representing new zealand meat processors, marketers and exporters meat industry update presentation...
TRANSCRIPT
Representing New Zealand Meat Processors, Marketers and ExportersRepresenting New Zealand Meat Processors, Marketers and Exporters
Meat Industry update
Presentation to NZ Cold Storage Association 82nd Annual Conference
Wellington19 August 2014
Tim RitchieChief Executive
Meat Industry Association of New Zealand

Representing New Zealand Meat Processors, Marketers and Exporters
Presentation outline
• About the MIA
• Meat industry overview
• Competitive challenges
• Industry response

Representing New Zealand Meat Processors, Marketers and ExportersRepresenting New Zealand Meat Processors, Marketers and Exporters
Meat Industry Association of New Zealand
A voluntary trade association representing beef and sheep meat processors and exporters.
33 member companies (about 99% of all meat exports).
Members operate some 60 processing plants nationwide.
Representing New Zealand Meat Processors, Marketers and Exporters
Industry overview (1)
12,500 commercial sheep and beef farmers
25,000 people employed in processing sectoro New Zealand’s largest manufacturing employer
Export-focused and fortunes driven by world prices

Representing New Zealand Meat Processors, Marketers and Exporters
Industry overview (2)
• Red meat and wool exports worth $7.3 billion in 2013/14
• NZ’s 2nd largest goods exporter - 14% of NZ’s total merchandise exports
• Exports 92% of sheepmeat and 83% of beef production
• Export to more than 120 countries
Representing New Zealand Meat Processors, Marketers and Exporters
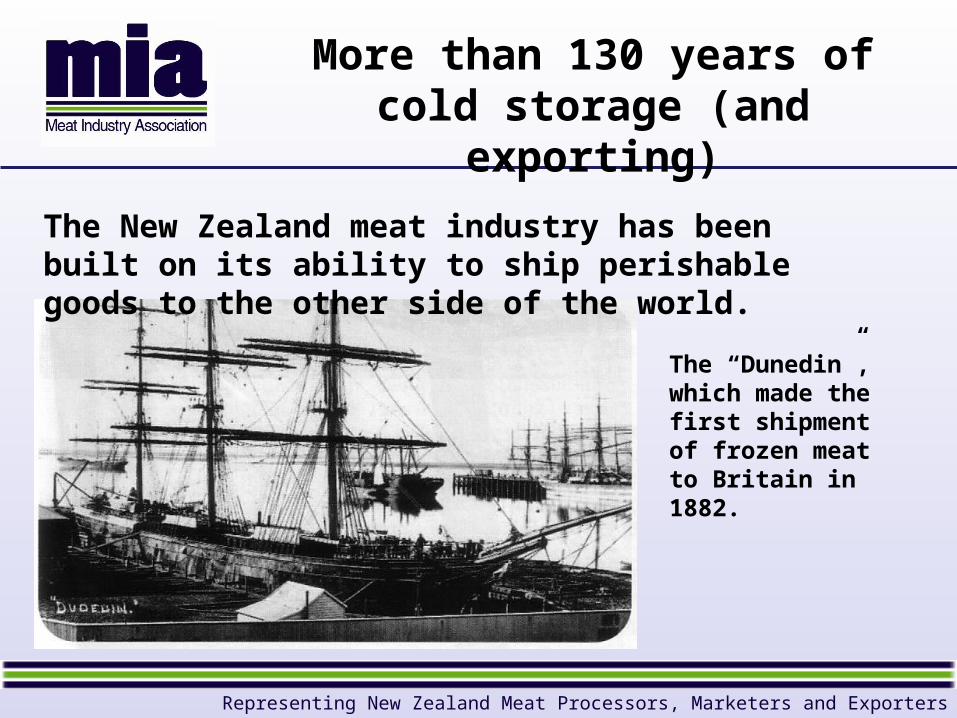
More than 130 years of cold storage (and exporting)
The New Zealand meat industry has been built on its ability to ship perishable goods to the other side of the world.
The “Dunedin”, which made the first shipment of frozen meat to Britain in 1882.

Representing New Zealand Meat Processors, Marketers and Exporters
Historical exports
New Zealand sheepmeat and beef exports in 1961 (by volume)
Sheepmeat BeefSource: Compiled by MIA from Statistics NZ data

Representing New Zealand Meat Processors, Marketers and Exporters
Market diversity
New Zealand sheepmeat and beef exports, ye June 2014 (by volume)
Sheepmeat BeefSource: Compiled by MIA from Statistics NZ data
United States48%
China10%
Japan7%
Korea6%
Taiwan5%
Indonesia4%
Canada4%
Malaysia2%
Hong Kong1%
Saudi Arabia1%
Other markets
12%
China40%
United Kingdom
16%
Germany5%
United States5%
Saudi Arabia4%
France3%
Netherlands3%
Canada2%
Belgium2%
Taiwan2%
Other markets
18%
Representing New Zealand Meat Processors, Marketers and Exporters
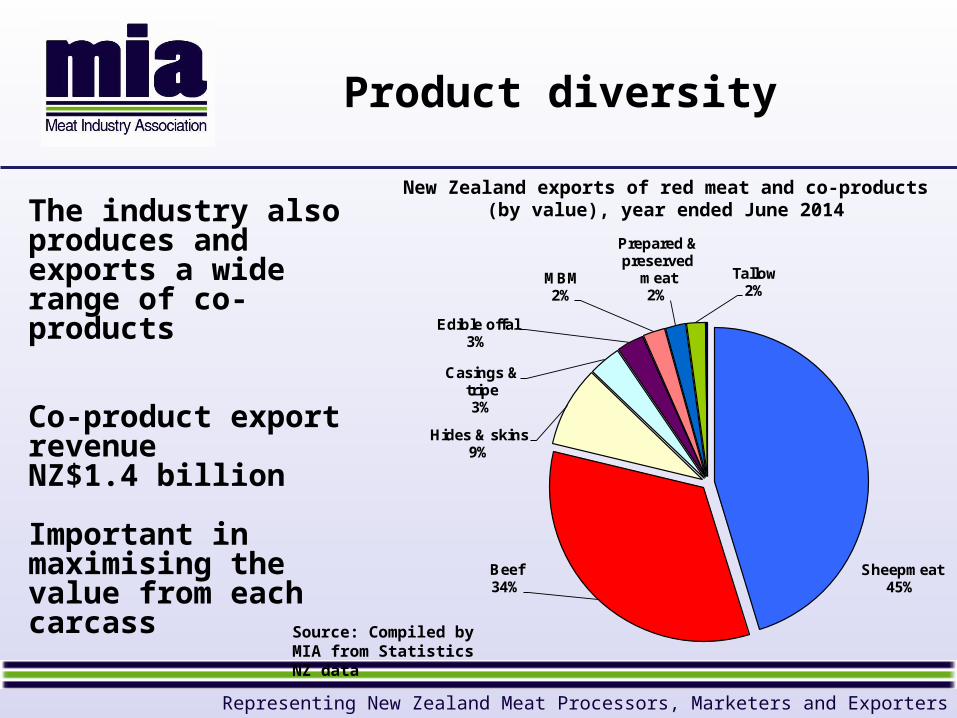
Product diversity
The industry also produces and exports a wide range of co-products
Co-product export revenue NZ$1.4 billion
Important in maximising the value from each carcass
New Zealand exports of red meat and co-products(by value), year ended June 2014
Source: Compiled by MIA from Statistics NZ data
Sheepmeat45%
Beef34%
Hides & skins9%
Casings & tripe3%
Edible offal3%
MBM2%
Prepared & preserved
meat2%
Tallow2%

Representing New Zealand Meat Processors, Marketers and Exporters
Product and market diversity(where the bits of a lamb go)
To Middle East To UK
To China
To USA To Europe/UK
Co-products:Pelts to China, MBM to USA, Tallow to China and Singapore, Casings to China/Hong Kong
Edible offals to UK/China/Saudi Arabia

Representing New Zealand Meat Processors, Marketers and Exporters
Changing product mix
Customers have changed from butcher shop to multiple retailer
Now in the disassembly business – exporting value-added products
Export lamb product mix, 1970/71 – 2011/12
Frozen carcassesFrozen bone-in cutsFrozen boneless cutsChilled cuts
0%
20%
40%
60%
80%
100%
1970
-71
1975
-76
1980
-81
1985
-86
1990
-91
1995
-96
2000
-01
2005
-06
2006
-07
2007
-08
2008
-09
2009
-10
2010
-11
2011
-12

Representing New Zealand Meat Processors, Marketers and Exporters
Major destinations for NZ red meat & co-products
For 2013/14, with arrows showing markets worth $50m+

Representing New Zealand Meat Processors, Marketers and Exporters
China
0
200,000,000
400,000,000
600,000,000
800,000,000
1,000,000,000
1,200,000,000
1,400,000,000
Va
lue
(N
ZD
)
12 Month period to
NZ Meat Industry Exports to China - Rolling 12 Month FOB Value - Combined Value
Beef
Beef offals
Sheepmeat
Sheep offals
Tripe, runners and casings
Tallow
Hides and skins
MBM
Source: Compiled by MIA from Statistics New Zealand overseas merchandise trade data

Representing New Zealand Meat Processors, Marketers and Exporters
China sheepmeat
Consumption
3 kg/per capita, and rising
Imports - 6.4% of demand
Major impact on world market
Chinese sheepmeat balance 2000-2014f

Representing New Zealand Meat Processors, Marketers and Exporters
China beef
Representing New Zealand Meat Processors, Marketers and Exporters
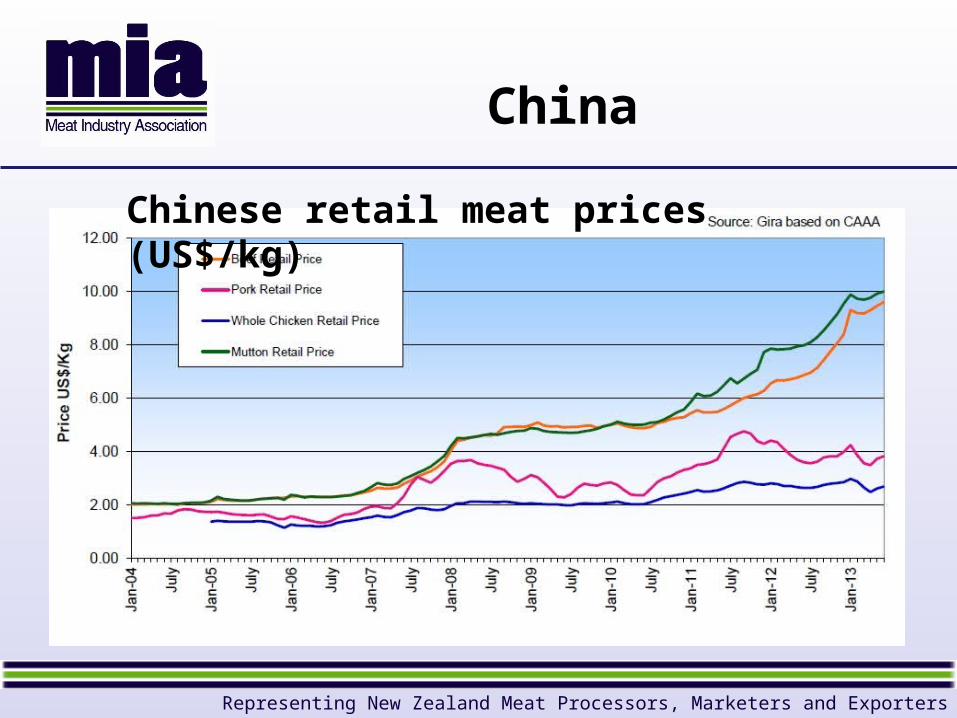
China
Chinese retail meat prices (US$/kg)
Representing New Zealand Meat Processors, Marketers and Exporters
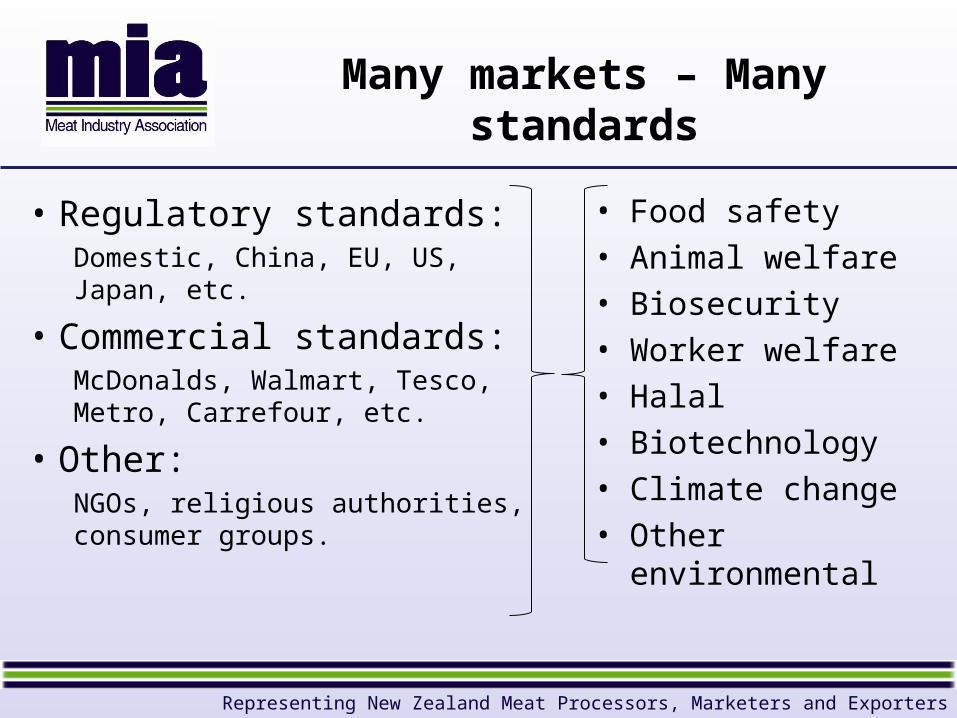
Many markets – Many standards
• Regulatory standards:Domestic, China, EU, US, Japan, etc.
• Commercial standards:McDonalds, Walmart, Tesco, Metro, Carrefour, etc.
• Other:NGOs, religious authorities, consumer groups.
• Food safety• Animal welfare• Biosecurity• Worker welfare• Halal• Biotechnology• Climate change• Other environmental

Representing New Zealand Meat Processors, Marketers and Exporters
Halal exports
0
100,000
200,000
300,000
400,000
500,000
600,000
700,000
800,000
900,000
1,000,000
2003 2004 2005 2006 2007 2008 2009 2010 2011 2012 2013
Vo
lum
e (
ton
ne
s)
Total halal certified exports Total exports of red meat and edible offals
Source: compiled by MIA from Stats NZ, NZMB and MIA data
Halal-certified exports compared to red meat and offal exports

Representing New Zealand Meat Processors, Marketers and Exporters
Competitive challenges
• International competition from other proteins
• Domestic competition for land use
• Competition from other red meat producers
• Getting products to markets

Representing New Zealand Meat Processors, Marketers and Exporters
Relative profitability
ANZ Commodity Price Index (Jan 1990=100)
0
50
100
150
200
250
Jul-
90
Jul-
91
Jul-
92
Jul-
93
Jul-
94
Jul-
95
Jul-
96
Jul-
97
Jul-
98
Jul-
99
Jul-
00
Jul-
01
Jul-
02
Jul-
03
Jul-
04
Jul-
05
Jul-
06
Jul-
07
Jul-
08
Jul-
09
Jul-
10
Jul-
11
Jul-
12
Jul-
13
Jul-
14
Meat Dairy
Representing New Zealand Meat Processors, Marketers and Exporters
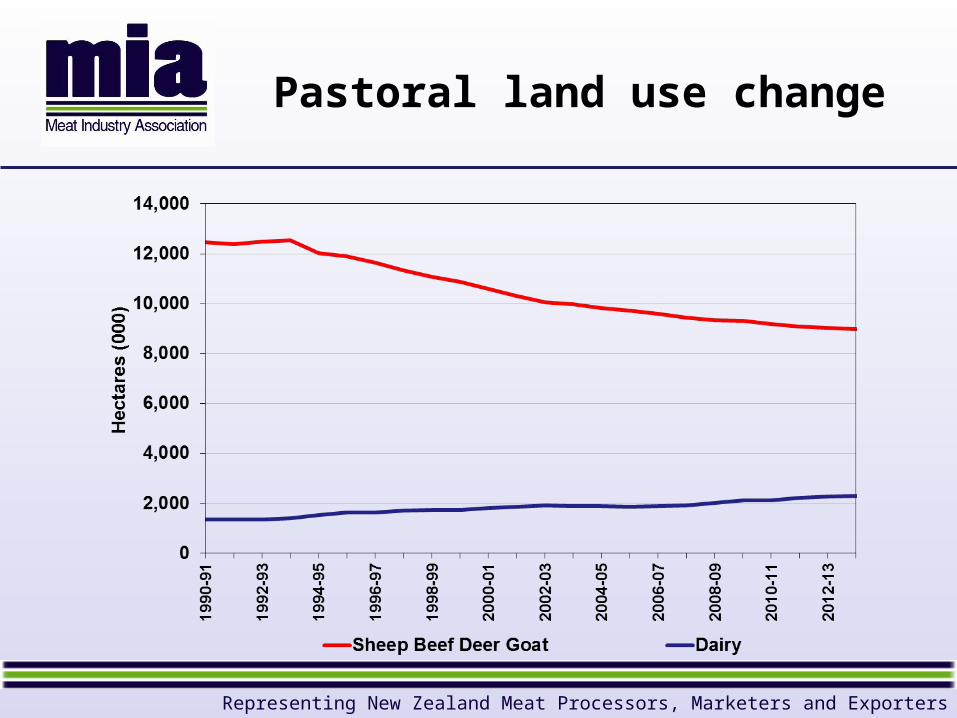
Pastoral land use change

Representing New Zealand Meat Processors, Marketers and Exporters
Livestock numbers
25,000
35,000
45,000
55,000
65,000
75,000
19
90
-91
19
92
-93
19
94
-95
19
96
-97
19
98
-99
20
00
-01
20
02
-03
20
04
-05
20
06
-07
20
08
-09
20
10
-11
20
12
-13
Sh
eep
(00
0)
2,000
3,000
4,000
5,000
6,000
Cat
tle
(000
)
Source: Beef + Lamb New Zealand Economic Service Statistics New Zealand % change 1990 to 2012
Dairy +85%
Beef -15%
Sheep -45%

Representing New Zealand Meat Processors, Marketers and Exporters
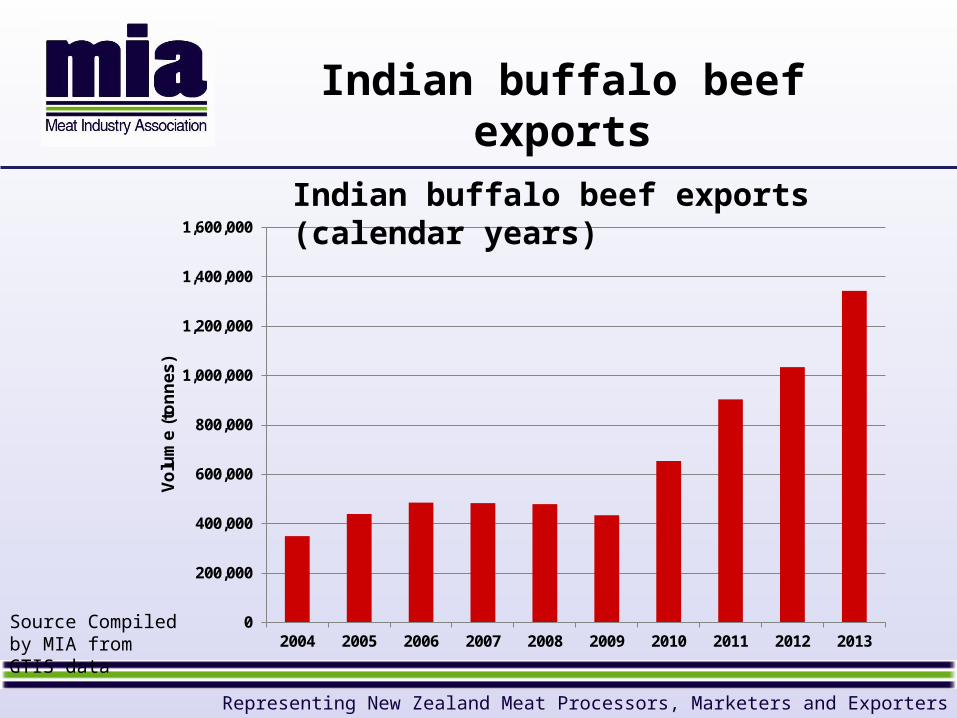
Other red meat producers
NZ and Australia the two major sheepmeat exporters
But NZ a much smaller player in the beef trade
NZ beef exports around 1/3 volume of the major exporters:• Australia, United States, Brazil – and India
Representing New Zealand Meat Processors, Marketers and Exporters
Indian buffalo beef exports
0
200,000
400,000
600,000
800,000
1,000,000
1,200,000
1,400,000
1,600,000
2004 2005 2006 2007 2008 2009 2010 2011 2012 2013
Vo
lum
e (
ton
nes
)
Source Compiled by MIA from GTIS data
Indian buffalo beef exports (calendar years)

Representing New Zealand Meat Processors, Marketers and Exporters
Getting product to market
Distance to major markets
A particular challenge for high value, time sensitive chilled products
-6%
+3%-16%
+13% +14% +12%
+7%
+2%
-2%+14%
+20%+6%
0%
10%
20%
30%
40%
50%
60%
70%
80%
European Union North America Middle East North Asia Non-EU Europe Other
Volume Value
(Figures show % change from previous year)
Source: Compiled by MIA from Statistics New Zealand overseas merchandise trade data
NZ chilled sheepmeat exports by Region(by volume and value for the year ending June 2014)
Representing New Zealand Meat Processors, Marketers and ExportersRepresenting New Zealand Meat Processors, Marketers and Exporters
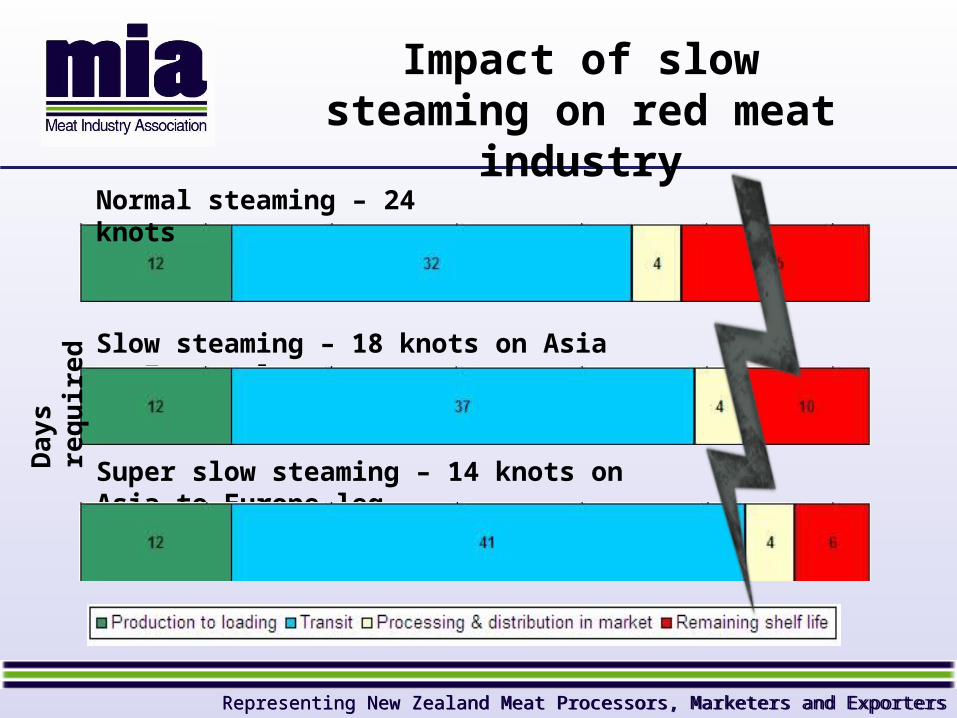
Impact of slow steaming on red meat industry
Normal steaming – 24 knots
Slow steaming – 18 knots on Asia to Europe leg
Super slow steaming – 14 knots on Asia to Europe legDay
s re
quire
d

Representing New Zealand Meat Processors, Marketers and Exporters
On-farm productivity
1990-91 2012-13p
Ewe Lambing % 100.4 123.2 +23%
Hogget Lambs % of all lambs - 4.9
Average Lamb kg 14.35 18.00 +25%
Lamb Sold kg/ewe 9.76 18.44 +89%
Wool Production kg/hd greasy 5.28 5.38 +2%
Average Steer kg 297 311 +5%
Milksolids kg/cow 260 340 +31%Source: B+LNZ Economic Service, Statistics New Zealand
Representing New Zealand Meat Processors, Marketers and Exporters
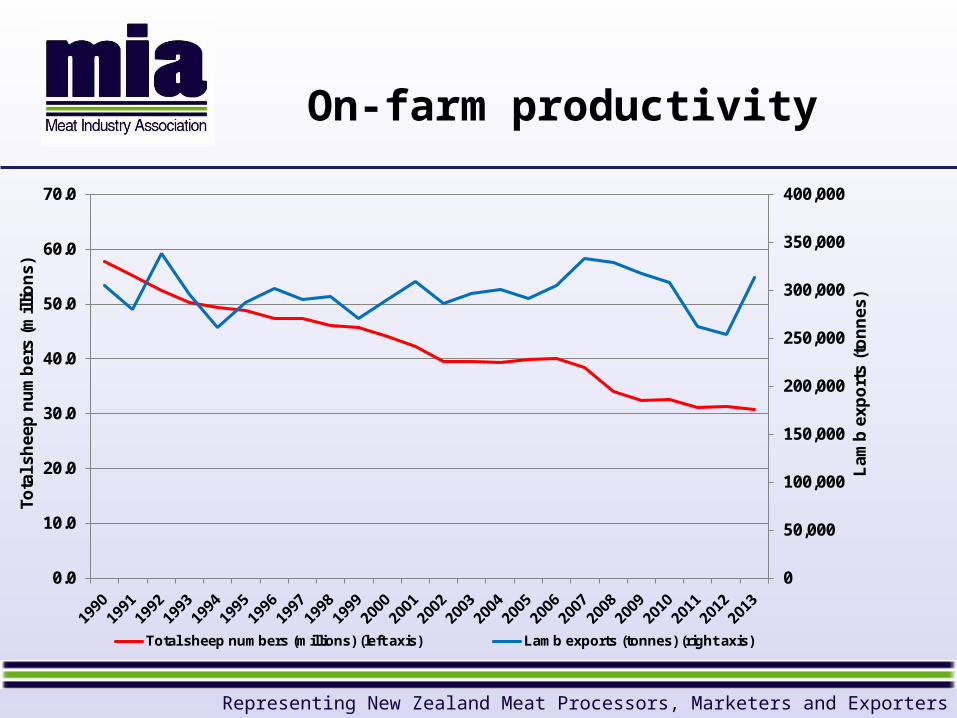
On-farm productivity
0
50,000
100,000
150,000
200,000
250,000
300,000
350,000
400,000
0.0
10.0
20.0
30.0
40.0
50.0
60.0
70.0
Lam
b e
xpo
rts
(to
nn
es)
Tota
l sh
eep
nu
mb
ers
(mill
ion
s)
Total sheep numbers (millions) (left axis) Lamb exports (tonnes) (right axis)

Representing New Zealand Meat Processors, Marketers and Exporters
Processing productivity improvement
• In 1980 the volume of meat exported per worker was 23 tonnes
• in 2013 the volume was 43.2 tonnes of a much more valuable and further processed product: a productivity gain of at least 88%.
• a typical meat worker now processes 130 sheep a day, compared to 55 in the 1980s.

Representing New Zealand Meat Processors, Marketers and Exporters
Robotics - automation
An industry consortium is investing in robotics to automate the early stages of sheep processing, with two systems recently commercialised.
An automated brisket cutting system An automated system to remove the viscera set

Representing New Zealand Meat Processors, Marketers and Exporters
Getting product to markets - industry
Maintaining and improving access into as many markets as possible:•Industry works closely with government on market access
Investment in R&D to extend shelf life of chilled meat
Will mitigate impact of slow steaming, reduce wastage and improve returns to the industry
Food safety
Representing New Zealand Meat Processors, Marketers and ExportersRepresenting New Zealand Meat Processors, Marketers and Exporters

Representing New Zealand Meat Processors, Marketers and ExportersRepresenting New Zealand Meat Processors, Marketers and Exporters
Thank you