repression of the dna-binding inhibitor id3 by blimp-1 limits the … · 2011-11-16 · yun ji1,...
TRANSCRIPT

Supplementary Information
Repression of the DNA-binding inhibitor Id3 by Blimp-1
limits the formation of memory CD8+ T cells
Yun Ji1, Zoltan Pos2,3, Mahadev Rao1, Christopher A. Klebanoff1, Zhiya Yu1,
Madhusudhanan Sukumar1, Robert N. Reger1, Douglas C. Palmer1 , Zachary A. Borman1,
Pawel Muranski1, Ena Wang2,3, David S. Schrump1, Francesco M. Marincola2,3, Nicholas
P. Restifo1, Luca Gattinoni1
1Center for Cancer Research, National Cancer Institute, National Institutes of Health, Bethesda,
Maryland, USA.
2Infectious Disease and Immunogenetics Section, Department of Transfusion Medicine, Clinical
Center, National Institutes of Health, Bethesda, Maryland, USA.
3Center for Human Immunology, National Institutes of Health, Bethesda, Maryland, USA.
Correspondence should be addressed to N.P.R. ([email protected]) or L.G. ([email protected])
Nature Immunology doi:10.1038/ni.2153
Pmel-1 Rag1-/- Id3+/+
Thy-1.2 HSC
Pmel-1 Rag1-/-Id3-/-Thy-1.1 HSC
WT Ly5.1
9Gy
Supplementary Fig. 1
d
Rag1-/- Id3-/- WT
7.6 19.6 99.9
CD
8
CFSE
a Pmel-1Id3-/- Pmel-1
98
100
100
100
CD
44
Vβ13
CD
44
hgp10025-33 tet
19
66
19
48
c
91
4
7
92
Pmel-1Id3-/- Pmel-1
Id3-/- WT
17
79
2 47
23
27 C
D44
CD62L
b
e Ly
5.1
Thy-1.1
Pmel-1Rag1-/-Id3-/- Pmel-1Rag1-/- WT
CD
44
CD62L
99 99 82
16
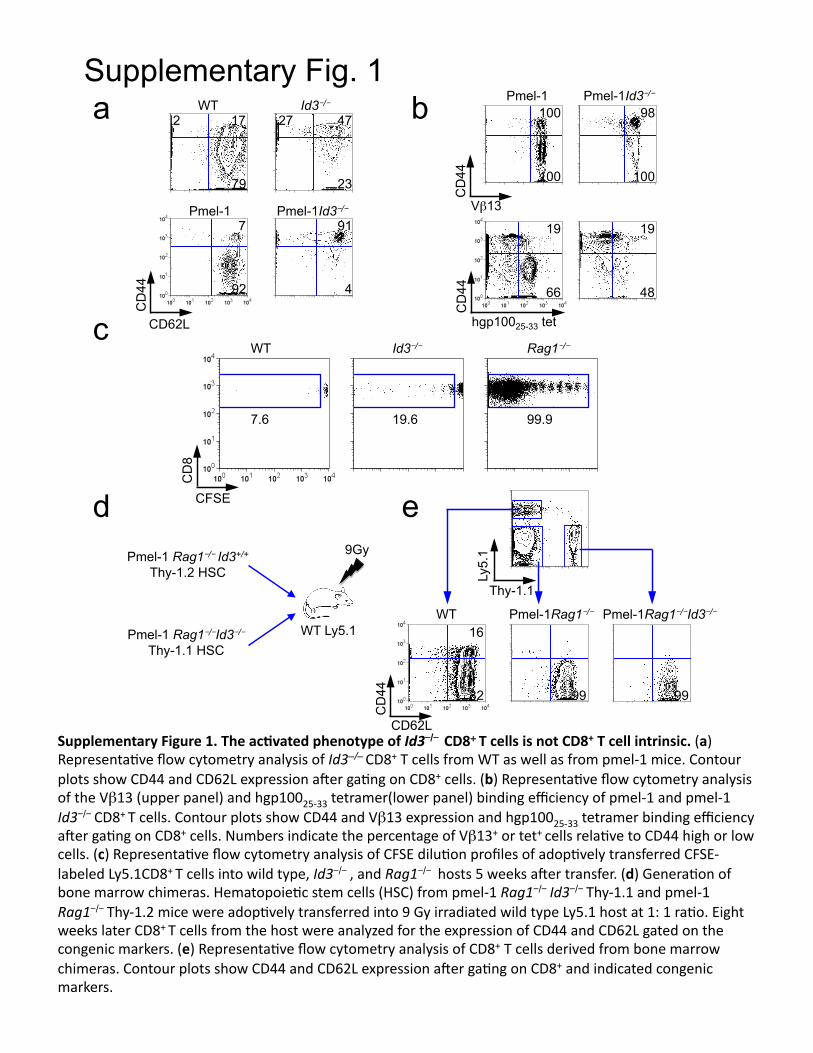
Supplementary Figure 1. The ac5vated phenotype of Id3-/- CD8+ T cells is not CD8+ T cell intrinsic. (a) Representa,ve flow cytometry analysis of Id3–/– CD8+ T cells from WT as well as from pmel-‐1 mice. Contour plots show CD44 and CD62L expression aHer ga,ng on CD8+ cells. (b) Representa,ve flow cytometry analysis of the Vβ13 (upper panel) and hgp10025-‐33 tetramer(lower panel) binding efficiency of pmel-‐1 and pmel-‐1 Id3-/- CD8+ T cells. Contour plots show CD44 and Vβ13 expression and hgp10025-‐33 tetramer binding efficiency aHer ga,ng on CD8+ cells. Numbers indicate the percentage of Vβ13+ or tet+ cells rela,ve to CD44 high or low cells. (c) Representa,ve flow cytometry analysis of CFSE dilu,on profiles of adop,vely transferred CFSE-‐labeled Ly5.1CD8+ T cells into wild type, Id3-/- , and Rag1-/- hosts 5 weeks aHer transfer. (d) Genera,on of bone marrow chimeras. Hematopoie,c stem cells (HSC) from pmel-‐1 Rag1-/- Id3-/- Thy-‐1.1 and pmel-‐1 Rag1-/- Thy-‐1.2 mice were adop,vely transferred into 9 Gy irradiated wild type Ly5.1 host at 1: 1 ra,o. Eight weeks later CD8+ T cells from the host were analyzed for the expression of CD44 and CD62L gated on the congenic markers. (e) Representa,ve flow cytometry analysis of CD8+ T cells derived from bone marrow chimeras. Contour plots show CD44 and CD62L expression aHer ga,ng on CD8+ and indicated congenic markers.

2.23
0.16
2.45
0.84
Day 5 Day 13
SSC
Ly5.
2
Id3-/-
Id3+/-
Id3+/- Id3-/-
Id3+/- Id3-/-
Con
tract
ion
(%)
a b c
Supplementary Figure 2. Id3 regulates the contrac5on of effector CD8+ T cells. (a, b)Representa,ve flow cytometry analysis (a) and numbers (b) of Ly5.2+CD8+ T cells following adop,ve transfer of 5 x 10³ Id3-/- or Id3+/- pmel-‐1 Rag1-/- CD8+ T cells from li\ermates in conjunc,on with gp100-‐VV infec,on at indicated ,me points. (c) Percentage contrac,on of Id3-/- or Id3+/-pmel-‐1 Rag1 -/- CD8+ T cells rela,ve to the peak of immune response (d5). *= P < 0.01.
Supplementary Fig. 2

Supplementary Fig. 3
Supplementary Figure 3. Id3 was not required for the long-‐term survival of naïve T cells. Numbers of CD8+CFSE+ T cells 30 days following adop,ve transfer of 9 X 10⁴ CFSE-‐labeled Id3+/+ , Id3+/-, or Id3-/-
pmel-‐1 Rag1-/- CD8+ T cells into WT hosts. Data are represented as mean ± s.d.
Pmel-1 Rag1−/− Id3+/+
Pmel-1 Rag1−/− Id3+/−
Pmel-1 Rag1−/− Id3−/−

Supplementary Fig. 4
Id3−Thy-‐1.1
Thy-‐1.1
Thy-1.1 Id3−Thy-1.1
V5
β-actin
a b
Supplementary Figure 4. Id3−Thy-‐1.1 retroviral vector induces cons5tu5ve expression of Id3 in CD8+ T cells. (a) Graphical representa,on of Id3−Thy-‐1.1 and Thy-‐1.1 retro-‐viral constructs. (b) Ectopic expression levels of Id3 in Thy-‐1.1 and Id3−Thy-‐1.1 pmel-‐1 CD8+ T cells were detected by an,-‐V5 immunoblofng.

Supplementary Fig. 5
−hgp100 (10x)
IFN
-γ (p
g/m
l)
IL-2
(pg/
ml)
Thy-1.1
Id3−Thy-1.1 66
12
CD
44
CD62L
21
60
17
21 b a
Supplementary Figure 5. Enforced expression of Id3 does not alter phenotype and func5on of pmel-‐1 CD8+ T cells prior to transfer. (a) Representa,ve flow cytometry analysis of Id3−Thy-‐1.1 and Thy-‐1.1 pmel-‐1 CD8+ T cells. Contour plots show CD62L and CD44 expression aHer ga,ng on CD8+ Thy-‐1.1+ cells. (b) IFN-‐γ (leH panel) and IL-‐2 (right panel) release by Id3−Thy-‐1.1 and Thy-‐1.1 pmel-‐1 CD8+ T cells aHer 16-‐hour co-‐culture with MCA205 tumor targets pulsed with indicated concentra,on of hgp100 pep,de. Data represented as mean ± s.e.m. of 3 samples.
Thy-1.1 Id3−Thy-1.1

Supplementary Fig. 6
Thy-1.1 Id3−Thy-1.1
23 22
Brdu
b a
cThy-1.1 Id3−Thy-1.1
10
11
7-A
AD
Annexin V
4
3
Time after infection (d)
Time after infection (d)
CD
8+Th
y-1.
1+ B
rdU
+ T
cells
(%)
CD
8+Th
y-1.
1+ A
nnex
inV
+
T ce
lls (%
)
d
Supplementary Figure 6. Enforced expression of Id3 enhances the survival but not the prolifera5on of CD8+ T cells. (a) BrdU+ incorpora,on by adop,vely transferred Id3−Thy-‐1.1 and Thy-‐1.1 pmel-‐1 CD8+ T cells 6 days aHer transfer and gp100-‐VV infec,on. Infected mice received 1.5 mg BrdU 16 hours before analysis of splenocytes. Representa,ve histograms show BrdU labeling aHer ga,ng on CD8+Thy-‐1.1+ cells. (b) Percent of BrdU+CD8+Thy-‐1.1+ T cells at indicated ,me-‐points aHer transferring Id3−Thy-‐1.1 and Thy-‐1.1 pmel-‐1 CD8+ T cells in conjunc,on with gp100-‐VV infec,on. Data are represented as mean ± s.e.m. of 3 samples. (c) Representa,ve flow cytometry analysis of Id3−Thy-‐1.1 and Thy-‐1.1 pmel-‐1 CD8+ T cells 6 days following adop,ve transfer in conjunc,on with gp100-‐VV infec,on. Contour plots show Annexin V and 7-‐AAD expression aHer ga,ng on CD8+Thy-‐1.1+ cells. (d) Percent of Annexin V+CD8+Thy-‐1.1+ T cells at indicated ,me-‐points aHer transferring Id3−Thy-‐1.1 and Thy-‐1.1 pmel-‐1 CD8+ T cells in conjunc,on with gp100-‐VV infec,on. Data are represented as mean ± s.e.m. of 3 samples. * = P < 0.05.
Thy-1.1 Id3−Thy-1.1
Thy-1.1 Id3−Thy-1.1

E1 E2 E3 I1
E1 E2 E3
Id3−Thy-1.1
Id3 gene structure
PGKneo Id3-/-
Supplementary Fig. 7
Supplementary Figure 7. Expression of Id3 exons and intron by WT Mouse Gene 1.0 ST arrays reflects differences in the structure of loss and gain-‐of-‐func5on constructs. (a) Expression levels of exon 1, 2, 3, and intron 1 of Id3 by WT Mouse Gene 1.0 ST arrays. (b) Graphical representa,on of Id3 gene structure compared to the Id3 dele,on construct targe,ng exon 1, 2 and the first 135 bp of exon 322 and the Id3−Thy-‐1.1 overexpressing construct, which contains the coding region of Id3 (the last 300 bp of exon 1 and the first 60 bp of exon 2).
a
b
Id3−Thy-1.1 Id3-/-
Id3+/+
Thy-1.1

Supplementary Fig. 8
Supplementary Figure 8. DNA replica5on and repair network iden5fied by Ingenuity Pathway Analysis. Genes differen,ally expressed in response to Id3 manipula,on. Colors indicate the average expression fold-‐change of knockout and overexpression experiments. Solid lines indicate direct interac,ons; dashed lines indicate indirect interac,ons.

Kif4a Kif2c Ttk Ect2 Anln Kif11 Bub1 Mki67 Top2a Aurka Nusap1 Ccna2 Mad2l1 Cdkn2c Plk4 Ccnb2 Tyms Hs3st1 Racgap1 Wbp5 Pfkp Fgfr2 H2afx Klhdc2 Slc7a5 Eprs Ptgs1 Slc12a2 Pgk1 Scin Ca2 Eif4ebp1
Thy-1.1 Id3−Thy-1.1
Supplementary Fig. 9
Supplementary Figure 9. A set of genes that are found upregulated in Tcf3 deficient cells is enriched in Id3+/+ and Id3-‐Thy-‐1.1 cells compared to controls. (a) GSEA enrichment heat map of genes over-‐expressed in Tcf3 deficient B cell lines compared to transcriptomes of Id3-/- or Id3+/+ pmel-‐1 CD8+ T cells. (b) GSEA enrichment heat map of over-‐expressed genes compared to transcriptomes of Id3−Thy-‐1.1 or Thy-‐1.1 pmel-‐1 CD8+ T cells. Red and blue indicate upregulated and downregulated genes respec,vely.
b a Id3+/+ Id3-/-
Slc12a2 Fgfr2 Ca2 Pgk1 Ptgs1 Eprs Pfkp Hs3st1 Slc7a5 Eif4ebp1 Scin Klhdc2 Wbp5 Racgap1 Plk4 Tyms Cdkn2c Mad2l1 Ccnb2 H2afx Ccna2 Aurka Top2a Mki67 Ect2 Nusap1 Kif11 Bub1 Kif2c Ttk Anln Kif4a

Supplementary Fig. 10
yz198 + PGK
yz198 + Flox
Tamoxifen ─ + ─ +
Tcf3flox/flox Tcf3wt/wt
Supplementary Figure 10. Tamoxifen induces the dele5on of Tcf3 in CD8+ T cells. PCR products of Pmel-‐1 Tcf3wt/wt Cre-‐ERT2 and Pmel-‐1 Tcf3flox/flox Cre-‐ERT2 CD8+ T cells five days aHer ac,va,on in the presence of 500 nM tamoxifen or vehicle DMSO. The inser,on of loxP was detected by PCR with primer pair yz198 and PGK while the dele,on of loxP inser,on was detected by PCR with primer pair yz198 and Flox.

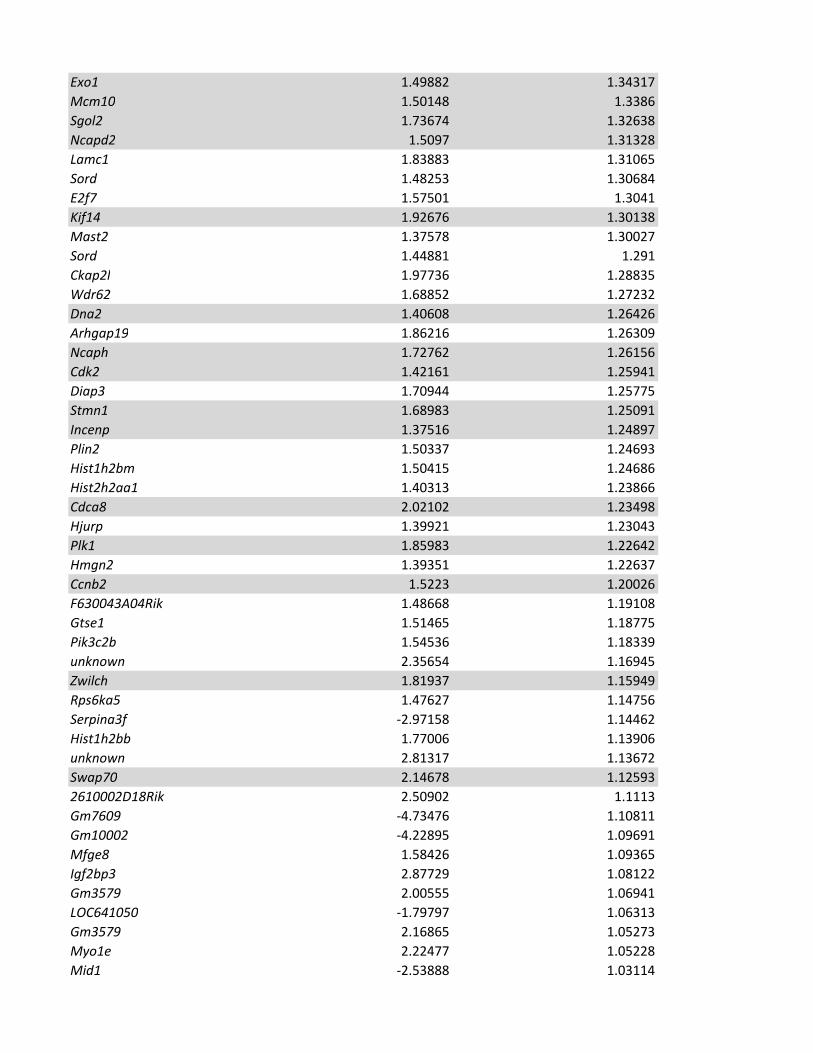
Supplementary Table 1: Genes differentially expressed
in Id3high
and Id3low
CD8+ effector T cells
Gene Symbol Fold change Fold change
Id3+/+
vs. Id3−−−−/−−−−
Id3−−−−Thy-1.1 vs. Thy-1.1
Id3 3.85251 42.9152
Foxm1 1.88648 1.64546
Prr11 1.70871 1.5785
Nek2 1.78809 1.56293
Kif2c 1.78569 1.56269
Ncapg2 1.71622 1.5564
Dlgap5 1.69066 1.55271
Kif4 2.08204 1.55253
5730590G19Rik 1.53412 1.53955
Aspm 2.25651 1.52354
Kif23 1.57334 1.51933
Il12rb2 2.41062 1.5157
Cdca5 2.17632 1.51468
Kif11 1.61491 1.51422
Chn2 1.40237 1.5042
Ccnb1 1.58764 1.49421
Fancd2 1.91392 1.48553
Kif18b 1.98318 1.47769
Pole 1.67229 1.46888
Prc1 1.75958 1.463
Rrm2 1.63077 1.46284
Cit 1.60228 1.46041
Cenpn 1.97648 1.4604
Pif1 1.41821 1.44921
Nusap1 1.78917 1.43494
Ube2c 1.54684 1.43455
Ccnb1 1.56456 1.42432
Espl1 1.93267 1.41691
Smpdl3b 1.62733 1.41657
Brip1 1.72293 1.39648
Kif20a 1.7433 1.39588
Mki67 1.55968 1.39139
Nuf2 1.80399 1.39065
Aurkb 1.57721 1.38513
Parm1 1.61514 1.3851
Eme1 1.4501 1.37307
Mcm3 1.43416 1.37072
Mcm2 1.48113 1.3707
Rrm1 1.3998 1.36879
Top2a 1.5453 1.36621
Exo1 1.49882 1.34317
Mcm10 1.50148 1.3386
Sgol2 1.73674 1.32638
Ncapd2 1.5097 1.31328
Lamc1 1.83883 1.31065
Sord 1.48253 1.30684
E2f7 1.57501 1.3041
Kif14 1.92676 1.30138
Mast2 1.37578 1.30027
Sord 1.44881 1.291
Ckap2l 1.97736 1.28835
Wdr62 1.68852 1.27232
Dna2 1.40608 1.26426
Arhgap19 1.86216 1.26309
Ncaph 1.72762 1.26156
Cdk2 1.42161 1.25941
Diap3 1.70944 1.25775
Stmn1 1.68983 1.25091
Incenp 1.37516 1.24897
Plin2 1.50337 1.24693
Hist1h2bm 1.50415 1.24686
Hist2h2aa1 1.40313 1.23866
Cdca8 2.02102 1.23498
Hjurp 1.39921 1.23043
Plk1 1.85983 1.22642
Hmgn2 1.39351 1.22637
Ccnb2 1.5223 1.20026
F630043A04Rik 1.48668 1.19108
Gtse1 1.51465 1.18775
Pik3c2b 1.54536 1.18339
unknown 2.35654 1.16945
Zwilch 1.81937 1.15949
Rps6ka5 1.47627 1.14756
Serpina3f -2.97158 1.14462
Hist1h2bb 1.77006 1.13906
unknown 2.81317 1.13672
Swap70 2.14678 1.12593
2610002D18Rik 2.50902 1.1113
Gm7609 -4.73476 1.10811
Gm10002 -4.22895 1.09691
Mfge8 1.58426 1.09365
Igf2bp3 2.87729 1.08122
Gm3579 2.00555 1.06941
LOC641050 -1.79797 1.06313
Gm3579 2.16865 1.05273
Myo1e 2.22477 1.05228
Mid1 -2.53888 1.03114

unknown -3.93819 1.01597
Sfn 3.23473 1.00646
Gm7609 -2.11706 -1.00455
Wdtc1 -1.77842 -1.01028
unknown 4.46894 -1.02156
Sntb1 -2.39275 -1.02965
Mela 3.94702 -1.03333
unknown -2.14921 -1.04372
unknown 36.7392 -1.05365
Stk39 -2.50634 -1.05677
Lilrb4 -4.62989 -1.05768
Ikzf2 1.90947 -1.06322
unknown -2.70401 -1.08357
Rab4a -2.67804 -1.10268
Lysmd2 -1.56549 -1.1029
Ppic -3.79314 -1.10616
Entpd4 -1.62954 -1.10683
Naip3 -3.16492 -1.14447
Cyp4v3 -1.48896 -1.14761
Gas5 -1.47852 -1.15597
Litaf -1.71126 -1.17086
Sytl1 -2.58675 -1.18448
Dapl1 -3.07135 -1.19001
Gm4841 -1.80246 -1.19852
Mela 107.167 -1.19893
Aim2 -1.57383 -1.21085
Cnr2 -1.69614 -1.21198
Gpr25 -1.61444 -1.21644
unknown -1.73344 -1.2242
Tlr1 -1.4902 -1.22989
Gp49a -5.33109 -1.2312
Ctla4 -1.40996 -1.27766
Sh3d20 -1.43419 -1.27954
Tanc2 -1.39033 -1.29058
Ccr7 -1.31535 -1.29128
Bmp7 -1.45961 -1.29352
Eps8l1 -1.51043 -1.29437
unknown -1.37162 -1.31612
F2rl1 -2.1879 -1.33099
Acpp -2.08446 -1.33502
unknown -1.39881 -1.34628
Atp1b1 -4.57052 -1.36184
unknown -1.57218 -1.37047
St6gal1 -1.97331 -1.49964
Wfikkn2 -1.31748 -1.51688
Ptbp2 -1.19227 -1.51838
Pdgfb -1.5765 -1.53815

Smyd1 -1.26593 -1.70987
Cxcr5 -2.01828 -1.71353
Slc16a5 -1.43574 -2.03152
Slc6a19 -1.61074 -2.19814
*Genes involved in DNA replication and repair are highlighted in gray

Supplementary Methods
Generation of BM chimeras. We enriched hematopoietic stem cells (HSC) obtained from
femurs and tibias of pmel-1 Rag1–/–Id3–/– Thy-1.1 and pmel-1 Rag1–/– Thy-1.2 mice with EasySep
mouse hematopoietic progenitor cell enrichment kit (Stemcell Technologies). Ly5.1 recipients
were irradiated with 9 Gy and injected i.v. with 1.2 X 10⁶ HSC cells. We analyzed bone marrow
chimeras 8 weeks after transplantation.
Cytokine release assays. 2.5 X 10⁴ MCA205 cells were pulsed with hgp10025–33 or irrelevant
influenza nucleoprotein peptide at indicated concentrations and incubated overnight with T
cells at a 1:1 ratio at 37 °C. We analyzed the supernatants using mouse IFN- and mouse IL-2 by
ELISA (R&D Systems).
BrdU/Annexin incorporation assay. We injected mice i.p with 1.5 mg of BrdU (Sigma-Aldrich)
16 h before collecting the spleens. CD8+ T cells were enriched and stained with CD8+ and
congenic surface makers. Annexin V/7-AAD assay and BrdU quantification were performed
following the manufacturer’s instruction (BD Biosciences).