reproductions supplied by edrs are the best that can … · bradburn, ellen m.; hurst, david g ......
TRANSCRIPT

ED 454 301
AUTHORTITLE
INSTITUTION
REPORT NOPUB DATENOTEAVAILABLE FROM
PUB TYPEEDRS PRICEDESCRIPTORS
IDENTIFIERS
ABSTRACT
DOCUMENT RESUME
TM 033 196
Bradburn, Ellen M.; Hurst, David G.; Peng, SamuelCommunity College Transfer Rates to 4-Year InstitutionsUsing Alternative Definitions of Transfer. Research andDevelopment Report.National Center for Education Statistics (ED), Washington,DC.
NCES-2001-1972001-07-00110p.
ED Pubs, P.O. Box 1398, Jessup, MD 20794-1398. Tel:1-877-433-7827 (Toll Free).Reports - Evaluative (142)MF01/PC05 Plus Postage.Academic Aspiration; *College Transfer Students; *CommunityColleges; *Definitions; Educational Attainment; HigherEducation; National Surveys; *Student EducationalObjectives; *Two Year College StudentsBeginning Postsecondary Students Long Study
This report uses the 1990-1994 Beginning PostsecondaryStudents Longitudinal Study (BPS:1990/1994) to examine several ways ofestimating the transfer rate from public two-year to four-year institutions.The report focuses on different approaches to defining the pool of potentialtransfer students or the group of community college students who appear to beplanning or hoping to transfer to a four-year institution. The relationshipof these definitions of potential transfers to student backgroundcharacteristics is explored, as is the relationship of each definition to theresulting transfer rate. The report concludes with a discussion of theresults in the context of other studies of community college students andtransfer. Overall, 71* of beginning community college students responded to asurvey that they anticipated earning a bachelor's degree or higher. Themajority of students also met three other definitions of potential transfers:(1) being enrolled in an academic program; (2) enrolling continuously in1989-1990; and (3) enrolling during the 1990-1991 academic year. Less thanhalf the students met another four definitions used in the report, and only11% had an academic major and were taking courses leading toward a bachelor'sdegree. In general, transfer rates increased across increasingly restrictivedefinitions of potential transfers, with the lowest rate (25%) of everenrolling in a four-year institution found for all beginning communitycollege students compared to 52% among students meeting the most restrictivedefinition of potential transfers. Three appendixes contain a glossary,technical motes, and supplemental and standard error tables. (Contains 11tables, 11 figures, and 24 references.) (SLD)
Reproductions supplied by EDRS are the best that can be madefrom the original document.

0)
O5I
NATIONAL CENTER FOR EDUCATION STATISTICS
Research and Development Report July 2001
Community College TransferRates to 4-Year InstitutionsUsing Alternative Definitionsof Transfer
U.S. DEPARTMENT OF EDUCATIONOffice of Educational Research and Improvement
EDUCATIONAL RESOURCES INFORMATIONCENTER (ERIC)
This document has been reproduced asreceived from the person or organizationoriginating it.
Minor changes have been made toimprove reproduction quality.
Points of view or opinions stated in thisdocument do not necessarily representofficial OERI position or policy.
U.S. Department of EducationOffice of Educational Research and Improvement NCES 2001-197

Customer Survey of OERI Publication UsersTo help us improve future editions of this publication and giveyou better customer service, we would appreciate yourcomments on this survey form. Please check the appropriatebox(es) below for each question. Responses will be keptcompletely confidential. You may return the survey by mailor FAX. It can be folded and taped closed to allow mailing tothe address listed on the reverse side of this form, or it canbe returned by FAX to 202-219-1321. Many thanks for yourcustomer feedbackit is very important to us!
la. Name of publication Community College Transfer Rates
lb. Publication number NCES 2001-197
1c. Author name Samuel Peng
2. How did you receive a copy of this publication?
Bought it
:11 Borrowed it
Mailing list membership
Telephone request
Internet request
Other (please describe)
3. Was this publication easy to get?Very Somewhat Not at all
4. How did you find out about this and other OERIpublications? (Check all that apply.)
Conferences
Journal articles
Teacher/educator
Professional associations
1:11 Internet (WWW)
Publication announcement
1:11 Received in mail
OERI staff contact
5. For what purposes did you use this OERIpublication? (Check all that apply.)
1:1 Planning
Policy or legislation
ZI1 Administrative decisions
Teaching, class material
Research/analysis
1:1 General information
Writing news articles, TV or radio material
Marketing, sales, or promotion
Other (please describe)
6. Did the publication help you accomplish whateveryou needed it for?
Yes No Partially
7. What is your occupation?Parent Teacher [11 Administrator
1:11 Librarian Researcher Statistician
Journalist/writer Policy Analyst Student
Program Planner
Other (please specify)
8. How could this OERI publication (or other OERIpublications) better meet your needs?(Check all that apply.)
More important topics in education
More timely release of data
More text introductions to each section
More research statisticsShorter reports (less than 10 pages)
Other (please describe)
9. Overall, how satisfied are youwith this product?
a. Comprehensiveness of information
b. Clarity of writing (readability, interpretability)
c. Clarity of presentation (e.g., tables, charts)
d. Timeliness of information
e. Accuracy of information
f. Clarity of technical notesg. Usefulness of resources and bibliographyh. Organization
i. Length
j. Format
Very Satisfied Satisfied Dissatisfied
PAPERWORK BURDEN STATEMENTOffice of Education Research and Improvement (OERI)
Publication Customer SurveyAccording to the Paperwork Reduction Act of 1995, no persons are required to respond to a collection of information unless t displays a valid OMB control number. The valid OMB
control number for this information collection is 1800-0011. The time required to complete this information collection is estimated to average 10 minutes per response, including
the time to review instructions, search existing data resources, gather the data needed, and complete and review the information collection. If you have any comments concerning
the accuracy of the time estimate(s), suggestions for improving this form, or concerns regarding the status of your individual submission of this form, write directly to: P. Guinn,
Room 204, Media and Information Services, OERI, U.S. Department of Education, 555 New Jersey Avenue NW, Washington, DC 20208.5570.
3

OERI Publication Customer SurveyMedia and Information ServicesU.S. Department of Education
Washington, DC 20202
Official BusinessPenalty for Private Use, $300
BUSINESS REPLY MAILFIRST-CLASS MAIL PERMIT NO. 012935 WASHINGTON DC
POSTAGE WILL BE PAID BY U.S. DEPARTMENT OF EDUCATION
U.S. Department of EducationMail Code: 5570400 Maryland Avenue, S.W.Washington, D.C. 20277-2935
111111111111 II 11111 II 1111111111111111111111111111111
NO POSTAGENECESSARY
IF MAILEDIN THE
UNITED STATES
Fold on lineTAPE CLOSEDDO NOT STAPLE
10. Do you have any suggestions regarding the content or format of future editions of this publication or other comments?
4
MIS 1999-6532

NATIONAL CENTER FOR EDUCATION STATISTICS
Research and Development Report July 2001
Community College TransferRates to 4-Year InstitutionsUsing Alternative Definitionsof Transfer
Ellen M. BradburnNational Center for Education Statistics
David G. HurstEducation Statistics Services Institute
Samuel Peng, Project OfficerNational Center for Education Statistics
U.S. Department of EducationOffice of Educational Research and Improvement NCES 2001-197
5

U.S. Department of EducationRod PaigeSecretary
National Center for Education StatisticsGary W. PhillipsActing Commissioner
The National Center for Education Statistics (NCES) is theprimary federal entity for collecting, analyzing, andreporting data related to education in the United States and other nations. It fulfills a congressional mandate tocollect, collate, analyze, and report full and complete statistics on the condition of education in the UnitedStates; conduct and publish reports and specialized analyses of the meaning and significance of such statis-tics; assist state and local education agencies in improving their statistical systems; and review and report oneducation activities in foreign countries.
NCES activities are designed to address high priority education data needs; provide consistent, reliable,complete, and accurate indicators of education status and trends; and report timely, useful, and high qualitydata to the U.S. Department of Education, the Congress, the states, other education policymakers,practitioners, data users, and the general public.
We strive to make our products available in a variety of formats and in language that is appropriate to a varietyof audiences. You, as our customer, are the best judge of our success in communicating information effec-tively. If you have any comments or suggestions about this or any other NCES product or report, we would liketo hear from you. Please direct your comments to:
National Center for Education StatisticsOffice of Educational Research and ImprovementU.S. Department of Education1990 K Street, NWWashington, DC 20006-5561
July 2001
The NCES World Wide Web Home Page is: http://nces.edgovThe NCES World Wide Web Electronic Catalog is: http://nces.ed.gov/pubsearch/index.asp
Suggested Citation
U.S. Department of Education. National Center for Education Statistics. Community CollegeTransfer Rates to4-Year Institutions Using Alternative Definitions of Transfer, NCES 2001-197, by Ellen M. Bradburn and DavidG. Hurst. Project Officer: Samuel Peng. Washington, DC: 2001.
For ordering information on this report, write:
U.S. Department of EducationED PubsP.O. Box 1398Jessup, MD 20794-1398
or call toll free 1-877-4ED-Pubs.

FOREWORD
The Research and Development (R&D) series of reports at NCES has been initiated:
1. To share studies and research that are developmental in nature. The results of such studies may be
revised as the work continues and additional data become available.
2. To share the results of studies that are, to some extent, on the "cutting edge" of methodological
developments. Emerging analytical approaches and new computer software development often per-
mit new, and sometimes controversial, analyses to be done. By participating in "frontier research,"
we hope to contribute to the resolution of issues and improved analysis.
3. To participate in discussions of emerging issues of interest to educational researchers, statisticians,
and the federal statistical community in general. Such reports may document workshops and sympo-
sia sponsored by NCES that address methodological and analytical issues or may share and discuss
issues regarding NCES practices, procedures, and standards.
The common theme in all three goals is that these reports present results or discussions that do not reach
definitive conclusions at this point in time, either because the data are tentative, the methodology is new and
developing, or the topic is one on which there are divergent views. Therefore, the techniques and inferences
made from the data are tentative and subject to revision. To facilitate the process of closure on the issues, we
invite comment, criticism, and alternatives to what we have done. Such responses should be directed to:
Marilyn McMillenChief StatisticianStatistical Standards ProgramNational Center for Education Statistics
1990 K Street, NWWashington, DC 20006-5654
iii

ACKNOWLEDGMENTS
The authors would like to thank all those who contributed to the production of this report. Samuel Pengof NCES provided support and feedback throughout the entire process, and Karol Krotki and Laura Salganikof the Education Statistics Services Institute (ESSI) also guided the project.
Many other reviewers at NCES and elsewhere influenced the report. Paula Knepper provided thoughtfultechnical review, and Bruce Taylor served as the adjudicator. Other reviewers from the Department of Edu-
cation included Shelley Burns, Dennis Carroll, Drew Malizio, and Audrey Pendleton. Outside reviewersincluded David Miller of ESSI, Kent Phillippe of the American Association of Community Colleges, andBrian Trzebiatowski of the American Association of State Colleges and Universities. We are grateful for themany improvements suggested by these reviewers.
The work that produced this report was the result of equal effort on the part of the authors. The order ofthe authors' names is alphabetical.
iv

EXECUTIVE SUMMARY
Introduction
A large proportion of undergraduates attend public 2-year institutions seeking a wide range of services,
from a place to experiment with postsecondary education to a structured vocational certificate or associate'sdegree program (Grubb 1988, 1991). Although the course offerings and degree programs of many commu-
nity colleges can accommodate diverse student interests and goals, preparing students to transfer to a 4-yearcollege remains a central characteristic of community colleges (Brint and Karabel 1989). This preparation is
key to the community college's role in higher education because it affirms the community college's claim to
a collegiate, academic identity and to a role in broadening access for those historically excluded from acollege education. Moreover, transfer is a component of most community college students' educationalaspirations (Grubb 1991, 195-96).
Despite, or perhaps because of, the importance of transfer from 2- to 4-year institutions, calculating thepercentage of community college students who transfer has proven to be somewhat problematic. At firstglance, the transfer rate seems relatively unambiguous: it is the number of students who transfer to a 4-yearcollege divided by the number of potential transfer students. However, the numerator and especially thedenominator can both be defined in a number of different ways, each having a significant impact on thetransfer estimate. The purpose of the present study is to use nationally representative community collegedata to examine several ways of defining the population of potential transfer students, the relationship ofthese definitions to student background characteristics, and the relationship of each definition to the result-ing transfer rate. This report consists of three sections. The first section describes the dataset used in theanalysis and the measurement issues implicated in the study of transfer. The second section presents theselected indicators of the key concepts in the study and the results of the analysis. The report concludes with
a discussion of the results in the context of other studies of community college students and transfer.
Data and Measurement
Although a considerable amount of research has investigated community college transfer rates, many ofthese analyses have used data that are either limited to a cohort of recent high school graduates, such as the
National Education Longitudinal Study of 1988 (NELS:88), or are not nationally representative. This study
uses the National Center for Education Statistics (NCES) 1990 Beginning Postsecondary Students Longitu-
dinal Study (BPS:1990/1994), a nationally representative sample of all students who enrolled in postsecondary
education for the first time between July 1, 1989, and June 30, 1990. Follow-up interviews were conducted
9

COMMUNITY COLLEGE TRANSFER RATES TO FOUR-YEAR INSTITUTIONS
in spring 1992 and 1994. BPS is particularly appropriate for the study of community college students be-cause it is representative of all beginning postsecondary students, not just recent high school graduates.
The approach of this report is similar to that used in analyses of individual community colleges or dis-tricts, particularly that of Spicer and Armstrong (1996). Holding the numerator constant, variously restric-tive definitions of the denominator are employed based on the different approaches to specifying the transferpopulation found in the literature.
This report defines transfer as follows: initial enrollment at a community college followed by subsequentenrollment at any 4-year institution within the 5-year study period. Potential transfer refers to being eligible
for transfer or "at risk" of transfer. The broadest definition of potential transfer used in this analysis includesall first-time, beginning community college students, although students only taking courses for which theyreceive no credit are excluded from the BPS sample. The pool of potential transfer students is then restrictedusing eight additional definitions of the denominator. They are referred to as "increasingly restrictive" be-cause the total proportion of the sample that is included generally decreases, although the more restrictivegroups are not necessarily subsets of the less restrictive groups. These definitions were selected to approxi-
mate measures commonly used in previous research, from explicit student goals to behaviors often thoughtto indicate intent to transfer or commitment to postsecondary education. They are as follows:
1) Expected to complete bachelor's degree or higher;
2) Enrolled in an academic program;
3) Enrolled continuously in 1989-90;
4) Enrolled anytime in academic year 1990-91;
5) Enrolled for 12 or more credit hours;
6) Indicated that they were taking courses toward a bachelor's degree in 1989-90;
7) Pursuing academic major or taking courses toward a bachelor's degree or both; and
8) Pursuing academic major and taking courses toward a bachelor's degree.
The analysis begins with estimating the percentage of the 1989-90 cohort of community college studentswho meet each of these definitions. The relationship of these criteria to various other student characteristics
is then explored. The first issue to be examined is whether the composition of the pool of potential transfer
students varies as the definition becomes more restrictive. Then, consideration is given to whether differentsubgroups of students are more or less likely to meet each definition. Finally, a transfer rate is calculated foreach group of potential transfer students, and the relationships of these definitions to transfer are explored.
vi10

EXECUTIVE SUMMARY
Results
Overall, 71 percent of beginning community college students responded that they anticipated earning a
bachelor's degree or higher when asked, "What is the highest level of education you ever expect to com-
plete?" (figure A). Also, the majority of students were enrolled in an academic program, enrolled continu-
ously in 1989-90, and enrolled during the 1990-91 academic year. Less than half of the students met the
other definitions, with 11 percent of the students both having an academic major and taking courses leading
toward a bachelor's degree.
Figure A.Among 1989-90 beginning postsecondary students enrolled at public 2-year institutions, thepercentage of the initial cohort meeting each definition of potential transfer
Percent100
90
80
7170 68
63 62
60
5043
40 36
30 25
20
11
10
0Expected to Enrolled 'n Enrolled Enrolled Pursuing Enrolled for Taking Pursuing
complete an academic continuously anytime in academic 12 or more courses academic
bachelor's program in 1989-90 academic major or credit hours toward major and
degree or year taking courses bachelor's taking courses
higher 1990-91 toward toward
bachelor's bachelor's
or both
NOTE: Unless otherwise specified, variables are as of 1989-90 (base year interview, first term of postsecondary enrollment).
SOURCE: U.S. Department of Education, National Center for Education Statistics, 1989-90 Beginning Postsecondary Students
Longitudinal Study (BPS:1990/1994), Data Analysis System.
vii

COMMUNITY COLLEGE TRANSFER RATES TO FOUR-YEAR INSTITUTIONS
Does the composition of the group of potential transfer students change as the definitionbecomes more restrictive?
Restricting the group of potential transfer students according to these definitions may alter the composi-tion of the group, since these educational characteristics are themselves associated with other backgroundvariables (Berkner, Cuccaro-Alamin, and McCormick 1996). Across increasingly restrictive definitions ofpotential transfer, the percentage of the pool that was in the highest socioeconomic status (SES) quartileincreased from 30 percent of all beginning postsecondary students to 51 percent of beginning postsecondarystudents with an academic major taking courses leading toward a bachelor's degree. Furthermore, none ofthe students in this particular sample who met the most restrictive definition of potential transfer were black,compared to 6 to 10 percent black students in each of the other potential transfer groups.' In general, re-stricting the pool of potential transfer students systematically altered the composition of the group to in-clude more traditional students (younger, dependent students who do not work full time).
What percentage of students with different characteristics meets each potential transferdefinition?
In addition to examining how the composition of the population of potential transfer students changed asthe definitions became more restrictive, the report also compares the likelihood of meeting each definitionof potential transfer across various subgroups of students. For example, students 22 years or older weregenerally less likely than younger students to meet the various definitions of potential transfer. In general,the higher the SES, the higher the percentage of students who met the criteria for each specification. Stu-dents who reported taking at least 1 credit hour of remedial mathematics instruction during 1989-90 weregenerally about as likely to fit each definition as students who did not take any remedial mathematics in-struction. Students who were enrolled full time were generally more likely to meet the various specificationsthan those who were enrolled less than full time.
Transfer rates for each definition of potential transfer
Figure B shows estimated transfer rates for all community college entrants and for the eight increasinglyrestrictive definitions of potential transfer arranged in order. The results show that, in general, the transferrate increased for more restrictive definitions. The lowest rate of ever enrolling in a 4-year institution, 25percent, was found for all beginning community college students, compared to 52 percent for studentsmeeting the most restrictive definition (both pursuing an academic major during 1989-90 and taking coursesleading toward a bachelor's degree). That is, the transfer rate for the most restrictive definition was at least
'This does not necessarily mean, however, that there are no black students in the population of community college studentswho would meet this definition.
viii12

EXECUTIVE SUMMARY
twice the rate for all students. Furthermore, figure C demonstrates that the percentage of actual transferstudents meeting the criteria for inclusion in the denominator also declined significantly as the definition ofpotential transfer became more restrictive. In other words, attempts to include only those students mostlikely to transfer actually exclude a sizable proportion of students who transfer anyway, without meetingthose criteria. For example, four out of five actual transfer students did not meet the most restrictive defini-
tion considered.
Figure B.Among 1989-90 beginning postsecondary students enrolled at public 2-year institutions, percentagewho transferred to 4-year institutions by spring 1994, for various definitions of potential transfer
Percent
100
90
80
70
60
50
40
30
20
10
0
36 36
25
37 38
4340
45
52
All Expected to Enrolled in Enrolled Enrolled Pursuing Enrolled for Taking Pursuing
students complete an academic continuously anytime in academic 12 or more courses academic
bachelor's program in 1989-90 academic major or credit hours toward major and
degree or year taking courses bachelor's taking courses
higher 1990-91 toward toward
bachelor's bachelor'sor both
NOTE: Unless otherwise specified, variables are as of 1989-90 (base year interview, first term of postsecondary enrollment).
SOURCE: U.S. Department of Education, National Center for Education Statistics, 1989-90 Beginning Postsecondary StudentsLongitudinal Study (BPS:1990/1994), Data Analysis System.
ix
13

COMMUNITY COLLEGE TRANSFER RATES TO FOUR-YEAR INSTITUTIONS
Figure C.Among 1989-90 beginning postsecondary students enrolled at public 2-year institutions whotransferred to 4-year institutions by spring 1994, the percentage who met the various definitions ofpotential transfer
Percent100
9593
90 89
84
80
70 69
6055
5044
40
30
20 g'! ' 1,71
10
0Expected o Enrolled in Enrolled Enrolled Pursuing Enrolled for Taking
complete an academic continuously anytime in academic 12 or more coursesbachelor's program in 1989-90 academic major or credit hours towarddegree or year taking courses bachelor'shigher 1990-91 toward
bachelor'sor both
21
Pursuingacademic
major andtaking courses
towardbachelor's
NOTE: Unless otherwise specified, variables are as of 1989-90 (base year interview, first term of postsecondary enrollment).
SOURCE: U.S. Department of Education, National Center for Education Statistics, 1989-90 Beginning Postsecondary StudentsLongitudinal Study (BPS:1990/1994), Data Analysis System.
Additional exploratory analyses examined the percentage of 1989-90 community college students whoever transferred to a 4-year institution by spring 1994 for each potential transfer definition, by selectedstudent background characteristics. In several cases, relationships of student characteristics to transfer ratesgenerally persisted even when restricted to students meeting the various potential transfer definitions. Forexample, in general, the older the age group, the lower the percentage of students who transferred, regard-less of the definition of potential transfer that was used. Also, regardless of the potential transfer definitionused, higher SES was generally associated with a higher transfer rate.
x14

EXECUTIVE SUMMARY
These results can be placed in the context of the literature about two questions: what percentage ofstudents in community colleges have educational expectations that include a bachelor's degree, and what is
the transfer rate for community college students? This contextual information is not intended to constitute a
statistical comparison across studies. In general, however, BPS estimates of the percentage of beginningcommunity college students whose expectations included a bachelor's degree or higher, as well as the per-
centage of students who transferred to a 4-year institution, are higher than estimates based on other datasets.
Dougherty (1987, 1992), for example, reviewed several studies and concluded that 30 to 40 percent of all
community college entrants aspire to a baccalaureate degree, while the present study found that 71 percent
of community college students in BPS expect to complete a bachelor's degree or higher. Similarly, while the
overall transfer rate found in this study is comparable to the average estimate of 22 percent found by the
Transfer Assembly project (Cohen and Sanchez 1997), both the numerator and denominator of the Transfer
Assembly project are more restrictive. Although BPS data do not facilitate use of this definition, an approxi-
mation of it using BPS data yielded a transfer rate of 33 percent, somewhat higher than that resulting from
the Transfer Assembly project.
However, any comparisons between the estimates presented in this report and those from other studies
must be considered in light of differences in how the overall population of community college students is
defined across studies. For example, BPS excluded students taking courses only for remedial oravocational
purposes without receiving credit, while other estimates may include these students. As a result, the
typical amount of remediation for students in BPS may underestimate, or otherwise differ from, the
amount of remediation found among community college students in generala factor that might be asso-
ciated with transfer to a 4-year institution. Furthermore, this report focuses only on students enrolled in
public 2-year colleges; including other less-than-4-year colleges, particularly less-than-2-year institu-
tions, may lower the estimates. In addition, BPS data are restricted to first-time beginning postsecondary
students; colleges conducting their own studies of transfer may include entering students who are not
first-time beginners as defined in the BPS study. Finally, it could also be that student aspirations change
appreciably from one cohort to the next, and that estimates therefore could depend in part on when the
survey was administered.
Conclusion
This examination of alternative ways of defining potential transfer was undertaken in part to inform
research at the design stage. Which definition (or definitions) is (are) most appropriate for addressing a
specific research question? The decision is not straightforward. This report illustrates the trade-off between
restricting the pool of potential transfer students and excluding substantial portions of the initial cohort. For
example, including students who have an academic major and are taking courses leading toward a bach-
elor's degree results in a high transfer rate (52 percent), but no more than about 1 in 10 community college
xi15

COMMUNITY COLLEGE TRANSFER RATES TO FOUR-YEAR INSTITUTIONS
students meets this definition, and it excludes 4 out of 5 transfer students. Restricting the pool to the 70percent of students who expect to earn a bachelor's degree or higher yields a transfer rate of 36 percent, butfully 95 percent of all transfers have this expectation.
Just as any statistic depends on the specific variables used to indicate the underlying concepts, the trans-
fer rate for community college students is sensitive to the specification of potential transfer. The most com-plete picture is provided by using multiple indicators, but this approach is not always practical. If datacollection costs or other constraints only permit one definition, one strategy is to define the group of poten-tial transfer students broadly enough that it still reflects community college students somewhat generally,while not being so broad as to include students who never harbor plans to transfer to a 4-year college. Theresults of this study present several alternatives with different advantages and disadvantages.
Overall, the results provide national estimates of community college students' academic expectationsand transfer activity. These estimates refine and update our understanding of students' intentions and paths
to transfer. Selecting an approach to defining potential transfer is a necessary first step in any effort toanalyze the impact of institution type on persistence and attainment. This report has taken a step back andanalyzed the definition itself by examining several alternative approaches using a complete nationally rep-resentative sample. While the results do not demonstrate the superiority of any single definition, they sharpen
one's appreciation for the consequences of measurement decisions and build a firmer foundation for futurework on this population.
xii 16

TABLE OF CONTENTS
Foreword iii
Acknowledgments iv
Executive SummaryList of Tables xiv
List of Figures xvi
Introduction 1
Data Source and Measurement Issues 2
Data Source 2
Measurement Issues 3
Analysis and Results 7
Definition of Variables 7
Results 9
Does the composition of the group of potential transfer studentsdefinition becomes more restrictive?
What percentage of students with different characteristics meetstransfer definition?
Transfer rates for each definition of potential transfer
change as the
each potential
11
16
21
Discussion 31
Educational Expectations and Potential Transfer 31
Transfer Estimates 33
Operationalizing the Transfer Rate Denominator 36
References 39
Appendix AGlossary 41
Appendix BTechnical Notes and Methodology 49
Appendix CSupplemental and Standard Error Tables 55
17

LIST OF TABLES
1 Percentage distributions within potential transfer categories of 1989-90 beginningpostsecondary students enrolled at public 2-year institutions according to various student andinstitution characteristics 12
2 Among 1989-90 beginning postsecondary students enrolled at public 2-year institutions,percentage of initial cohort meeting each definition of potential transfer, by various studentand institution characteristics 17
3 Among 1989-90 beginning postsecondary students enrolled at public 2-year institutions,percentage who transferred to 4-year institutions by spring 1994, for various definitions ofpotential transfer 23
Cl Standard errors for table 1: Percentage distributions within potential transfer categories of1989-90 beginning postsecondary students enrolled at public 2-year institutions according tovarious student and institution characteristics 56
C2 Standard errors for table 2: Among 1989-90 beginning postsecondary students enrolled at
public 2-year institutions, percentage of initial cohort meeting each definition of potentialtransfer, by various student and institution characteristics 60
C3 Standard errors for table 3: Among 1989-90 beginning postsecondary students enrolled atpublic 2-year institutions, percentage who transferred to 4-year institutions by spring 1994,for various definitions of potential transfer 64
C4 Estimates and standard errors for figure 4: Among 1989-90 beginning postsecondary studentsenrolled at public 2-year institutions who transferred to 4-year institutions by spring 1994, thepercentage who met the various definitions of potential transfer 65
C5 Among 1989-90 beginning postsecondary students enrolled at public 2-year institutions,percentage who transferred to 4-year institutions by spring 1994, by student characteristicsand for various definitions of potential transfer 66
C6 Standard errors for table C5: Among 1989-90 beginning postsecondary students enrolled atpublic 2-year institutions, percentage who transferred to 4-year institutions by spring 1994, bystudent characteristics and for various definitions of potential transfer 68
18xiv

LIST OF TABLES
C7 Percentage of 1989-90 beginning postsecondary students enrolled at public 2-year institutionsmeeting each definition of potential transfer, by whether they met less restrictive definitions 70
C8 Standard errors for table C7: Percentage of 1989-90 beginning postsecondary students enrolledat public 2-year institutions meeting each definition of potential transfer, by whether they met
less restrictive definitions 71
xv
19
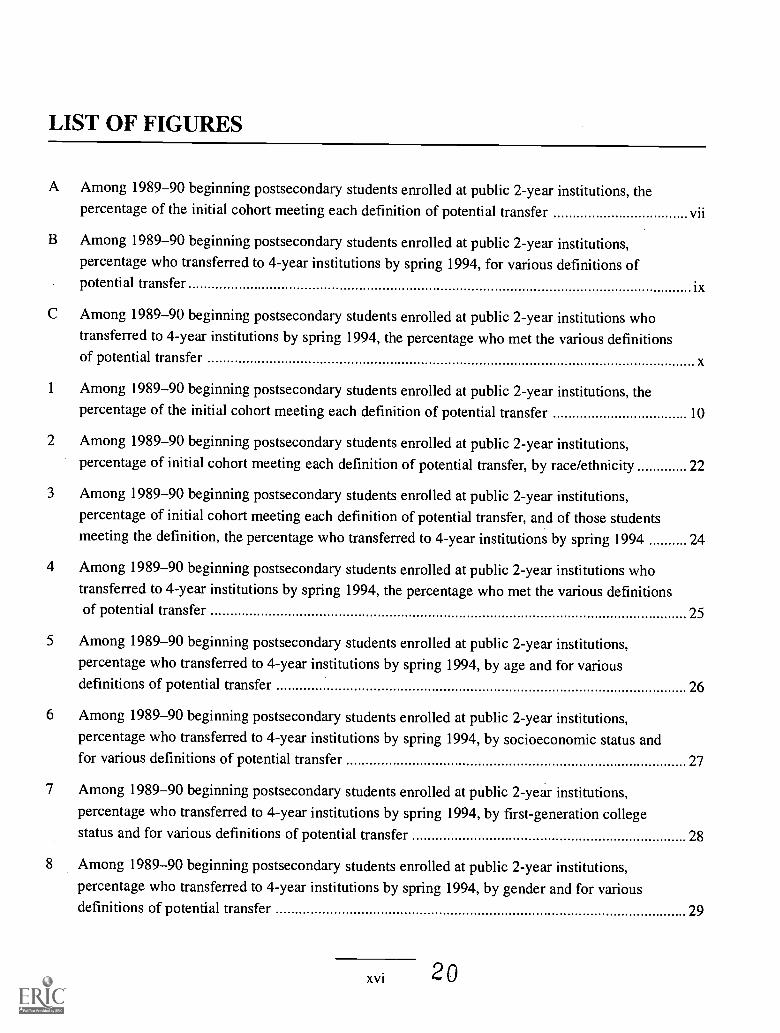
LIST OF FIGURES
A Among 1989-90 beginning postsecondary students enrolled at public 2-year institutions, thepercentage of the initial cohort meeting each definition of potential transfer vii
B Among 1989-90 beginning postsecondary students enrolled at public 2-year institutions,percentage who transferred to 4-year institutions by spring 1994, for various definitions ofpotential transfer ix
C Among 1989-90 beginning postsecondary students enrolled at public 2-year institutions whotransferred to 4-year institutions by spring 1994, the percentage who met the various definitionsof potential transfer
1 Among 1989-90 beginning postsecondary students enrolled at public 2-year institutions, thepercentage of the initial cohort meeting each definition of potential transfer 10
2 Among 1989-90 beginning postsecondary students enrolled at public 2-year institutions,percentage of initial cohort meeting each definition of potential transfer, by race/ethnicity 22
3 Among 1989-90 beginning postsecondary students enrolled at public 2-year institutions,percentage of initial cohort meeting each definition of potential transfer, and of those studentsmeeting the definition, the percentage who transferred to 4-year institutions by spring 1994 24
4 Among 1989-90 beginning postsecondary students enrolled at public 2-year institutions whotransferred to 4-year institutions by spring 1994, the percentage who met the various definitionsof potential transfer 25
5 Among 1989-90 beginning postsecondary students enrolled at public 2-year institutions,percentage who transferred to 4-year institutions by spring 1994, by age and for variousdefinitions of potential transfer 26
6 Among 1989-90 beginning postsecondary students enrolled at public 2-year institutions,percentage who transferred to 4-year institutions by spring 1994, by socioeconomic status andfor various definitions of potential transfer 27
7 Among 1989-90 beginning postsecondary students enrolled at public 2-year institutions,percentage who transferred to 4-year institutions by spring 1994, by first-generation collegestatus and for various definitions of potential transfer 28
Among 1989-90 beginning postsecondary students enrolled at public 2-year institutions,percentage who transferred to 4-year institutions by spring 1994, by gender and for variousdefinitions of potential transfer 29
xvi 20

INTRODUCTION
In fall 1996, 43.5 percent of all first-time, first-year undergraduate students were enrolled in communitycolleges' (Barbett 1998). Some of these students enroll in community colleges expecting to earn a certificate
or an associate's degree in a vocational area such as data processing, business support, or automotive technol-
ogy that will have immediate returns in the labor market. Other students enroll with the intention of takingprimarily academic courses and eventually transferring to a 4-year college to earn a bachelor's degree. Still
others enter community colleges planning to take no more than one or two classes that are of personal orprofessional interest. Finally, some students may not have a clearly defined academic or occupational goalwhen they enter community college, but are simply "experimenting" with postsecondary education (Grubb1988, 1991). The relative proportions of these various goals, however, have not been definitively established.
Although the course offerings and degree programs of many community colleges can accommodatediverse student interests and goals, preparing students to transfer to a 4-year college remains a central char-
acteristic of community colleges (Brint and Karabel 1989). This preparation is key to community colleges'role in higher education because it affirms community colleges' claim to a collegiate, academic identity andto a role in broadening access for those historically excluded from a college education. Moreover, transfer is
a component of most community college students' educational aspirations (Grubb 1991, 195-96).
Despite, or perhaps because of, the importance of transfer from 2- to 4-year institutions, calculating thepercentage of community college students who transfer has proven to be somewhat problematic. At firstglance, the transfer rate seems relatively unambiguous: it is the number of students who transfer to a 4-yearcollege divided by the number of potential transfer students. However, the numerator and especially thedenominator can both be defined in a number of different ways, each having a significant impact on thetransfer estimate. Some researchers and practitioners suggest, for example, that the denominator shouldconsist of all students who enter a community college in a given year, regardless of their initial expectations,while others argue that the denominator should only include those students who start out planning, expect-
ing, or hoping to transferi.e., the pool of "potential transfer students" (Dougherty 1994; Spicer andArmstrong 1996). If the denominator is restricted to only those community college students with transfer
intentions, how should this group be defined?
The purpose of the present study is to use nationally representative community college data to examineseveral ways of defining potential transfer, the relationship of these definitions to student background char-
'In this report, the terms "community college" and "public 2-year college" refer to a public institution whose highest programof study results in an award or degree below the baccalaureate level and is at least 2 years but less than 4 years in duration.
1 21

COMMUNITY COLLEGE TRANSFER RATES TO FOUR-YEAR INSTITUTIONS
acteristics, and the relationship of each definition to the resulting transfer rate. This report consists of threesections. The first section describes the dataset used in the analysis and the measurement issues implicatedin the study of transfer. The second section presents selected indicators of the key concepts in the study andresults of the analysis. The report concludes with a discussion of the results in the context of other studies ofcommunity college students and transfer.
Data Source and Measurement Issues
Data Source
Although a considerable amount of research has investigated community college transfer rates, many ofthese analyses have used data that are either limited to a cohort of recent high school graduates, such as theNational Education Longitudinal Study of 1988 (NELS:88), or are not nationally representative. This studyuses the National Center for Education Statistics (NCES) 1990-94 Beginning Postsecondary Students Longi-
tudinal Study (BPS:1990/1994), a nationally representative sample of all students who enrolled in postsecondary
education' for the first time between July 1, 1989, and June 30, 1990. To be eligible, a student must have beenenrolled during the 1989-90 academic year for one or more of the following purposes: taking course(s) forcredit; in a degree or formal award program of at least 3 months' duration; or in an occupationally or vocationallyspecific program of at least 3 months' duration. Students only taking courses for remedial or avocationalpurposes without receiving credit were excluded from the sample (Pratt et al. 1996, 5). Follow-up interviewswere conducted in spring 1992 and 1994.4 The BPS:1990/1994 response rate was 91 percent among thosestudents known to be eligible for the study, yielding a total sample of 6,617 students who responded to allthree interviews (Berkner, Cuccaro-Alamin, and McCormick 1996; Pratt et al. 1996).
BPS is particularly appropriate for the study of community college students because it is representativeof all beginning postsecondary students, not just recent high school graduates. Older, non-traditional begin-ning postsecondary students and those who may never have completed a high school diploma are moreprevalent in community colleges than 4-year institutions (Kojaku and Nunez 1998). For example, 26 percent
'The 1990 National Postsecondary Student Aid Study (NPSAS:1990), upon which the BPS:1990/1994 sample is based, wasdesigned to include students enrolled in all types of postsecondary education. However, service academies; institutionsoffering only avocational, recreational, or remedial courses; institutions offering only in-house business courses; those offer-ing only programs of less than 3 months' duration; and those offering only correspondencecourses were excluded (McCormick1997, 69).
4A new BPS cohort of 1995-96 beginning students was interviewed in 1996 and re-interviewed in 1998 (BPS:1996/1998).While this new BPS contains additional survey items concerning students' educational goals, only data from the first follow-up interviews were available at the time the current analysis was undertaken (a second follow-up will be administered in2001). Because the relationship between definitions of potential transfer and the likelihood of transferring are of particularinterest in this analysis, the first BPS, for which five academic years of data are available, was considered a more appropriatedataset.
2 22

INTRODUCTION
of beginning community college students are age 24 or over, compared with 5 percent of those entering 4-
year institutions (Kojaku and Nuflez 1998, 9). In addition, the final follow-up of BPS students occurred 5
academic years after most students had first enrolled, allowing sufficient time for many transfers to occur.BPS also captured all transfers that occurred within this 5-year period, regardless of the control or locationof the receiving institution. Thus, students who made lateral or "downward" transfers to other less- than -4-
year institutions and then transferred to a 4-year college or university are also included in BPS. (About 20
percent of community college beginners first transferred to a less-than-4-year institution; of those, 9 percent
enrolled in a 4-year institution by spring 1994 [McCormick 1997, 32, 41]). In short, BPS is the first study
that provides a nationally representative sample of all entering college students at public 2-year institutions,
while reflecting all of their transfer activity over an extended period of time.
Measurement Issues
As noted above, the primary purpose of this study is to examine alternative ways of defining potentialtransfer, or the sub-population of community college students who may harbor some intention of transfer-
ring to a 4-year institution. While BPS is a particularly appropriate dataset with which to study educationalexpectations and transfer, selecting a set of potential transfer definitions from the wide range of alternativesthat have been proposed in previous research is a challenging task. This section reviews issues that research-
ers have faced in operationalizing the transfer rate, with an emphasis on the denominator, or the pool of
potential transfer students.
Calculating a transfer rate requires delineating both the population of potential transfer students and
what is considered transfer itself. Although specifying the potential transfer population is particularly prob-
lematic and is the primary focus of this report, at least three issues arise when defining what constitutes"transfer." The level of the destination institution has already been specified because transfer to 4-yearinstitutions is of particular interest in the community college literature (Grubb 1991). Second, assuming thattransfer is defined as subsequent enrollment,' what is the maximum length of time within which a student
can enroll in a 4-year college and still be counted as a transfer student for a given cohort of community
college students? If this period is very short, the transfer estimate may systematically undercount the trans-fer of students who initially enroll less than full time or who "stop out" for an extended period (see, e.g.,Gutierrez-Marquez 1994; Kojaku and Nuriez 1998). Even students with transfer intentions at the time of
entry into postsecondary education may not plan to do so immediately following their departure from their
first institution (McCormick 1997; Berkner, Horn, and Clune 2000). On the other hand, accounting for all
subsequent enrollment would, in essence, require following students until they died, which would be pro-
hibitively expensive and cumbersome.
'This definition excludes students who are enrolled at two or more institutions simultaneously: about 5 percent of under-graduates did so in 1995-96 (Horn and Berktold 1998, table 2.1).
3 23

COMMUNITY COLLEGE TRANSFER RATES TO FOUR-YEAR INSTITUTIONS
Finally, the location and control of the 4-year institution to which a student transfers varies and may be abasis for defining transfer. While the most reliable data available on a routine basis may be transfers to in-state, public institutions (Cohen 1991; Cohen and Sanchez 1997; Palmer and Reish 1991), students whotransfer to private or out-of-state institutions are not captured in this definition of transfer. Studies usingnational longitudinal datasets such as High School and Beyond (HS&B), however, typically count enrollmentat any 4-year college or university after leaving a community college as transfer (Lee and Frank 1990;McCormick 1997).
These questions must be answered in specifying the numerator of the transfer rate. However, it is theoperationalization of the denominator, or the population of potential transfer students, that varies mostwidely. Perhaps the most extensively considered issue in defining potential transfer is whether to include allstudents or only those with transfer intentions. In a recent study, for example, 38 percent of communitycollege entrants said transfer to a 4-year institution was their primary reason for enrolling (Berkner, Horn,and Clune 2000). However, students who indicated another primary reason for enrolling, such as to earn adegree or certificate, may nevertheless also intend to transfer to a 4-year institution. If one of the roles ofcommunity colleges is to afford all students the opportunity to enter a baccalaureate institution, that prepa-ration might entail raising expectations to a level that would necessitate transfer. The denominator under thisassumption would include all students (Gutierrez-Marquez 1994). On the other hand, some identify this asan issue of "fairness," asserting that community colleges should not be held accountable for the lack oftransfer among students who never intended to transfer when they first enrolled in the community college(Gutierrez-Marquez 1994; McCormick 1997). The denominator in this case would be more restrictive.
When restrictions are imposed, one of two broad approaches is usually used: one focusing on whatstudents say they intend to do, the other relying on observable behaviors. Both approaches have limitations.Even when students are asked directly whether or not they intend to transfer, some may say they intend totransfer even when they do not (for example, believing that institutional and financial aid practices rewardtransfer intentions [Spicer and Armstrong 1996] or perceiving "bachelor's degree" to be the most sociallydesirable response). If so, the measure could inadvertently underestimate transfer rates by overestimatingthe number of students in the denominator. When behavioral indicators, such as completion of a minimumnumber of credits, are used, they too may be thought to reflect explicit or nascent student intent to transfer,whether as a cause or a result of students' specific behaviors (Dougherty 1992; Spicer and Armstrong 1996).Yet students may take such actions without harboring intentions to transfer at any time. Thus, some meas-urement error may occur with either type of criterion.
Self-reported student academic intent can be very difficult to assess, particularly when making specificinstitutional comparisons, because not all colleges ask students their intentions, those that do use varyingquestion wording that can affect responses, and students' intentions may change over time (Laanan andSanchez 1996). Still, both institution-based studies (Gutierrez-Marquez 1994) and national surveys(McCormick 1997) have asked students about their future plans. Some have specifically asked community

INTRODUCTION
college students at time of entry, after a period of enrollment, or both times whether they intend to transfer(Gutierrez-Marquez 1994; Spicer and Armstrong 1996; Berkner, Horn, and Clune 2000), while others have
broadly asked about educational expectations or aspirations (McCormick 1997). A previous NCES report,for example, restricted the definition of potential transfer students to those who said that the courses they
were currently enrolled in (during their first term in postsecondary education) were leading to a bachelor's
degree or higher, inferring intent to transfer on that basis (McCormick 1997).
Cohen (1991) suggests that potential transfer definitions should include only those students who havecompleted a minimum number of credits, thus having "been enrolled long enough for the college staff to have
had a chance to work with them" (p. 3). Thus, his ongoing Transfer Assembly project, designed to produce
consistent transfer data for community colleges across the country, aims to exclude students who simply "drop
in" to postsecondary educationsampling one or two courses without giving any indications that they aredirected toward completion of a specific credential goal. The Transfer Assembly definition, adopted by many
researchers because it is widely collected by institutions, includes all students with no previous postsecondary
experience' who complete a minimum of 12 credits within 4 years (Cohen 1991; Cohen and Sanchez 1997;
Gutierrez-Marquez 1994; Laanan and Sanchez 1996; Spicer and Armstrong 1996). Variations on this behavioral
definition look at completion of fewer or more credits in more or less time, or consider semesters completedrather than credits earned. Such measures, which necessarily limit the amount of time that may elapse before
data are collected, exclude students who take longer than the specified time period to meet the potential trans-
fer criteria. Furthermore, these measures also exclude students who transfer before meeting the criteria.
Some studies have limited potential transfer students to those pursuing a specific credential objective atthe community college level. Cohen and Sanchez (1997) explain that some of the programs that students
might enroll in are more focused toward or compatible with transfer than others. To the extent that students
enroll in these programs because they plan to transfer, or develop transfer goals after enrolling in them,
credential objectives may reflect transfer intentions. Along these lines, both students' reported current de-gree objectives (e.g., completion of a certificate or an associate's degree [Gutierrez-Marquez 1994]) and
their actual enrollment in certificate or degree programs (Laanan and Sanchez 1996; Spicer and Armstrong1996) have been employed. Similarly, enrollment in an academic rather than a vocational program of study
may be more compatible with subsequent transfer to a 4-year institution (Berkner, Horn, and Clune 2000).
Of course, students who are enrolled with no plans for degree completion may also tend to be enrolled in
academic rather than vocational courses.
6Many studies have attempted to filter out any effect of previous postsecondary experience by including only those students
who are first-time postsecondary or first-time college students (Cohen 1991; Cohen and Sanchez 1997; Gutierrez-Marquez
1994; Laanan and Sanchez 1996; Spicer and Armstrong 1996; McCormick 1997) or students who enrolled in a given term
who were not also enrolled at 4-year institutions and did not already have bachelor's degrees (Laanan and Sanchez 1996).
Studies that rely on samples of recent high school graduates (Lee and Frank 1990; Grubb 1991) also, in effect, make this
restriction.
5 2J

COMMUNITY COLLEGE TRANSFER RATES TO FOUR-YEAR INSTITUTIONS
Finally, recent federal legislation regarding the Student Right-to-Know Act requires schools to reportinformation about the rate of completion and transfer (California Community Colleges Chancellor's Office1999). Schools must make available information about the transfer rate of degree-seeking students whoattempt full-time enrollment in their first term (Spicer and Armstrong 1996). Unlike most of the definitionsof transfer used in the literature, however, only students who enroll in a 4-year institution and do not firstcomplete a certificate or an associate's degree are counted as transfers.
This section summarized some of the measurement concerns that arise when calculating a transfer rateand some of the approaches that researchers have used to define potential transfer. The following sectionoutlines this report's approach to the measurement of the transfer rate, first defining "transfer" and thendelineating the several alternative definitions of "potential transfer" used in the analysis. The results ofapplying these definitions to the BPS longitudinal dataset are then detailed.
6 26

ANALYSIS AND RESULTS
The purpose of this analysis is to use data that are nationally representative of the community college
population to examine a number of alternative definitions of potential transfer. The approach of this report is
similar to that used in analyses of individual community colleges or districts, particularly that of Spicer and
Armstrong (1996). Holding the numerator constant, variously restrictive definitions of the denominator are
employed based on the different approaches to specifying the potential transfer population found in the
literature. The next set of results examines how the composition of the student population captured by each
definition of potential transfer changes as the definitions become more restrictive, and the relationship of
each definition to the resulting transfer rate.
Definition of Variables
The operationalization of transfer (the numerator) used in this report is as follows: initial enrollment at a
community college followed by subsequent enrollment at any 4-year institution' within the 5-year study
period. To be counted as a transfer student, the student must have ceased enrollment at the community
college; concurrent enrollment at a community college and a 4-year institution is not considered transfer in
this study. Activity after enrollment at a 4-year institution is not factored into this definition: if a community
college student transferred to a 4-year institution and then re-enrolled at the first institution, the student is
still counted as having transferred.' Also, following McCormick's (1997) earlier analysis of transfer using
BPS:1990/1994, this definition of transfer is based on enrollment only, regardless of whether or not a stu-
dent transfers credits. About 89 percent of students who attended only two institutions over the course of the
study9 reported transferring credits between the community college where they initially enrolled and the 4-
year institution at which they later enrolled (McCormick 1997, 37). Both the percentage of beginning com-
munity college students who ever enrolled in a 4-year institution (including students who first transferred to
another less-than-4-year institution before transferring to a 4-year institution) and the percentage who first
transferred to a 4-year institution after community college enrollment (including only students whose first
transfer was to a 4-year institution) are presented.
'Defined as a public, private not-for-profit, or private for-profit institution that offers 4-year bachelor's degrees. These insti-
tutions may or may not also offer master's, doctoral, or first-professional degrees (McCormick 1997, 61).
'That is, students who enroll at 4-year institutions with only a short-term purpose, such as to pick up a course not offered at their
current institution, are treated here as transfer students. However, since simultaneous enrollment is not counted as transfer, this
group may be small. This definition of transfer is consistent with that used in previous NCES reports (McCormick 1997).
9These students represent 73 percent of all community college students who transferred to a 4-year institution (McCormick
1997, 37). Credit estimates for students attending more than two institutions are not readily available from BPS:1990/1994.
7 27

COMMUNITY COLLEGE TRANSFER RATES TO FOUR-YEAR INSTITUTIONS
Potential transfer refers to being eligible for transfer or "at risk" of transfer, and is specified in severalways in this analysis. The broadest definition of potential transfer used in this analysis includes all first-time, beginning community college students, although students only taking courses for which they receiveno credit are excluded from the BPS sample. The pool of potential transfer students is then restricted usingthe eight additional definitions of the denominator described below. These definitions were selected toreflect the widest possible range of measures detailed above, from explicit student goals to behaviors oftenthought to indicate intent to transfer or commitment to postsecondary education. For more informationabout the variables used in these definitions, as well as other variables used in the analysis, see the glossaryin appendix A.
1) Expected to complete bachelor's degree or higher. This is the primary measure of self-reported aca-demic expectations used in this analysis and is based on a student's response to the question, "Whatis the highest level of education you ever expect to complete?" The question was asked of studentsduring the base year interview in 1989-90.
2) Enrolled in an academic program. This definition is based on student reports of whether their pro-gram of study during the 1989-90 year was primarily academic or vocational.
3) Enrolled continuously in 1989-90. Students were considered continuously enrolled if they did nothave any period of more than 4 months of nonenrollmentduring 1989-90. This definition and the onethat follows are each intended to roughly approximate the Transfer Assembly approach of looking atonly those students who earn 12 credit units (or about 4 classes) over 4 years."'
4) Enrolled anytime in academic year 1990-91. Students indicating enrollment at any postsecondaryinstitution during academic year 1990-91 are included.
5) Enrolled for 12 or more credit hours. This definition refers to the student's 1989-90 sampled term(first term of postsecondary enrollment). Although most studies of transfer do not include full-timeenrollment as a definition of the pool of potential transfers, this definition approximates the denomi-nator used in the Graduation Rate Survey (GRS) of the NCES Integrated Postsecondary EducationData System (IPEDS). The GRS is designed to help institutions meet the reporting requirements ofthe Student Right-To-Know legislation."
6) Taking courses toward bachelor's degree. This definition is more narrowly focused than the generaleducational expectations in definition (1) because it refers to the courses the students were specifi-cally enrolled in during the 1989-90 term. Even though students are enrolled at 2-year institutions,those who plan to transfer in the short term might indicate that they are currently working on a
'The Transfer Assembly definition cannot readily be used with BPS data. Although this definition and the next are intendedto approximate the Transfer Assembly approach, a student could conceivably take just two courses over a 1- or 2-year periodand still meet either of these criteria. Therefore, these definitions are likely to be somewhat less restrictive than the TransferAssembly model.
"However, unlike the current study, the definition of transfer used in GRS includes only those students who have not com-pleted a certificate, degree, or transfer-preparatory program.
828

ANALYSIS AND RESULTS
bachelor's degree. However, in systems where students are encouraged to complete an associate'sdegree before transfer, students might indicate that they are working on the associate's degree evenif they have transfer intentions (McCormick 1997). Such students may, for example, be enrolled incommunity colleges that have clear articulation agreements with 4-year institutions in the same
system.12
7) Pursuing academic major or taking courses toward bachelor's degree or both. This definition ofpotential transfer excludes those students pursuing a vocational major and taking courses toward an
associate's degree, as well as those working on a credential below the associate's degree.
8) Pursuing academic major and taking courses toward bachelor's degree. While definition (7) in-cludes students meeting either of these criteria, this highly restrictive definition requires studentsto meet both. Although it also excludes those students with a vocational focus, this specification
serves as an attempt to exclude those students who may only be experimenting with postsecondary
education.
The analysis begins with estimating the percentage of the 1989-90 cohort of community college students
who meet each of these definitions of potential transfer. The relationship of these criteria to various other
student characteristics is then explored. First, the degree to which the composition of the pool ofpotential
transfer students varies as the definition becomes more restrictive is examined. Then, consideration is given
to whether different subgroups of students are more or less likely to meet each definition. Finally, a transfer
rate is calculated for each group of potential transfer students. The following section describes the results of
this analysis.
Results
Figure 1 presents the percentage of the 1989-90 community college cohort meeting each definition of
potential transfer described above. Overall, 71 percent of beginning community college students responded
that they anticipated earning a bachelor's degree or higher when asked, "What is the highest level of educa-
tion you ever expect to complete?" Also, the majority of students were enrolled in an academic program,enrolled continuously in 1989-90, and enrolled during the 1990-91 academic year. Less than half of the
students met the other definitions, with 11 percent of the students both having an academic majorand taking
courses leading toward a bachelor's degree.
Throughout the remainder of the report, the definitions of potential transfer are ordered according to the
percentage of the initial cohort meeting each definition. They are referred to as "increasingly restrictive"
'2An unknown proportion of students, moreover, may misunderstand the question. As shown below, however, students in this
category do have a higher than average rate of transfer to 4-year institutions.
929

COMMUNITY COLLEGE TRANSFER RATES TO FOUR-YEAR INSTITUTIONS
Figure 1.Among 1989-90 beginning postsecondary students enrolled at public 2-year institutions, thepercentage of the initial cohort meeting each definition of potential transfer
Percentt00
90
80
7170 68
63 63
60
50
43
4036
3026
20
10
0Expected o Enrolled in Enrolled Enrolled Pursuing Enrolled for Taking
complete an academic continuously anytime in academic 12 or more coursesbachelor's program in 1989-90 academic major or credit hours towarddegree or year taking courses bachelor'shigher 1990-91 toward
bachelor'sor both
11
Pursuingacademic
major andtaking courses
towardbachelor's
NOTE: Unless otherwise specified, variables are as of 1989-90 (base year interview, first term of postsecondary enrollment).
SOURCE: U.S. Department of Education, National Center for Education Statistics, 1989-90 Beginning Postsecondary StudentsLongitudinal Study (BPS:1990/1994), Data Analysis System.
because the total proportion of the cohort that is included generally decreases, although the more restrictivegroups are not necessarily subsets of the less restrictive groups. Generally, about 70 percent or more ofstudents meeting the criteria for a given definition of potential transfer also met the less restrictive defini-tions. For example, 82 percent of students enrolled in an academic program also expected to earn a bach-elor's degree or higher (see table C7 in appendix C). Among those enrolled for 12 or more credit hours,however, about half (52 percent) indicated that they were pursuing an academic major or taking coursestoward a bachelor's degree or both, while 45 percent of students indicating that they were taking coursestoward a bachelor's degree were also enrolled for 12 or more credit hours.
10 30

ANALYSIS AND RESULTS
Does the composition of the group of potential transfer students change as the definitionbecomes more restrictive?
Restricting the group of potential transfer students according to these definitions may alter the composi-tion of the group, since these educational characteristics are themselves associated with other backgroundvariables (Berkner, Cuccaro-Alamin, and McCormick 1996). Table 1 shows the percentage distributions of
all beginning community college students and students meeting each definition of potential transfer accord-ing to several student characteristics. Definitions of potential transfer are ordered by the proportion of theinitial student cohort included in that definition (see figure 1). Caution should be exercised in interpretingthis table, as many of the percentages shown are based on small sample sizes, which produce rather ineffi-cient estimates. Still, some relationships are observed in this table.
In particular, the increasing restriction of the definition of potential transfer was associated with severalof the characteristics considered. As the definition of potential transfer became more restrictive, the percent-
age of the pool that was in the highest socioeconomic status (SES) quartile increased from 30 percent of allbeginning postsecondary students to 51 percent of beginning postsecondary students with an academicmajor taking courses leading toward a bachelor's degree. The proportion of students meeting each definitionwho were in the lowest SES quartile decreased from 19 to 8 percent of potential transfer students. Further-
more, in this sample, none of the students meeting the most restrictive definition of potential transfer wereblack, compared to 6 to 10 percent black students in each of the other potential transfer groups.'3
Across increasingly restrictive definitions of potential transfer, the proportion of the pool that was age 18
or younger increased and the proportion that was age 22 or older decreased. Other relationships are consistent
with this pattern: the proportion of students who were dependent (who are likely to be younger students;[Berkner, Cuccaro-Alamin, and McCormick 1996]) also increased, from 65 percent of all students to 88percent of those in the most restrictive pool of potential transfer students. In general, the restricted groups ofpotential transfer students had higher proportions of dependent students than the sample overall. On the other
hand, the proportion delaying postsecondary enrollment more than a year after high school (who are likely to
be older students; [Berkner, Cuccaro-Alamin, and McCormick 1996]) decreased with increasing restriction
of the sample. The restricted pools of potential transfers generally had lower proportions of students whodelayed enrollment compared to the entire cohort.'4 The percentage of students working full time (35 or more
13This does not necessarily mean, however, that there are no black students in the population of community college studentswho would meet this definition. One possible explanation for this finding is that black students may be more likely than whiteor Hispanic students to indicate that they are pursuing an academic major and taking courses leading toward an associate'sdegree (rather than a bachelor's), in which case they would not be included in this most restrictive definition. Studentspursing a vocational major and taking courses leading toward a bachelor's degree are also excluded from this definition.
14Although the difference in this percentage between the total cohort and the most restrictive definition appears large, thelatter group is small and has a large standard error, so the difference is not statistically significant.
11 31

Tab
le 1
.-Pe
rcen
tage
dis
trib
utio
ns w
ithin
pot
entia
l tra
nsfe
r ca
tego
ries
of
1989
-90
begi
nnin
g po
stse
cond
ary
stud
ents
enr
olle
d at
pub
lic 2
-yea
rin
stitu
tions
acc
ordi
ng to
var
ious
stu
dent
and
inst
itutio
n ch
arac
teri
stic
s
Exp
ecte
dto
com
plet
eE
nrol
led
bach
elor
'sin
an
degr
eeac
adem
icC
hara
cter
istic
Tot
alor
hig
her
prog
ram
Tot
al10
0.0
100.
010
0.0
Age
as
of 1
2/31
/89
18 o
r be
low
43.9
50.9
53.6
19 th
roug
h 21
28.9
30.2
28.9
22 a
nd a
bove
27.1
18.9
17.6
22 th
roug
h 24
5.9
5.4
4.1
25 th
roug
h 34
12.1
8.0
8.2
35 th
roug
h 44
6.2
4.7
4.0
45 o
r ab
ove
2.9
0.8
1.2
Soci
oeco
nom
ic s
tatu
sL
owes
t qua
rtile
18.6
13.5
11.2
Low
er m
iddl
e20
.818
.618
.5
Upp
er m
iddl
e30
.331
.431
.5
Hig
hest
qua
rtile
30.3
36.6
38.8
Firs
t gen
erat
ion
colle
ge s
tatu
sFi
rst g
ener
atio
n50
.543
.043
.3N
ot f
irst
gen
erat
ion
49.5
57.0
56.7
Gen
der
Mal
e49
.049
.850
.1Fe
mal
e51
.050
.349
.9
Rac
e/et
hnic
ityW
hite
, non
-His
pani
c75
.973
.776
.5
Bla
ck, n
on-H
ispa
nic
8.5
9.7
7.3
His
pani
c11
.111
.711
.1
Asi
an/P
acif
ic I
slan
der
3.7
4.0
4.2
Am
eric
an I
ndia
n/A
lask
an N
ativ
e0.
70.
90.
8
3r)
Enr
olle
dco
ntin
uous
lyin
198
9-90
Enr
olle
dan
ytim
e in
acad
emic
year
1990
-91
Purs
uing
acad
emic
maj
or o
rta
king
cour
ses
tow
ard
bach
elor
'sor
bot
h
Enr
olle
dfo
r 12
or m
ore
cred
it ho
urs
Tak
ing
cour
ses
tow
ard
bach
elor
's
Purs
uing
acad
emic
maj
or a
ndta
king
cour
ses
tow
ard
bach
elor
's
100.
010
0.0
100.
010
0.0
100.
010
0.0
52.8
53.3
58.9
61.9
58.6
55.5
25.9
26.2
28.5
26.0
29.7
36.2
21.2
20.5
12.6
12.1
11.7
8.3
4.9
5.4
3.0
2.5
3.0
2.2
9.9
9.6
6.4
6.4
6.2
6.1
5.1
4.1
2.7
2.8
2.5
0.0
1.4
1.4
0.5
0.4
0.0
0.0
14.0
15.1
11.3
13.8
11.7
8.2
17.1
16.9
13.8
10.5
13.9
10.1
32.3
32.0
31.5
35.1
26.0
30.3
36.7
36.0
43.5
40.6
48.4
51.4
43.5
46.6
41.8
43.8
37.3
30.3
56.5
53.4
58.2
56.2
62.7
69.7
44.8
48.0
54.3
51.0
58.8
56.8
55.2
52.0
45.7
49.0
41.2
43.2
77.3
75.0
71.6
75.2
69.9
68.3
6.5
6.5
8.9
7.4
6.4
0.0
11.3
13.0
12.3
11.8
14.6
21.8
4.1
4.8
5.9
5.1
7.9
8.1
0.8
0.8
1.3
0.4
1.2
1.8
33

Tab
le 1
.-Pe
rcen
tage
dis
trib
utio
ns w
ithin
pot
entia
l tra
nsfe
r ca
tego
ries
of
1989
-90
begi
nnin
g po
stse
cond
ary
stud
ents
enr
olle
d at
pub
lic 2
-yea
rin
stitu
tions
acc
ordi
ng to
var
ious
stu
dent
and
inst
itutio
n ch
arac
teri
stic
s-C
ontin
ued
Cha
ract
eris
ticT
otal
Exp
ecte
dto
com
plet
eba
chel
or's
degr
eeor
hig
her
Enr
olle
din
an
acad
emic
prog
ram
Enr
olle
dco
ntin
uous
lyin
198
9-90
Enr
olle
dan
ytim
e in
acad
emic
year
1990
-91
Purs
uing
acad
emic
maj
or o
rta
king
cour
ses
tow
ard
bach
elor
'sor
bot
h
Enr
olle
dfo
r 12
or m
ore
cred
it ho
urs
Tak
ing
cour
ses
tow
ard
bach
elor
's
Purs
uing
acad
emic
maj
or a
ndta
king
cour
ses
tow
ard
bach
elor
's
Reg
ion
of in
stitu
tion
Nor
thea
st21
.221
.420
.718
.220
.319
.824
.515
.012
.3
New
Eng
land
4.8
3.7
4.3
3.3
3.6
2.4
5.1
2.4
1.6
Mid
Eas
t16
.417
.716
.414
.916
.717
.419
.412
.610
.7
Mid
wes
t21
.320
.019
.821
.821
.020
.520
.522
.114
.3
Gre
at L
akes
14.7
13.4
14.5
15.6
14.4
14.2
15.3
15.2
11.1
Plai
ns6.
76.
65.
36.
26.
56.
35.
26.
83.
2
Sout
h29
.629
.628
.630
.430
.225
.029
.625
.622
.6
Sout
heas
t21
.421
.121
.822
.620
.819
.520
.019
.016
.1
Sout
hwes
t8.
28.
56.
97.
89.
45.
59.
66.
66.
6
Wes
t27
.929
.030
.929
.628
.534
.725
.437
.350
.8
Roc
ky M
ount
ains
3.0
2.3
2.9
3.3
3.1
3.4
2.5
2.6
3.2
Far
Wes
t24
.926
.728
.026
.325
.531
.322
.934
.847
.7
Self
-rat
ed a
cade
mic
abi
lity
Abo
ve a
vera
ge24
.428
.328
.728
.530
.229
.230
.228
.731
.9
Ave
rage
72.9
69.5
68.8
68.9
67.2
68.4
68.0
69.7
66.3
Bel
ow a
vera
ge2.
72.
22.
62.
62.
62.
31.
81.
61.
8
Self
-rat
ed m
athe
mat
ical
abi
lity
Abo
ve a
vera
ge22
.725
.925
.725
.924
.628
.628
.332
.026
.8
Ave
rage
60.0
54.3
54.6
56.0
58.5
49.9
55.8
47.1
50.3
Bel
ow a
vera
ge17
.319
.919
.718
.116
.921
.515
.920
.923
.0
Too
k re
med
ial m
ath
1989
-90
No
88.5
86.9
87.5
88.2
87.5
82.9
89.2
84.4
93.6
Yes
11.4
13.1
12.5
11.8
12.4
17.1
10.9
15.6
6.4
Del
ayed
enr
ollm
ent a
fter
hig
h sc
hool
No
56.0
64.5
66.4
66.5
66.0
72.7
74.2
71.7
70.0
Yes
44.0
35.5
33.6
33.5
34.0
27.3
25.8
28.3
30.0
3435
s;

Tab
le 1
.-Pe
rcen
tage
dis
trib
utio
ns w
ithin
pot
entia
l tra
nsfe
r ca
tego
ries
of
1989
-90
begi
nnin
g po
stse
cond
ary
stud
ents
enr
olle
d at
publ
ic 2
-yea
rin
stitu
tions
acc
ordi
ng to
var
ious
stu
dent
and
inst
itutio
n ch
arac
teri
stic
s-C
ontin
ued
Cha
ract
eris
tic
Purs
uing
acad
emic
Purs
uing
maj
or o
rac
adem
icE
xpec
ted
Enr
olle
dta
king
maj
or a
ndto
com
plet
eE
nrol
led
anyt
ime
inco
urse
sE
nrol
led
Tak
ing
taki
ngba
chel
or's
in a
nE
nrol
led
acad
emic
tow
ard
' for
12
cour
ses
cour
ses
degr
eeac
adem
icco
ntin
uous
lyye
arba
chel
or's
or m
ore
tow
ard
tow
ard
Tot
alor
hig
her
prog
ram
in 1
989-
9019
90-9
1or
bot
hcr
edit
hour
sba
chel
or's
bach
elor
's
Atte
ndan
ce in
tens
ityFu
ll tim
e48
.554
.954
.361
.656
.156
.498
.357
.458
.9L
ess
than
ful
l tim
e51
.545
.145
.738
.443
.943
.61.
742
.641
.1
Cam
pus
part
icip
atio
n in
dex
2 or
bel
ow37
.030
.230
.730
.529
.724
.023
.326
.922
.43-
433
.835
.536
.635
.638
.038
.739
.839
.349
.35-
619
.323
.322
.221
.121
.928
.022
.424
.319
.27
or a
bove
9.8
11.0
10.4
12.8
10.5
9.3
14.5
9.5
9.1
Sing
le p
aren
tN
o93
.395
.894
.695
.595
.297
.595
.595
.396
.6Y
es6.
74.
25.
44.
54.
82.
54.
54.
73.
4
Dep
ende
ncy
stat
usD
epen
dent
65.4
74.6
76.1
71.8
73.8
81.1
83.3
84.6
87.5
Inde
pend
ent
34.6
25.4
23.9
28.1
26.2
18.9
16.7
15.4
12.5
Hou
rs w
orke
d pe
r w
eek
Few
er th
an 3
567
.772
.275
.475
.273
.879
.186
.979
.079
.535
or
mor
e32
.327
.824
.624
.826
.120
.913
.121
.020
.5
Rec
eive
d fi
nanc
ial a
idN
o72
.273
.075
.268
.470
.674
.660
.777
.781
.0Y
es27
.826
.924
.831
.629
.425
.439
.322
.419
.0
3

Tab
le 1
.-Pe
rcen
tage
dis
trib
utio
ns w
ithin
pot
entia
l tra
nsfe
r ca
tego
ries
of
1989
-90
begi
nnin
g po
stse
cond
ary
stud
ents
enr
olle
d at
pub
lic 2
-yea
rin
stitu
tions
acc
ordi
ng to
var
ious
stu
dent
and
inst
itutio
n ch
arac
teri
stic
s-C
ontin
ued
Cha
ract
eris
tic
Exp
ecte
dto
com
plet
eE
nrol
led
bach
elor
'sin
an
degr
eeac
adem
icT
otal
or h
ighe
rpr
ogra
m
Rat
io o
f ai
d to
pri
ce*
No
aid
71.9
73.0
75.1
1-33
per
cent
15.3
13.7
13.8
34-6
7 pe
rcen
t6.
36.
95.
968
-100
per
cent
6.5
6.4
5.2
Enr
olle
d
Purs
uing
acad
emic
maj
or o
rta
king
Purs
uing
acad
emic
maj
or a
ndan
ytim
e in
cour
ses
Enr
olle
dT
akin
gta
king
Enr
olle
dac
adem
icto
war
dfo
r 12
cour
ses
cour
ses
cont
inuo
usly
year
bach
elor
'sor
mor
eto
war
dto
war
din
198
9-90
1990
-91
or b
oth
cred
it ho
urs
bach
elor
'sba
chel
or's
68.2
70.6
75.0
60.8
77.9
81.8
17.0
16.4
12.4
20.8
11.6
11.4
7.6
6.5
7.2
8.6
8.3
3.9
7.2
6.6
5.4
9.8
2.3
3.0
* Pr
ice
adju
sted
for
atte
ndan
ce in
tens
ity. S
ee th
e gl
ossa
ry (
appe
ndix
A)
for
deta
ils.
NO
TE
: Unl
ess
othe
rwis
e sp
ecif
ied,
var
iabl
es a
re a
s of
198
9-90
(ba
se y
ear
inte
rvie
w, f
irst
term
of
post
seco
ndar
y en
rollm
ent)
. Per
cent
age
dist
ribu
tions
may
not
sum
to10
0.0
due
to r
ound
ing.
SOU
RC
E: U
.S. D
epar
tmen
t of
Edu
catio
n, N
atio
nal C
ente
r fo
r E
duca
tion
Stat
istic
s, 1
989-
90 B
egin
ning
Pos
tsec
onda
ry S
tude
nts
Lon
gitu
dina
l Stu
dy (
BPS
:199
0/19
94),
Dat
a A
naly
sis
Syst
em.

COMMUNITY COLLEGE TRANSFER RATES TO FOUR-YEAR INSTITUTIONS
hours a week) was also higher the more inclusive the definition of potential transfer. Also, the percentage ofpotential transfers in the West, particularly the Far West, was higher the more restrictive the definition.
Students were asked to compare their ability in several areas to the average person of their age. Thepercentage of potential transfer students who rate themselves as having "above average" academic abilityincreased as the definitions became more restrictive, comprising 24 percent of all students but 32 percent ofstudents working toward a bachelor's degree in an academic major. This pattern was also found for self-ratings of mathematical ability compared to others. Students meeting increasingly restrictive definitions ofpotential transfer were also less likely to score low (2 or less out of 9) on an index of participation in studentlife (including participation in school-sponsored extracurricular activities, interaction with other studentsand faculty, and the like).
In sum, this table suggests that restricting the pool of potential transfer students not only changes thecomposition of the student pool, but alters it systematically toward greater proportions of higher SES stu-dents and more traditional students (younger, dependent students who do not work full time).
What percentage of students with different characteristics meet each potential transferdefinition?
The previous section examined how the composition of the population of potential transfer studentschanged as the definitions became more restrictive. This section takes another approach to exploring therelationship between potential transfer and other student characteristics, comparing the likelihood of meet-ing each definition of transfer across various subgroups of students (table 2). In general, students age 22 orolder were less likely than younger students to meet the various definitions of potential transfer. For exam-ple, about 50 percent of students age 22 or older expected to earn a bachelor's degree or higher, compared to75 percent of students ages 19 to 21 and 81 percent of students age 18 or younger. Likewise, 11 percent ofstudents age 22 or older indicated that they were taking courses leading toward a bachelor's degree in 1989-90, compared to 26 percent of students ages 19 through 21 and 33 percent of students age 18 or below.
Generally, the higher the SES, the higher the percentage of students who met the definitions of potentialtransfer. For instance, 16 percent of students from the lowest SES quartile indicated that they were takingcourses leading toward a bachelor's degree, compared to 40 percent of students from the highest SES quar-tile. First-generation students, defined as those who reported that their parents had no more than a highschool education, were less likely to meet each definition of potential transfer than those whowere not first-generation students. For example, 62 percent of first-generation students expected to complete a bachelor'sdegree or higher, compared to 81 percent of those who were not first-generation students.
While the bachelor's degree expectations of men and women were about the same, men were less likelyto have been enrolled continuously during 1989-90, but more likely to indicate that they were working
16 40

Tab
le 2
.-A
mon
g 19
89-9
0 be
ginn
ing
post
seco
ndar
y st
uden
ts e
nrol
led
at p
ublic
2-y
ear
inst
itutio
ns, p
erce
ntag
e of
initi
al c
ohor
t mee
ting
each
def
initi
onof
pot
entia
l tra
nsfe
r, b
y va
riou
s st
uden
t and
inst
itutio
n ch
arac
teri
stic
s
Cha
ract
eris
tic
Exp
ecte
dto
com
plet
eba
chel
or's
degr
eeor
hig
her
Enr
olle
din
an
acad
emic
prog
ram
Enr
olle
dco
ntin
uous
lyin
198
9-90
Enr
olle
dan
ytim
e in
acad
emic
year
1990
-91
Purs
uing
acad
emic
maj
or o
rta
king
cour
ses
tow
ard
bach
elor
'sor
bot
h
Enr
olle
dfo
r 12
or m
ore
cred
it ho
urs
Tak
ing
cour
ses
tow
ard
bach
elor
's
Purs
uing
acad
emic
maj
or a
ndta
king
cour
ses
tow
ard
bach
elor
's
Tot
al71
.067
.763
.262
.543
.236
.125
.510
.6
Age
as
of 1
2/31
/89
18 o
r be
low
80.7
76.8
72.9
75.8
55.1
50.7
33.4
12.8
19 th
roug
h 21
74.9
71.5
61.1
56.6
43.9
31.9
26.1
13.7
22 o
r ab
ove
50.5
46.8
48.9
47.2
21.1
16.5
11.3
3.4
22 th
roug
h 24
63.1
54.1
48.6
56.9
23.9
15.9
13.0
4.4
25 th
roug
h 34
48.2
47.0
52.5
49.7
22.7
19.2
13.1
5.3
35 th
roug
h 44
51.7
45.6
50.9
41.3
20.5
16.3
10.8
0.0
45 o
r ab
ove
--
--
--
--
Soci
oeco
nom
ic s
tatu
sL
owes
t qua
rtile
53.2
45.3
51.1
50.8
28.1
27.9
16.2
5.0
Low
er m
iddl
e64
.261
.151
.850
.829
.218
.217
.35.
3
Upp
er m
iddl
e73
.668
.666
.166
.144
.341
.322
.110
.5
Hig
hest
qua
rtile
83.3
83.1
74.6
74.1
59.4
48.0
39.7
17.2
Firs
t-ge
nera
tion
colle
ge s
tatu
sFi
rst g
ener
atio
n62
.060
.756
.559
.237
.733
.019
.66.
7
Not
fir
st g
ener
atio
n81
.077
.771
.269
.051
.342
.532
.615
.1
Gen
der
Mal
e71
.968
.657
.961
.246
.737
.830
.812
.0
Fem
ale
70.1
66.9
68.3
63.7
39.6
34.5
20.5
9.2
Rac
e/et
hnic
ityW
hite
, non
-His
pani
c69
.068
.263
.961
.740
.536
.023
.59.
5
Bla
ck, n
on-H
ispa
nic
81.5
62.0
48.2
47.8
45.4
31.1
19.3
0.0
His
pani
c75
.064
.765
.672
.948
.737
.032
.721
.1
Asi
an/P
acif
ic I
slan
der
--
--
-A
mer
ican
Ind
ian/
Ala
skan
Nat
ive
--
--
--
-- 42
41

Tab
le 2
.-A
mon
g 19
89-9
0 be
ginn
ing
post
seco
ndar
y st
uden
ts e
nrol
led
at p
ublic
2-y
ear
inst
itutio
ns, p
erce
ntag
e of
initi
al c
ohor
t mee
ting
each
def
initi
onof
pot
entia
l tra
nsfe
r, b
y va
riou
s st
uden
t and
inst
itutio
n ch
arac
teri
stic
s-C
ontin
ued
Cha
ract
eris
tic
Purs
uing
acad
emic
Purs
uing
maj
or o
rac
adem
icE
xpec
ted
Enr
olle
dta
king
maj
or a
ndto
com
plet
eE
nrol
led
anyt
ime
inco
urse
sE
nrol
led
Tak
ing
taki
ngba
chel
or's
in a
nE
nrol
led
acad
emic
tow
ard
for
12co
urse
sco
urse
sde
gree
acad
emic
cont
inuo
usly
year
bach
elor
'sor
mor
eto
war
dto
war
dor
hig
her
prog
ram
in 1
989-
9019
90-9
1or
bot
hcr
edit
hour
sba
chel
or's
bach
elor
's
Reg
ion
of in
stitu
tion
Nor
thea
st68
.664
.554
.360
.138
.040
.918
.35.
8N
ew E
ngla
nd53
.8-
47.7
37.2
Mid
Eas
t72
.864
.957
.263
.743
.042
.019
.66.
5M
idw
est
67.4
63.6
64.9
61.5
41.4
34.2
26.5
7.1
Gre
at L
akes
66.8
65.7
64.6
61.6
41.6
36.9
26.1
8.0
Plai
ns68
.758
.565
.661
.441
.028
.327
.65.
0So
uth
70.8
68.0
65.4
63.6
38.4
37.3
22.2
8.6
Sout
heas
t69
.571
.566
.060
.741
.935
.922
.58.
5So
uthw
est
74.4
58.8
63.6
71.3
29.5
40.8
21.5
8.7
00W
est
76.4
73.5
66.5
63.9
53.9
32.6
33.6
19.4
Roc
ky M
ount
ains
--
Far
Wes
t78
.174
.565
.763
.954
.632
.835
.120
.4
Self
-rat
ed a
cade
mic
abi
lity
Abo
ve a
vera
ge78
.774
.571
.877
.550
.844
.129
.213
.7
Ave
rage
69.2
65.2
60.0
57.8
40.5
34.1
24.1
9.7
Bel
ow a
vera
ge-
-Se
lf-r
ated
mat
hem
atic
al a
bilit
yA
bove
ave
rage
77.6
72.7
70.7
67.8
52.8
44.3
34.9
12.3
Ave
rage
66.1
62.6
59.6
61.1
35.9
34.1
20.0
8.9
Bel
ow a
vera
ge80
.377
.465
.461
.154
.533
.030
.414
.4
Too
k re
med
ial m
ath
in 1
989-
90N
o70
.166
.863
.461
.340
.536
.724
.011
.0Y
es79
.772
.664
.967
.360
.033
.833
.65.
4
Del
ayed
enr
ollm
ent a
fter
hig
h sc
hool
No
80.4
76.9
72.7
73.6
53.4
47.5
32.2
12.7
Yes
58.6
54.9
50.1
48.3
28.6
21.4
16.7
7.7
43

Tab
le 2
.-A
mon
g 19
89-9
0 be
ginn
ing
post
seco
ndar
y st
uden
ts e
nrol
led
at p
ublic
2-y
ear
inst
itutio
ns, p
erce
ntag
e of
initi
al c
ohor
t mee
ting
each
def
initi
on
of p
oten
tial t
rans
fer,
by
vari
ous
stud
ent a
nd in
stitu
tion
char
acte
rist
ics-
Con
tinue
d
Cha
ract
eris
tic
Purs
uing
acad
emic
Purs
uing
maj
or o
rac
adem
ic
Exp
ecte
dE
nrol
led
taki
ngm
ajor
and
to c
ompl
ete
Enr
olle
dan
ytim
e in
cour
ses
Enr
olle
dba
chel
or's
in a
nE
nrol
led
acad
emic
tow
ard
cour
ses
taki
ngco
urse
s
degr
eeac
adem
icco
ntin
uous
lyye
arba
chel
or's
for
12or
mor
eto
war
dto
war
d
or h
ighe
rpr
ogra
min
198
9-90
1990
-91
or b
oth
cred
it ho
urs
bach
elor
'sba
chel
or's
Atte
ndan
ce in
tens
ityFu
ll tim
e78
.672
.878
.872
.347
.774
.328
.712
.3
Les
s th
an f
ull t
ime
63.7
62.6
48.3
53.3
37.5
1.2
21.0
8.7
Cam
pus
part
icip
atio
n in
dex
2 or
bel
ow59
.461
.052
.551
.931
.123
.319
.07.
0
3-4
75.4
69.8
66.3
72.6
46.5
42.4
28.9
14.2
5-6
82.1
75.8
68.8
73.3
60.4
42.4
31.8
10.0
7 or
abo
ve79
.071
.380
.768
.940
.454
.224
.49.
4
Sing
le p
aren
tN
o73
.068
.564
.563
.644
.737
.226
.011
.0
Yes
42.6
58.4
43.9
44.9
17.9
24.4
17.7
6.0
Dep
ende
ncy
stat
usD
epen
dent
80.5
76.0
68.7
70.5
51.8
45.6
32.6
13.7
Inde
pend
ent
52.8
50.3
52.4
47.3
25.2
17.7
11.6
4.1
Hou
rs w
orke
d pe
r w
eek
Few
er th
an 3
575
.772
.470
.068
.249
.146
.129
.412
.1
35 o
r m
ore
61.3
56.5
48.8
50.5
29.6
14.9
17.0
7.1
Rec
eive
d fi
nanc
ial a
idN
o72
.070
.760
.061
.145
.230
.327
.312
.1
Yes
68.6
60.2
71.5
66.1
38.1
51.1
20.6
7.0
46
45

O 47
Tab
le 2
.-A
mon
g 19
89-9
0 be
ginn
ing
post
seco
ndar
y st
uden
ts e
nrol
led
at p
ublic
2-ye
ar in
stitu
tions
, per
cent
age
of in
itial
coh
ort m
eetin
g ea
ch d
efin
ition
of p
oten
tial t
rans
fer,
by
vari
ous
stud
ent a
nd in
stitu
tion
char
acte
rist
ics-
Con
tinue
d
Cha
ract
eris
tic
Purs
uing
acad
emic
Purs
uing
maj
or o
rac
adem
icE
xpec
ted
Enr
olle
dta
king
maj
or a
ndto
com
plet
eE
nrol
led
anyt
ime
inco
urse
sE
nrol
led
Tak
ing
taki
ngba
chel
or's
in a
nE
nrol
led
acad
emic
tow
ard
for
12co
urse
sco
urse
sde
gree
acad
emic
cont
inuo
usly
year
bach
elor
'sor
mor
eto
war
dto
war
dor
hig
her
prog
ram
in 1
989-
9019
90-9
1or
bot
hcr
edit
hour
sba
chel
or's
bach
elor
's
Rat
io o
f ai
d to
pri
ce*
No
aid
72.7
71.0
59.9
61.6
45.7
30.8
27.7
12.0
1-33
per
cent
62.7
58.6
68.1
67.4
33.5
49.1
19.3
7.4
34-6
7 pe
rcen
t79
.068
.776
.964
.552
.050
.235
.56.
868
-100
per
cent
72.1
56.9
74.3
63.5
34.0
57.0
9.1
4.5
- T
oo f
ew c
ases
for
a r
elia
ble
estim
ate.
*Pri
ce a
djus
ted
for
atte
ndan
ce in
tens
ity. S
ee th
e gl
ossa
ry (
appe
ndix
A)
for
deta
ils.
NO
TE
: Unl
ess
othe
rwis
e sp
ecif
ied,
var
iabl
es a
re a
s of
198
9-90
(ba
seye
ar in
terv
iew
, fir
st te
rm o
f po
stse
cond
ary
enro
llmen
t).
SOU
RC
E: U
.S. D
epar
tmen
t of
Edu
catio
n, N
atio
nal C
ente
r fo
r E
duca
tion
Stat
istic
s, 1
989-
90 B
egin
ning
Post
seco
ndar
y St
uden
ts L
ongi
tudi
nal S
tudy
(B
PS:1
990/
1994
),D
ata
Ana
lysi
s Sy
stem
.
44
ANALYSIS AND RESULTS
toward a bachelor's degree. Men and women were equally likely to meet the most restrictive definition of
potential transfer.
Hispanic students were about as likely as other students to indicate that they expected to earn a bach-elor's degree or higher, but were more likely than black students to have enrolled anytime during aca-demic year 1990-91 (figure 2). White students and Hispanic students were more likely than black stu-dents to meet the most restrictive definition of transfer: having an academic major and taking coursestoward a bachelor's degree. Students attending community colleges in the West were more likely than
students attending schools in other regions of the country to have academic majors and be taking courses
leading toward a bachelor's degree (the most restrictive definition of potential transfers), but were no
more likely to indicate that they expected to earn a bachelor's degree or higher (the least restrictive
definition).
While students who rated themselves above average in mathematical ability and those who rated them-
selves below average were both more likely to indicate that they expected to earn a bachelor's degree or
higher than students who rated themselves average, there were few differences across self-reported ability
levels in the other definitions of potential transfer. Students who reported taking at least 1 credit hour of
remedial mathematics instruction during 1989-90 were generally about as likely to meeteach of the poten-
tial transfer definitions as students who did not take any remedial mathematics instruction. In general, stu-
dents who were enrolled full time were more likely to meet the various potential transfer definitions than
those who were enrolled less than full time.
In general, students who reported working 35 or more hours per week were less likely than students
working fewer hours to meet the definitions of potential transfer. For example, 49 percent of students work-
ing 35 or more hours per week were enrolled continuously in 1989-90, compared to70 percent of those who
worked fewer than 35 hours per week. Students who did not receive financial aid were about as likely as
students who did receive financial aid to expect to earn a bachelor's degree or higher and to be enrolled
anytime during academic year 1990-91. Students who did not receive financial aid, however, were less
likely to be enrolled continuously in 1989-90 and less likely to be enrolled for 12 or more credit hours in the
1989-90 sampled term than were students who received financial aid.
Transfer rates for each definition of potential transfer
Estimated transfer rates for the nine definitions of potential transfer among 1989-90 beginning commu-
nity college students are shown in table 3. Table 3 also shows the transfer rate of community college students
that did not meet a given definition of potential transfer. Rates of transfer to 4-year institutions are shown
both for first transferthe first enrollment following termination of enrollment at a community college
and for whether the students had ever enrolled at a 4-year institution by 1994. The results show that, in
general, the transfer rate increased across increasingly restrictive definitions. The lowest rate of ever enroll-
214 9

COMMUNITY COLLEGE TRANSFER RATES TO FOUR-YEAR INSTITUTIONS
Figure 2.Among 1989-90 beginning postsecondary students enrolled at public 2-year institutions, percentage ofinitial cohort meeting each definition of potential transfer, by race/ethnicity
Percent100
90
80
70
60
50
40
30
20
10
0
68
White, non-Hispanic Black, non-Hispanic Hispanic
65 64
48
6562
48
73
49
36 37
24
33
Expected to Enrolled in Enrolled Enrolled Pursuing Enrolled for Takingcomplete an academic continuously anytime in academic 12 or more coursesbachelor's program in 1989-90 academic major or credit hours towarddegree or
higheryear
1990-91taking courses
towardbachelor's
or both
bachelor's
21
10
0
Pursuingacademicmajor and
taking coursestoward
bachelor's
NOTE: Unless otherwise specified, variables are as of 1989-90 (base year interview, first term of postsecondary enrollment).SOURCE: U.S. Department of Education, National Center for Education Statistics, 1989-90 Beginning Postsecondary StudentsLongitudinal Study (BPS:1990/1994), Data Analysis System.
ing in a 4-year institution, 25 percent, was found for all beginning community college students, compared to52 percent among students meeting the most restrictive definition. The proportions of students first transfer-ring to 4-year institutions were similar for each definition, ranging from 22 to 51 percent's For eachdefinition, the transfer rate for students meeting the definition was higher than the transfer rate for studentsnot meeting the definition.
°The estimates of the proportions ever attending 4-year institutions appear higher by a few percentage points for each category,due to the fact that the numerator is more inclusive while the denominator stays the same. The differences in rates between thetwo estimates are not statistically significant. Results below focus on the rate ofever enrolling in a 4-year institution.
22 50

ANALYSIS AND RESULTS
Table 3.-Among 1989-90 beginning postsecondary students enrolled at public 2-year institutions, percentage whotransferred to 4-year institutions by spring 1994, for various definitions of potential transfer
Potential transfer definitionFirst transferred
to 4-year'Ever transferred
to 4-year2
All students 22.4 25.4
Expected to complete bachelor's degree or higher 31.8 35.7
Students not meeting this definition 3.4 4.7
Enrolled in an academic program 32.9 35.7
Students not meeting this definition 8.6 9.6
Enrolled continuously in 1989-90 33.3 36.6
Students not meeting this definition 9.6 11.6
Enrolled anytime in academic year 1990-91 33.2 37.7
Students not meeting this definition 4.2 4.9
Pursuing academic major or taking courses toward bachelor's or both 39.9 43.0
Students not meeting this definition 13.3 15.0
Enrolled for 12 or more credit hours 36.6 39.6
Students not meeting this definition 15.2 18.2
Taking courses toward bachelor's 38.7 44.8
Students not meeting this definition 17.9 19.9
Pursuing academic major and taking courses toward bachelor's 50.7 52.3
Students not meeting this definition 21.8 24.1
'Includes only students whose first transfer from a community college was to a4-year institution.
'Includes students who first transferred to another less-than-4-year institution before transferring to a 4-year institution.
NOTE: Unless otherwise specified, variables are as of 1989-90 (base year interview, first term of postsecondary enrollment).
SOURCE: U.S. Department of Education, National Center for Education Statistics, 1989-90 Beginning Postsecondary Students
Longitudinal Study (BPS:1990/1994), Data Analysis System.
Figure 3 displays two sets of estimates. For each potential transfer definition, the figure shows the per-
centage of the initial cohort meeting that definition and the rate of transfer to 4-year institutions among
students meeting that definition. For example, 63 percent of the initial cohort enrolled continuously during
their first year of postsecondary education in 1989-90, and of these students, 37 percent transferred. Figure
4 presents another statistic relevant to the evaluation of these definitions: the percentage of actual transfer
students meeting each definition. For example, among 1989-90 community college students who had trans-
ferred to a 4-year institution by spring 1994,44 percent indicated that the courses they were taking were
leading toward a bachelor's degree.
When considered together, two facts are evident in figures 3 and 4. First, as suggested earlier, the transfer
rate generally increased with the increasing restriction of the group of potential transfer students (figure 3).
In fact, the transfer rate for the most restrictive definition was at least twice the rate for all students: while
roughly one-quarter of all students transferred, about one-half of those pursuing an academic major and
23

COMMUNITY COLLEGE TRANSFER RATES TO FOUR-YEAR INSTITUTIONS
Figure 3. Among 1989-90 beginning postsecondary students enrolled at public 2-year institutions, percentage ofinitial cohort meeting each definition of potential transfer, and of those students meeting the definition,the percentage who transferred to 4-year institutions by spring 1994
Percent100
100
90
80
70
60
50
40
30
20
10
0
alPercentage of initial student cohort meeting definition [1 Of those meeting definition, percentage who transferred
25
7168
63
37
63
43 4338
All Expected to Enrolled in Enrolledstudents complete an academic continuously
bachelor's program in 1989-90degree or
higher
Enrolled Pursuinganytime in academicacademic major or
year taking courses1990-91 toward
bachelor'sor both
40
45
11
52
Enrolled for Taking Pursuing12 or more courses academic
credit hours toward major andbachelor's taking courses
towardbachelor's
NOTE: Unless otherwise specified, variables are as of 1989-90 (base year interview, first term of postsecondary enrollment).SOURCE: U.S. Department of Education, National Center for Education Statistics, 1989-90 Beginning Postsecondary StudentsLongitudinal Study (BPS:1990/1994), Data Analysis System.
working toward a bachelor's degree did so. Second, the percentage of actual transfer students meeting thecriteria for inclusion in the denominator also declined significantly with the increasing restriction of thedefinition of potential transfer (figure 4). In other words, attempts to include only those students most likelyto transfer actually exclude a sizable proportion of students who transfer anyway, without meeting thosecriteria. For example, four out of five actual transfer students did not meet the most restrictive definitionconsidered. Accordingly, as shown in table 3, while the transfer rate of students not meeting the least restric-tive definitionexpecting to complete a bachelor's degree or higherwas relatively small (5 percent), thetransfer rate of students not meeting the more restrictive definitions was relatively high (e.g., 20 percentamong those not taking courses leading toward the bachelor's degree).
24 52

ANALYSIS AND RESULTS
Figure 4.Among 1989-90 beginning postsecondary students enrolled at public 2-year institutions whotransferred to 4-year institutions by spring 1994, the percentage who met the various definitions of
potential transfer
Percent
10095 93
90 89
84
80
7069
60 55
5044
40
30
21
20
10
0Expected to Enrolled in Enrolled Enrolled Pursuing Enrolled for Taking Pursuing
complete an academic continuously anytime in academic 12 or more courses academic
bachelor's program in 1989-90 academic major or credit hours toward major and
degree or year taking courses bachelor's taking courses
higher 1990-91 toward toward
bachelor's bachelor's
or both
NOTE: Unless otherwise specified, variables are as of 1989-90 (base year interview, first term of postsecondary enrollment).
SOURCE: U.S. Department of Education, National Center for Education Statistics, 1989-90 Beginning Postsecondary Students
Longitudinal Study (BPS:1990/1994), Data Analysis System.
Figures 5 through 8 present the percentage of 1989-90 community college students who ever transferred
to a 4-year institution by spring 1994 for each potential transfer definition, by selected student background
characteristics.'6 For example, figure 5 shows that 39 percent of all students 18 years old or younger ever
transferred to a 4-year institution, compared to 22 percent of students ages 19 to 21, and 8 percent of stu-
dents age 22 or older.
'Supporting data for these figures are shown in appendix C, table C5. Analysis ofdifferences in transfer rates by major field
of study within each definition was also conducted; however, due to small cell sizes, few conclusions could be drawn.
25 53

COMMUNITY COLLEGE TRANSFER RATES TO FOUR-YEAR INSTITUTIONS
Figure 5.Among 1989-90 beginning postsecondary students enrolled at public 2-year institutions, percentagewho transferred to 4-year institutions by spring 1994, by age and for various definitions of potentialtransfer
Percent80
70
60
50 -r
-
-18 or below
47 46
40 39
30 28 29
2220
16 16
10 -
0All Expected to Enrolled in
students complete an academicbachelor'sdegree or
higher
program
II 19 through 21 22 or above
50
29
13
49
Enrolled Enrolledcontinuously anytime inin 1989-90 academic
year1990-91
5249
37
30
23
14
Pursuing Enrolled foracademic 12 or moremajor or credit hours
taking coursestoward
bachelor'sor both
56
48
Taking Pursuingcourses academictoward major and
bachelor's taking coursestoward
bachelor's
NOTE: Unless otherwise specified, variables are as of 1989-90 (base year interview, first term of postsecondary enrollment).Categories not shown are based on too few cases for a reliable estimate.
SOURCE: U.S. Department of Education, National Center for Education Statistics, 1989-90 Beginning Postsecondary StudentsLongitudinal Study (BPS:1990/1994), Data Analysis System.
These figures are useful because they reveal whether any differences in transfer rates across studentgroups remain when more restrictive definitions of potential transfer are applied to the sample. However,this approach to holding the definition of potential transfers constant while examining variations acrossstudent groups is limited by sample size. The number of cases in any given cell (e.g., students 22 years oldor older who are taking courses toward a bachelor's degree) is often too small to produce an efficient esti-mate. As a result, some of the apparent differences across groups are not statistically significant. Still, somepatterns are suggested.
For example, in general, the older the age group, the lower the percentage of students who transferred,regardless of the definition of potential transfer used (figure 5). Also, regardless of the potential transfer
26 54

ANALYSIS AND RESULTS
definition used, higher SES was generally associated with a higher transfer rate (figure 6). For some poten-
tial transfer definitions, the transfer rate for first-generation students was similar to the rate for those whose
parents attended a postsecondary institution, while the transfer rate for first-generation students was lower
for other definitions (figure 7). Overall, first-generation students were less likely to transfer than those who
were not; the same is true among students enrolled continuously, those enrolled anytime during 1990-91,
and those enrolled for 12 or more credit hours. However, for the other definitions of potential transfer, the
transfer rate for first-generation students and those whose parents attended a postsecondary institution was
about the same. Finally, both male and female transfer rates increased with increasingly restrictive defini-
tions of potential transfer (figure 8).
Figure 6.Among 1989-90 beginning postsecondary students enrolled at public 2-year institutions, percentagewho transferred to 4-year institutions by spring 1994, by socioeconomic status and for various
definitions of potential transfer
Percent80
70
60
50
40
30
20
10
0
Lowest quartile MI Lower middle Upper middle 0 Highest quartile
41
4946
4851
53 53
All Expected tostudents complete
bachelor'sdegree or
higher
55
35
71
Enrolled in Enrolled Enrolled Pursuing Enrolled for Taking Pursuing
an academic continuously anytime in academic 12 or more courses academic
program in 1989-90 academic major or credit hours toward major and
year1990-91
taking coursestoward
bachelor'sor both
bachelor's taking coursestoward
bachelor's
NOTE: Unless otherwise specified, variables are as of 1989-90 (base year interview, first term of postsecondary enrollment).
Categories not shown are based on too few cases for a reliable estimate.
SOURCE: U.S. Department of Education, National Center for Education Statistics, 1989-90 Beginning Postsecondary Students
Longitudinal Study (BPS:1990/1994), Data Analysis System.
27 J

COMMUNITY COLLEGE TRANSFER RATES TO FOUR-YEAR INSTITUTIONS
Table C5 in appendix C also shows transfer rates by racial/ethnic subgroups and by region for studentsmeeting each potential transfer definition. However, for several of the potential transfer definitions, therewere not enough students in most racial/ethnic subgroups to estimate transfer rates, so comparing racial/ethnic patterns of transfer across definitions is not possible. In addition, it appears that generally acrossthe set of potential transfer definitions, students in the Northeast had lower transfer rates than those in theother regions.
Figure 7.Among 1989-90 beginning postsecondary students enrolled at public 2-year institutions, percentagewho transferred to 4-year institutions by spring 1994, by first-generation college status and for variousdefinitions of potential transfer
Percent80
70
60
50
40
30
20
10
0
35
First generation I. Not first generation
41
32
39
33
44
29
47 46
42
4947
44
54
All Expected to Enrolled in Enrolled Enrolled Pursuingstudents complete an academic continuously anytime in academic
bachelor's program in 1989-90 academic major ordegree or year taking courses
higher 1990-91 towardbachelor's
or both
Enrolled for12 or more
credit hours
Taking Pursuingcourses academictoward major and
bachelor's taking coursestoward
bachelor's
NOTE: Unless otherwise specified, variables are as of 1989-90 (base year interview, first term of postsecondary enrollment).Categories not shown are based on too few cases for a reliable estimate.
SOURCE: U.S. Department of Education, National Center for Education Statistics, 1989-90 Beginning Postsecondary StudentsLongitudinal Study (BPS:1990/1994), Data Analysis System.
28 56

ANALYSIS AND RESULTS
Figure 8.Among 1989-90 beginning postsecondary students enrolled at public 2-year institutions, percentagewho transferred to 4-year institutions by spring 1994, by gender and for various definitions ofpotential transfer
Percent80
111 Male II Female70
60
50
40 36 35 35 3638
35
39
30 26 25
20
10
0All Expected to Enrolled in
students complete an academicbachelor's programdegree or
higher
47
42
37
Enrolled Enrolled Pursuing Enrolled for
continuously anytime in academic 12 or more
in 1989-90 academic major or credit hoursyear taking courses
1990-91 towardbachelor's
or both
50
41
Takingcoursestoward
bachelor's
50
Pursuingacademic
major andtaking courses
towardbachelor's
NOTE: Unless otherwise specified, variables are as of 1989-90 (base year interview, first term of postsecondary enrollment).Categories not shown are based on too few cases for a reliable estimate.
SOURCE: U.S. Department of Education, National Center for Education Statistics, 1989-90 Beginning Postsecondary Students
Longitudinal Study (BPS:1990/1994), Data Analysis System.
29 57

DISCUSSION
This study uses BPS data to explore various definitions of potential transfer: the percentage of commu-nity college students meeting each definition; the composition of the groups of students so defined and the
variation among student subgroups in the proportion meeting each definition; and the actual transfer activityfor different groups meeting these definitions. These results can be compared to the literature regarding two
questions about community college students' transfer intentions and activities. First, what percentage ofstudents in community colleges have educational expectations that include a bachelor's degree? This ques-
tion is the basis for much of the debate surrounding the advantages and disadvantages of different ways of
defining the pool of potential transfer students. Second, what is the transfer rate for community collegestudents? The evidence from this report in response to these two questions is placed in the context of theliterature, although this contextual information is not intended to constitute a statistical comparison acrossstudies. The consequences for these questions of restricting the definition of potential transfer are discussed,
and the section concludes with a consideration of the practical matter of operationalization.
However, any comparisons between the estimates presented in this report and those from other studiesmust be considered in light of differences in how the overall population of community college students is
defined across studies. For example, BPS excluded students taking courses only for remedial or avocationalpurposes without receiving credit, while other estimates may include these students. As a result, the typical
amount of remediation for students in BPS may underestimate, or otherwise differ from, the amount of
remediation found among community college students in generala factor that might be associated withtransfer to a 4-year institution. Furthermore, this report focuses only on students enrolled in public 2-yearcolleges; including other less-than-4-year colleges, particularly less-than-2-year institutions, may lower theestimates. Finally, BPS data are restricted to first-time beginning postsecondary students; colleges conduct-ing their own studies of transfer may include entering students who are not first-time beginners as defined in
the BPS study.
Educational Expectations and Potential Transfer
About 7 out of 10 beginning community college students explicitly stated educationalexpectations that included a bachelor's degree or higher, a somewhat higher rate thanprevious estimates.
As noted previously, determining the percentage of students whose academic goals or expectations in-
clude a bachelor's degree has been difficult. Dougherty (1987, 1992) reviewed several studies and con-
31 53

COMMUNITY COLLEGE TRANSFER RATES TO FOUR-YEAR INSTITUTIONS
cluded that 30 to 40 percent of all community college entrants aspire to a baccalaureate degree. He alsonoted the lack of nationally representative estimates and that the often-cited estimate of 70 percent for full-time students from the American Council of Education's annual first-year student survey is not representa-tive of the full community college student population. In contrast, the BPS results reported here showed thatabout 71 percent of all first-time beginning community college students expect to earn a bachelor's degree.However, student aspirations could change appreciably from one cohort to the next, and estimates couldtherefore depend in part on when the survey was administered. Still, the overall estimate of 71 percent,which is based on a reasonably broad definition of "community college students," suggests that the aca-demic expectations of these students are generally quite high.
Using observed behaviors as indicators of transfer intent, anywhere from 11 to 68 percentof beginning community college students took such steps.
Regarding the validity of self-reported student aspirations, Dougherty (1992) asked "whether one shouldtake what students say as the only valid indication [of baccalaureate aspirations], even if those statementsare not reflected in baccalaureate-oriented behavior, or whether one should only class as baccalaureateaspirants those who take concrete steps in this direction?" (p. 189, fn. 1). This report has tried to address thisquestion partially by comparing different groups of potential transfer students, some defined by self-reportsof expectations and others by indicators of "concrete steps," such as enrolling continuously during the firstyear of postsecondary study. The selection of a specific behavior or combination of behaviors that mostaccurately indicates baccalaureate orientation, however, is not obvious. Furthermore, the proportion of stu-dents taking each concrete step varies widely: for the various behavioral indicators of potential transfer,between 11 and 68 percent of students met each definition.
With increasing restriction of the pool of potential transfer students, the group was moretraditional and less representative of all beginning community college students.
Restricting the population of potential transfer students based on various measures of intent could af-fect the representativeness of the pool compared to all community college students. Spicer and Armstrong(1996) examined the transfer rate in conjunction with the percentage of the initial cohort of students whomet the definition used in the denominator. In the two districts they studied, less than 40 percent of theinitial cohort met the Transfer Assembly definition of earning 12 credits within 4 years, while less than 4percent met the most restrictive definition of the denominator. In this report, the percentage of first-timestudents meeting the various definitions of potential transfer ranged from 11 to 71 percent, with the leastrestrictive definition (apart from looking at all students) being educational expectations including a bach-elor's degree or higher. As the share of the population of community college students became smaller, thecharacteristics of the group changed as well. For example, as the definition was restricted further, the groupof potential transfer students was more traditional (younger, more likely to be dependents, and less likelyto be working full time).
32 59

DISCUSSION
Transfer Estimates
As with estimates of educational expectations, the transfer rate estimates from BPS in this report can becompared to those based on other datasets. Various approaches to defining the transfer rate have produced awide range of transfer estimates. Cohen (1991) found that the estimated transfer rate ranged from 5 to 84percent across different studies, depending on how the denominator was defined. Transfer estimates tended
to be lowest when all community college students were used in the denominator and highest when the pool
of potential transfers was restricted to students with transfer intentions who had also earned associate's
degrees.
As noted above, the Transfer Assembly project tries to address the lack of a consistent definition of thetransfer rate by providing a common method of calculating it that is readily estimated using data typicallycollected by community colleges. As of 1997, over 400 community colleges, enrolling more than 50 percentof all first-time community college students, participated in the project (Cohen and Sanchez 1997). Theproject found that among the 1988 cohort of beginning community college students who earned a minimumof 12 credit units in 4 years, about 22 percent had taken one or more classes at an in-state, 4-year college oruniversity within 4 years of their initial enrollmenta rate that remained fairly stable across several subse-quent cohorts (Cohen and Sanchez 1997).
Several researchers have used longitudinal surveys of high school cohorts to estimate transfer rates. Leeand Frank (1990), for instance, using the HS&B study, reported that 24 percent of students who enteredcommunity college within 2 years of graduating from high school in 1980 transferred to 4-year institutionswithin 4 years of graduating from high school." Using the same dataset, Grubb (1991) found a transfer rateof 20 percent for all students, 25 percent for all students excluding those who completed fewer than 12credits, and 34 percent for students who aspired to a bachelor's or graduate degree during their last year inhigh school. While the samples used in these national studies are representative of the high school cohort in
a given year and capture all transfers (rather than only those to in-state, public institutions), they are not
representative of all beginning community college students. Using BPS, McCormick (1997) found that 22percent of all students who began at a community college in 1989-90 had transferred directly to a 4-year
institution by 1994. Among those students who indicated in 1989-90 that they were taking courses leading
toward a bachelor's degree, 39 percent had transferred to a 4-year institution by 1994.
Rather than using one or two approaches to calculating the transfer rate, some studies of specific commu-nity colleges or systems have presented several different estimates for the same cohort of students by vary-
ing how the denominator is defined. These studies, however, tend to use local or regional samples. Gutierrez-Marquez (1994), for example, examined transfer and other outcomes of over 10,000 beginning students who
"High school graduates who entered a community college in the second year after graduating high school would have 3 orfewer years to transfer and be counted as such (rather than the 4 years included in several other studies of transfer).
33 60

COMMUNITY COLLEGE TRANSFER RATES TO FOUR-YEAR INSTITUTIONS
entered the City Colleges of Chicago in fall 1986. Among all students, 13 percent had transferred to an in-state, 4-year institution by 1990.'8 The transfer rate ranged from 15.5 percent for students who were enrolled
in baccalaureate/transfer programs to 19 percent using the Transfer Assembly definition, which restricts the
denominator to students who completed at least 12 credit hours in 4 years.
Spicer and Armstrong (1996) applied 11 ways of defining the denominator to a cohort of beginningstudents enrolled in two California community college districts in fall 1988. The definitions ranged fromincluding all students new to the institution to the most restrictive definition, which included "all first-time
college students with a transfer goal who are transfer ready and who have completed at least fifty-six units"
(Spicer and Armstrong 1996, 50). Spicer and Armstrong also examined the transfer rates of students whomet the Transfer Assembly criteria, those who enrolled with a transfer goal, and students who were "transferready" (i.e., they had completed freshman English composition and mathematics courses transferable to a 4-
year institution). In the first district, the estimated transfer rate ranged from 3.6 percent using the leastrestrictive denominator definition to 40.4 percent using the most restrictive definition, while the rate for thesecond district ranged from 5.3 to 61.3 percent. The Transfer Assembly definition yielded a transfer rate ofaround 13 percent for both districts.
Approximating the pool of potential transfers as defined in previous studies, such as theTransfer Assembly model or high school cohorts, transfer rates in BPS appear to be a fewpercentage points higher than previous estimates.
In general, the transfer rates found in this study appear to be somewhat higher than those from previous
research. For example, while the overall transfer rate found in this study is comparable to the averageestimate of 22 percent found by the Transfer Assembly project (Cohen and Sanchez 1997), both the numera-
tor and denominator of the Transfer Assembly project are more restrictive: to be eligible, students must haveearned a minimum of 12 credit units in 4 years, and transfers were to in-state, 4-year colleges or universities
(Cohen and Sanchez 1997). Although BPS data do not facilitate use of this definition, this analysis approxi-
mated it by looking at those students who were enrolled for at least one term during the academic yearfollowing their initial enrollment (they had to have taken at least two classes in 2 years, compared to theTransfer Assembly criterion of about four classes in 4 years). This analysis found that 33 percent of students
meeting this criterion transferred to a 4-year college or university within 5 academic years of their initialenrollment, which is somewhat higher than the rate resulting from the Transfer Assembly project. Using aslightly different approximation of the Transfer Assembly definition, the rate of first transfer to public 4-year institutions among beginning postsecondary students who enrolled in two consecutive academic yearswas 29 percent, still a few percentage points higher than the Transfer Assembly estimates.
'8It is not clear whether restrictions in this study included only for-credit students, only public school transfers, or for those inbaccalaureate/transfer programs, only initial enrollment in such a program.
346 1

DISCUSSION
Comparisons with other studies for other definitions also suggest higher estimates. While the transferrate obtained from a representative sample of community college students might be different from estimatesbased on a high school cohort, the overall estimate of 25 percent in this report is similar to the transfer rate
of 20 to 24 percent for the high school class of 1980 (Grubb 1991; Lee and Frank 1990). However, theresulting transfer rate of 39 percent among students who were 18 years old or younger when they firstenrolled in a community college is appreciably higher than the estimates based on 1980 high school gradu-
ates. This report replicated the estimates of first transfer rates for all beginning postsecondary students (22
percent) and for those taking courses leading toward a bachelor's degree (39 percent) provided by McCormick
(1997) using the BPS dataset.
Finally, after reviewing numerous transfer studies, Dougherty (1994, 92) concluded that "the best esti-
mate of the transfer rate of community college entrants is around 15 to 20%." Although the overall transfer
rate estimate of 25 percent found in this report is somewhat higher than Dougherty's estimate, some of the
discrepancy may be attributed to differences in definitions of community college students or transfer.
As the pool of potential transfer students was restricted according to the various selectioncriteria, the transfer rate generally increased.
This report also suggests some more general consequences of various choices of operationalization. Forexample, the results show that transfer rates were generally higher among potential transfer students as thedefinition became more restrictive. One explanation for this result, as suggested above, is that many students
who report high educational expectations (the most inclusive of the restricted definitions of potential trans-fer) are not "committed enough" to the idea of earning a bachelor's degree to begin taking the necessarysteps to obtain one. Alternatively, students' ability to transfer easily may vary from state to state, depending
on articulation agreements that establish transfer credits or admissions policies facilitating transfer across
levels of postsecondary education. Another explanation is that the difference in transfer rates may be due in
part to a lack of resources among some students with bachelor's degree expectations, which may limit their
ability to take the necessary steps to achieve a degree. Indeed, this report found that the proportion of
students meeting each definition who had high SES increased as the definitions became more restrictive.
Furthermore, some of the behavioral measures of academic intentions yield transfer rates similar to that of
the self-reported measure, although they are somewhat more restrictive in terms of the percentage of the
initial cohort meeting the criteria. Finally, there is some evidence that differences in transfer rates acrossvarious subgroups may not be accounted for by the definitions of potential transfer considered.
As the definition of potential transfer became more restrictive, the percentage of actualtransfer students meeting the selection criteria tended to decrease.
To what extent do actual transfer students meet the criteria used to restrict the population to potential
transfer students? Spicer and Armstrong (1996) investigated the percentage of transfer students captured by
35 62

COMMUNITY COLLEGE TRANSFER RATES TO FOUR-YEAR INSTITUTIONS
the definitions of potential transfer they studied in two community college districts. In one district, with theexception of the "all students" definition, no more than 50 percent of transfer students were captured by anydefinition, while in the other district 88 percent or more of transfer students were captured by several of thedefinitions. In this report, the percentage of transfer students meeting the criteria for inclusion in the de-nominator declined significantly as the definition of potential transfer became more restrictive. While 95percent of transfer students indicated educational expectations including the bachelor's degree, about one infive (20.5 percent) had academic majors and were taking courses leading toward the bachelor's degree.
Operationalizing the Transfer Rate Denominator
This examination of alternative ways of defining the pool of potential transfer students was undertakenin part to inform research at the design stage. The purpose of the research, however, was not to recommendany particular definition as superior to all the others. Instead, the analysis contrasted these alternative defi-nitions so that whatever choice is made for any specific research question can be understood in the contextof other options of operationalization that could have been selected. Three examples illustrate this point.First, if the purpose of a particular analysis is to examine the effect of community college attendance onstudent outcomes, such as bachelor's degree attainment, then it may be most useful to examine the transferrates of students who expect to earn a bachelor's degree or higher, as well as those who do not. Such ananalysis does not ignore the fact that at least some students who did not expect to earn a bachelor's degreeor higher nevertheless transferred to a 4-year institution. Although the proportion who did so is relativelysmall (5 percent), this result is consistent with the hypothesis that community college attendance may raisesome students' expectations.
A second example further illustrates the point that the differences across definitions are not immediatelyevident from estimated transfer rates. The results of the analysis suggest that three of the definitions basedupon enrollmentenrolled in an academic program, enrolled continuously in 1989-90, and enrolled anytimein academic year 1990-91define groups of students whose transfer rates are similar to the rate for stu-dents who expected to earn a bachelor's degree or higher (about 32 or 33 percent for first transfer; table 3).The percentages of students meeting these definitions, as well as the transfer rates of students not meetingthese definitions, are also similar. These results suggest that definitions of potential transfer based uponcertain enrollment characteristics are roughly comparable to the definition based upon students' stated in-tent, which in some cases may be more difficult to obtain. However, while the aggregate numbers are com-parable, the individual students comprising these groups vary. For example, for each enrollment-based defi-nition, roughly one in five students did not express bachelor's degree expectations (see appendix table C7).The underlying composition of the groups may vary with respect to other characteristics as well.
Finally, the more restrictive definitions may be useful in identifying a group of community college stu-dents comparable (in terms of major and degree program) to students who first enroll in 4-year institutions.

DISCUSSION
For example, one definition of potential transfer used in this analysis included students who indicated thatthey were pursuing academic majors or taking courses toward the bachelor's degree (or both). This defini-tion excludes students with vocational majors taking courses leading to the associate's degree, as well asthose students pursuing certificates. Because relatively few 4-year institutions offer vocational associate'sdegrees or certificates, this definition may maximize comparability across 2- and 4-year student populationsin analyses of persistence and attainment. However, in the BPS:1990/1994 dataset, questions based on a.student's major tended to have a higher than average number of missing values. Furthermore, while thisdefinition resulted in a fairly high transfer rate (43 percent), about two-fifths (43 percent) of communitycollege students met this definition, and it excluded about 30 percent of all transfer students. This definition
illustrates the trade-off between restricting the pool of potential transfer students and excluding substantial
portions of the initial cohort and actual transfer students.
Which definition (or definitions) is most appropriate for addressing a specific research question? Thedecision is not straightforward. Just as any statistic depends on the specific variables used to indicate theunderlying concepts, the transfer rate for community college students is rather sensitive to the specification
of potential transfer. The most complete picture is provided by using multiple indicators, but this approachis not always practical. If data collection costs or other constraints permit only one definition, one strategyis to define the group of potential transfer students broadly enough so that it still generally reflects commu-nity college students, while not being so broad as to include students who never harbor plans to transfer to a4-year college. This study presents several alternatives with different advantages and disadvantages.
Overall, the results of this study provide national estimates of community college students' academicexpectations and transfer activity. These estimates refine and update our understanding of students' inten-tions and paths to transfer. Selecting an approach to defining the pool of potential transfer students is anecessary first step in any effort to analyze the impact of institution type on persistence and attainment. This
report has taken a step back and analyzed the definition itself by examining several alternative approaches
using a complete nationally representative sample. While the results do not demonstrate the superiority of
any single definition, they sharpen one's appreciation for the consequences of measurement decisions and
build a firmer foundation for future work on this population. Such work will be facilitated by the completion
of the newest panel of the 1995-96 BPS, with follow-ups in 1998 and 2001. This new data source includesdata on students' explicit transfer intentions and expectations of degree completion at the first institutionattended (Berkner, Horn, and Clune 2000). This additional information, also available in a nationally repre-
sentative sample, has the potential to substantially enrich our understanding of potential transfer populations.
37 64

REFERENCES
Barbett, S. (1998). Fall Enrollment in Postsecondary Institutions, 1996 (NCES 1999-239). U.S. Department
of Education, National Center for Education Statistics. Washington, DC: U.S. Government Printing Of-
fice.
Berkner, L.K., Horn, L., and Clune, M. (2000). Descriptive Summary of 1995-96 Beginning Postsecondary
Students: Three Years Later With an Essay on Students Who Start at Less-Than-4-Year Institutions (NCES
2000-154). U.S. Department of Education, National Center for Education Statistics. Washington, DC:
U.S. Government Printing Office.
Berkner, L.K., Cuccaro-Alamin, S., and McCormick, A.C. (1996). Descriptive Summary of 1989-90 Begin-
ning Postsecondary Students: 5 Years Later With an Essay on Postsecondary Persistence and Attainment
(NCES 96-155). U.S. Department of Education, National Center for Education Statistics. Washington,
DC: U.S. Government Printing Office.
Brint, S., and Karabel, J. (1989). The Diverted Dream; Community Colleges and the Promise of Educational
Opportunity in America, 1900-1985. New York: Oxford University Press.
California Community Colleges Chancellor's Office. (1999). Policy Analysis and MIS Division Student
Right-to-Know Reporting Project. Available: http://www.cccco.edu/cccco/mis/srtk/srtkhome.htm
Cohen, A.M. (1991). Deriving a Valid Transfer Rate. In E.B. Jones (Ed.), A Model for Deriving the Transfer
Rate (pp. 1-15). Washington, DC: American Association of Community and Junior Colleges.
Cohen, A.M., and Sanchez, J. R. (1997). The Transfer Rate: A Model of Consistency. Los Angeles, CA:
Center for the Study of Community Colleges. (ERIC ED409952)
Dougherty, K. (1987). The Effects of Community Colleges: Aid or Hindrance to Socioeconomic Attain-
ment? Sociology of Education, 60(2):86 -103.
Dougherty, K. (1992). Community Colleges and Baccalaureate Attainment. Journal of Higher Education,
63(2):188-214.
Dougherty, K. (1994). The Contradictory College. Albany, NY: SUNY Press.
Dunn, O.J. (1961). Multiple Comparisons Among Means. Journal of the American Statistical Association,
56:52-64.
Grubb, W.N. (1988). Vocationalizing Higher Education: The Causes of Enrollment and Completion in Pub-
lic Two-Year Colleges, 1970-1980. Economics of Education Review, 7(3): 301-319.
3965

COMMUNITY COLLEGE TRANSFER RATES TO FOUR-YEAR INSTITUTIONS
Grubb, W.N. (1991). The Decline of Community College Transfer Rates: Evidence from National Longitu-dinal Surveys. Journal of Higher Education, 62(2):194-222.
Gutierrez-Marquez, A. (1994, May/June). A Longitudinal Model for Assessing Student Outcomes at a Com-munity College. Paper presented at the Annual Forum of the Association for Institutional Research, NewOrleans, LA, May 29June 1,1994. (ERIC ED376908)
Horn, L.J., and Berktold, J. (1998). Profile of Undergraduates in U.S. Postsecondary Education Institutions:1995-96 (NCES 98-084). U.S. Department of Education, National Center for Education Statistics. Wash-ington, DC: U.S. Government Printing Office.
Kojaku, L., and Nuilez, A.-M. (1998). Descriptive Summary of 1995-96 Beginning Postsecondary Students,With Profiles of Students Entering 2- and 4-Year Institutions (NCES 1999-030). U.S. Department ofEducation, National Center for Education Statistics. Washington, DC: U.S. Government Printing Office.
Laanan, F.S., and Sanchez, J.R. (1996). New Ways of Conceptualizing Transfer Rate Definitions. New Di-rections for Community Colleges, 24(4):35-43.
Lee, V.E., and Frank, K.A. (1990). Students' Characteristics That Facilitate the Transfer from Two-Year toFour-Year Colleges. Sociology of Education, 63(3):178-193.
Lewis-Beck, M.S. (1980). Applied Regression: An Introduction. Beverly Hills, CA: Sage Publications, Inc.
McCormick, A.C. (1997). Transfer Behavior Among Beginning Postsecondary Students: 1989-94 (NCES97-266). U.S. Department of Education, National Center for Education Statistics. Washington, DC: U.S.Government Printing Office.
Palmer, J., and Reish, J. (1991). The Process: Gathering Data for Transfer. In E.B. Jones, (Ed.), A Model forDeriving the Transfer Rate (pp. 17-29). Washington, DC: American Association of Community andJunior Colleges.
Pratt, D.J., Whitmore, R.W., Wine, J.S., Blackwell, K.M., Forsyth, B.H., Smith, T.K., Becker, E.A., Veith,K.J., Mitchell, M., and Borman, G.D. (1996). Beginning Postsecondary Students Longitudinal StudySecond Follow-up (BPS:90/94) Final Technical Report (NCES 96-153). U.S. Department of Education,National Center for Education Statistics. Washington, DC: U.S. Government Printing Office.
Snedecor, G.W., and Cochran, W.G. (1967). Statistical Methods. Ames, IA: Iowa State University Press.
Spicer, S.L., and Armstrong, W.B. (1996). Transfer: The Elusive Denominator. New Directions for Commu-nity Colleges, 24(4):45-54.
4066

APPENDIX A GLOSSARY
This glossary describes the variables used in this report. These variables were selected directly from theBeginning Postsecondary Students Longitudinal Study (BPS:1990/1994) Data Analysis System (DAS), anNCES software application that generates tables directly from the BPS:1990/1994 data files. A description
of the DAS files can be found in appendix B. The variables are organized in alphabetical order by label usedin the report. The BPS:1990/1994 variable label is indicated to the right of each entry in the glossary. The
index below groups the variables as they are used in the report.
Glossary Index
Potential Transfer Definitions First-generation college status 44
Gender 44Expected to complete bachelor's degree or
Race/ethnicity 45higher 44
Region of institution 46Enrolled in an academic program 43
Self-rated academic ability 46Enrolled continuously in 1989-90 43
Self-rated mathematical ability 47Enrolled anytime in academic year
Took remedial math in 1989-90 471990-91 43
Delayed enrollment after high school 42Enrolled for 12 or more credit hours 43
Campus participation index 42Taking courses toward bachelor's 47
Single parent 47Pursuing academic major or taking courses
Dependency status 43toward bachelor's or both 45
Hours worked per week 44Pursuing academic major and taking
Received financial aid 46courses toward bachelor's 45
Ratio of aid to price 45
Other Student CharacteristicsTransfer Outcomes
Age as of 12/31/89 42First transferred to 4-year 44
Attendance intensity 42Ever transferred to 4-year 43
Socioeconomic status 47
41
67

COMMUNITY COLLEGE TRANSFER RATES TO FOUR-YEAR INSTITUTIONS
Age as of 12/31/89 AGE
Student's age as of 12/31/89. Ages in years were grouped as follows:
18 or below
19 through 21
22 and above
22 through 24
25 through 34
35 through 4445 and above
Attendance intsensity ATTEND
Whether student attended the institution full time or less than full time during the sampled 1989-90 term.
Full time
Less than full time
Campus participation index CLIMINDX
Overall participation index of activities the student reported doing during the 1989-90 academic year either"sometimes" or "often." Activities included attending career-related lectures, having informal contact withfaculty members, participating in student assistance centers/programs, participating in study groups, meet-ing advisors about academic plans, participating in intramurals, participating in school clubs, talking aboutacademics with faculty, and going out with school friends. Possible scores as coded in the DAS range from0 to 9. Scores were grouped into the following categories:
2 or below
3-45-67 or above
Delayed enrollment after high school DELAYENR
Indicates whether or not the student delayed postsecondary education following high school graduation.Those who graduated earlier than 1989, or who did not receive a regular high school diploma, were consid-ered to have delayed enrollment.
42

APPENDIX AGLOSSARY
Dependency status DEPEND
Indicates whether the student was considered a dependent or independent student for financial aid purposes
in academic year 1989-90.
Enrolled anytime in academic year 1990-91 ENAY8990
Indicates whether or not the student enrolled in a postsecondary institution at any time during the 1990-91academic year. Students who were enrolled at some point during 1990-91 were included in this pool of
potential transfers. Some students meeting this definition may have already left the community college in
which they first enrolled.
Enrolled continuously in 1989-90 ST8990
Indicates the student's continuous full-time or part-time enrollment during 1989-90. Students classified as
having "continuous full-time" or "other continuous" enrollment were included in this pool of potential
transfer students.
Enrolled for 12 or more credit hours CREDHRS
This DAS variable indicates the number of semester hours for which the student was enrolled during the
primary term. Quarter hours were converted to semester hours by multiplying by 2/3. Students who had
enrolled for 12 or more credit hours were included in this pool of potential transfer students.
Enrolled in an academic program VOCA8990
This variable was derived based on the student's report of whether his/her program of study was primarily
academic or vocational. The question was asked during the first follow-up in the spring of 1992 for each
previous term of postsecondary enrollment, and a value was assigned for 1989-90 based on the student's
response for the earliest term queried. Students who reported being in an academic program were included
in this pool of potential transfer students.
Ever transferred to 4-year EVER4YR
Classifies the student according to whether he/she ever attended a 4-year postsecondary institution as of the
second follow-up in spring 1994. Those who had were included in the calculation of this transfer rate.
4369

COMMUNITY COLLEGE TRANSFER RATES TO FOUR-YEAR INSTITUTIONS
Expected to complete bachelor's degree or higher EXEDCOL
This variable is based on the student's response to the question, "What is the highest level of education youever expect to complete?" Students responding that they expected to receive a bachelor's degree, master'sdegree or equivalent, Ph.D., M.D., or other advanced professional degree were included in this pool ofpotential transfer students.
First-generation college status RPARED
This variable indicates whether the student was the first generation to enter postsecondary education, basedon the higher of the parents' educational attainment. Students whose parents had not taken any postsecondaryeducation were considered first- generation students.
First transferred to 4-year TRANTO
This variable classifies the institutional level of the first institution the student enrolled in after leaving theinstitution at which he/she was sampled for participation in the study. For this report, students whose firsttransfer was to a public or private 4-year institution were included in the calculation of this transfer rate,versus all others, including those transferring to other institution types or never enrolling in a differentinstitution.
Gender H_GENDR
Indicates whether the student was male or female.
Hours worked per week EMWKHR2
This variable calculates the average hours worked per week between 07/01/89 and 06/30/90 for all students(including those who did not work). If a student was employed (including college work-study and anyassistantships) during a given month, the average number of hours worked per week across all jobs heldduring the month was derived based on the start and end dates and the average hours worked per week foreach job as reported during the interview. This estimate was calculated as follows: 1) determine the averagenumber of hours per week a student worked during each month; 2) sum the average hours per week across 12months; and 3) divide by 12 months. For example, if a student worked 40 hours per week for 3 monthsduring the year and did not work during the remaining 9 months, his/her value for this variable would be 10[(40+40+40)/12]. Therefore, this variable indicates the number of hours worked per week averaged over a12-month period. For this report, responses were grouped as follows:
44 70

APPENDIX AGLOSSARY
Fewer than 3535 or more
Pursuing an academic major and taking courses toward bachelor's MAJDEG89
This variable is based on two survey questions. The first is "What is your major?" (at the institution in which
the student first enrolled). Students reporting a major in humanities, social and behavioral science, lifesciences, physical sciences, mathematics, or education were considered to be pursuing an academic major.Students reporting a major in computer and information technology, engineering, business and manage-ment, health, vocational/technical, or other technical/professional program were considered to be pursuing
a vocational degree. The second component of this variable is based on the question, "Toward which degree
or other award are the courses you are taking leading?" (See "Taking courses toward bachelor's," below.)
Students' major type was cross-classified with the type of credential they indicated they were working on.For this report, students whose category for MAJDEG89 was academic bachelor's degree were included in
this pool of potential transfer students.
Pursuing academic major or taking courses toward bachelor's or both MAJDEG89
This variable is based on the same DAS variable as the previous entry. However, it is more inclusive. Stu-dents whose category for MAJDEG89 was reported as academic bachelor's degree, academic associate'sdegree, or vocational bachelor's degree were included in this pool of potential transfer students. Thus, stu-dents with academic majors who indicated they were pursuing the associate's degree or higher, as well as
those working on the bachelor's degree in vocational majors, were included.
Race/ethnicity BPSRACE
Indicates the student's racial/ethnic background in the following five categories: white, non-Hispanic; black,
non-Hispanic; Hispanic; Asian/Pacific Islander; or American Indian/Alaskan Native.
Ratio of aid to price AIDRTIO2
Ratio of total aid to attendance-adjusted, student-reported price. This variable adjusts for non-tuition charges
of part-time and independent students so that the monthly expenses of the household included in educational
charges are limited to the student and related to attendance intensity. The total price is reduced by one-fourth
of the sum of the room, board, and other off-campus expenses for part-time students attending half time or
45

COMMUNITY COLLEGE TRANSFER RATES TO FOUR-YEAR INSTITUTIONS
more, and by three-fourths for those attending less than half time. This provides a total price of attendanceamount that more closely reflects the assumptions used in awarding financial aid. For this report, responseswere grouped as follows:
Zero
1-33 percent34-67 percent68-100 percent
Received financial aid AID8990
Indicates whether or not the student received financial aid during the 1989-90 academic year.
Region of institution OBEREG
The region of the student's 1989-90 institution at which he/she was sampled for participation in the study.Although students from outlying areas were included in the study, there were no such students attendingpublic 2-year institutions. The following categories were used:
NortheastNew EnglandMid East
MidwestGreat LakesPlains
South
Southeast
SouthwestWest
Rocky MountainsFar West
Self-rated academic ability COMPAREA
Student's self-rating during his/her first postsecondary term of his/her academic ability in response to thefollowing question as part of a series: "Compared with the average person of your age, would you rateyourself as above average, average, or below average in... academic ability?"
46 72

APPENDIX AGLOSSARY
Self-rated mathematical ability COMPAREF
Student's self-rating during his/her first postsecondary term of his/her mathematical ability in response tothe following question as part of a series: "Compared with the average person of your age, would you rate
yourself as above average, average, or below average in... mathematical ability?"
Single parent SINGLPAR
Indicates whether or not the student was a single parent as of academic year 1989-90, based on the student'smarital status, dependency status, and whether or not the student reported having dependents other than aspouse. Students who were themselves dependent were not counted as single parents.
Socioeconomic status SESPERC
Students' socioeconomic status in academic year 1989-90. Composite variable combining parents' occupa-tion (father/mother), things in the home (dishwasher, VCR), and dependents' family income. Percentiles forthis composite variable were grouped into quartiles for this report:
Lowest quartileLower middle
Upper middleHighest quartile
Taking courses toward bachelor's GOAL8990
This variable is based on the question, "Toward which degree or other award are the courses you are taking
leading?" Those who indicated that their coursework was leading toward a bachelor's degree were included
in this pool of potential transfer students.
Took remedial math in 1989-90 REMMATH
Student's response to a question about whether he/she had taken any remedial math from July 1,1989, untilthe survey. The DAS variable is a continuous variable indicating the number of hours of remedial mathtaken; for this study, the responses were collapsed into the following categories:
No Took no hours
Yes Took at least 1 hour
47 7 3

APPENDIX B TECHNICAL NOTES AND METHODOLOGY
Beginning Postsecondary Students Longitudinal Study
The need for a nationally representative database on postsecondary student financial aid prompted theU.S. Department of Education to initiate the National Postsecondary Student Aid Study (NPSAS), a cross-sectional survey conducted every 3 years starting in 1987. The NPSAS sample was designed to includestudents enrolled in all types of postsecondary education. However, service academies were not included in
the institution sample because of their unique funding and tuition base, and certain other institutions werealso excluded.' In addition to a computer-assisted telephone interview (CATI) of students and parents, theNPSAS surveys collect students' registration and financial aid information directly from the sampled insti-
tutions. To provide the full range of information on financing postsecondary education, NPSAS samples
both aided and nonaided students.
The Beginning Postsecondary Students Longitudinal Study (BPS:1990/1994) followed students from the
NPSAS:1990 sample who were identified as first-time beginning students in academic year 1989-90. A CATI
was conducted with these students 2 and 4 years after the base year study that collected information concerning
enrollment, program completion, education financing, employment, and family formation; graduate school
access and enrollment; and civic participation. The data derived from this survey permit a variety of analyses
concerning postsecondary persistence and completion, entry into the work force, and civic participation.
Unlike other NCES longitudinal surveys based on grade-specific cohorts (such as High School and Be-
yond), the BPS design allows for the increasing numbers of nontraditional postsecondary students, such as
those who have delayed their education due to financial needs or family responsibilities. Students who
began their postsecondary studies before 1989-90, stopped out, and then returned to their studies in 1989-
90 were not included, nor were students still enrolled in high school.
The NPSAS and BPS survey samples, while representative and statistically accurate, are not simple
random samples. Instead, the samples are selected using a more complex three-step procedure with strati-
fied samples and differential probabilities of selection at each level. First, postsecondary institutions areselected within geographic strata. Once institutions are organized by zip code and state, they are further
stratified by, control (i.e., public; private, not-for-profit; or private, for-profit) and degree offering (less-than-
2-year, 2- to 3-year, 4-year nondoctorate-granting, and 4-year doctorate-granting).
19Other excluded institutions were those offering only avocational, recreational, or remedial courses; only in-house businesscourses; only programs of less than 3 months' duration; or only correspondence courses.
497

COMMUNITY COLLEGE TRANSFER RATES TO FOUR-YEAR INSTITUTIONS
For more information on BPS:1990/1994, consult the Beginning Postsecondary Students LongitudinalStudy Second Follow-up (BPS:90/94) Final Technical Report (Pratt et al. 1996).
Accuracy of Estimates
The statistics in this report are estimates derived from a sample. Two broad categories of error occur insuch estimates: sampling and nonsampling errors. Sampling errors occur because observations are madeonly on samples of students, not on entire populations. Nonsampling errors occur not only in sample sur-veys, but also in complete censuses of entire populations.
Nonsampling errors can be attributed to a number of sources: inability to obtain complete informationabout all students in all institutions in the sample (e.g., some students or institutions refused to participate,or students participated but answered only certain items); ambiguous definitions; differences in interpretingquestions; inability or unwillingness to give correct information; mistakes in recording or coding data; andother errors of collecting, processing, sampling, and imputing missing data.
Data Analysis System
The estimates presented in this report were produced using the BPS:1990/1994 Data Analysis System(DAS). The DAS software makes it possible for users to specify and generate their own tables from BPSdata. With the DAS, users can replicate or expand upon the tables presented in this report. In addition to thetable estimates, the DAS calculates proper standard errors2° and weighted sample sizes for these estimates.If the number of valid cases is too small to produce a reliable estimate (fewer than 30 cases), the DAS printsthe message "low n" instead of the estimate. In addition to tables, the DAS will also produce a correlationmatrix of selected variables to be used for linear regression models. Included in the output with the correla-tion matrix are the design effects (DEFTs) for each variable in the matrix. Since statistical proceduresgenerally compute regression coefficients based on simple random sample assumptions, the standard errorsmust be adjusted with the design effects to take into account the BPS stratified sampling method.
The DAS can be accessed electronically at www.PEDAR-DAS.org. For more information about theBPS:1990/1994 DAS, contact:
"The BPS sample is not a simple random sample; therefore, simple random sample techniques for estimating sampling errorcannot be applied to these data. The DAS takes into account the complexity of the sampling procedures and calculatesstandard errors appropriate for such samples. The method for computing sampling errors used by the DAS involves approxi-mating the estimator by the linear terms of a Taylor series expansion. The procedure is typically referred to as the Taylorseries method.
50 75.

APPENDIX BTECHNICAL NOTES AND METHODOLOGY
Aurora D'AmicoNational Center for Education StatisticsPostsecondary Studies Division
1990 K Street, NWWashington, DC 20006-5650
(202) 502-7334
E-mail: Aurora_D'[email protected]
Statistical Procedures
Two types of statistical procedures were employed in this report: testing differences between two esti-mates and testing for linear trends in estimates across a set of ordered categories. Each procedure is de-
scribed below.
Differences Between Estimates
The descriptive comparisons were tested in this report using the Student's t statistic. Differences betweenestimates are tested against the probability of a Type I error or significance level. The significance levelswere determined by calculating the Student's t values for the differences between each pair of means or
proportions, and comparing these with published tables of significance levels for two-tailed hypothesistesting. The Student's t values may be computed to test the difference between estimates with the following
formula:
t =(E, E)
q(sel2 +se22) (1)
where E1 and E2 are the estimates to be compared, and se, and see are their corresponding standard errors.This formula is valid only for independent estimates. When estimates are not independent, a covarianceterm must be added to the formula. If the comparison is between the mean of a subgroup and the mean of the
total group, the following formula is used:
(Etot --Esub)t =se.2 +sesub-2 -2 (p)se2
51 76
(2)
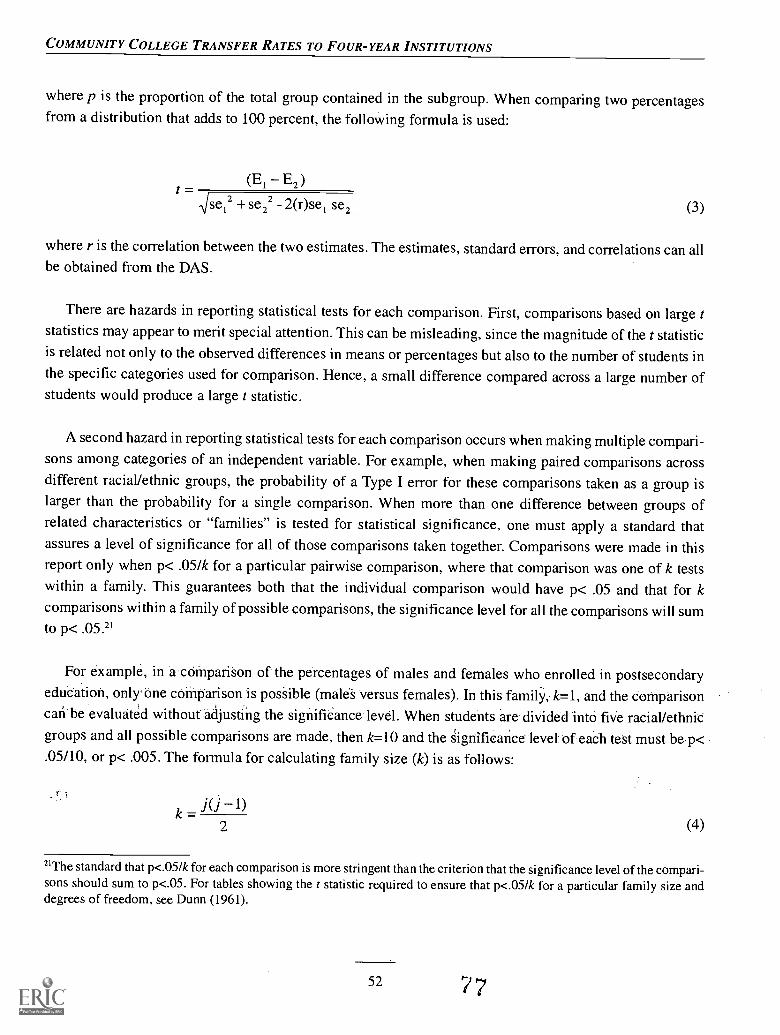
COMMUNITY COLLEGE TRANSFER RATES TO FOUR-YEAR INSTITUTIONS
where p is the proportion of the total group contained in the subgroup. When comparing two percentagesfrom a distribution that adds to 100 percent, the following formula is used:
(E1 E2)
12 + se 22 2(r)se1
set (3)
where r is the correlation between the two estimates. The estimates, standard errors, and correlations can allbe obtained from the DAS.
There are hazards in reporting statistical tests for each comparison. First, comparisons based on large tstatistics may appear to merit special attention. This can be misleading, since the magnitude of the t statisticis related not only to the observed differences in means or percentages but also to the number of students inthe specific categories used for comparison. Hence, a small difference compared across a large number ofstudents would produce a large t statistic.
A second hazard in reporting statistical tests for each comparison occurs when making multiple compari-sons among categories of an independent variable. For example, when making paired comparisons acrossdifferent racial/ethnic groups, the probability of a Type I error for these comparisons taken as a group islarger than the probability for a single comparison. When more than one difference between groups ofrelated characteristics or "families" is tested for statistical significance, one must apply a standard thatassures a level of significance for all of those comparisons taken together. Comparisons were made in thisreport only when p< .05/k for a particular pairwise comparison, where that comparison was one of k testswithin a family. This guarantees both that the individual comparison would have p< .05 and that for kcomparisons within a family of possible comparisons, the significance level for all the comparisons will sumto p< .05.21
For example, in a cornpariSon of the percentages of males and females who enrolled in postsecondaryeducation, only One comparison is posSible ( males versus females). In this family, k=1, and the comparisoncan be evaluated without adjusting the signifiCance level. When students are divided into five racial /ethnicgroups and all possible comparisons are made, then k=10 and the significance level of each test must be.p<.05/10, or p< .005. The formula for calculating family size (k) is as follows:
k = 1)2 (4)
'The standard that p<.05/k for each comparison is more stringent than the criterion that the significance level ofthe compari-sons should sum to p<.05. For tables showing the t statistic required to ensure that p<.05/k for a particular family size anddegrees of freedom, see Dunn (1961).
52

APPENDIX BTECHNICAL NOTES AND METHODOLOGY
where j is the number of categories for the variable being tested. In the case of race/ethnicity, there are five
racial/ethnic groups (American Indian/Alaskan Native; Asian/Pacific Islander; black, non-Hispanic; His-
panic; and white, non-Hispanic), so substituting 5 for j in equation 4,
k =5(5 1)
=102
Linear Trends
(5)
When comparing estimates across a family of three or more categories that are ordered, however, such as
SES quartiles, it is possible to test whether the estimates may also be ordered more efficiently than with a
series of paired comparisons.
When proportions were examined relative to a variable with ordered categories, the Student's t-test was
applied to a measure of a linear trend. The test involves estimating a simple linear regression with a variable
representing the order of the categories as the independent variable (e.g., SES quartile), and the proportion
of interest (e.g., the percentage who enrolled for 12 or more credits) as the dependent variable. Before
estimating the regression, the data must be adjusted by the design effects to account for the complex sample
design. The t statistic is calculated as the ratio of the regression coefficient to its standard error. If t is greater
than 1.96 (the critical value of t at a significance level of .05), there is evidence of a linear relationship
between the two variables.22
22For more information about this modification of Student's t-test, see Snedecor and Cochran (1967, 246-247). For more
information about linear regression, see Lewis-Beck (1980).
53 78

APPENDIX C- SUPPLEMENTAL AND STANDARDERROR TABLES
55
79

Tab
le C
1.-S
tand
ard
erro
rs f
or ta
ble
1: P
erce
ntag
e di
stri
butio
ns w
ithin
pot
entia
l tra
nsfe
r ca
tego
ries
of
1989
-90
begi
nnin
gpo
stse
cond
ary
stud
ents
enro
lled
at p
ublic
2-y
ear
inst
itutio
ns a
ccor
ding
to v
ario
us s
tude
nt a
nd in
stitu
tion
char
acte
rist
ics
n o t t c :7-1 ..< n o
Exp
ecte
dE
nrol
led
Purs
uing
acad
emic
maj
or o
rta
king
Purs
uing
acad
emic
maj
or a
ndto
com
plet
eE
nrol
led
anyt
ime
inco
urse
sE
nrol
led
Tak
ing
taki
ngN i
bach
elor
'sin
an
Enr
olle
dac
adem
icto
war
dfo
r 12
cour
ses
cour
ses
ztri
degr
eeac
adem
icco
ntin
uous
lyye
arba
chel
or's
or m
ore
tow
ard
tow
ard
tri
Cha
ract
eris
ticT
otal
or h
ighe
rpr
ogra
min
198
9-90
1990
-91
or b
oth
cred
it ho
urs
bach
elor
'sba
chel
or's
P-.3
Tot
al
Age
as
of 1
2/31
/89
tt
tt
tt
tt
ta c4 tli
18 o
r be
low
2.33
2.56
2.64
2.84
2.77
3.03
3.36
3.73
6.99
>c
19 th
roug
h 21
1.80
2.28
2.37
2.38
2.22
2.74
2.70
3.50
6.79
a22
or
abov
e2.
432.
152.
172.
312.
542.
262.
432.
553.
79r.
II
22 th
roug
h 24
1.06
1.21
0.98
1.10
1.16
1.06
1.15
1.47
2.18
--i
(.4
25 th
roug
h 34
35 th
roug
h 44
1.39
0.91
1.38
0.95
1.52
1.09
1.54
1.14
1.50
1.10
1.66
1.11
1.57
1.06
1.94
1.28
3.17 t
0 ."21 0
45 o
r ab
ove
0.83
0.46
0.70
0.63
0.63
0.51
0.44
tt
Soci
oeco
nom
ic s
tatu
s-< tr
lL
owes
t qua
rtile
1.67
1.54
1.68
1.75
1.75
1.90
2.12
2.48
3.36
asL
ower
mid
dle
1.79
2.26
2.39
1.94
2.27
2.79
1.99
3.20
4.02
''''U
pper
mid
dle
1.87
2.28
2.72
2.25
2.38
3.12
3.14
3.93
6.82
vp :J.
Hig
hest
qua
rtile
1.75
2.27
2.59
2.27
2.17
3.19
3.39
3.98
7.16
`-3 C
Firs
t-ge
nera
tion
colle
ge s
tatu
s--
i
Firs
t gen
erat
ion
2.18
2.41
2.76
2.53
2.50
3.31
3.40
4.16
6.44
0N
ot f
irst
gen
erat
ion
2.18
2.41
2.76
2.53
2.50
3.31
3.40
4.16
6.44
c4
Gen
der
Mal
e2.
212.
592.
782.
812.
693.
313.
414.
197.
01Fe
mal
e2.
212.
592.
782.
812.
693.
313.
414.
197.
01
Rac
e/et
hnic
ityW
hite
, non
-His
pani
c2.
262.
672.
762.
542.
723.
752.
864.
29-
6.59
Bla
ck, n
on-H
ispa
nic
1.30
1.57
1.46
1.22
1.39
2.00
1.65
1.94
tH
ispa
nic
1.63
1.78
1.94
1.77
2.14
2.69
2.15
3.07
5.81
Asi
an/P
acif
ic I
slan
der
0.78
1.03
1.15
1.03
1.13
1.80
1.46
2.37
3.97
Am
eric
an I
ndia
n/A
lask
an N
ativ
e0.
320.
460.
460.
480.
430.
760.
420.
871.
80

Tab
le C
1.-S
tand
ard
erro
rs f
or ta
ble
1: P
erce
ntag
e di
stri
butio
ns w
ithin
pot
entia
l tra
nsfe
r ca
tego
ries
of
1989
-90
begi
nnin
g po
stse
cond
ary
stud
ents
enro
lled
at p
ublic
2-y
ear
inst
itutio
ns a
ccor
ding
to v
ario
us s
tude
nt a
nd in
stitu
tion
char
acte
rist
ics-
Con
tinue
d
Cha
ract
eris
tic
Exp
ecte
dto
com
plet
eE
nrol
led
bach
elor
'sin
an
degr
eeac
adem
icT
otal
or h
ighe
rpr
ogra
m
Enr
olle
d
Purs
uing
acad
emic
maj
or o
rta
king
Purs
uing
acad
emic
maj
or a
ndan
ytim
e in
cour
ses
Enr
olle
dT
akin
gta
king
Enr
olle
dac
adem
icto
war
dfo
r 12
cour
ses
cour
ses
cont
inuo
usly
year
bach
elor
'sor
mor
eto
war
dto
war
din
198
9-90
1990
-91
or b
oth
cred
it ho
urs
bach
elor
'sba
chel
or's
Reg
ion.
of in
stitu
tion
Nor
thea
st4.
044.
144.
313.
613.
974.
864.
774.
184.
22
New
Eng
land
2.35
1.93
2.08
1.44
1.62
1.45
2.36
1.40
1.59
Mid
Eas
t3.
673.
934.
063.
483.
824.
784.
484.
023.
96' M
idw
est
3.29
3.62
3.85
3.26
3.65
4.30
4.31
5.66
5.02
Gre
at L
akes
2.94
3.26
3.68
2.94
3.43
4.02
3.84
5.53
4.63
Plai
ns1.
861.
961.
451.
701.
722.
062.
442.
302.
22
Sout
h3.
694.
024.
343.
974.
134.
684.
705.
185.
41
Sout
heas
t3.
293.
563.
993.
653.
644.
314.
114.
464.
67
Sout
hwes
t2.
092.
292.
051.
992.
422.
012.
582.
693.
26
Wes
t3.
683.
994.
373.
844.
084.
894.
355.
666.
98
Roc
ky M
ount
ains
0.94
0.80
1.02
1.13
1.03
1.31
1.39
1.34
2.25
Far
Wes
t3.
673.
994.
383.
834.
064.
904.
245.
647.
05
Self
-rat
ed a
cade
mic
abi
lity
Abo
ve a
vera
ge1.
712.
162.
312.
162.
232.
992.
663.
766.
49
Ave
rage
1.83
2.22
2.46
2.35
2.35
3.09
2.74
3.90
6.57
Bel
ow a
vera
ge0.
600.
720.
770.
750.
730.
950.
810.
931.
81
Self
-rat
ed m
athe
mat
ical
abi
lity
Abo
ve a
vera
ge1.
622.
132.
332.
192.
063.
002.
913.
685.
49
Ave
rage
1.81
2.34
2.50
2.24
2.32
3.16
3.19
3.70
6.54
Bel
ow a
vera
ge1.
391.
912.
00.1
.93
1.96
2.80
2.31
3.25
5.77
Too
k re
med
ial m
ath
in 1
989-
90N
o1.
531.
961.
951.
691.
863.
002.
023.
672.
99
Yes
1.53
1.96
1.95
1.69
1.86
3.00
2.02
3.67
2.99
Del
ayed
enr
ollm
ent a
fter
hig
h sc
hool
No
2.42
2.63
2.43
2.56
2.58
2.87
3.30
3.53
6.68
Yes
2.42
2.63
2.43
2.56
2.58
2.87
3.30
3.53
6.68
8283

84
Tab
le C
1.-S
tand
ard
erro
rs f
or ta
ble
1: P
erce
ntag
e di
stri
butio
ns w
ithin
pot
entia
l tra
nsfe
rca
tego
ries
of
1989
-90
begi
nnin
g po
stse
cond
ary
stud
ents
enro
lled
at p
ublic
2-y
ear
inst
itutio
ns a
ccor
ding
to v
ario
us s
tude
nt a
nd in
stitu
tion
char
acte
rist
ics-
Con
tinue
d
Cha
ract
eris
tic
Purs
uing
acad
emic
Purs
uing
maj
or o
rac
adem
icE
xpec
ted
Enr
olle
dta
king
.m
ajor
and
to c
ompl
ete
Enr
olle
dan
ytim
e in
cour
ses
Enr
olle
dT
akin
gta
king
bach
elor
'sin
an
Enf
olle
dac
adem
icto
war
dfo
r 12
cour
ses
cour
ses
degr
eeac
adem
ic c
ontin
uous
lyye
arba
chel
or's
or m
ore
tow
ard
tow
ard
Tot
alor
hig
her
prog
ram
in 1
989-
9019
90 -
91or
bot
hcr
edit
hour
sba
chel
or's
bach
elor
's
Atte
ndan
ce in
tens
ityFu
ll tim
e2.
533.
003.
212.
912.
983.
951.
044.
886.
95L
ess
than
ful
l tim
e2.
533.
00.
3.21
2.91
2.98
3.95
1.04
4.88
6.95
Cam
pus
part
icip
atio
n in
dex
2 or
bel
ow2.
112.
352.
242.
252.
192.
763.
113.
345.
703-
42.
242.
722.
542.
582.
703.
903.
334.
697.
075-
61.
612.
262.
201.
992.
053.
112.
803.
895.
877
or a
bove
1.21
1.57
1.61
1.66
1.56
2.05
2.27
2.45
3.81
Sing
le p
aren
tN
o1.
090.
941.
120.
911.
070.
981.
161.
602.
00Y
es1.
090.
941.
120.
911.
070.
981.
161.
602.
00
Dep
ende
ncy
stat
usD
epen
dent
2.37
2.16
2.29
2.38
2:48
2.50
2.54
2.93
4.30
Inde
pend
ent
2.37
2.16
2.29
2.38
2.48
2.50
2.54
2.93
4.30
Hou
rs w
orke
d pe
r w
eek
Few
er th
an 3
52.
052.
492.
272.
292.
533.
252.
133.
675.
4135
or
mor
e2.
052.
492.
272.
292.
533.
252.
133.
675.
41
Rec
eive
d fi
nanc
ial a
idN
o2.
102.
232.
532.
502.
49.
3.04
3.83
3.29
4.35
Yes
2.10
2.23
2.53
2.50
2.49
104
3.83
3.29
4.35
85

Tab
le C
1.-S
tand
ard
erro
rs f
or ta
ble
1: P
erce
ntag
e di
stri
butio
ns w
ithin
pot
entia
l tra
nsfe
r ca
tego
ries
of
1989
-90
begi
nnin
g po
stse
cond
ary
stud
ents
enro
lled
at p
ublic
2-y
ear
inst
itutio
ns a
ccor
ding
to v
ario
us s
tude
nt a
nd in
stitu
tion
char
acte
rist
ics-
Con
tinue
d
Cha
ract
eris
tic
Purs
uing
acad
emic
Purs
uing
maj
or o
rac
adem
icE
xpec
ted
Enr
olle
dta
king
maj
or a
ndto
com
plet
eE
nrol
led
anyt
ime
inco
urse
sE
nrol
led
Tak
ing
taki
ngba
chel
or's
in a
nE
nrol
led
acad
emic
tow
ard
for
12co
urse
sco
urse
sde
gree
acad
emic
cont
inuo
usly
year
bach
elor
'sor
mor
eto
war
dto
war
dT
otal
or h
ighe
rpr
ogra
min
198
9-90
1990
-91
or b
oth
cred
it ho
urs
bach
elor
'sba
chel
or's
Rat
io o
f ai
d to
pri
ce*
No
aid
2.09
2.24
2.47
2.48
2.46
2.98
3.79
3.27
4.31
1-33
per
cent
1.44
1.52
1.73
1.75
1.73
2.03
2.96
2.19
3.51
34-6
7 pe
rcen
t0.
891.
151.
071.
181.
151.
631.
572.
042.
21
68-1
00 p
erce
nt0.
901.
121.
121.
221.
191.
401.
771.
032.
09
tNot
app
licab
le.
*Pri
ce a
djus
ted
for
atte
ndan
ce in
tens
ity. S
ee th
e gl
ossa
ry (
appe
ndix
A)
for
deta
ils.
NO
TE
: Unl
ess
othe
rwis
e sp
ecif
ied,
var
iabl
es a
re a
s of
198
9-90
(ba
se y
ear
inte
rvie
w, f
irst
term
of
post
seco
ndar
y en
rollm
ent)
.
SOU
RC
E: U
.S. D
epar
tmen
t of
Edu
catio
n, N
atio
nal C
ente
r fo
r E
duca
tion
Stat
istic
s, 1
989-
90 B
egin
ning
Pos
tsec
onda
ry S
tude
nts
Lon
gitu
dina
l Stu
dy (
BPS
:199
0/19
94),
Dat
a A
naly
sis
Syst
em.
8786

Tab
le C
2.-S
tand
ard
erro
rs f
or ta
ble
2: A
mon
g 19
89-9
0 be
ginn
ing
post
seco
ndar
y st
uden
ts e
nrol
led
at p
ublic
2-y
ear
inst
itutio
ns, p
erce
ntag
e of
initi
al c
ohor
t mee
ting
each
def
initi
on o
f po
tent
ial t
rans
fer,
by
vari
ous
stud
ent a
nd in
stitu
tion
char
acte
rist
ics
Cha
ract
eris
tic
Exp
ecte
dto
com
plet
eba
chel
or's
degr
eeor
hig
her
Enr
olle
din
an
acad
emic
prog
ram
Enr
olle
dco
ntin
uous
lyin
198
9-90
Enr
olle
dan
ytim
e in
acad
emic
year
1990
-91
Purs
uing
acad
emic
maj
or o
rta
king
cour
ses
tow
ard
bach
elor
'sor
bot
h
Enr
olle
dfo
r 12
or m
ore
cred
it ho
urs
Tak
ing
cour
ses
tow
ard
bach
elor
's
Purs
uing
acad
emic
maj
or a
ndta
king
cour
ses
tow
ard
bach
elor
's
Tot
al2.
062.
222.
392.
032.
342.
301.
931.
25
Age
as
of 1
2/31
/89
18 o
r be
low
2.69
2.49
3.47
2.86
3.30
3.30
2.79
2.05
19 th
roug
h 21
3.28
4.03
4.38
3.55
3.98
3.83
3.34
3.01
22 o
r ab
ove
4.06
4.05
4.71
3.67
3.50
3.05
2.35
1.54
22 th
roug
h 24
7.44
8.93
9.68
8.17
8.15
6.17
5.89
4.27
25 th
roug
h 34
6.44
6.77
6.32
5.54
5.65
4.24
4.13
2.71
35 th
roug
h 44
7.11
8.72
9.38
8.25
7.03
5.69
4.89
t45
or
abov
eC
I\So
cioe
cono
mic
sta
tus
Low
est q
uart
ile4.
545.
435.
564.
354.
274.
133.
192.
08L
ower
mid
dle
4.79
5.00
5.13
4.84
4.60
3.32
3.74
1.96
Upp
er m
iddl
e3.
773.
954.
413.
493.
854.
293.
202.
55
Hig
hest
qua
rtile
2.89
2.98
3.47
2.64
3.86
3.83
3.72
2.93
Firs
t-ge
nera
tion
colle
ge s
tatu
sFi
rst g
ener
atio
n3.
153.
403.
092.
943.
303.
012.
731.
55
Not
firs
t gen
erat
ion
2.27
2.70
2.71
2.61
3.11
3.16
2.70
2.26
Gen
der
gale
2.77
3.22
3.52
2.82
3.63
3.27
2.95
2.06
Fem
ale
2.95
3.11
3.18
2.83
2.96
2.87
2.44
1.65
Rac
e/et
hnic
ityW
hite
, non
-His
pani
c2.
442.
452.
832.
442.
672.
572.
281.
36
Bla
ck, n
on-H
ispa
nic
5.19
6.81
7.69
7.16
6.69
6.51
4.87
tH
ispa
nic
5.83
5.75
8.14
6.05
8.01
6.49
5.85
5.26
Asi
an/P
acif
ic I
slan
der
Am
eric
an I
ndia
n/ A
lask
an N
ativ
e
88

Tab
le C
2.-S
tand
ard
erro
rs f
or ta
ble
2: A
mon
g 19
89-9
0 be
ginn
ing
post
seco
ndar
y st
uden
ts e
nrol
led
at p
ublic
2-y
ear
inst
itutio
ns, p
erce
ntag
eof
initi
al c
ohor
t mee
ting
each
def
initi
on o
f po
tent
ial t
rans
fer,
by
vari
ous
stud
ent a
nd in
stitu
tion
char
acte
rist
ics-
Con
tinue
d
Cha
ract
eris
tic
Purs
uing
acad
emic
Purs
uing
maj
or o
rac
adem
ic
Exp
ecte
dE
nrol
led
taki
ngm
ajor
and
to c
ompl
ete
Enr
olle
dan
ytim
e in
cour
ses
Enr
olle
dT
akin
gta
king
bach
elor
'sin
an
Enr
olle
dac
adem
icto
war
dfo
r 12
cour
ses
cour
ses
degr
eeac
adem
icco
ntin
uous
lyye
arba
chel
or's
or m
ore
tow
ard
tow
ard
or h
ighe
rpr
ogra
min
198
9-90
1990
-91
or b
oth
cred
it ho
urs
bach
elor
'sba
chel
or's
Reg
ion
of in
stitu
tion
Nor
thea
st4.
293.
985.
714.
594.
924.
283.
191.
69
New
Eng
land
8.82
-6.
25--
-13
.64
-M
id E
ast
4.22
4.55
5.66
4.97
5.36
3.52
3.88
1.76
Mid
wes
t5.
295.
394.
824.
555.
475.
345.
172.
40
Gre
at L
akes
6.45
6.95
5.81
5.91
7.36
6.12
7.19
3.15
Plai
ns9.
426.
128.
456.
816.
8710
.59
4.09
3.33
Sout
h3.
534.
934.
343.
484.
594.
513.
291.
78
Sout
heas
t4.
455.
904.
354.
085.
825.
283.
852.
20
Sout
hwes
t5.
138.
0510
.53
5.68
6.11
8.11
5.54
3.47
Wes
t3.
523.
334.
763.
803.
973.
993.
312.
74
Roc
ky M
ount
ains
--
--
--
--
Far
Wes
t3.
543.
485.
064.
104.
204.
183.
542.
93
Self
-rat
ed a
cade
mic
abi
lity
Abo
ve a
vera
ge3.
163.
773.
883.
304.
163.
843.
743.
00
Ave
rage
2.66
2.51
2.93
2.42
2.86
2.67
2.31
1.49
Bel
ow a
vera
ge-
--
Self
-ra
ted
mat
hem
atic
al a
bilit
yA
bove
ave
rage
3.59
3.82
4.06
3.98
4.21
4.36
3.90
2.81
Ave
rage
2.92
2.92
3.01
2.55
2.94
2.92
2.08
1.57
Bel
ow a
vera
ge3.
764.
485.
474.
925.
784.
494.
593.
66
Too
k re
med
ial m
ath
in 1
989-
90N
o2.
192.
282.
632.
162.
362.
391.
791.
39
Yes
4.71
5.57
6.78
6.38
7.06
5.99
6.85
2.63
Del
ayed
enr
ollm
ent a
fter
hig
h sc
hool
No
2.30
2.46
2.71
2.44
3.05
3.11
2.49
1.73
Yes
3.43
3.34
3.75
2.86
3.10
2.75
2.40
2.00
9091
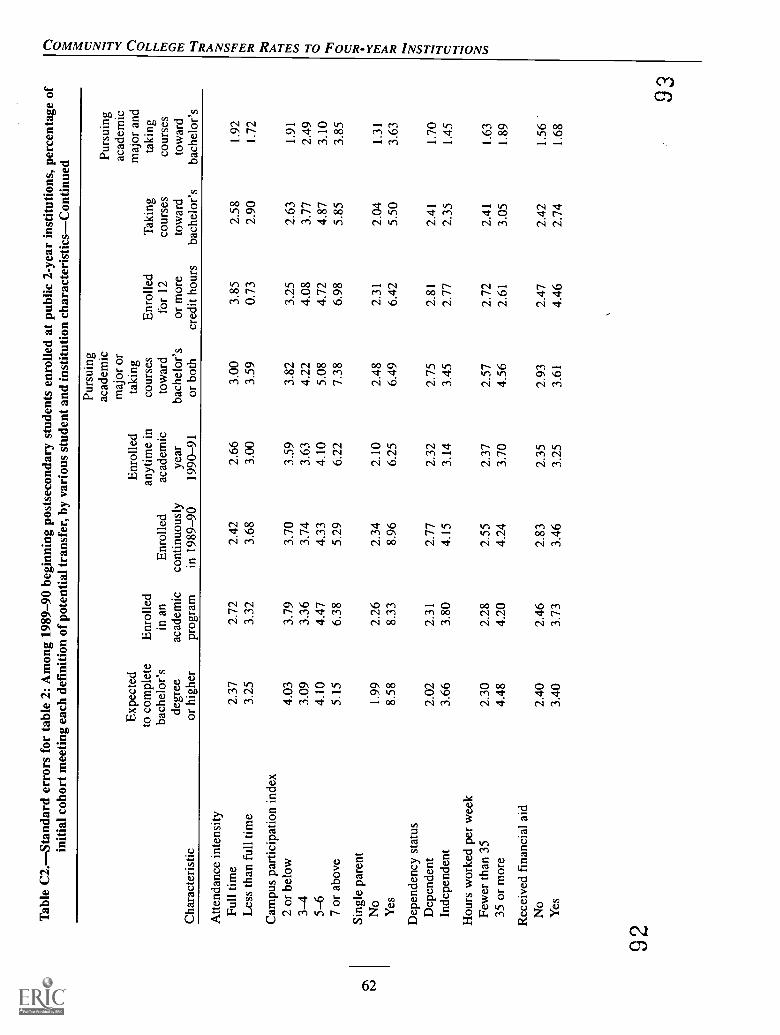
Tab
le C
2.-S
tand
ard
erro
rs f
or ta
ble
2: A
mon
g 19
89-9
0 be
ginn
ing
post
seco
ndar
y st
uden
ts e
nrol
led
atpu
blic
2-y
ear
inst
itutio
ns, p
erce
ntag
e of
initi
al c
ohor
t mee
ting
each
def
initi
on o
f po
tent
ial t
rans
fer,
by
vari
ous
stud
ent a
nd in
stitu
tion
char
acte
rist
ics-
Con
tinue
d
Cha
ract
eris
tic
Purs
uing
acad
emic
Purs
uing
maj
or o
rac
adem
icE
xpec
ted
Enr
olle
dta
king
maj
or a
ndto
com
plet
eE
nrol
led
anyt
ime
inco
urse
sE
nrol
led
Tak
ing
taki
ngba
chel
or's
in a
nE
nrol
led
acad
emic
tow
ard
for
12co
urse
sco
urse
sde
gree
acad
emic
cont
inuo
usly
year
bach
elor
'sor
mor
eto
war
dto
war
dor
hig
her
prog
ram
in 1
989-
9019
90-9
1or
bot
hcr
edit
hour
sba
chel
or's
bach
elor
's
Atte
ndan
ce in
tens
ityFu
ll tim
e2.
372.
722.
422.
663.
003.
852.
581.
92L
ess
than
ful
l tim
e3.
253.
323.
683.
003.
590.
732.
901.
72
Cam
pus
part
icip
atio
n in
dex
2 or
bel
ow4.
033.
793.
703.
593.
823.
252.
631.
913-
43.
093.
363.
743.
634.
224.
083.
772.
495-
64.
104.
474.
334.
105.
084.
724.
873.
107
or a
bove
5.15
6.38
5.29
6.22
7.38
6.98
5.85
3.85
Sing
le p
aren
tN
o1.
992.
262.
342.
102.
482.
312.
041.
31Y
es8.
588.
338.
966.
256.
496.
425.
503.
63
Dep
ende
ncy
stat
usD
epen
dent
2.02
2.31
2.77
2.32
2.75
2.81
2.41
1.70
Inde
pend
ent
3.66
3.80
4.15
3.14
3.45
2.77
2.35
1.45
Hou
rs w
orke
d pe
r w
eek
Few
er th
an 3
52.
302.
282.
552.
372.
572.
722.
411.
6335
or
mor
e4.
484.
204.
243.
704.
562.
613.
051.
89
Rec
eive
d fi
nanc
ial a
idN
o2.
402.
462.
832.
352.
932.
472.
421.
56Y
es3.
403.
733.
463.
253.
614.
462.
741.
68
9293

Tab
le C
2.-S
tand
ard
erro
rs f
or ta
ble
2: A
mon
g 19
89-9
0 be
ginn
ing
post
seco
ndar
y st
uden
tsen
rolle
d at
pub
lic 2
-yea
r in
stitu
tions
, per
cent
age
ofin
itial
coh
ort m
eetin
g ea
ch d
efin
ition
of
pote
ntia
l tra
nsfe
r, b
y va
riou
s st
uden
t and
inst
itutio
n ch
arac
teri
stic
s-C
ontin
ued
Cha
ract
eris
tic
Purs
uing
acad
emic
Purs
uing
maj
or o
rac
adem
ic
Exp
ecte
dE
nrol
led
taki
ngm
ajor
and
to c
ompl
ete
Enr
olle
dan
ytim
e in
cour
ses
Enr
olle
dT
akin
gta
king
bach
elor
'sin
an
Enr
olle
dac
adem
icto
war
dfo
r 12
cour
ses
cour
ses
degr
eeac
adem
icco
ntin
uous
lyye
arba
chel
or's
or m
ore
tow
ard
tow
ard
or h
ighe
rpr
ogra
min
198
9-90
1990
-91
or b
oth
cred
it ho
urs
bach
elor
'sba
chel
or's
Rat
io o
f ai
d to
pri
ce*
No
aid
2.41
2.42
2.83
2.35
2.92
2.50
2.44
1.57
1-33
per
cent
4.58
4.66
4.62
4.11
4.78
5.57
3.48
2.41
34-6
7 pe
rcen
t5.
676.
936.
846.
418.
006.
976.
703.
65
68-1
00 p
erce
nt6.
737.
976.
417.
067.
058.
193.
873.
16
tNot
app
licab
le.
- T
oo f
ew c
ases
for
a r
elia
ble
estim
ate.
*Pri
ce a
djus
ted
for
atte
ndan
ce in
tens
ity. S
ee th
e gl
ossa
ry (
appe
ndix
A)
for
deta
ils.
NO
TE
: Unl
ess
othe
rwis
e sp
ecif
ied,
var
iabl
es a
re a
s of
198
9-90
(ba
se y
ear
inte
rvie
w, f
irst
term
of
post
seco
ndar
yen
rollm
ent)
.
SOU
RC
E: U
.S. D
epar
tmen
t of
Edu
catio
n, N
atio
nal C
ente
r fo
r E
duca
tion
Stat
istic
s, 1
989-
90 B
egin
ning
Pos
tsec
onda
rySt
uden
ts L
ongi
tudi
nal S
tudy
(B
PS:I
990/
1994
),
Dat
a A
naly
sis
Syst
em.
95
94

COMMUNITY COLLEGE TRANSFER RATES TO FOUR-YEAR INSTITUTIONS
Table C3.-Standard errors for table 3: Among 1989-90 beginning postsecondary students enrolled at public 2-yearinstitutions, percentage who transferred to 4-year institutions by spring 1994, for various definitions ofpotential transfer
Potential transfer definitionFirst transferred
to 4-yearEver transferred
to 4-year
All students 1.73 1.80
Expected to complete bachelor's degree or higher 2.23 2.29Students not meeting this definition 1.36 1.63
Enrolled in an academic program 2.46 2.48Students not meeting this definition 2.00 2.07
Enrolled continuously in 1989-90 2.40 2.50Students not meeting this definition 2.51 2.73
Enrolled anytime in academic year 1990-91 2.43 2.45Students not meeting this definition 1.21 1.31
Pursuing academic major or taking courses toward bachelor's or both 3.31 3.23Students not meeting this definition 1.94 2.06
Enrolled for 12 or more credit hours 3.11 3.23Students not meeting this definition 1.88 2.05
Taking courses toward bachelor's 4.00 4.04Students not meeting this definition 1.72 1.81
Pursuing academic major and taking courses toward bachelor's 7.39 7.18Students not meeting this definition 1.99 2.07
NOTE: Unless otherwise specified, variables are as of 1989-90 (base year interview, first term of postsecondary enrollment).
SOURCE: U.S. Department of Education, National Center for Education Statistics, 1989-90 Beginning Postsecondary Students.Longitudinal Study (BPS:1990/1994), Data Analysis System.
64 95

APPENDIX CSUPPLEMENTAL AND STANDARD ERROR TABLES
Table C4.Estimates and standard errors for figure 4: Among 1989-90 beginning postsecondary students enrolledat public 2-year institutions who transferred to 4-year institutions by spring 1994, the percentage whomet the various definitions of potential transfer
Potential transfer definition
Percentage oftransfer students
with characteristic Standard error
Expected to complete bachelor's degree or higher 94.9 1.73
Enrolled in an academic program 88.7 2.41
Enrolled continuously in 1989-90 84.4 3.54
Enrolled anytime in academic year 1990-91 92:8 2.00
Pursuing academic major or taking courses toward bachelor's or both 68.5 3.62
Enrolled for 12 or more credit hours 55.2 4.27
Taking courses toward bachelor's 43.5 3.59
Pursuing academic major and taking courses toward bachelor's 20.5 3.12
NOTE: Unless otherwise specified, variables are as of 1989-90 (base year interview, first term of postsecondary enrollment).
SOURCE: U.S. Department of Education, National Center for Education Statistics, 1989-90 Beginning Postsecondary Students
Longitudinal Study (BPS:1990/1994), Data Analysis System.
659 7

Tab
le C
5. -
Am
ong
1989
-90
begi
nnin
g po
stse
cond
ary
stud
ents
enr
olle
d at
publ
ic 2
-yea
r in
stitu
tions
, per
cent
age
who
tran
sfer
red
to 4
-yea
r in
stitu
tions
by s
prin
g 19
94, b
y st
uden
t cha
ract
eris
tics
and
for
vari
ous
defi
nitio
ns o
f po
tent
ial t
rans
fer
Cha
ract
eris
tic
Purs
uing
acad
emic
Purs
uing
maj
or o
rac
adem
icE
xpec
ted
Enr
olle
dta
king
maj
or a
ndto
com
plet
eE
nrol
led
anyt
ime
inco
urse
sE
nrol
led
Tak
ing
taki
ngba
chel
or's
in a
nE
nrol
led
acad
emic
tow
ard
for
12co
urse
sco
urse
sA
llde
gree
acad
emic
cont
inuo
usly
year
bach
elor
'sor
mor
eto
war
dto
war
dst
uden
tsor
hig
her
prog
ram
in 1
989-
9019
90-9
1or
bot
hcr
edit
hour
sba
chel
or's
bach
elor
's
Age 18
or
belo
w38
.947
.446
.149
.648
.848
.951
.747
.755
.619
thro
ugh
2121
.528
.428
.629
.331
.836
.723
.242
.522
or
abov
e7.
715
.915
.813
.416
.230
.113
.5
Soci
oeco
nom
ic q
uart
ileL
owes
t qua
rtile
10.2
21.0
27.0
20.0
18.9
29.9
13.2
Low
er m
iddl
e14
.220
.922
.122
.325
.743
.427
.4U
pper
mid
dle
27.1
35.7
33.9
38.1
37.5
34.4
38.5
35.0
Hig
hest
qua
rtile
40.6
48.6
46.3
48.4
51.4
52.5
52.8
55.4
71.4
CIN ON
Firs
t-ge
nera
tion
colle
ge s
tatu
sFi
rst g
ener
atio
n19
.131
.933
.430
.129
.342
.130
.144
.0N
ot f
irst
gen
erat
ion
34.6
41.4
39.0
43.7
46.9
45.8
48.8
47.2
54.1
Rac
e/et
hnic
ityW
hite
, non
-His
pani
c26
.338
.338
.037
.639
.348
.640
.451
.764
.1B
lack
, non
-His
pani
c15
.815
.9-
--
--
His
pani
c24
.934
.129
.334
.232
.2-
-A
sian
/Pac
ific
Isl
ande
r-
--
--
--
--
Am
eric
an I
ndia
n/A
lask
an N
ativ
e-
--
--
--
Reg
ion
of in
stitu
tion
Nor
thea
st20
.227
.727
.930
.631
.332
.029
.2M
idw
est
27.1
42.8
43.3
37.3
43.1
53.2
42.3
47.7
Sout
h28
.639
.741
.043
.240
.848
.247
.052
.2W
est
24.7
32.7
31.2
33.3
35.2
39.6
38.9
39.4
44.7
98
S3

Tab
le C
5. A
mon
g 19
89-9
0 be
ginn
ing
post
seco
ndar
y st
uden
ts e
nrol
led
at p
ublic
2-y
ear
inst
itutio
ns, p
erce
ntag
e w
ho tr
ansf
erre
d to
4-y
ear
inst
itutio
ns
by s
prin
g 19
94, b
y st
uden
t cha
ract
eris
tics
and
for
vari
ous
of p
oten
tial t
rans
ferC
ontin
ued
Cha
ract
eris
tic
Exp
ecte
dto
com
plet
eE
nrol
led
bach
elor
'sin
an
All
degr
eeac
adem
icst
uden
tsor
hig
her
prog
ram
Gen
der
Mal
e26
.136
.335
.0
Fem
ale
24.7
35.1
36.4
Enr
olle
d
Purs
uing
acad
emic
maj
or o
rta
king
Purs
uing
acad
emic
maj
or a
ndan
ytim
e in
cour
ses
Enr
olle
dT
akin
gta
king
Enr
olle
dac
adem
icto
war
dfo
r 12
cour
ses
cour
ses
cont
inuo
usly
year
bach
elor
'sor
mor
eto
war
dto
war
din
198
9-90
1990
-91
or b
oth
cred
it ho
urs
bach
elor
'sba
chel
or's
35.3
39.3
39.3
37.0
41.0
50.3
37.7
36.2
47.4
42.4
50.3
Too
few
cas
es f
or a
rel
iabl
e es
timat
e.
NO
TE
: Unl
ess
othe
rwis
e sp
ecif
ied,
var
iabl
es a
re a
s of
198
9-90
(ba
se y
ear
inte
rvie
w,
firs
t ter
m o
f po
stse
cond
ary
enro
llmen
t).
SOU
RC
E: U
.S. D
epar
tmen
t of
Edu
catio
n, N
atio
nal C
ente
r fo
r E
duca
tion
Stat
istic
s,19
89-9
0 B
egin
ning
Pos
tsec
onda
ry S
tude
nts
Lon
gitu
dina
l Stu
dy (
BPS
:199
0/19
94),
Dat
a A
naly
sis
Syst
em.
100
101

Tab
le C
6.-S
tand
ard
erro
rs f
or ta
ble
C5:
Am
ong
1989
-90
begi
nnin
g po
stse
cond
ary
stud
ents
enr
olle
d at
pub
lic 2
-yea
r in
stitu
tions
, per
cent
age
who
r) 0tr
ansf
erre
d to
4-y
ear
inst
itutio
ns b
y sp
ring
199
4,by
stu
dent
cha
ract
eris
tics
and
for
vari
ous
defi
nitio
ns o
f po
tent
ial t
rans
fer
Exp
ecte
dto
com
plet
eE
nrol
led
bach
elor
'sin
an
All
degr
eeac
adem
icC
hara
cter
istic
stud
ents
or h
ighe
rpr
ogra
m
Age
Enr
olle
d
Purs
uing
acad
emic
maj
or o
rta
king
Purs
uing
acad
emic
maj
or a
ndan
ytim
e in
cour
ses
Enr
olle
dT
akin
gta
king
Enr
olle
dac
adem
icto
war
dfo
r 12
cour
ses
cour
ses
cont
inuo
usly
year
bach
elor
'sor
mor
eto
war
dto
war
din
198
9-90
1990
-91
or b
oth
cred
it ho
urs
bach
elor
'sba
chel
or's
18 o
r be
low
3.02
3.35
3.74
3.39
3.49
4.24
3.87
19 th
roug
h 21
3.24
4.03
4.36
4.72
5.04
6.03
5.05
22 o
r ab
ove
2.15
4.37
4.65
3.68
4.20
9.08
7.08
Soci
oeco
nom
ic q
uart
ileL
owes
t qua
rtile
2.44
4.85
6.21
4.89
4.57
7.85
5.09
Low
er m
iddl
e2.
844.
354.
294.
584.
748.
268.
38U
pper
mid
dle
2.95
4.00
4.10
4.11
3.98
5.07
5.47
Hig
hest
qua
rtile
3.50
4.08
3.90
4.29
4.10
4.98
4.96
00Fi
rst-
gene
ratio
n co
llege
sta
tus
Firs
t gen
erat
ion
2.41
3.64
4.14
3.69
3.73
5.02
5.41
Not
fir
st g
ener
atio
n2.
793.
433.
533.
483.
554.
544.
29
Rac
e/et
hnic
ityW
hite
, non
-His
pani
c2.
042.
632.
892.
792.
713.
653.
79B
lack
, non
-His
pani
c4.
425.
03-
His
pani
c5.
136.
946.
487.
555.
95A
sian
/Pac
ific
Isl
ande
r-
-A
mer
ican
Ind
ian/
., -
Ala
skan
Nat
ive
-R
egio
n of
inst
itutio
nN
orth
east
3.82
4.74
5.21
6.55
5.13
6.25
5.29
Mid
wes
t4.
615.
495.
835.
055.
546.
838.
13So
uth
3.63
4.60
4.87
4.66
4.70
7.71
5.28
Wes
t3.
534.
454.
944.
775.
085.
326.
90
102
Z ;=:,
...i
.< czn t t Ztzi
cis a cA
5.19
9.37
NI
7.37
% % a i rti i
-'"
't,6.
540
5.86
8.24
,.< NI a
6.24
%
5.27
8.83
'*.l
--i
..... i
4.27
8.14
c ,-i 0
-c)
- - 7.42
9.41
7.10
10.6
5
3

Tab
le C
6.St
anda
rd e
rror
s fo
r ta
ble
C5:
Am
ong
1989
-90
begi
nnin
g po
stse
cond
ary
stud
ents
enr
olle
d at
pub
lic 2
-yea
rin
stitu
tions
, per
cent
age
who
_
tran
sfer
red
to 4
-yea
r in
stitu
tions
by
spri
ng 1
994,
by
stud
ent
char
acte
rist
ics
and
for
vari
ous
defi
nitio
ns o
f po
tent
ialt
rans
ferC
ontin
ued
Purs
uing
acad
emic
Purs
uing
maj
or o
rac
adem
ic
Exp
ecte
dE
nrol
led
taki
ng.
maj
or a
nd
to c
ompl
ete
Enr
olle
dan
ytim
e in
cour
ses
Enr
olle
dT
akin
gta
king
bach
elor
'sin
an
Enr
olle
dac
adem
icto
war
dfo
r 12
cour
ses
cour
ses
All
degr
eeac
adem
icco
ntin
uous
lyye
arba
chel
or's
or m
ore
tow
ard
tow
ard
Cha
ract
eris
ticst
uden
tsor
hig
her
prog
ram
in 1
989-
9019
90-9
1or
bot
hcr
edit
hour
sba
chel
or's
bach
elor
's
Gen
der
Mal
e2.
693.
323.
793.
843.
804.
414.
475.
519.
71
Fem
ale
2.27
3.01
3.19
3.13
2.90
4.49
4.24
6.11
Too
few
cas
es f
or a
rel
iabl
e es
timat
e.N
OT
E: U
nles
s ot
herw
ise
spec
ifie
d, v
aria
bles
are
as
of 1
989-
90 (
base
yea
rint
ervi
ew, f
irst
term
of
post
seco
ndar
y en
rollm
ent)
.
SOU
RC
E: U
.S. D
epar
tmen
t of
Edu
catio
n, N
atio
nal C
ente
r fo
rE
duca
tion
Stat
istic
s, 1
989-
90 B
egin
ning
Pos
tsec
onda
ry S
tude
nts
Lon
gitu
dina
l Stu
dy(B
PS:1
990/
1994
),
Dat
a A
naly
sis
Syst
em.
105
104

Tab
le C
7.Pe
rcen
tage
of
1989
-90
begi
nnin
g po
stse
cond
ary
stud
ents
enr
olle
d at
pub
lic2-
year
inst
itutio
ns m
eetin
g ea
ch d
efin
ition
of
pote
ntia
ltr
ansf
er, b
y w
heth
er th
ey m
et le
ss r
estr
ictiv
e de
fini
tions
Exp
ecte
dE
nrol
led
Purs
uing
acad
emic
maj
or o
rta
king
to c
ompl
ete
Enr
olle
dan
ytim
e in
cour
ses
Enr
olle
dT
akin
gba
chel
or's
in a
nE
nrol
led
acad
emic
tow
ard
for
12co
urse
sde
gree
acad
emic
cont
inuo
usly
year
bach
elor
'sor
mor
eto
war
dPo
tent
ial t
rans
fer
defi
nitio
nor
hig
her
prog
ram
in 1
989-
9019
90-9
1or
bot
hcr
edit
hour
sba
chel
or's
Enr
olle
d in
an
acad
emic
prog
ram
81.7
Enr
olle
d co
ntin
uous
ly in
198
9-90
78.6
70.8
Enr
olle
d an
ytim
e in
aca
dem
icye
ar 1
990-
9176
.373
.273
.4
Purs
uing
aca
dem
ic m
ajor
or
taki
ng c
ours
esto
war
d ba
chel
or's
or
both
89.1
88.5
75.7
81.7
Enr
olle
d fo
r 12
or
mor
e cr
edit
hour
s80
.473
.782
.575
.052
.2T
akin
g co
urse
s to
war
d ba
chel
or's
94.3
91.3
69.0
78.9
100.
045
.1Pu
rsui
ng a
cade
mic
maj
or a
nd ta
king
cou
rses
tow
ard
bach
elor
's98
.193
.884
.787
.910
0.0
51.9
100.
0
NO
TE
: Unl
ess
othe
rwis
e sp
ecif
ied,
var
iabl
es a
re a
s of
198
9-90
(bas
e ye
ar in
terv
iew
, fir
st te
rm o
f po
stse
cond
ary
enro
llmen
t). T
able
rea
ds:
Am
ong
publ
ic 2
-yea
r st
uden
tsw
ho in
dica
ted
that
they
wer
e en
rolle
d in
an
acad
emic
prog
ram
, 81.
7 pe
rcen
t ind
icat
ed th
at th
ey e
xpec
ted
to e
arn
a ba
chel
or's
deg
ree
or h
ighe
r.SO
UR
CE
: U.S
. Dep
artm
ent o
f E
duca
tion,
Nat
iona
l Cen
ter
for
Edu
catio
nSt
atis
tics,
198
9-90
Beg
inni
ng P
osts
econ
dary
Stu
dent
s L
ongi
tudi
nal
Stud
y (B
PS:1
990/
1994
),D
ata
Ana
lysi
s Sy
stem
.
107

Tab
le C
8.St
anda
rd e
rror
s fo
r ta
ble
C7:
Per
cent
age
of 1
989-
90 b
egin
ning
pos
tsec
onda
ry s
tude
nts
enro
lled
at p
ublic
2-y
eari
nstit
utio
ns m
eetin
gea
ch d
efin
ition
of
pote
ntia
l tra
nsfe
r, b
y w
heth
er th
ey m
et le
ss r
estr
ictiv
e de
fini
tions
Pote
ntia
l tra
nsfe
r de
fini
tion
Exp
ecte
dto
com
plet
eE
nrol
led
bach
elor
'sin
an
degr
eeac
adem
icor
hig
her
prog
ram
Enr
olle
d in
an
acad
emic
pro
gram
Enr
olle
d co
ntin
uous
ly in
198
9-90
Enr
olle
d an
ytim
e in
aca
dem
ic y
ear
1990
-91
Purs
uing
aca
dem
ic m
ajor
or
taki
ng c
ours
esto
war
d ba
chel
or's
or
both
Enr
olle
d fo
r 12
or
mor
e cr
edit
hour
s
Tak
ing
cour
ses
tow
ard
bach
elor
's
Purs
uing
aca
dem
ic m
ajor
and
taki
ng c
ours
esto
war
d ba
chel
or's
Enr
olle
d
Purs
uing
acad
emic
maj
or o
rta
king
anyt
ime
inco
urse
sE
nrol
led
Tak
ing
Enr
olle
dac
adem
icto
war
dfo
r 12
cour
ses
cont
inuo
usly
year
bach
elor
'sor
mor
eto
war
din
198
9-90
1990
-91
or b
oth
cred
it ho
urs
bach
elor
's
2.12
2.24
2.17
2.31
2.76
1.87
1.85
2.46
2.52
2.33
3.00
3.06
3.09
3.01
3.8
2.55
5.20
5.77
2.45
3.10
3.37
4.30
3.37
0.00
0.01
4.41
6.79
0.01
NO
TE
: Unl
ess
othe
rwis
e sp
ecif
ied,
var
iabl
es a
re a
s of
198
9-90
(ba
se y
ear
inte
rvie
w, f
irst
term
of
post
seco
ndar
y en
rollm
ent)
.
SOU
RC
E: U
.S. D
epar
tmen
t of
Edu
catio
n, N
atio
nal C
ente
r fo
r E
duca
tion
Stat
istic
s, 1
989-
90 B
egin
ning
Pos
tsec
onda
ry S
tude
nts
Lon
gitu
dina
l Stu
dy(B
PS:I
990/
1994
),
Dat
a A
naly
sis
Syst
em.
109
108

United StatesDepartment of Education
ED Pubs8242B Sandy Court
Jessup, MD 20794-1398
Official BusinessPenalty for Private Use, $300
110
PRESORTED STANDARDPostage and Fees Paid
U.S. Department of EducationPermit No. G-17

U.S. Department of EducationOffice of Educational Research and Improvement (OERI)
National Library of Education (NLE)Educational Resources Information Center (ERIC)
NOTICE
Reproduction Basis
TM033196
ERIC
This document is covered by a signed "Reproduction Release(Blanket)" form (on file within the ERIC system), encompassing allor classes of documents from its source organization and, therefore,does not require a "Specific Document" Release form.
This document is Federally-funded, or carries its own permission toreproduce, or is otherwise in the public domain and, therefore, maybe reproduced by ERIC without a signed Reproduction Release form(either "Specific Document" or "Blanket").
EFF-089 (3/2000)