republic of turkey - european commissionec.europa.eu/economy_finance/international/enlargement/...vi...
TRANSCRIPT

REPUBLIC OF TURKEY
PRE-ACCESSION ECONOMIC PROGRAMME
2008
ANKARA April 2009


i
CONTENTS
1. OVERALL POLICY FRAMEWORK AND OBJECTIVES ...................................................................1 2. MACROECONOMIC OUTLOOK............................................................................................................3
2.1. Recent Economic Developments ............................................................................................................4 2.1.1. Real Sector......................................................................................................................................4 2.1.2. Inflation, Money and Exchange Rate Policies ................................................................................9 2.1.3. Financial Sector ............................................................................................................................13 2.1.4. Balance of Payments.....................................................................................................................14
2.2. Medium Term Macroeconomic Scenario .............................................................................................20 2.2.1. Real Sector....................................................................................................................................20 2.2.2. Inflation, Money and Exchange Rate Policies ..............................................................................28 2.2.3. Balance of Payments.....................................................................................................................28 2.2.4. Main Risks in Projections .............................................................................................................30
3. PUBLIC FINANCES .................................................................................................................................31 3.1. General Government Balance and Public Debt ....................................................................................31
3.1.1. Fiscal Policy Strategy and Medium Term Objectives...................................................................31 3.1.2. Current Situation and Medium Term Perspective.........................................................................32 3.1.3. Structural and Cyclical Central Government Budget Balance......................................................39 3.1.4. Public Debt Management..............................................................................................................41 3.1.5. Budgetary Implications of Major Structural Reforms ..................................................................49
3.2. Sensitivity Analysis ..............................................................................................................................50 3.3. Public Finance Risks ............................................................................................................................51 3.4. Quality of Public Finances ...................................................................................................................51 3.5. Institutional Features of Public Finances..............................................................................................52
4. STRUCTURAL REFORMS .....................................................................................................................55 4.1. Enterprise Sector ..................................................................................................................................55
4.1.1. Privatization..................................................................................................................................55 4.1.2. Competition Law and Policies ......................................................................................................56 4.1.3. Improvement of the Investment Environment ..............................................................................57 4.1.4. Utilities and Network Industries ...................................................................................................58
4. 2. Financial Sector ...................................................................................................................................61 4.2.1. Banking Sector..............................................................................................................................61 4.2.2. Capital Market ..............................................................................................................................62 4.2.3. Insurance Sector............................................................................................................................64
4.3. Labor Market ........................................................................................................................................64 4.4. Agriculture Sector.................................................................................................................................69 4.5. Administrative Reform.........................................................................................................................74 4.6. Other Reform Areas..............................................................................................................................75
4.6.1. Regional Development .................................................................................................................75 4.6.2. Health and Social Security Reform...............................................................................................77 4.6.3. R&D and Innovation.....................................................................................................................80 4.6.4. Information and Communication Technologies............................................................................81 4.6.5. Transportation...............................................................................................................................83 4.6.6. Energy...........................................................................................................................................86
ANNEX TABLES...........................................................................................................................................91

ii
TABLES
Table 2. 1: Growth Rates and Demand Components .........................................................................................4 Table 2. 2: Developments in the Labor Market..................................................................................................8 Table 2. 3: Inflation Targets .............................................................................................................................11 Table 2. 4: Monetary Policy Decisions ............................................................................................................12 Table 2. 5: FX Market Interventions and Auctions of the Central Bank..........................................................13 Table 2. 6: Overview of the Banking Sector ....................................................................................................14 Table 2. 7: Balance of Payments ......................................................................................................................15 Table 2. 8: Foreign Trade by Classification of Broad Economic Categories (BEC)........................................16 Table 2. 9: Foreign Trade by Countries............................................................................................................16 Table 2. 10: Demand Components of Growth..................................................................................................21 Table 2. 11: Savings-Investment Balance ........................................................................................................23 Table 2. 12: Value-Added by Sectors...............................................................................................................25 Table 2. 13: Increases in Production Factors....................................................................................................25 Table 2. 14: Developments in the Labor Market..............................................................................................27 Table 2. 15: Inflation Targets ...........................................................................................................................28 Table 2. 16: Balance of Payments Forecasts ....................................................................................................30 Table 3. 1: Central Government Budget Balance.............................................................................................34 Table 3. 2: Revenues and Expenditures of General Government - 1 ...............................................................36 Table 3. 3: Revenues and Expenditures of General Government - 2 ...............................................................39 Table 3. 4: General Government Debt Stock ...................................................................................................42 Table 3. 5: Central Government Gross Debt Stock ..........................................................................................43 Table 3. 6: Central Government Debt Stock Composition by Instruments ......................................................43 Table 3. 7: Domestic Debt Stock by Lenders...................................................................................................44 Table 3. 8: Maturity Structure of Central Government Domestic Debt Stock .................................................44 Table 3. 9: Time Remaining to Maturity of the Central Government’s External Debt ....................................45 Table 3. 10: General Government External Debt Stock ...................................................................................46 Table 3. 11: Treasury Guaranteed External Debt Service Projections .............................................................48 Table 3. 12: Public Debt Stock Projections......................................................................................................49 Table 3. 13: Secondary and Tertiary Legislation List of Law No.5018 ...........................................................52 Table 4. 1: Privatization Transactions Completed During the Period of November 2007-December 2008.....55 Table 4. 2: Standard Reference Interconnection Charge Tariffs ......................................................................60 Table 4. 3: Market Shares ................................................................................................................................60 Table 4. 4: Share of Age Groups in Total Population ......................................................................................64 Table 4. 5: Basic Employment and Labor Indicators .......................................................................................65 Table 4. 6: Trends in Gross Schooling Rates ...................................................................................................66 Table 4. 7: Education Level of the Labor Force in 2007..................................................................................66 Table 4. 8: Matrix of Policy Commitments: Labor Market..............................................................................69 Table 4. 9: Matrix of Policy Commitments: Agriculture - I (Main Developments in Agriculture Support)...........73 Table 4. 10: Matrix of Policy Commitments: Agriculture – II (Important Projects in Agriculture) ................73 Table 4. 11: Matrix of Policy Commitments: Regional Development .............................................................76 Table 4. 12: Matrix of Policy Commitments: Health Care-Social Security .....................................................79 Table 4. 13: Matrix of Policy Commitments: Transportation ..........................................................................85 Table 4. 14: Legislative Acts for Energy Market in 2008 ................................................................................88 Table 4. 15: Matrix of Policy Commitments: Energy...........................................................................................89

iii
FIGURES Figure 2. 1: Industrial Production and Capacity Utilization...............................................................................7 Figure 2. 2: CPI Targets and Realizations..........................................................................................................9 Figure 2. 3: CPI and Core CPI .........................................................................................................................10 Figure 2. 4: GDP Growth .................................................................................................................................22 Figure 2. 5: Contributions to GDP Growth ......................................................................................................23 Figure 2. 6: Composition of Production by Sectors .........................................................................................24 Figure 2. 7: Output Gap....................................................................................................................................26 Figure 3. 1: Actual and Structural Primary Budget Balances...........................................................................40 Figure 3. 2: Actual and Structural Budget Balances ........................................................................................40 Figure 3. 3: Cyclical Budget Balances .............................................................................................................41 Figure 3. 4: Average Maturity and Cost of Treasury’s Borrowing ..................................................................46 Figure 3. 5: Sustainability Scenarios ................................................................................................................50

iv
BOXES
Box 2. 1: Revised National Accounts.................................................................................................................6 Box 2. 2: The Non-Banking Sector’s Foreign Currency Indebtedness ............................................................18 Box 3. 1: Measures Taken for the Global Financial Crisis and their Estimated Fiscal Costs ..........................35 Box 3. 2: Fight Against Informal Economy .....................................................................................................38

v
ABBREVIATIONS
ADSL Asymmetric Digital Subscribers Line AIS Automatic Identification System APL Applicable Program Loan ARIP Agricultural Reform Implementation Project BAĞ-KUR Social Security Organization of the Self-Employed
BASEL-II International Recommendations on Banking Laws and Regulations Issued by Basel Committee on Banking Supervision
BELDES Project for Supporting Infrastructure of Municipalities BO Build-Operate BOT Build-Operate-Transfer BOTAŞ Petroleum Pipeline Corporation BRSA Banking Regulation and Supervision Agency CBRT Central Bank of the Republic of Turkey CMB Capital Markets Board CPI Consumer Price Index CRD Capital Requirements Directive of EU DHMİ State Airports Authority of Turkey DIS Direct Income Support DOKAP Eastern Blacksea Development Programme ECB European Central Bank EMRA Energy Market Regulatory Authority ESA 95 European System of Accounts 1995 EU-15 The EU Member Countries Before Enlargement on May 1, 2004. EU-25 The EU Member Countries After Enlargement on May 1, 2004. EU-27 The EU Member Countries After Enlargement on January 1, 2007. EUROSTAT European Union Statistics Office FED The Federal Reserve, The Central Bank of USA GAP Southeastern Anatolian Project GDBI Government Domestic Borrowing Instrument GDP Gross Domestic Product GNP Gross National Product GSM Global System for Mobile Communications HIA Household Labor Survey HPC High Planning Council IACS Integrated Administration and Control System IDKK Internal Audit Coordination Board ILO International Labor Organization IMF International Monetary Fund IPA Instrument for Pre-Accession Assistance IPARD IPA Rural Development Funds ISE İstanbul Stock Exchange IT Information Technology İŞKUR Turkish Employment Organization KOSGEB Small and Medium Industry Development Organization KÖY-DES Project for Supporting Infrastructure of Villages LPG Liquefied Petroleum Gas MEB Ministry of National Education MEDA Euro-Mediterranean Partnership MLSS Ministry of Labor and Social Security NAIRU Non Accelerating Inflation Rate of Unemployment OECD Organization for Economic Co-operation and Development PA Privatization Administration

vi
PEP Pre-Accession Economic Programme PETKİM Petrochemical Corporation PHARE Poland and Hungary: Action for the Restructuring of the Economy PPI Producer Price Index PSSP Privatization Social Support Project QIS Quantitative Impact Study R&D Research and Development RIA Regulatory Impact Analysis SARUT Standard Interconnection Reference Fee Tariffs SCT Special Consumption Tax SDIF Savings Deposit Insurance Fund SDR Special Drawing Right SEEs State Economic Enterprises SMEs Small and Medium Sized Enterprises SPO State Planning Organization SSI Social Security Institutions SSK Social Insurance Institution TBMM Turkish Grand National Assembly (TGNA) TCDD Turkish State Railways TEDAŞ Turkish Electricity Distribution Company TEİAŞ Turkish Electricity Transmission Company TEKEL General Directorate of Tobacco, Tobacco Products, Salt and Alcohol Enterprises TETAŞ Turkish Electricity Trading and Contracting Company Inc. TFP Total Factor Productivity TINA Transport Infrastructure Needs Assessment TL Turkish Lira TR31 İzmir Province TR52 Karaman and Konya Provinces TR62 Adana and Mersin Provinces TR72 Kayseri, Sivas and Yozgat Provinces TR82 Çankırı, Kastamonu and Sinop Provinces TR83 Amasya, Çorum, Samsun and Tokat Provinces TR90 Artvin, Giresun, Gümüşhane, Ordu, Rize and Trabzon Provinces TRA1 Bayburt, Erzincan and Erzurum Provinces TRA2 Ağrı, Ardahan, Iğdır and Kars Provinces TRB1 Bingöl, Elazığ, Malatya and Tunceli Provinces TURKSTAT Turkish Statistical Institute TÜBİTAK Scientific and Technological Research Council of Turkey UCTE Union for the Coordination of Transmission of Electricity UKKS National Rural Development Strategy VAT Value Added Tax VEDOP Tax Office Full Automation Project YOİKK Coordination Council for the Improvement for the Investment Environment YÖK Higher Education Council

Overall Policy Framework And Objectives
1
1. OVERALL POLICY FRAMEWORK AND OBJECTIVES
Turkey has prepared the Pre-Accession Economic Programme (PEP) and has submitted to the European Commission since 2001, responding to the request of the Economic and Financial Affairs Council (ECOFIN Council) dated 26/27 November 2000. The 2008 PEP covering the 2009-2011 period is the eighth program that has been prepared under the coordination of the Undersecretariat of State Planning Organization1 with the contributions of relevant ministries and institutions. The 2008 PEP has been adopted by the decision of the High Planning Council2 No 2009/7.
In the 2008 Progress Report, the European Commission has assessed that Turkey broadly implemented the economic policies agreed with the Commission and with the International Monetary Fund (IMF) and successfully completed the stand-by arrangement with IMF in May 2008. In addition, it was denoted that consensus on economic policy essentials has been maintained and coordination has improved.
The priorities of economic policy have been stated in the 2008 National Programme3 adopted on December 31, 2008. Harmonization with the Copenhagen Criteria and convergence towards Maastricht Criteria constitute the main perspective in designing economic policies in the EU accession process. Turkey has achieved a significant success by keeping the general government gross debt stock and deficit figures below the levels stated in Maastricht Criteria since 2004 and 2005, respectively. Sustaining this achievement and full harmonization with Maastricht Criteria is targeted for the medium term. In the scope of Copenhagen Criteria, strengthening market economy and increasing the competitive power of the economy are priority targets.
The 2008 Pre-Accession Economic Program was prepared in an environment in which global economic crisis that has initiated in financial markets of developed countries and spread to developing countries in time and that prolonged its negative effects on global economic activity has been experienced, uncertainties for forthcoming period have increased and it became difficult to make medium term forecasts at present. The crisis that caused uncertainty in global economy has negatively affected Turkish economy as well as all developed and developing economies; economic conjuncture in the middle of the year 2008 has turned out to be negative. The uncertainty environment of international financial crisis, the increasing economic recession in important trading partners, in parallel to significant downward revision of forward-looking growth expectations of these countries and shrinking of internal and external financial facilities are the main reasons of breakdown in economic conjuncture. In the light of these developments, it is envisaged that the contraction in the Turkish economy will continue in 2009 following the contraction in the last quarter of 2008. The economy will begin to recover starting from 2010 and will converge to its potential growth in 2011.
The general framework of stability oriented macroeconomic policies being implemented in the recent years will be maintained in the 2008 Pre-Accession Economic Programme period. In addition to these policies, the preferences and priorities related with the inflation-growth-employment were taken into consideration within the constraints of the needs of the economy and the restrictions of the global conjuncture. In this context, the basic objective of economic policies
1 The 2008 Pre-Accession Economic Programme was prepared under the coordination of the Undersecretariat of State Planning Organization (SPO) with the contributions of Ministry of Finance, Ministry of National Education, Ministry of Health, Ministry of Transport, Ministry of Agriculture and Rural Affairs, Ministry of Labor and Social Security, Ministry of Industry and Trade, Ministry of Energy and Natural Resources, Undersecretariat of Treasury, Undersecretariat of Foreign Trade, Central Bank of Republic of Turkey, Privatization Administration, Capital Markets Board of Turkey, Turkish Competition Authority, Banking Regulation and Supervision Agency, Savings Deposit Insurance Fund, Telecommunications Authority, Energy Market Regulatory Authority, Council of Higher Education, Revenue Administration, Social Security Institution and Turkish Employment Organization. 2 The High Planning Council is a board composed of the Prime Minister as chair and eight Ministers and the Undersecretary of the State Planning Organization. 3 It was promulgated on Official Gazette dated on December 31, 2008 and No.27097 (5. Record), as the Decision of Council of Ministers No. 2008/14481.

Overall Policy Framework And Objectives
2
to be implemented during the PEP period is to minimize negative effects of the global crisis on growth, to continue the disinflation policies, to create an environment conducive to economic growth through implementing fiscal and incomes policies in a way to contribute to macroeconomic stability.
The fiscal policy continued since early 2000s is based on yielding primary surplus to reduce the public debt stock in the middle term, supporting the establishment and sustainability of macroeconomic stability and contributing to anti-inflationary efforts. In the 2008 PEP period, it is aimed to implement a flexible finance policy and yielding reasonable amount of primary surplus in order to mitigate the effects of the global recession.
The basic objective of the monetary policy is to ensure price stability. The monetary policy will be implemented within the framework of explicit inflation targeting, also in the 2008 PEP period. The Central Bank will continue to use short term interest rates as the basic policy instrument. In the upcoming period, the Central Bank will focus on medium-term inflation outlook and set the monetary policy decisions in line with this outlook. In addition, the floating exchange rate regime will also be maintained in the 2008 PEP period. Foreign exchange rates will be determined by supply and demand conditions in the market as in the previous years, and the Central Bank will not set any target for exchange rates. However, the Central Bank may directly intervene in the foreign exchange market via FX buying or FX selling interventions on its own initiative, in order to prevent actual and potential excess volatility in the foreign exchange rates.
Structural reforms, which have been implemented with determination in the recent period, will also be continued in the 2009-2011 period. These structural reforms will serve to strengthen the market mechanism, increase competitiveness, reduce the share of the public sector in the economy through privatization, strengthen the functions of regulatory and supervisory agencies, develop the intermediary capacity of the financial sector to meet funding requirements needs of the enterprise sector, improve labor qualifications according to today’s conditions, strengthen the link between the labor market and the education system, improve the effectiveness of public services, eliminate the deficiencies in health and social security systems, increase R&D activities and innovative capacity, improve transportation and energy infrastructure, ensure regional development and increase productivity in agriculture. Taking the ongoing negative developments in world economy into account, the need of sustaining structural reforms decisively that is necessary for increasing the competitiveness of Turkey is of vital importance and is on agenda in this period.
The 2008 Pre-Accession Economic Programme consists of four main chapters. In the second chapter following the Overall Policy Framework and Objectives, recent economic developments in the Turkish economy are evaluated by considering the developments in the world economy, and then macroeconomic forecasts for the 2009-2011 period are presented. In the third chapter, fiscal policies for the 2008 PEP period are put forward together with forecasts and analyses regarding budget and debt management. Additionally, in this chapter the quality and institutional features of public finances are covered. In the fourth chapter, assessments on developments in structural reforms, budgetary impacts and reform agenda are included.
Macroeconomic Outlook
3
2. MACROECONOMIC OUTLOOK
The 2008 Pre-Accession Economic Program was prepared in an environment in which serious problems were experienced and uncertainties increased on the global economic outlook. It became more difficult to make short and medium term macroeconomic forecast in this environment. As a matter of fact, all international institutions needed to update their expectations and forecasts regarding the world economy and individual economies more frequently. Therefore, the assumptions used in the 2008 PEP preparations regarding the world economy have important uncertainties compared to the previous years.
With the global financial crisis, the world economy, which had high growth rates continuously in recent years, has entered into a slowdown starting from 2008. The growth rate of the world output, which was 5.2 percent in 2007, is expected to recede to 3.4 percent in 2008 and to 0.5 percent in 2009.4 Many developed countries have entered into a contraction period and growth rates of many developing countries have begun to slow down starting from the last quarter of 2008. This situation is expected to continue in 2009. Depending on the success of the measures and policies put into practice by many countries cooperatively, recovery in the world economy is expected to begin as of 2010.
The International Money Fund (IMF) envisages that the developed countries will contract by 2 percent and, with the expectation that China and India will continue to grow, developing countries will grow by 3.3 percent in 2009. EU countries, which grew by 0.9 percent in 2008, is expected to contract by 1.8 percent in 2009. Besides, international institutions claim that growth forecasts have downward risks. OECD Economic Outlook5, which is one of the most recent reports on the world economy, revised previous growth forecasts further down. The report forecasts that the US economy will contract by 4 percent, while the Euro Area will contract by 4.1 percent in 2009.
Analyzing the price developments, inflationist pressures arising as a result of the high increases in food and oil prices starting from the second half of 2007 were alleviated starting from the second half of 2008 in line with the slowdown that began in economic activities. In fact, oil prices, which rose to 137 dollars in July, receded to 41 dollars in December 2008. However, inflation in consumer prices in 2008 exceeded the inflation in 2007 as a result of the high commodity prices in the first half of 2008. As a matter of fact, the inflation in consumer prices, which was 2.2 percent in developed countries in 2007, increased to 3.3 percent in 2008. Similarly, inflation rate in developing countries increased to 9.1 percent in 2008 from 6.1 percent in 2007.
In the forthcoming period, the inflation is expected to decrease by the effect of the global slowdown. Price declines experienced in oil, food and commodity prices in recent months will contribute to this process. In this context, consumer prices are estimated to increase by 0.3 percent in developed countries and by 5.8 percent in developing countries in 2009.
Impacts of the negative developments experienced in the world economy have also been observed on the world trade volume. The revaluation of assets in the markets of developed countries causes the household wealth to decrease and thereby the domestic demand to contract. The demand contraction in developed countries threatens the economic activity in developing countries, which are linked to these markets through trade channel, seriously by reducing the export levels. In fact, IMF envisages a slowdown in the growth rate of the world trade volume and predicts that world trade growth, which was 7.2 percent in 2007, will be 4.1 percent in 2008 and trade will contract by 2.8 percent in 2009. On the other hand, OECD forecasts that world trade growth rate will be 2.5 percent, -13.2 percent and 1.5 percent for 2008, 2009 and 2010, respectively. Similarly, the World Bank also foresees the world trade volume to contract in 20096.
The world import price index increased by 12.5 percent in 2008. In the period of 2009-2011, it is assumed that the world import price index will increase by 2.5 percent annually on average. In
4 International Money Fund, World Economic Outlook, January 2009 5 OECD, OECD Economic Outlook, March 2009 6 World Bank, Global Economic Prospects 2009: Commodities at the Crossroads, December 2008
Macroeconomic Outlook
4
the period of 2009-2011, it is estimated that the EU consumer price index will increase by 1.7 percent and US consumer price index will increase by 1.2 percent on average. On the other hand, dollar/euro parity is assumed to be realized below the level of 2008 and to be 1.30 in PEP period. All exogenous assumptions used in the PEP estimations are presented in Annex Table-7.
2.1. Recent Economic Developments
2.1.1. Real Sector
After the economic crisis experienced in 2001, as a result of the implemented structural reforms, macroeconomic policies and favorable conditions in the international markets, Turkish economy entered into a rapid recovery period and grew by 6.8 percent annually on average within the period of 2002-2007.
Within this period, the growth rate reached its highest level in 2004. The growth rate, which was 9.4 in 2004, experienced a relative slowdown in the following years and was realized as 8.4 percent, 6.9 percent and 4.7 percent in the years 2005, 2006 and 2007 respectively.
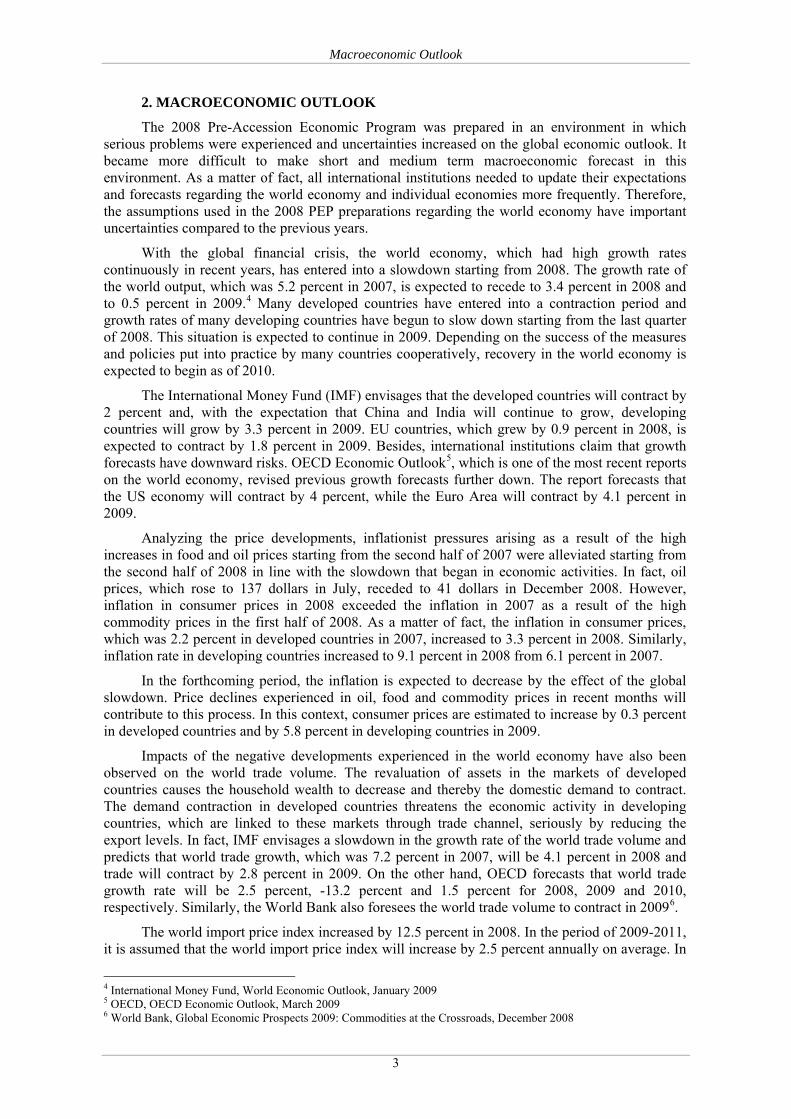
In the first quarter of 2007, Gross Domestic Product (GDP) increased by 8.1 percent with the contributions of the net exports, housing investments and change in stocks. However, in the remaining part of the year, the average growth rate remained at 3.7 percent since the contribution of net exports went down dramatically and the contributions of change in stocks and housing investments also declined. More than one factor had influence on this significant slowdown in the economy. Domestic political uncertainties arising in the second quarter caused the economy to slow down and this impact was observed especially in private sector consumption expenditures.
Table 2. 1: Growth Rates and Demand Components (Annual Percentage Change, at 1998 Prices)
Quarterly Annual 2007 2008
2006 2007 2008 I II III IV I II III IV
GDP 6.9 4.7 1.1 8.1 3.8 3.2 4.2 7.3 2.8 1.2 -6.2
Agriculture 1.4 -6.7 4.1 -2.7 -4.7 -8.7 -6.3 7.9 -1.2 5.3 4.2
Industry 8.3 5.8 1.1 9.6 4.7 5.1 4.2 8.8 5.0 0.9 -9.6
Services 8.2 6.3 1.5 8.5 4.8 6.2 5.9 6.4 3.7 0.7 -4.0
Construction 18.5 5.7 -7.6 12.7 7.3 3.9 0.3 -3.1 -5.0 -8.5 -13.4
Total Consumption 5.1 4.9 0.5 4.3 3.0 6.5 5.6 5.9 0.7 -1.0 -3.1
Public 8.4 6.5 1.8 7.0 13.5 4.2 2.7 5.0 -5.0 1.2 6.1
Private 4.6 4.6 0.3 4.0 1.6 6.8 6.1 6.1 1.5 -1.3 -4.6
Gross Fixed Capital Form. 13.3 5.4 -4.6 4.9 3.6 4.4 8.5 9.5 -1.2 -6.9 -17.5
Public 2.6 6.3 13.1 3.2 7.8 12.8 1.8 18.3 14.9 5.4 15.9
Private 15.0 5.3 -7.3 5.1 3.1 3.2 9.8 8.6 -3.4 -8.9 -23.5
Machinery and Equip. 12.2 4.7 -4.4 -0.2 0.9 3.8 14.9 18.6 -0.5 -6.8 -25.3
Housing 20.3 6.2 -12.2 14.4 7.5 2.1 2.0 -6.5 -9.0 -12.5 -20.4
Total Final Dom. Demand 7.0 5.0 -0.8 4.5 3.2 6.0 6.3 6.8 0.2 -2.4 -6.7
Total Domestic Demand 7.0 5.7 -0.5 7.0 2.8 5.6 7.5 8.1 2.3 -0.5 -10.7
Exports of Goods and Serv. 6.6 7.3 2.6 13.3 9.8 4.6 3.3 13.3 3.9 3.6 -8.2
Imports of Goods and Serv. 6.9 10.7 -3.1 8.2 5.1 14.0 15.5 14.9 2.2 -2.8 -23.0
Source: TURKSTAT Note: Due to indirectly measured financial intermediation services and taxes-subsidies items, value-added by sectors does not add up to GDP.
As one-party government came to power and political uncertainty was resolved as of the third quarter, market interest rates relatively improved. By the impact of the developments in real

Macroeconomic Outlook
5
exchange rates and the improvement in the interest rates, a recovery was observed in machinery and equipment investments and private sector consumption expenditures.
On the other hand, the recovery in these items was not observed on the overall economy. The main reason of this was the fact that the contribution of net exports to growth declined dramatically. The decrease in net exports resulted from the excessive exchange rate appreciation, due to the continuing high capital inflows despite the fluctuations which began in international capital markets starting from the summer months of 2007. In fact, the increase in imports accelerated and the increase in real exports slowed down in this period. The other reason for the limited growth rate in the second half of the year was the slowdown in private sector housing investments compared to the first half of the year.
TURKSTAT announced new national income series in 2008 (Box 2.1). Therefore, the estimations in which the old national income series were used in the 2007 PEP are not comparable with realizations.
In 2007, a slowdown was observed in the increase rates of labor productivity which was 6.3 percent annually on average in the period of 2002-2006 and was one of the major factors supporting growth. The increase in labor productivity was realized as 3.5 percent in overall economy while it was 5.1 percent in manufacturing industry.
Financial fluctuations, which started in US housing market in the second half of 2007, have begun to affect all of the world economies starting from 2008. This crisis leading to an uncertainty in the global economy, which has affected all developed and developing economies, has also affected Turkish economy negatively.
In this economic environment, Turkish economy grew by 7.3 percent in the first quarter of 2008. High growth rates in public investment and in exports of certain sectors had a contribution on this growth performance.
However, economic outlook turned to negative starting from the second quarter of the year. Uncertainty environment created by the international financial crisis, continuous increase in economic recession in our major foreign trade partners, the revision of the future growth expectations in these countries and the contraction in domestic and foreign financing opportunities were the main reasons for the deterioration in economic outlook. In this context, the growth rate was 2.8 percent and 1.2 percent in the second and third quarters of the year, respectively. In the last quarter of 2008, the economy contracted by 6.2 percent along with the deepening of the global crisis. Thereby, the growth rate was recorded as 1.1 percent in 2008.
Private consumption expenditures increased by 6.1 percent in the first quarter of 2008. However, due to the uncertainty caused by the financial crisis, private consumption slowed down significantly in the second quarter and increased only by 1.5 percent. This slowdown continued in the third quarter of 2008 and private consumption expenditures contracted by 1.3 percent. In the last quarter of 2008, together with the uncertainty in external markets, increasing interest rates and real depreciation of TL adversely affected private consumption and led to a contraction of private consumption by 4.6 percent. Thus, private consumption increased by 0.3 percent in 2008.
Private fixed capital investments displayed a similar pattern to private consumption expenditures. In the first quarter of 2008, private fixed capital investments increased by 8.6 percent, but started to contract in the second quarter. Investment decisions are likely to be affected by uncertainty more rapidly and severely compared to consumption decisions. Thus, private fixed capital investments contracted by 3.4 percent, 8.9 percent and 23.5 percent, respectively in the second, third and fourth quarters of 2008. Thereby, private fixed capital investments recorded a contraction of 7.3 percent in 2008.
Public sector fixed capital investments increased by 13.1 percent, whereas public sector consumption expenditures increased by 1.8 percent in 2008. As a result of these developments, in the third quarter of 2008, domestic demand contracted for the first time after 26 quarters by 0.5 percent. The contraction in domestic demand reached 10.7 percent in the last quarter and 0.5 percent throughout the year.

Macroeconomic Outlook
6
Box 2.1: Revised National Accounts
New GDP data was announced on 6 March 2008 by TURKSTAT. European System of Accounts 1995 replaced the 1968 SNA. More relevant conceptual framework that reflects contemporary requirements for measuring Turkey’s economic and financial
conditions. Ensures comparability of Turkey’s statistics with other countries. Enables Turkey to meet data requirements of international organizations.
Methodological Change
New base year of 1998 has been introduced instead of base year of 1987.
Classification systems are based on ESA 95 and other international standards; new classification of industries (NACE Rev. 1) and private household consumption (COICOP) will facilitate international comparison.
Financial Services are measured according to ESA 95 (Measurement of the FISIM according to ESA 95).
Sectoral value added figures were calculated by the basic prices instead of producer prices. Basic prices exclude the taxes and include all subsidies on the product.
Adoption of chain-linking method in constant price estimation gives more accurate aggregate volume growth rate.
Unit value indices at constant price estimation of exports/imports of goods have been adopted.
Free Trade Zones are included in economic territory of country.
Supply and Use Tables are improved for 2002, as basis for benchmark year. 2002 Supply & Use and Input-Output Table is the first table compiled by the concepts, definitions and classifications of the 1995 European System of Accounts (ESA’95).
Introduction of revised base year has increased the accuracy of the GDP.
Expenditure Side
Contribution to Growth
-20
-15
-10
-5
0
5
10
15
1999
old
new
2000
old
new
2001
old
new
2002
old
new
2003
old
new
2004
old
new
2005
old
new
2006
old
new
2007
* ol
dne
w
%
Prv. Cons. Pub. Cons. Investment Net Exports
The share of final domestic demand in GDP has increased. Since the share of exports has increased while the share of imports has not changed significantly; the share of net exports has risen.
The share of private expenditures in new-GDP has increased, but the shares of public expenditures have declined.
Average growth over the period 1998-2006 increased by 0.4 percentage points from 3.7 percent to 4.1 percent per year.
Production Side
Sectoral Distribution of Output at Current Prices
0
200
400
600
800
1998
O
ldN
ew
1999
O
ldN
ew
2000
O
ldN
ew
2001
O
ldN
ew
2002
O
ldN
ew
2003
O
ldN
ew
2004
O
ldN
ew
2005
O
ldN
ew
2006
O
ldN
ew
2007
* O
ldN
ew
Bill
ion
YT L
Agriculture Industry Services
The new national accounts data are upward revision of nominal GDP for the years 1998-2006 of between 26 and 32 percent. Per capita income of Turkey for 2007 has risen to 9333 dollars as a result of this upward revision and revision of population estimate.
The share of services in new-GDP has been increased, but the shares of agriculture and industry declined compared to those of old-GDP. Especially the share of construction sector in GDP increased by 50 percent.
* As of first three quarters.
Broader Coverage
The 2000 Building Census and the Number of Electricity Subscribers resulted in improved data on the number of dwellings which is used in the estimates of paid and imputed rents by type of dwelling and heating system (Number of dwellings increased from 13.9 million to 19.2 million).
The 2001 Farm Census updates and improves technical coefficients utilized for estimation of the sector’s value added.
The 2002 Census of Industry and Business Establishments caused better coverage of production of goods and services, particularly for manufacturing industries, updated business register leading to improved results from future sample surveys (The number of firms, which employ 10 and more than 10 persons, increased from 11,293 to 27,813).
Improved The Labor Force Survey (LFS) sample size has increased the accuracy, and expanded the content. Adjustments for the Non-Observed Economy have improved (better exhaustiveness).
Comparison of GDP Growth Rates
-8
-4
0
4
8
1999
2000
2001
2002
2003
2004
2005
2006
2007
*
%
GDP (1998) GDP (1987)
Macroeconomic Outlook
7
The crisis, which started in the international financial markets, has affected trade partners of Turkey and reduced their growth expectations. As a result, a significant slowdown has been observed in the growth rate of real exports of goods and services, starting from the second quarter of 2008. In the last quarter of 2008, exports of goods and services contracted by 8.2 percent and thereby the growth rate of exports of goods and services was realized as 2.6 percent in 2008.
In line with the decrease in domestic demand, real imports of goods and services slowed down starting from the second quarter of 2008 and it contracted by 2.8 percent in the third quarter and 23.0 percent in the last quarter. Thereby, imports declined by 3.1 percent in 2008. In addition to the decrease in domestic demand, decline in intermediary goods imports, due to the slowdown in exports, contributed to the decrease in the growth rate of imports.
In light of these developments, the contribution of private consumption to the GDP growth was 0.2 points, contribution of private investment was -1.6 points, contribution of public consumption was 0.2 points, contribution of public investment was 0.4 points and the contribution of net exports of goods and services was 1.6 points in 2008. The contribution of change in stocks to growth was realized as 0.3 points.
Scrutinizing the sectoral developments, it is observed that the value-added in agriculture increased by 4.1 percent throughout 2008. Despite the base effect of the drought in 2007, continuing drought in Southeastern Anatolian region was effective on the limited increase of agricultural output in 2008.
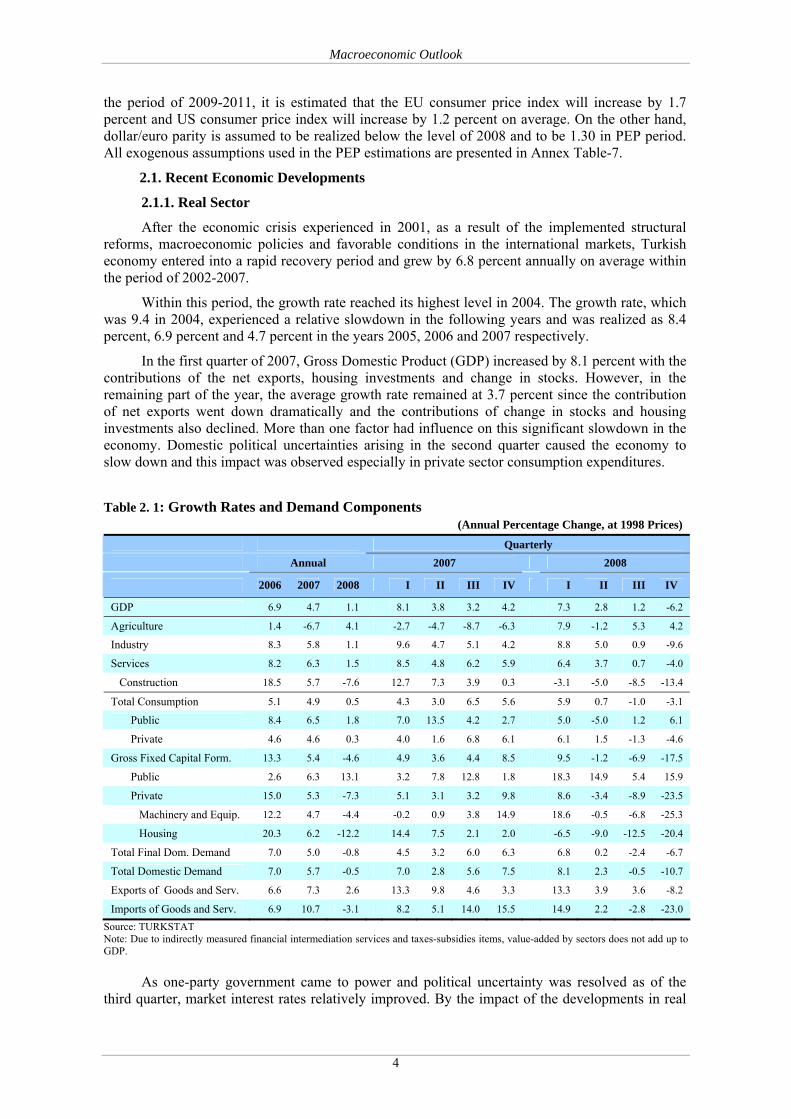
The increase in value-added of the industry sector was realized as 1.1 percent in 2008. Leading indicators for the last quarter of 2008 signaled a contraction in industry sector. Analyzing the Tendency in the Manufacturing Sector Survey, a significant decline in the capacity utilization rates was observed in October-December period. Similarly, industrial production index receded significantly in the period of October-December (Figure 2.1). Analyzing the national accounts data, industrial value-added increased by 4.8 percent in the first nine months of the year, but contracted by 9.6 percent in the last quarter.
Figure 2. 1: Industrial Production and Capacity Utilization
100
110
120
130
140
150
160
170
Jan-
05
Mar
.05
May
.05
Jul-0
5
Sep-
05
Nov
-05
Jan-
06
Mar
.06
May
.06
Jul-0
6
Sep-
06
Nov
-06
Jan-
07
Mar
.07
May
.07
Jul-0
7
Sep-
07
Nov
-07
Jan-
08
Mar
.08
May
.08
Jul-0
8
Sep-
08
Nov
-08
Indu
stria
l Pro
duct
ion
Inde
x (2
005=
100)
60
65
70
75
80
85
Cap
acity
Util
izat
ion
Rat
e, P
erce
nt
Industry Capacity Utilization
Source: TURKSTAT
While the value-added in the services sector increased by 3.5 percent in the first nine months of 2008, it contracted by 4.0 percent in the last quarter of the year. Thus, value added in the services sector increased by 1.5 percent throughout the year. Analyzing the major sub-sectors, it is observed that wholesale and retail trade sector contracted by 0.9 percent in 2008. Similarly, a

Macroeconomic Outlook
8
contraction of 7.6 percent was materialized in the construction sector. The growth rate of transportation sector, which is one of the major sub-sectors, was 1.6 percent implying a relative slowdown compared to the previous year.
Considering the developments in the labor market, it is observed that total employment increased by 1.1 percent in 2007. While agricultural employment contracted by 112 thousand persons, the non-agricultural employment increased by 346 thousand persons and 85 percent of this increase was in the services sector. As a result, while the agricultural employment contracted by 2 percent, non-agricultural employment expanded by 2.3 percent in 2007 and a total of 235 thousand new jobs were created in 2007.
Table 2. 2: Developments in the Labor Market (15+Age, Thousands)
Annual 2007 2008 2006 2007 2008* I II III IV I II III IV
Working Age Population 48,485 49,215 49,974 48,935 49,118 49,317 49,511 49,672 49,881 50,087 50,286Labor Force Part. Rate, % 48.0 47.8 48.2 46.3 48.8 49.3 46.9 45.9 49.0 49.8 48.4Labor Force 23,250 23,523 24,073 22,646 23,965 24,292 23,217 22,804 24,440 24,948 24,310 Employment 20,954 21,189 21,513 20,058 21,843 22,060 20,876 20,162 22,277 22,509 21,315 Unemployed 2,295 2,333 2,560 2,587 2,123 2,232 2,350 2,642 2,164 2,439 2,995Employment Rate, % 43.2 43.1 43.0 41.0 44.5 44.7 42.2 40.6 44.7 44.9 42.4Unemployment Rate, % 9.9 9.9 10.6 11.4 8.9 9.2 10.1 11.6 8.9 9.8 12.3 Non-Agriculture, % 12.6 12.6 ---- 14.2 11.5 11.9 12.6 14.2 11.5 12.7 15.4 Among Young People, % 18.7 19.6 ---- 21.7 17.5 19.2 20.0 21.2 16.3 19.1 23.9Employment by Sectors Agriculture 5,713 5,601 5,608 5,003 6,042 6,174 5,211 4,751 6,034 6,314 5,494 Non-Agriculture 15,242 15,588 15,904 15,056 15,800 15,885 15,656 15,411 16,243 16,195 15,821 Industry 4,136 4,185 ---- 4,074 4,171 4,212 4,046 4,285 4,323 4,388 4,017 Services 11,106 11,403 ---- 10,982 11,629 11,673 11,610 11,126 11,920 11,807 11,804
* Realization Forecast Source: TURKSTAT
As a result of the 0.2 point decrease in labor force participation rate in 2007 compared to 2006, the increase in labor supply remained below the increase in the working age population. As labor supply increased by approximately 273 thousand persons, the number of unemployed increased by 38 thousand persons. However, the unemployment rate did not change and remained at 9.9 percent. Similarly, the non-agricultural unemployment rate was recorded as 12.6 percent by keeping its level in 2006. The unemployment rate among young people reached 19.6 percent with an increase of 0.9 points.
Considering the developments in 2008, it is observed that the total employment increased by 0.5 percent in the first quarter, 2 percent in the second and third quarters and 2.1 percent in the last quarter compared to the same period of the previous year. When the sectoral composition of employment is analyzed, it is worth mentioning that the increase in industrial employment was quite higher than the increase in total employment in the first three quarters. Increases in industrial employment were recorded as 5.2 percent, 3.6 percent and 4.2 percent in the first, second and third quarters, respectively. However, along with the severe deterioration of the world economy starting from September 2008 and manifestation of the effects of global crisis in domestic markets, the rapid growth in industrial employment halted and industrial employment declined by 0.7 percent in the last quarter of 2008. The main reason behind the continuation of employment growth in the last quarter was the increase in employment in agriculture and services sectors.
Labor force participation rate, which declined in the first quarter of 2008, increased by 0.2, 0.5, and 1.5 percentage points in the last three quarters compared to the same quarters of the previous year. The remarkable increase in the last quarter of the year can be attributed to the deterioration of the economic circumstances.

Macroeconomic Outlook
9
As a result of these developments, unemployment rate increased remarkably in the last quarter of the year and reached 12.3 percent with an increase of 2.2 percentage points compared to the same period of the previous year.
Analyzing developments in wages in the Turkish economy, it is observed that average nominal worker wages in the public sector increased by 12.2 percent in 2007 and 8.3 percent in 2008. Average nominal worker wages in the private sector increased by 11.5 percent in 2007, whereas it had increased by 8.8 percent in 2006.
2.1.2. Inflation, Money and Exchange Rate Policies
Inflation
Year-end CPI inflation realized as 8.39 percent and year-end PPI inflation realized as 5.94 percent for 2007. Under inflation targeting regime, in the period 2002-2005 the annual inflation was realized below the predetermined targets, but realized above the target in 2006 due to the supply shocks and depreciation of TL as a result of the fluctuations in international markets. In 2007, annual inflation slowed down gradually, when lagged effects of tight monetary policy on inflation became apparent, and it fell down to 6.9 percent in July. On the other hand, in addition to the impact of the surge in food and commodity prices, which showed their effects starting from August, administered price adjustments in the last quarter of the year caused inflation to increase and remain above the target determined for the end of 2007.
Figure 2. 2: CPI Targets and Realizations
35.0
20.0
12.08.0
5.0 4.0 4.0
29.7
18.4
9.3 7.79.7 8.4
10.1
0
5
10
15
20
25
30
35
40
2002 2003 2004 2005 2006 2007 2008
TargetRealization
Source: CBRT, TURKSTAT Annual inflation increased in 2008 compared to 2007. Driven particularly by direct and
indirect effects of the rapid increase in processed food and oil prices, annual inflation increased to 12.06 percent as of July. Starting from August, food prices began to slowdown due to the improvements in supply conditions and decrease in import prices, and thus the adverse effect of food prices on inflation decreased. While the impact of decreases in crude oil prices in second half of the year was reflected on domestic fuel prices particularly in the last quarter of the year, inflation in non-fuel energy items remained high due to lagged effects. Although energy prices plummeted in the last quarter, end-year energy inflation in 2008 was recorded well above the past years. As for the services group, while indirect impacts of the increases in the food and energy prices were effective throughout the year on the catering and transportation services, the annual inflation declined due to the weakness of domestic demand and the reduction in cost pressures in the last quarter. Despite the depreciation of TL, the annual inflation for the commodity group other than food and energy was realized below the averages of the previous year, with the slowdown in
Macroeconomic Outlook
10
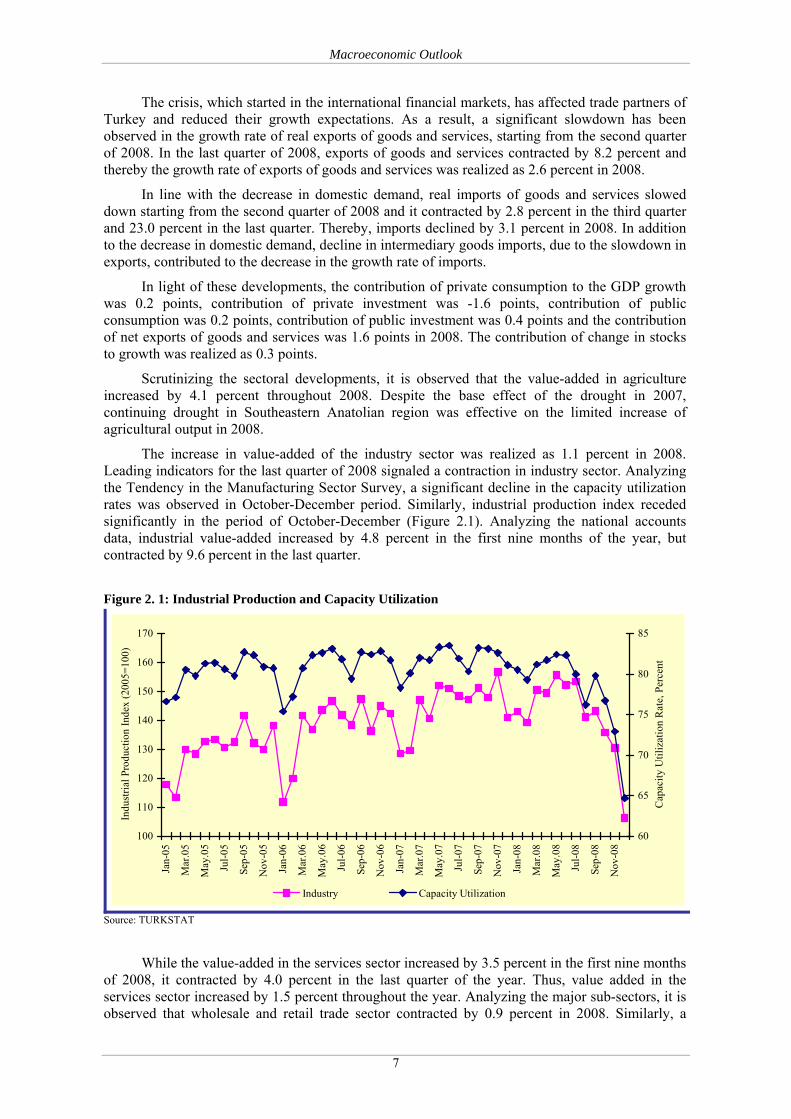
economic activities. Following these developments, year-end inflation was realized as 10.06 percent in 2008.
The slowdown in inflation which started at the end of 2008, continued in the first two months of 2009 with contributions of weaker domestic demand and lower cost pressures. As a result, annual inflation materialized at 7.73 percent at the end of February 2009.
Figure 2. 3: CPI and Core CPI (Annual Percentage Change)
0
2
4
6
8
10
12
14
01.0
7
02.0
7
03.0
7
04.0
7
05.0
7
06.0
7
07.0
7
08.0
7
09.0
7
10.0
7
11.0
7
12.0
7
01.0
8
02.0
8
03.0
8
04.0
8
05.0
8
06.0
8
07.0
8
08.0
8
09.0
8
10.0
8
11.0
8
12.0
8
01.0
9
02.0
9
Core CPI-I CPI
Source: TURKSTAT Monetary and Exchange Rate Policy
Monetary policy in Turkey has been implemented within the framework of inflation targeting regime since the beginning of 2006. There has been no change in operational framework stated in 2007 PEP. Within this context, the end-year targets for annual consumer price inflation are determined by the Government and Central Bank together for a three-year period. These targets are declared to the public at the end of each year with the symmetric uncertainty bands, which constitute basis for accountability principle. The main instrument of the monetary policy is the short-term interest rates in the Interbank Money Market and Istanbul Stock Exchange Repo-Reverse Repo Market.
CPI inflation, which measures cost of living efficiently and can be easily followed by every segment of the society, is set as the target variable in inflation targeting regime. However, in its inflation analyses and communication with the public, the Central Bank may emphasize the CPI indicators having specified coverage (core inflation), formed by excluding inflation in certain items which is beyond the control of the monetary policy. Characteristics of shocks to inflation may be different among periods and some indicators may become prominent accordingly. As a matter of fact, the supply shocks in the last two years increased the importance of the core inflation indicators that exclude food and energy items. It is thought that such an approach contributes to the communication policy to be more effective and the decision making process to function well.
Inflation target was announced as 4 percent for both 2007 and 2008 in monetary policy announcements. However, inflation target was exceeded significantly in 2007 and 2008 due to exogenous reasons mostly beyond the control of the monetary policy. There were mainly two reasons for the inflation rate to stay well above the targets. First, the supply shocks, which became effective starting from 2006 and aggravated in 2007, led to a cost-push inflation. Second, problems in global credit markets stemming from US housing market, which has worsened as of August 2007, had adverse effects on exchange rates and country risk premium, creating inflationary

Macroeconomic Outlook
11
pressures. While inflation rate was 8.4 percent at the end of 2007, it increased to 10.06 percent at the end of 2008.
In this context, tight and prudent stance of the monetary policy, commenced in the May-June period of 2006, continued until the end of 2008. Based on the relative improvements in the main inflation indicators and the anticipation that the decrease in inflation will be supported by demand conditions due to the slowdown in the world economy and lagged effects of monetary tightening; gradual interest rate cuts, initiated in September 2007, were continued in the first months of 2008. Despite these cuts, monetary policy was continued to be tight in the mentioned period. With the acceleration of the increases in food and energy prices, deepening of the fluctuations in the global financial markets and depreciation of TL altogether starting to have adverse impacts on the inflation and expectations, the Central Bank suspended the rate cutting process by not changing policy interest rates starting from March and reinforced its tight stance by increasing the interest rates starting from May.
On the other hand, perceptions that the supply shocks may not be short-lived but continue in the medium term became stronger. Additionally, ongoing uncertainties in the global economy and the initial signs of secondary effects forced the Central Bank to update its inflation forecasts significantly upwards. In the Inflation Report published in April 2008, it is stated that it may take more than two years for inflation to approach to the medium term target of 4 percent, even if the tight stance of the monetary policy was continued for a while. In this process, economic agents began to focus on the past inflation while forming their inflation expectations and the anchor role of the current inflation targets in guiding expectations of the economic agents has decreased significantly.
Although the year-end inflation targets could not be achieved in 2006 and 2007, first two years of the inflation targeting regime, inflation targets were not changed in these years by considering that medium-term targets could be reached and that changing the targets could have adverse impacts on the credibility of monetary policy and inflation expectations. However, the adverse developments mentioned above were regarded as the condition that “a pre-announced inflation target shall only change in the event that very sharp and long-term deviations from the target are expected or medium-term targets no longer make sense due to factors beyond the control of monetary policy” included in the announcement titled the General Framework of Inflation Targeting Regime dated December 2005 was realized. In this framework, the Government and Central Bank reached an agreement on the necessity of determining new inflation targets for the period of 2009-2011 and new inflation targets were announced to the public with an open letter on 3 June 2008. While the inflation target for 2008 was not changed to abide by the accountability principle, the end-year inflation targets for 2009 and 2010 were updated as 7.5 percent and 6.5 percent and the end-year inflation target for 2011 was determined as 5.5 percent. Changing inflation targets along with tight monetary policy succeeded in keeping inflation expectations under control.
Table 2. 3: Inflation Targets (Year-end Annual Change in CPI, Percent) Targets before
revision New Targets
2009 4.0 7.5 2010 4.0 6.5 2011 - 5.5
Source: CBRT
The latest figures indicate a deepening in the slowdown of economic activity and domestic demand. Besides, declines in oil and commodity prices as well as the sluggish external demand because of the problems in the international credit markets and global economy, continue to exert downward pressure on inflation. It is anticipated that the developments in domestic and external demand will continue for a while and have a favorable impact on inflation outlook. In this context,

Macroeconomic Outlook
12
the Central Bank started interest rate cuts as of November 2008, after keeping the policy rates unchanged during the August-October period. Lastly, Monetary Policy Committee, in its February 2009 meeting, cut the policy rates by 150 basis points, with the anticipation that in the forthcoming period the decrease in inflation will continue and the end year inflation target would be reached earlier than expected. Thereby, the rate cuts have amounted to 525 basis points, since October 2008. Nevertheless, despite the recent rate cuts the extra tight stance of financial conditions continues and especially commercial credit rates remained at high levels. The Central Bank will continue to take the necessary policy measures to minimize the negative impact of the problems in the international markets on the economy unless these actions contradict with its main objective of achieving price stability.
Table 2. 4: Monetary Policy Decisions MPC Meeting Dates Policy Decision Policy Rate* 14 November 2007 -0.50 16.25 13 December 2007 -0.50 15.75 17 January 2008 -0.25 15.50 14 February 2008 -0.25 15.25 19 March 2008 Unchanged 15.25 17 April 2008 Unchanged 15.25 16 May 2008 +0.50 15.75 17 June 2008 +0.50 16.25 18 July 2008 +0.50 16.75 14 August 2008 Unchanged 16.75 18 September 2008 Unchanged 16.75 22 October 2008 Unchanged 16.75 19 November 2008 -0.50 16.25 18 December 2008 -1.25 15.00 15 January 2009 -2.00 13.00 19 February 2009 -1.50 11.50
(*) Overnight borrowing rate valid in Interbank Money Market and Istanbul Stock Exchange Repo- Reverse Repo Market.
Source: CBRT
Besides the main objective of achieving price stability, the Central Bank has followed an active policy against the possibility that the stability in Turkish financial system may be affected by the problems experienced in the international credit markets recently, and it took some measures for effective functioning of the foreign exchange market and providing FX liquidity. In this context, Central Bank reopened Foreign Exchange and Banknotes Markets Foreign Exchange Deposit Market on 9 October 2008. In the following periods, transaction limits of the banks in the Foreign Exchange and Banknotes Markets Foreign Exchange Deposit Market were increased significantly to 10.8 billion dollars. In addition, the maturity of FX stock provided by the Central Bank was extended and the FX borrowing rates of banks were reduced. Considering the recent interest developments in international markets, conditions of FX liquidity facilities provided to banking sector were rearranged on 20 February 2009. In this context, the maturity of dollar and euro denominated FX stocks that banks can borrow from the Central Bank within their predetermined limits at Foreign Exchange and Banknotes Markets Foreign Exchange Deposit Market, were extended from 1 month to 3 months. As for the transactions the banks make among them, the maturities which were up to 1 month were extended up to 3 months and the lending rates for transactions with Central Bank were decreased from 7 percent to 5.5 percent for dollar and from 9 percent to 6.5 percent for Euro. In addition to these measures, extra FX liquidity was supplied to the banking sector by reducing the required reserve ratio for FX deposits.
Floating exchange rate regime has been continued since 2001 within the pre-announced framework allowing for volatility interventions and foreign exchange purchase auctions to accumulate reserves. There has been no direct intervention to the FX market since the sales

Macroeconomic Outlook
13
intervention made during the fluctuations in the international financial markets in June 2006. FX purchase auctions, which were suspended in May 2006, were resumed in November 2006, and continued within a program until October 2008, in a fashion with preannounced occasional changes in the amounts to be purchased. On 16 October 2008, foreign exchange purchase auctions were suspended along with the measures taken in order to strengthen the liquidity positions of the Turkish banks due to the problems in the global financial markets. Liquidity was provided to market through FX sales auctions in 24-30 October period in order to avoid non-competitive pricing in the FX market.
Net 7.5 billion dollars was purchased through sales-purchase auctions in 2008 whereas 9.9 billion dollars was purchased through purchase auctions in 2007. As of 20 February 2009, gross foreign exchange reserve of the Central Bank was about 66.3 billion dollars.
Table 2. 5: FX Market Interventions and Auctions of the Central Bank (Million Dollars)
Years FX Purchase Auctions
FX Sale Auctions
FX Purchase Interventions
FX Sale Interventions
Total Net FX Purchases
2002 795 - 16 12 799 2003 5,652 - 4,229 - 9,881 2004 4,104 - 1,283 9 5,378 2005 7,442 - 14,565 - 22,007 2006 4,296 1,000 5,441 2,105 6,632 2007 9,906 - - - 9,906 2008 7,584 100 - - 7,484
Source: CBRT Note: The Central Bank restarted programmed FX Sales Auctions as of 10 March 2009.
2.1.3. Financial Sector
The total assets of the banking sector, which was 502 billion dollars at the end of 2007, realized as 435 billion dollars as of the end of February 2009. Pre-tax profit was realized as 12.8 billion dollars in 2007 and 8.8 billion dollars in 2008. The share of the credits in the total assets increased from 49 percent to 50 percent in the period of 2007-2008. Credits of the banking sector were recorded as 217 billion dollars as of February 2009. The ratio of non-performing loans, which was 3.5 percent in 2007, increased to 3.7 percent in 2008 and 4.2 percent in February 2009.
As the financial institutions have not been active in the asset backed securities and derivative instruments etc. markets yet, the global financial crisis did not have significant adverse effect on the Turkish financial system. The decreasing trend in the balance sheet FX position since 2007 can also be interpreted as another contributing factor.
As of February 2009, financial soundness indicators of the banking sector show that the sector still works with a capital adequacy rate quite higher than the legal limits.
As a result of restructuring of banking sector, global investors continue to show high interest in the sector. There are 49 active banks in the sector.
The global financial turmoil became effective in domestic capital markets starting from the third quarter of 2008 and resulted in significant fluctuations in the markets. Thus, ISE National-100 Compound Index, which was 55,538 at the end of 2007, receded to 26,864 with a decline of 53 percent as of end of 2008. In the same periods, ISE National-100 Compound Dollar Index declined to 1028 from 2,790, which corresponds to a decline of 63 percent. As of February 2009, ISE National-100 Compound Index declined to 24.027 in TL terms and 829 in dollar terms. Despite these developments, there was no significant foreign investor outflow from the stock market and the foreign investors holding rate within the stock market stood at 63 percent, as of 9April 2009.

Macroeconomic Outlook
14
Table 2. 6: Overview of the Banking Sector
2002 2003 2004 2005 2006 2007 2008 2009 Feb.
Main Aggregates Assets (In Billion Dollars) 130.1 178.9 228.3 295.9 356.0 502.0 481.0 435.0 Loans (In Billion Dollars) 30.0 47.4 74.0 113.7 156.0 246.0 241.0 217.0 Deposits (In Billion Dollars) 84.4 111.3 143.0 187.1 219.0 308.0 299.0 275.0 Number of Banks 54 50 48 47 50 50 49 49 Number of Employees (Thousands) 123.9 124.0 127.9 133.0 151.0 168.0 182.0 182.0Performance Indicators Net Profit (In Billion Dollars) 1.8 4.0 4.5 3.7 8.1 12.8 8.8 1.9 Return on Assets (%) 1.4 2.2 2.1 2.7 2.6 2.8 2.1 0.5 Rate of Return for Equity Capital (%) 9.2 15.8 14.0 18.6 21.0 24.8 18.8 3.7 Loans/Deposits (%) 35.5 42.6 51.7 61.7 71.2 80.0 80.8 78.9Risk Indicators Capital Adequacy Ratio (%) 26.1 30.9 28.8 24.2 21.9 18.9 18.0 18.1 FX Position in Balance Sheet (Billion Dollars) -0.6 0.0 -1.4 -1.9 -5.5 -8.3 -3.3 -0.2 Net General Position (In Billion Dollars) -0.4 0.3 -0.1 -0.1 0.1 0.2 -0.1 0.1 Non-Performing Loans/Gross Loans (%) 17.6 11.5 6.0 5.0 3.7 3.5 3.7 4.2 Securities Portfolio/Assets (%) 40.5 42.8 40.4 36.0 31.8 21.3 26.5 28.6
* Data includes participation banks starting from 2006. Source: BRSA
There were 50 companies operative in insurance and private pension sector, as of the end of 2008. In 2008, total assets of the insurance sector increased by 18 percent to 27.5 billion TL and premium generation increased by 6.9 percent to 11.8 billion TL.
Since its initiation in 2003, the private pension sector has been displaying a high growth tendency. As the end of 2008, the number of participants in the private pension system exceeded 1.7 million persons, the number of contracts exceeded 1.9 million and the fund accumulated in the system reached 6.4 billion TL. While the number of contracts increased by 23 percent in 2008, the total amount directed to investment increased by 40 percent and realized as 5.3 billion TL.
2.1.4. Balance of Payments
Current Account
The upward trend in the current account deficit observed in recent years continued also in 2007. Due to the increase in the trade deficit, current account deficit increased by 19.2 percent in 2007, and reached 38.2 billion dollars.
The current account deficit of 2007 was realized 1.8 billion dollars above the 2007 PEP forecast. Realization of trade deficit and services expenditures above the forecasts was effective in the higher than expected current account deficit.
The upward trend in the current account deficit continued in the first eight months of 2008. In September-December period, the current account deficit decreased significantly compared to the same period of the previous year due to the decrease in the trade deficit. The current account deficit reached 41.7 billion dollars by the end of 2008.
Exports sustained its high growth path in 2007 and increased by 25.4 percent to 107.3 billion dollars. While the growth rate of real exports of goods realized as 11.1 percent, quarterly growth rates showed a declining trend. On the other hand, nominal exports reached high levels due to the increases in export prices. As a result of these developments, in 2007 nominal exports was realized 3.3 billion dollars above the 2007 PEP projection.
Macroeconomic Outlook
15
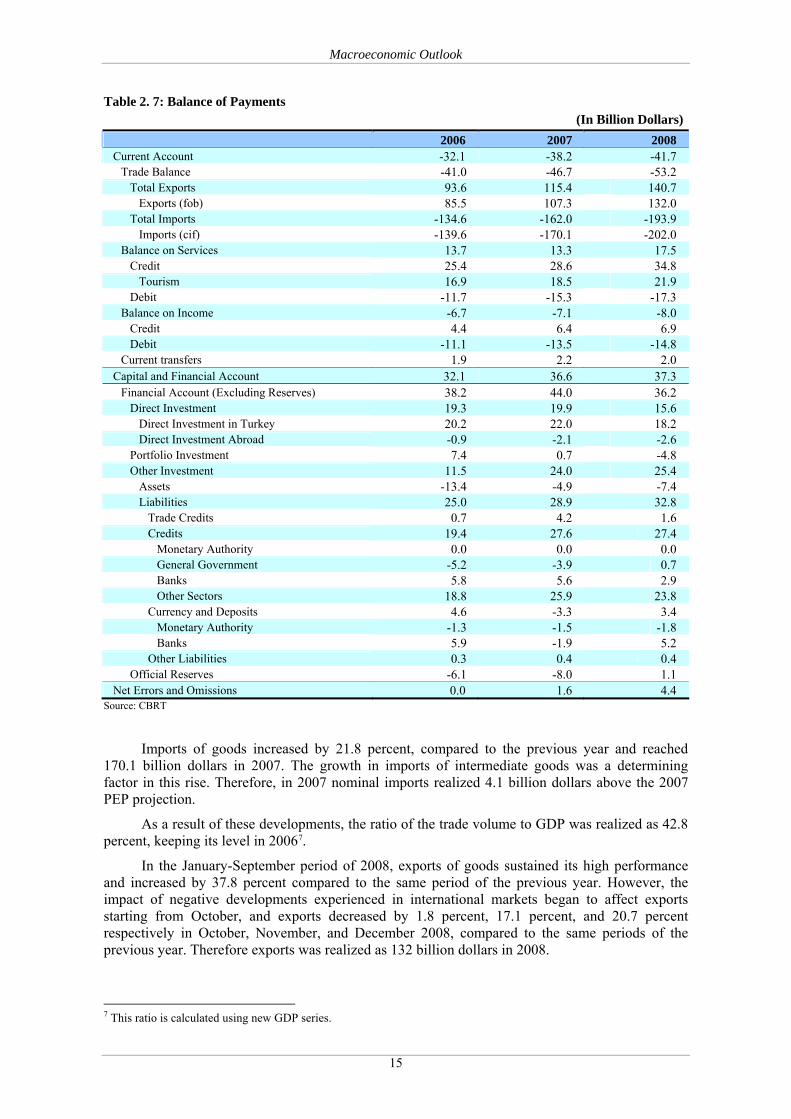
Table 2. 7: Balance of Payments (In Billion Dollars)
2006 2007 2008 Current Account -32.1 -38.2 -41.7 Trade Balance -41.0 -46.7 -53.2 Total Exports 93.6 115.4 140.7 Exports (fob) 85.5 107.3 132.0 Total Imports -134.6 -162.0 -193.9 Imports (cif) -139.6 -170.1 -202.0 Balance on Services 13.7 13.3 17.5 Credit 25.4 28.6 34.8 Tourism 16.9 18.5 21.9 Debit -11.7 -15.3 -17.3 Balance on Income -6.7 -7.1 -8.0 Credit 4.4 6.4 6.9 Debit -11.1 -13.5 -14.8 Current transfers 1.9 2.2 2.0 Capital and Financial Account 32.1 36.6 37.3 Financial Account (Excluding Reserves) 38.2 44.0 36.2 Direct Investment 19.3 19.9 15.6 Direct Investment in Turkey 20.2 22.0 18.2 Direct Investment Abroad -0.9 -2.1 -2.6 Portfolio Investment 7.4 0.7 -4.8 Other Investment 11.5 24.0 25.4 Assets -13.4 -4.9 -7.4 Liabilities 25.0 28.9 32.8 Trade Credits 0.7 4.2 1.6 Credits 19.4 27.6 27.4 Monetary Authority 0.0 0.0 0.0 General Government -5.2 -3.9 0.7 Banks 5.8 5.6 2.9 Other Sectors 18.8 25.9 23.8 Currency and Deposits 4.6 -3.3 3.4 Monetary Authority -1.3 -1.5 -1.8 Banks 5.9 -1.9 5.2 Other Liabilities 0.3 0.4 0.4 Official Reserves -6.1 -8.0 1.1 Net Errors and Omissions 0.0 1.6 4.4
Source: CBRT
Imports of goods increased by 21.8 percent, compared to the previous year and reached 170.1 billion dollars in 2007. The growth in imports of intermediate goods was a determining factor in this rise. Therefore, in 2007 nominal imports realized 4.1 billion dollars above the 2007 PEP projection.
As a result of these developments, the ratio of the trade volume to GDP was realized as 42.8 percent, keeping its level in 20067.
In the January-September period of 2008, exports of goods sustained its high performance and increased by 37.8 percent compared to the same period of the previous year. However, the impact of negative developments experienced in international markets began to affect exports starting from October, and exports decreased by 1.8 percent, 17.1 percent, and 20.7 percent respectively in October, November, and December 2008, compared to the same periods of the previous year. Therefore exports was realized as 132 billion dollars in 2008.
7 This ratio is calculated using new GDP series.

Macroeconomic Outlook
16
Exports of manufacturing goods, which accounts for approximately 95 percent of total exports, increased by 38.9 percent in January-September 2008 compared to same period of the previous year, while it decreased by 13.8 percent in October-December period. Thereby, the increase was realized as 23.8 percent in 2008. Considering the major exporting sectors, it is observed that exports of main metal industry, which increased by 105.4 percent in January-September period of 2008, slowed down and increased by only 21 percent in October-December period. On the other hand, exports of motor vehicles and trailers, which increased 35.8 percent in the January-September period, decreased by 40.3 percent in October-December period and similarly, wearing apparel exports, which increased 4.9 percent in the January-September period, decreased by 24.1 percent in the October-December period.
In the January-September period of 2008, imports of goods increased by 34.4 percent compared to the same period of the previous year. With the contraction of domestic demand and the decrease in exports, a significant contraction has been observed in imports since October. In October, November, and December, imports decreased by 4.4 percent, 27.4 percent, and 30.1 percent, respectively, compared to the same period of the previous year and it was realized as 202 billion dollars in 2008. In this period, imports of intermediate goods followed a similar trend to the increase in exports whereas the increase in consumption and investment goods remained below the increase in total imports.
Table 2. 8: Foreign Trade by Classification of Broad Economic Categories (BEC)
(Billion Dollars)
2006 Share, % 2007 Share, %
Rate of Change,
% 2008 Share,
%
Rate of Change,
% Total Exports 85.5 100.0 107.3 100.0 25.4 132.0 100.0 23.0 Capital Goods 9.4 11.0 13.8 12.8 46.0 16.7 12.7 21.4 Intermediate Goods 37.8 44.2 49.4 46.1 30.7 67.7 51.3 37.1 Consumption Goods 37.8 44.2 43.7 40.7 15.6 47.1 35.7 7.7 Total Imports 139.6 100.0 170.1 100.0 21.8 202.0 100.0 18.8 Capital Goods 23.3 16.7 27.1 15.9 15.9 28.0 13.9 3.6 Intermediate Goods 99.6 71.4 123.6 72.7 24.1 151.7 75.1 22.7 Consumption Goods 16.1 11.5 18.7 11.0 16.0 21.5 10.6 15.0 Source: TURKSTAT
Analyzing trade figures of Turkey with EU countries in 2007, it is observed that the share of
EU countries in Turkish exports increased by 0.3 points to 56.3 percent, and the share of EU countries in Turkish imports decreased by 2.3 points to 40.3 percent. Increase in energy imports of Turkey from non-EU countries was influential on the decrease in the share of imports from EU countries. In 2008, the share of exports to EU countries in total exports was 48 percent, while the share of imports from EU countries in total imports was realized as 37 percent.
Table 2. 9: Foreign Trade by Countries
(In Billion Dollars)
2006 Share, % 2007 Share,
%
Rate of Change,
% 2008 Share,
%
Rate of Change,
% Merchandise Exports 85.5 100.0 107.3 100.0 25.4 132.0 100.0 23.0European Countries (EU-27) 47.9 56.0 60.4 56.3 26.0 63.4 48.0 4.9Other Countries 34.6 40.5 43.9 41.0 26.8 65.6 49.7 49.3Turkish Free Zones 3.0 3.5 2.9 2.7 -0.8 3.0 2.3 2.2Merchandise Imports 139.6 100.0 170.1 100.0 21.8 202.0 100 18.8European Countries (EU-27) 59.4 42.6 68.6 40.3 15.5 74.8 37.0 9.0Other Countries 79.2 56.8 100.2 58.9 26.5 125.8 62.3 25.5Turkish Free Zones 0.9 0.7 1.2 0.7 29.6 1.3 0.7 9.0
Source: TURKSTAT

Macroeconomic Outlook
17
Considering services balance, it is observed that services surplus, which was 13.7 billion dollars in 2006, receded to 13.3 billion dollars in 2007. Tourism revenues, which decreased in 2006, increased by 1.6 billion dollars and reached 18.5 billion dollars in 2007. Despite the increase in tourism revenues, surplus in services decreased and the most important reason behind this was the increase in freight expenditures, which rose by approximately 2 billion dollars in 2007 compared to the previous year.
With the effect of increase in tourism revenues by 3.4 billion dollars, services balance was in surplus of 17.5 billion dollars in 2008.
Despite the increase in portfolio investments revenue, the income balance deteriorated in 2007 due to the increase in direct investments and other investments expenditures. Within this context, income balance had a deficit of 7.1 billion dollars in 2007. The major reason for this deterioration was the increase in direct investment expenditures by 1 billion dollars due to the increase in direct foreign investment stocks at home.
Similarly, in 2008, the deficit in income balance increased by 11.5 percent compared to 2007 and reached 8.0 billion dollars. Due to the increase in long-term foreign debt of non-banking private sector, interest payments of the private sector increased by 1 billion dollars compared to 2007 and interest payments of the general government decreased slightly.
Current transfers that was 2.2 billion dollars in 2007 was realized as 2 billion dollars in 2008.
Capital and Financial Account
High increases in capital inflows observed particularly starting from 2004 sustained in 2007. Capital and financial account gave a surplus of 32.1 billion dollars in 2006 and 36.6 billion dollars in 2007. In the first three quarters of 2008, high capital inflows continued, however in the last quarter, an outflow of 6.2 billion dollars was realized stemming from portfolio and other investment items. Thus, the capital and financial account was realized as 37.3 billion dollars but due to the rapid capital outflows in the last quarter, reserves melted down by 1.1 billion dollars in 2008.
In 2007, net direct foreign investments continued its increase in recent years and reached 19.9 billion dollars. Despite the 21.8 percent decrease, net direct foreign investment was realized at a quite high level of 15.6 billion dollars in 2008.
Portfolio investments, which were 7.4 billion dollars in 2006, declined to 0.7 billion dollars in 2007. The outflow in government domestic borrowing instruments by 3.3 billion dollars was effective on this decrease. Portfolio investments displayed a volatile pattern in 2008. While inflows amounting to 2.5 billion dollars were recorded in the first seven months of 2008, an outflow of 7.3 billion dollars was realized in the rest of the year. Thus, the total outflow was realized as 4.8 billion dollars in 2008, and this outflow can be mainly attributed to the outflows in government domestic borrowing instruments. The highest monthly outflow in portfolio investment was recorded in October, which can be considered as the starting point of the global financial crash. Thus, the portfolio investments, which were a major financing item in recent years, started to record a deficit.
Other investments, which were 11.5 billion dollars in 2006, increased significantly and reached 24.0 billion dollars in 2007. Capital inflows realized at significant amounts in other investments item in the January-September period of 2008. Despite an outflow of 10.3 billion dollars in the last quarter of the year due to the international financial turmoil, a total inflow of 25.4 billion dollars was recorded throughout 2008. Thereby, 68.5 percent of the total capital inflows excluding reserves stemmed from other investments in 2008.
Analyzing other investments in details, it is observed that the long-term foreign credits of the non-banking private sector, which plays a major role in financing the domestic investments, was realized as 47.6 billion dollars. The long-term liabilities of the non-banking private sector rose by 22.8 billion dollars. While a net inflow of commercial credits amounting to 6 billion dollars was realized in the first eight months of the year, a net amount of 4.5 billion dollars was repaid in the rest of the year. FX assets of the banking sector increased 9.1 billion dollars in 2008.
While 1.9 billion dollars was repaid to the IMF, 3.6 billion dollars was withdrawn in 2008.

Macroeconomic Outlook
18
Box 2. 2: The Non-Banking Sector’s Foreign Currency Indebtedness
Following the 2001 crisis, the reforms in the Turkish banking sector, an improved public finance, as well as the monetary policy carried out by the Central Bank of the Republic of Turkey having instrument independence, promoted a significant reduction in risk premium, inflation, real interest rates and public sector borrowing requirement of the country, while providing a strong boost to the private sector activity. In that period, private investments grew quite rapidly, while the gap between saving and investment was mainly financed by long-term external loans. Private sector’s external debt stock increased at a more dramatic pace compared to other related economic aggregates (exports, machinery-equipment investments, firms’ assets), especially after 2004, mainly driven by the increases in external debt of non-bank firms. As of 2008, the non-bank external debt, accounting for 15 percent of GDP, exceeded one-third of total external debt stock.
The recent global financial turmoil evolved into a crisis in September 2008 and has a dampening effect on economic activity, trade volume and capital flows all over the world. As an open economy that relies heavily on foreign savings for financing of growth, Turkish economy cannot remain intact from the global financial turbulence. Financing of large current account deficit and external debt has become a growing concern for economic activity and financial stability in Turkey, particularly at a time of slower capital flows. The debt rollover ratios in the upcoming period will provide a broad indication of the likely impact of the crisis on Turkish economy. In this framework, containing spillovers from the global financial crisis will require an efficient management of credit supply and an effective credit mechanism in Turkey, as in the entire world. Hence, for maintaining investments and economic activity, in-depth analysis of the non-bank external debt stock (maturity structure, sectoral distribution, balance sheet structures of indebted firms, etc.) is of importance. In this box, a brief overview of FX indebtedness, particularly external borrowing, of the Turkish non-banking sector, is presented.
The non-bank external debt stock, which was 40.1 billion dollars at end-2005, increased with a rapid pace to 111.5 billion dollars at end-2008 (Table 1). Of this amount, 11.2 billion dollars and 100.3 billion dollars belong to non-bank financial companies and non-financial companies, respectively. Based on original maturities, the non-bank external debt is largely of long-term maturity profile. As a matter of fact, long-term external debt stock amounted to 109.6 billion dollars at end-2008, while short-term external debt stock was quite negligible (1.9 billion dollars). As the regulation on intermediation costs in Turkey punishes short-term (less than one year) borrowing, the maturity of debt stock is generally more than one year.
A large proportion of long-term non-bank external debt stock consists of debts of firms in services sector. As of the end of 2008, services sector accounts for 58.1 percent of the non-financial debt, manufacturing industries for 30.1 percent, and electricity-gas-water supply companies, mining and agricultural industries for the remaining 11.8 percent. External borrowing of the services sector concentrated in real estates, leasing and business activities and in transportation, storing and communication industries, while that of the manufacturing industry concentrated in base metals and food.
Table 1: Non-bank External Debt Stock (Billion Dollars)
2004 2005 2006 2007 2008External Debt Stock 32.8 40.0 61.8 91.7 111.5 Ratio to GDP, Percent 8.4 8.3 11.7 14.0 15.1Long Term 31.0 38.1 59.9 90.2 109.6Non-bank Financial Companies 2.8 3.7 6.4 11.0 10.9Non-financial Companies 28.2 34.4 53.3 79.2 98.7Short Term 1.8 1.8 2.0 1.5 1.9Non-bank Financial Companies 0.4 0.6 0.7 0.4 0.2Non-financial Companies 1.4 1.2 1.3 1.1 1.6Source: CBRT, TURKSTAT.
The creditor structure of the external debt of non-bank firms is a factor that determines the dynamics of the debt rollover. As of the end of 2008, borrowing from foreign commercial banks accounts for about 49.1 percent of total debt stock, whereas borrowing from foreign branches and subsidiaries of domestic commercial banks makes up 37.4 percent. Moreover, the share of floating rate instruments in the debt stock of non-bank firms amounts to 71 percent, with an average rate of LIBOR+2.2 percent. 61.7 percent of non-bank external debt stock is dollar denominated, while 35.4 percent is euro denominated. Non-bank firms have borrowed heavily through countries such as UK, Bahrain, Germany, and Malta. Among other factors, the fact that 250 firms, which were generally large-scale and/or exporters, held almost 70 percent of the debt stock, as of end-2007 restrained the risk perception related with this debt.
As of the end of 2008, time-to-maturity of outstanding long-term external debt of non-bank private sector indicates that about two-thirds of the non-bank long-term external debt stock is due in 2010 and after, despite a significant amount due in 2009 (Graph 1). Of the non-bank long-term external debt, 35.4 billion dollars is due in 2009, 18.2 billion dollars in 2010, and the remaining 55.1 billion dollars in 2011 and after. The amount due in 2009 makes the renewal of non-bank borrowing critical, at a time of tighter international liquidity conditions.
Graph 1: Maturity structure of private sector external debt(as of end 2008, billion US dollars)
35.4
18.213.4 11.3 9.1
21.2
0
10
20
30
40
2009 2010 2011 2012 2013 2014+
Source: CBRT

Macroeconomic Outlook
19
The global financial crisis that emerged in the summer of 2007 and deepened by mid-2008 caused domestic and global economic activity to slow down sharply, which raised concerns over the renewal of non-bank external debt. The rollover ratio of non-bank foreign borrowing has been above 100 percent since mid-90s, except for a ratio of 94.8 percent during the crisis in 2001 (Graph 2).
Graph 2: Non-banking sector external debt rollover ratio (%)
0306090
120150180210240
1998 1999 2000 2001 2002 2003 2004 2005 2006 2007 20080306090120150180210240
creditstrade creditstotal
Source: CBRT
Due to the surge in external borrowing, non-bank net FX position has deteriorated rapidly in recent years, that is to say, non-bank FX liabilities exceeded FX-denominated assets remarkably. After hitting 20 billion dollars in 2004, the non-bank net FX position widened to a deficit of 86.1 billion dollars as of September 2008 (Graph 3). Although these macroeconomic indicators heighten the risk perceptions toward non-bank firms, inferences drawn from such aggregate data should be treated prudently. Besides, considering short-term non-bank assets and liabilities, the short-term FX short position is found to be quite small.
31.0 38.7 45.763.4 77.9 87.0
50.7 59.3 73.0
140.1173.1
101.1
-19.7 -20.6 -27.3 -37.7-62.3 -86.1
-100
-50
0
50
100
150
200
2003 2004 2005 2006 2007 Sept. 2008
FX Denominated AssetsFX Denominated LiabilitiesNet FX Position
Graph 3: FX position of non-bank private sector (Billion Dollars)
Source: CBRT
Firm-level data establish a detailed and accurate account of the risks that firms face due to their FX debts, and partially offset problems arising from aggregation. Data from CBRT Company Accounts and CBRT Risk Center reveals a strong positive correlation between the size-export ratios of firms (exports/total sales), and their FX borrowing. Moreover, firm-level data indicates that FX borrowing is higher in non-manufacturing sectors on average, which is consistent with the sectoral distribution of external debt presented above (Table 2).* Table 2: Average FX Debt by Sectors, Groups and Years (2000=100, Dollar)
Manufacturing Industries Non-manufacturing Sectors Total Exporters Small Large Total Exporters Small Large
2000 93 119 3 216 112 168 4 288 2001 89 110 2 199 128 168 3 325 2002 98 124 2 220 137 195 3 358 2003 111 145 3 253 136 193 3 354 2004 140 179 3 334 154 230 3 413 2005 168 206 4 404 194 321 4 519 2006 192 235 5 450 246 434 5 655 2007 253 313 7 593 311 494 7 828
Change (Times) 2.7 2.6 2.6 2.7 2.8 2.9 2.0 2.9 Source: CBRT Note: The average FX debt of firms (in dollars) is assumed to be 100 in 2000, and the amount of their debt (by industries, groups and years) is indexed to that year. Large-scale firms are firms with 250 and more employees, small-scale firms are firms with less than 50 employees, and exporters are firms that export more than 25 percent of their total sales.
Indicators such as profitability, maturity structure, exports/FX debt ratio and leverage ratio suggest that firms with greater FX debts have sounder balance sheet structure on average compared to other firms in the data set. Although this fact alleviates concerns about the rollover of corporate debt, global credit conditions will still have a determining role in this respect. The fact that firms with higher FX liabilities are mostly large-scale and/or exporters, provides a natural hedge against foreign exchange volatilities. This is also confirmed by the fact that large-scale and/or exporting firms maintained high levels of liability dollarization rates as opposed to falling rate of liability dollarization in small-scale and/or non-exporting firms (Graph 4 and Graph 5).

Macroeconomic Outlook
20
3035404550556065707580
2000 2001 2002 2003 2004 2005 2006 2007
Exporter FirmsNon-financial firmsNon-exporter firms
Graph 4: Non-financial firms debt dollarization(Company groups by their exports, Percent)
Source: CBRT
10
20
30
40
50
60
70
80
2000 2001 2002 2003 2004 2005 2006 2007
Large Medium Small
Graph 5: Non-financial firms debt dollarization(Company groups by scale, Percent)
Source: CBRT
To sum up, Turkey’s non-banking sector holds a substantial open FX position, and is therefore sensitive to external shocks, particularly
exchange rate fluctuations. However, the concentration of these FX liabilities in large-scale and/or exporting firms with relatively sound balance sheets reduces default risk. Moreover, the fact that about one-third of non-bank firms’ external debt has been borrowed from foreign branches of domestic commercial banks also needs to be considered. Since further declines in domestic and foreign demand are expected in 2009, together with some further tightening in credit conditions, the FX liabilities of the non-banking sector need to be closely monitored to preserve macroeconomic stability.
* CBRT Company Accounts and Risk Center surveys involve data from around 5000 companies.
2.2. Medium Term Macroeconomic Scenario
The 2008 PEP was prepared in a very different economic environment compared to the previous PEPs. As explained in the Recent Economic Developments section, a global slowdown/contraction period is being experienced in the world. Therefore, in addition to the stability oriented macroeconomic policies implemented in recent years, choices and priorities regarding growth-inflation-employment are taken into consideration given the constraints of the global economic conjuncture and other domestic economic needs. In this scope, the main purpose of the economic policies to be implemented in the PEP period is to minimize adverse impacts of the global economic crisis on domestic growth, to continue the disinflation process, and to establish a favorable environment for sustainable growth in medium term as a result of supportive fiscal and incomes policies for macroeconomic stability, and thereby to maintain the EU convergence process.
2.2.1. Real Sector
The world economic environment envisaged for the 2008 PEP period departs significantly from the economic environment that prevailed from 2002 to 2008. The most distinct changes in the

Macroeconomic Outlook
21
economic environment for developing countries are the interruption of the high growth period and the capital flow bonanza observed in the previous six years. The macroeconomic forecasts of 2009-2011 period for Turkish economy were prepared, taking these issues into account.
Demand Components of Growth
Turkish economy, which grew at an average rate of 7.2 percent in the period of 2002-2006, started to slowdown due to global uncertainties that emerged in 2007 and intensified in late 2008. The financial turmoil, which started in 2007, deepened starting from the second half of 2008 and turned into a full-blown global crisis. The negative effects of the crisis on the Turkish economy became apparent in the second half of the year. Due to the adverse effects of lack-of-confidence stemming from the global crisis on domestic demand and contraction of EU economy, the most important export market of Turkey, Turkish economy contracted in the last quarter of 2008 for the first time since 2001. As a result of these developments, economy grew by only 1.1 percent in 2008.
As of the beginning of 2009, it is expected that contraction will continue in major export partners of Turkey. Furthermore, continued uncertainty in global financial markets and the failure to clear troubled assets from the global financial system still pose significant risks. International organizations predict that the contraction will continue in developed economies, growth will slow down in developing economies in 2009, and a recovery would start in 2010.
Under this baseline scenario for the world economy, it is predicted that Turkish economy will also contract in 2009; however, recovery will begin in 2010. It is considered that the Turkish economy, which exposed to the global crisis with reduced vulnerabilities due to a strong banking sector and a sound budget and debt structure in the public sector, is likely to start its recovery together with the developed economies.
Table 2. 10: Demand Components of Growth (Percentage Changes, at 1998 Prices)
Forecast 2007 2008 2009 2010 2011
Total Consumption Expenditure 4.9 0.5 -2.3 2.8 4.1 Private 4.6 0.3 -3.1 3.0 4.3 Public 6.5 1.8 3.1 1.6 2.8 Total Investment Expenditure 8.3 -3.5 -14.0 6.2 9.6 Gross Fixed Capital Formation 5.4 -4.6 -13.3 6.2 8.5 Private Fixed Investment 5.3 -7.3 -14.4 6.8 9.2 Public Fixed Investment 6.3 13.1 -7.3 3.0 4.7 Change in Inventories (1) 0.7 0.3 -0.2 0.0 0.3 Exports of Goods and Services 7.3 2.6 -10.9 6.9 6.7 Imports of Goods and Services 10.7 -3.1 -15.5 7.9 9.8 Gross Domestic Product 4.7 1.1 -3.6 3.3 4.5
Domestic Demand 5.7 -0.5 -5.1 3.6 5.3 Domestic Final Demand 5.0 -0.8 -4.9 3.6 5.1
(1) Contribution to GDP growth. Source: SPO, TURKSTAT
In this context, it is expected that the economy will contract by 3.6 percent in 2009. Private sector consumption expenditures is expected to decrease by 3.1 percent in 2009. It is foreseen that private sector fixed capital formation will contract by 14.4 percent in 2009 due to significant tightening of global credit conditions and ensuing uncertainty. The declining demand in the export partners is also expected to be effective in this contraction. On the other hand, public sector fixed capital investments is expected to decline in 2009, while public sector consumption expenditures is predicted to increase. As a result of the contraction in trading partners, exports of goods and

Macroeconomic Outlook
22
services is likely to recede by 10.9 percent in 2009, and due to the slowdown in exports and domestic demand, imports of goods and services is expected to decline by 15.5 percent. Due to the fact that imports will decrease as a result of both the significant decline in domestic demand and the decrease in exports resulted from the sluggish foreign demand, the contribution of net exports to growth will be high. Thus, it is forecasted that the contribution of domestic demand to growth will be negative 5.2 percentage points, while the contribution of net exports to growth will be positive 1.6 percentage points in 2009.
After the contraction expected for 2009, it is forecasted that economy will start to recover in 2010 as a result of the improvement in global economic conditions and will grow by 3.3 percent. Growth is expected to continue in 2011 and GDP growth rate is expected to realize as 4.5 percent
Figure 2. 4: GDP Growth
-8-6-4-202468
1012
1999
2000
2001
2002
2003
2004
2005
2006
2007
2008
2009
2010
2011
Perc
enta
ge C
hang
e
GDP 1999-2008
Projection
It is expected that private sector consumption expenditures will increase at around the growth rate in 2010 and 2011 (Table 2.10). Private sector fixed capital investment is predicted to rise by 6.8 percent in 2010 and 9.2 percent in 2011. Among the reasons for the expected increase in investments are deferred investments, low interest rates and expected real appreciation of TL. However, the excess capacity, due to the sharp decline in the capacity utilization rates as a result of economic crisis, limited the growth in investments. Moreover, it is predicted that exports will grow by 6.9 percent and 6.7 percent respectively in 2010 and 2011 with the onset of the global economic recovery. Imports is expected to rise by 7.9 percent and 9.8 percent respectively in 2010 and 2011 along with increasing domestic demand and exports. It is expected that the public sector consumption and fixed capital investments will rise by 2.2 and 3.8 percent annually on average respectively in 2010-2011 period.
Thus, due to the effect of expected contraction for 2009, it is predicted that average growth in the period of 2009-2011 will be 1.3 percent. On the other hand, the average growth in the period of 2010-2011 will be 3.9 percent. Scrutinizing the contributions to growth for 2010-2011 period, the growth is expected to originate from private sector and the contribution of net exports to growth is expected to be negative.
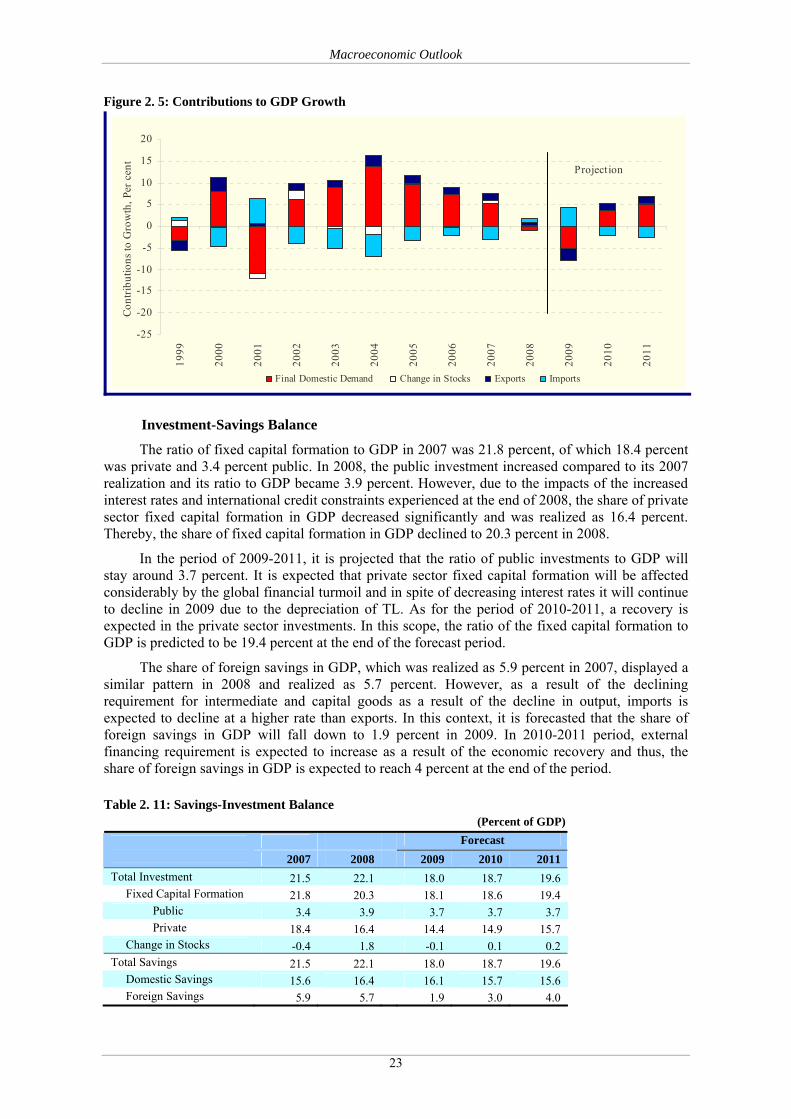
Macroeconomic Outlook
23
Figure 2. 5: Contributions to GDP Growth
-25
-20
-15
-10
-5
0
5
10
15
20
1999
2000
2001
2002
2003
2004
2005
2006
2007
2008
2009
2010
2011
Cont
ribut
ions
to G
row
th, P
er c
ent
Final Domestic Demand Change in Stocks Exports Imports
Projection
Investment-Savings Balance
The ratio of fixed capital formation to GDP in 2007 was 21.8 percent, of which 18.4 percent was private and 3.4 percent public. In 2008, the public investment increased compared to its 2007 realization and its ratio to GDP became 3.9 percent. However, due to the impacts of the increased interest rates and international credit constraints experienced at the end of 2008, the share of private sector fixed capital formation in GDP decreased significantly and was realized as 16.4 percent. Thereby, the share of fixed capital formation in GDP declined to 20.3 percent in 2008.
In the period of 2009-2011, it is projected that the ratio of public investments to GDP will stay around 3.7 percent. It is expected that private sector fixed capital formation will be affected considerably by the global financial turmoil and in spite of decreasing interest rates it will continue to decline in 2009 due to the depreciation of TL. As for the period of 2010-2011, a recovery is expected in the private sector investments. In this scope, the ratio of the fixed capital formation to GDP is predicted to be 19.4 percent at the end of the forecast period.
The share of foreign savings in GDP, which was realized as 5.9 percent in 2007, displayed a similar pattern in 2008 and realized as 5.7 percent. However, as a result of the declining requirement for intermediate and capital goods as a result of the decline in output, imports is expected to decline at a higher rate than exports. In this context, it is forecasted that the share of foreign savings in GDP will fall down to 1.9 percent in 2009. In 2010-2011 period, external financing requirement is expected to increase as a result of the economic recovery and thus, the share of foreign savings in GDP is expected to reach 4 percent at the end of the period.
Table 2. 11: Savings-Investment Balance (Percent of GDP)
Forecast 2007 2008 2009 2010 2011
Total Investment 21.5 22.1 18.0 18.7 19.6 Fixed Capital Formation 21.8 20.3 18.1 18.6 19.4 Public 3.4 3.9 3.7 3.7 3.7 Private 18.4 16.4 14.4 14.9 15.7 Change in Stocks -0.4 1.8 -0.1 0.1 0.2 Total Savings 21.5 22.1 18.0 18.7 19.6 Domestic Savings 15.6 16.4 16.1 15.7 15.6 Foreign Savings 5.9 5.7 1.9 3.0 4.0

Macroeconomic Outlook
24
The share of domestic savings in GDP was realized as 15.6 percent in 2007. This share increased slightly to 16.4 percent in 2008. As for 2009, the share of domestic savings in GDP is expected to decrease slightly compared to 2008. It is envisaged that the share of domestic savings in GDP will stay around 15.7 percent in 2010-2011 period.
Growth by Sectors
New national accounts were disclosed in 2008 based on a revised methodology and extended scope (Box 2.1). As a result of these changes, a disparity arose between the new and old national accounts regarding the composition of output by sectors. While the shares of agriculture and industry in output went down, that of services increased significantly.
Agricultural output, which shrank significantly in 2007 due to the drought, increased by 4.1 percent in 2008. In 2008 the share of agriculture in total of sectors was realized as 9.4 percent, increasing slightly compared to the pervious year. Agricultural value-added is expected to increase by 2.6 percent in 2009. In the 2010-2011 period, it is forecasted that value-added in agriculture will increase by 1.6 percent annually on average, and its share in total of sectors will realize as 9.6 percent at the end of period. Figure 2. 6: Composition of Production by Sectors
Percent of GDP
5
10
15
20
25
30
1998
1999
2000
2001
2002
2003
2004
2005
2006
2007
2008
2009
2010
2011
Agr
icul
ture
and
Indu
stry
, Per
cent
56
57
58
59
60
61
62
63
64
65
66
Serv
ices
, Per
cent
Agriculture Industry Services
Estimation
Industrial value-added increased by 1.1 percent throughout 2008. However, a 9.6 percent decrease in the last quarter in 2008 indicates that industry is the most seriously affected sector from the global crisis. Industrial value-added, which decreased in the last quarter of 2008, is expected to contract also throughout 2009. The decline in industrial value-added is forecasted to be 9.7 percent in 2009. Especially the output declines in exporting sectors due to the contraction of foreign demand will be determining in this development. In the period of 2010-2011, it is expected that the value-added in industry will increase by 3.8 percent on average, and the share of industry in total of sectors will be around 25.7 percent at the end of period.
The increase in value-added of services is realized as 1.5 percent in 2008. In 2009, value-added in services, which has the largest share in output, is expected to decline by 1.7 percent. The services sector is expected to grow by 3.8 percent annually on average in the period of 2010-2011, following the sluggish performance of 2008 and 2009. Consequently, the share of services sector in total is expected to reach 64.8 percent at the end of PEP period.

Macroeconomic Outlook
25
Table 2. 12: Value-Added by Sectors (At 1998 Prices, Percent)
Realizations Forecast 2005 2006 2007 2008 2009 2010 2011
Growth RatesAgriculture 7.2 1.4 -6.7 4.1 2.6 1.5 1.7Industry 8.6 8.3 5.8 1.1 -9.7 3.0 4.7Services 8.7 8.2 6.3 1.5 -1.7 3.5 4.2Total of Sectors 8.5 7.5 4.8 1.7 -3.5 3.2 4.0GDP 8.4 6.9 4.7 1.1 -3.6 3.3 4.5
Percent of GDPAgriculture 10.9 10.3 9.2 9.4 10.0 9.8 9.6Industry 27.0 27.2 27.4 27.3 25.5 25.5 25.7Services 62.1 62.5 63.4 63.3 64.5 64.7 64.8Total of Sectors 100.0 100.0 100.0 100.0 100.0 100.0 100.0GDP 103.2 102.6 102.4 101.8 101.7 101.8 102.2
Sources of Growth
The Turkish economy, having grown rapidly after the crisis of 2001, started to slowdown in 2007. The growth rate of GDP in 2007 was 4.7 percent, and the growth rates of employment and total factor productivity (TFP) decreased compared to the previous year. Consequently, the contributions of employment and TFP to growth receded, while the largest contribution came from the capital stock in 2007.
The growth rate in Turkish economy slowed down significantly in 2008 due to the financial crisis. In 2008, although capital accumulation slowed down due to contraction of investment, the highest contribution to growth stemmed from the capital stock. It is predicted that the rate of capital accumulation will be higher in 2010 and 2011 compared to the previous years. Since the capital stock is a cumulative production factor and reacts more slowly to shocks compared to other production factors, the capital stock is expected to be the main determinant of growth in the 2008 PEP period.
Employment, which is predicted to decline by 1.8 percent in 2009 due to the economic contraction, is expected to increase by 1.3 percent annually on average in 2010 and 2011 along with economic recovery.
Table 2. 13: Increases in Production Factors (Percent)
Period GDP Capital Stock Employment TFP 2006 6.9 7.1 1.3 3.0 2007 4.7 7.0 1.1 1.0 2008 1.1 5.8 1.5 -2.2 2009 -3.6 4.1 -1.8 -4.2 2010 3.3 4.2 1.0 0.9 2011 4.5 4.6 1.5 1.6 2009-2011 1.3 4.3 0.2 -0.6
In 2008 and 2009, TFP growth is estimated to be negative. However, the fact that TFP, which is estimated as Solow-residual in the production function, records negative growth rates in contractionary periods emerges as a methodological outcome. Nevertheless, this should not mean that TFP, a significant factor for sustainable economic growth, has lost its importance for the economy. Indeed, TFP emerges as a corollary of such factors as education expenditures, R&D expenditures, foreign direct investments, openness, institutional and physical infrastructure investments, etc. Therefore, temporary production declines or capacity losses in crises periods
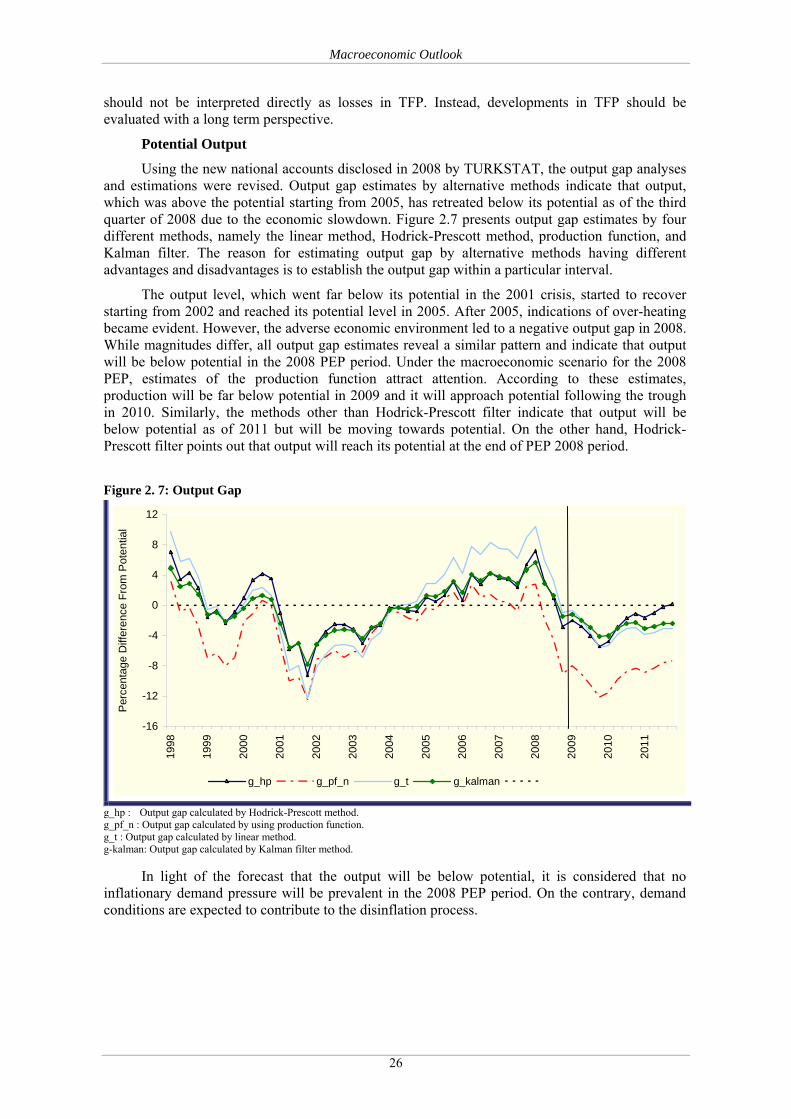
Macroeconomic Outlook
26
should not be interpreted directly as losses in TFP. Instead, developments in TFP should be evaluated with a long term perspective.
Potential Output
Using the new national accounts disclosed in 2008 by TURKSTAT, the output gap analyses and estimations were revised. Output gap estimates by alternative methods indicate that output, which was above the potential starting from 2005, has retreated below its potential as of the third quarter of 2008 due to the economic slowdown. Figure 2.7 presents output gap estimates by four different methods, namely the linear method, Hodrick-Prescott method, production function, and Kalman filter. The reason for estimating output gap by alternative methods having different advantages and disadvantages is to establish the output gap within a particular interval.
The output level, which went far below its potential in the 2001 crisis, started to recover starting from 2002 and reached its potential level in 2005. After 2005, indications of over-heating became evident. However, the adverse economic environment led to a negative output gap in 2008. While magnitudes differ, all output gap estimates reveal a similar pattern and indicate that output will be below potential in the 2008 PEP period. Under the macroeconomic scenario for the 2008 PEP, estimates of the production function attract attention. According to these estimates, production will be far below potential in 2009 and it will approach potential following the trough in 2010. Similarly, the methods other than Hodrick-Prescott filter indicate that output will be below potential as of 2011 but will be moving towards potential. On the other hand, Hodrick-Prescott filter points out that output will reach its potential at the end of PEP 2008 period.
Figure 2. 7: Output Gap
-16
-12
-8
-4
0
4
8
12
1998
1999
2000
2001
2002
2003
2004
2005
2006
2007
2008
2009
2010
2011
Per
cent
age
Diff
eren
ce F
rom
Pot
entia
l
g_hp g_pf_n g_t g_kalman
g_hp : Output gap calculated by Hodrick-Prescott method. g_pf_n : Output gap calculated by using production function. g_t : Output gap calculated by linear method. g-kalman: Output gap calculated by Kalman filter method.
In light of the forecast that the output will be below potential, it is considered that no inflationary demand pressure will be prevalent in the 2008 PEP period. On the contrary, demand conditions are expected to contribute to the disinflation process.

Macroeconomic Outlook
27
Labor Market8
In 2007, employment increased by 2.3 percent in non-agricultural sectors, while it contracted by 2 percent in agriculture, and overall employment growth was 1.1 percent.
Analyzing 2008 figures, it is observed that agricultural employment continued to contract in the first half of the year, while it increased in the second half. Despite deteriorating economic conditions, non-agricultural employment increased throughout 2008. In this context, it is estimated that the non-agricultural employment increased by 2 percent, and total employment by 1.5 percent in 2008.
In this period, the major reason for recording a certain level of employment growth despite the global financial crisis was that the crisis in financial markets reflected onto the real sector only in the last months of the year. As indicated in Recent Economic Developments section, the effects of the crisis on the real sector became more pronounced starting from October, and the job losses particularly in industry emerged after that month. Thus, annual employment figures do not show a significant worsening in 2008. However, due to the labor market deterioration in the final quarter of the year, unemployment rate is expected to rise by 0.7 percentage points to 10.6 percent. The increase in the unemployment rate in 2008 was basically driven also by developments in labor force participation.
Table 2. 14: Developments in the Labor Market
(15 + Age)
Realization Forecast
2006 2007 2008* 2009 2010 2011
Working Age Population (Thousands of Persons) 48,485 49,215 49,974 50,724 51,474 52,226Labor Force Participation Rate (Percent) 48.0 47.8 48.2 48.2 48.2 48.2Labor Force (Thousands of Persons) 23,250 23,523 24,073 24,434 24,795 25,157 Employment 20,954 21,189 21,513 21,123 21,338 21,660 Agriculture 5,713 5,601 5,609 5,553 5,497 5,442 Non-agricultural 15,241 15,588 15,904 15,571 15,841 16,218 Unemployed 2,295 2,334 2,560 3,310 3,457 3,497Employment Increase (Percent) ---- 1.1 1.5 -1.8 1.0 1.5 Agriculture ---- -2.0 0.1 -1.0 -1.0 -1.0 Non-agricultural ---- 2.3 2.0 -2.1 1.7 2.4Employment Rate (Percent) 43.2 43.1 43.0 41.6 41.5 41.5Unemployment Rate (Percent) 9.9 9.9 10.6 13.5 13.9 13.9Employment by Sectors (Percent) Agriculture 27.3 26.4 26.1 26.3 25.8 25.1 Non-agricultural 72.7 73.6 73.9 73.7 74.2 74.9
* Realization Forecast Source: TURKSTAT
Employment is expected to decline in 2009 in which the economy will contract. It is
predicted that the non-agricultural employment will contract by 2.1 percent in 2009, while agricultural employment will contract by 1 percent. Thus, it is expected that aggregate employment will contract by 1.8 percent and the unemployment rate will rise to 13.5 percent in 2009.
It is envisaged that new job opportunities will arise particularly in the non-agricultural sectors with the onset of the economic recovery in 2010-2011. In this context, it is predicted that non-agricultural employment will increase by 2 percent annually on average, whereas agricultural employment will continue to decline during the 2010-2011 period. It is expected that employment will increase by 537 thousand people as a result of these two counteracting forces in 2010-2011. However, since 2009 is a lost year in terms of job creation, it is expected that this increase in employment will not be sufficient to reduce the unemployment rate, which will stay around 13.9 percent. 8 TURKSTAT started to disclose the Household Labor Force Survey according to the address based population registration system starting from November 2006. The figures presented in this section are not comparable with the figures prior to 2006 due to the discrepancy in the size of the population.

Macroeconomic Outlook
28
2.2.2. Inflation, Money and Exchange Rate Policies
Inflation targeting regime will be continued in 2008 PEP period in compliance with the main objective of establishing price stability. The ultimate target is to decrease inflation rate to the levels complying with the Maastricht criteria. Within this context, the end-year inflation targets for the years 2009, 2010 and 2011 are set as 7.5 percent, 6.5 percent and 5.5 percent, respectively.
Within this scope, by considering the structural transformation in the economy, the process of convergence to developed countries and the pricing behaviors inherited from the high inflation period; a gradual target path towards price stability is envisaged. As the main policy instrument, short term interest rates will be determined by considering medium term inflation outlook as before. Furthermore, the Central Bank may use instruments such as required reserve ratios or effective liquidity management if necessary.
Table 2. 15: Inflation Targets
(Percentage Change)
2009 2010 2011 CPI 7.5 6.5 5.5
According to the forecasts included in the latest Inflation Report dated January 2009, which is
the main communication tool of the Central Bank, it is forecasted that, with 70 percent probability, the inflation rate will be between 5.4 percent and 8.2 percent (midpoint 6.8) in 2009 and will be between 4 percent and 7.6 percent (midpoint 5.8) at the end of 2010. The inflation rate is expected to fall down to 5.2 percent by the end of 2011. These forecasts based on the following assumptions: the support of aggregate demand conditions to disinflation will increase significantly compared to the previous periods, oil prices will be around 55 dollars, inflation in food prices will fall down to 7.5, 6 and 6 for the years 2008, 2009 and 2010, respectively, and the economies of developed countries will continue to contract during 2009 before recovering gradually in 2010. Accordingly a framework, in which the depreciation in foreign exchange rates will be offset by the improvement in food and energy prices and the fiscal and income policies will be carried out in accordance with the pre-announced inflation targets, is envisaged. Ongoing uncertainties regarding the commodity prices and international financial markets are considered as important risk factors that could change the outlook of the inflation and monetary policy. Although the forecasts for global economic growth have been revised downwards recently, it is stated that downward risks remain. This fact increases the probability that the inflation will undershoot the target at the end of 2009.
The Central Bank will take additional measures should the problems in international markets worsen and affect domestic financial markets. Within this context, the transaction limits may be increased in foreign exchange deposit market and FX required reserve ratios may be reduced to a limited extent.
Without contradicting with the floating exchange rate regime, foreign exchange sales auctions may be restarted should the foreign exchange market deemed shallow and the Central Bank may directly intervene in the market if non-competitive pricing resulting from speculative behaviors is observed. In case of excess FX supply, the Central Bank may start pre-announced FX purchase auctions to accumulate reserves.
2.2.3. Balance of Payments
Current Account
The current account deficit, which rose by 19.2 percent and was recorded as 38.2 billion dollars in 2007, increased by 9.1 percent and reached 41.7 billion dollars in 2008. Thus, the global economic crisis caused a slowdown on the growth rate of the current account deficit.
The EU-27 economy, which grew by 2.9 percent in 2007 and 0.9 percent in 2008, is expected to contract in 2009. Concomitantly, exports are forecasted to shrink by 21.2 percent and to be 104 billion dollars in 2009. In the upcoming period, exports are expected to pick up and reach 111.5 billion dollars in 2010 and 120.1 billion dollars in 2011.

Macroeconomic Outlook
29
In line with the expectation that the contraction in the final quarter of 2008 will continue and energy prices will maintain their low levels in 2009, the demand for imports is predicted to go down remarkably and be about 138 billion dollars. Starting from 2010, along with the recovery in domestic demand, import demand is expected to be 155 billion dollars in 2010 and 174 billion dollars in 2011. Low international energy prices will be effective on this outcome.
Tourism revenues which reached 21.9 billion dollars in 2008 are expected to recede to 20.9 billion dollars in 2009 due to the slowdown in the global economy. However, it is foreseen to return to its upward trend in 2010 and 2011.
In this context, the current accounts deficit is expected to recede to 11 billion dollars due to the expected contraction in trade volume in 2009. With the onset of the economic recovery in 2010 and 2011, the current account deficit is expected to revert to its upward trend and reach 18.6 billion dollars and 26.4 billion dollars, respectively. Thereby, the ratio of current accounts deficit to GDP will go down from 5.7 percent in 2008 to 1.9 percent in 2009, then rise progressively to 3 percent in 2010 and 4 percent in 2011.
Capital and Financial Account
Global economic crisis caused a significant contraction in international capital movements and a decrease in borrowing possibilities. There are some important uncertainties regarding the trend of capital flows in the forthcoming period. The analysis of capital and financial account has been made under the assumptions that confidence in the economy will be increased through the measures to be taken in the 2008 PEP period and that the expected recovery in international capital markets will start in 2010.
The capital and financial account, which was recorded as 36.2 billion dollars, excluding reserve assets, in 2008, is expected to record a deficit of 6.4 billion dollars in 2009. With the global economy recovering, international capital flows are expected to increase again and capital inflows to Turkey are expected to resume starting from 2010. Thereby, capital and financial account balance –excluding reserve assets– is expected to record at 25.1 billion dollars and 32.1 billion dollars in 2010 and 2011, respectively.
Net direct investments, which were realized as 15.6 billion dollars in 2008, are expected to decrease significantly due to the global economic conditions and remain at 8.6 billion dollars in 2009. Direct investments are expected to increase along with the recovery of the global economy. In this context, net direct investments are expected to reach 9.6 billion dollars and 11.1 billion dollars in 2010 and 2011, respectively.
Portfolio investments, which were forecasted as 2.7 billion dollars in the previous PEP, were realized as -4.8 billion dollars in 2008. This item is expected to record a deficit of 1.4 billion dollars in 2009. In 2010, recovery is expected to start in this item and a capital inflow of 1.2 billion dollars is expected to be recorded. It is expected that the recovery will continue and 2.8 billion dollars of portfolio investment will be recorded in 2011.
Other investments were realized above the expectations in 2007 and 2008. Thus, capital account was realized in line with the expectations in spite of the deviation observed in the portfolio investments. Other investments item was forecasted as 21.4 billion dollars and 23.9 billion dollars for years 2007 and 2008 respectively, and realized as 24 billion dollars in 2007 and 25.4 billion dollars in 2008. It is envisaged that the global economic crisis will have the severest impact on this item and it is expected to record a deficit of 13.6 billion dollars in 2009. In other investment item, a net inflow of 14.3 billion dollars in 2010 and 18.3 billion dollars in 2011 is expected. This recovery expected in 2010-2011 period depends on the assumption that global credit flows will resume with the return of the confidence in the global markets and that especially non-banking private sector will attract significant amount of net capital inflows as in the recent years. A delayed or slower recovery than expected might result in a revision of projections and outlook regarding the capital account.
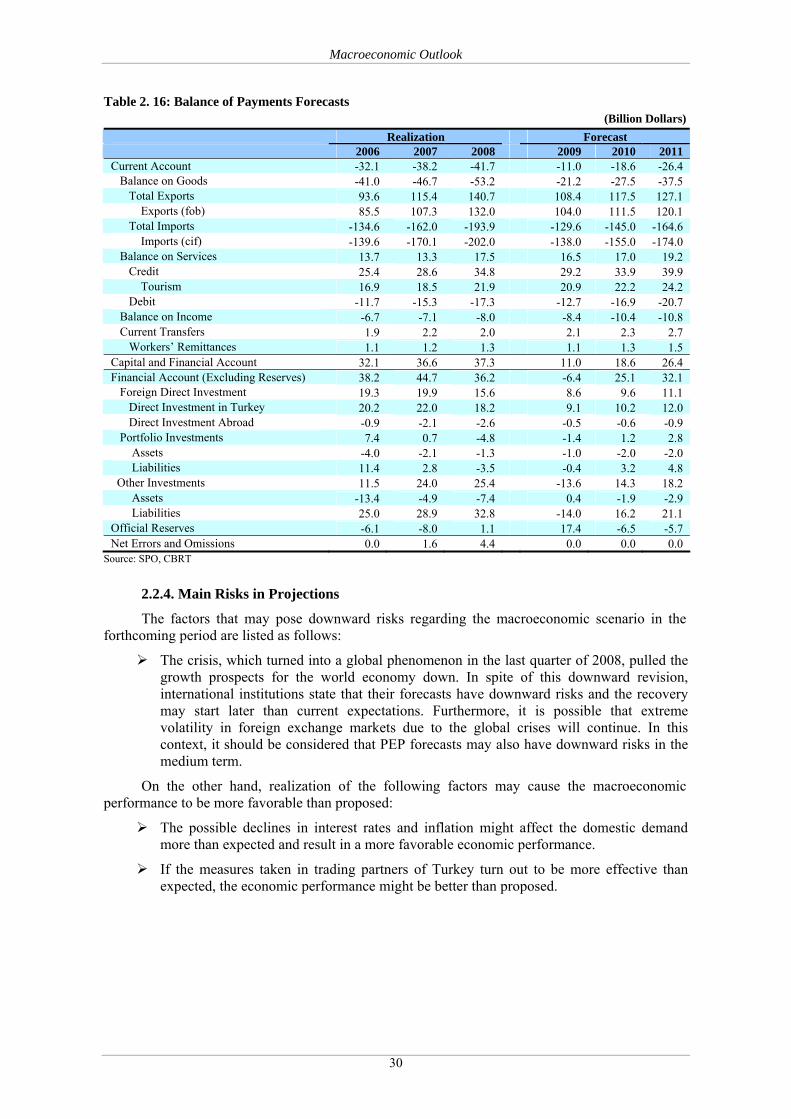
Macroeconomic Outlook
30
Table 2. 16: Balance of Payments Forecasts (Billion Dollars)
Realization Forecast 2006 2007 2008 2009 2010 2011 Current Account -32.1 -38.2 -41.7 -11.0 -18.6 -26.4 Balance on Goods -41.0 -46.7 -53.2 -21.2 -27.5 -37.5 Total Exports 93.6 115.4 140.7 108.4 117.5 127.1 Exports (fob) 85.5 107.3 132.0 104.0 111.5 120.1 Total Imports -134.6 -162.0 -193.9 -129.6 -145.0 -164.6 Imports (cif) -139.6 -170.1 -202.0 -138.0 -155.0 -174.0 Balance on Services 13.7 13.3 17.5 16.5 17.0 19.2 Credit 25.4 28.6 34.8 29.2 33.9 39.9 Tourism 16.9 18.5 21.9 20.9 22.2 24.2 Debit -11.7 -15.3 -17.3 -12.7 -16.9 -20.7 Balance on Income -6.7 -7.1 -8.0 -8.4 -10.4 -10.8 Current Transfers 1.9 2.2 2.0 2.1 2.3 2.7 Workers’ Remittances 1.1 1.2 1.3 1.1 1.3 1.5 Capital and Financial Account 32.1 36.6 37.3 11.0 18.6 26.4 Financial Account (Excluding Reserves) 38.2 44.7 36.2 -6.4 25.1 32.1 Foreign Direct Investment 19.3 19.9 15.6 8.6 9.6 11.1 Direct Investment in Turkey 20.2 22.0 18.2 9.1 10.2 12.0 Direct Investment Abroad -0.9 -2.1 -2.6 -0.5 -0.6 -0.9 Portfolio Investments 7.4 0.7 -4.8 -1.4 1.2 2.8 Assets -4.0 -2.1 -1.3 -1.0 -2.0 -2.0 Liabilities 11.4 2.8 -3.5 -0.4 3.2 4.8 Other Investments 11.5 24.0 25.4 -13.6 14.3 18.2 Assets -13.4 -4.9 -7.4 0.4 -1.9 -2.9 Liabilities 25.0 28.9 32.8 -14.0 16.2 21.1 Official Reserves -6.1 -8.0 1.1 17.4 -6.5 -5.7 Net Errors and Omissions 0.0 1.6 4.4 0.0 0.0 0.0
Source: SPO, CBRT
2.2.4. Main Risks in Projections
The factors that may pose downward risks regarding the macroeconomic scenario in the forthcoming period are listed as follows:
The crisis, which turned into a global phenomenon in the last quarter of 2008, pulled the growth prospects for the world economy down. In spite of this downward revision, international institutions state that their forecasts have downward risks and the recovery may start later than current expectations. Furthermore, it is possible that extreme volatility in foreign exchange markets due to the global crises will continue. In this context, it should be considered that PEP forecasts may also have downward risks in the medium term.
On the other hand, realization of the following factors may cause the macroeconomic performance to be more favorable than proposed:
The possible declines in interest rates and inflation might affect the domestic demand more than expected and result in a more favorable economic performance.
If the measures taken in trading partners of Turkey turn out to be more effective than expected, the economic performance might be better than proposed.
Public Finances
31
3. PUBLIC FINANCES
The fiscal policy continued since early 2000s is based on yielding primary surplus to reduce the public debt stock in the medium term, supporting the establishment and sustainability of macroeconomic stability and contributing to anti-inflationary efforts. In the 2008 PEP period, it is aimed to implement a flexible finance policy and yielding reasonable amount of primary surplus in order to mitigate the effects of the global financial crisis.
3.1. General Government Balance and Public Debt
The general government consists of the public organizations and institutions covered by the central government budget, local administrations, non-budgetary funds, social security institutions, revolving funds and unemployment insurance fund. Once the general government balance runs a deficit, the necessary financing is obtained through borrowing.
3.1.1. Fiscal Policy Strategy and Medium Term Objectives
The basic objectives of the fiscal policy are contributing to the fight against inflation and current account deficit through implementing a policy of yielding a reasonable amount of primary surplus, and reducing the fiscal dominance in the financial markets to minimize the possible crowding out effect for the private sector borrowing in existing liquidity difficulty.
In order to sustain the macroeconomic stability, fiscal policy will be managed in harmony with the monetary and revenues policy and when considered necessary, measures will be continued to taken in order to alleviate the effects of the global financial crisis.
Necessary measures will be taken to strengthen the fiscal transparency in public finances and regulations and practices that would violate the fiscal transparency will be avoided. The impact analysis regarding the regulations and practices that would have financial impact will be implemented by taking their short term as well as medium and long term impacts into account.
In this context, the public revenues and expenditures policies to be implemented in the 2009-2011 period are as follows:
Revenues Policy
Stability in the implementation of the tax policies and predictability in taxation will be the main objective.
If considered necessary, for the purpose of the mitigating the effects of the global financial crisis, works will continue to revitalize the contracted demand, to decrease the existing stocks and to increase the production.
Works to determine the total tax expenditures will be concluded and no new regulations will be issued that will lead to new tax expenditures.
Works will continue to increase voluntary compliance with respect to taxation and to expand the tax base.
Second phase of reform intended to increase the revenues of the local administrations will be legislated in 2009. In line with the increase of the revenues of the local administrations, budget transfers to the local administrations will be reviewed and they will be forced to pay off their overdue payments to the central government.
For the local administrations with overdue debts to public authorities, the legal upper limit of 40 percent will be implemented in the deductions from their tax shares.
Efforts will be continued to simplify the tax legislation.
Through the implementation of the cost-based pricing formula, energy SEEs will be able to attain their primary surplus targets.
It will be ensured that Energy SEEs will not default in their taxes and other liabilities and it will also be ensured that BOTAŞ pays its deferred tax liabilities.

Public Finances
32
An action plan will be prepared to realize the implementation of the automatic tax collection system in 2010.
Expenditures Policy
In the budget implementation phase, if considered necessary, measures will continue to be taken in order to mitigate the effects of the global financial crisis.
In order to develop the sense of fiscal responsibility, technical and administrative capacity for fiscal management, internal supervision and internal auditing activities will be increased.
The draft law for the arrangement on fiscal rule and the establishment of the associated institutional framework will be submitted to the Turkish Grand National Assembly in 2009.
Fiscal rule will be completely brought in within the 2011 budget process.
As part of the fiscal rule implementation, measures will be taken to prevent the exceeding the appropriation in the budget through special appropriation arrangements.
Expenditure programs in the context of appropriateness, efficiency, effectiveness and opportunity costs in public expenditures will be revised and thereby expenditures that no longer have priority will be cancelled.
New non-budgetary funds will not be allowed.
Exceptions regarding the borrowing limits of the local administrations will be reviewed and reduced accordingly.
Including the local administrations, the deferred liabilities of the non-financial public sector will be reported on a three-monthly basis starting from the end of 2008 and increase of the said liabilities will be prevented.
Measures will be continued to control the financial burden resulting from medication and treatment expenditures.
In order to ensure the sustainability of the universal health insurance system, health expenditures will be monitored on a regular basis and taken under control.
3.1.2. Current Situation and Medium Term Perspective
Current Situation
Developments in the Central Government Budget Revenues and Expenditures
Following the full implementation of the Law No.5018 Public Financial Management and Control in 2006, the budget scope expanded, the shares transferred to local administrations and funds were shown as in-budget transfer costs and the weight of central government budget, which is the most important policy tool of public sector, in terms of total revenue and expenditure size increased. Accordingly, the central government budget continued to be the most important policy tool of the currently implemented economic program in 2007 as well.
Compared to the previous year, 2007 was a year in which the privatization revenues declined, no significant collections were made from SDIF and in which some of the regulations and decisions made in 2006 started to create expenditure pressure.
In 2007, the financial problems experienced by energy SEEs and the privatization revenues and revenues from asset-sales, were the most important elements affecting the central government revenues. The fact that even the energy SEEs failed to fulfill their obligations including tax, adversely affected the tax revenues collection. On the other hand, the cash payment of the remaining balance for the privatization of Turk Telekom and the sales revenues resulting from the real estates, which were higher than expected, generated a positive effect on the central government’s non-tax revenues.

Public Finances
33
The increase in the real wages and the registered employment rates as well as increasing interest rates, positively affected the tax revenue collection in 2007. The profitability in the banking sector also created a positive impact on the collection of the corporate tax. Accordingly, as a share of GDP, income tax was 4.1 percent and corporate tax was 1.6 percent.
The practice under the Law No. 5615 and known as the tax refund for paid workers in the income tax was cancelled in early 2007 and it was decided that starting from 2008; minimum living allowance will be applied. The minimum subsistence allowance is implemented by leaving a certain portion of the gross minimum wage out of tax for the worker himself, non-working and non-earning spouse and each child for whom he/she is responsible.
In 2007, the fact that the planned tax and expected price increase regarding the SCT applied to tobacco products did not take place and the decline in the sales of motor vehicles adversely impacted the collection of SCT. Internally collected VAT was adversely affected by the increasing tax refunds due to high export performances and the associated legal arrangements. In 2007, the shares of SCT and internally collected VAT in GDP, was respectively 4.6 percent and 2 percent.
In 2007, negative effects were experienced due to the fact that exchange rates were low and the financing problems in the energy industry, and therefore, the VAT collection for importation was realized as 3.1 percent as a share of GDP.
In 2007, promotion of temporary workers to permanent workers and according to the mass employment contract signed in that year, increased wages of the public workers and the employment of additional contract workers created an expenditure pressure on the personnel expenditures.
The payments made under the Law governing the Disabled, as well as the additional expenditures resulting from the improvement of the conditions to be entitled to the subsidies under the Law No. 5084 on the Encouragement of Investments, generated a pressure on the budget expenditures of 2007.
The provision of certified-seed support to farmers who suffered from draught, and the increase of wheat premiums to an unexpected level, the appropriation of the agricultural subsidy payments increased more than planned.
In 2007, several expenditure-related measures were taken to ensure the attainment of the primary surplus goals and to prevent the exceeding of the specified limit for the total budget expenditures. Accordingly, the appropriations for the last three months of the year, as specified with the relevant Budget Implementation Circular, were blocked.
The collections resulting from the restructuring of social security premium revenues and BAĞ-KUR pursuant to the Law No. 5458 enacted in 2006, declined in 2007, the insurance expenditures of the retired people increased as a result of the restructuring, the health expenditures increased due to the improved access to health-care services, the wage increases for retired people, all resulted in the increase of the open transfers to social security institutions by 0.7 percent to 3.1 percent as a share of GDP.
As a result of these developments, the ratio of the central government expenditures to GDP was 24.2 percent in 2007 and the ratio of the central government revenues to GDP was realized as 22.6 percent. The ratio of budget deficit to GDP was 1.6 percent and the primary surplus was realized as 4.2 percent.
The 19th Stand-by agreement with IMF implemented since 2005 May, ended in May 2008. Following the end of Stand-by agreement, in May 2008, the government has announced its new Medium-Term Budgetary Framework that it plans to implement.
In 2008, energy SEEs failed to fulfill their tax obligations completely as it was the case in the previous year and this adversely affected the tax performance. However, high interest rates that were higher than expected, the wage increase and inflation positively affected the tax collection and the corporate tax collection was higher than expected.

Public Finances
34
The changes in the consumer preferences and habits and the decline in the domestic demand especially in the last quarter of 2008, adversely affected the collection of SCT.
In 2008, as a result of the arrangements made under the Laws No. 5763 and No. 5793, 5,9 billion TL and 1,3 billion TL budget revenues were obtained from the privatization revenues and the income return of Unemployment Insurance Fund, respectively.
In 2008, pursuant to the Law No. 5793, the Council of Ministers were authorized to make additional payment to public workers who do not receive additional institutional payment, provided that it does not exceed 200 percent of the wage of the highest paid public worker. Accordingly, the Council of Ministers started to implement its additional payment decision as of August 15, 2008.
Table 3. 1: Central Government Budget Balance
(Share in GDP, Percent)
2006 2007 2008 2009* Expenditures 23.5 24.2 23.8 26.9
Non-interest Expenditures 17.4 18.4 18.5 21.0 Personnel Expenditures 5.0 5.2 5.1 5.7 Social Sec. Ins. Government Premium Expenditures 0.7 0.7 0.7 0.7 Goods and Services Purchase Expenditures 2.5 2.6 2.5 2.5 Current Transfers 6.6 7.5 7.4 9.5 Capital Expenditures 1.6 1.5 1.9 1.5 Capital Transfers 0.3 0.4 0.3 0.3 Lending 0.8 0.5 0.5 0.6 Reserve Appropriation 0.0 0.0 0.0 0.2
Interest Payments 6.1 5.8 5.3 6.0 Revenues 22.9 22.6 22.0 21.9
Tax Revenues 18.1 18.1 17.7 17.6 Non-Tax Revenues 4.1 3.5 3.0 3.1 Capital Revenues 0.3 0.7 0.9 0.9 Grants, Aids and Special Revenues 0.3 0.2 0.3 0.2
Primary Surplus 5.4 4.2 3.5 1.0 IMF Defined Primary Surplus 4.3 2.5 1.9 -0.5 Borrowing Requirement 0.6 1.6 1.8 5.0 * Realization forecast. Source: SPO, Ministry of Finance
In 2008, it was decided that 5 point of the insurance premium that is the responsibility of the
employer under the Law No. 5763, should be covered by the Treasury as of October 1, 2008. The drought-support, terrorism compensation payments and the payments for the Disabled under the Law continued and the terms for being entitled to advantages under the Law No. 5084, were improved through the recently enacted Laws No: 5350 and 5615. All these developments created expenditure pressure on current transfer expenditures; and the collections resulting from the reconstruction of the social security premium receivables under the Law No. 5797, resulted in the decline of the transfers to social security institutions from the central government budget.
Within the scope of the arrangements under the Laws No. 5763 and No.5793, the collections from privatization and a certain share of the income return revenues from the Unemployment Insurance Fund, were transferred to the central government budget to be used for Southeastern Anatolian Project (GAP) Action Plan and for the other economic and social development investments. This and the additional appropriations to be used for the investments by the General Directorate of Highways and the Ministry of Health, led to the exceeding of the initial appropriation.

Public Finances
35
Box 3. 1: Measures Taken for the Global Financial Crisis and their Estimated Fiscal Costs Estimated Fiscal Cost (Million TL)
2008 2009 2010 2008-10
-430 8,043 6,409 14,022 REVENUE MEASURES
-500 -500 Revenues in the context of the Law No. 5811 on the Introduction of Some Assets to the National Economy.
70 80 90 240 The withholding tax rate on gains from equities was reduced to zero percent for domestic investors.
Tax on individuals
The implementation of paying the taxes, which are overdue as of 31 October 2008, by installments of 18 months with 3 % interest rate, will be continued.
451 982 1,433
As a requirement of new incentive system, legal arrangement was made related to the implementation of reduced corporate tax and providing the right of easement of real estates belonging to the Treasury as investment locations for the new investments. Legal arrangement was undertaken for supporting the companies in textile sector, through tax advantages, to move their plants to certain provinces which will be determined by the Council of Ministers.
1,100 1,100The duration of the Incentive Law No. 5084, which has been already implemented in 49 provinces, ended in 31 December 2008. Its implementation period was extended for one year.
Business taxes
0 3,358 3,959 7,317From October 2008, in order to decrease the labor costs on employers, 5 percentage points of employers' social security contributions (over a total of 21.5 % ) was reduced and this amount will be paid by the Treasury.
100 110 210 Special Consumption Tax rate on internet was lowered to 5 % from 15 %. 600 600 Temporary reduction in Special Consumption Tax for motor vehicles.
80 80 Temporary reduction in Special Consumption Tax for white goods and a wide range of electronic household goods from 6.7% to 0%.
500 500 VAT reduction on new home sales above 150 m2, from 18% to 8% for three months. 200 200 VAT reduction on new office sales from 18% to 8% for three months. 200 200 VAT reduction on furniture from 18% to 8% for three months. 75 75 VAT reduction on IT products from 18% to 8% for three months.
Consumption taxes on specific goods and services
150 150 VAT reduction on machinery, equipment from 18% to 8% for three months.
208 176 384 In the context of the employment package, from May 2008, social security contributions for young and female workers are reduced.
Contributions for public pensions, unemployment, health care,.) 66 84 150 In the context of the employment package, employer's share of insurance premium for
disabled personnel will be subsidized by the Treasury (measure of employment package). 100 100 Removal of motor vehicles tax and fines for old vehicles to be scrapped.
400 902 1,302Resource Utilization Support Fund deduction taken from consumer loans was reduced from 15 % to 10 % under the condition that loans will not be used for commercial purposes by the banks and financial institutions.
275 275 Fee taken from real estate sales has been reduced from 1,5 % to 0.5 % (for three months)
Other revenue measures
100 106 206 Reduction in real estate transaction fee (permanently). 7,620 11,085 8,871 27,576 EXPENDITURE MEASURES
2,800 2,800 Road Investments
2,300 3,111 3,300 8,711The government will invest an additional amount of 19.4 billion TL between 2008 and 2012 for the South-eastern Anatolian Project (GAP), and the other projects for developing infrastructures and irrigation system.
Government consumption and investment
900 2,519 2,690 6,109 Increase in civil servant salaries. Transfers to household 40 172 113 325 Unemployment insurance payment will be calculated in terms of gross instead of net and
thereby its amount will be increased by 11 percent.
646 646 In order to reduce the input costs of electricity energy, implementation of discounted night charge for 2009 will be extended to include the weekends and other official holidays.
1,300 229 1,529 With the legal arrangement, the amount of short-term working allowances was increased by 50 percent. Moreover, its duration was increased from 3 months to 6 months.
150 150 Additional appropriation for Support and Price Stabilization Fund and Small and Medium Sized Industry Development Organization.
375 375 One year extension of the Law No. 5084 on incentives (For energy support).
Transfers to businesses
123 219 342 New Incentive System; support for interest expenditures of firms; cash support to the firms move their plants to the certain cities.
Transfers to sub-national governments 1,080 2,189 2,320 5,589 Increase in transfers to local administrations from central government.
Other spending 500 500 1,000 Paid in capital of Eximbank will have been increased from 1 billion TL to 2 billion TL.
1,455 11,318 0 12,773 FISCAL MEASURES WITH NO DIRECT OR IMMEDIATE IMPACT ON FISCAL BALANCES
1,700 1,700Guarantee limit of the Treasury was increased from 3 billion dollars to 4 billion dollars. The increment of 1 billion dollars will be mostly used to support exports and SMEs. Besides the limit for each company to resort Eximbank resources was increased from 10 million dollars to 20 million dollars.
Guarantee and insurance schemes for financial institutions
5,100 5,100The limit of export rediscount credit to be used by exporters has increased from 500 million dollars to 1 billion dollars that will be used in three times in one year. In addition, the usage of these credits has been rearranged and eased.
350 383 733 Small and Medium Sized Industry Development Organization (KOSGEB) has given zero interest loans to the SMEs. Total loan volume has reached to 733 million TL.
1,105 1,700 2,805 A loan of 1,650 billion dollars with zero interest rate was given to exporter SMEs by KOSGEB.
1,500 1,500Under a protocol, signed between Turkish Union of Chambers and Commodity Exchanges (TOBB) and Halkbank (a State Owned Bank), union member SMEs can use loans with low interest rates. According to the protocol, an amount of 800 million TL cash & non-cash loan and 400 million dollars export loan will be used.
Loans to enterprises
935 935 Under a protocol, signed between Turkish Textile Employers' Association and Ziraat Bank (a State Owned Bank), association member SMEs can use loans with low interest rates.
Total 8,645 30,446 15,280 54,371Budget Impact 7.190 19.128 15.280 41.598Non-Budget Impact 1.455 11.318 0 12.773Share in GDP, % 0.89 2.90 1.33 5.13

Public Finances
36
As a result of these developments, the central government budget expenditures to GDP was realized as 23.8 percent in 2008 whereas the central government budget revenues were realized as 22 percent. Thus, the ratio of budget deficit and the primary surplus to GDP were 1.8 percent and 3.5 percent respectively.
Developments Regarding General Government Revenues and Expenditures
The ratio of general government revenues to GDP dropped to 33.6 percent in 2007 from 34.8 percent in 2006. The ratio of general government tax revenues to GDP, in 2007, was realized 0.2 points below the previous year’s level. In this decline, poor performance of indirect taxes of central government budget was effective. In line with this development, the share of the indirect taxes in the total taxes dropped to 67.1 percent from the previous year’s level of 69.3 percent.
Table 3. 2: Revenues and Expenditures of General Government - 1 (Share in GDP, Percent)
2004 2005 2006 2007Taxes 18.1 18.6 18.8 18.6 Direct 5.6 5.6 5.2 5.6 Indirect 12.0 12.5 13.0 12.5 Wealth 0.5 0.6 0.5 0.6Non-Tax Revenues 2.4 2.5 2.5 2.1Factor Incomes 5.3 6.0 6.1 5.8Social Funds 5.4 5.2 5.9 5.7Total 31.2 32.3 33.2 32.2 Privatization Revenues 0.3 0.6 1.6 1.4Total Revenues 31.5 32.9 34.8 33.6Current Expenditures 13.6 13.4 14.6 15.0Investment Expenditures 2.4 2.9 3.0 3.2 Fixed Investment 2.4 2.9 2.9 3.1 Change in Stocks 0.0 0.0 0.0 0.1Transfer Expenditures 19.5 16.7 15.9 15.6 Current Transfers 19.0 16.3 14.9 15.0 Capital Transfers 0.6 0.4 1.0 0.6Stock Revaluation Fund 0.0 0.0 0.0 0.0Non-Interest Expenditures 25.2 25.8 27.3 27.9Total Expenditures 35.6 33.0 33.4 33.8Primary Surplus 6.3 7.1 7.5 5.7Borrowing Requirement 4.1 0.1 -1.4 0.2IMF Defined Primary Surplus 4.6 4.4 4.4 2.7
Source: SPO, Ministry of Finance The share of the general government total expenditures in GDP dropped to 33.8 percent in
2007 from the 33.4 percent in 2006. While the non-interest expenditures increased by 0.7 points, the decrease in interest expenditures was 0.3 points. In 2007, the share of investment expenditures in GDP increased by 0.2 points.
Through the Labor Law No. 5763 and the Law on the Amendment of some Laws, which are known as the Employment Package by the public, some arrangements were made directly related in the social security area. Under the Law, it was decided that as of the effective date, when women more than 18, regardless of their age, and men between 18-29 are recruited within the scope of a new employment contract, entire amount corresponding to the employer's liability regarding the disability, ageing, and death insurance premiums of these people for the first year will be covered by the Unemployment Insurance Fund. This amount will be 80 percent in the second year, 60 percent in the third year, 40 percent in the fourth year and 20 percent in the fifth year and will be transferred to SSI. Also to be effective from October 1, 2008, 5 points corresponding to the
Public Finances
37
employer’s liability regarding the disability, ageing and death insurance premiums of the employees working under an employment contract, was decided be covered by the Treasury.
Under the Law No. 5510 amended by the Law No. 5754, the transferred SSK and transferred BAĞ-KUR premium liabilities will be reconstructed and under this new arrangement, it will be possible to pay the liabilities in advance or with payment installments of up to 24 months and the delay penalty will be decreased by 85 percent in case of advance payment, and in case of payment in 12 months, it will be reduced by 55 percent and in case of payment in 24 months, it will be reduced by 35 percent. Also with respect to the reconstruction under the Law No.5797, 20-day additional application period was granted, the option of installment payment of up to 12 months was provided and it was decided that if paid in advance, the delay penalty will be reduced by 80 percent and in case of payment in 12 months, it will be reduced by 50 percent Accordingly, 6,676 million TL premium reconstruction revenues was obtained in 2008.
As a result of these developments, and particularly thanks to the privatization and the positive effect of one-time revenues, the general government balance to GDP ratio gave a deficit of only 0.2 percent in 2007, a drop from 1.4 percent in 2006. The ratio of general government borrowing requirement to GDP excluding interests, declined to 5.7 percent from 7.5 percent.
Medium Term Perspective
In the forecast of general government accounts, various assumptions about revenues and expenditures were taken into consideration for the period of 2009-2011.
Accordingly;
Tax and public wage and salary policies and SEE prices will be implemented in line with the program targets.
It is estimated that lump-sum tax and duties will be updated in line with the general economic circumstances and no arrangements that could lead to loss of revenue will be done.
It is aimed that the works on the strengthening of the supervision and implementation capacity of the tax administration will continue.
It is assumed that the SCT on fuel oil products will be increased with the same rate of inflation.
One-fourth of the income return revenues from the Unemployment Insurance Fund, and cash surplus of the Privatization Fund, will be recorded as revenue for the budget in the relevant period.
It is foreseen that the works on the reconstruction of the income tax system will be concluded in 2009. In accordance with the said works, it is intended to establish a fair, simple income tax system that is in line with the international tendencies and to reduce the informal economy by widening the tax base.
In order to support the standard reporting of the local administrations, Say2000i system will be expanded in 2009 to cover the biggest four Greater City Municipality.
In order to ensure the tracking of the refund and deduction requests digitally, the works to digitize the refund and deduction requests of the tax-payers are currently underway.
The works to improve the publication calendar for the balance sheet data of the non-financial sector companies, including those not traded in the stock exchange, will continue and the tracking and analysis capacities in the area will be reinforced.
In order to determine the required improvements, the legislation on the bankruptcy will be reviewed.

Public Finances
38
Box 3. 2: Fight Against Informal Economy An analysis was conducted as the first step in the policy priorities and measures announced with respect to the informal economy
in 2008 Program. This analysis was conducted by the Revenues Administration Directorate, which was determined as the responsible authority for the building of the strategy for fight against informal economy, in cooperation with the Ministry of Finance, Ministry of Labor and Social Security, Social Security Institute, EMRA, TPAB (Tobacco, Tobacco Products and Alcoholic Beverages Market Regulatory Authority) , BRSA, SPO, Treasury Undersecretariat and Customs Directorate as well as the Ministry of Industry and Trade and lays out the reasons, consequences and size of the informal economy.
Following the completion of the analysis, as a result of the works contributed to by the foregoing, ‘Action Plan for the Strategy for the Fight Against the Informal Economy’ was formulated in June 2008. Solution suggestions were provided regarding the reasons specified in the analysis and a schedule was established for the steps to be taken and for related performance indicators. As a result of these works, ‘Action Plan for the Fight Against Informal Economy 2008-2010' was formulated.
It is important to monitor the fight against informal economy, in order to determine delays, deviations and determining their causes and taking necessary measures. To this end, if the developments are not in accordance with the established indicators and the schedule, the delays, deviations and the relevant causes must be reported. Under the Action Plan for the Fight Against Informal Economy, the monitoring and evaluation of the implementation process, will be carried out by the Revenues Administration Directorate in line with the schedule and performance indicators specified in the plan. The institutions will monitor the activities for each activity, and report to the Revenues Administration Directorate every three months.
Accordingly, the objectives and goals of the strategy for the fight against informal economy, were set as follows:
GOAL OBJECTIVE a- Reinforcing the potential for generating formal employment
1- Encouraging formal economy b- Increasing voluntary compliance a- Improving the supervision capacity b- Sharing the database 2- Strengthening the Inspection Capacity and
Increasing the Deterrence of the Penalties c- Ensuring deterrence of the penalties a- Ensuring, strengthening and sustaining institutional cooperation 3- Ensuring and Strengthening the
Institutional and Social Agreement b- Ensuring and strengthening social agreement through training and promotion
Fight against informal economy continues in an effective manner in accordance with the strategy established thanks to the cooperation of the other institutions. Works are underway to build a call center where incidents can be reported easily and on time. Risk Analysis Center was built under the Revenues Administration Directorate and risk analysis model works were started for the supervision and compliance analysis on the corporate tax, income tax and VAT payers, for the purpose of speeding up and improving the fight against informal economy. Furthermore, labeling practice was started for the tobacco and alcohol market through the product tracking system and as a result, the tracking and supervision of the sector became possible.
In terms of the sectors, analysis works were conducted on risky tax-payer groups in order to research, analyze and report the tax deficit. Risk project work to determine and prevent informal economy, will continue.
The capacity of the data storage built to provide supervision and information for the purpose of fight against informal economy, was increased and as a result of the negotiations with various public authorities and private sector organizations, new information sources were included in the system. On the other hand, based on the tax-payer oriented administration view, some of the data of third parties regarding the business and activity situations of the tax-payers, were submitted to the tax-payers for review in an attempt to increase the compliance levels with respect to the taxation. It is planned to give a larger amount of third party information to the tax payers in the subsequent periods, in order to increase the tax awareness and compliance of the tax-payers.
Under these assumptions, the general government revenues excluding the privatization revenues, which were programmed to be 32 percent of the GDP in 2008, are estimated to be 32.6 percent in 2009. The general government revenues including privatization revenues, which were realized at 32.8 percent of GDP in 2008, are estimated to be at 33.6 percent in 2009. In 2011, it is estimated that the general government revenues excluding the privatization revenues will be 33.1 percent of GDP and the total general government revenues are estimated to be 33.9 percent of GDP in 2011. Also, in 2009-2011 period, approximately 1 percent of privatization revenue as a share of GDP is estimated.
Assumptions regarding expenditures:
It is assumed that the policy of restricting the amount of public personnel recruitment will continue, and the wages and salaries will be increased in accordance with the inflation target.
The pensions of the retired public servants will be increased in accordance with the inflation rate and the pensions of the transferred SSK and transferred BAĞ-KUR, will be increased in accordance with the former six-month cumulative inflation rate.

Public Finances
39
Health-care expenditures will be monitored, reviewed in a systematic manner, and necessary strategies will be developed to ensure cost efficiency.
As a result of the projections based on these assumptions, the share of the general government expenditures in GDP is estimated to be at 38.2 percent in 2009 and 36.7 percent in 2011, which was 34.2 percent in 2008. The share of primary expenditures in GDP is expected to reach 31.4 percent in 2011 with an increase of 2.7 points from the 28.7 percent level in 2008.
The share of the general government fixed capital investments in GDP is expected to recede to 2.8 percent in 2009, by a 0.5 points decrease from its 2008 level and to be 2.7 percent in 2011.
When the revenues and expenditures estimations are considered together, it is estimated that the balance which started to run a deficit again in 2007, will continue to run deficit in 2009-2011 period. Accordingly, the ratio of the general government budget deficit to GDP which was 1.5 percent in 2008, are estimated to be at 4.6 percent, 3.2 percent and 2.8 percent in 2009, 2010 and 2011, respectively.
However, it is estimated that general government primary surplus to GDP which was 4.1 percent in 2008, will be 1.7 percent in 2009, and 2.6 percent in 2010 and 2011.
Table 3. 3: Revenues and Expenditures of General Government - 2 (Share in GDP, Percent)
2008 2009 2010 2011Taxes 18.1 18.0 18.8 18.6 Direct 5.7 5.8 6.0 6.0 Indirect 11.8 11.6 11.9 11.8 Wealth 0.6 0.7 0.9 0.9Non-Tax Revenues 2.0 2.0 2.0 2.0Factor Incomes 5.5 5.4 5.2 5.2Social Funds 6.5 7.1 7.2 7.2Total 32.0 32.6 33.2 33.1 Privatization Revenues 0.8 1.0 1.0 0.8Total Revenues 32.8 33.6 34.2 33.9Current Expenditures 15.5 16.4 16.2 16.0Investment Expenditures 3.3 2.8 2.8 2.7 Fixed Investment 3.3 2.8 2.8 2.7 Change in Stocks 0.0 0.0 0.0 0.0Transfer Expenditures 15.4 18.9 18.4 18.0 Current Transfers 14.7 18.4 17.8 17.5 Capital Transfers 0.8 0.5 0.5 0.6Stock Revaluation Fund 0.0 0.0 0.0 0.0Non-Interest Expenditures 28.7 31.9 31.6 31.4Total Expenditures 34.2 38.2 37.4 36.7Primary Surplus 4.1 1.7 2.6 2.6Borrowing Requirement 1.5 4.6 3.2 2.8IMF Defined Primary Surplus 1.7 -0.6 0.5 0.6
Note: Return and tax refunds are not included in the figures for revenues and expenditures. Source: SPO
3.1.3. Structural and Cyclical Central Government Budget Balance
The structural and cyclical budget balances for the Turkish economy and cyclical impacts on the budget were examined for the 2008 PEP period, with the method commonly used by the European Commission and OECD9.
9 Pre-Accession Economic Program 2003

Public Finances
40
Figure 3. 1: Actual and Structural Primary Budget Balances
-10
-8
-6
-4
-2
0
2
4
6
8
10
1990
1991
1992
1993
1994
1995
1996
1997
1998
1999
2000
2001
2002
2003
2004
2005
2006
2007
2008
2009
2010
2011
Perc
ent
0.85
0.90
0.95
1.00
1.05
1.10
1.15
yp /
y
Structural PBB/GDP Actual PBB/GDP yp / y
PBB: Primary Budget Balance yp/y: Potential Output/Actual Output
When the structural primary budget balance and the actual primary budget balances presented in Figure 3.1 are examined, it is observed that the structural primary budget balance and the actual primary budget balance are very close in 2007. There is no cyclical impact is observed in that year. However, as of 2008, the structural and actual primary budget balances started to differ from each other significantly and the actual budget surplus significantly receded. It is estimated that the primary budget surplus to GDP which was around 5-5.5 in the previous years, will recede to 1.4 percent on average in 2008 PEP period. On the other hand, it is estimated that in 2009-2011 period, structural primary budget surplus will maintain its level.
Figure 3. 2: Actual and Structural Budget Balances
-17
-12
-7
-2
3
8
13
1990
1991
1992
1993
1994
1995
1996
1997
1998
1999
2000
2001
2002
2003
2004
2005
2006
2007
2008
2009
2010
2011
Perc
ent
0.85
0.90
0.95
1.00
1.05
1.10
1.15yp
/ y
Structural BB/GDPActual BB/GDPyp/y
BB: Budget Balance yp/y: Potential Output/Actual Output
Figure 3.2 presents the actual budget and the structural budget balances. It is observed that starting from 2005, the actual budget deficit significantly reduced with the help of the tight fiscal policy and the effect of the declining interest rates, however after 2007, budget balances started to

Public Finances
41
deteriorate. In consistence with the analyses done in 2007 PEP, the fluctuation in the international markets in 2006 and its reflection on the interest rates, the decline in interest payments to GDP ratio and its positive effects on budget ended in 2007 and 2008.
The financial crisis, which got serious in international markets towards the end of 2008, resulted in contraction in the Turkish economy and called for some measures against the crisis as it was the case in other developing and developed countries. With the help of the measures taken in order to the mitigate effects of the slowdown/contraction in the economy and the crisis, it is estimated that the budget deficit will increase significantly and its ratio to GDP will be around 4.1 percent on average in 2008 PEP period. However it is estimated that in 2009-2011 period, structural budget will be almost in balance.
The cyclical budget balance is calculated as the difference between the actual budget balance and the structural budget balance. As seen in Figure 3.3, there is no cyclical impact in 2007. In 2008, Turkish economy significantly slowed down due to the effect of global financial crisis. It is estimated that the economy will contract in 2009. According to the macroeconomic scenario presented in 2008 PEP period, it is estimated that, as it was the case in 2008, the production will be lower than potential in 2009-2011 period. Therefore, it is estimated that the cyclical impacts will be dominant in the said periods and the cyclical budget deficit will increase significantly.
Figure 3. 3: Cyclical Budget Balances
-5
-4
-3
-2
-1
0
1
2
3
4
5
1990
1991
1992
1993
1994
1995
1996
1997
1998
1999
2000
2001
2002
2003
2004
2005
2006
2007
2008
2009
2010
2011
Perc
ent
0.85
0.90
0.95
1.00
1.05
1.10
1.15
yp /
yCyclical BD/GDP yp/y
BB: Budget Balance yp/y: Potential Output/Actual Output
3.1.4. Public Debt Management
Institutional Responsibilities for Debt Management and Borrowing Limits
The Undersecretariat of Treasury executes debt management in line with the borrowing limit determined pursuant to Article 5 of the Law No. 4749 on Regulating Public Finance and Debt Management enacted in April 2002.
Along the lines of the legal framework, the main principles of public debt and risk management are determined as follows:
a) To follow a sustainable, transparent and accountable debt management policy that conforms to monetary and fiscal policies, considering macroeconomic balances,

Public Finances
42
b) To meet financing requirements at the appropriate cost in the medium and long term, taking into account the risks, regarding costs as well as domestic and international market conditions.
Net borrowing limit is described as the amount of difference between the initial budget appropriations and revenues in the budget law. This limit may be increased up to 5 percent within the year by considering the needs and development of debt management within the framework of same article of the mentioned Law.
In 2008, some amendments were made in the Law No. 4749 on Regulating Public Finance and Debt Management in order to enhance institutional efficiency in public debt management. In this scope, the practice of implementing strategic benchmarks has been bound to a legal basis. Moreover, it was incorporated in the Law that the decisions concerning debt management including the determination of the strategic benchmarks are under the responsibility of the Debt and Risk Management Committee which meets under the presidency of the Minister of State for Economic Affairs and consists of the Undersecretary, Deputy Undersecretaries and General Directors.
On the other hand, in 2007 the Undersecretariat of Treasury commenced a project, supported by SIGMA (Support for Improvement in Governance and Management), a joint venture of European Union, concerning operational risk management in order to reach the best international applications aimed at increasing work quality in the operational sense.
In this project, firstly, “the improvement of internal control mechanisms required for minimizing operational risks in debt management” was determined as a cooperation area with the SIGMA Board within the context of Peer Collaboration Mechanisms. In this scope, the work that had commenced with a pilot project on “Improving Internal Control Applications in Debt Transactions” was expanded in 2008. In line with these activities, a workshop on Internal Control Mechanisms applied in Debt Management Offices, supported by TAIEX (Technical Assistance Information Exchange Instrument), an EU foundation, was organized in Ankara at January 29-30, 2009. In this workshop, the experiences of England, Spain, Portugal and Italy on internal control and internal audit mechanisms were shared and the details of the studies on operational risk management in the Treasury were conveyed.
These activities, carried out within the context of operational risk management, are important for establishing the required mechanisms to determine the risks promptly and correctly in order to improve efficiency in the management of the assets and liabilities of the Treasury.
Other activities are also in progress in order to increase the institutional capacity in terms of debt management. For the purpose of improving the technical infrastructure of debt management, the tools used in modeling and simulation analyses have been enhanced. Furthermore, in 2009 several study tours are planned to various debt management offices in different countries of Europe within the scope of the Leonardo da Vinci Mobility project of the European Union to share information in the area of public debt management
Public Debt Stock
Current Situation
As a result of the implemented economic program, fiscal discipline and efficient borrowing strategies, the ratio of the EU defined general government nominal debt stock to GDP fell to the level of 39.5 percent at the end of 2008 from a level of 73.7 percent in 2002.
Table 3. 4: General Government Debt Stock
(Percent of GDP) 2002 2003 2004 2005 2006 2007 2008 EU General Government Nominal Debt Stock 73.7 67.4 59.2 52.3 46.1 39.4 39.5
Source: Undersecretariat of Treasury

Public Finances
43
The rate of the central government debt stock to GDP slightly increased by 0.4 points in 2008 and reached to 40 percent as of the end of 2008. However, in the last six years, the ratio decreased by 29.2 points.
Table 3. 5: Central Government Gross Debt Stock (Percent of GDP)
2002 2003 2004 2005 2006 2007 2008Domestic Debt Stock 42.8 42.7 40.2 37.7 33.2 30.3 28.9External Debt Stock 26.5 19.4 16.5 13.4 12.3 9.3 11.1Total 69.2 62.2 56.6 51.1 45.5 39.6 40.0
Source: Undersecretariat of Treasury
Table 3. 6: Central Government Debt Stock Composition by Instruments 2003 2004 2005 2006 2007 2008
Million TL % Million
TL % Million TL % Million
TL % Million TL % Million
TL %
OVERALL TOTAL 282,807 100 316,528 100 331,520 100 345,050 100 333,485 100 380,316 100
Fixed 138,116 49 170,276 54 166,106 50 186,169 54 185,883 56 216,561 57
Floating 144,691 51 146,252 46 165,414 50 158,881 46 147,602 44 163,755 43
TL Denominated 151,790 54 185,020 58 206,852 62 216,800 63 229,168 69 251,836 66
Fixed 68,614 24 94,930 30 101,444 31 111,457 32 116,993 35 126,271 33
Floating 83,175 29 90,090 28 105,408 32 105,343 31 112,175 34 125,566 33
FX Total 131,017 46 131,508 42 124,667 38 128,250 37 104,317 31 128,479 34
FX Denominated 113,140 40 122,067 39 119,098 36 126,569 37 103,106 31 127,716 34
Fixed 69,502 25 75,346 24 64,662 20 74,712 22 68,890 21 90,290 24
Floating 43,639 15 46,721 15 54,436 16 51,856 15 34,216 10 37,426 10
FX Indexed 17,877 6 9,441 3 5,570 2 1,681 0 1,211 0 764 0
Fixed 0 0 0 0 0 0 0 0 0 0 0 0
Floating 17,877 6 9,441 3 5,570 2 1,681 0 1,211 0 764 0
Total Dom. Debt Stock 194,387 100 224,483 100 244,782 100 251,470 100 255,310 100 274,827 100
Total Fixed 85,032 44 115,572 51 111,061 45 121,053 48 128,148 50 140,614 51
Total Floating 109,354 56 108,911 49 133,720 55 130,417 52 127,162 50 134,213 49
TL Denominated 151,790 78 185,020 82 206,852 85 216,800 86 229,168 90 251,836 92
Fixed 68,614 35 94,930 42 101,444 41 111,457 44 116,993 46 126,271 46
Floating 83,175 43 90,090 40 105,408 43 105,343 42 112,175 44 125,566 46
FX Denominated 24,720 13 30,021 13 32,360 13 32,989 13 24,931 10 22,227 8
Fixed 16,418 8 20,642 9 9,617 4 9,596 4 11,155 4 14,344 5
Floating 8,302 4 9,380 4 22,743 9 23,393 9 13,776 5 7,884 3
FX Indexed 17,877 9 9,441 4 5,570 2 1,681 1 1,211 0 764 0
Fixed 0 0 0 0 0 0 0 0 0 0 0 0
Floating 17,877 9 9,441 4 5,570 2 1,681 1 1,211 0 764 0
External Debt Stock 88,420 100 92,046 100 86,738 100 93,580 100 78,175 100 105,488 100
USD 35,723 40 38,973 42 42,245 49 49,236 53 43,310 55 57,303 54
JPY 5,222 6 3,854 4 3,095 4 3,062 3 2,701 3 4,774 5
EUR 23,328 26 23,708 26 21,089 24 25,451 27 23,253 30 29,593 28
SDR 23,365 26 24,765 27 19,662 23 15,130 16 8,327 11 12,965 12
Other 782 1 745 1 647 1 700 1 584 1 853 1
External Debt Stock 88,420 100 92,046 100 86,738 100 93,580 100 78,175 100 105,488 100
Fixed 53,084 60 54,704 59 55,045 63 65,116 70 57,735 74 75,946 72
Floating 35,337 40 37,341 41 31,693 37 28,463 30 20,440 26 29,542 28
Source: Undersecretariat of Treasury
Central government total debt stock, which was 242.7 billion TL at the end of 2002, stood at 380.3 billion TL at the end of 2008. As of end of 2008, share of domestic debt in the total central

Public Finances
44
government debt was 72.3 percent while that of external debt was 27.7 percent which was 10.5 points higher at the end of 2002. As a result of the applied borrowing strategies, the share of the debt stock in TL terms in the total stock has increased by years and reached to 66.2 percent as of the end of 2008. The share of foreign currency and foreign exchange indexed debts fell down to 33.8 percent at the end of 2008 by decreasing 24.3 points compared to the end of 2002. The share of fixed interest rate debt increased by 11.9 points in six years reaching 56.9 percent at the end of 2008. This situation has increased the sensitivity of stock to the volatilities in the exchange rates and interest rates.
Central government domestic debt stock stood at 274.8 billion TL as of the end of 2008 with an increase of 19.5 billion TL, compared to 2007. As of 2009 February, it reached to 288.9 billion TL. The ratio of the domestic debt stock to GDP fell down to 28.9 percent in 2008 from a level of 30.3 percent in 2007.
The share of TL debt stock in the total domestic debt stock sustained its upward trend over the years and reached 91.6 percent at the end of 2008, from its level of 89.8 percent at the end of 2007. As of 2009 February, the figure realized as 91.4 percent.
The share of public institutions in the central government total debt stock, that reached to a level of 66 percent due to the bonds issued to Saving Deposit Insurance Fund in line with the restructuring of the banking sector and the bonds issued for duty losses and capital injections to public banks in 2001, continued to decrease and fell down to 26.2 percent in 2007, 23.9 percent in 2008 and 23.3 percent in February 2009.
Table 3.7: Domestic Debt Stock by Lenders
2003 2004 2005 2006 2007 2008 2009 Feb. 2003 2004 2005 2006 2007 2008 2009
Feb. Million TL Share in Domestic Debt Stock, Percent
Total 194.4 224.5 244.8 251.5 255.3 274.8 288.9 100.0 100.0 100.0 100.0 100.0 100.0 100.0 Public 92.6 83.3 75.5 71.4 66.9 65.8 67.2 47.7 37.1 30.8 28.4 26.2 23.9 23.3 CBRT 18.4 18.4 18.4 17.8 16.0 13.0 13.0 9.5 8.2 7.5 7.1 6.3 4.7 4.5 State Banks 27.2 27.5 25.0 19.9 15.8 10.1 10.1 14.0 12.2 10.2 7.9 6.2 3.7 3.5 SDIF 15.1 8.3 4.5 4.5 3.8 3.1 3.1 7.7 3.7 1.8 1.8 1.5 1.1 1.1 CBRT (IMF Credits) 8.5 3.7 - - - - - 4.4 1.6 - - - - - Other 23.4 25.4 27.5 29.3 31.3 39.6 41.0 12.1 11.3 11.2 11.6 12.3 14.4 14.2 Market* 101.8 141.1 169.3 180.1 188.4 209.1 221.7 52.3 62.9 69.2 71.6 73.8 76.1 76.7
*Market includes the instruments issued to SDIF for the deposits of İmar Bank. Source: Undersecretariat of Treasury
The average maturity of the central government domestic debt stock fell down to 23.9 months at the end of 2008 from a level of 25.7 months at the end of 2007. It was 23.8 months as of 2009 February. In year 2008, the average maturity of non-cash domestic debt stock fell down to 19.8 months from 25.7 months. It stood at a level of 17.6 months as of 2009 February. The average maturity of cash domestic debt stock fell down to 24.4 months from 25.7 months in 2008 and it increased to 24.5 months as of 2009 February. This decrease is due to the fact that the non-cash bonds are repaid as they mature and the Treasury is not issuing new non-cash bonds in return for the redeemed ones.
Table 3. 8: Maturity Structure of Central Government Domestic Debt Stock
2003 2004 2005 2006 2007 2008 2009 Feb.
Average Maturity of Stock (Month) Cash 12.4 11.8 19.6 22.3 25.7 24.4 24.5 Non-Cash 51.2 45.5 38.7 32.0 25.7 19.8 17.6 Total 25.1 20.6 23.5 24.0 25.7 23.9 23.8
Source: Undersecretariat of Treasury

Public Finances
45
Central government external debt stock stood at 105.5 billion TL at the end of 2008. The share of fixed interest rate debt in the external debt that pursued an upward trend since 2002 and reached to 74 percent at the end of 2007 showed a slight decrease in 2008 to a level of 72 percent. In the currency composition, the shares of Euro and dollar denominated debt have been increasing in the last six years. In this regard, the share of the debt in dollar and Euro in the total external debt stock, which were 40 percent and 26 percent respectively at the end of 2002, raised to 54 percent and 28 percent level respectively as of end 2008, and the debt in SDR fell down to 12 percent level with a decrease of 13 points.
Table 3. 9: Time Remaining to Maturity of the Central Government’s External Debt 2007 2008
Stock
Time Remaining
to Maturity
Time Remaining to Average Maturity
Stock
Time Remaining
to Maturity
Time Remaining to Average Maturity
Million Euros % Year Year Million
Euros % Year Year
Maturity 45,713 100 9.3 7.7 49,275 100 9.6 7.9 Short Term (Less than 1 year) 0 0 0.0 0.0 0 0 0.0 0.0 Medium Term (1-5 years) 1,104 2 2.2 0.9 468 1 1.9 0.6 Long Term (More than 5 years) 44,609 98 9.5 7.9 48,807 99 9.7 8.0By Lender 45,713 100 9.3 7.7 49,275 100 9.6 7.9 Credit 19,326 42 8.6 4.9 21,791 44 8.8 5.0 International Organizations 11,769 26 7.9 4.6 13,359 27 7.4 4.4
IMF 4,866 11 3.9 1.6 6,049 12 3.3 1.6 Government Institutions 3,359 7 14.9 7.6 3,911 8 16.0 8.3
Other 4,198 9 5.8 3.8 4,520 9 6.5 3.7 Bond 26,387 58 9.8 9.8 27,484 56 10.3 10.3By Currency 45,713 100 9.3 7.7 49,275 100 9.6 7.9
USD 25,326 55 10.4 9.4 26,767 54 11.0 10.1 JPY 1,579 3 15.1 8.4 2,230 5 16.1 8.3 EUR 13,597 30 8.6 6.8 13,823 28 8.7 6.6 SDR 4,869 11 3.9 1.6 6,056 12 3.3 1.6 Other 341 1 11.2 5.3 398 1 11.4 5.1
Source: Undersecretariat of Treasury
The average time to maturity for the central government external debt stock was realized as 7.9 years at the end of 2008 with an increase of 0.2 years compared to the end of 2007. The time to maturity stood at 9.6 years at the end of 2008 with an increase of 0.3 year compared to the end of 2007.
Analyzing the maturity structure of the general government external debt stock, it is seen that the general government external debt stock is fully constituted by medium and long term liabilities since 2002.
The share of bonds in the general government external debt stock increased to 53.9 percent at the end of 2008. This increase is due to preferring bonds instead of loans in financing in addition to repayments of loans.
After the crisis experienced in 2001, the share of the loans provided from international organizations in the general government external debt stock almost doubled and this share stood at 36.9 percent and 38.3 percent in 2003 and 2004 respectively while it was 35.9 percent in 2002. As a result of high repayments, this share pursued a declining trend starting from 2005 and fell to a level of 27.3 percent at the end of 2008 with a decrease of 10.3 points compared to the end of 2004.
The share of dollar debt in the general government external debt stock showed an increasing trend until 2007. As a result of this trend, the share of dollar debt in the stock was realized as 55.5 percent at the end of 2007. The share decreased by 1.2 points to 54.3 percent in 2008. As a result of the loan repayments to IMF; the share of SDR denominated debt, which was around 25 percent in the period of 2002-2004, fell to 11.9 percent at the end of 2008. The share of Euro denominated

Public Finances
46
debt, which were around 25 percent in the same period, rose up to 29.5 percent at the end of 2007 with an increase of 4.3 points compared to 2004. As of the end of 2008, the share of Euro debt in the general government external debt stock realized as 28.2 percent.
Table 3. 10: General Government External Debt Stock Million Euros Percentage Distribution
2003 2004 2005 2006 2007 2008 2003 2004 2005 2006 2007 2008
By Type
Total 52,121 51,513 55,719 51,511 46,838 51,028 100.0 100.0 100.0 100.0 100.0 100.0
Bond 21,406 21,842 26,676 27,594 26,387 27,484 41.1 42.4 47.9 53.6 56.3 53.9
Credit 30,714 29,671 29,043 23,917 20,451 23,544 58.9 57.6 52.1 46.4 43.7 46.1
By Maturity
Total 52,121 51,513 55,719 51,511 46,838 51,028 100.0 100.0 100.0 100.0 100.0 100.0
Short Term 0.0 0.0 0.0 0.0 0.0 0.0 0.0 0.0 0.0 0.0 0.0 0.0
Medium-Long Term 52,121 51,513 55,719 51,511 46,838 51,028 100.0 100.0 100.0 100.0 100.0 100.0
By Lender
Total 52,121 51,513 55,719 51,511 46,838 51,028 100.0 100.0 100.0 100.0 100.0 100.0
International Organizations 19,241 19,717 19,128 15,110 12,163 13,952 36.9 38.3 34.3 29.3 26.0 27.3
Government Institutions 5,650 4,874 4,448 3,804 3,353 4,035 10.8 9.5 8.0 7.4 7.2 7.9
Commercial Banks 15,040 15,872 19,185 23,041 22,570 25,969 28.9 30.8 34.4 44.7 48.2 50.9
Other Private Creditors 12,190 11,051 12,959 9,556 8,752 7,072 23.4 21.5 23.3 18.6 18.7 13.9
By Currency
Total 52,121 51,513 55,719 51,511 46,838 51,028 100.0 100.0 100.0 100.0 100.0 100.0
USD 21,120 21,855 27,132 27,088 25,987 27,641 40.5 42.4 48.7 52.6 55.5 54.2
JPY 2,993 2,110 1,949 1,654 1,579 2,230 5.7 4.1 3.5 3.2 3.4 4.4
EUR 13,335 12,987 13,404 13,914 13,840 14,537 25.6 25.2 24.1 27.0 29.5 28.5
SDR 13,389 13,557 12,386 8,172 4,869 6,056 25.7 26.3 22.2 15.9 10.4 11.9
Other 1,283 1,005 849 683 562 564 2.5 2.0 1.5 1.3 1.2 1.1
Source: Undersecretariat of Treasury
Analyzing the borrowing realizations of 2008, it is seen that the cost of zero-coupon borrowing in TL terms, which was 18.4 percent on average in 2007, was slightly higher in 2008 with a level of 19.2 percent due to deepening of the crisis experienced in US credit markets.
Figure 3. 4: Average Maturity and Cost of Treasury’s Borrowing
0
20
40
60
80
100
120
140
160
180
200
2001
-01
2001
-07
2002
-01
2002
-07
2003
-01
2003
-07
2004
-01
2004
-07
2005
-01
2005
-07
2006
-01
2006
-07
2007
-01
2007
-07
2008
-01
2008
-07
%
0
10
20
30
40
50
60
Ay
Borçlanma Maliyeti (Sol Eksen)Borçlanma VadesiAverage Cost of Borrowing (left axis) Avegare Maturity of Borrowing
M o n t h s
Source: Undersecretariat of Treasury

Public Finances
47
The average maturity of domestic borrowing, which was 34 months in 2007, stood at 31.7 months in 2008.
Debt Management Strategy
Within the scope of accountable, transparent, and sustainable borrowing policies which are compatible with the monetary and fiscal policies, strategic benchmarking policy has been continued since 2004 in order to meet the financing requirement with an appropriate cost at a reasonable risk level in the medium and long term. Depending on the cost and risk calculations, to manage the public debt efficiently against the main risks of liquidity, exchange rates and interest rates, the following issues were implemented as the main pillars of the borrowing policy as part of the strategic benchmarks in 2008:
To borrow mainly in TL considering domestic cash borrowing,
To use fixed rate TL instruments as the major source of domestic cash borrowing and decrease the share of debt which has interest rate re-fixing period less than 12 months,
To increase the average maturity of domestic cash borrowing taking market conditions into consideration and decrease the share of debt maturing within 12 months,
To keep a certain level of cash reserve in order to reduce the liquidity risk associated with cash and debt management.
Furthermore, in line with the risk and cost targets, borrowing strategies complying with strategic benchmarks will be continued in the upcoming periods.
In this regard, policies concerning the improvement of efficiency in primary and secondary markets and enhancement of the investor base of the Government Domestic Borrowing Securities (GDBS) are planned to be continued. Within this context, Primary Dealership System application will be sustained. Besides, the works concerning direct sales of GDBS to individuals within the scope of retail sales will be continued. On the other hand, the Treasury will continue to issue benchmark securities with the aims of providing liquidity and forming a reliable yield curve in the secondary bond markets.
In line with the transparency principle in debt management, financing programs, monthly auction calendars and other information on public debt will be made publicly available in the forthcoming period, as in the previous years. As for the domestic borrowing, which constitutes a large part of the annual financing requirement; buy/back and switching transactions will be continued as active debt management tools, in accordance with the strategic benchmarks for the purpose of smoothing out the redemption profile.
Contingent Liabilities
The Undersecretariat of Treasury provides repayment guarantees to state economic enterprises, establishments subject to provisions of private law with more than 50 percent their capital belonging to the state, funds, state banks, investment and development banks, metropolitan municipalities, municipalities and establishments affiliated to municipalities and other local government agencies for the purposes of minimizing the investment financing costs, ensuring sustainability of growth and meeting funding requirements of the multi-year investment projects of the mentioned institutions. Within this context, the Undersecretariat of Treasury provides guarantees only for the external financing by the aforementioned institutions, and does not provide any guarantee for domestic financing. Furthermore, abiding by and limited to the provisions of the relevant law within the scope of Built-Operate-Transfer, Built-Operate, Transfer of Operating Rights and similar financing models; the Undersecretariat of Treasury provides investment guarantees to state economic enterprises, establishments subject to provisions of private law with more than 50 percent their capital belonging to the state, funds, state banks, investment and development banks, metropolitan municipalities, municipalities and establishments affiliated to municipalities and other local government agencies.

Public Finances
48
The probable undertaking of the payments of the guaranteed debts of the financially stressed organizations and the obligations under the investment guarantees by the Treasury constitutes a significant part of the explicit contingent liabilities.
Credit Rating Model considering the debt-receivable relation between the institutions and Treasury and the financial statements of such institutions, was put into practice from 1 January 2007 to improve the management of contingent liabilities confronting the Undersecretariat of Treasury. In this context, the limit for Treasury guarantees and on-lent foreign loans, guarantee and on-lent fees and partial guarantee ratios are calculated using this model based on the expected losses from organizations in order to alleviate risks arising from contingent liabilities10.
In this context, the limit covering repayment guarantees, investment guarantees and on-lent loans to be provided under the Law No. 4749 is defined by the budget law every year. The limit to be applied for the Treasury guarantees to be provided under the Law No. 4749 was 2 billion dollars in 2005, 3 billion dollars in 2006 and 2007 whereas it was 2 billion dollars in 2008. Beginning from 2009, the extent of the limit has been widened to include on-lent loans and 4 billion dollars was determined as Treasury guarantee and on-lent loan limit for 2009.
When a Treasury guarantee is provided under the Law No. 4749, a fee up to 1 percent of the guaranteed amount is charged to the relevant institution. On the other hand, upon the last amendment made in the Law No. 4749, if on-lent foreign loan is provided, a fee up to 1 percent of the on-lent amount is charged to the relevant institution as well. In the partial guarantee practice, credits except export credits obtained from the international and regional organizations and foreign Official Export Insurance Agencies (ECAs), are guaranteed up to 95 percent of the total liabilities.
Repayment Guarantees
Treasury repayment guarantees of the public institutions and organizations out of the scope of the General Budget are used for ensuring the flow of funds and keeping investment financing costs at a minimum. In 2007 and 2008, an upward trend replaced the downward trend of 2002-2006 concerning the Treasury guaranteed debt stock. The stock amount, which stood at the level of 4.3 billion dollars as of the end of 2006, was increased to the level of 4.8 billion dollars as of the end of 2007 and 5.6 billion dollars as of 2008. The above mentioned increase in stock in 2007 and 2008 was due to the disbursement of the Treasury guaranteed credits provided for the public banks (Halkbank, Vakıfbank) and investment and development banks (TSKB, TKB) especially after 2005. Since these credits are repaid by the borrower banks regularly, they do not cause an additional risk for the Treasury. Additionally, the share of the local administrations some of which are subject to Treasury undertakings in the stock has been decreasing since 2002.
Treasury guaranteed debt stock declined to 5.6 billion dollars as of the end of 2008 by decreasing by 677 million dollars compared to 2002, whereas the undertaking ratio, which was 52 percent as of the end of 2006, dropped to the level of 18 percent as of the end of 2008.
The payment projection of the Treasury guaranteed foreign debt stock in the medium term is increasing in parallel to the increase in disbursements.
Table 3. 11: Treasury Guaranteed External Debt Service Projections
(Million Euros) Principal Interest Total
2009 384 159 5432010 390 127 517
2011-2015+ 2,843 576 3,419
10 Expected loss indicates the expectation regarding the cost which arises from the undertaking claim of institution due to the financial inadequacies, or the condition of inability to meet its liability to Treasury.

Public Finances
49
Investment Guarantees
Apart from the repayment guarantees, investment guarantees provided for electric power plants built with the Built-Operate-Transfer model (10 plants), the Built-Operate model (5 plants) and the Transfer of Operating Rights model (1 plant) constitute an important explicit contingent liability. There have been no undertakings for the investment guarantees up to now; however, the mentioned fiscal risks are taken into account while calculating the burdens that may arise from contingent liabilities.
Within the context of an investment guarantee provided to a municipality for the payment of the water selling price in 1995, nearly 2 billion dollars has been undertaken in total from 1999 until the end of 2008.
Treasury Receivables
Considering the Treasury’s receivables stock at the end of 2008, it is seen that the local administrations have a share of 54.6 percent, SEEs have a share of 26.1 percent and other receivables have a share of 19.3 in the total amount.
When the distribution of collections is analyzed according to their sources, 91 percent of the collections made in 2008 is formed by the payments made in cash by the institutions. The collections which are the deductions made from tax income shares of the Municipalities by the Ministry of Finance and İller Bank cover 7 percent and 1 percent of the collections, respectively, in this period. In addition, the collections made pursuant to the Law 6183 cover 0.3 percent of the collections realized in this period.
Risk Account
Risk Account has been set up at the Central Bank of Turkey in order to eliminate the disruptions in the cash and debt management caused by the amounts paid by the Treasury within the scope of the Treasury guarantees. The budgetary allocations of the Risk Account which is showing a downward trend since 2003 as a result of the decrease in undertakings and increase in the collections, decreased to a level of 148.9 million TL in 2008 from 240 million TL at the end of 2006.
General Government Gross Debt Stock Projections for 2009-2011 Period
As a result of the fiscal policies implemented and the high growth rates, achieved in an environment of increased public confidence and economic stability, in the last five years, the ratio of the general government gross debt stock to GDP has decreased at a significant amount. As of 2008, the figure stood at 39.5 percent. It is projected that the general government gross debt stock will exhibit a limited increase in the period of 2009-2010 with the impact of the market conditions formed by the global crisis and to decrease again in 2011.
Table 3. 12: Public Debt Stock Projections (Percent of GDP)
2008 2009 2010 2011 Realization Forecast General Government Gross Debt Stock 39.5 43.1 44.1 43.4
Source: Undersecretariat of Treasury, Ministry of Finance and SPO
3.1.5. Budgetary Implications of Major Structural Reforms
In line with the Law No.5793, which was prepared to eliminate the wage imbalances between the public servants performing similar tasks and to improve the wages of the low-income groups, the Council of Ministers was given the authority to make additional payments to public servants that do not receive additional institutional payment, provided that the amount will not exceed 200 percent of the monthly salary of the highest-paid public servant. The Council of Ministers started applying the new additional payment decision as of August 2008. The said

Public Finances
50
arrangement which is not a comprehensive public personnel reform caused an additional expenditure of 0.1 percent of GDP for 2008. It is expected that this arrangement will cause an increase of 0.2 percentage points in the central government personnel expenditure.
Under the Law No.5763, and in line with the fight against informal economy, it was decided that 5 percentage points share of the disability, ageing, death insurance premium that is the responsibility of the employers, will be covered by the Treasury in order to reduce the fiscal burden of employment. The impact of this discount on the social security balances has become apparent since December 2008, due to two-month notice and the delay in payment period. This practice is expected to create an additional burden on the general government budget of 0.34 percent, 0.36 percent and 0.37 percent of GDP in 2009, 2010 and 2011, respectively.
3.2. Sensitivity Analysis
Within the public debt and risk management framework, a sustainable, transparent and accountable borrowing policy that is in line with monetary and fiscal policies has been followed since the year 2002. Tight fiscal policies implemented in recent years and strategic benchmarking practices since 2004 helped mitigate the impacts of the exchange rate, interest rate and growth shocks on the public debt stock in the medium and long term, and as a result, improved the resilience of the debt stock structure.
In this context, some sustainability analyses concerning the impact of various negative macroeconomic shocks on the debt stock for the period of 2008-2011 have been carried out. In the below graphic, medium term EU Defined Public Gross Debt Stock/GDP trends under different scenarios are presented.
In the scenario analyses, the separate and joint impacts of 5 percent increase in the exchange rates, 2 points decrease in the real growth rate and 500 base points increase in the real interest rates in each year have been assessed.
Scenario analyses points out that stock / GDP ratio would go up by 0.8 points in the case of exchange rate shock, by 2.7 points under the growth shock and the real interest rate shock in 2011. In the combined shock scenario, the debt stock is proposed to increase by 6.5 points compared to the base scenario.
Figure 3. 5: Sustainability Scenarios
43,4
46,246,1
44,2
49,9
35
40
45
50
55
2005 2006 2007 2008 2009 2010 2011
(%)
Baseline Scenario Growth Shock Real Interest Rate ShockFX Shock Combined Shock
In this context, depending on the fiscal policies and debt management strategies, it is
estimated that the rate of debt stock/GDP will increase in 2009-2010 and start to decline in 2011.

Public Finances
51
On the other hand, even in the combined shock scenario, the rate of debt stock/GDP is expected to increase moderately in the medium term. The analyses show that the sensitivity of the public debt stock to external shocks decreased significantly compared to the previous years.
3.3. Public Finance Risks
In the 2009-2011 period, deepening and/or prolonging of the global recession may generate various risks for the public finances. The risks that might prevent the attaining of the basic objectives in the public finances are summarized below:
If the growth slows down, the revenue performance of the central government budget will be adversely affected, resulting in the increase of the financing need and thus, the borrowing requirement.
The reduction in the predictability of the macroeconomic parameters may hinder the attainment of fiscal targets.
In the current global crises environment, it is possible for the privatization revenues to be lower than expected. If this risk materializes, the borrowing requirement will increase.
Slowdown in economic growth will adversely affect the employment increase parameter and will cause the social security system premium collections to be lower than foreseen. This, combined with the possible failure to discipline the health care expenditures, might increase the transfers to the social security institutions from the central government budget.
If the unemployment rates increase, the number of people to be entitled to Unemployment Insurance Fund will increase as well resulting in a slight deterioration of the balances of the Unemployment Insurance Fund.
The current domestic debt stock is adversely affected by the unexpected increases in the real exchange rates or interest rates due to the presence of FX denominated bonds and bonds with floating rates, although not severely as in the past years.
The possibility that Treasury will assume the responsibility for the liabilities resulting from the investment guarantees and repayment guarantees generates a risk for the budget. In order to eliminate the said risk, a Risk Account was opened with the Central Bank and as of 1.1.2003, any payments that may result from such guarantees, began to be made from this account.
3.4. Quality of Public Finances
The policy of prioritization of the expenditures, taking the appropriateness, effectiveness, efficiency and alternative costs into account, will be continued in the forthcoming period. In this context, the rationalization of the public investment program and elimination of inefficient expenditure programs are objectives.
With the start of the partial utilization of the privatization revenues and the income returns of the Unemployment Insurance Fund for GAP Action Plan starting from 2008, it is aimed to accelerate the investments under GAP. To this end, 2.8 billion TL appropriation was allocated for the investments to be made under GAP Action Plan in 2009.
As a result of the amendments in the Laws no 5350 and 5615, the scope of the subsidies for priority regions was extended and the eligibility conditions were improved. Also, the period of the Subsidies Law No. 5084 was extended for another year. As a result of all these legal arrangements, it is expected that an expenditure that is some 500 million TL higher than the originally designated appropriation will ensue.
An expenditure of 500 million TL was designated for R&D works, directed by the Scientific and Technological Research Council of Turkey (TÜBİTAK); 200 million TL was designated for the supports used by the Small and Medium Industry Development Organization (KOSGEB) and the said appropriation was increased by 75 million TL during the year. It is expected that the

Public Finances
52
number of the Development Agencies which were designed to boost the local development potential and which are currently in the progress of starting up their activities, is expected to increase significantly in 2009. Accordingly, 200 million TL appropriation was designated for these agencies in 2009.
In order to create a productive and competitive economic environment through the support of R&D activities, the Law No. 5746 was enacted to be effective until 2023. Under the said law, it is now possible to deduct 100 percent of the R&D expenditures from the tax liabilities while this was formerly 40 percent under the Corporate Tax and Income Tax Laws. The law also enables withholding tax support for the income tax, as well as the insurance premium for the R&D staff and offers techno-enterprise capital support for innovative ideas.
The Project for the Support of the Infrastructure of the Villages (KÖY-DES), which has been implemented since 2005 and developed to meet common local needs of the local administrations such as drinking water, sewage and roads, will continue in 2009. Accordingly, 500 million TL appropriation was designated for this project in 2009. No appropriation was designated in 2009 for the Project for the Support of the Infrastructures of the Municipalities (BEL-DES) which was started in 2007.
3.5. Institutional Features of Public Finances
Significant structural changes are being made to improve the institutional capacity in the public financial management. In this context, some of the recent regulations and implementations are presented below.
Public Financial Management and Control Law
As a result of the examinations held by the Ministry of Finance in 2006 and 2007, 467 financial services officers were appointed to the financial services units of the public authorities. In order to improve and ensure the sustainability of the professional capacities of the financial services specialists, a comprehensive training program was launched and it is expected that the training program will be completed before the end of 2008. In order to increase the financial management and inspection capacities of the public authorities, a special contest was held to recruit 546 financial services associate experts on November 9, 2008.
Table 3. 13: Secondary and Tertiary Legislation List of Law No. 5018*
Name of the Arrangement Legal Basis Situation By-Law on Procedures and Principles for Collecting Public Losses 5018 Md. 71 Published in the Official Gazette dated
19.10.2006 No.26324. Communiqué on Principles and Procedures about the Internal Auditor Appointments (No.2) 5018 Md. 65 Published in the Official Gazette dated
30.12.2006 No.26392. Principles and Procedures about Preparation, Approval, Implementation and Monitoring of Detailed Expenditure and Financing Programs
5018 Md. 20 No.3 Budgetary Practice Order is published in the Official Gazette dated 24.01.2007 No.26413.
By-Law on Movable Property 5018 Md. 44 Published in the Official Gazette dated 18.01.2007 No.26407.
General Communiqué on Preliminary Payment Procedures and Principles 5018 Md. 35 Published in the Official Gazette dated
08.03.2007 No.26456. General Communiqué on Central Government Expenditure Vouchers 5018 Md. 33 Published in the Official Gazette dated
08.03.2007 No.26456. By-Law on Budgeting and Accounting of Revolving Fund Enterprises
5018 Temp. Md. 11
Published in the Official Gazette dated 01.05.2007 No.26509
By-Law on Financial Services Specialists 5018 Md. 60 Published in the Official Gazette dated 25.08.2007 No.26624.
Public Internal Audit Standards 5018 Md.67 The No.12 decision of The Internal Audit Coordination Board (IDKK) dated 20.11.2006.
Public Internal Auditors Professional Code of Ethics 5018 Md.67 The decision of IDKK dated 20.11.2006 No.12. Public Internal Audit Reporting Standards 5018 Md.67 The decision of IDKK dated 05.06.2007 No.10. Communiqué on the Public Internal Inspection Standards 5018 Md. 55 Published in the Official Gazette dated 26.12.2007
with no 26738. Public Internal Audit Strategy Guide (2008-2010) 5018 Md. 67 The decision of IDKK dated 05.11.2007 No 22

Public Finances
53
Public Internal Audit Glossary 5018 Md. 67 The decision of IDKK dated 28.10.2008 No.12 General Communiqué on the General Management Accounting By-Law 5018 Md. 49 Published in the Official Gazette dated 10.01.2008
No 26752 . By-Law on Working Principles and Procedures of Internal Auditors
Public Internal Audit Charter Md.13 The decision of IDKK dated 22.01.2007 No.2 Procedures and Principles on the Ranking Certification of Public Internal Auditors Md.30 The decision of IDKK dated 02.07.2007 No.11.
Procedures and Principles on the Common Working of the Internal Auditors More than One Md.51 The decision of IDKK dated 03.07.2007 No.12.
Manual for Preparing Public Internal Audit Plan and Program Md.40 The decision of IDKK dated 29.08.2007 No.15.
Risk Assessment Guide in Public Internal Auditing Md.36 The decision of IDKK dated 06.09.2007 No.17. Procedures and Principles on the Determination of the Professional Seniority of the Public Internal Auditors Md. 55 The decision of IDKK dated 19.02.2008 No 2
Public Internal Audit Guide Md. 10 The decision of İDKK dated 07.04.2008 No 5 (*) The secondary and tertiary legislation list for 1 January 2006-19 October 2006 period was given in the PEP 2006. Source: Ministry of Finance
As of November 2008, 802 appointments were made to 1200 internal auditor positions which were allocated for the institutions subject to the Decree Law No. 190. 786 of the appointed internal auditors received three-month certification training.
The General Activities Report, which was prepared as a requirement of fiscal transparency and accountability pursuant to the Law No.5018, which includes a fiscal year activity results of public administrations and social security institutions under the central government and overall assessments of financial structure of local administrations, was announced. In addition, the 2008 Central Government Budget Realizations and Expectations Report, which includes the first half implementation results of central government budget, financial positions, expectations, targets and activities of the second half, was announced.
Budget Accounting Code System and Fiscal Transparency
Due to the amendment made in Article 49 of the Law No.5018 which constitutes the legal basis of the By-Law on General Budget Accounting introduced on 1 January 2006, the Central Government Accounting By-Law prepared according to the mentioned amendment was put into effect on 1 January 2007.
While the By-Law on General Budget Accounting covers only the public administrations in the general budget, the By-Law on Central Government Accounting covers the special budget public administrations and regulatory and supervisory agencies in addition to the general budget public administrations.
In addition to the general government scope definition in the Law No. 5018, in order to allow the determination of a general governments scope definition in line with the ESA-95 criteria for statistical purposes, the 52nd article of the Law No.5018 was amended with the Law No.5793 dated 24.07.2008 and Ministry of Finance was authorized accordingly. With the amendment in the 53rd article of the Law No. 5018, new arrangements were made to ensure that the administrations reporting to the general government send their data timely.
Works are underway to ensure that the cash-based budget tables and accrual-based financial tables of the Social Security Institution are published digitally quarterly and annually. Among the financial tables of the central government budget, cash-based budget tables are published regularly every month. Among the accrual-based financial tables, balance sheet, trial balance, operation report, financial assets and liabilities table, internal and external debt position tables are published monthly and annually.
Cash based budget tables and accrual based financial statements of local administrations are published quarterly and annually.

Public Finances
54
Revenue Administration and Social Security System
Efforts are continuing to improve the implementation and auditing capacity of the Revenue Administration. In this context, the Major Taxpayers Office was activated in the beginning of 2007. The third phase of VEDOP project which constitutes the basis of the technological infrastructure of the revenue administration is continuing, and it is planned to include all units of the revenue administration under the scope of the system in 2009, and in parallel, to strengthen information systems and infrastructure and establish a disaster recovery center.
The Tax Offices Automation Project (VEDOP), which is intended to digitize the entire transactions of the tax offices in order to reduce the work load, increase the work productivity, and obtain accurate data required for decision-making, is implemented through two different systems, one being the tax offices automation (VDO) running on client-server architecture and the second one being the tax offices automation running on the central structure (e-VDO). Under the VEDOP Project, third phase, it is planned that the tax offices using the VDO automation system, will shift to e-VDO automation system and revenue services of the assets directorates will be automated through the e-VDO automation systems and relevant works are underway.
Currently, through tax legislation changes, efforts are made to develop tax office application software in line with the needs and requests of the tax offices and include assets directorates in the automation through e-VDO.
Works are underway to include the works of the tax assessment council in the automation system and as of October 2008, system definitions were completed for the infrastructure and hardware building and central inquiries of 43 Tax Assessment Commission. However, efforts are still continuing to complete the software phase of the system.
The authority of the Revenues Administration Directorate for the resource distribution and use within the institution will be expanded.
In order to increase the inspection capacity, the number of the revenues controllers and tax auditors will be increased in a regular manner.
By the end of July 2009, a ‘Common Action Plan for the Social Security Institution- Revenues Administration Directorate’ will be devised and the plan will be put into practice by the end of October 2009. With the action plan, the compliance of the employers with the recently introduced tax deduction and their liabilities for wage payments of employees will be ensured and the situations where the employees are shown as contractors will be prevented. Also, steps will be defined to ensure that in kind supports are reported accurately.
Works are underway to prepare the ‘Services and Automation Hardware Settlement Plan’ within the scope of the Third Phase of the Tax Offices Full Automation Project (VEDOP-3) and in line with the specified schedule, and the organization and workflow techniques of the service units of the Revenues Administration Directorate.
The consolidated tax declaration form application for the social security premiums and income tax will start in 2010.
With the Social Security Institution Law No. 5502, SSI, BAĞ-KUR and Emekli Sandığı were included in the Social Security Institution. Under this new structure, Social Insurances General Directorate, Universal Health Insurance General Directorate, Non-Premium Payments General Directorate, and Service Provision General Directorate were established. In this way, pensioner services, health-care financing and non-premium payments are collected under one roof. In the same law, fully-automated and localized social security centers were built to speed up the provision of pensioner and health-care services. With the said law, the institutional and administrative capacities were improved to attain more efficient premium collection and prevention of abuses in these service provisions.

Structural Reforms
55
4. STRUCTURAL REFORMS
With the decisively pursued structural reforms since year 2000, significant progress has been achieved about establishing macroeconomic stability, high growth, improving productivity and also in economic, social and legal convergence towards EU. Uninterrupted and decisive continuation of the reform process is targeted in the 2008 PEP period.
In this chapter, reform actions and progress achieved in real sector, financial sector, labor market, agricultural sector, administrative issues, regional development, health and social security system, R&D and innovation, information and communication technologies, transportation and energy sectors are discussed and evaluated.
4.1. Enterprise Sector
4.1.1. Privatization
2008 was an important year in which the leasing process of Sabiha Gökçen Airport, which belongs to the Undersecretariat of Defense Industries, for a 20 year period was completed and,
block sale of 51 percent of the state owned shares of Petrochemical Holding Inc. (PETKİM),
public offering of 13.34 percent of the shares of Turkish Telecommunication Inc. (TÜRK TELEKOM),
sale of one thermal plant, and transfer of operating rights of one geothermal plant and seven hydroelectric plants of Ankara Natural Electricity Generation and Distribution Company Inc. (ADÜAŞ),
sale of all cigarette factories and various real estates of Tobacco, Tobacco Products, Salt and Alcohol Enterprises Inc. (TEKEL),
block sale of 100 percent shares of Başkent, Sakarya, Meram and Aras Electricity Distribution Companies
were realized in terms of privatization. The total amount of privatization operations of which sales/transfers transactions were completed, was realized as 8.68 billion dollars as of December 2008, whereas this amount was 7.45 billion dollars in 2007. The total amount of privatization operations including TCDD ports (İzmir, Derince, Bandırma, Samsun) and electricity distribution companies (Sakarya, Başkent, Meram, Aras), for which approval of sale/transfer processes are in progress, was 4.17 billion dollars.
The following table presents the list of privatization transactions of which sales/transfers were completed from November 2007 to the end of December 2008.
Table 4. 1: Privatization Transactions Completed During the Period of November 2007-December 2008
Company Privatization Transaction Sales Price (Dollars)
Undersecretariat of Defense Industries 20-year lease of Sabiha Gökçen Airport 2,640,400,000
TÜRK TELEKOM Public offering (13.34 %) 1,662,931,517
PETKİM Block sale 2,040,000,000
TEKEL Block sale 1,720,000,000
ADÜAŞ Transfer of operating rights 510,000,000
TEKEL 2 real estates in Manisa 50,284,137
Sümer Holding NİTRO-MAK (33.5 %) 19,550,000
Others Sales and transfers of various real estates and facilities since November 2007 41,870,202
TOTAL 8,684,699,666

Structural Reforms
56
It is expected that sales/transfers and contract processes concerning privatization operations of İzmir, Derince, Bandırma and Samsun ports of TCDD will be finalized within the shortest time after legal process is completed.
The privatization process of electricity distribution companies has been continuing. After realization of sale/transfer transactions of Başkent, Sakarya, Meram and Aras Electricity distribution companies, for which tenders have been completed, works on the simultaneous realization of electricity distribution and generation privatizations will be continued.
As Privatization High Council Decision issued on including TŞFAŞ in privatization portfolio in 2007 was cancelled by the Council of State, Turkish Sugar Factories Co. (TŞFAŞ) has been re-included in the privatization program in 2008. Besides, real estates of TİGEM and Treasury and shares of the Treasury were also included in the privatization program in 2008.
The tender process was commenced to privatize 51 percent public share in Kıbrıs Türk Tütün Endüstrisi Limited Şirketi, which is an affiliate of TEKEL, through block sales.
The privatization process regarding license transfer of games of chance was commenced with the tender announced on 5 November 2008 and privatization works are being carried out in line with the provisions of the Decree Law No. 320. Within this context, the license including lottery, instant win and numerical games, for which National Lottery Administration has the right to plan, regulate and arrange drawing with consideration in cash, and similar games of chance that may be allowed within the framework of relevant legislation will be transferred as a whole for a 10-year period.
It is aimed to complete the legal infrastructure regarding privatization of highways and bridges under the privatization program within the shortest time. With this perspective; when market conditions are convenient, the tender process for privatization of highways-bridges can be commenced.
4.1.2. Competition Law and Policies
At the beginning of 2008, important and deterrent amendments related to administrative fines were made to the Act No. 4054 on the Protection of Competition. By means of these amendments, fixed administrative fines are replaced by administrative fines calculated on the basis of annual gross income, it is provided that managers and employees of undertakings or associations of undertakings who are found to have a crucial role in the infringement shall also be imposed administrative fines, and reduction in or immunity from the relevant administrative fines in cases of active cooperation with the Competition Authority is made possible.
The competition (antitrust) legislation in Turkey is mostly in harmonization with EU legislation. However, when the practices of the Competition Authority up to now and the practices and amendments in EU are taken into account, amendments to both institutional structure and competition legislation are needed. An amendment bill which was prepared to this end was sent to Turkish Grand National Assembly in July 2008. More efficient implementation of competition legislation is the aim of the bill.
After the bill is enacted,
Agreements, concerted practices and decisions which do not significantly affect competition shall not be subject to investigation in order to enable the Competition Authority to use its resources in more important competition infringements,
Substantial lessening of competition test shall be adopted so that unilateral and cooperative effects which may occur as a result of concentration transactions are evaluated more soundly via using economic analyses,
In order to eliminate competition infringements in a shorter time period, to prevent increasing of possible damages and to use the resources more efficiently, investigation may not be launched or an investigation in progress may be terminated in case the

Structural Reforms
57
relevant undertakings or associations of undertakings make commitments to eliminate the relevant problems about competition,
The Competition Authority may resort to jurisdiction for the annulment of administrative transactions and regulations that have competition-restrictive effects in markets for goods and services in order to strengthen competition advocacy powers.
On the other hand, in order to harmonize with EU legislation in the field of competition law and policy, draft law, which stipulates that a department shall be established to create a supervisory mechanism in order to supervise and monitor state aid in terms of competition, has been prepared and is foreseen to be enacted in 2009.
4.1.3. Improvement of the Investment Environment
Activities to expand the role of the private sector in the economy maintain its priority in the macroeconomic stability program of the government. In this respect, efforts to improve the investment environment being undertaken since 2001 aim to rationalize the investment related procedures and increase the volume of international foreign direct investments to Turkey.
Efforts to improve the investment environment are carried out by the Coordination Council for the Improvement of the Investment Environment (YOIKK), a national platform based on public and private sectors cooperation, and the Council functions through 12 Technical Committees11 each assigned for a different theme of the investment environment.
On 30 January 2008, it was decided to establish R&D Technical committee under the presidency of TUBITAK in order to realize studies concerning investment environment in R&D subjects as result of the proposal submitted by private sector.
Technical Committees, established within the scope of YOIKK works, announced their action plans, which were rearranged in coordination with public and private sector, in April 2008. The revisions of these action plans and additional activities were announced in February 2009.
In 2008 regarding licenses, within the scope of the legal arrangement prepared by the Ministry of Labor and Social Security, license for establishing a business place was removed by the amendment made in Labor Law, Besides, Draft Law on General Administrative Procedure prepared by the Ministry of Justice was sent to the Prime Ministry in September 2008. By the mentioned Draft Law, relevant administrations became obliged to respond to the applications, made by the citizens and private sector, within 30 days. Within this context, it will be ensured that the license receiving procedure be shorter.
Regarding the arrangement of exportation and proof of origin documents; General Customs Communiqué, which was prepared for speeding up the mentioned transactions by increasing the number of those benefiting from simplified customs transactions, was published in the Official Gazette in April 200812.
Legislative act13 that amended the provisions of the Land Registry Law No. 5782 regarding property acquisition by foreigners came into effect on 7 January 2006, but it was put into effect again on 15 July 2008 after some amendments14.
After the removal of legal obstacles as of 2008, the Investment Support Offices were established in İzmir, Adana and Mersin provinces and personnel at a sufficient number has been employed. Furthermore, Investment Support Offices will come into operation after completion of the works concerning revision of the regulation arranging activities of Development Agencies by the Undersecretariat of SPO in a short time. It is planned to establish and activate Investment
11 Company Founding, Employment, Sectoral Licenses, Investment Location, Taxes and Incentives, Foreign Trade and Customs, Intellectual and Industrial Property Rights, Investment Promotion, Foreign Direct Investment Legislation, SME, Corporate Governance, R&D 12 General Customs Communiqué (Time Alteration) Serial No: 2 (O.G. 26.04.2006/26150) 13 Law Amending the Law No. 5444 on Land Registry Law (O.G. 07.01.2006/26046) 14 Law Amending the Law No. 5782 on Land Registry Law (O.G 15.07.2008/26937)

Structural Reforms
58
Support Offices in all cities in the next period in addition to 7 attraction centers and 1 finance center determined in 2008.
Works are continuing to legislate the Draft Bill on Amending the Law No.4817 on Work Permits for Foreigners prepared by the Ministry of Labor and Social Security in order to get over the problems experienced in the implementation process related to working permits for foreigners.
By the Communiqué put into effect by the Capital Markets Board (CMB) in the beginning of 2008 in order to support improvement works for investment environment; it was made obligatory to valuate Istanbul Stock Exchange (ISE) listed companies for transactions made with related institutions, ensure public disclosure, establish unit of relations with shareholders, strengthen the harmonization capacity of partnerships with capital markets legislation and to employ license holder personnel15.
In addition, within the scope of the studies commenced for state owned companies in order to implement modern governance principles in state owned enterprises, it is envisaged to prepare a draft law based on accountability, transparency, elasticity in resolution process and strategic management approach in SEEs in 2009.
Employment Package16, which aims to increase elasticity of labor market and decrease administrative and financial burdens on labor force, entered into effect after being published in the Official Gazette on 26 May 2008.
By The Law No.5838, which was put into effect through being published in the Official Gazette on 28 February 2009, various amendments to improve the investment environment and reducing the bureaucracy were made. By the amendments for reducing the bureaucratic procedures, giving information about the payment and the parties of a transaction to the institutions and organizations who have to seek the clear of debt document was taken out of the scope of trade secret, hiring and firing procedures are simplified by the arrangement of declaring these acts only to Social Security Institution. Additionally, by the amendments on the Law on Income Tax the tax rates on internet based communication was reduced 5 percent and companies were provided with R&D incentives. 17
4.1.4. Utilities and Network Industries
Energy
Important progress has been achieved in the liberalization of energy market since the previous PEP. Significant steps have been taken on privatization of electricity production and distribution, which is an important component for establishing full competition in electricity market, and although it still corresponds to a minor amount in contract transfer process in the natural gas market, the transfer of first natural gas purchase contract was completed, thus the entry of private sector into the long term natural gas purchase contracts could said to be facilitated.
Benefits expected from privatization of electricity distribution are reducing costs through efficient operation and reflecting them to consumers, decreasing high theft-loss rates, strengthening financial structure of the sector by increasing accrual and collection rates, increasing the contribution of the private sector on the security of energy supply and realizing the renewal-expansion investments by the private sector.
Operating right of one distribution company has been transferred and the company was taken out of the privatization programme, tenders of 4 distribution companies have been completed in the electricity sector and final privatization transactions are in progress at various stages. The net sales volume of the mentioned 5 companies constitutes 24 percent of the total net electricity sales of TEDAŞ (comprising 20 distribution companies) and the theft-loss amount of them constitutes 14
15 Series: IV, Communiqué on Principles to be complied by Joint Stock Companies Subject to Capitals Market Law No.
41 (O.G.19.03.2008/26821). 16 Law No. 5763 on Amending Labor Law and Various Laws (O.G. 26.05.2008/26887) 17 Law No. 5838 on Amending various Laws (O.G. 28.02.2009/27155)

Structural Reforms
59
percent of the total theft-loss amount. The privatization of 15 distribution companies remaining under the privatization portfolio will be continued in 2009.
The first privatization was successfully realized in electricity generation although it was small in terms of capacity. Transfer of 9 power plants having approximately 140 MW of installed capacity to private sector was completed.
In the natural gas market, in accordance with the finalized tender to transfer 4 billion contract m3 of gas to the private sector, imports of 250 million contract m3/year of gas has been commenced as of 19 December 2007 by the winning company after the completion of the first contract transfer. Moreover, the natural gas transmission network was started to be used by third parties as of 1 July 2007 for the first time.
Some amendments were made in legislation in order to improve competition in the sector. The market control limit, which was previously determined on a production company basis, was redefined on natural and legal persons basis. Accordingly, in the electricity market, the total electricity installed capacity owned by any natural person or private sector legal person through production companies controlled by him may not exceed 20 percent of the total previous year’s published electricity installed capacity of Turkey. Similarly, amount of electricity that may be sold by any natural person or private sector legal person through wholesale companies controlled by him may not exceed 10 percent of the total amount of electrical energy consumed in the market in the previous year.
Besides, electricity distribution companies are obliged to legally separate their electricity production and retail sale activities until 1 January 2013.
The legal infrastructure was enhanced by removing ambiguities in legislation regarding security of supply. Within this context, creation of capacity mechanism and public sector generation investment as a last resort in case of private sector being unable to ensure security of supply are permitted.
A new pricing mechanism was developed in order to facilitate the privatization process and enhance the financial viability of the companies operating in the sector and increase competition in the market. Within this context, cost based pricing mechanism (CPM) concerning electricity and natural gas sales prices was put into effect on 1 August 2008 by the High Planning Council Decision. With this mechanism, final consumer sales prices will be updated automatically in a periodic manner by taking mainly into account the changes in input prices, inflation and exchange rates. As a matter of fact, substantial increases were experienced in consumer prices in 2008, both with the practice just before the CPM and with the application of CPM, as a result of significant increases in international energy prices.
The balancing and settlement mechanism (balancing of electricity supply and demand in real time and financial settlement of buyers and sellers on traded energy), which has major importance for the efficient operation of the electricity market, started to operate in cash basis as of August 2006. In this period, the wholesale market had shown a rapid expansion and reached a volume of about 32 billion kWh in 2007. When it is considered that the total electricity consumption was about 190 billion kWh in 2007, the amount sold represents an important figure. The market reflected the supply deficit risk into the prices and average spot prices were realized as 12.8 Kuruş/kWh for 2007. As of the first nine months of 2008, 31 billion kWh electricity trade was realized in the spot market and the average price was 16.3 Kuruş/kWh.
Telecommunications
The Law No. 4502, which came into force in 2000, has paved the way to liberalization process in the telecommunications sector and Telecommunications Authority18 was established as the independent regulatory authority. On the other hand, in accordance with the same Law,
18 Electronic Communications Law (Law No. 5809), which came into force on 10 November 2008, altered the name of the Telecommunications Authority as Information Technologies and Communications Authority.

Structural Reforms
60
monopoly rights of the incumbent operator Turk Telekom have expired at the beginning of 2004 and full competition was introduced in the sector.
The main target of Information Technologies and Communications Authority (ITCA) is to achieve full liberalization in the sector. Effective conducting of regulatory and supervisory activities by the Authority is crucial to establish a sustainable competitive environment in the sector. On the other hand, ITCA and Competition Authority are consulting each other about the decisions on the telecommunications sector.
ITCA has completed sectoral secondary legislation and authorized several operators during the recent period. In order to be able to deliver services, it is indispensable for these operators to access to some infrastructures controlled by the incumbent operator and make interconnection with the incumbent operator under reasonable terms. To this aim, relevant markets and operators with significant market power (SMP) have been identified. SMP operators prepare and send their reference and access interconnection offers to ITCA and these are published after the approval of the Authority. Standard reference interconnection charges of the incumbent and GSM operators are provided in the following Table with their effective dates.
Table 4. 2: Standard Reference Interconnection Charge Tariffs
Call Termination Charges on GSM Networks (KR/min.) Call Initiation and Call Termination Charges on Turk Telekom Network (Kr/min.)
Enforcement Date
In-zone Out-zone Turkcell Vodafone Avea
1 Jan. 2007 2.00 3.70 14.00 15.20 17.50 1 March 2007 1.89 3.00 13.60 14.50 16.70 1 April 2008 1.71 2.70 9.10 9.50 11.20
Source: Information Technologies and Communications Authority
It is evident from the table that interconnection charges of SMP operators have been reduced notably in the previous period. Although it is low at the moment, market share of long distance telephone operators authorized to provide intercity and international telephone services is increasing, partly due to the reductions in the interconnection charges.
Turk Telekom has published reference offer on local loop access and access to the local loop is currently operational. In order to increase the market share of alternative operators in the broadband access market, regulations have been made to ease subscriber transfer and reduce wholesale charges further. Following these regulations, it is observed that alternative operators are taking more active role in the broadband access market, although their market share is still quite low.
Market shares of alternative operators in broadband access and long distance telephone services markets, in which they compete with the incumbent, are provided in the table below.
Table 4. 3: Market Shares
Market Share of Turk Telekom (%) Market Share of Alternative
Operators (%) 2008 Q1 2008 Q2 2008 Q3 2008 Q1 2008 Q2 2008 Q3
Long distance telephone services (in terms of traffic initiated abroad and terminated in Turkey)
56.7 55.4 54.1 43.3 44.6 45.9
Total fixed telephone traffic 97.07 96.03 95.98 2.93 3.97 4.02 Broadband access (in terms of subscriber numbers)
95.3 95.1 95.0 4.7 4.9 5.0
Source: Information Technologies and Communications Authority

Structural Reforms
61
Fierce competition exists among 3 operators in the mobile services market and mobile number portability, which was initiated in November 2008, is expected to increase competition further. Following the initiation of number portability, more than 400 thousands subscribers ported their number within a month. It is observed that operators are offering favorable service and tariff packages to secure their subscribers and attract others following the implementation of number portability.
Besides activities regarding regulation and authorization in the telecommunications sector, due to market needs, auditing activities became more and more important in 2008. All audits carried out by the ITCA, which is the regulatory authority in the telecommunications sector, are conducted in accordance with annual audit plans and the By-law on Principles of Auditing, which came into force after its publication in the Official Gazette No. 26478, dated 30 March 2007. In the first half of 2008, 34 operators were audited on 12 different issues. These activities are important to ensure enforcement of regulations.
“Technical Aid Project on the Development of Access Framework in Turkish Telecommunications Market”, which was carried out as part of EU Financial Aids and which targets to equip the regulatory authority with necessary experience and competency regarding cost models and imposition of accounting separation principles to ensure cost-based access pricing in the context of EU regulatory framework, was initiated in January 2008 and completed in November 2008. Cost-based prices to be determined by ITCA will support advancement of competition in the sector and provision of cheaper and quality services for consumers.
4. 2. Financial Sector
4.2.1. Banking Sector
Supported by the political and economical stability, Turkish banking sector has recorded significant progress in recent years. In this period, important structural transformations were also realized in the sector. These steps include, commencing a more integrative supervising and monitoring structure by means of transferring authorities and responsibilities regarding financial leasing, factoring and consumer financing companies to Banking Regulation and Supervision Agency (BRSA); establishing discipline in the sector by making regulation, monitoring and accounting standards of non-bank financial institutions parallel to banks; enhancing supervision and monitoring of banking sector with risk-focused auditing principles, digital supervision and IT based instruments and practices; attaching importance to auditing and monitoring of off-balance sheet transactions, enacting regulation about management and tracking of liquidity; with a cautious approach transition to 12 percent target capital adequacy ratio; elimination of loopholes in credit card market legislation and strengthening the framework of rating and valuation organizations.
Within the framework of the Banking Law No. 5411, which was put into force on 1 November 2005 in order to provide full harmonization with the EU Directives and international principles and standards; fundamental secondary regulations regarding banks and non-bank financial institutions were completed to a large extent, in 2006. Regulations made in the following period were mostly amendments made on effective regulations in the light of new requirements. New regulations made within this context were focused on regulations about precautionary provisions, foundation and activities, financial reporting and corporate management subjects, aiming more cautious supervision and monitoring conception and an adaptive framework required by changing necessities and changing conjuncture.
Among the regulations that became effective; arrangements about establishment and execution have aimed to improve authorization and approval process regarding foreign bank agencies, support services, independent audit, valuation and rating organizations, whereas the arrangements related to precautious provisions aimed to ensure a more secure environment for banks by focusing on areas such as capital adequacy, equity, precious metal trade, credit classification and liquidity adequacy. On the other hand, with regulations on corporate governance, efficiency of top management, internal audit and decision making process in banks was aimed to be increased, while with arrangements concerning financial reporting the infrastructure towards establishing transparency was enhanced. Finally, supervision and monitoring infrastructure of non-bank financial institutions was made parallel to banks

Structural Reforms
62
and international standards. The organizational structure of BRSA was rearranged and its organizational capacity was enhanced according to the current requirements and necessities. Besides, principles and procedures concerning BRSA’s information and document sharing with other institutions, especially regarding institutions subject to consolidated audit, were defined. In addition to the mentioned regulations that became effective, in order to provide financial leasing, factoring and financing companies to act within the framework of legal arrangements that can satisfy today’s requirements, The Draft Bill on Financial Leasing, Factoring and Financing Companies and in order to solve problems faced in implementation, Draft Bill on Amending the Banking Law, were shared with the public and submitted to relevant authorities.
As for secondary regulations, the Draft Regulation Amending the Regulation on Banks to Getting Support Services and Authorization of Institutions Providing These Services, which aims to extend the time allowed to banks to harmonize with the new legislation concerning support services, was prepared. Besides, Draft Communiqué on Credit Risk Management, which determines principles and procedures concerning establishing and sustaining of an efficient and sufficient credit risk management in banks in accordance with the structure and scope of banking activities and changing conditions, was submitted to consideration of the sector.
The efforts have been continuing towards minimizing the burden imposed on the public by the process of dissolving the banks under SDIF. In this context, between the date of transfer to SDIF and September 2008, a total of 17.9 billion dollars was collected from claims under legal prosecution, claims restructured for an agreed payment plan, sales of participations, affiliates, property, security and bank sales by SDIF, and further collection of 5 billion dollars is expected in proceeds by the end of 2018.
Share transfer of Adabank A.Ş., which was put on sale again on 10 September 2008, will be realized by the approval of Fund Board after receiving the consent of BRSA. The disposal process of the assets of SDIF remaining from banks taken over is in progress depending on legal terms and market conditions. Thereby, the Fund will focus on its primary duty of deposit insurance.
Harmonization with the capital adequacy directive of EU (CRD) was aimed with the Regulation on Measuring and Assessing Capital Adequacy of Banks published in the Official Gazette dated 1 November 2006, and the capital adequacy calculation in partial compliance with CRD was commenced within the frame of road map announced by BRSA, in the beginning of 2007. However, considering the developments in international financial markets, necessity of revision in the current set of standards, the fact that Turkish Commercial Code still awaits enactment and the opinions concerning the starting date of application; it was concluded that the rating based credit risk evaluation in the bank capital adequacy calculation should be postponed and the rating based calculation could only be done for indicative purposes.
4.2.2. Capital Market
At the end of 2007 and in 2008, the following steps were taken in order to protect investors in the capital markets and create a stable and efficient market considering the EU directives:
In the context of harmonization with the EU legislation, the project, which was prepared to benefit from the PHARE program under the 2004 Programming of Pre-Accession Financial Assistance being provided to Turkey by the EU and initiated in February 2006, was completed in December 2007.
Within the context of the project on “Establishing Effective Supervision System for Financial Reporting by Listed Companies and Establishing More Effective Remote Supervision System for Intermediary Institutions Operating in Capital Markets”, which was financed by the Dutch Government and initiated in January 2007, a pilot implementation for intermediary institutions which is planned to be completed until the end of 2008 has been running. Implementation of remote supervision project in 2009 in all intermediary institutions is planned, after eliminating deficiencies of the system detected during this practice. On the other hand, a mechanism for supervision of financial reports of listed companies was established, risk analyses of listed companies

Structural Reforms
63
were completed and detailed analyses have started and the system is under test process within this context.
Examination for Independent Auditing in Capital Markets and Examination for Housing Appraisal Specialist Licensing were introduced in September 2007 and January 2008, respectively.
Principle decisions about risk management in investment funds and risk limitations in hedge funds and guaranteed/protected funds were prepared, and amendment has been made in Communiqués concerning real estate investment trusts and real estate appraisal companies.
As a result of the efforts made in order to enhance legislation concerning market supervision by stock markets against manipulation and insider trading, amendments were made in the Regulation on Establishment and Working Procedures of Futures and Option Exchanges in July 2008 and in the Regulation on Establishment and Working Procedures of Stock Exchanges in August 2008.
The list of actions to be carried out in the period of 2008-2011 in order to increase supply and demand in capital markets, ensure confidence and stability in the markets, create legislation in compliance with the EU, and establish infrastructure necessary to implement such legislation are as follows:
It is aimed to increase the capacity of CMB – ISE Surveillance System with Advanced Surveillance Project which is planned to be completed in 2011. EU funds were demanded for this project and initial approval has been received within the framework of 2008 programming of Pre–Accession Financial Assistance. The project is under the approval and tender process of the European Union Commission.
The aim of Electronic Application and Data Collection System Project, planned to be completed in 2011, is to transfer every kind of communication, of companies listed in the capital markets, independent audit companies, portfolio management companies, intermediary institutions, investment funds and trusts with Capital Markets Board, to internet. The project has two fundamental functions. The first is enabling the companies making their applications to CMB via internet. The second is to facilitate online transmission of every kind of document, report and notice by the companies to CMB. Electronic signature technologies will be used in the realization of both functions. EU funds were demanded for this project and initial approval has been received within the framework of 2008 programming of Pre–Accession Financial Assistance. The project is under the approval and tender process of the European Union Commission.
With the Strategic Information Systems Planning Project, which aims utilization of information technologies in all work areas of CMB in a best and efficient way, IT investments needed by CMB within next 3 years have been determined, and the project is planned to be completed in 2011. EU funds were demanded for this project and initial approval has been received within the framework of 2008 programming of Pre–Accession Financial Assistance. The project is under the approval and tender process of the European Union Commission.
Standards and rules to be followed by stakeholders in capitals market in terms of IT audit are planned to be determined. For this project, which is planned to be completed in 2010, EU funds were demanded and initial approval has been received within the framework of 2008 programming of Pre–Accession Financial Assistance. The project is under the approval and tender process of the European Union Commission.
Communiqué works are in progress in order to enable establishment of Venture Capital Investment Funds. These works are planned to be completed in 2009.
Steps will be taken to commence umbrella fund structure, shorten application processes and merge foundation and registry transactions of collective investment institutions, in

Structural Reforms
64
order to extend the assets that might be included in the portfolio of collective investment institutions, facilitate issuance and registry processes in investment funds and also to allow investors to make investments under one fund roof.
Within all subjects about its duty field, CMB will continue to provide juridical support in all works made concerning the amendments proposed to be made in national legislation such as Draft Bill of Code of Obligations and Draft Bill of Turkish Commercial Code. Besides, Draft Bill of Capital Markets is being prepared, considering market requirements and the works completed within the scope of twinning project titled Assisting Capital Markets Board in Harmonization with EU Capital Markets Standards, which was conducted with the Federal Ministry of Finance of Germany within the framework of works for harmonization with EU acquis and within the context of EU Pre-Accession Financial Assistance. Drafts concerning the amendments required to in the Law in order to harmonize with EU regulations are planned to be submitted to the Government in 2009.
For the purpose of monitoring and developing corporate governance practices; works have begun about the report which is to be prepared in order to determine problems and legislation amendments required to be made in the subjects of “Director Liability” and “Shareholder Suits” included in Doing Business Reports prepared by the World Bank and to define elements that may be used as quotation condition from good corporate governance practices. These works are planned to be completed in 2009.
4.2.3. Insurance Sector
Within the scope of the Insurance Law No. 5684, efforts for making arbitration system actually functioning are continuing rapidly. On the other hand, secondary legislation works, carried out considering EU legislation and international practices, about Insurance Law have been completed to a large extent.
4.3. Labor Market
Within the framework of employment focused sustainable growth and towards a competitive economy and information society, the basic priorities are to develop employment opportunities, reduce unemployment, enable labor market to function effectively, enhance an effective relation between education and employment, enable shifting of labor exiting from the agricultural sector to other sectors and promote active labor market policies.
The population of Turkey was 70.6 million people as of the end of 2007. According to temporary estimations based on this population, the total population is expected to be 71.4 million with an increase of 1.13 percent in 2008 and to reach 72.2 million in 2009 by increasing 1.11 percent.
While the share of 0-14 age group in the total population is decreasing, the share of working age population and elderly population is increasing.
Table 4. 4: Share of Age Groups in Total Population (Percent)
0-14 Age Group 15-64 Age Group
2000 2007 2000 2007
EU - 25 16.7 16.0 66.9 67.1
Turkey 30.0 26.4 64.7 66.5 Source: TURKSTAT, EUROSTAT
The increase in employment, which lagged behind the increases in working age population and labor force, was 1.1 percent in 2007 compared to the previous year whereas it was 0.6 on average in the 2000-2006 period. The working age population increased by 1.5 percent and labor

Structural Reforms
65
force increased by 1.2 percent in 2007 compared to the previous year. However, the increases in the number of unemployed people and discouraged workers, who are not participating in labor force, were realized as 1.6 and 1.8 percent, respectively. An important decrease of 7.8 percent was realized in the number of people who are included among those not participating in labor force but who are ready to work though they are not seeking job.
Though slowing down, the change in sectoral distribution of employment is continuing. The share of agriculture sector in employment declined to 26.4 percent from 27.3 percent and employment in this sector decreased by 112,000 people in 2007 compared to the previous year. New employment was created for 347,000 people in non-agricultural sectors. Maximum employment increase was realized in social services, social and personal services sector with 120,000 people.
The labor force participation rate in Turkey is significantly lower than EU averages. This rate was 50.2 percent in our country, whereas it was 70.9 percent in the EU-25 in 2007. The main reason is that women's labor force participation rate is considerably low. Female labor force participation rate is lower than that of male, both in rural and urban areas. Thus, male labor force participation rate is 70.6 percent in the urban areas, and 72.6 percent in the rural areas, whereas these ratios are 20.2 percent and 32.7 percent, respectively, for females.
Table 4.5: Basic Employment and Labor Indicators (Percent)
Turkey EU-25
2004 2005 2006 2007 2004 2005 2006 2007
Labor Force Participation Rate (15-64) 51.5 51.4 50.2 50.2 69.8 70.3 70.7 70.9 - Female 27.0 26.5 26.1 26.1 62.1 62.8 63.4 63.7 - Male 76.1 76.2 74.4 74.4 77.5 77.9 78.0 78.1 Employment Rate (15-64) 46.1 46.0 45.9 45.8 63.3 64.0 64.8 65.8 - Female 24.3 23.7 23.9 23.8 55.8 56.6 57.6 58.6 - Male 67.9 68.2 68.1 68.0 70.9 71.4 72.1 73.0 Unemployment Rate (15+) 10.3 10.3 9.9 9.9 9.2 9.0 8.2 7.2 - Rural 5.9 6.8 6.5 6.9 - - - - - Urban 13.6 12.7 12.1 11.9 - - - - Non-Agricultural Unemployment Rate 14.3 13.6 12.6 12.6 - - - - Youth Unemployment Rate (15-24) 19.7 19.3 18.7 19.6 18.3 18.5 17.1 15.3
Source: TURKSTAT, EUROSTAT
After migrating to the urban areas, women, being employed as unpaid family worker in the rural areas, fall out of the labor force because they have insufficient qualifications for urban jobs, and children, elderly or disabled care in the family becomes an issue.
Informal employment continues to be one of the significant problems of the labor market. According to the TURKSTAT Household Labor Surveys (HIA) figures in 2007, 46.8 percent of the employment is informal, where as this figure is 32.2 percent in the non-agricultural sectors. The high rates of informal employment create a dual structure in the labor market and lead to unfair competition among enterprises. In addition, informal employment rate tends to decrease in recent years.
Flexible working conditions prevalent in EU countries cannot be applied effectively in Turkey. Dissemination of flexible working conditions is of particular importance to increase employment, reduce unemployment and informal employment, and increase employment of women and disadvantaged groups within the context of social inclusion. In order to disseminate
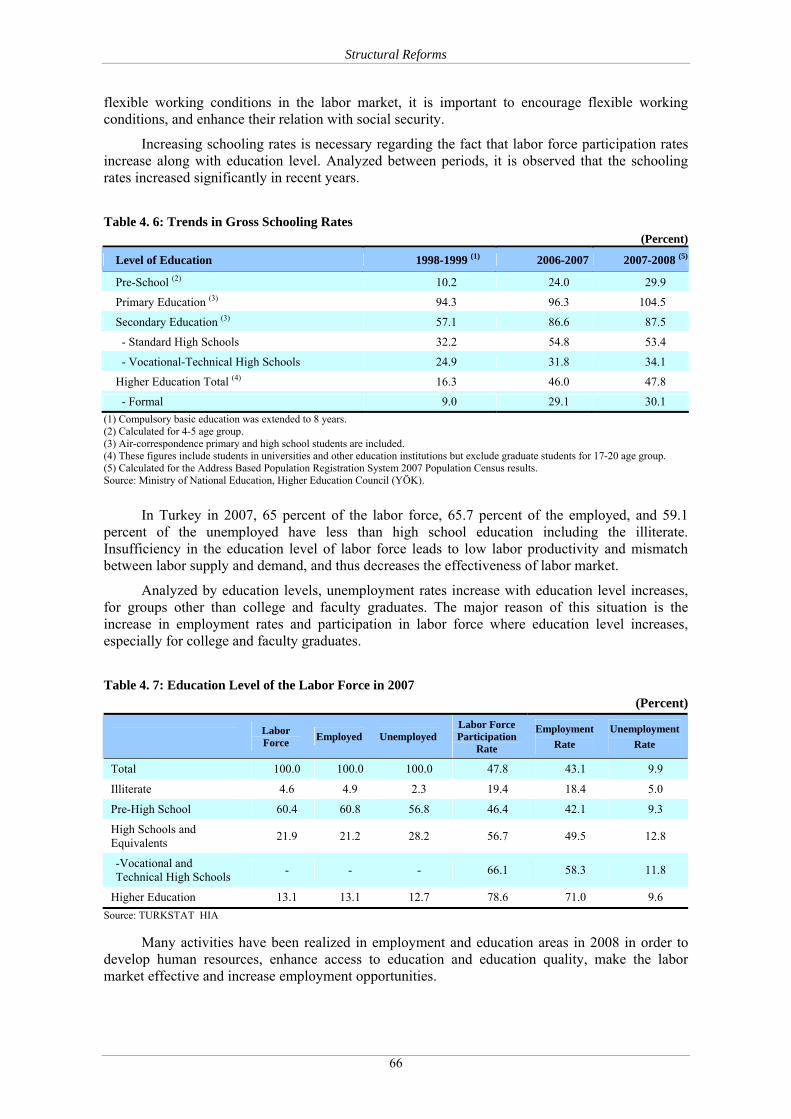
Structural Reforms
66
flexible working conditions in the labor market, it is important to encourage flexible working conditions, and enhance their relation with social security.
Increasing schooling rates is necessary regarding the fact that labor force participation rates increase along with education level. Analyzed between periods, it is observed that the schooling rates increased significantly in recent years.
Table 4. 6: Trends in Gross Schooling Rates (Percent)
Level of Education 1998-1999 (1) 2006-2007 2007-2008 (5)
Pre-School (2) 10.2 24.0 29.9
Primary Education (3) 94.3 96.3 104.5
Secondary Education (3) 57.1 86.6 87.5
- Standard High Schools 32.2 54.8 53.4
- Vocational-Technical High Schools 24.9 31.8 34.1
Higher Education Total (4) 16.3 46.0 47.8
- Formal 9.0 29.1 30.1 (1) Compulsory basic education was extended to 8 years. (2) Calculated for 4-5 age group. (3) Air-correspondence primary and high school students are included. (4) These figures include students in universities and other education institutions but exclude graduate students for 17-20 age group. (5) Calculated for the Address Based Population Registration System 2007 Population Census results. Source: Ministry of National Education, Higher Education Council (YÖK).
In Turkey in 2007, 65 percent of the labor force, 65.7 percent of the employed, and 59.1 percent of the unemployed have less than high school education including the illiterate. Insufficiency in the education level of labor force leads to low labor productivity and mismatch between labor supply and demand, and thus decreases the effectiveness of labor market.
Analyzed by education levels, unemployment rates increase with education level increases, for groups other than college and faculty graduates. The major reason of this situation is the increase in employment rates and participation in labor force where education level increases, especially for college and faculty graduates.
Table 4. 7: Education Level of the Labor Force in 2007 (Percent)
Labor Force Employed Unemployed
Labor Force Participation
Rate
Employment Rate
Unemployment Rate
Total 100.0 100.0 100.0 47.8 43.1 9.9
Illiterate 4.6 4.9 2.3 19.4 18.4 5.0
Pre-High School 60.4 60.8 56.8 46.4 42.1 9.3
High Schools and Equivalents 21.9 21.2 28.2 56.7 49.5 12.8
-Vocational and Technical High Schools - - - 66.1 58.3 11.8
Higher Education 13.1 13.1 12.7 78.6 71.0 9.6 Source: TURKSTAT HIA
Many activities have been realized in employment and education areas in 2008 in order to develop human resources, enhance access to education and education quality, make the labor market effective and increase employment opportunities.

Structural Reforms
67
The Law on Amending Labor Law No. 5763 and Amendment of Some Laws, which makes arrangements concerning avoiding unemployment and increasing employment, known as employment package, entered into effect after being published in the Official Gazette on 26 May 2008. The mentioned Law proposes measures, especially concerning the obligations of employers arisen from the units they have to establish and the persons they have to employ depending on the number of employees, in order to decrease labor costs, raise employment of young people and women, improve active labor force programs, increase unemployment benefits, strengthen the connection between education and employment, reduce informal employment, facilitate establishment of private employment offices, regulate sub-contractor relation and reduce formalities regarding opening business place.
By the Law No. 5763, it is provided for all unemployed people registered to İŞKUR to benefit from social work services, labor force adaptation, vocational education, consultancy and job placement services from which only insured unemployed could benefit in the current situation. It has been made possible for İŞKUR to use 30 percent of state share transferred to Unemployment Insurance Fund in order to finance the mentioned activities and labor market research and planning studies, thus, opportunity to use more resource concerning active labor force policies has been obtained.
By the Law No. 5763, it is aimed to establish a structure, which is more active and which can make binding decisions, by unifying Provincial Employment Commissions and Provincial Vocational Education Commissions under the name of Provincial Employment and Vocational Education Commission. Members of the Commission have been changed, their duty and authority areas have been expanded and meeting time of the Commission has been shortened with this law.
Project focused Social Support Program (SODES) was prepared in order to satisfy the existing and probable social requirements in addition to ordinary duties of public institutions within the scope of Providing Social Development component of GAP Action Plan of 2008-2012 period and a total resource of 600 million TL was proposed. By the projects to be prepared under the titles of employment, social inclusion and culture, art and sport; it is expected to increase employability, develop qualified labor force, reduce poverty, facilitate access of disadvantageous segment of the society to employment and raise their living standards, improve cultural, artistic and sportive activities and to support guiding especially children and young people to such activities. In addition, 139.3 million TL was reserved for İŞKUR in the period of 2008-2012 within the scope of GAP Action Plan. It is expected that this major resource assigned to GAP provinces will cause an important increase in employment in the region.
Within the context of developing active labor market policies, The Active Employment Measures and Local Level Support to Turkish Employment Agency Project aimed to increase employability of women and youth and strengthen the institutional capacity of İŞKUR, which covers 28 provinces and is financed jointly by Turkey and EU was initiated in 2007. Project proposals are in evaluation process and evaluation stage is envisaged to be completed by the end of 2008.
Within the framework of Developing Human Resources Component of the Instrument for Pre-Accession Assistance (IPA); attraction centers and Supporting Women Employment Operation to be applied in Level 2 regions has been commenced by İŞKUR as of the end of 2008, in order to increase women employment, facilitate their accession to better jobs and reducing the obstacles on entrance of women into labor market.
The Project for Strengthening Institutional Structure of İŞKUR, an Enhanced Employment Strategy for the Disabled and Vocational Rehabilitation was initiated in 2007 with the partnership of the Dutch Ministry of Economic Affairs and the Turkish Ministry of Labor and Social Security. By this project, which aims to develop a coding and registration system defining the individual skills, existing potentials and functional capacities of the disabled and place them in appropriate jobs and increase their employment, reaching EU standards is targeted. Besides, the project of “Increasing Labor Market Intermediary Activities in favor of Employability of Long Term Unemployed People”, which was prepared in order to increase employability of long term

Structural Reforms
68
unemployed people having problems in entering labor market and participation of them in labor market and which will be applied in Adana and Mersin in 2008-2009, is supported by the Dutch Government.
Under the Privatization Social Support Project (PSSP) II, a total of 9,748 persons as of September 2007 were provided with consulting, formal training, on the job training and social work program services, and of the total, 5,422 persons were employed. Furthermore, 5 Business Development Centers were established and 367 new business places were opened and employment for 1,721 persons was created.
A total of 11,025 unemployed persons were provided vocational education in 282 courses organized for employment guarantees and for starting up own business by İŞKUR in 2007. Besides, 7,880 disabled and 6,188 ex-convict unemployed persons were provided vocational education by İŞKUR. In 275 courses, a total of 4,329 unemployed persons were provided vocational education in context of placement of unemployed persons on unemployment insurance in new jobs in 2007.
A significant increase was provided in employment of women having problems about entering labor market in 2007. As a matter of fact, while 16,424 of unemployed women registered in İŞKUR was placed in jobs in 2006, this figure increased to 23,400 in 2007. There was an important increase in employment of disabled persons, who constitute another group having problems in entering labor market, in 2007 compared to 2003. While 12,481 disabled persons were placed in jobs by İŞKUR in 2003, 17,864 disabled persons had the opportunity to enter labor market in 2007.
A Labor Market Research on labor market needs assessment was conducted by İŞKUR in order to monitor current situation, follow changes in labor market and reveal their effects on the need for labor force. The Labor Market Research will help to determine in which sectors and professions and how many personnel employers need in the present day and will need in the next periods and in which professions they have difficulties to find personnel. In addition, the results of this survey are expected to contribute to application of active labor force programs according to the needs of the economy.
The Project of Gathering Information on (Supply-Demand) Labor Market concerning Training of Human Resources of the 21st Century, Establishing Predictions and Analyzing and Monitoring System for an Effective Labor Force has been commenced. The mentioned project will be applied in 2008-2010.
National and international markets increasingly demand labor that is creative, has high analytic thinking abilities and can quickly adapt to new skills and access information. In this context, the new curriculum prepared in line with today’s conditions so as to increase education quality, was started to be implemented in primary education. The works of the curriculum preparation for vocational and technical secondary schooling have been completed to a large extent.
In Turkey, the number of students for one computer is 26 while this number is six in OECD countries. In Turkey, there is a need to support formal and mass education with technologies, increase informatics literacy qualities of teachers and students and develop information and communication technology infrastructure in schools in order to equip students with technological competences. Efforts are continuing to provide effective use of Information Technology (IT) classes in education and disseminate broadband internet access services to all schools and educational institutions.
It is of utmost importance to effectively direct vocational and technical education to meet qualified intermediate labor required by the labor market. However, the share of vocational education is very low in secondary education. While the share of vocational and technical education was 42.3 percent in secondary education in 1995, this rate receded to 32.3 percent due to the effect of different coefficient applications among school types in the academic year of 2002-2003. However, with the effect of non-exam entry to vocational high schools introduced in 2002,

Structural Reforms
69
common education for general and vocational education of 9th grades as of 2005-2006 academic year and guiding activities, this rate started to pick up and reached 39 percent in the 2007-2008 academic year.
In order to make the occupational and technical education more effective, vocational and technical education programs at secondary level that were prepared according to the modular education system for 42 broad areas and would allow horizontal transitions were introduced across Turkey since the beginning of the academic year of 2006-2007.
2006 Efforts continue to build up the capacities of Professional Qualifications Agency established in 2006 to create and operate the national professional qualifications system. Within this context, standard development works have been commenced in four vocational areas.
In order to support the development of SMEs and strengthen their competitiveness in the Eastern and Southeastern Anatolian Regions, The Human Resources Support via Vocational Education Project, that aims to develop human resources by modernizing and updating vocational education in selected provinces, was initiated by the Ministry of National Education and Directorate of the Higher Education Council in 2007.
Table 4. 8: Matrix of Policy Commitments: Labor Market (In 1000 Euros)
2006 2007 2008 2009 2010 1. Privatization Social Support Project II A. Implementation Profile --- --- --- --- --- B. Net Budgetary Effect -12,405 -4,150 -5,479 --- --- B.1. Direct Effect on Budgetary Revenues --- --- --- --- --- B.2. Direct Effect on Budgetary Expenditures -12,405 -4,150 -5,479 --- --- 2. The Active Employment Measures and Local Level Support to Turkish Employment Agency Project A. Implementation Profile --- --- --- --- --- B. Net Budgetary Effect --- -3,200 -800 --- --- B.1. Direct Effect on Budgetary Revenues --- --- --- --- --- B.2. Direct Effect on Budgetary Expenditures --- -3,200 -800 --- --- 3. The Women Employment Support Operation A. Implementation Profile --- --- --- --- --- B. Net Budgetary Effect --- --- -2,344 -771 --- B.1. Direct Effect on Budgetary Revenues(1) --- --- --- --- --- B.2. Direct Effect on Budgetary Expenditures(2) --- --- -2,344 -771 --- Total Net Budgetary Effect A. Implementation Profile --- --- ---- ---- --- B. Net Budgetary Effect -12,405 -7,350 -8,623 -771 --- B.1. Direct Effect on Budgetary Revenues --- ---- --- --- --- B.2. Direct Effect on Budgetary Expenditures -12,405 -7,350 -8,623 -771 ---
(1) It represents the difference between the cost of additional capacity acquired as a result of the tax concession provided as part of the Campaign for 100 percent Support for Education and the loss arising from the tax concession. Tax losses were included in budgetary expenditure.
(2) The Fundamental Education Project and the projects funded by European Investment Bank were included. Expenditure funded by provincial special administrations, MEDA grants and the Social Solidarity Fund were not considered since they are not included in the budget.
4.4. Agriculture Sector
The basic objectives of agricultural policies are; to ensure food security and safety and to form an agricultural structure that is harmonized with EU and sustainable as well.
In this context, while the policy instruments are implemented to direct the production according to demand, high priority will be given to the necessary transformation of the agricultural

Structural Reforms
70
structure in order to cope with the competition in the Union after Turkey’s accession. In this context, significant supports provided to contribute to the structural transformation in the agriculture sector are given in Table 4.9. In addition, projects for basic activities regarding the abovementioned supports including technical supports provided under the EU Financial Cooperation are given in Table 4.10.
The studies for Law on the establishment and duties of the Ministry of Agriculture and Rural Affairs which aim to increase the institutional capacity of public sector in the process of structural transformation will be completed by taking into account functional organization required for providing especially plant health, veterinary and food safety services together as envisaged in EU acquis, agricultural research-development and extension in an integrated way and establishing of policy development capacity in soil conservation and land usage.
Technical studies related to draft law prepared for regulation of public services in the area of food, feed, food hygiene, and veterinary services will be finalized after assessing the draft text regarding the subjects of complementary implementation of the abovementioned services, providing clear division of responsibilities between central and local authorities and within the competent authority. In this framework, for the aim of improvement of control and inspection infrastructure, The National Food Reference Laboratory was established in Ankara with the financial support provided from Turkey-EU Financial Cooperation.
Necessary amendments will be made in the related legislation for the Agricultural Sale Cooperatives and Associations, which are an important entity for agricultural producers organizing, so as to have sustainable financial and administrative structures and to strengthen their independence via rationalizing credit support provided to Associations.
In order to prevent fragmentation of agricultural lands by inheritance, necessary amendments in the related laws will be made. Besides, land consolidation activities for decreasing investment and expropriation costs in irrigation projects as well as the studies of reducing the amount of fragmented and scattered agricultural lands will be accelerated.
Through the Direct Income Support (DIS) payments program introduced across the country in 2001, 16.2 million hectares of land was registered in 2007 and payments were made to approximately 2.6 million farmers. The share of area based payments including DIS payments in agricultural support budget realized as 35 percent in 2008 which was 80 percent in 2004. In 2009 when DIS payments are envisaged to be removed, the share of area based payments in agricultural support budget is expected to be approximately 28 percent. Within the context of registration, monitoring and control system improved along with DIS implementation, conditional area-based payments, that launched since 2004, such as for organic farming, soil analyses, Environmentally Based Agricultural Land Protection (ÇATAK), use of certificated seed and seedling and unconditional area-based payments for diesel oil and fertilizer were started to guide production.
In addition, due to the droughts in Turkey, drought supports were paid to farmers in 36 provinces facing 30 percent and above crop loss in last two years.
Nonetheless, in order to provide structural transformation that is necessary for livestock sector competitiveness within the Union after full membership, the share of animal husbandry supports, which was 7 percent share in total support budget in 2004, increased to 20 percent in 2008 and envisaged to be 24 percent in 2009. In this context, fodder crops support payments per thousand square meters, milk incentive premium, pure bred cow payments per head and additional payment implementations for being registered and free from diseases cases were foreseen. Furthermore, implementation of animal identification system was launched and in addition to this in the context of sheep and goats identification “Tagging and Vaccination of sheep and goats Project” having EU grant will be started in 2009. Moreover, in order to improve related administrative capacity, Border Inspection Posts Project and Control of Rabies Project, which put into practice in 2007 under Turkey-EU Financial Cooperation, are expected to be completed at the end of 2009.
Structural Reforms
71
The share of “Support Programme for Rural Development Investments”, which is implemented in order to establish institutional capacity for implementation of EU Rural Development Policies, had 1,44 percent share in total support budget in 2007 and it is foreseen to be 5.40 percent including national co-finance contribution for rural development program in Pre-Accession Financial Instrument. While there is a need to differentiate this practice by taking into account regional characteristics, it is also essential to consider the complementarity of this program with similar one expected to be operational in 2009 within the context of Pre-Accession Financial Instrument.
Pursuant to the Agriculture Insurance Law No. 5363, in the scope of supporting producer’s insurance premium, the number of issued insurance policies, related to the risks under assurance especially for hail, frost, and animal life, has reached to 242 thousands, and 55 million TL support has been provided as of September 2008. Premium supports that are seemed necessary for the health of insurance system are expected to be decreased incrementally for the sustainability of system.
In the framework of above mentioned issues, taking into consideration the requirements of EU accession process as well, a support strategy will be prepared together with a timing schedule that would enhance predictability with respect to (i) the development of an infrastructure whereby the ultimate goal will be agricultural holdings-based subsidies with the capability of area-based administration and control, and (ii) ensuring efficiency and quality improvement through registration that will enable structural transformation in animal husbandry and transforming animal stock to pure culture race.
Activities in order to eliminate problems related to the quality and quantity of agricultural statistical data and to improve information infrastructure and administrative structure are programmed in a way of obtaining technical support in the scope of EU Financial Cooperation. In this context, the works on improving Farmer Registration System are continued in order to establish an Integrated Administration and Control System having an ultimate goal of forming Farm Registration System. To this end, in the framework of Pre-Accession Financial Cooperation, for the aim of monitoring the development of enterprises and contributing to policy making process, projects related to establishing Farm Accounting Data Network and Land Parcel Identification System and improvement of MARA’s statistical capacity have been implemented.
In the fisheries sector, priority will be given to improving the institutional structure, increasing the effectiveness of resource management in capture fisheries and ensuring environmentally friendly production in aquaculture. In this context, Law on Amendment of Fisheries Law, prepared by taking into consideration the compliance with EU Common Fisheries Policy, is on the agenda of Grand National Assembly of Turkey. Construction of offices at the landing points and in the scope of fisheries information system, infrastructural works on registration of catching data and fleet have been continuing. Additionally, it is aimed to disseminate the use of monitoring system presently practiced in the tuna vessels as pilot implementation. In order to be a basis for the establishment of stock assessment system, a project named “Introduction of Stock Assessment to Fisheries Management System of Turkey” will be implemented to determine the legislative and institutional needs and to improve the human resources.
The privatization process of the public sugar factories is in progress. It is envisaged that legislative work, to complete the institutional arrangement in the sector and to make quota management and control effective, is going to be concluded.
Rural Development
The rural development policy framework during the period of the Ninth Development Plan (2007-2013) has been outlined as follows so as to contribute to the implementations of regional development policies which basically aims to reduce the disparities both among the regions and rural-urban areas, and also to solve the cohesion problems emerged in rural areas due to the restructuring of the agriculture sector. The policy objectives are;
1. Enhancement of the competitiveness of agriculture and food sectors,

Structural Reforms
72
2. Improvement of human resources, institutional level and local development capacity
3. Improvement of the physical infrastructure,
4. Protection and improvement of the rural environment
In order to contribute to the policy objectives indicated above, the efforts regarding the development in rural areas will be followed within the context of such principles;
ensuring the consistency between sectoral and territorial policies for the rural development implementations,
complementing the rural and agricultural policies,
ensuring the alignment with the EU’s agriculture and rural policies,
considering the needs and potentials of the country differentiated among the rural areas,
enhancing the coordination and cooperation mechanism among the related public agencies for the implementation of the rural projects,
ensuring local administrations, NGOs, and beneficiaries to participate into decision making and implementation processes for the rural projects.
In the context of the EU membership process, in order to increase the alignment with the acquis on the Common Agriculture Policy and support the sustainable development of agriculture sector and rural areas, the institution building process is being continued within the context of IPA rural development component.
The preparations started for the IPARD Program (2007-2013) which ensures to benefit from pre-accession rural development funds has been finished, and the program has been approved by the EU Commission on 25 February 2008.
The twinning project programmed in 2005 regarding the support on the establishment of IPARD Agency (Agriculture and Rural Development Support Institution) having implementation and payment functions for the IPARD Programme, and increasing of the institutional capacity has been completed in December 2008. The efforts for the accreditation of both central and local offices of the agency are being continued.
The preparations are being continued for the Rural Development Plan which will be produced in line with the National Rural Development Strategy (NRDS) enforced in 2006. Plan is being prepared to cover all rural development programs, projects and activities financed by national and international funds. In addition, a monitoring and evaluation system will be built by the Plan which is designed as a dynamic action plan to devise general principles of the project implementations.
Implementation of the integrated rural development projects financed by international funds like Sivas-Erzincan Rural Development Project (2004-2012), Anatolia Watershed Rehabilitation Project (2004-2012), and Diyarbakır-Batman-Siirt Rural Development Project (2007-2012) are being continued. These projects mostly implemented in the less developed regions contribute both to the modernization and restructuring process of the agriculture and sustainable development of the rural areas.
While the Village-based Participatory Investment Program financed by the World Bank and started in 2005 in 16 provinces has been finished by 2008, the Rural Development Investments Support Program financed by national resources and started in 2006 in the other 65 provinces is being continued and its implementation was extended to the all provinces. Those programs basically aim to increase the rural revenues, improve the integration of agriculture and industry sectors, enhance the marketing infrastructure, increase the food security, generate alternative economic activities, improve irrigation infrastructure, and improve agricultural mechanization. Those programmes, as grant schemes, because of having close implementation mechanism with IPARD Program which covers solely 42 provinces, ensure the IPARD objectives to be achieved country-wide, and therefore contribute to the sustainable development of the rural areas.

Structural Reforms
73
The implementations regarding the Village Infrastructure Support Project (KÖYDES) started in 79 provinces since 2005 except for İstanbul and Kocaeli provinces, and Municipal Infrastructure Support Project (BELDES) started for the rural municipalities having population less than 10.000 in all 81 provinces since 2007 are being continued to provide the infrastructure needs of the rural settlements. The total fund allocated for KÖYDES in 2005-2008 is 4.7 billion TL, and it is 600 million TL for BELDES in 2007-2008 period.
Table 4. 9: Matrix of Policy Commitments: Agriculture - I (Main Developments in Agriculture Support)
(In 1000 Euros) 2007 2008 2009 2010 2011
1.Area Based Supports
A. Implementation Profile --- --- --- --- ---
B. Net Effect on Budget -1,413,172 -1,086,590 -702,212 --- ---
B.1. Direct Effect on Budgetary Revenues 0 0 0 --- ---
B.2. Direct Effect on Budgetary Expenditures -1,413,172 -1,086,590 -702,212 --- ---
2. Pursuant to the Decree 2005/8503 on Supporting Livestock Sector
A. Implementation Profile --- --- --- --- ---
B. Net Effect on Budget -414,717 -609,923 -601,896 --- ---
B.1. Direct Effect on Budgetary Revenues 0 0 0 --- ---
B.2. Direct Effect on Budgetary Expenditures -414,717 -609,923 -601,896 --- ---
3. Support for Rural Development Investments A. Implementation Profile --- --- --- --- ---
B. Net Effect on Budget -44,774 -67,418 -136,045 --- ---
B.1. Direct Effect on Budgetary Revenues 0 0 0 --- ---
B.2. Direct Effect on Budgetary Expenditures -44,774 -67,418 -136,045 --- ---
4. Agricultural Insurance
A. Implementation Profile --- --- --- --- ---
B. Net Effect on Budget -22,387 -28,969 -41,226 --- ---
B.1. Direct Effect on Budgetary Revenues 0 0 0 --- ---
B.2. Direct Effect on Budgetary Expenditures -22,387 -28,969 -41,226 --- ---
Total Net Effect on Budget
A. Implementation Profile --- --- --- --- ---
B. Net Effect on Budget -1,895,050 -1,792,900 -1,481,380 --- ---
B.1. Direct Effect on Budgetary Revenues 0 0 0 --- ---
B.2. Direct Effect on Budgetary Expenditures -1,895,050 -1,792,900 -1,481,380 --- ---
Table 4. 10: Matrix of Policy Commitments: Agriculture – II (Important Projects in Agriculture (1)) (In 1000 Euros)
2007 2008 2009 2010 2011 1. Restructuring the Border Inspection Points Project A. Implementation Profile --- --- --- --- --- B. Net Effect on Budget 4,589 3,345 499 --- --- B.1. Direct Effect on Budgetary Revenues 6,716 4,977 568 --- --- B.2. Direct Effect on Budgetary Expenditures -2,127 -1,633 -69 --- --- 2. Controlling of Rabies Project A. Implementation Profile --- --- --- --- --- B. Net Effect on Budget 6,730 1,606 206 --- --- B.1. Direct Effect on Budgetary Revenues 8,633 2,370 323 --- --- B.2. Direct Effect on Budgetary Expenditures -1,903 -764 -117 --- --- 3. Tagging and Vaccination of sheep and goats

Structural Reforms
74
A. Implementation Profile --- --- --- --- --- B. Net Effect on Budget --- --- 11,073 --- --- B.1. Direct Effect on Budgetary Revenues --- --- 17,944 --- --- B.2. Direct Effect on Budgetary Expenditures --- --- -6,871 --- --- 4. Avian Influenza and Human Pandemic Preparedness and Response A. Implementation Profile --- --- --- --- --- B. Net Effect on Budget -6,600 -4,873 -4,054 --- --- B.1. Direct Effect on Budgetary Revenues 2,299 2,306 1,081 --- --- B.2. Direct Effect on Budgetary Expenditures -8,899 -7,179 -5,134 --- --- Total Net Effect on Budget A. Implementation Profile --- --- --- --- --- B. Net Effect on Budget 4,719 78 7,725 --- --- B.1. Direct Effect on Budgetary Revenues 17,648 9,653 19,916 --- --- B.2. Direct Effect on Budgetary Expenditures -12,928 -9,575 -12,191 --- ---
(1) In EU-funded projects, impact on budgetary revenues results from EU contributions with grant and investment component in the related projects.
4.5. Administrative Reform
Strategic Planning and Performance Based Budgeting
Efforts are underway to establish strategic planning and performance based budgeting in public administrations under the Public Financial Management and Control Law No.5018. and the practice is being expanded within the transition programme which will last until 2010. Within this framework, as of December 2008, out of 104 central public administrations which are under the obligation of preparation of strategic plans and performance programmes, 96 have prepared strategic plans and 76 have prepared performance programmes.
The By-Law on the Performance Programmes to be prepared by Public Administrations which directs agencies’ works on performance based budgeting was promulgated in the Official Gazette dated 5 July 2008. The Guidelines on Preparation of Performance Programmes prepared by the Ministry of Finance was presented for public administrations’ use in July 2008.
In the forthcoming period, strategic planning and performance based budgeting works at institutional level will be continued to expand within the said transition program. As a result of works on expansion, it is expected that by the end of 2009, a total of 145 central administrations will have had institutional strategic plans and these administrations will have prepared performance programmes within the context of budget preparation for 2010.
Strategic planning and performance based budgeting implementation is also continuing in local administrations. Within the six-month period after the local elections which will be held on 29 March 2009, strategic plans and performance programmes for 2010 will be prepared in 244 municipalities whose population is over 50.000 pursuant to the Municipality Law No.5393. as well as in 81 special provincial administrations based on the Special Provincial Administration Law No. 5302.
In order to effectively apply strategic management and to build up theoretical and practical knowledge, a capacity building programme including training, research and publication activities is being carried out by State Planning Organization.
In the light of the works done so far and the experiences gained, the By-Law on the Procedures and Principles of Strategic Planning in Public Administrations which was enacted in 2006 and the Strategic Planning Guide for Public Administrations will be reviewed and necessary changes will be done in 2009 in order to overcome the problems encountered and enable the system to function more effectively.

Structural Reforms
75
4.6. Other Reform Areas
4.6.1. Regional Development
One of the five development axes defined in the Ninth Development Plan of Turkey covering the period of 2007-2013 is Ensuring Regional Development. As it is stated in the Plan; within the frame of development approach based on local dynamics and internal potential, the main objectives of regional development policies are as follows:
making central-level policies more compatible and effective,
increasing institutional capacity at local level,
disseminating economical development and social welfare across the country in a balanced way,
keeping inter-regional migration propensity within the region,
ensuring balanced distribution of the population in space,
establishing a healthy structure of urbanization,
reducing socio-economic development disparities between urban and rural areas by enhancing welfare in rural areas.
Within the mentioned axis of the Plan, it is stated that works for making regional development policies at central-level more effective will be focused; spatial prioritization and concentration will be provided in public investment implementations and service supply in order to increase business opportunities and quality of living in the region. Furthermore, it is emphasized in the Plan that centers, especially in less developed regions, having a high potential to grow and provide services for their periphery will be determined, accessibility of these centers will be improved, and their physical and social infrastructures will be strengthened at first.
In the “Increasing Competitiveness” axes of the Plan, it is mentioned under the priority of improving business environment that “creation of new industrial focuses will be ensured by encouraging the direction of investments towards medium level centers with appropriate infrastructure.” By supporting such focuses and development centers especially in less developed regions, problems caused by migration in metropolitan cities will be decreased, and it will be provided for development to be a process in which everybody participates in a balanced way across the country.
Within this context, particularly in the less developed regions, by determining “Growth Centers” that have high potential to grow and serve to their periphery, it is aimed to ensure a development atmosphere based on local dynamics and internal potential, and to ensure spatial prioritization and concentration in public investment implementations and supply of services. With the programmes which will be designed for these determined centers, it is targeted to encourage the development of new metropolitans especially in less developed regions, in order both to speed up the development process in the region by utilizing the dynamism of these centers and facilitate internal migration by directing it to these centers. Within this framework, pilot implementation works have been initiated in Diyarbakır in 2008, which has been selected among the determined centers and is also under the scope of GAP Action Plan.
A major development realized in 2008 was GAP Action Plan prepared concerning completion of Southeastern Anatolian Project (GAP) in the medium term, which is a regional development project aiming to raise income level and living quality of the people in the region, removing inter-regional disparities and contributing to economic development and social stability targets at national level, by utilizing the resources of Southeastern Anatolian Region. Four main development axes have been based in the GAP Action Plan, as Realizing Economic Development, Providing Social Development, Improving Infrastructure and Improving Institutional Capacity. A total of 12.2 billion Euros will be used in 2008-2012 period for the activities and projects included within the scope of the GAP Action Plan. It is planned to provide 526 million Euros, of 7.6 billion

Structural Reforms
76
Euro additional financing required in 2008-2012 period for the GAP Action Plan, in 2008 and 7.1 billion Euros in 2009-2012 period.
On the other hand, special regional development programs, which have been implemented in the scope of Turkey-EU financial cooperation with joint financing in the period of 2004-2006, are in the final stage. Excluding the one coordinated by GAP Administration, the total amount of grant allocated to the regions in the context of regional development programs coordinated by SPO have reached approximately 259 million Euros at the end of 2008. Implementations within the scope of Eastern Blacksea Development Programme (DOKAP) and Turkey-Bulgaria Cross-Border Cooperation Programme-2006 Joint Small Project Fund among the mentioned programs are in progress, and other programs are mostly finalized successfully at a large extent. A total of 1,428 projects have been supported in 33 provinces by regional development programs implemented, excluding GAP Program and Turkey-Bulgaria Cross-Border Cooperation Program. Among them, 1,215 projects were completed and implementations of the projects within the scope of DOKAP are in progress.
In addition, pilot implementations were commenced in 2006 with the first legal arrangements regarding Development Agencies. Agencies for pilot implementation was established, organized and put into operation in Çukurova region including Adana and Mersin provinces having Adana as center, and in İzmir metropolitan region including İzmir province. However, activities of pilot agencies suspended for a long time because of judicial process, which was commenced in February 2007 and continued until March 2008, and the process of establishing new agencies was interrupted. After all, legal obstacles on Development Agencies were removed after March 2008 within the framework of affirmative decision of the Constitutional Court.
Development agencies were officially established in November 2008 in eight regions having Istanbul, Samsun, Diyarbakır, Konya, Erzurum, Gaziantep, Mardin and Van as their centers. Efforts are continuing for establishing Development Agencies in all NUTS II regions as of the end of 2009.
Development Agencies will provide technical and financial support for the projects and activities in the prominent sectors in their regions within the frame of National Development Plans and regional plans. “Regulation on the Support to Projects and Activities by the Development Agencies”, which is the fundamental legislation regarding this issue, was prepared by State Planning Organization and has entered into effect after being published in the Official Gazette dated 8 November 2008 and numbered 27048, and required infrastructure has been set up.
Table 4. 11: Matrix of Policy Commitments: Regional Development (In 1000 Euros)
2007 2008 2009 2010 2011 1. Regional Development in TR82, TR83 and TRA1 NUTS II Regions A. Implementation Profile --- B. Net Effect on Budget -2,414 --- --- --- --- B.1. Direct Effect on Budgetary Revenues --- --- --- --- --- B.2. Direct Effect on Budgetary Expenditures -2,414 --- --- --- --- 2. Turkey-Bulgaria Cross Border Cooperation Programme A. Implementation Profile --- --- --- B. Net Effect on Budget -303 -949 -1,413 --- --- B.1. Direct Effect on Budgetary Revenues --- --- --- --- --- B.2. Direct Effect on Budgetary Expenditures -303 -949 -1,413 --- --- 3. Regional Development in TRA2, TR72, TR52 and TRB1 NUTS II Regions A. Implementation Profile --- --- B. Net Effect on Budget -16,776 - 4,194 --- --- --- B.1. Direct Effect on Budgetary Revenues --- --- --- --- --- B.2. Direct Effect on Budgetary Expenditures -16,776 - 4,194 --- --- ---

Structural Reforms
77
4. Regional Development in TR90 NUTS II Region A. Implementation Profile --- --- --- B. Net Effect on Budget --- -4,800 -1,200 --- --- B.1. Direct Effect on Budgetary Revenues --- --- --- --- --- B.2. Direct Effect on Budgetary Expenditures --- -4,800 -1,200 --- --- 5. EU Regional Programmes (1) A. Implementation Profile --- --- B. Net Effect on Budget -564 -1,613 --- --- --- B.1. Direct Effect on Budgetary Revenues --- --- --- --- --- B.2. Direct Effect on Budgetary Expenditures -564 -1,613 --- --- --- 6. Regional Development Project (2) A. Implementation Profile --- --- --- B. Net Effect on Budget -110 -108 -103 --- --- B.1. Direct Effect on Budgetary Revenues --- --- --- --- --- B.2. Direct Effect on Budgetary Expenditures -110 -108 -103 --- --- 7. GAP Action Plan A. Implementation Profile --- --- --- --- B. Net Effect on Budget -1,294,322 -2,065,951 -2,209,249 -2,074,182 B.1. Direct Effect on Budgetary Revenues --- --- --- --- B.2. Direct Effect on Budgetary Expenditures -1,294,322 -2,065,951 -2,209,249 -2,074,182 8. Allocations for Local Administrations A. Implementation Profile --- --- B. Net Effect on Budget -4,769 -6,056 --- --- --- B.1. Direct Effect on Budgetary Revenues --- --- --- --- --- B.2. Direct Effect on Budgetary Expenditures -4,769 -6,056 --- --- --- 9. Development Agencies A. Implementation Profile --- --- --- --- --- B. Net Effect on Budget --- -34,236 -206,129 -302,821 -320,954 B.1. Direct Effect on Budgetary Revenues --- --- --- --- --- B.2. Direct Effect on Budgetary Expenditures --- -34,236 -206,129 -302,821 -320,954 Total Net Effect on Budget A. Implementation Profile --- --- --- --- --- B. Net Effect on Budget -24,936 -1,346,278 -2,274,796 -2,512,070 -2,395,136 B.1. Direct Effect on Budgetary Revenues --- --- --- --- --- B.2. Direct Effect on Budgetary Expenditures -24,936 -1,346,278 -2,274,796 -2,512,070 -2,395,136
Note: Spending related to the programs being implemented take place in the following year due to the approval procedure under Decentralized Implementation System.
(1) For the regional development projects under this project, in case of necessary circumstances, transfers will be made to the budgets of local administrations or their enterprises directly or via Ministry of Internal Affairs’ budget.
(2) Yeşilırmak Project prepared by strategic planning approach.
4.6.2. Health and Social Security Reform
Health Transformation Program
The Health Transformation Program aims to restructure the Ministry of Health to strengthen its regulating, planning and supervising roles, establish the universal health insurance system, ensure rational use of medicine and medical devices and make the health information system effective. The program also aims at spreading the health services, increasing their quality and ensuring easy access to these services.
In the context of the Health Transformation Program, the pilot implementation of Family Medicine was initiated in 2005 with a view to strengthening primary health services and ensuring efficient use of the referral chain, and the number of pilot provinces was increased to 26 in 2008. It is planned to disseminate the practice to the whole country at the end of the year 2012.

Structural Reforms
78
Under the e-health project, which aims to compile, analyze and evaluate data from health institutions according to specified standards; standard definitions of institutions communicated while providing health service, data bank of doctors providing the service, internationally accepted illness classification, medicine and medical devices codes have been determined and started to be used. In this context, the pilot implementation of the tele–medicine system in radiology and pathology was started. Pilot implementations in the scope of the Central Hospital Appointment System Project will be initiated in 3 regional centers in 2009.
Within the framework of the Health Transformation Program, institutions responsible for health services provision will be restructured. In this context, firstly, the organization law of the Ministry of Health will be renewed in order to strengthen its planning and supervisory role, and Refik Saydam Hygiene Center will be transformed into a National Public Health Institution with international accreditation. In order to enhance service quality and efficiency, public hospitals will be gradually given administrative and financial autonomy. Turkey Medicine and Medical Devices Agency will be established to regulate production, import, export, provision and use of drugs, of substances used in drug production and of medical devices. It will also ensure that they will be delivered to the society safely, effectively, in good quality and in compliance with standards.
It is planned to complete the First Stage of Health Transformation Project, which is conducted in order to provide support for the implementation of Health Transformation Project, in 2009; and to initiate its second stage in the second half of 2009.
Social Security Reform
Upon the cancellation of some articles of the Social Insurances and Universal Health Insurance Law No. 5510, which was prepared to ensure norm and standard unity in social insurance regimes, by the Supreme Court; the Social Insurances and Universal Health Insurance Law No. 5754 and the Law on Amending Various Laws and Decree Laws, which were prepared by considering cancellation decision, entered into effect on 1 October 2008 after being published in the Official Gazette dated 8 May 2008 and numbered 26870.
A major part of social security reform was completed with the Laws No. 5510 and 5754. The mentioned laws ensures the establishment of a new institutional structure in the social security system; the formation of a financially sustainable, uniform retirement insurance system that equalizes insurance rights and obligations; and establishment of a universal health insurance system that finances provision of accessible, equal and good quality health services to the whole population.
These regulations, which can be described as a parametric reform, cover gradual increases in the retirement age, reduction in replacement rates and changes in the definition of the premium basis for newly recruited civil servants.
Premium rates also changed with the Law that has come into effect. According to this; the premium rate for workers under service contract 4 (a) was raised from 25 percent to 32 percent, and the premium rate for self-employed 4 (b) was raised from 20 percent to 32 percent.
Social security support premium is deducted from pensions of those who continue to work although they are retired or begin to work again. Social Security Support Premium (SGDP) rate, which was applied as 30 percent for those retirees working under an employment contract before the effective date of the Law, was determined as 31-36.5 percent of their earnings taken as basis to premium. For those retirees, who will be insured under an employment contract after the effective date of the Law, the concept of SGDP is removed and they will participate in the system through a mandatory insurance scheme. For self employed insurees, the SGDP rate, which was applied as 10 percent, is raised to 12 percent of their pensions after the effective date of the Law. Furthermore, it is agreed to increase this rate up to 15 percent by raising it gradually 1 percentage point in January each year.
Replacement rates were also re-arranged with the Law and determined as 2 percent for every year spent in the new system. According to this, the total replacement rate of a person, who

Structural Reforms
79
becomes insured after effective date of the Law and works for 25 years, will be calculated as 50 percent.
The reform includes legal amendments related to the insurance branches other than pension insurance. It is agreed that the funeral aid will be set according to the amount to be determined over the tariff notified by the Administrative Board of the Social Security Institution and approved by the Minister and that the daily benefit paid in case of temporary inability to work will be set at 2/3 of daily wage for outpatient treatment and 1/2 of daily wage for inpatient treatment. Besides, according to regulation, wages of public officials will be paid by the employing institutions while they are in recovery leave. Provided that at least 120 days of short term insurance premium is paid within one year before the birth, breast-feeding aid will be paid to insurees who are under service contracts or self-employed, for each child at a rate which is valid on the birth date and determined by Board of Directors of the Social Security Institution and approved by the Minister. In addition to these, it is proposed to grant 24 times of the death income or salary as marriage aid to daughters (receiving death income or salary) of people worked under service contract, as self employed or as public officials.
By the universal health insurance, which is another component of the reform, a mandatory universal health insurance that covers the entire society has been put into action. By the Health Practice Communiqué (SUT) that regulates procedures and principles regarding the delivery of health services, the uniformity of practice for the insured under SSK, BAĞ-KUR and Emekli Sandığı was ensured in June 2007. After the enactment of reform Laws, some revisions were made on SUT and they were published in Official Gazette dated 29 October 2008 and numbered 27012.
With commencement of the universal health insurance, it is envisaged that the government shall pay the premiums for those who do not have the ability to pay. Persons, who are not covered under any health scheme and who are not eligible to government relief, will start to pay universal health insurance premium with the new Law. Furthermore, with the reform, those under age 18 will benefit from Universal Health Insurance without considering insurance condition of parents.
The provincial organization of the new institutional structure within the context of social security reform has been completed on the basis of Provincial Directorates and efforts for establishing central directorates are in progress. Furthermore, works for approximately 20 regulations and the same number of Communiqués were completed within the frame of secondary legislation, and entered into effect after being published in the Official Gazette. Currently, around 10 more regulations are at the publishing stage. Table 4. 12: Matrix of Policy Commitments: Health Care-Social Security
(In 1000 Euros) 2007 2008 2009 2010 2011
1. Health Transformation Project (1) A. Implementation Profile --- --- --- --- --- B. Net Effect on Budget 33,555 75,468 87,600 93,295 93,910 B.1. Direct Effect on Budgetary Revenues 50,000 100,000 100,000 100,000 100,000 B.2. Direct Effect on Budgetary Expenditures -16,445 -24,532 -12,400 -6,705 -6,090 2. Avian Influenza Project (2) A. Implementation Profile --- --- --- --- --- B. Net Effect on Budget -6,116 -6,076 -4,210 -3,075 --- B.1. Direct Effect on Budgetary Revenues --- --- --- --- --- B.2. Direct Effect on Budgetary Expenditures -6,116 -6,076 -4,210 -3,075 --- Total Net Budgetary Effect A. Implementation Profile --- --- --- --- --- B. Net Effect on Budget 27,439 69,392 83,390 90,220 93,910 B.1. Direct Effect on Budgetary Revenues 50,000 100,000 100,000 100,000 100,000 B.2. Direct Effect on Budgetary Expenditures -22,561 -30,608 -16,610 -9,780 -6,090
(1) Establishment of database infrastructure of social security is included. (2) The project has two components, one of which will be funded by the World Bank and the other by the European Union.

Structural Reforms
80
4.6.3. R&D and Innovation
The main objective of the science and technology policy is defined as to enhance innovative capabilities of the private sector, to become competent in science and technology and to transform such competence to economic and social benefit.
In Turkey, the share of R&D expenditures in GDP was 0.76 percent in 2006 whereas it was 1.84 percent for the EU average. It is aimed to raise this rate to 2 percent in 2013. Accordingly, while the amount of public investments in R&D was 319 million TL in 2003, it was raised to 964 million TL in 2008 with an increase of 302 percent.
Role of private sector is increasing in transforming R&D efforts to products and increasing its contribution to competitiveness. While the rate of R&D activities realized by private sector in Turkey was 33.8 percent in 2005, it was raised to 37 percent in 2006. However, this rate lagged quite behind the EU-27 average of 64 percent in 2006. In this context, on the one hand support and incentives to R&D projects of the private sector are increased, on the other hand the number of technology development zones (TDZ) and technology centers was increased which were established to bring together all parties that generate knowledge and use it to produce value added and allow the participant companies to benefit various incentives. As of September 2008, 31 technology development zones have been established and 18 of them continue its operations. Investments for establishing and putting latent TDZs into operation are continuing. R&D supports provided for small and medium-sized enterprises (SMEs) under the responsibility of the Directorate of Small and Medium Industry Development Organization (KOSGEB) will be activated and disseminated, and it will be provided to sustain activities related to creating more R&D demand by SMEs. Works for establishing Technology Development Centers (TEKMER) and Un-walled Technology Incubators (DTİ) will be realized in order to provide cooperation of university and industry and support R&D studies.
Besides, the Law No. 5746 on Supporting Research and Development Activities, which was codified to regulate tax incentives provided for R&D subjects, entered into effect after being published in the Official Gazette dated 12 March 2008 and numbered 26814. By the effective date of this Law, it is aimed to increase the number of R&D expenditures made by private sector and the number of R&D personnel employed in private sector.
Another issue as important as increasing the allocated resources is to overcome the shortage of researchers. In Turkey, ratio of R&D personnel to total labor force was 0.43 percent in 2006 and this ratio is well below the EU-27 average of 1.33 percent in 2006. Programs and projects were initiated to educate researchers inside and outside the country to overcome this shortage. The measure for “improving researcher labor force raising programs and developing incentive mechanism for encouraging research” under the responsibility of TÜBİTAK (Scientific and Technological Research Council of Turkey) is included in 2009 Public Investment Program in order to improve researcher human force by quality and quantity.
The number of faculty members will be increased and balanced distribution of faculty members will be ensured across the country. Furthermore, academician raising programs (ÖYP) will be disseminated in developed universities in order to overcome the shortage of faculty members in developing universities.
The EU Seventh Framework Program in science and technology was fully participated in order to increase science and technology cooperation with EU member states and become a part of the European Research Area.
National Innovation Strategy and Action Plan will be prepared under the responsibility of TÜBİTAK in order to establish a national innovation system, which increase the cooperation between institutions in science and technology areas and the effectiveness of private sector in the system. Within this context, duties, authorities and responsibilities of the institutions will be redefined by ensuring coordination among the institutions. Besides, establishment of cooperation networks among universities, public institutions and local socio-economic dynamics will be

Structural Reforms
81
supported in order to enhance competition capacities of provinces and support development in the provinces.
The need to improve the monitoring and evaluating system for policies and support mechanisms applied in science and technology areas still continues. Based on this requirement, monitoring and evaluation processes on governmental supports for R&D will be initiated in 2009.
4.6.4. Information and Communication Technologies
One of the basic objectives of the Ninth Development Plan (2007-2013) is to realize the transformation of Turkey into an information society.
Works are continuing under the Information Society Strategy and its annexed Action Plan which lay down basic objectives and policies to realize this transformation and methods and tools that should be followed.
Within the context of the development of human resources required for the information society, about 32,857 schools/institutions of the Ministry of National Education (MoNE) have been connected to internet (ADSL) by December 2008 as the outcome of protocols signed by the MoNE and Türk Telekom Inc. Moreover, 5,000 more schools or institutions will be connected to internet following the efforts of Türk Telekom Inc. to undertake necessary infrastructure investments. On the other hand, it was planned that 5,227 schools/institutions where ADSL connection is impossible would be connected to internet through very small aperture terminal (VSAT) based on the protocols signed by TÜRKSAT Inc. and MoNE, and 4,300 schools/institutions are provided with satellite connection by 3 December 2008. As a result, 93 percent of primary school students and 99 percent of secondary school students that adds up to almost 12 million students have been provided with broadband internet access.
With the e-School Project that has been introduced in all schools in Turkey, parents can communicate with the school continuously; keep track of their children’s success and absenteeism. In addition, teachers can monitor their course schedules through internet. Furthermore, works on the establishment of decision support system by using the information collected countrywide, were expanded to cover 71 provinces.
According to the survey on the Use of Information and Communication Technology (ICT) in Households announced by the Turkish Statistical Institute (TURKSTAT) in August 2008, the percentage of individuals using the internet is 35.8 percent, of which 26.1 percent use the internet for communication with the public institutions and organizations for personal purpose. 31.8 percent of individuals using internet for the communication with public administrations have used internet to fill the forms and to send the filled forms. Additionally, according to the survey on ICT Usage in Enterprises published by TURKSTAT in November 2008, percentage of the enterprises that have Internet access increased to 89.2 percent, while percentage of enterprises using the internet communication with the public institutions and organizations increased to 68.8 percent.
e-Government Portal, which is under the duty and responsibility of TURKSAT Inc., through which the citizens and the business can reach integrated public services online on one-stop basis, became operational on 18th of December 2008, with pilot services.
Besides commonly used primary e-government applications, address record system was integrated with citizenship identification system. In addition to these, the works on health and social security applications, the third phase of Automation of Tax Administrations Project (VEDOP), land registry and cadastre information system (TAKBIS), unique number system for legal persons and the Pilot Project on Citizenship Card are continuing.
The pilot studies regarding the Project on Citizenship Card that is aiming at provision of citizen oriented and high quality electronic public services on safe and secure environment and that will ease and speed up the transactions of the citizens in civil services like tax, citizenship affairs, health, social security, etc. have been initiated; and the dissemination phase will be started in accordance with the results of the pilot implementation.

Structural Reforms
82
The number of the electronic signature users has been increasing gradually. The number of the qualified electronic certificate has been increased to 70,000 at the end of October 2008, while it was 12,000 at the end of 2006. Besides, 60,250 qualified electronic signatures have been produced for the mobile signature of which the implementation was started in 2007. Currently, 66 public institutions and organizations are using e-signature in their institutional procedures. The usage of e-signature is increasing in different areas of private sector, especially in the energy and banking sectors.
Legislative alignment with the EU acquis related to cybercrime is continuing. In this regard, the Draft Law on Protection of Personal Data was sent to the Turkish Grand National Assembly (TGNA) by the Prime Ministry on 22 April 2008. As of December 2008, the Draft is at the Justice Commission of the Assembly.
Within the context of liberalization and harmonization to EU legislation in the electronic communications sector, Electronic Communications Law, which has been prepared with the aim of eliminating the dispersed structure of Turkish legislation regarding telecommunications in parallel to the developments of the sector and to the EU regulations, came into force following its publication in the Official Gazette No. 27050, dated 10 November 2008. Secondary legislation will be reviewed and harmonized with this Law in the forthcoming period.
As of September 2008; fixed telephone, mobile telephone and broadband subscriber penetration rates have been 25 percent, 92 percent and 8 percent in Turkey, respectively.
The by-law on Electronic Communications Security that identifies obligations of operators regarding security of electronic communication networks has come into force following its publication in the Official Gazette No. 26942, dated 20 July 2008.
Legal regulation regarding the authorization of fixed telecommunication services, also covering local calls, came into force after its publication in the Official Gazette No. 27060, dated 20 November 2008. Following the determination of minimum license value by the Council of Ministers, authorization process will be initiated. Auction regarding the authorization of third generation mobile services, which will enable the provision of mobile broadband services, has been completed in November 2008. Mobile broadband access services are envisaged to be licensed in 2009. Number of licensed operators, as of November 2008, is shown in the following table according to service types:
1- National Telecommunication Services: 1
2- Global System for Mobile Communications (GSM) Mobile Telephone Service: 3
3- Satellite Platform Services: 2
4- Satellite Telecommunication Services: 20
5- Global Mobile Personal Communication System Mobile Telephone Services: 5
6- Wireline and Wireless Internet Service Provision Services: 88
7- Data Communication Services over Terrestrial Lines: 26
8- Joint Use Radio Services: 51
9- Infrastructure Operations Services: 16
10- Cable Platform Services: 5
11- Directory Services: 8
12- Long Distance Telephone Services: 32
Mobile number portability has been introduced as of 9 November 2008. Enforcement date for geographical and non-geographical number portability is planned to be 9 May 2009.
Local loop unbundling is operational since the beginning of 2008.

Structural Reforms
83
Following the declaration of intention of Turkey regarding participation in ICT Policy Support Program, which is a component of the Competitiveness and Innovation Program of EU, negotiations on Memorandum of Understanding (MoU) has been completed. However, participation was delayed to 2009, since the MoU could not have been signed until the closure of 2008 project calls.
Legal and technical infrastructure works on the policy of transition to digital video broadcasting-terrestrial (DVB-T) are being executed through the coordination of Ministry of Transport. In this context, trial DVB-T broadcasts, launched in 2006 in Ankara, Istanbul and Izmir, are continued. Legal amendments on Broadcasting Law No. 3984 are planned to be completed in 2009 in order to develop legal infrastructure.
Postal services failed to acquire a structure compatible with the market realities, changing economic approaches and actual competition in the market. Necessary regulations are planned to be completed in 2009 in order to liberalize postal services in a gradual and controlled manner, and restructure the sector in a competitive manner by taking the relevant EU Directives into account.
4.6.5. Transportation
Trans-European Networks Chapter was opened to negotiations in December 2007. Final Report TINA-Turkey Study, which was completed in May 2007, was approved by the Decree of the Higher Planning Council Decision with No. 2008/35 and dated 10 July 2008. TINA-Turkey study constitutes the basic issue in this chapter. Preparation works concerning this chapter, which have still continued, conducted with European Commission jointly.
Providing to establish legal and structural framework of Turkish Railway Sector for alignment with the EU legislations and to regulate the railway sector, the draft bills of General Railway Framework Law and TCDD Law and the complementary draft regulations on Railway Safety, Railway Operating License, Railway Interoperability and Railway Infrastructure Access were prepared. The drafts, which were rearranged including general rationale and article rationales and taking the opinions of relevant governmental institutions and organizations and non-governmental organizations, was submitted to the Ministry of Transportation as of 15 July 2008. In Turkey's Programme for Alignment with the Acquis covering the 2007-2013 period, the said draft bills are scheduled to be legislated in the 2008-2009 legislative term.
Turkish Railways Reform Project was prepared in order to be ready for arrangements to required regulations after entrance of the Laws into effect, and it was accepted by the European Council. The project aims to determine a strategy regarding railway reform and prepare an action plan, to improve the Infrastructure Management in TCDD which will be restructured soon, to improve of Railway Enterprises regarding interoperability and security, and to improve the allocation and pricing capacity of the Infrastructure Management. Work description of the project was prepared and primary tender announcement was made by Central Finance and Tender Department. Efforts for conducting the tender until the beginning of 2009 are in progress.
Consultancy contract regarding Boğazköprü-Ulukışla-Yenice, Mersin-Adana-Toprakkale Signalization, Telekom Complex Establishment and Infrastructure Rehabilitation Project, which is mostly financed by the credit obtained from World Bank, was signed on 13 May 2008 and building contract was signed on 7 November 2008. Completion period of the project is 36 months.
Regarding maritime transport, as a result of effective implementation of country obligations in Flag, Port and Coastal State controls and measures taken regarding maritime safety, Turkish flag moved from the black list to the gray list of the Paris MoU in 2007 and necessary steps are being taken for moving Turkish flag to the white list.
In the light of experiences gained from Turkish Straits Vessel Traffic Systems (VTS), efforts for establishing new VTS in order to raise maritime safety and security in İzmit, İzmir, İskenderun and Mersin Bays and Aliağa/Nemrut Region where vessel traffic is heavy and risky are continuing, and establishment tender will be made in 2009.

Structural Reforms
84
Thanks to the Automatic Identification System (AIS) which was put into service in July 2007 in order to enhance efficiency in maritime safety, vessel traffic across all coasts of Turkey can be monitored instantaneously by the operation center established in the Undersecretariat of Maritime Affairs. Furthermore, Turkey will be integrated with the Long-Range Vessel Identification and Tracking System (LRIT), which is envisaged to be put into operation by the end of 2008 in accordance with SOLAS regulation V/19-1, by the National LRIT Data Center that is to be established within the Directorate General of Coastal Safety. As a result, Turkish flagged vessels all around the world and foreign flagged vessels within an area of 1000 miles from Turkish coasts shall be monitored.
The process of harmonizing Turkish maritime legislation with the EU acquis and becoming party to some important international maritime conventions will be continued according to the program prepared earlier.
Within the context of harmonization process with EU, Examination Instructions for Air Craft Maintenance Personnel Regulation (SHY 66-01), which was prepared parallel with license requirements of EASA Part 66, Instructions of Pass Card for All Airports and Circular for Conducting SHD-T-35 License Operations providing accordance with type and license arrangements in Part 66 and Part 147 of the European Aviation Safety Agency, was published. Besides, SHY-66 Transformation Instructions and SHY-66-01 Application Circular regulating transformation of SHD-T_35 licenses into SHY/JAR-66 licenses in order to satisfy EASA requirements were published and license examinations for aircraft maintenance personnel have been commenced.
Within the scope of the works for harmonization with EU; it is planned to publish Regulation on Slot Implementation Principles, Regulation on Airports Ground Services (SHY-22), Regulation on Maintenance System of Commercial Air Freight Enterprises (SHY-M Rev.1), Regulation on Passenger Rights, Regulation on the Rights of Disabled Persons and Persons with Reduced Mobility Transported by Airway, Regulation on Safety Assessment of Domestic and Foreign Air Crafts in 2009 and Instructions for Computerized Reservation Systems in 2010.
It is aimed to determine new investment needs of airports by making current status analysis and commence Airports Master Plan works which will guide medium and long term investments in 2009.
In the area of road transport, it is aimed to establish a powerful and highly competitive sector with the enactment of The Road Transport Law in 2003 and a series of regulations issued pursuant to this Law.
Establishment and operation of vehicle inspection stations across Turkey was transferred to a Consortium for 20 years with an Agreement signed between Privatization Administration and a triple consortium on 15 August 2007. The aim is to increase road traffic safety by conducting mechanical inspection, weight and dimension controls of vehicles more effectively and healthy and in accordance with EU standards. In this scope, 189 immobile and 39 new mobile stations have been aimed to be established by private sector. By November 2008, 100 immobile and 42 mobile vehicle inspection stations have been put into operation. All stations will be completed and put into operation by February 2009.
On the other hand, following transfer of the General Directorate of Highways to the Ministry of Transportation from the Ministry of Public Works and Settlement in August 2007, 21 current vehicle weight and dimension control stations across the country was renewed and rehabilitated. In addition, 3 new weight and dimension control stations was built and put into operation. By this way, it has been made possible to make weight and dimension controls in stations which have EU standards. Furthermore, it is aimed to provide more effective inspection service by distributing 200 mobile weight measuring devices purchased in 2007 to Regional Directorates of the Ministry of Transportation.

Structural Reforms
85
In addition to these, the Regulation on road transport of hazardous materials, which was published in 2007 and will enter into effect in 2010, will serve to raise road safety with its implementation. Measures concerning the implementation of this regulation are still in progress.
It is aimed to remove 60,000 old commercial vehicles from domestic market within 2 years, by a Communiqué published concerning removal of the vehicles manufactured before 1972 from national market in order to raise road safety and protect environment.
In the road transportation area, the Project for Supporting Turkish Highways Sector, which was developed for supporting the EU harmonization process and financed by the EU with 5.5 million Euros, and which consists of three main components namely twinning, service procurement (training) and equipment procurement, was implemented and completed in 2007. Within the scope of the project, under the twinning project component, which was commenced on 11 May 2006, it is aimed to improve the harmonization of the existing road transportation legislation with EU Acquis and make necessary regulations in the non-harmonized areas. The By-Law on Road Transport of Hazardous Materials prepared with the contribution of this project was promulgated in the Official Gazette dated 31 March 2007 No. 26479. Within the scope of the service procurement component of the Project for Supporting Turkish Highways Sector, which commenced on 30 November 2006, technical training was provided in many subjects, especially in English. Within the framework material/equipment procurement component, six mobile control stations are assigned to the service of the Ministry of Transportation in order to conduct roadside inspections, and these control stations have been put into operation recently.
Table 4. 13: Matrix of Policy Commitments: Transportation
(In 1000 Euros) 2007 2008 2009 2010 2011 1. Reconstruction of TCDD and Turkish Railway Sector A. Implementation Profile --- --- --- --- --- B. Net Effect on Budget -477 --- --- --- --- B.1. Direct Effect on Budgetary Revenues --- --- --- --- --- B.2. Direct Effect on Budgetary Expenditures -477 --- --- --- --- 2. Highways Sector Support Project A. Implementation Profile --- --- --- --- --- B. Net Effect on Budget -1,500 -1,500 --- --- --- B.1. Direct Effect on Budgetary Revenues --- --- --- --- --- B.2. Direct Effect on Budgetary Expenditures -1,500 -1,500 --- --- --- 3. Increasing Maritime Safety in Ports and Coastal Areas of Turkey A. Implementation Profile --- --- --- --- --- B. Net Effect on Budget -162.5 --- --- --- --- B.1. Direct Effect on Budgetary Revenues --- --- --- --- --- B.2. Direct Effect on Budgetary Expenditures -162.5 --- --- --- --- 4. Modernization of Maritime Communication Infrastructure A. Implementation Profile --- --- --- --- --- B. Net Effect on Budget --- -700 (1) --- --- --- B.1. Direct Effect on Budgetary Revenues --- --- --- --- --- B.2. Direct Effect on Budgetary Expenditures --- -700 (1) --- --- --- 5. Transport Operational Programme A. Implementation Profile --- --- --- --- --- B. Net Effect on Budget --- --- -388 (2) -218,299 (3) --- B.1. Direct Effect on Budgetary Revenues --- --- --- --- --- B.2. Direct Effect on Budgetary Expenditures --- --- -388 (2) -218,299 (3) --- Total Net Budget Effect A. Implementation Profile --- --- --- --- --- B. Net Effect on Budget -2,139.5 -2,200 -388 -218,299 --- B.1. Direct Effect on Budgetary Revenues --- --- --- --- --- B.2. Direct Effect on Budgetary Expenditures -2,139.5 -2,200 -388 -218,299 ---
(1) Included in 2007 programming. Figures are indicative. (2) Indicative figure for Know-How Support component of Transport Operational Programme. (3) Indicative figure for the infrastructural investments under the Transport Operational Programme.

Structural Reforms
86
4.6.6. Energy
In the Ninth Development Plan, which covers 2007 – 2013 period and in which economic and social targets are determined, it is aimed to develop energy and transportation infrastructure for development axes of enhancing competitiveness. Within this context, the basic objective is to supply the energy for economic and social development in a continuous, quality and secure manner with the least costs in a competitive free market environment. For this purpose, Turkey attaches great importance and gives priority to realizing energy market reforms and harmonizing the national energy legislation fully with the EU energy acquis. In this context, fundamental sector specific laws were completed at a large extent and efforts for establishing a fully competitive energy market are continuing.
TEDAŞ, the public electricity distribution company, was restructured as 20 regional electricity distribution companies, and TEDAŞ signed contracts with these companies for the transfer of operating rights in their respective regions. Works are in progress for licensing and tariff approval for Kayseri ve Civarı Elektrik Dağıtım T.A.Ş., the only private sector electricity distribution company.
In the context of privatizing the public generation and distribution assets, a basic component of reform efforts, operating rights of Menderes EDAŞ region, one of 20 regional distribution companies, was transferred to the private sector and it was removed from the privatization programme on August 2008. Tenders of Başkent and Sakarya EDAŞ were completed as of July 2008, and sale of two companies were approved by Privatization High Council in September 2008; tenders of Meram and Aras EDAŞ were completed as of September 2008. Thereby, 15 distribution companies remained under the privatization portfolio. Electricity distribution privatizations will be continued in year 2009. A price equalization mechanism will be implemented until the end of 2012 in order to offset instant and high electricity price differences between regions after the privatizations.
On the production side, sales of 9 power plants having capacity of 140 MW, comprising of 7 small hydroelectric power plant, 1 geothermal power plant and 1 gas turbine were completed in September 2008 as asset sale for the gas turbine and transfer of operating rights for the others.
With the aim of expanding the use of natural gas across the country, the EMRA held natural gas city distribution tenders for 55 distribution regions so far and 52 winning companies were awarded gas distribution licenses. Of these, 49 distribution companies started investments in their regions, and 41 distribution companies started to supply gas in their regions. In this regard, the number of regions, in which investment was commenced by licensed companies, and the number of licensed companies increased by 4, and the number of regions using natural gas increased by 10 since the previous PEP.
Pursuant to the Law, as a result of tender held by the public natural gas company BOTAŞ to transfer natural gas imports to the private sector, the proposals from four companies were found appropriate regarding gas contract transfer for a total volume of 4 billion sm3. The company submitting the best price completed the required transfer transactions and commenced to import gas at an amount of 250 million sm3/year as of December 2007. Approval of the seller party is being expected for the company submitting the second appropriate offer and EMRA license and approval of the seller are required for the others. In addition, natural gas transmission network was started to be used by third parties for the first time as of July 2007.
A draft bill, was prepared by the Ministry of Energy and Natural Resources – General Directorate of Petroleum Affairs, is expected to be enacted in the near future in order to ensure continuity in the petroleum market, prevent risks in case of crises or extraordinary circumstances, and keeping adequate amount of petroleum stock to perform our country obligations as required by international agreements, aligning the stock system with the EU legislation and establishing a more robust stock management.
Secondary legislation works are in progress pursuant to the Energy Efficiency Law No. 5627 which aims to provide such multiple benefits as utilizing energy and energy resources rationally,

Structural Reforms
87
benefiting the national economy by realizing the energy saving potential, reducing environmental pollution from energy use, and creating new jobs. Within this context, secondary regulations were developed in order to enhance energy efficiency in transportation and industry. Preparation studies for secondary regulations regarding principles and procedures concerning energy performance in buildings and assignment of energy administrator in the schools affiliated to the Ministry of National Education is continuing. Furthermore, with the Prime Ministry Circular issued in 2008, measures were taken in public institutions and organizations in order to use energy in an efficient and effective way. With this Circular, “National Energy Efficiency Movement” has been commenced and year 2008 has been declared as “Energy Efficiency Year”.
Law on Installation and Operation of Nuclear Power Plants and Energy Sales was published in November 2007. By this law, investment environment required for installation and operation of nuclear power plants by private sector has been created and various incentives for this purpose have been given. According to this, TETAŞ will sign purchase contract up to 15 years for electricity to be produced in the plant. TETAŞ has arranged a contest in March 2008 in order to receive bids in September 2008 for establishing a nuclear power plant having an installed capacity of 5000 (4000 +/- 25 percent) MWe in Mersin–Akkuyu. Only one bid was submitted to the contest and bid evaluation process is still in progress.
In order to prevent short–term electricity supply deficit envisaged by the projections and to provide long–term supply security, the Law No. 5784 on Amending Electricity Market Law and Various Laws entered into force in July 2008. Duties and responsibilities of relevant institutions and organizations are clarified by this Law in terms of monitoring, assessing and ensuring the security of energy supply.
By the Law No. 5784, the creation of capacity mechanisms to ensure supply security is enabled and in this regard procurement of energy via a central contest is made possible. As a last resort, the public sector is allowed to make generation investment. The final decision maker for all these options is the Council of Ministers.
A cost-based pricing mechanism in retail sales prices for electricity entered into force in 1 August 2008. By this mechanism, it is foreseen to update the retail sales prices every 4 months in the light of changes in inflation and exchange rates and the prices of inputs such as coal and natural gas whose prices are also subject to automatic cost-based updates.
Projects towards Turkey's physical integration with the EU electricity and gas markets are continuing. Works are continuing for the Turkey-Bulgaria-Romania-Hungary-Austria Natural Gas Pipeline (Nabucco Project), which is planned to be commenced in 2012. Upon the implementation of these projects, Turkey will become a new route in gas supply to the EU. On the other hand, works for the interconnection between Turkey’s electricity grid and the UCTE (Union for the Coordination of Transmission of Electricity), which would allow synchronous operation between two systems, are in the final phase and test studies is expected to be commenced in 2009.
Three separate projects are in progress with the EU within the context of reforms in the energy sector;
1. Raising Public Awareness on Efficient Use of Energy in Buildings Project which was commenced on 14 January 2008 and supported under the EU 2005 Financial Cooperation Programming aims to raise public awareness on efficient use of energy in buildings. The total budget of the project is 1.07 million Euros, of this amount 1.04 million Euros come from EU and 30,000 Euros from the national resources.
2. The Project for Adapting the Operation Conditions for Cross-border Electricity Trade in Turkey to the Best Practices in EU is being carried out by TEİAŞ under the 2006 Financial Cooperation Programming in order to make the technical infrastructure suitable for cross-border trade to integrate the Turkish electricity system with the European electricity system, and create the required legal infrastructure.

Structural Reforms
88
3. Technical Assistance Project for Rehabilitation of the Frequency Control Performance of Turkish Power System for Synchronous Operation with UCTE which has been proposed by TEİAŞ to ensure integration of Turkish electricity system with European electricity system and approved by European Commission is in the contract signing phase. 2.5 million Euros of EU contribution is foreseen for the project.
Table 4. 14: Legislative Acts for Energy Market in 2008 Date Number Name Description
Electricity
21/11/2007 Official Gazette No. 26707
Law No. 5710 on Installation and Operation of Nuclear Power Plants and Energy Sales
This Law lays down the procedures and principles for the installation and operation of nuclear power plants and energy sales.
26/07/2008 Official Gazette No. 26948
Law No. 5784 on Amending Electricity Market Law and Various Laws
Articles have been added in order to strengthen the Law No. 4628 on Electricity Market in terms of supply security.
Energy Efficiency
14/04/2008 Official Gazette No. 26847
Regulation on Sharing of Heating and Sanitary Hot Water Costs in Central Heating and Sanitary Hot Water Systems
It lays down the procedures and principles for allocating the heating and sanitary hot water costs to the users of separate sections in the old and new buildings having multiple separate sections with central or district heating systems.
09/06/2008 Official Gazette No. 26901
Regulation on Procedures and Principles to Increase the Energy Efficiency in Transportation
In order to increase energy efficiency in transportation; it contains procedures and principles to establish systems increasing traffic stream, popularizing public transportation, increasing efficiency standards in vehicles and decreasing fuel consumption of motor vehicles.
08/10/2008 Official Gazette No. 26667
Regulation on Amending the Regulation on Implementation Principles of Introductory and Usage Guides
For the energy consuming goods, it is envisaged that information regarding the use of goods in an energy-efficient manner will be included in a separate section of usage guide.
25/10/2008 Official Gazette No. 27035
Regulation on Increasing the Efficiency in the Use of Energy Resources and Energy.
It lays down the procedures and principles for increasing the efficiency in the use of energy and energy resources in order to use energy effectively, prevent waste of energy, reduce burden of energy costs on economy and protect environment.
05/12/2008 Official Gazette No. 27075
Regulation on Energy Performance of Buildings
It aims to set the energy performance criteria and its applicability in the buildings, energy performance calculation methodology, to classify the buildings in terms of primary energy use and CO2 emission, to evaluate the applicability of renewable energy resources.
Natural Gas
12/07/2008 Official Gazette No. 26550
Law on Amending the Natural Gas Market Law
It concerns the transfer of all infrastructure facilities and assets concerning city distribution of natural gas under the possession and/or operation of the General Directorate of EGO a body of Ankara Metropolitan Municipality.
Petroleum
14/10/2008 Official Gazette No. 27024
Regulation on Petroleum Market Pricing System
This regulation lays down the procedures and principles about setting and applying prices of various goods and services concerning market activities in order to ensure transparency, equitibility and stability in supplying goods and services to the users safely and economically in a competitive environment, and on announcing such prices to stakeholders and public.
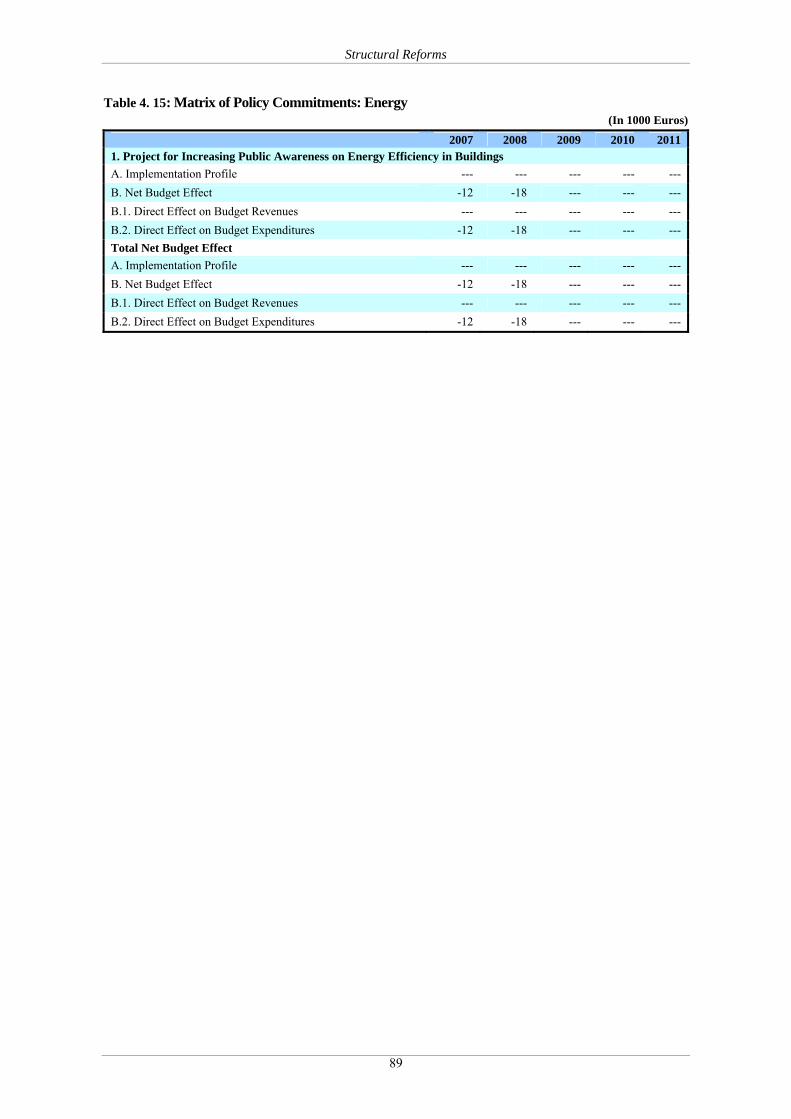
Structural Reforms
89
Table 4. 15: Matrix of Policy Commitments: Energy (In 1000 Euros)
2007 2008 2009 2010 2011 1. Project for Increasing Public Awareness on Energy Efficiency in Buildings A. Implementation Profile --- --- --- --- --- B. Net Budget Effect -12 -18 --- --- --- B.1. Direct Effect on Budget Revenues --- --- --- --- --- B.2. Direct Effect on Budget Expenditures -12 -18 --- --- --- Total Net Budget Effect A. Implementation Profile --- --- --- --- --- B. Net Budget Effect -12 -18 --- --- --- B.1. Direct Effect on Budget Revenues --- --- --- --- --- B.2. Direct Effect on Budget Expenditures -12 -18 --- --- ---

Structural Reforms
90

Annex Tables
91
ANNEX TABLES
ANNEX TABLES

Annex Tables
92

Annex Tables
93
Table 1.a: Macroeconomic Prospects
ESA Code 2007 2007 2008 2009 2010 2011
Level (Mil. TL) Rate of Change
1. Real GDP, at 1998 prices B 1 * g 101,255 4.7 1.1 -3.6 3.3 4.5
2. GDP, at current prices B 1 * g 843,178 11.2 12.7 1.7 8.4 9.2
Components of Real GDP (1998 Prices, Percentage Change)
3. Private Consumption Expenditure P3 69,844 4.6 0.3 -3.1 3.0 4.3
4. Public Consumption Expenditure P3 10,127 6.5 1.8 3.1 1.6 2.8
5. Gross Fixed Capital Formation P51 25,942 5.4 -4.6 -13.3 6.2 8.56. Changes in Inventories and Net Acquisition of
Valuables* P52+P53 -110 0.7 0.3 -0.2 0.0 0.3
7. Exports of Goods and Services P6 25,275 7.3 2.6 -10.9 6.9 6.7
8. Imports of Goods and Services P7 29,933 10.7 -3.1 -15.5 7.9 9.8
Contribution to Real GDP Growth
9. Final Domestic Demand --- --- 5.2 -0.8 -5.0 3.6 5.110. Changes in Inventories and Net Acquisition of
Valuables P52+P53 --- 0.7 0.3 -0.2 0.0 0.3
11. External Balance on Goods and Services B11 --- -0.3 1.6 1.6 -0.3 -0.9* Contribution to growth.
Table 1.b: Price Developments
Percentage Changes, Annual Averages ESA Code 2007 2008 2009 2010 2011
1. GDP Deflator --- 6.2 11.5 5.5 5.0 4.52. CPI --- 8.4 9.6 7.1 6.5 5.6
Table 1.c: Labor Market Developments
ESA Code 2006 2006 2007 2008 2009 2010
Level Rate of Change, Percent 1. Employment, persons (Thousands)* --- 21,189 1.1 1.5 -1.8 1.0 1.52. Unemployment Rate (ILO Definition) --- 2,334 9.9 10.6 13.5 13.9 13.93. Labor Productivity, persons --- --- 3.5 -0.5 -1.8 2.2 2.94. Compensation of Employees --- --- --- --- --- --- ---
*+15 years-old
Table 1.d: Balance of Payments
Percentages of GDP ESA Code 2007 2008 2009 2010 2011
1. Current Account --- -5.9 -5.7 -1.9 -3.0 -4.0 - Balance of Goods --- -7.2 -7.3 -3.6 -4.4 -5.7 - Balance of Services --- 2.1 2.4 2.8 2.7 2.9 - Balance of Incomes --- -1.1 -1.1 -1.4 -1.7 -1.6 - Balance of Current Transfer --- 0.3 0.3 0.4 0.4 0.4
2. Capital and Financial Account (Including Reserves) --- 5.6 5.1 1.9 3.0 4.0 - Private Sector --- --- --- --- --- --- - Public Sector --- --- --- --- --- ---
Statistical Discrepancy --- 0.2 0.6 0.0 0.0 0.0

Annex Tables
94
Table 2: General Government Budgetary Prospects Percentages of GDP ESA 2007 2008 2009 2010 2011
Net Lending(B9) by sub-sectors* 1. General Government S13 0.2 1.5 4.6 3.2 2.82. Central Government S1311 -1.9 -0.6 2.1 0.7 0.43. Funds S1311 -0.8 -0.5 -0.4 -0.3 -0.44. Local Administration S1313 0.9 0.9 0.5 0.4 0.35. Social Security Fund S1314 3.0 2.7 3.2 3.3 3.56. Revolving Funds S1311 -0.3 -0.3 -0.3 -0.3 -0.37. Unemployment Fund --- -0.8 -0.8 -0.5 -0.6 -0.7
General Government (S13) 8. Total Receipts TR 33.6 32.8 33.6 34.2 33.99. Total Expenditures TE 33.8 34.2 38.2 37.4 36.710. Net Lending EDP.B9 0.2 1.5 4.6 3.2 2.8
11. Interest Payments EDP. D41+FISIM 5.9 5.6 6.2 5.8 5.4
12. Primary Balance --- 5.7 4.1 1.7 2.6 2.6Components of Revenues
13. Taxes (13 a+13 b + 13 c) --- 18.6 18.1 18.0 18.8 18.614. Social Funds D61 5.7 6.5 7.1 7.2 7.215. Factor Incomes D4 5.8 5.5 5.4 5.2 5.216. Other --- 3.5 2.7 3.1 3.0 2.817. Total Receipts TR 33.6 32.8 33.6 34.2 33.9
Components of Expenditures 18. Total Consumption P32 15.0 15.5 16.4 16.2 16.019. Total Social Transfers D62+D63 4.3 4.1 6.0 6.2 6.3
20. Interest Payments EDP. D41+FISIM 5.9 5.6 6.2 5.8 5.4
21. Subsidies(1) D3 0.8 0.8 0.8 0.7 0.722. Gross Fixed Capital Formation P51 3.2 3.3 2.8 2.8 2.723. Other --- 4.6 4.9 6.0 5.7 5.624. Total Expenditures TE 33.8 34.2 38.2 37.4 36.7
*(+) refers to deficit, (-) refers to surplus. (1) Includes agricultural support, duty losses of SEEs and Support and Price Stability Fund. Table. 3: General Government Debt Developments
Percentage of GDP ESA Code 2007 2008 2009 2010 2011
1. Gross Debt --- --- 39.5 43.1 44.1 43.42. Change in Gross Debt --- --- --- 3.6 1.0 -0.7
Contributions to Change in Gross Debt
3. Primary Balance --- --- --- -1.7 -2.6 -2.64. Interest Expenditure EDP D.41 --- --- 6.3 5.8 5.45. Current GDP Growth --- --- --- -0.7 -3.4 -3.76. Other --- --- --- -0.3 1.2 0.2

Annex Tables
95
Table 4: Cyclical Developments*
2007 2008 2009 2010 2011
1. Real GDP Growth (1987 Prices) 4.7 1.1 -3.6 3.3 4.5 2. Net Lending of General Government 1.6 1.8 5.0 3.7 3.5 3. Interest Expenditure 5.1 4.8 5.7 5.2 4.8 4. Potential GDP Growth 5.4 5.1 3.0 2.8 2.9
Contributions: - Labor 8.6 19.4 6.6 9.4 8.6 - Capital Stock 55.1 48.4 57.6 65.1 55.1 - Total Factor Productivity 36.3 32.2 35.8 25.5 36.35. Output Gap (percentage difference from the potential) 0.6 -3.3 -9.5 -9.0 -7.66. Cyclical Budget Component** -0.2 1.2 4.0 3.8 3.27. Cyclically Adjusted Balance** 2.0 0.6 1.0 0.0 0.38. Cyclically Adjusted Primary Balance** -4.2 -5.0 -4.8 -5.4 -4.7
*Consolidated/Central Government budget ** (+) refers to deficit, (-) refers to surplus.
Table 5: Divergence From Previous Update 2007 2008 2009 2010 2011 GDP Growth (Percent)
Previous Update 5.0 5.5 5.7 5.7 --- Latest Update 4.7 1.1 -3.6 3.3 4.5 Difference* -0.3 -4.4 -9.3 -2.4 --- General Government Net Lending (Percentage of GDP) Previous Update 0.0 0.0 -0.7 -1.0 --- Latest Update 0.2 1.5 4.6 3.2 4.8 Difference 0.2 1.5 5.3 4.2 --- General Government Gross Debt (Percentage of GDP) Previous Update 56.8 52.5 49.6 45.6 --- Latest Update (ESA Definition) --- 39.5 43.1 44.1 43.4 Difference --- -13.0 -6.5 -1.5 ---
* Forecasts in the 2007 PEP are not comparable with the realizations and forecasts provided in the 2008 PEP since they were made by using the old national accounts data.
Table 6: Basic Assumptions on the External Economic Environment Underlying the PEP 2007 Framework*
2007 2008 2009 2010 2011 Exchange Rates Parity (USD/ €) 1.37 1.48 1.30 1.30 1.30 Real Exchange Rate (Percentage Change) 5.6 6.1 -12.5 2.0 2.4 GDP Growth Euro Area (Real, Percentage Change) 2.6 0.7 -4.1 -0.3 1.5 World Trade (In Real Terms) World Import Volume Increase (Percent) 7.2 2.5 -13.2 1.5 --- International Prices EU CPI (Percentage Change) 2.4 3.3 0.6 0.7 1.5 US CPI (Percentage Change) 2.8 3.8 -0.4 0.5 0.7 Oil Prices (USD per Barrel) 68.1 97.1 50.0 60.0 65.0
*EUROSTAT and OECD

Annex Tables
96
Table. 7: Structural Reform Agenda and Developments
Measures in Previous PEP Realization
Status (Y/N)
Date19 Comments
Privatization
Initiation of the privatization process for electricity distribution companies Y 2008
Privatization procedures of Başkent, Sakarya, Meram and Aras Electricity Distribution Companies was initiated and tender stages have been finalized
Initiation of the privatization process for lottery games Y 2008
Works on necessary legal infrastructure regarding license transfer of games of chance were completed and tender was announced
Initiation of the tender process for the privatization of Bandırma and Samsun ports of TCDD
Y 2008 The tender processes for the ports of Bandırma and Samsun were completed and are at contract approval stage
Initiation of the tender process for the privatization of İskenderun ports of TCDD
N --- The tender on 9 September 2005 for the privatization of İskenderun Port was cancelled by the Council of State
Initiation of the tender process for the privatization of Çamaltı and Ayvalık saltpans of TEKEL
Y 2008 The tender was announced for Ayvalık saltpan and the process has been completed.
Privatization of Sugar Factories Inc. N ---
As Privatization High Council Decision issued on including TŞFAŞ in privatization portfolio in 2007 was cancelled by the Council of State, Turkish Sugar Factories Co. (TŞFAŞ) has been re-included in the privatization program in 2008
Competition Law and Policies
Amendments to the Act No. 4054 on the Protection of Competition in order to increase the enforcement efficiency and to harmonize with the current legislation in the form of Regulation and Notice in EU
N 2008 The Bill was sent to Turkish Grand National Assembly. It is expected to be enacted in 2008.
Works aimed at the creation of a functionally independent state aids monitoring and supervising unit
N 2009
The Draft Bill prepared in order enable monitoring and supervision of the state aids in Turkey in line with the EU criteria, is expected to be enacted in 2009.
Improvement of the Investment Environment
The Draft Bill on Amending the Law on Work Permits for Foreigners and some other laws
N 2009
Work permits process of foreigners; especially to work in the scope of vocational services and national and international projects, is aimed to be shortened.
The Draft Bill on Amending the Law on Land Registry Y 2008
Legislative act that amended the provisions of the Land Registry Law No.5782 regarding property acquisition by foreigners came into effect on 7 January 2006. However, it was cancelled by the constitutional court on 16 January 2008. New arrangement which took into consideration the grounds for cancellation came into effect on 15 July 2008.
Turkish Commercial Law N 2009 The draft Turkish Commercial Law, which is on the agenda of the TBMM, is expected to be enacted in 2009.
19 The date or foreseen date of realization.

Annex Tables
97
The Coastal Act N 2009
The Draft Bill Amending the Coastal Act prepared by Ministry of Public Works and Settlement was submitted to the Prime Ministry in May 2006. The Ministry’s evaluation process of the opinions obtained by the Prime Ministry has been continuing.
Financial Sector
Privatization of public banks N --- In light of the Halkbank experience, a privatization strategy will be formulated for Ziraat Bank.
Completion of the establishment of a company to lay down the organization and infrastructure of an organized market where capital market instruments issued by SMEs will be traded and commencement of operations in the market in 2005
N 2009
Establishment of the company Emerging Enterprises Market (EEM) which will lay down and develop the trade platform, where buying and selling will take place, and the related necessary organization is completed by the end of 2005. On the other hand, the work done on EEM is being revising after the idea that the market for the equities of SMEs can be established under ISE came into the agenda. It is concluded that alternative models can be discussed to make SMEs’ equities to trade under ISE. The protocol between EEM and ISE is affirmed in general share holders’ meeting of EEM on 19.08.2008 that the project on SMEs market is going to continue under ISE. The drafts on the legislation prepared by ISE is submitted to CMB and the market is expected to function in 2009.
Enhancing the structure on custody and clearing transactions N 2009
Following the amendments planned to be done in the Capital Markets Law about the institutions of custody and clearing, it is planned to make the main legislation on these institutions about their organizations and activities, to make sure that the main principles of the current custody system is included in the legislation and to make necessary changes in these principles.
Capital markets compliance with the Community acquis dealing with the intermediary institutions’ capital adequacy following the acceptance of Basel II criteria by EU
N 2009-2011
The drafts on Compliance with the EU acquis on capital adequacy are prepared during the Twinning Project. However, the EU regulation framework on this issue is closely related to the banking sector. Therefore, the works by CMB will be finalized in parallel to the agenda of the amendment to the banking legislation.
Establishing specialty courts for capital markets N --- No progress was made due to the need for
coordinated work with other institutions.
Dematerialization of Government Domestic Borrowing Instruments (GDBI) at the Central Registry Agency (CRA) and custody and monitor on customer basis
N 2009
Within the project, principles of final sale and purchase transactions of GDBIs are set. Integration of repo reverse repo transactions in which GDBIs are subject, into registered system is being evaluated and within this context last stage is reached about determination of the process about dematerialization of GDBIs. On the other hand, progress is not possible in the project until CMB’s proposed law amendment about seizure in dematerialized system becomes effective, and the relevant Ministry of State and Ministry in charge of Treasury is informed about this issue.
Labor Market
Privatisation Social Support Project II Y 2007-2009
Privatization Social Support Project II is continuing as the implementations of privatization continue.

Annex Tables
98
Agriculture
Issuance of the Law on food, feed, food hygiene and veterinary services N 2009
Technical studies related to draft law prepared for regulation of public services in the area of food, feed, food hygiene and veterinary services will be finalized after assessing the draft text regarding the subjects of complementary implementation of the abovementioned services, and providing clear division of responsibilities between central and local authorities and within the competent authority.
Privatization of sugar factories N 2009 The preparation for privatization of all public sugar factories will continue until the end of 2009
Issuance of the Law on the establishment and duties of the Ministry of Agriculture and Rural Affairs
N 2009
The studies for Law on the establishment and duties of the Ministry of Agriculture and Rural Affairs which aim to increase the institutional capacity of public sector in the process of structural transformation will be completed by taking into account functional organization required for providing especially plant health, veterinary and food safety services together as envisaged in EU acquis, agricultural research-development and extension in an integrated way and establishing of policy development capacity in soil conservation and land usage
Administrative Reform
The Strategic Planning and Performance Programme Y 2006-
2009
Within the transition program determined in the By-Law on the Procedures and Principles of Strategic Planning in Public Administrations, as of December 2008, out of 104 central public administrations which are under the obligation of preparation of strategic plans and performance programmes, 96 have prepared strategic plans and 76 have prepared performance programmes. Within the budget preparation process for 2010, performance programmes in a total of 145 central administrations will be prepared in 2009.
Regional Development
The Decision of the Council of Ministers on the Establishment of Development Agencies in certain NUTS II Regions *
Y 2008
In addition to the development agencies established in 2006 in TR62 and TR31 NUTS II regions, development agencies in TRB2, TR10, TR52, TR83, TRA1, TRC1, TRC2 and TRC3 NUTS II regions have been established in 2008.
Regulation on the Working Principles and Procedures of Development Agencies
Y 2007
Provisions on structure and bodies of Development Agencies, duties and authorities of these bodies, and the functioning of Development Agencies have been regulated.
Regulation on the Personnel Regime of Development Agencies Y 2007
Human resources policy, procedures for the personnel recruitment and other related provisions for personnel of Development Agencies have been regulated.
Regulation on the Budget and Accounting of Development Agencies Y 2007
Authorities and responsibilities of the personnel who will serve in the budget and accounting system of Development Agencies, preparation and implementation process of the budget of Development Agencies and the provisions for accounting system of Development Agencies have been regulated.
Regulation on the Support to Projects and Activities by the Development Agencies
Y 2008 Procedures and principals of actions and processes regarding project and activity supports by the development agencies and the principals and rules

Annex Tables
99
of benefiting from these supports have been regulated.
Auditing Regulation of Development Agencies N 2008
Within the framework of procedures and principals which will be determined collectively by the Ministry of Interior, Ministry of Finance and State Planning Organization, provisions on the inspection of all kinds of accounts and transactions of Development Agencies by independent auditing institutions which have been set up according to the legislation of Capital Markets Board have been regulated.
Health and Social Security Reform
Nationwide extension of pilot implementation of Family Medicine Y 2012
Pilot implementation of Family Medicine has been extended to 26 provinces at the end of 2008. Nationwide extension of the service by 2012, is targeted.
Establishment of health information system Y 2008
National Health Data Dictionary has been prepared. Minimum Health Data Set has been defined, published and its usage has been made more widespread. Pilot implementations of Tele-medicine and Hospital Appointment and Referral Integration System projects have started
Merger of social security institutions under a single organization, separation of the long-term and short-term insurance branches and establishment of universal health insurance
Y 2005-2008
Social Insurances and Universal Health Insurance Law No.5510 was scheduled to become effective on 1 January 2007, however the Constitutional Court has canceled some of the provisions of the Law with its 15 December 2006 dated decision. The Law Amending Social Insurances and Universal Health Insurance Law and on Certain Laws and Decree Laws No.5754 has been published on 08/05/2008 dated No.26870 Official Gazette and has became effective on 1 October 2008
Establishment of an effective IT infrastructure with the social security reform
N 2006-2009
Works related to building of an effective, accessible, and sustainable structure in social insurance system by establishing a fully computerized IT infrastructure are underway
Information and Communication Technologies
Electronic Communications Law Y 2008 The Law was put into force after it was published on the Official Gazette No. 27050 dated 10 November 2008.
Law on Protection of Personal Data N 2008 The Draft Law has been sent to the TGNA on 22 April 2008. It is at the Justice Commission of the Assembly at present.
By-law on Electronic Communications Security Y 2008
The By-law was put into force after it was published on the Official Gazette No. 26942, dated 20 July 2008.
By-law on Fixed Telephone Services Amending the By-law on Authorization of Telecommunications Services and Infrastructures
Y 2008 It was published in Official Gazette No. 27060, dated 20 November 2008 and came into force.
Amendment on the By-Law on the Authorization in Electronic Communications Sector
N 2008 Efforts on harmonization with the Authorization Directive No. 2002/20/EC are continuing.
By-law on Processing of Personal Data and Protection of Privacy in the Telecommunications Sector
N 2008 Works are continuing to conform to the Directive 2002/58/EC concerning the processing of the personal data and protection of privacy in the electronic communications sector and the

Annex Tables
100
Directive 2006/24/EC on the retention of data generated or processed in connection with the provision of publicly available electronic communications services or of public communications network.
Energy
Continuation of the privatization process for the electricity distribution companies
Y 2008
Operation rights of Menderes EDAŞ have been transferred, sale of Başkent and Sakarya EDAŞ has been approved by Privatization High Council, tender auction for Meram and Aras EDAŞ has been held.
Efforts about privatizations in electricity sector N 2004-
2009
Privatization of 7 small hydroelectric plants, 1 geothermal plant and 1 gas tribune under the body of Ankara Natural Electricity Generation and Distribution Company Inc. (ADÜAŞ), comprising a sum of 140MW power, has been completed. Works towards privatization of portfolio production groups, single privatization of some plants and determination of privatization method of production are underway. Privatizations will continue in distribution.
Regulatory Board Information System Project N 2004 - ...
The project, which has started in November 2005, was suspended unilaterally by EDYN, due to different interpretation of contract at the analysis stage by the contractor firm EDYN. The project will be handled by EMRA with its own resources.
Project for Increasing Energy Efficiency in Turkey Y 2005-
2007
In the context of harmonization with Community acquis and EU experiences, the project aiming implementation of energy efficiency programs to improve national energy efficiency performance, which is totally financed under the Financial Ccooperation Programs, has been completed in November 2007.
Development of Functioning Conditions of Cross-Border Electricity Trade of Turkey in line with the Best Practices in EU
N 2006-2009
The twinning project, aiming to make the technical infrastructure suitable for cross-border trade and to establish relevant legal framework in order to integrate the Turkish electricity system with the EU electricity system, is planned to be completed in the first half of 2009
Establishing security of supply in electricity and natural gas N 2007-
2009
Establishment of legal framework to sustain and improve the permanence of supply in energy markets has become more important in a deregulated environment.
In this context, to strengthen the Electricity Market Law No.4628 in terms of security of supply, new regulations have been put into life with the Law No.5784. Works towards increasing security of natural gas supply have been continuing
Institutional separation of regulatory and supervisory functions in nuclear energy area
N 2007-2009
Regulatory and supervisory functions about nuclear energy issues will be performed by a new authority to be created, TAEK will retain the research, technology development and implementation roles
* The activities of the agencies have been suspended due to the action for nullity of the Law numbered 5449 in 2007. However, the legal obstacles on the operation of current agencies and establishment of new agencies have been removed in the light of the judgment resulted in February 2008.