requirements for industrial cabling supporting … for industrial cabling supporting gigabit...
TRANSCRIPT

Requirements for Industrial Cabling Supporting Gigabit Applications for ControlA Study of Noise
Bob LounsburyPrincipal EngineerRockwell Automation
October 14, 2015
Abstract
2
This paper is the result of over 700 man hours of cable measurements, noise testing and analysis resulting in defining cabling parameters supporting 1Gig cabling requirements for harsh industrial environments.
In the early 2000 a study was performed by several ODVA member companies. The goal of this study was to define the requirements for 10/100mb/s twisted pair cabling for industrial environments. This eventually resulted in the creation of national and international standards defining parameters for cabling used on the factory floor and industrial machine areas. Once again with the need for additional bandwidth we find the need to define the parameters required to support of 1gig data rates on 4 pair industrial cabling.
This paper will discuss the approach used, the testing, analysis and the results of the study. The testing, is based on standardized transmission line testing techniques and environmental noise testing as defined by ISO/IEC and IEC 61000 standards. In addition this paper will discuss the impact of the new limits to the parameters from a technical perspective. Since industrial cabling is the subject to national and international standards this paper will briefly cover the approach to standardization, including the EtherNet/IP Specification. The paper will conclude with a complete set of cabling component specifications defining the communications channel supporting robust data communications for control applications.
Technical Track 2015 Industry Conference & 17th Annual Meeting www.odva.org
© 2015 ODVA, Inc. All rights reserved.

Purpose
3
The purpose of this project is to determine the required cable performance needed to support
1000 Base-TX for industrial control applications. This study and white paper does not consider
applications using office grade cabling in office (MICE 1) environments. This report documents
the tests, test results and conclusions of cable transmission and EMC testing. Both
unshielded and shielded cables were considered and evaluated. In the case of shielded cables
additional testing is performed to determine the shielding effectiveness since it is expected
that shielding has a positive impact on cable’s noise rejection.
The foundation of this project is based on examining the performance of off-the-shelf cables
and engineering samples designed for both office and industrial applications. The design of
the cabling targeted for Industrial applications must be carefully considered where the
environments are MICE - E 2 and MICE - E3.
Technical Track 2015 Industry Conference & 17th Annual Meeting www.odva.org
© 2015 ODVA, Inc. All rights reserved.

4
Background
• Ethernet and Fast Ethernet (10/100Mb/s) cabling study 1999/2000
– RL and TCL/ELTCTL was the focus
– 2006 Industrial Focused Standards recognized the need and applied specs to
cabling
– Driven by ODVA
• ISO/IEC 24702 and
• ANSI/TIA 1005 Was Created
– ISO/IEC specified TCL and ELTCTL in terms of MICE Classifications under “E”
Electromagnetic Noise.
– The TCL and ELTCTL values were not optimal for industrial cabling based on IEC
61000 Testing and limits.
Technical Track 2015 Industry Conference & 17th Annual Meeting www.odva.org
© 2015 ODVA, Inc. All rights reserved.

ISO/IEC 24702 -- ANSI TIA 1005 – IEC 61918
5Technical Track 2015 Industry Conference & 17th Annual Meeting www.odva.org
© 2015 ODVA, Inc. All rights reserved.
TCL for Class D and
Class E Channels
ELTCTL for Class D
and Class E Channels
6
• A presentation describing the test methods and results has been circulated
to the EtherNet/IP Physical Layer SIG, TIA TR42.9, ISO/IEC and IEC.
– Described what was tested (30 cables 12 UTP and 18 Screened)
– Mixture of solid and stranded designs UTP(4 stranded/8 solid), Screened (13
Stranded/5 Solid).
– Tests Performed
– Methods for how the cables were tested
– Results of the Tests
– Results, Channel Recommendations for TCL and ELTCTL
Technical Track 2015 Industry Conference & 17th Annual Meeting www.odva.org
© 2015 ODVA, Inc. All rights reserved.
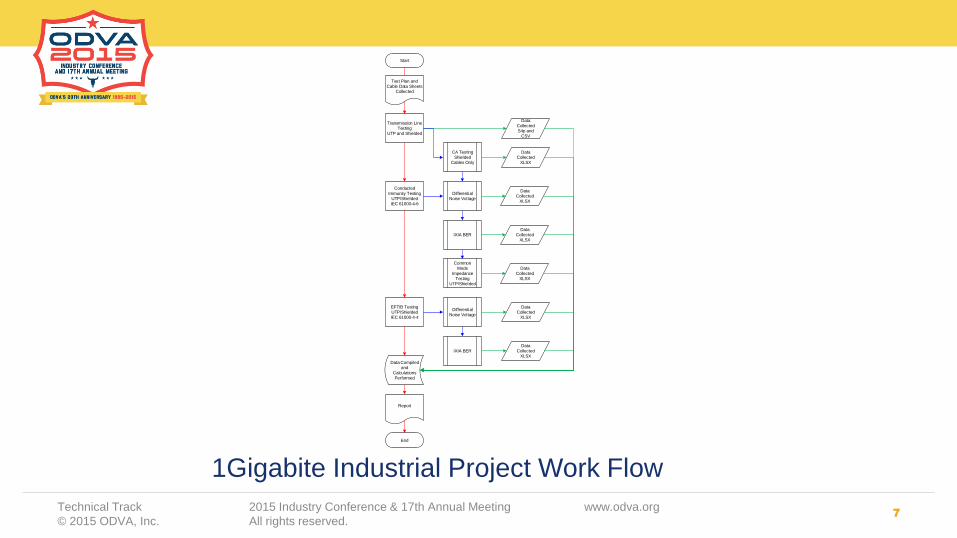
1Gigabite Industrial Project Work Flow
7Technical Track 2015 Industry Conference & 17th Annual Meeting www.odva.org
© 2015 ODVA, Inc. All rights reserved.
Transmission Line Testing
UTP and Shielded
Data CollectedS4p and
CSV
Start
CA Testing Shielded
Cables Only
Conducted Immunity Testing
UTP/ShieldedIEC 61000-4-6
Common Mode
Impedance Testing
UTP/Shielded
Differential Noise Voltage
IXIA BER
EFT/B TestingUTP/ShieldedIEC 61000-4-4
Differential Noise Voltage
IXIA BER
Test Plan and Cable Data Sheets
Collected
Data Collected
XLSX
Data Collected
XLSX
Data Collected
XLSX
Data Collected
XLSX
Data Collected
XLSX
Data Collected
XLSX
Data Compiled and
Calculations Performed
Report
End
8
Automation
• All Cable Tests were Automated using HP VEE
– Data Collection was saved in S4P, CSV and XLSX formats
• Visual Basic was used for Data Import, Graphing
• Excel was Used for Trending
• Mathcad and Excel was Used for Calculations
Technical Track 2015 Industry Conference & 17th Annual Meeting www.odva.org
© 2015 ODVA, Inc. All rights reserved.

Insertion Loss of Samples Stranded and SolidSdd21Cable(PR1, PR2, PR3, PR4)-‘Sdd21(Fixture)
The maximum IL for any of the 4 pairs was used. The fixture IL was removed
9Technical Track 2015 Industry Conference & 17th Annual Meeting www.odva.org
© 2015 ODVA, Inc. All rights reserved.
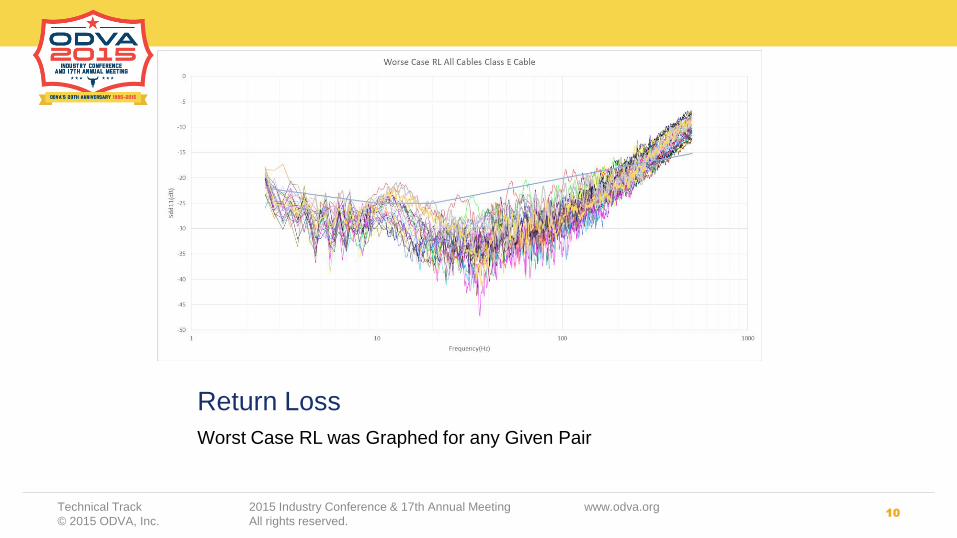
Return Loss
Worst Case RL was Graphed for any Given Pair
10Technical Track 2015 Industry Conference & 17th Annual Meeting www.odva.org
© 2015 ODVA, Inc. All rights reserved.

TCL Maximum UTP and Screened
SCD21Max(PR1, PR2, PR3, PR4)
11Technical Track 2015 Industry Conference & 17th Annual Meeting www.odva.org
© 2015 ODVA, Inc. All rights reserved.
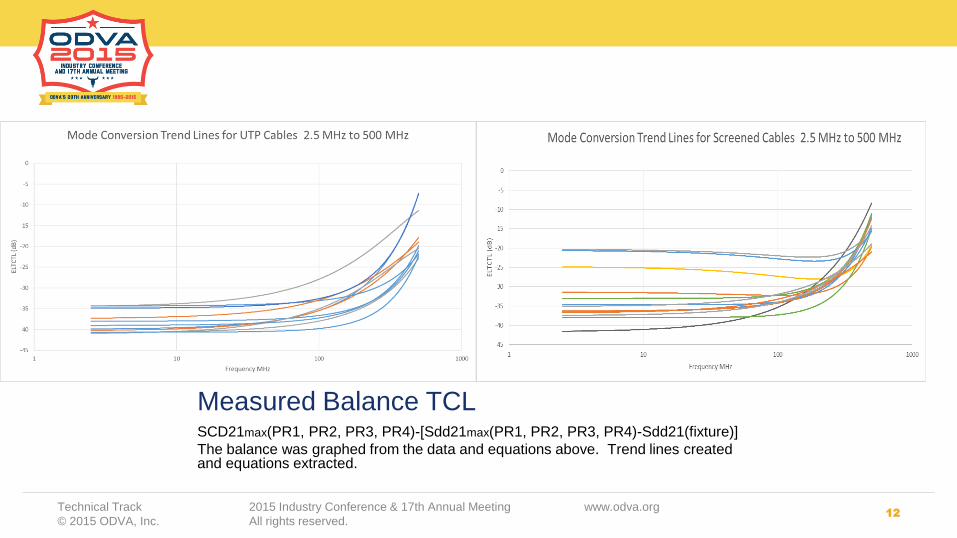
Measured Balance TCLSCD21max(PR1, PR2, PR3, PR4)-[Sdd21max(PR1, PR2, PR3, PR4)-Sdd21(fixture)]
The balance was graphed from the data and equations above. Trend lines created and equations extracted.
12Technical Track 2015 Industry Conference & 17th Annual Meeting www.odva.org
© 2015 ODVA, Inc. All rights reserved.
13
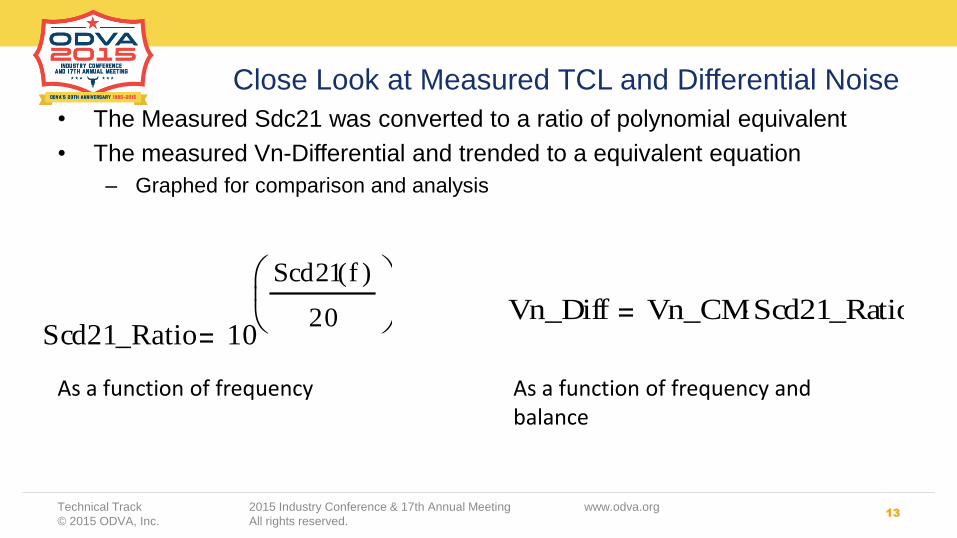
Close Look at Measured TCL and Differential Noise
• The Measured Sdc21 was converted to a ratio of polynomial equivalent
• The measured Vn-Differential and trended to a equivalent equation
– Graphed for comparison and analysis
Technical Track 2015 Industry Conference & 17th Annual Meeting www.odva.org
© 2015 ODVA, Inc. All rights reserved.
As a function of frequency and balance
As a function of frequency
Scd21_Ratio 10
Scd21 f( )
20
Vn_Diff Vn_CMScd21_Ratio
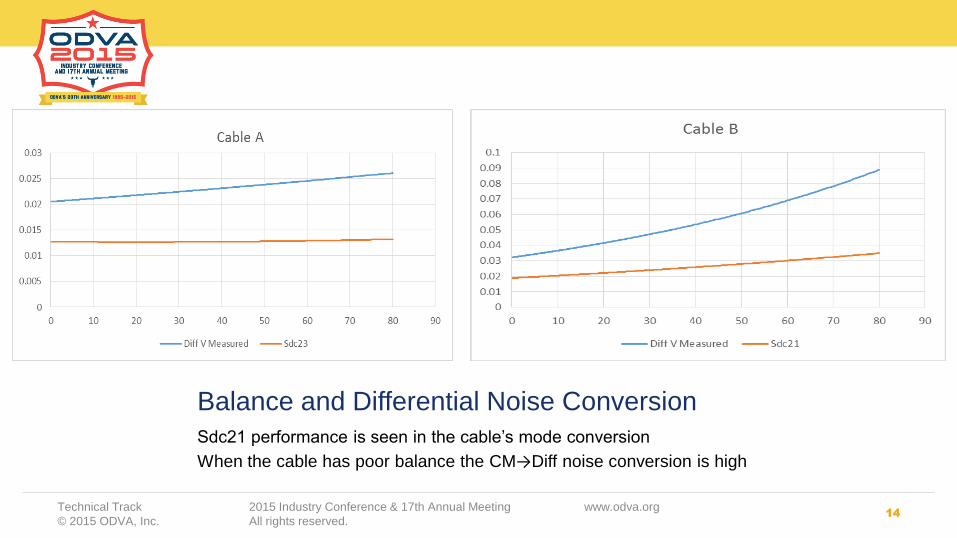
Balance and Differential Noise Conversion
Sdc21 performance is seen in the cable’s mode conversion
When the cable has poor balance the CM→Diff noise conversion is high
14Technical Track 2015 Industry Conference & 17th Annual Meeting www.odva.org
© 2015 ODVA, Inc. All rights reserved.

15
Conducted Immunity
• In accordance with IEC 61000-4-6
– Cable Test Fixture
• Controlled impedance to the GRP
• Low cross coupling
• PVC Cones Protect Bend Radius
Technical Track 2015 Industry Conference & 17th Annual Meeting www.odva.org
© 2015 ODVA, Inc. All rights reserved.
Capacitive Coupling Clamp or Injection Clamp
PVC Cones
10 CM
GRP
16
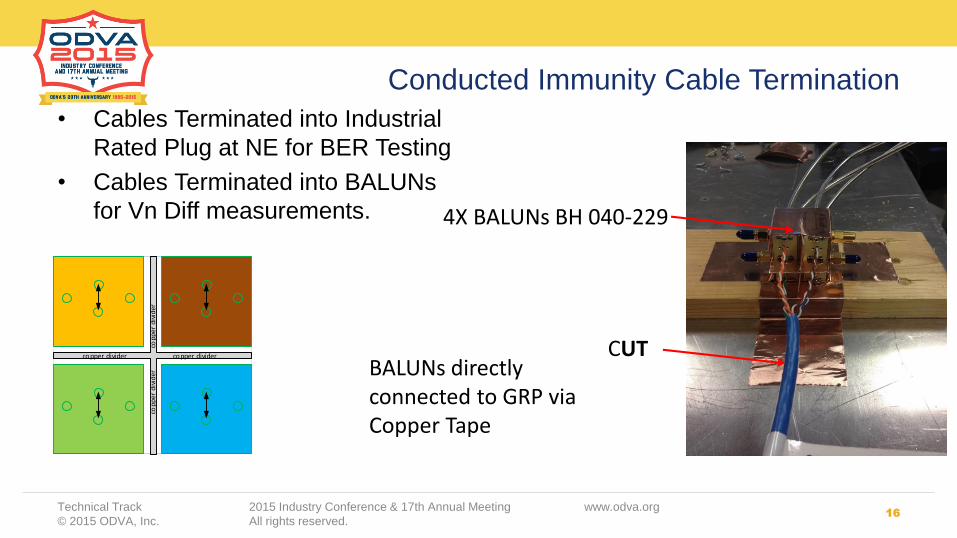
Conducted Immunity Cable Termination
• Cables Terminated into Industrial
Rated Plug at NE for BER Testing
• Cables Terminated into BALUNs
for Vn Diff measurements.
Technical Track 2015 Industry Conference & 17th Annual Meeting www.odva.org
© 2015 ODVA, Inc. All rights reserved.
BALUNs directly connected to GRP via Copper Tape
copper divider
copp
er d
ivid
erco
pp
er
div
ide
r
copper divider
4X BALUNs BH 040-229
CUT

17
Cable Termination FE
• Cables Terminated at CM and Diff
Impedance
Technical Track 2015 Industry Conference & 17th Annual Meeting www.odva.org
© 2015 ODVA, Inc. All rights reserved.
25 Ohm50 Ohm X 2
25 Ohm50 Ohm X 2
25 Ohm50 Ohm X 2
25 Ohm50 Ohm X 2
CUT
T Terminator
18
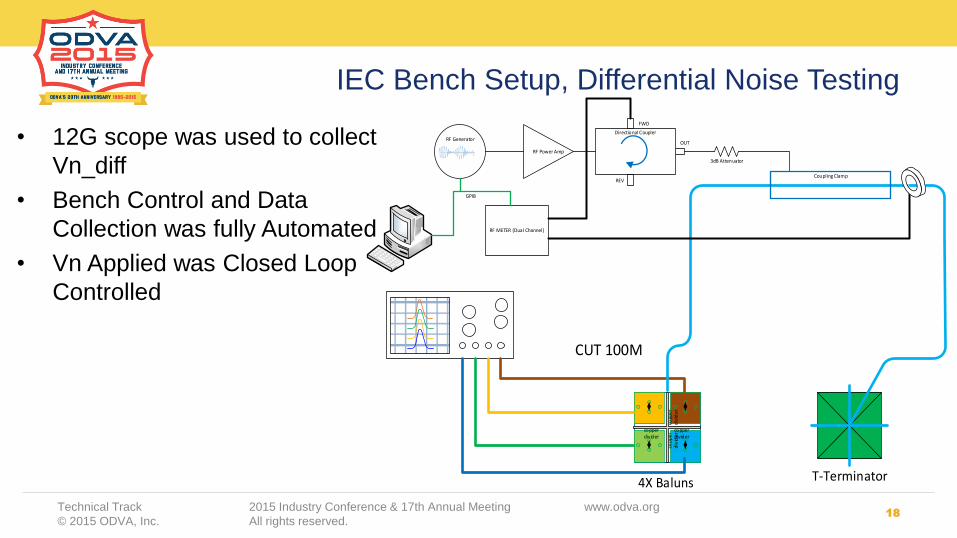
IEC Bench Setup, Differential Noise Testing
• 12G scope was used to collect
Vn_diff
• Bench Control and Data
Collection was fully Automated
• Vn Applied was Closed Loop
Controlled
Technical Track 2015 Industry Conference & 17th Annual Meeting www.odva.org
© 2015 ODVA, Inc. All rights reserved.
CUT 100M
T-Terminator
copper divider
cop
pe
r d
ivid
er
cop
pe
r d
ivid
er
copper divider
4X Baluns
RF Power Amp
Directional Coupler
3dB Attenuator
FWD
REV
OUTRF Generator
RF METER (Dual Channel)
Coupling Clamp
GPIB

19
IEC Bench Setup, BER Testing
• Ixia was Used for BER Statistics
• Bench Control and Data Collection
was Fully Automated
• Vn Applied was Closed Loop
Controlled
Technical Track 2015 Industry Conference & 17th Annual Meeting www.odva.org
© 2015 ODVA, Inc. All rights reserved.
RF Power Amp
Directional Coupler
3dB Attenuator
FWD
REV
OUT
RF METER (Dual Channel)
Coupling Clamp
GPIB
IXIAIndustrial
SwitchIndustrial
SwitchBATT 24V BATT 24V
RF Generator
Port 1 PBRS Bit ErrorsPort 2 PBRS Bit ErrorsPort 1 Error RatioPort 2 Error Ratio
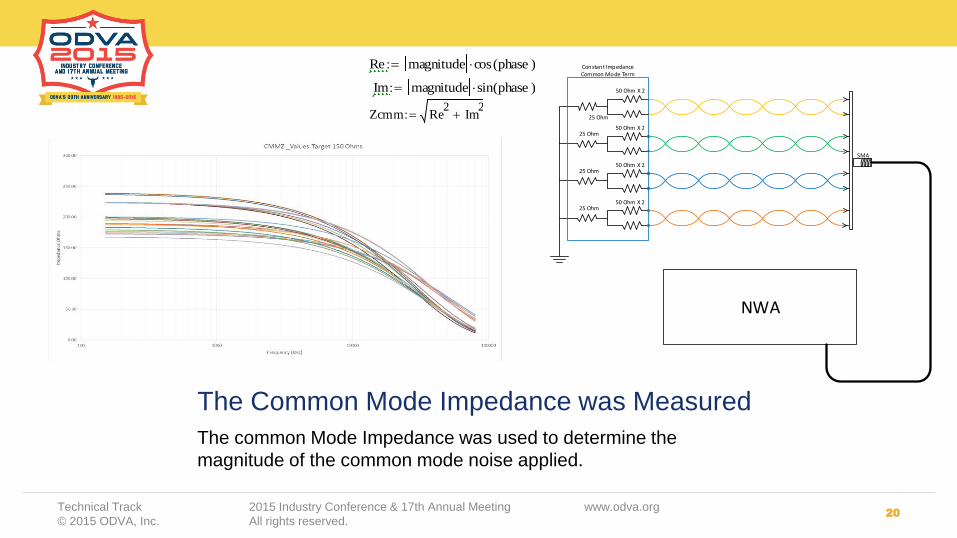
The Common Mode Impedance was Measured
The common Mode Impedance was used to determine the
magnitude of the common mode noise applied.
20Technical Track 2015 Industry Conference & 17th Annual Meeting www.odva.org
© 2015 ODVA, Inc. All rights reserved.
25 Ohm
50 Ohm X 2
25 Ohm50 Ohm X 2
25 Ohm50 Ohm X 2
25 Ohm50 Ohm X 2
SMA
NWA
Constant Impedance Common Mode Term
Re magnitude cos phase( )
Im magnitude sin phase( )
Zcmm Re2
Im2

21
Vn_CM Applied
• The Applied CM Noise Voltage is a function of the Probe CFs and the Common Mode Impedance Between the GRP and the Cable 10CM off the Bench.
Technical Track 2015 Industry Conference & 17th Annual Meeting www.odva.org
© 2015 ODVA, Inc. All rights reserved.
Vapplied 10
20 log ProbeVmv 1000 CF 120
20
Zcm
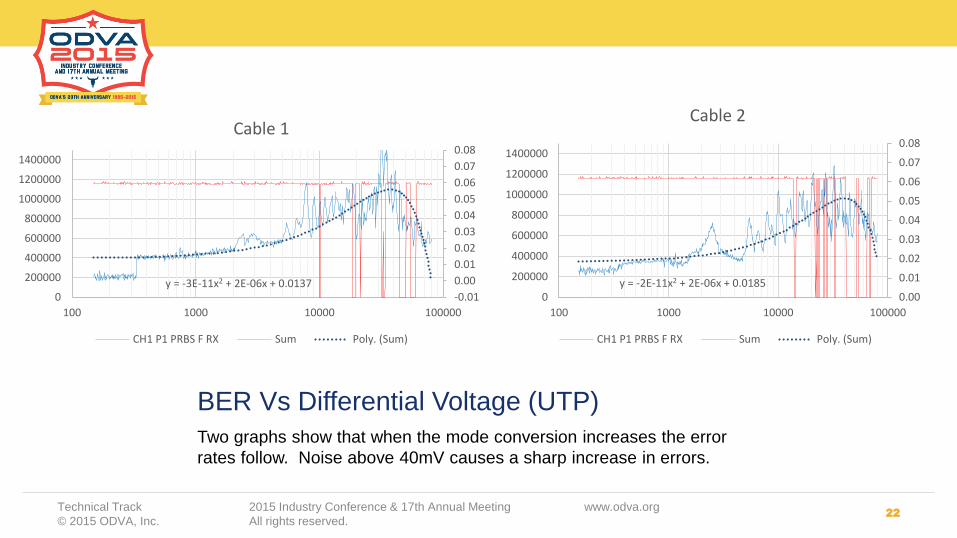
BER Vs Differential Voltage (UTP)
Two graphs show that when the mode conversion increases the error
rates follow. Noise above 40mV causes a sharp increase in errors.
22Technical Track 2015 Industry Conference & 17th Annual Meeting www.odva.org
© 2015 ODVA, Inc. All rights reserved.
y = -3E-11x2 + 2E-06x + 0.0137-0.01
0.00
0.01
0.02
0.03
0.04
0.05
0.06
0.07
0.08
0
200000
400000
600000
800000
1000000
1200000
1400000
100 1000 10000 100000
Cable 1
CH1 P1 PRBS F RX Sum Poly. (Sum)
y = -2E-11x2 + 2E-06x + 0.01850.00
0.01
0.02
0.03
0.04
0.05
0.06
0.07
0.08
0
200000
400000
600000
800000
1000000
1200000
1400000
100 1000 10000 100000
Cable 2
CH1 P1 PRBS F RX Sum Poly. (Sum)

BER and Mode Conversion Correlation
The UTP Cable Samples show a direct correlation between BER
and Vn Diff
23Technical Track 2015 Industry Conference & 17th Annual Meeting www.odva.org
© 2015 ODVA, Inc. All rights reserved.
y = -1E-11x2 + 8E-07x + 0.0214
0.00
0.01
0.02
0.03
0.04
0.05
0.06
0.07
0.08
0
200000
400000
600000
800000
1000000
1200000
1400000
100 1000 10000 100000
Cable 3
CH1 P1 PRBS F RX Sum Poly. (Sum)
0.00
0.01
0.02
0.03
0.04
0.05
0.06
0.07
0.08
0
200000
400000
600000
800000
1000000
1200000
1400000
100 1000 10000 100000
Cable 4
CH1 P1 PRBS F RX Sum Poly. (Sum)

Analysis of Vn Diff and EL Mode Conversion (UTP)Blue Trace Vn Differential
Red Trace TCL Conversion Ratio According to the Equation above
Traces show that there is a correlation between Cable balance and mode conversion in the cable.
24Technical Track 2015 Industry Conference & 17th Annual Meeting www.odva.org
© 2015 ODVA, Inc. All rights reserved.
y = 0.0171e0.1658x
y = 0.011e0.169x
0
0.005
0.01
0.015
0.02
0.025
0.03
0.035
0.04
0.045
0.05
0
0.005
0.01
0.015
0.02
0.025
0.03
0.035
0.04
0.045
0.05
0 1 2 3 4 5 6 7
Graph of Vdiff VS EXP(EL Mode Conv) out layers removed
Vdiff (mV) Exp (balance) Expon. (Vdiff (mV)) Expon. (Exp (balance))
Exp Balance( ) 10
BalancedB
20
Balance as
Measured Scd21
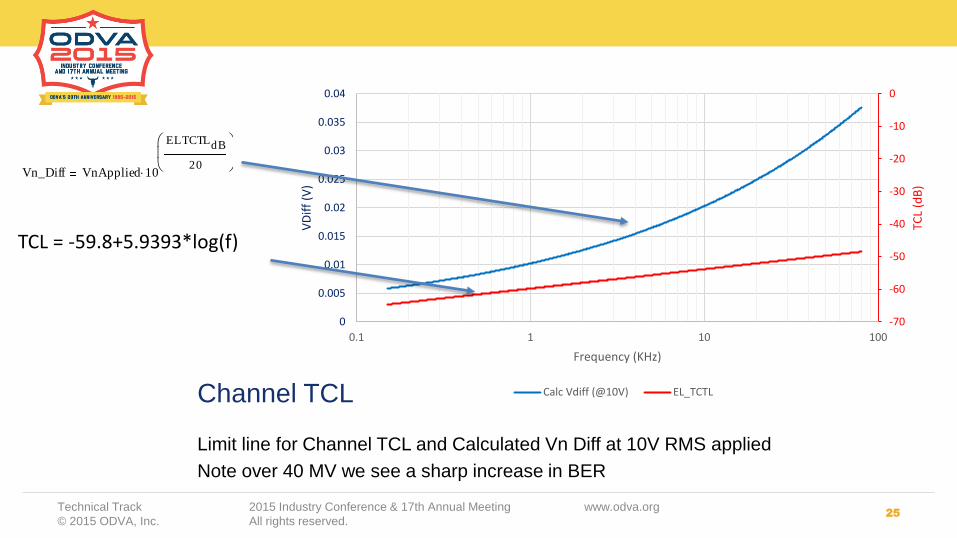
Channel TCL
Limit line for Channel TCL and Calculated Vn Diff at 10V RMS applied
Note over 40 MV we see a sharp increase in BER
25Technical Track 2015 Industry Conference & 17th Annual Meeting www.odva.org
© 2015 ODVA, Inc. All rights reserved.
-70
-60
-50
-40
-30
-20
-10
0
0
0.005
0.01
0.015
0.02
0.025
0.03
0.035
0.04
0.1 1 10 100
TCL
(dB
)
VD
iff
(V)
Frequency (KHz)
Calc Vdiff (@10V) EL_TCTL
TCL = -59.8+5.9393*log(f)
Vn_Diff VnApplied 10
ELTCTLdB
20

Industrial Channel TCL E3 Comparison to ISO/IEC 24702
26Technical Track 2015 Industry Conference & 17th Annual Meeting www.odva.org
© 2015 ODVA, Inc. All rights reserved.
1 10 100 1 103
80
60
40
20
0
12.441
77
TCL_Chan_24702E1 f.TCL
TCL_Chan_24702E2 f.TCL
TCL_Chan_24702E3 f.TCL
Indust_TCL_E3 f.TCL
2501 f.TCL
Indust_TCL_E3 fChan( ) y MICE6 0
15 log fChan( ) fChan 80if
y MICE6 1
20 log fChan( ) otherwise
MICE6 0
77
MICE6 1
86.6
fChan 1 2 250
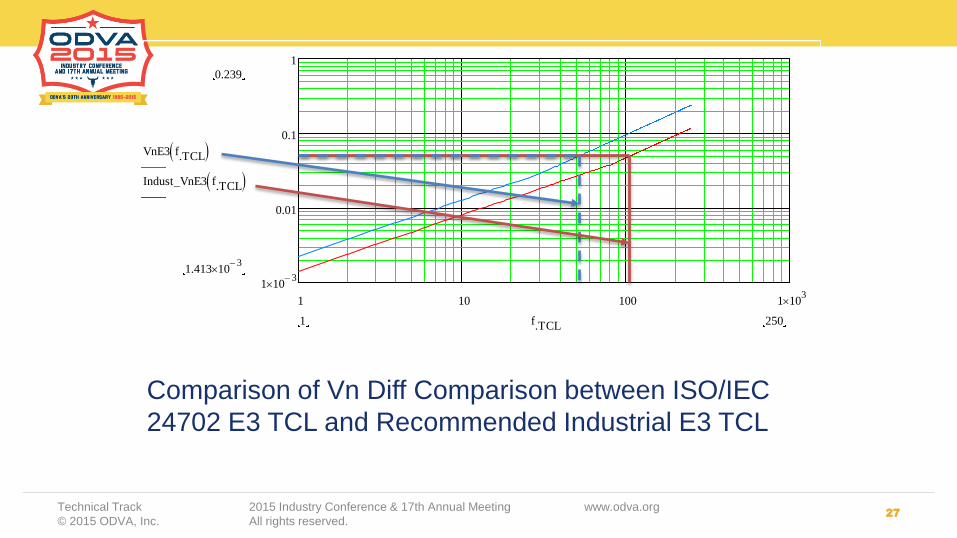
Comparison of Vn Diff Comparison between ISO/IEC
24702 E3 TCL and Recommended Industrial E3 TCL
27Technical Track 2015 Industry Conference & 17th Annual Meeting www.odva.org
© 2015 ODVA, Inc. All rights reserved.
1 10 100 1 103
1 103
0.01
0.1
1
0.239
1.413 103
VnE3 f.TCL
Indust_VnE3 f.TCL
2501 f.TCL
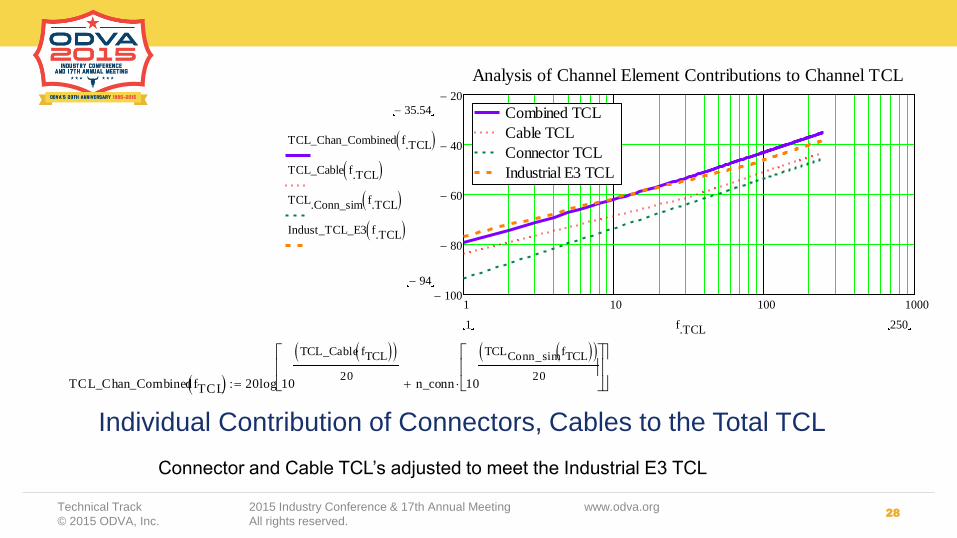
Individual Contribution of Connectors, Cables to the Total TCL
28Technical Track 2015 Industry Conference & 17th Annual Meeting www.odva.org
© 2015 ODVA, Inc. All rights reserved.
Connector and Cable TCL’s adjusted to meet the Industrial E3 TCL
1 10 100 1000100
80
60
40
20
Combined TCL
Cable TCL
Connector TCL
Industrial E3 TCL
Analysis of Channel Element Contributions to Channel TCL
35.54
94
TCL_Chan_Combined f.TCL
TCL_Cable f.TCL
TCL.Conn_sim f.TCL
Indust_TCL_E3 f.TCL
2501 f.TCL
TCL_Chan_Combined fTCL 20log 10
TCL_Cable fTCL 20
n_conn 10
TCLConn_simfTCL 20

29
Differential Noise
• Predicted Channel Differential Noise 2 Connectors 10V CM
Technical Track 2015 Industry Conference & 17th Annual Meeting www.odva.org
© 2015 ODVA, Inc. All rights reserved.
1 10 100 1 103
0
0.05
0.1
0.15
0.2
Vn
RX Sens
Differential Noise (Mode Conversion)
Frequency (MHz)
Vn D
iffe
renti
al
TCL_Ratio fTCL
RX_Limit
fTCL

30
TCL Equations of Limit Lines
• Component and Channel Equations
Technical Track 2015 Industry Conference & 17th Annual Meeting www.odva.org
© 2015 ODVA, Inc. All rights reserved.
TCL_Chan_Combined fTCL 20log 10
TCL_Cable fTCL 20
n_conn 10
TCLConn_simfTCL 20
Calculated Combined TCL for 2 Connectors
New Values for Connector TCL
TCL_CablefTCL y TCL_Ancor 15 log fTCL fTCL 30if
TCL_Ancor 7.4( ) 20 log fTCL otherwise
TCL_Ancor 15 log fTCL fTCL 30if
TCL_Ancor 7.4( ) 20 log fTCL otherwise
TCL_Limitif
y TCL_Limit otherwise
New Values for Cable TCL
Since a RJ45 connector is inherently unbalanced and there are 4 connections, they are the highest contributor to the poor TCL. Reducing the number of connectors and increasing the anchor helps to equal out the contribution between the cable and the connectors in the channel
31
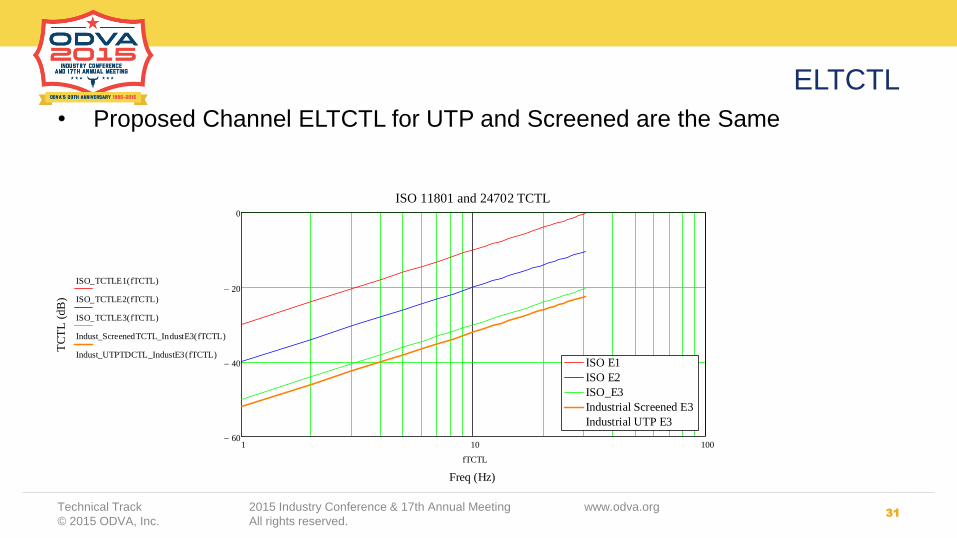
ELTCTL
• Proposed Channel ELTCTL for UTP and Screened are the Same
Technical Track 2015 Industry Conference & 17th Annual Meeting www.odva.org
© 2015 ODVA, Inc. All rights reserved.
1 10 10060
40
20
0
ISO E1
ISO E2
ISO_E3
Industrial Screened E3
Industrial UTP E3
ISO 11801 and 24702 TCTL
Freq (Hz)
TC
TL
(d
B)
ISO_TCTLE1 fTCTL( )
ISO_TCTLE2 fTCTL( )
ISO_TCTLE3 fTCTL( )
Indust_ScreenedTCTL_IndustE3 fTCTL( )
Indust_UTPTDCTL_IndustE3 fTCTL( )
fTCTL
32
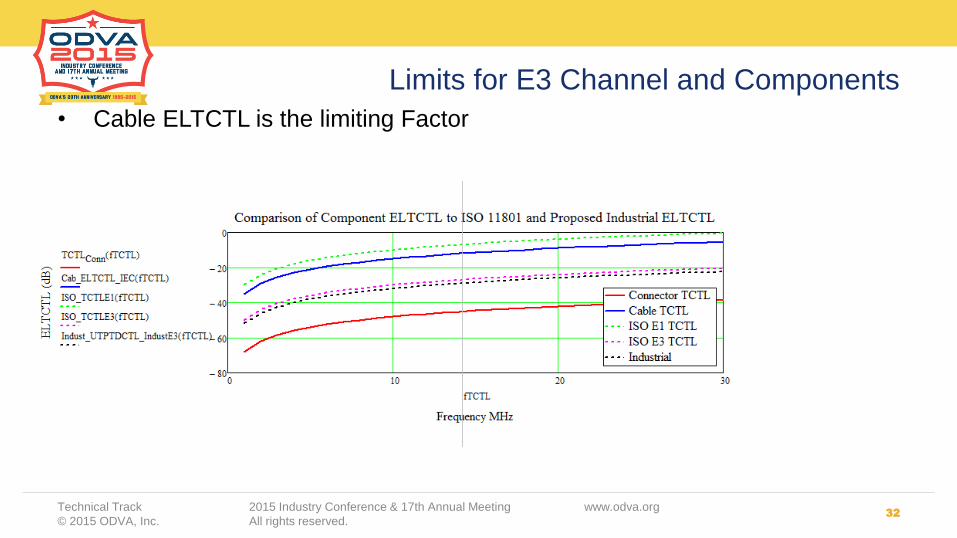
Limits for E3 Channel and Components
• Cable ELTCTL is the limiting Factor
Technical Track 2015 Industry Conference & 17th Annual Meeting www.odva.org
© 2015 ODVA, Inc. All rights reserved.
33
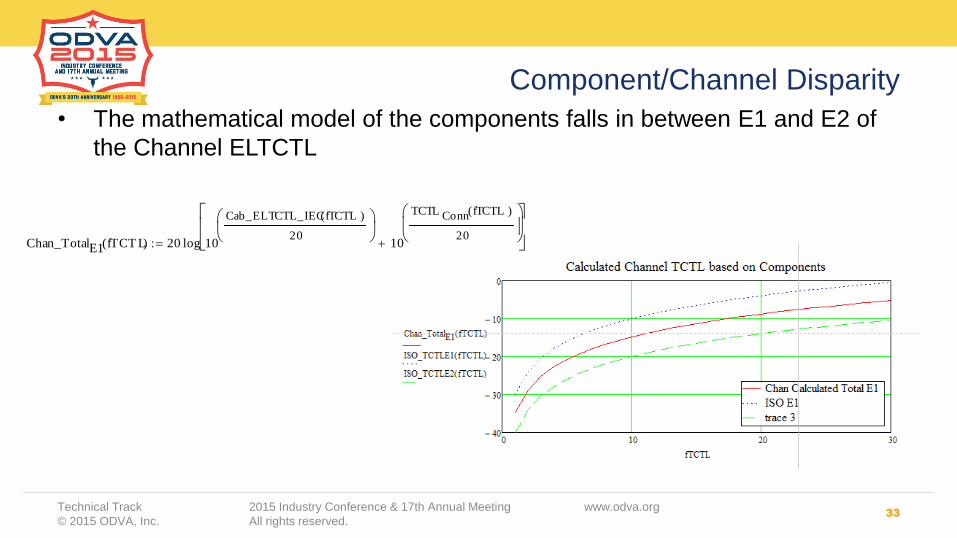
Component/Channel Disparity
• The mathematical model of the components falls in between E1 and E2 of
the Channel ELTCTL
Technical Track 2015 Industry Conference & 17th Annual Meeting www.odva.org
© 2015 ODVA, Inc. All rights reserved.
Chan_TotalE1 fTCT L( ) 20 log 10
Cab_ELTCTL_IECfTCTL( )
20
10
TCTL Conn fTCTL( )
20

34
Proposed Component Limits for ELTCTL
• The New Component Values Combined Meet the targeted Channel
ELCTCL for E3 as Modified
Technical Track 2015 Industry Conference & 17th Annual Meeting www.odva.org
© 2015 ODVA, Inc. All rights reserved.
Indust_TCTLConn fTCT L( ) 68 20 log fTCTL( )( ) 68 20 log fTCTL( )( ) TCTL_Limitconnif
TCTL_Limitconn otherwise
Indust_TCTL Cab fTCTL( ) 53.5 20 log fTCTL( )( )
Calc_TCT L_IndustChan fTCT L( ) 20 log 10
Indust_TCTLCab fTCTL( )
20
10
Indust_TCTLConn fTCTL( )
20

35
Differential Noise Analysis for 10VCM
• Note Analysis still shows Differential Noise above 0.04V below 10MHz
Technical Track 2015 Industry Conference & 17th Annual Meeting www.odva.org
© 2015 ODVA, Inc. All rights reserved.

THANK YOU