requirements to testing of power system services provided ... · tion, power balancing and voltage...
TRANSCRIPT

Requirements to Testing of Power System Services Provided by DER Units
Per Nørgaard, Fridrik Rafn IsleifssonPaul Crolla
Date: 2011-12
European Distributed Energy Resources Laboratories
DERlab Report No. R- 006.0

IMPRINT
Authors:Per Nørgaard, Fridrik Rafn IsleifssonRisø National Laboratory, Technical University of DenmarkFrederiksborgvej 399, DK-4000 Roskilde, DenmarkPhone (45) 4677 5068, Fax (45) 4677 5083E-mail: [email protected]
Paul CrollaUniversity of Strathclyde, United Kingdom
Title:Requirements to testing of power system services provided by DER units
DERlab Report No. R- 006.0 Date: 2011-12ISBN: 978-3-943517-04-0
Cover Picture: DTU
Abstract: The present document discuss the power system services that may be provided from DER units and the related methods to test the services actually provided, both at com-ponent level and at system level.
Requirements to testing of power system ser-vices provided by DER units Per Nørgaard, Fridrik Rafn Isleifsso Risø National Laboratory, Technical University of Denmark Frederiksborgvej 399, 4000 Roskilde, Denmark Phone (45) 4677-5068, Fax (45) 4677-5083 E-mail: H [email protected] Paul Crolla University of Strathclyde, United Kingdom
ABSTRACT
The present report forms the Project Deliverable ‘D 2.2’ of the DERlab NoE project, supported by the EC under Contract No. SES6-CT-518299 NoE DERlab.
The present document discuss the power system services that may be provided from DER units and the related methods to test the services actually provided, both at component level and at system level.

CONTENT
Content .................................................................................................................................................... 2
Abbreviations .......................................................................................................................................... 4
1 0BIntroduction ..................................................................................................................................... 5
1.1 13BPower system services ............................................................................................................. 5
1.1.1 1Voltage control ................................................................................................................ 6
1.1.2 18BPower regulation and power balancing............................................................................ 7
1.1.3 18BProtection......................................................................................................................... 7
1.1.4 18BBlack start and island operation....................................................................................... 7
1.2 14BDER unit control...................................................................................................................... 8
1.2.1 18BPower system services by DER units .............................................................................. 8
1.2.2 18BMulti purposes DER units ............................................................................................... 9
1.3 14BTesting ..................................................................................................................................... 9
1.3.1 18BComponent tests .............................................................................................................. 9
1.3.2 18BSystem tests ..................................................................................................................... 9
2 1BComponent testing........................................................................................................................... 9
2.1 14BP+Q capability ....................................................................................................................... 10
2.1.1 18BReactive power control.................................................................................................. 10
2.1.2 18BActive power control ..................................................................................................... 10
2.2 14BAutomatic responses.............................................................................................................. 11
2.2.1 18BAutomatic voltage response........................................................................................... 11
2.2.2 18BAutomatic frequency response ...................................................................................... 11
2.3 14BReal conditions ...................................................................................................................... 12

3 1BTest of aggregated response ...........................................................................................................13
3.1 14BIntroduction ............................................................................................................................13
3.2 14BThe test set-up ........................................................................................................................15
4 1BDERlab PSS Workshop #1.............................................................................................................18
4.1 14BWorkshop programme............................................................................................................18
4.2 14BSummary from workshop.......................................................................................................18
5 1BDERlab PSS Workshop #2.............................................................................................................23
5.1 14BWorkshop programme............................................................................................................23
5.2 14BSummary from workshop.......................................................................................................23
5.2.1 19B RegModHarz project - Regenerative model region of Harz .........................................23
5.2.2 19BThe FENIX and TWENTIES projects approach to creating virtual power plants .........24
5.2.3 19BThe control concept in the FlexPower project................................................................24
5.2.4 19BDiscussion ......................................................................................................................25
6 1BDERlab PSS Workshop #3.............................................................................................................25
6.1 14BWorkshop programme............................................................................................................25
7 1BAttachments....................................................................................................................................26
7.1 14BInvitation to Workshop #1......................................................................................................26
7.2 14BInvitation to Workshop #2......................................................................................................26
7.3 14BInvitation to Workshop #3......................................................................................................26
7.4 14BDiscussion note ......................................................................................................................26
7.5 14BPaper: Statistical method for in-situ testing of the aggregated response from many distributed power units .......................................................................................................................26

Abbreviations
DER Decentralised Energy Resources
DERlab The NoE of European DER laboratories
EC European Commission
NoE Network of Excellence
PCC Point of Common Coupling
PSS Power system services
VPP Virtual Power Plant

5
1 0BINTRODUCTION
The present document discuss the power system services that may be provided from DER units and the related methods to test the services actually provided, both at component level and at system level.
The work presented in the present report addresses only part of the power system services – namely the provision of regulation of the active and reactive power on demand – activated either by automati-cally response or by direct or indirect control.
The following power flow direction notation is used throughout the document: positive (active and reactive) power flow is in the direction to the electrical node (or the point of common coupling - PCC) – meaning that: positive power flow corresponds to generation, while negative power flow corre-sponds to consumption, and positive power regulation corresponds to the usual ‘up-regulation’ and negative power regulation corresponds to ‘down-regulation’. A positive power regulation can thus be provided either by an increase of the generation or by a decrease of the consumption.
1.1 13BPower system services
Power system services are required for proper power system operation. Power system ser-vices cover both services under normal power system operation, like the regulation of the active and reactive po-wer to maintain the power balance and the voltage in any node in the power system, and special ser-vices under abnormal operation – like sort circuit power (for tripping the protection units when short circuit), grid forming service (for island operation), and black start capability (for re-establishing the grid after black out).
In this DERlab context, the term ‘power system services’ has a broader meaning and func-tionality than the usual term ‘ancillary services1
The term power system services is not well defined, but covers in general power services needed to maintain proper operation of the power system. The term ancillary services2 has been used for services provided in addition to the bulk services provided from the large-scale power units. With more of the power system services being provided by a large number of distributed units, the term should be de-fined and named in a way better reflecting this situation. In the present document the term power sys-tem services is used in a broad understand-ing, in principle covering all the necessary power services necessary to maintain a proper operation of the power system, and provided from all types of active power units – central large scale units as well as distributed small sale units. The power system ser-vices include services for power balancing (or power regulation), for voltage regulation, for system stabili-sation, for short circuit power and for grid forming.
1 As defined by Entso-e (www.entsoe.eu)
2 Ancillary services are by the European network of transmission system operators for electricity (ENTSO-E) defined as: Interconnected Operations Services identified as necessary to effect a transfer of electricity between purchasing and selling entities (transmission) and which a provider of transmission services must include in an open access transmission tariff. [ENTSO-E Operation Handbook, 2011]

6
Power grids have traditionally been divided into distribution systems and transmission sys-tems, de-fined by a combination of the voltage levels (below or above around 100 kV), the power flow (bidirec-tional or unidirectional) and responsible actors (DSOs3 or TSOs4). How-ever, with the possibilities for bidirectional power flow in all parts of the grid and with new actors and responsibilities, it is more convenient only to divide by voltage levels – e.g. into the categories HV, MV and LV, even that the intervals differ between the power systems.
The present document focuses on power system services provided by distributed energy resource (DER) units. DER units cover all active power units in the low voltage part of the power system – in this report defined by voltage levels < 25 kV. The DER units can be pure generation units (e.g. photo voltaic), pure consuming units (e.g. for heating / cooling), pure system services providers (e.g. electri-cal storage units), or a combination (e.g. electrical vehicles with bidirectional power flow control).
The services discusses in this document are limited to the active power regulation (for power regula-tion, power balancing and voltage regulation) and the reactive power regulation (for voltage regulation and for optimising the efficiency of the power distribution).
Power system services include the supply of active and / or reactive power (both source and suck) on system demand. These power system services are needed in the attempt to control the voltage and the frequency at any point in the power system at any time and in any situa-tions. Under normal operation, the aim is to maintain the voltage and the frequency. At faults, the aim is to isolate the fault, limit the negative consequences and maintain or re-establish the voltage and frequency in the remaining part of the power system.
The units supposed to provide the power system services must know what is needed by the system. Large power units may be directly controlled by the central power system operator. However, this is not feasible for a huge number of small power units, each contributing with minor power system ser-vices, and therefore some kind of indirect control is needed.
See the discussion paper in the Appendix.
Services needed from the active power units in the system include:
voltage control power regulation power balancing protection black start
1.1.1 1Voltage control
3 DSO: Distribution System Operator.
4 TSO: Transmission System Operator.

7
Controls of the voltage level include both control of the steady state voltage levels (within given lim-its) and control of the voltage fluctuations (e.g. given by the voltage flicker level). High quality of the voltage level is critical at the customers at the low voltage level. Central control of local voltage levels requires a grid with only small changes of the voltages in the distribution grid. This can only be real-ized through an overcapacity of the grid, and is there-fore not economically attractive. Local active regulations of the voltages are therefore prefer-able. Robust and reliable control of the local voltage levels through local regulations provided by active distributed power units (DERs) requires well de-sign, local active units with sufficient regulation capacity and good coordination. The control of the DER units can either be based on 1) central direct control of the DER units in combination with two-way communication, or on 2) decentralised intelligence and dynamic control (e.g. based on ‘policy’ base central control). The voltage control requires fast (immediate) controls and regulations.
1.1.2 18BPower regulation and power balancing Regulations of the power flow in the grid are required to match the capacities of the power lines and desirable to minimise the losses in the grid. Power regulations are required at all voltage levels in and all parts of the grid. For grid components with thermal inertia, no fast control and regulation is re-quired. However, this is normally not the case for the increasing electronically based grid components, which requires fast controls and regulations.
Power regulations are also required constantly to ensure the power balances in any of the synchronised power system areas at any time, controlling the frequency. The power balancing is relevant at all time scales – from seconds to years. The fast regulations are provided by autonomous active units respond-ing to changes in the frequency – e.g. from the mechanical inertia of the synchronous machines. The slower regulations are activated through central control. And the longer term balances are ensured through contracts.
1.1.3 18BProtection Protection covers both 1) protections of the power system components, and 2) personal protection.
The first is about protection against (voltage or current) overload of the components. If the current protection scheme is based on the components resistance to shortly overload in combination with a quick responding protection device (fuse or relay), the proper function of the protection is dependent on the power systems ability to provide high short circuit power to blow the fuse or activate the relay. In power systems based on DERs with limited or un-known short circuit power levels, the protection schemes must be properly designed with more advanced protection relays.
The second is about how to obtain that part of a grid with DERs becomes powerless in a simple, effi-cient and reliable way, and remains powerless until released again.
1.1.4 18BBlack start and island operation When part of a power system for some reasons becomes electrically isolated, the isolated part may be able to continue its operation. This requires the availability, activation and control of sufficient local power system services, including load management or load shedding.
However, the island operation should only be an emergency situation, and the different parts of the power system should be able to re-connect when powered. This implies specific (synchronisation) requirements to the local control and controllers.

8
If an electrically isolated part of a power system with local power generation units for some reasons has been de-powered (i.e. black out), the local power generation units may be able to re-power (i.e. black start) the isolated part, for subsequently re-connecting it to other (powered) parts of the power system. This requires advanced coordination and control of the DERs and of the re-connection of the passive loads.
1.2 14BDER unit control
DER units are active power units, implying that they can be controlled or in other ways re-spond to external signals (like the frequency or the voltage).
As the potential contributions from the individual DER units are limited, the means of activa-tion must be simple and cheap. The activations will therefore not necessarily be based on centralised individual activations based on centrally available individual status information, but rather on rules (or policies), distributed control, one-way broadcast communication and volunteer responses.
From the power system point of view, what matters is the aggregated contribution and impact from many individual units distributed in the given part of the power system. From the owner of the DER unit’s point of view, the cost-benefit relation matters.
It is therefore important to define procedures to test and characterise both the individual DER unit’s ability to provide power system services and a system of more DER units’ ability i com-bination to provide aggregated power system services.
As the provision of power system services (per definition) will have an impact on the opera-tion con-ditions (e.g. the power quality), the DER units’ abilities to provide power system ser-vices is depend-ent on the characteristics of the actual power system, and must be tested in well defined power system contexts.
1.2.1 18BPower system services by DER units Several DER units have technical potentials to provide power system services with no or minor addi-tional investments.
DER: distributed energy resource
distributed: in the distribution system (= small scale); energy: in this context = electrical; resource: controllable.
The introduction of power system services offered by DER units expects to develop from the more simple concepts to the more complex concepts – like:
Automatic response to frequency variations provided by the individual DER units Automatic response to voltage variations provided by the individual DER units Simple on/off control of individual DER units on demand (simple demand side management) Advanced control of the individual DER units on demand Simple aggregated control concepts (e.g. central on/off-control of many units) Advanced control of aggregated concepts (e.g. VPPs)

9
There are no present standard procedures for how to define, specify and test power system services provided by DER units. The present report presents the DERlab NoE partners pro-posal and recom-mendations to common testing procedures for testing DER unit’s ability to provide selected power system services.
DERlab could contribute with specification of requirements and development of testing pro-cedures for the DER unit’s ability to provide system services like support of voltage and fre-quency regulation on direct or indirect demand. Direct response to system demands may be based on control signals or commands. Indirect response to system demands may be based on automatic response to frequency deviations, voltage deviations or dynamic price signals.
Proposals are given for testing of component response (in Section 2) and of aggregated re-sponse (in Section 3).
The proposals are based on the results from the two related DERlab workshops, presented in the Ap-pendix.
1.2.2 18BMulti purposes DER units For most of the DER units – like wind and solar power units, micro CHPs, heat pumps, electrical ve-hicles, other controllable loads etc – their primary functions are other than providing power system services. The only exceptions are the dedicated electricity storage units, which purposes are solely to provide power system services. The DER unit’s actual – and dynamic – ability (or willingness) to pro-vide power system services therefore not only depends on the actual status of the DER unit itself, but also on the requests for their primary services (heat, cold, charging etc). The DER units’ abilities to provide power system services must therefore be specified, characterised and tested for specific and well defined operating conditions.
1.3 14BTesting
The test procedures discussed in the present report are not intended for dedicated electrical storage units with the only purposes to provide power system services.
The tests are divided into component tests (or single unit tests) and system tests (or multi units tests).
1.3.1 18BComponent tests Component tests are tests of the potential power system services for a single DER unit. The tests should be designed to test the potential power system services when the provisions of power system services are not limited by the provision of its primary service.
1.3.2 18BSystem tests System tests are tests of the power system services provided as the aggregated response from more DER units.
2 1BCOMPONENT TESTING
The power system services addressed in this report is limited to those that require only the provision of (additional) active and/or reactive power (in either direction) either automatically or on request. The

10
various power system services in question require different response time and different quantities of active power, reactive power and energy.
Testing of the various DER power units’ ability to provide these types of power system ser-vices is therefore reduced to testing of their abilities to provide regulation of their active and reactive power.
Three different types of tests are discussed:
Testing the P+Q capability Testing the automatic response Testing the power regulation capabilities under real conditions
2.1 14BP+Q capability
It is assumed that the DER unit is connected to the grid via an inverter.
The following tests are described:
Reactive power control Active power control
2.1.1 18BReactive power control Testing of reactive power production and consumption of the inverter.
The unit is tested to confirm that the given set point for reactive power gives a corresponding reactive power output.
The inverter is connected to a controllable DC-source on one side and a grid on the AC side. Then the maximum reactive power production and consumption is measured at varying active power production levels, for example at 0%, 25%, 50%, 75% and 100% active power production.
The measured values are then plotted in a P(Q) graph to show the inverters reactive power capabilities.
These measurements can be repeated with varying grid impedance angles, if a grid simulator is avail-able, to assess the voltage change induced by the reactive power injection and absorption.
If the inverter is equipped with a automatic voltage regulator, the regulator should be tested by varying the grid voltage up and down from the nominal voltage and recording the reactive power production or consumption of the inverter.
2.1.2 18BActive power control Testing the active power control of the inverter.
To test the inverters ability to support frequency control in the AC grid the following test is to be per-formed.

11
The inverter is connected to a controllable DC-source and an AC-grid simulator. The tests are per-formed at various levels of active power production, such as 25%, 50%, 75% and 100%. For each level the frequency is slowly increased or decreased from the nominal frequency and changes in the active power output are measured and recorded. Using these measurements it is possible to plot the power output against the frequency and compare the results with the specifications for the inverter.
2.2 14BAutomatic responses
The following tests are described:
Automatic voltage response. Automatic frequency response.
2.2.1 18BAutomatic voltage response The following tests are performed:
Grid side voltage is decreased until it is below voltage minimum, measurements are made on re-active power production and the speed of the response.
Grid side voltage is increased until it is above voltage maximum, measurements are made on re-active power production and the speed of the response.
The units reactive power production/consumption capabilities are tested: a) The P(Q) curve is measured b) Reactive power production/consumption capability by set point is measured.
The measurements should be performed using different grid impedances to assess the units ca-pabilities under different conditions.
Notes: The unit should have a voltage control dead band so that it normally does not participate in the voltage control, but only participates when the voltage reaches the limits of what is al-lowed. This is necessary to prevent the unit from interfering and disturbing the primary volt-age control in the system.
2.2.2 18BAutomatic frequency response The following tests are performed:
The grid frequency is reduced until it reaches its minimum allowed frequency. Then it is slowly reduced further and the response of the DER unit is measured. Response time and the amplitude of the response are recorded.
The grid frequency is increased until it reaches its maximum allowed frequency. Then it is slowly increased further and the response of the DER unit is measured. Re-sponse time and the amplitude of the response are recorded.
The measurements should be performed using different grid impedances to assess the unit’s ca-pabilities under different conditions.
Notes: The unit’s capability to support during under-frequency conditions is of course limited by the unit’s production state. The different unit’s capabilities in these situations would have to be viewed in re-spect to this. It would also be possible to work with some guidelines on duration of response here,

12
such as the possibility of overloading the unit for a short predetermined time, where the unit would provide frequency support.
2.3 14BReal conditions
Except for dedicated electricity storage units, the DER units are not dedicated to provide power system services. The DER units will typically have other primary purposes with stochastic active and reactive power flows (like for solar power, wind power, consumption). The power system services provided from these DER units will therefore typically be in the form of a change in their active and/or reactive power, relative to what they otherwise would have had. And the test of their power system service contributions - in terms of their active and reactive power responses on request - is therefore not straight forward.
Example: Wind power units can provide positive relative active power regulation on request by oper-ating the wind power unit dynamically at reduced power level – at a fixed difference value below the maximum potential power generation at given wind speed – the so-called delta-regulation. This func-tionality is required in some grid codes for wind farms. The challenge is not to control dynamically the wind power generation – the challenge is to estimate dynamically the maximum potential power gen-eration and thereby the actual positive regulation capability. To illustrate the complexity: The wind power will fluctuate with the fluctuating wind, and a request to provide positive relative active power may be fulfilled even by a reduced power generation, if the ‘natural’ power is reduced more than the requested positive power during the defined response time. The functionality cannot be tested under ideally controlled conditions.
Example: An electrical heating (or cooling) service may be able to make use of its heat capacity and shift its request for power consumption in time, if requested. Its actual capability to shift the power consumption in time will depend on the actual state, the actual heat capacity, the actual temperature relative to the acceptable temperature interval and the knowledge of the future needs. If the unit is operated on-off, the unit can only regulate positive when its state is off, and only regulate negative when it is on.
We therefore propose a statistical testing approach (with similarities to the approach used for determi-nation of the power curve for a wind turbine unit, as defined in the international standard IEC 61400-12):
The DER unit under test is operated under typical conditions. Square-formed cyclic changes of the relative active or reactive power are requested from the DER unit, and the actual active or reactive power flow is recorded – see Figure 1. The operation conditions are classified – typically in classes of relative power levels (e.g. in the following classes: 0..20%; 20..50%; 50..80%; 80..100% relative power level) and in classes of relative power request (e.g. in the following classes: 1%; 5%; 20%; 50%).

13
Figure 1: Example of a square-formed request signal and the corresponding measured actual response over-lapped with ‘natural noise’.
Proposed requirements to the test:
The cycle time of the squared-formed request signal should be 10 times the expected response time.
The power value recorded for each change in the request, to be used for the statistical analysis, is the average of the power variable measured during the second half of the half-cycle.
The test should be continued until at least 100 data sets in each operation condition class have been collected. The required test time may be minimised by dynamically changing the request signal, covering all the specified request classes.
Statistical analyses: In each of the operation condition classes, the measured responses to respectively the positive and negative requests are individually statistically analysed. The mean value indicates the expected response. The standard deviation of the responses indicates a combination of the ‘natural noise’ from the fluctuating operation conditions and the variation of the responses.
3 1BTEST OF AGGREGATED RESPONSE
Below are described proposals to procedures for testing of power system services provided as the ag-gregated response from many DER units through advanced control.
3.1 14BIntroduction
As the potential power system services that may be offered by the individual DER units are insignifi-cant, it is the aggregated power system services from many DER units that is of in-terest for the opera-tion (and the operator) of the power system.
The power system services (e.g. as defined by Entso-e) are typically traded at dedicated markets. The conditions for contributing to these markets requires full controllability of the power system service offered and full documentation of the service actually provided. These requirements can only be ful-filled through individual, fast two-way communication to all the DER units to be involved and central-ised registration of the individual services provided by each unit – see Table. The two-way communi-cation is needed for the aggregator to know and activate the potential service – for respectively bid-ding and activating. It is relatively costly to fulfil these requirements, and the set-up is not optimal in relation to engage a huge numbers of small potential services. If all these small-scale potentials should be utilised in an economic way, the control of the power systems must be redesigned – including the design of the power markets.

14
Condition Requirement
Full controllability Individual two-way communication
Full documentation Individual registration
Table: Selected conditions and related requirements for trading of power system services at the European power exchange markets.
We therefore propose a methodology for testing the aggregated power system services from many DER units that is not directly applicable for the existing power markets, as it does not fulfil the re-quirements mentioned.
Figure 2: Aggregated power system services in laboratory-like environment (upper) and in a real environment (lower).
If the aggregated response from the DER units in question can be tested in a laboratory-like environ-ment with no disturbances or if the individual responses from all the DER units are measured, then tests of the aggregated responses are relatively trivial. But, as we assume that neither of these testing conditions are realistic, we propose a methodology that can be used to test the aggregated response from many DER units, distributed in a real power sys-tem and with disturbances from other compo-nents in the power system – see Figure 2.

15
3.2 14BThe test set-up
The proposed methodology is designed for testing the active and reactive aggregated power response from a number of (potential) controllable DER units in a power system. The disturbances from the power system are treated as measurement noise, and the accuracy of the methodology depends on the noise level relative to the level of the aggregated response. The means of control of the DER units is not important for the methodology. The control can be individual, direct control, indirect control through a broadcasted signal with volunteer response, or any combinations of control means.
The following components are involved in the test: A number of (potentially) controllable DER units and an aggregation controller – see Figure 2. The following variables must be accessible and collected as time series: the requested response and the actual aggregated response.
Only the requested response, X (= the reference signal to the controller) and the actual aggregated response, Y, are measured – see Figure 3. They should be measured simultaneously with a fixed sam-ple rate, fs, and the data should be collected as time series. It is assumed that the aggregated response can be measured in a single point in the power system. However, this is not critical for the methodol-ogy. Control signals for the required response are send from the controller to the DER units. The re-quested aggregated response is assumed to be a change in the aggregated active or reactive power (or a combination).
Figure 3: Example of a square-formed reference signal and the correspond-ing measured aggregated response overlapped with ‘power system noise’.
A cyclic signal should be used as the reference signal, X. We propose (as a starting point) to use a square-formed signal, but other forms could be considered (triangle, sinusoidal). The cycle frequency and the signal amplitude should be adapted to the actual application. In general, the optimal cycle fre-quency will depend on the response time in the control loop and on the dominating frequency compo-nents in the noise in the measured response. And the optimal amplitude of the reference signal will depend on the level of the noise in the measured response and on the maximum response amplitude that the DER units can provide. A series of tests with different cycle frequencies and different refer-ence amplitudes should be performed.

16
A complete test will include the following steps:
Step 0: Specification of maximum response and response time
Step 1: Characterisation of background noise
Step 2: Test of response
Step 3: Analysis of response
Repetition of Step 1-3: Performance check
Step 4: Reporting the results
Step 0: Specification of maximum response and response time
The expected maximum response, Ymax, and maximum response time, Txy,max, will form the basis for the sample rate, fs, and for the reference cycle frequency, fx, and amplitude, Xa, for the (first) test: fx = 0.1 x 1/Txy,max Tx = 1/fx Xa = 0.2 x Ymax fs > 100 x fx
Step 1: Characterisation of background noise
The background noise in the response signal is measured during a period of 100 x Txy,max, with no change in the reference signal, X. The level (DC offset + rms) and frequency spectrum (at least within the range 0.1..10 x fx) of the background noise are calculated.
Step 2: Test of response
A symmetrical square-formed reference signal, X, with a cycle frequency of fx and an amplitude of Xa is applied for a period with 100 cycles (test time Tt = 100 x 1/fx). The reference and the response are measured and recorded.
Step 3: Analysis of response
The mean values, Ym, of the measured response, Y, are calculated for each second half of each of the half-periods in each reference cycle - Ym+,i and Ym-,i for the step-up and step-down respectively. The average and rms values of the differences of the calculated Ym+ and Um- values represent the aggregated responses and the uncertainties for step-up and step-down requests respectively. The re-sults may be presented as frequency plots – see figure.

17
Figure 4: Example of the distribution of the step-up and step-down responses to a cyclic square-formed reference signal.
Repetition of Step 1-3: Performance check
Step 1-3 should be repeated, but with higher cycle frequencies and higher reference amplitudes to check the reliability of the results and to identify the actual response time and maxi-mum response. The actual response time and maximum response may be identified through plots of the response as functions of respectively the cycle time and the reference amplitude.
Step 4: Reporting the results
The following parameters should be reported for each of the tests:
Test #1 #2 #3
Start date-time
Reference signal Square form Square form Square form
Cycle time [s]
Reference amplitude [kW or kVAr]
Sampling frequency [Hz]
Background noise – mean [kW or kVAr]
Background noise – rms [kW or kVAr]
Step-up – average [kW or kVAr]
Step-up – rms [kW or kVAr]
Step-down – average [kW or kVAr]

18
Step-down – rms [kW or kVAr]
4 1BDERLAB PSS WORKSHOP #1
15 April 2010 at University of Strathclyde in Glasgow in connection with the Smart Grid Sym-posium.
4.1 14BWorkshop programme
9:00 Introduction Per Nørgård Risø DTU (DK)
Power system services NN DERlab
Discussion
Break
Component test procedures NN DERlab
Discussion
Conclusions Per Nørgård Risø DTU (DK)
12:00 Closing Per Nørgård Risø DTU (DK)
4.2 14BSummary from workshop
Presentation by Per Norgard of RISO DTU
Per Norgard made a presentation introducing power system services, also known as ancillary services. The differences between the operation of the traditional power system with large thermal units and those with large amounts of embedded or distributed renewable generation were highlighted.
Power system services provided by generators as required by the transmission system op-erators are defined as:
In normal operations Maintaining power quality (frequency & voltage limits and harmonic limits) Maintaining the balance of power in terms of P & Q

19
In abnormal conditions the generators must continue to operate with Some faults in the system including Limited short circuits Large generation/ transmission circuit failures Disconnection of the generation to the grid (must detect and stop generating currently
as islanding is not allowed generally) If islanding is allowed then local system stability must be maintained and a re-
synchronisation procedure is required to facilitate re-connection to grid. Blackouts of whole system – a set of procedures for restart and reconnection is re-
quired. DER units currently would play no part in this. Power system control is defined under three headings of primary/ secondary/ tertiary control ac-
tions. These can be classified under time to make use of them. Primary controls, e.g. turbine speed governors takes place in seconds Secondary controls, e.g. spinning reserve generation takes place in minutes Tertiary controls, e.g. working points changed takes place in 10’s of minutes
Control Actions and DER
The above control actions are not easily related to DER units for example, DER units generally do not have large turbines with high inertia that are capable of removing or inputting small amounts of real power to balance the system and maintain frequency. In terms of DER the equivalent of turbine inertia could be storage in batteries or fuel cells or not running DER at below maximum to give a small amount of rapidly available power to boost the frequency. These control actions could be defined by the time response required rather than as primary / secondary / tertiary. This could allow DER to pro-vide ancillary services to the grid through turning off/ on, trimming output or inputting reactive power to the system as required by the system operator.
System Stakeholders
The current operation method of TSO/ DNO is indicative of a top down power system from the large thermal units to consumers. This model is not useful if there are large amounts of DER in the system integrated at different levels within the power system. This gives rise to a topology that is different to the traditional one with power flows in unusual directions. This topology can only be realised through the use of Smart Grid as the operators will not be able to change small generators manually in Real-Time as is done with major thermal plants currently.
In the future the concepts of producers, consumers and prosumers will be less meaningful. It would be better to have the concept of an actor or user of the power system, who may generate, consume or store (e.g. an electric vehicle). The actor could be intelligently automated so that it detects changes in the power system (e.g. frequency or voltage changes) and re-acts appropriately (e.g. increasing or cur-tailing generation, switching off completely, increasing reactive power production, etc.). It could also be more centrally managed by intelligent active management systems.
Smart Grid Definitions
There are a number of different definitions of Smart Grid; formulated by the EU ERGEG, US De-partment of Energy, and the UK Department of Energy & Climate Change.

20
The EU’s definition concentrates on enabling the integration of all users behaviour and actions to in-crease economic efficiency, increase sustainability, lower power losses, and in-crease power quality and security of supply.
The US DoE’s definition focuses on the use of digital technology to increase the reliability, security and efficiency of the electric system.
The UK DECC’s definition focuses on using embedded sensing and processing technology to enable the observation (measurements and visualisation), control (manipulate and optimisation), automation (adaption and self healing), full integration (interoperable with existing systems to increase system stability) of the Grid and Distribution Networks.
Aggregated DER Units
Currently DER is tested and connected as single units. However with massive amounts of DER on the network it will no longer be possible to individually control each DER unit and so some sort of aggre-gation will be necessary. The aggregation of many DER units would allow the provision of power system services through the integrated contribution of each individual unit.
DERlab consortia should propose a way of defining power system services in a generic technology independent format with regard to functionality timescale, power, energy and means of activation. DERlab should further propose testing methods and procedures for aggregated DER units. It is pro-posed here that testing for aggregated units should focus on
1. Active power control/ frequency response, 2. Reactive power control/ voltage response, and 3. Fault ride-through capability.
Test procedures for checking the capability of aggregated DER units to stay online after a grid/ net-work disturbances are necessary. DERlab will select relevant DER applications and then suggest new test procedures (TP) based on these applications. These TPs will verify DER components and their ancillary services performance.
DER as A Power System Actor
If DER is to become a major actor in the power system then there will need to be agreement (legal and technical) as to what level of remote access and control is required by other actors (e.g. central dis-patch system.) If it is to be controllable how should this be done? For exam-ple a range of set-points or max rate of change of outputs, control of responses to frequency or voltage changes. Who will be al-lowed to see the droop curves or its dead band of voltage/ power response?
DER units should be flexible and if able to dynamically use and produce power it could have an objec-tive function based on the price of electricity and try to maximise the profit made by generating.
Presentation by Thomas Degner (IWES)
A brief presentation on the current grid code in Germany used for the connection of DER units above a certain size.

21
Background
Currently 45 GW of renewable energy sources in the German power generation portfolio. With wind at 26 GW and PV 9 GW. This has resulted in a huge change in the type of generation in Germany of the last 20 years.
There are various pieces of legislation that determine renewable integration along with the Distribution Code and Technical Guidelines issued by FGW.
Requirements for DER on MV Network
To be connected to the German MV Network a DER device must meet a set of requirements:
Steady state Power quality characteristic parameter limits Active power control (reduction) Reactive power control
Must be able to operate in reduced power mode Reduction on P in max steps on 10% Must operate in pf range of 0.95ind to 0.95cap Various ways of setting the power factor dependent on local conditions Time limits on changing through the full range of power output (reactive and active) Difference between DER unit and DER plant (aggregated units with one grid connection point)
Further work
DERlab should use grid codes already in existence and adapt them to take into ac-count the dif-ferences in operation presented by DER rather than large thermal plants.
Should DERlab develop test procedures for the testing of aggregated DER? Should FRT and other requirements for abnormal operation be seen as PSS?
Breakout Discussion One
Inverters were identified as difficult to test in an aggregated system. This is due to it being difficult to define what size of network and how many inverters should be included as an aggregated unit. Manu-facturers should be made as part of the standards approval tests to give a set of functions defining care-fully how the inverter will act under various conditions. Manufacturers should also indicate how the inverters would respond to different numbers of the inverters being lumped together to form one unit.
There are different requirements for the control of frequency in the UK compared to Germany (it is likely that they are different throughout Europe). It would help manufacturers if more standardised requirements were in place across Europe.
Harmonics generated especially by switching Inverters can have a huge effect on the performance of the power network. Power System services are less critical to net-work operation than low levels of harmonics.

22
At the research stage in the UK there is a plan to control the real power generated by wind turbines thus allowing some frequency control.
The control of power system services currently lies with the network operator which could be chal-lenging if lots of different generators owned by lots of stakeholders are to be integrated on the grid. Generators will want to maximise profit and any decrease in their output (for in-stance) would require them to be paid.
In Poland the grid code only defines requirements for large wind farms which are not applicable to smaller DER at the LV level. Poland’s DNO/ TSOs are opposed to the integration of generators at the distribution level as their network is designed for unidirectional power flows from large generation to consumers.
The Greek grid code does not define tests for single DER units except that there is good PQ at the connection point. System effects are not covered.
There is fuzziness in the definition of Smart Grid and how it applies to the current distribution/ trans-mission set-up. SG does not currently make any difference between the two. SG will not solve prob-lems related to power quality as these are related to generation/ load device characteristics.
Storage could provide frequency, power and voltage support. Electric vehicles could provide demand control, system frequency support, local voltage support.
Micro-generation – benefits are technology dependent.
Overall the impression is that system operators and politicians must be persuaded that the smart grid is the way forward for technical and social reasons.
Breakout Discussion Two
DERlab should look to do work in the following areas:
i. Contribution of DER sources to Frequency control 1. Joint control of DER and adjustable loads ii. Test voltage control of DER 1. Adjustment of VARs is pretty pointless at LV level due to resistance iii. Contribution to improving PQ locally using inverter connected devices iv. Behaviour of DER during faults – should they contribute to fault level 1. A standard signature from DER into system could be injected to demonstrate the existence of
fault 2. Analysis of domino fall over of many DER units under fault conditions as happened inthe UK
Grid in 2008 v. How does population of these devices on a network respond to faults? 1. i.e. look at aggregation testing vi. Measurement of frequencies would need communication systems if measured cen-trally as
today as local frequency measurements could de-stabilise the grid as inverters could go into a run-away loop.
vii. Generic services of reactive / active power viii. Others could control higher layer/ value services ix. Generic Network models for each country should be created

23
1. Would allow the effects of smart grids to be studied x. Network Congestion could be eased with DER, assuming the DNO’s allow this. xi. A table of all DER technologies and their frequency/ voltage/ power controllability should be
created.
5 1BDERLAB PSS WORKSHOP #2
19 October 2010 at Bedford Congress Centre in Brussels in connection with the European Smart Grid and E-mobility Conference.
5.1 14BWorkshop programme
14:00 Introduction to the workshop Debora Coll-Mayor DERlab (D)
14:15 Component testing – summary of Workshop #1 Fridrik Isleifsson Risø DTU (DK)
14:30 Regenerative Model Region RegModHarz Florian Schloegl Fraunhofer IWES (D)
14:45 European initiatives in VPP: FENIX and TWENTIES approach
Debora Coll-Mayor DERlab (D)
15:00 The FlexPower concept Per Nørgård Risø DTU (DK)
15:15 The challenges – introduction to the discussion Per Nørgård Risø DTU (DK)
15:30 Coffee break
16:00 Discussion
17:00 Conclusion
17:45 Closing Per Nørgård Risø DTU (DK)
5.2 14BSummary from workshop
Debora Coll-Mayor (DERlab) gave an introduction to the workshop and Fridrik Rafn Isleifsson (Risø DTU) presented a summary from the previous workshop. The slide presenta-tion for the summary was prepared and provided by Paul Crolla (University of Strathclyde).
5.2.1 19B RegModHarz project - Regenerative model region of Harz
Presentation by Florian Schloegl (Fraunhofer, IWES)
24
The project aims to coordinate the production, storage and consumption within the region to show that a stable and reliable electricity distribution can be maintained with maximum contribution from re-newable energy sources. This is done by fully utilizing new integrated approaches, made possible by use of modern information and communication technologies.
Main goals of the project:
Development of a virtual power plant control centre for renewable energies. Marketing of electric energy produced by the virtual power plant. Support of grid operation by network monitoring and ancillary services.
Planned research
With increased use of electric vehicles it will be possible to use the then available storage capac-ity in the vehicles batteries. This capacity can be used to help maintain a stable and reliable elec-trical grid.
Enhanced virtual power plant control to enable provision of ancillary services from DER units, this however requires a change in regulations and market systems.
5.2.2 19BThe FENIX and TWENTIES projects approach to creating virtual power plants
Presentation by Debora Coll-Mayor (DERlab)
The goal of the projects is to demonstrate virtual power plants in real situations. The VPP's should participate in voltage control and secondary frequency regulation. The projects pro-pose aggregation of DER units into VPP's that provide the same system services as conventional centralized power plants have done until now.
The projects are planned to develop and implement:
Regulatory authorizations DER unit aggregation control Control tools at dispatch centre Communication infrastructure between centres
The projects are then planned to demonstrate
Use of protocols form control of DER units Frequency control provided by DER units Voltage control provided by DER units
5.2.3 19BThe control concept in the FlexPower project
Presentation by Per Nørgård (Risø DTU)

25
The goals of the project are to design and test a simple and efficient market that produces price signals to activate electricity demand and DER units’ generation as a regulating element in the power system. The benefits of this being the involvement of the demand side as a regulative element and the simplic-ity of the control system that consist only of the one-way price signal.
The idea of using price signals to activate power system services from DER units will also be studied within the project.
The project will include
Simulations of the market and the influence of the DER units on the power system Lab testing of the proposed market control Real life testing of the influence of the simulated market prices on the power system
The overall aim of the project is to cost optimise the integration of wind power into the current power system and to enable indirect adjustment of power production and consumption of a huge number of DER units and loads using one-way control signals to provide a controllable aggregated power system regulation.
5.2.4 19BDiscussion
Several different approaches to testing provision of power system services from DER units were dis-cussed. Main focus was on the following:
Statistical approach: This test would make use of statistical analysis of the output of the aggre-gated DER units to try to identify chances in the output corresponding to the change in the con-trol signal.
Modulated control signal: This test method proposed a modulation of the control sig-nal and a frequency analysis of the aggregated DER units response to identify the frequency of the control signal in the units output.
Combined modulated control signal and statistical analysis of the output: A combination of the two previously mentioned methods. By combining the two methods the strength of each method could contribute to a more accurate assessment of the DER units aggregated response to a change in the control signal. The statistical analysis of the output could further increase the fil-tering of normal fluctuations from the energy source overlaying the output of the DER units. This along with the periodic change of the control signal and the analysis of the output from the units where these periodic changes would be identified, could possibly present a method with the capability of identifying the response of the DER units with a sufficient precision.
6 1BDERLAB PSS WORKSHOP #3
5 April 2011 at University of Strathclyde in Glasgow in connection with the MicroGen II Conference.
6.1 14BWorkshop programme
16:00 DERlab activities Per Nørgård Risø DTU (DK)

26
Micro generation and its role in a changing energy network
Dave Openshaw UK Energy Networks
Distributed voltage control using inverter connected DERs
Fridrik Isleifsson Risø DTU (DK)
Discussion
17:30 Closing Per Nørgård Risø DTU (DK)
7 1BATTACHMENTS
7.1 14BInvitation to Workshop #1
7.2 14BInvitation to Workshop #2
7.3 14BInvitation to Workshop #3
7.4 14BDiscussion note
7.5 14BPaper: Statistical method for in-situ testing of the aggregated response from many dis-tributed power units

www.der‐lab.net
DERLAB WORKSHOPS
Proper operation of power systems requires access to and to some extent control of various power system services. Several distributed energy resource (DER) units can, as an added value, provide various power system services on requests. The individual contributions may be modest; however, the aggregated impact from a huge number of units could be significant.
Two public DERlab workshops in 2010 will discuss potential applications, the benefits and the ways to assess them.
Workshop 1: DER power system services
April 2010, Univercity of Strathclyde, Glasgow, in connection to the Smart Grids Symposium (www.strath.ac.uk/eee)
Aims: to formulate a common, general understanding of power system services; to propose component test procedures for selected power system services.
Workshop 2: Testing DER power system services
October 2010, Brussels, in connection to the SmartGrids and e‐Mobility European conference
Aim: to discuss methods on how to test aggregated power system services from DER units.
REGISTRATION
Please register via the DERlab home page. Participation is free of charge.
DERLAB NOE
Distributed Energy Resources Laboratories – European Network of Excellence
Partners:
IWES DETest and certification centre for Distributed Energy Resources The University of Manchester UKThe UK centre for distributed generation and sustainable electrical energy KEMA NLT&D Consulting / High power and high voltage laboratories LABEIN ESDistributed generation laboratoryRisø DTU DKTest and certifi cation centre for wind turbines and facility for hybrid and system simulation and testing Arsenal research ATTesting laboratory for system components for photovoltaic and other DG applications NTUA‐ICCS / CRES GRTest facility for hybrid systems and mini‐gridsERSE ITDistributed power generation test facility CEA‐INES FRLaboratory for solar systems / storage systemsTU Sofia BGPower electronics laboratoryTU Lodz PLPower quality laboratory
WORKSHOP
DER POWER SYSTEM SERVICES
15 APRIL 2010
UNIVERSITY OF STRATHCLYDE
GLASGOW
IN CONNECTION TO THE SMART GRID SYMPOSIUM
Version 2010‐03‐10
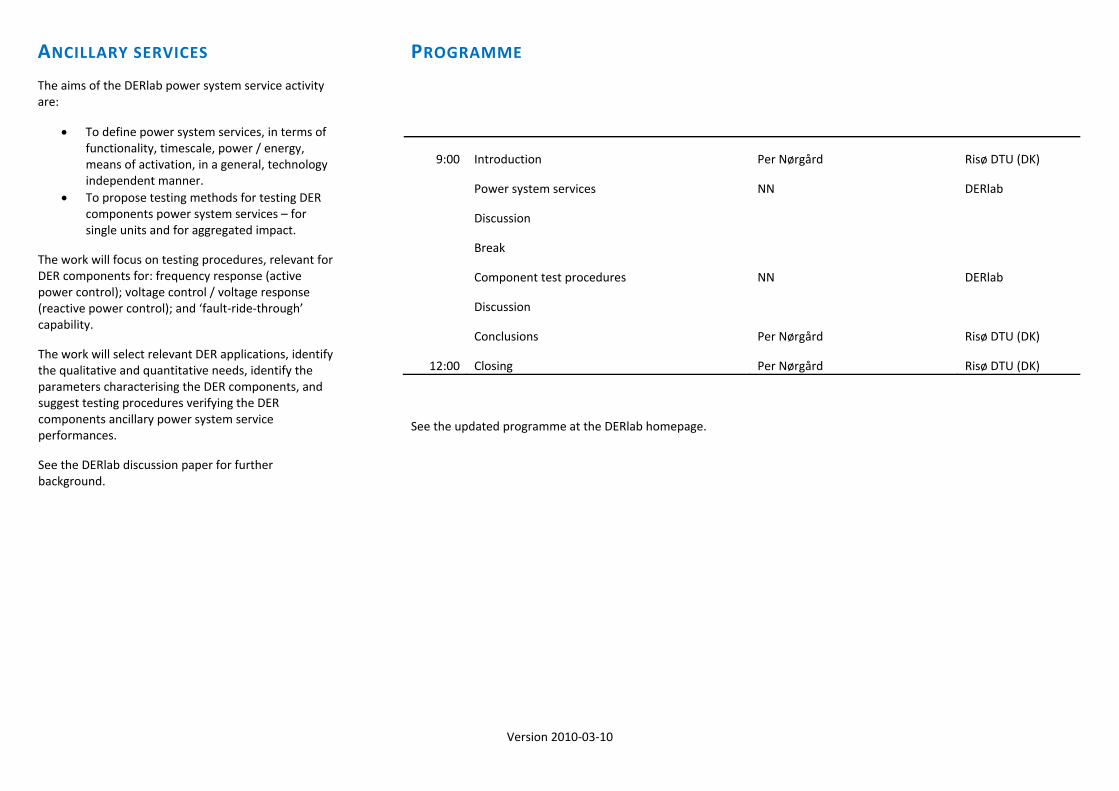
ANCILLARY SERVICES
The aims of the DERlab power system service activity are:
• To define power system services, in terms of functionality, timescale, power / energy, means of activation, in a general, technology independent manner.
• To propose testing methods for testing DER components power system services – for single units and for aggregated impact.
The work will focus on testing procedures, relevant for DER components for: frequency response (active power control); voltage control / voltage response (reactive power control); and ‘fault‐ride‐through’ capability.
The work will select relevant DER applications, identify the qualitative and quantitative needs, identify the parameters characterising the DER components, and suggest testing procedures verifying the DER components ancillary power system service performances.
See the DERlab discussion paper for further background.
PROGRAMME
9:00 Introduction Per Nørgård Risø DTU (DK)
Power system services NN DERlab
Discussion
Break
Component test procedures NN DERlab
Discussion
Conclusions Per Nørgård Risø DTU (DK)
12:00 Closing Per Nørgård Risø DTU (DK)
See the updated programme at the DERlab homepage.

www.der-lab.net
DERLAB WORKSHOPS
Proper operation of power systems requires access to and to some extent control of various power system services. Several distributed energy resource (DER) units can, as an added value, provide various power system services on requests. The individual contributions may be modest; however, the aggregated impact from a huge number of units could be significant.
Two public DERlab workshops in 2010 will discuss potential applications, the benefits and the ways to assess them.
Workshop 1: DER power system services
15 April 2010, University of Strathclyde, Glasgow, in connection to the Smart Grids Symposium (www.strath.ac.uk/eee)
Aims: to formulate a common, general understanding of power system services; to propose component test procedures for selected power system services.
Workshop 2: Testing DER power system services
19 October 2010, Brussels, in connection to the SmartGrids and e-Mobility European conference
Aim: to discuss methods on how to test aggregated power system services from DER units.
Venue: Bedford Hotel & Congress Centre, 135-137 Rue du Midi, 1000 Brussels, www.hotelbedford.be.
REGISTRATION
Participation is free of charge. Please register by sending an email to info(at)der-lab.net.
DERLAB NOE
European Network of Excellence (NoE) of Distributed Energy Resources Laboratories and Pre-Standardization
Partners:
Fraunhofer IWES D Test and certification centre for Distributed Energy Resources
The University of Manchester UK The UK centre for distributed generation and sustainable electrical energy
KEMA NL T&D Consulting / High power and high voltage laboratories
Tecnalia ES Distributed generation laboratory Risø DTU DK Test and certification centre for wind turbines and facility for hybrid and system simulation and testing
AIT AT Testing laboratory for system components for photovoltaic and other DG applications
NTUA-ICCS / CRES EL Test facility for hybrid systems and mini-grids RSE IT Distributed power generation test facility CEA-INES F Laboratory for solar systems / storage systems TU Sofia BG Power electronics laboratory TU Lodz PL Power quality laboratory DERlab e.V. European Distributed Energy Resources Laboratories e.V.
D
WORKSHOP
DER POWER SYSTEM SERVICES
19 OCTOBER 2010
BEDFORD CONGRESS CENTRE
BRUSSELS
IN CONNECTION WITH THE EUROPEAN SMARTGRIDS AND E-MOBILITY CONFERENCE

Version 2010-10-11
POWER SYSTEM SERVICES
The aims of the DERlab power system service (PSS) activity are:
To define power system services, in terms of functionality, timescale, power / energy, means of activation, in a general, technology independent manner.
To propose testing methods for testing DER components power system services – for single units and for aggregated impact.
The work will focus on testing procedures, relevant for DER components for: frequency response (active power control); voltage control / voltage response (reactive power control); and ‘fault-ride-through’ capability.
The work will select relevant DER applications, identify the qualitative and quantitative needs, identify the parameters characterising the DER components, and suggest testing procedures verifying the DER components ancillary power system service performances.
Please see the DERlab discussion paper for further background.
PROGRAMME
14:00 Introduction to the workshop Debora Coll-Mayor DERlab e. V. (D)
14:15 Component testing – summary of Workshop 1 Per Nørgård Risø DTU (DK)
14:30 Regenerative Model Region RegModHarz Florian Schloegl Fraunhofer IWES (D)
14:45 European initiatives in VPP: FENIX and TWENTIES approach
Debora Coll-Mayor DERlab e. V. (D)
15:00 FlexPower concept Per Nørgård Risø DTU (DK)
15:15 The challenges – introduction to the discussion Per Nørgård Risø DTU (DK)
15:30 Coffee break
16:00 Discussions in two groups: a) Laboratory tests b) In situ tests
(Reporters)
17:00 Findings from discussions (Reporter)
17:45 Closing Per Nørgård Risø DTU (DK)
See the updated programme at the DERlab homepage.
The workshop will focus on how to verify power system services provided by the aggregated response from several individual and distributed DER units. Only active and reactive power responses will be addressed. In most cases, the verification has to be carried out in situ with no on-line registration of the individual responses.
The virtual power plant (VPP) control concept is most often implemented with direct control and with individual two-way communication and on-line registration of the responses. Due to individual delays and response times, the aggregated response must be verified.
Regenerative Model Region (RegModHarz) is one of the six pilot projects, funded under the German initiative "E-Energy". By coordinating the production, storage and consumption, the region will show that with a maximum contribution of renewable energy sources a stable, reliable and consumer-based approach is possible.
FlexPower Concept: Broadcasting of dynamic power price signal(s) to all the DER units with no individual communication is an example of an indirect control concept with voluntary responses from the individual DER units, and where the recognised feedback is the aggregated response. The indirect control is simple, but requires a (statistical) knowledge of the response.

www.der‐lab.net
DERLAB PSS WORKSHOPS
The present DERlab PSS workshop #3 is a follow‐up on the two workshops in 2010.
Workshop 1: DER power system services
15 April 2010, University of Strathclyde, Glasgow, in connection to the Smart Grids Symposium (www.strath.ac.uk/eee)
Aims: to formulate a common, general understanding of power system services; to propose component test procedures for selected power system services.
Workshop 2: Testing DER power system services
19 October 2010, Brussels, in connection to the SmartGrids and e‐Mobility European conference
Aim: to discuss methods on how to test aggregated power system services from DER units.
Workshop 3: DERs aggregated power system services
5 April 2011, Glasgow, in connection to the MicroGen II conference.
Aim: to discuss testing procedures for aggregated power system services from DER units.
Venue: The University of Strathclyde in Glasgow, www.strath.ac.uk.
REGISTRATION
Participation is free of charge. Please register by sending an email to info@der‐lab.net.
DERLAB NOE
European Network of Excellence (NoE) of Distributed Energy Resources Laboratories and Pre‐Standardization
Partners:
Fraunhofer IWES DTest and certification centre for Distributed Energy Resources The University of Manchester UKThe UK centre for distributed generation and sustainable electrical energy KEMA NLT&D Consulting / High power and high voltage laboratories Tecnalia ESDistributed generation laboratoryRisø DTU DKTest and certification centre for wind turbines and facility for hybrid and system simulation and testing AIT ATTesting laboratory for system components for photovoltaic and other DG applications NTUA‐ICCS / CRES ELTest facility for hybrid systems and mini‐gridsRSE ITDistributed power generation test facility CEA‐INES FLaboratory for solar systems / storage systemsTU Sofia BGPower electronics laboratoryTU Lodz PLPower quality laboratoryDERlab e.V. European Distributed Energy Resources Laboratories e.V.
D
PSS WORKSHOP #3
DER POWER SYSTEM SERVICES
5 APRIL 2011
UNIVERSITY OF STRATHCLYDE
GLASGOW
IN CONNECTION WITH THE MICROGEN II CONFERENCE

Version 2011‐03‐04
POWER SYSTEM SERVICES
Proper operation of power systems requires access to and control of various (ancillary) power system services. Several distributed energy resource (DER) units can, as an added value, provide various power system services on requests. The individual contribu‐tions may be modest; however, the aggregated impact from a huge number of units could be significant.
The aims of the DERlab power system service (PSS) activity are:
• To define and characterise power system services, in terms of functionality, timescale, power / energy, means of activation, in a general, technology independent manner.
• To propose testing methods for testing DER components power system services – for single units and for aggregated response.
The work will focus on testing procedures, relevant for DER components for: frequency response (active power control); voltage control / voltage response (reactive power control); and ‘fault‐ride‐through’ capability.
The work will select relevant DER applications, identify the qualitative and quantitative needs, identify the parameters characterising the DER components, and suggest testing procedures verifying the DER components power system service performances.
Please see the DERlab discussion paper for further background.
PROGRAMME
Workshop chaired by: Nick Jenkins University of Cardiff (UK)
16:00 DERlab activities Per Nørgaard Risø DTU (DK)
16:20 Micro generation and its role in a changing energy network
Dave Openshaw UK Energy Networks
16:40 Distributed voltage control using inverter connected DERs
Fridrik Isleifsson Risø DTU (DK)
17:00 Discussion
17:30 Closing
See the updated programme at the DERlab or MicroGen homepages.
The present DERlab PSS Workshop #3 is organised as one of the sessions of the Industry Day of the MicroGen II conference.
The workshop will focus on power system services provided by the aggregated response from several individual DER units, distributed in the network. Focus will be on the active and reactive power responses and on procedures how to verify the aggregated response.
Inverter connected units: Several DER units are connected to the power system using inverters with the potential to support the electrical power system with various power system services. One of services that can be provided is local voltage control support. This brings up the questions of how the voltage support function is controlled for multiple DER units as well as how the response of the units can be estimated and evaluated.
Control concepts
The virtual power plant (VPP) control concept is most often implemented with direct control and with individual two‐way communication and on‐line registration of the responses. Due to individual delays and response times, the aggregated response must be verified.
FlexPower Concept: Broadcasting of dynamic power price signal(s) to all the DER units with no individual communication is an example of an indirect control concept with voluntary responses from the individual DER units, and where the recognised feedback is the aggregated response. The indirect control is simple, but requires a (statistical) knowledge of the response.
www.der‐lab.net 1 2010‐03‐10
POWER SYSTEM SERVICES PROVIDED BY DER UNITS DISCUSSION PAPER – INPUT TO THE DERLAB WORKSHOPS
INTRODUCTION
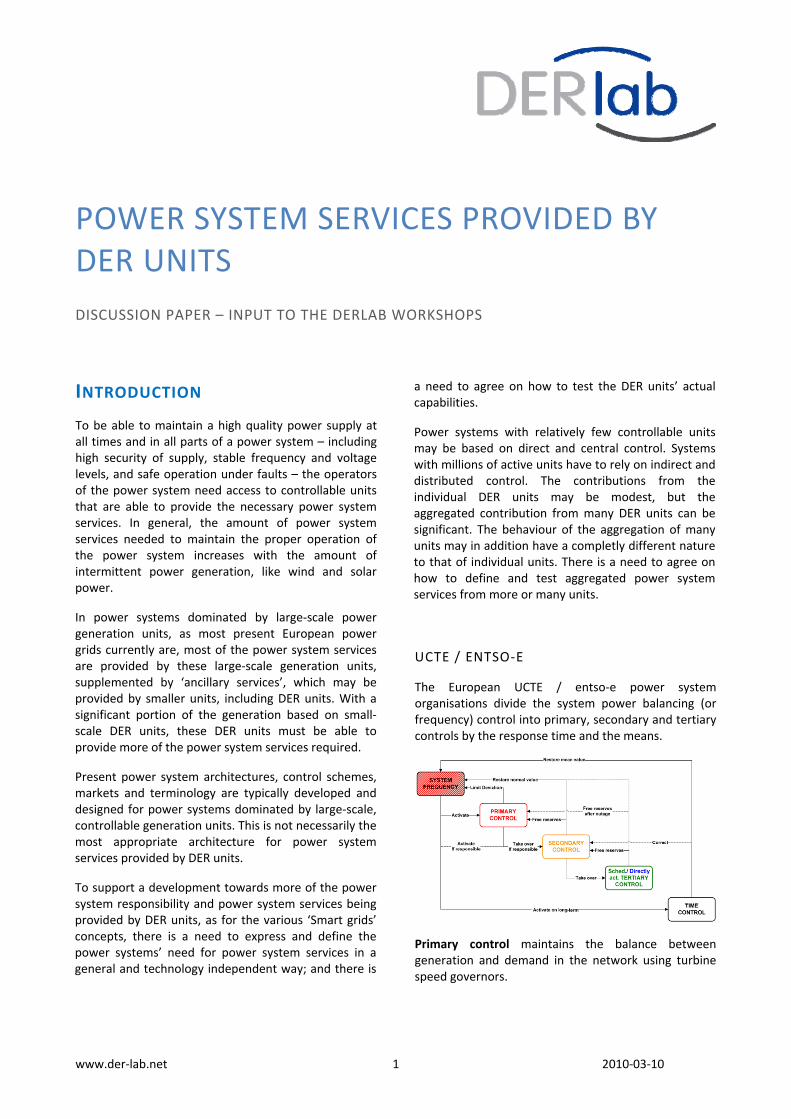
To be able to maintain a high quality power supply at all times and in all parts of a power system – including high security of supply, stable frequency and voltage levels, and safe operation under faults – the operators of the power system need access to controllable units that are able to provide the necessary power system services. In general, the amount of power system services needed to maintain the proper operation of the power system increases with the amount of intermittent power generation, like wind and solar power.
In power systems dominated by large‐scale power generation units, as most present European power grids currently are, most of the power system services are provided by these large‐scale generation units, supplemented by ‘ancillary services’, which may be provided by smaller units, including DER units. With a significant portion of the generation based on small‐scale DER units, these DER units must be able to provide more of the power system services required.
Present power system architectures, control schemes, markets and terminology are typically developed and designed for power systems dominated by large‐scale, controllable generation units. This is not necessarily the most appropriate architecture for power system services provided by DER units.
To support a development towards more of the power system responsibility and power system services being provided by DER units, as for the various ‘Smart grids’ concepts, there is a need to express and define the power systems’ need for power system services in a general and technology independent way; and there is
a need to agree on how to test the DER units’ actual capabilities.
Power systems with relatively few controllable units may be based on direct and central control. Systems with millions of active units have to rely on indirect and distributed control. The contributions from the individual DER units may be modest, but the aggregated contribution from many DER units can be significant. The behaviour of the aggregation of many units may in addition have a completly different nature to that of individual units. There is a need to agree on how to define and test aggregated power system services from more or many units.
UCTE / ENTSO‐E
The European UCTE / entso‐e power system organisations divide the system power balancing (or frequency) control into primary, secondary and tertiary controls by the response time and the means.
Primary control maintains the balance between generation and demand in the network using turbine speed governors.

Discussion paper Power system services provided by DER units DERlab
Secondary control is a centralised automatic function to regulate the generation in a control area based on secondary control reserves.
Tertiary control is any change in the working points of generators (mainly by re‐scheduling).
Ancillary services are defined as interconnected operations services identified as necessary to effect a transfer of electricity between purchasing and selling entities (transmission) and which a provider of transmission services must include in an open access transmission tariff (UCTE, 2004).
Smart grids are defined as electricity network that can cost efficiently integrate the behaviour and actions of all users connected to it – generators, consumers and those that do both – in order to ensure economically efficient, sustainable power system with low losses and high levels of quality and security of supply and safety (ERGEG Position paper on Smart Grids, 2010).
DISCUSSIONS IN USA
The US Federal Energy Regulatory Commission (FERC) has recognized six key ancillary services in its Order 888 (1996): (1) Scheduling, System Control and Dispatch Service; (2) Reactive Supply and Voltage Control from Generation Sources Service; (3) Regulation and Frequency Response Service; (4) Energy Imbalance Service; (5) Operating Reserve ‐ Spinning Reserve
Service; and (6) Operating Reserve ‐ Supplemental Reserve Service.
These services have been further discussed and developed into the following 12 key ancillary services (Hirst and Kirby, 1998):
• System Control: Control‐area operator reliability and commercial functions.
• Reactive Supply and Voltage Control from Generation: Injection and absorption of reactive power from generators to control transmission voltages.
• Regulation: Maintenance of the minute‐to‐minute generation/load balance to meet CPS 1 and 2.
• Load Following: Maintenance of the hour‐to‐hour generation/load balance.
• Frequency Responsive Spinning Reserve: Immediate (10‐second) response to contingencies and frequency deviations.
• Supplemental Reserve: response to restore generation/load balance within 10 minutes of a generation or transmission contingency.
• Backup Supply Plan: Customer plan to restore system contingency reserves within 30 minutes if the customer’s primary supply is disabled.
• Real‐Power‐Loss Replacement: Compensation for transmission‐system losses.
• Energy Imbalance: Accounting for the hourly discrepancy between scheduled and actual transactions.
• Dynamic Scheduling: Real‐time metering, telemetering, and computer software and hardware to electronically transfer some or all of a generator’s output or a customer’s load from one control area to another.
• Network Stability: Use of fast‐response equipment to maintain a secure transmission system.
• System Black Start: The capability to start generation and restore all or a major portion of the power system to service without support from the outside after a total collapse.
Again, the regulation services for power balancing is characterised by their response time:
Regulation and Frequency Response Service provides the continuous minute‐to‐minute balancing of generation and load under normal conditions. This is the most expensive ancillary service. Most balancing authorities dedicate about 1% to 1.5% of their generation to supplying regulation. In regions with independent system operators and ancillary service
www.der‐lab.net 2 2010‐03‐10

Discussion paper Power system services provided by DER units DERlab
www.der‐lab.net 3 2010‐03‐10
DERLAB NOE ACTIVITIES markets it is the most expensive ancillary service. Some loads may be capable of supplying regulation. Energy Imbalance Service is really an accounting function that accommodates any differences between scheduled and actual transactions. It is not a “service” that individual generators or loads provide. Load following is a related service that compensates for the inter‐ and intra‐hour changes in demand. This is the slower counterpart to regulation.
The aims of the activities on power system service from DERs within the DERlab NoE are:
• To contribute to the definitions of power system services, in terms of functionality, timescale, power / energy, means of activation, in a general, technology independent manner.
• To propose testing methods for testing DER components power system services – for single units and for aggregated impact.
Operating Reserve ‐ Spinning Reserve Service is generation (or responsive load) that is poised, ready to respond immediately, in case a generator or transmission line fails unexpectedly. Spinning reserve begins to respond immediately and must fully respond within ten minutes. Enough contingency reserve (spinning and non‐spinning) must be available to deal with the largest failure that is anticipated. Some regions allow appropriate loads to supply spinning reserve but many currently do not.
The work within DERlab NoE will focus on testing procedures that are relevant for DER components for example: frequency response (active power control); voltage control / voltage response (reactive power control); and ‘fault‐ride‐through’ capability.
The work will select relevant DER applications, identify the qualitative and quantitative needs, identify the parameters characterising the DER components power system service capabilities, and suggest testing procedures verifying the DER components power system service performances.
Operating Reserve – Non‐Spinning Reserve Service is similar to spinning reserve except that response does not need to begin immediately. Full response is still required within 10 minutes. Appropriately responsive loads are typically allowed to supply non‐spinning reserve. WORKSHOPS
Replacement or Supplemental Reserve is an additional reserve required in some regions. It begins responding in 30 to 60 minutes. It is distinguished from non‐spinning reserve by the response time frame. Appropriately responsive loads are typically allowed to supply replacement or supplemental reserve.
How to test DER units capabilities to provide power system services will be discussed at two half‐day public DERlab workshops. The workshops are arranged in connection to other relevant European events.
Workshop 1 will discuss two topics: 1) A common understanding and formulation power system services. 2) Component testing procedures for selected power system services.
Workshop 2 will discuss procedures to test aggregated power system services.
We propose to focus on the following three power system services, relevant also for DER units:
• Partial control of the active power (in both directions) ‐ on request.
• Partial control of the reactive power (in both directions) ‐ on request.
• The ability to stay connected and maintain operation during and after a short voltage drop (the ‘fault‐ride‐through’ capability).

1
Abstract—A statistical method for testing of the aggregated
response on request from many small-scale power units (DER units), distributed in a defined part of a power system, is proposed and discussed. As the contribution from the individual DER units is modest, the cost for the communication for and implementation of the activation must be low. And as the number of active units involved is high, neither testing in a controlled environment nor measurements at the individual, distributed DER units are realistic. We therefore propose a statistical method based only on the requested and the actual aggregated responses, that can be applied to DER units distributed in part of a power system, including other, disturbing components.
Index Terms— Aggregated response, DER units, indirect control, in-situ testing, power system services, statistical methodology, volunteer response.
I. INTRODUCTION
Today, most of the power system ancillary services, such as power and voltage regulation, necessary for the proper operation of the power system, are provided by the large-scale generation units in the power system [1]. An increased penetration of small-scale, distributed generation units, such as solar power and micro CHP, will to some extent substitute the large-scale, central generation units [2]. Further the increased penetration of intermittent electricity generation, such as wind and solar power, will require more power system services for power balancing. New actors are therefore required to meet the increasing demand for power system services. The various power system services are generally traded at dedicated electricity exchange markets, which today are designed for large-scale actors and therefore not suitable for integrating small-scale actors. However, with the increased prevalence of fluctuating wind and solar power, there is a desire to activate all possible regulation potential [3-5].
This work is part of the DERlab project, a Network of Excellence between
European DER laboratories, supported by the European Commission under the FP6 frame program.
P. B. Nørgaard, F.R Isleifsson, and O. Gehrke, Risø DTU, Danish Technical University, Roskilde, Denmark (e-mail: [email protected]).
G. M. Burt and P. Crolla, Institute for Energy and Environment, University of Strathclyde, Glasgow, UK (e-mail:[email protected]).
Distributed energy resources (DER) units are small-scale, controllable power units embedded in the power distribution system. DER units can be place in three classes, generating units (e.g. micro CHPs), consuming units (e.g. electrical vehicles) and combined units (e.g. electrical storage). Examples of load units are: electrical appliances for heating / cooling, and electrical vehicles, these could shift their load in time (as one possible system support). Examples of DER generating units are solar power panels where the reactive power from their inverters may be controllable, or micro-hydro where the output could be decreased on demand. DER storage units include various types of batteries, fly wheels and fuel cells each with varying degrees of output power and controllability.
DER units often have an inherent storage capacity, and can, with minor or no modification, provide various power system services (PSS) on request, typically regulation of the active and / or reactive power, in addition to their primary functions. The contribution from individual DER units may be modest, but the aggregated contribution from a huge number (thousands to millions) of units can be significant. One challenge is how to control the many units in a precise and efficient way so that the summed units will provide the required regulation.
There are two types of control schemes currently under consideration by the research and industrial community; the first is direct complete closed loop control of each individual device that an aggregator would then present to the market as a virtual power plant (VPP) [6]. This requires extensive control and communications equipment to be installed close to each device and so could be quite expensive in terms of capital outlay. Another option is to use an aggregated amount of available DER capacity that has a voluntary response to a control signal based on its own local settings but does not relay its individual response back to the central controller. This is an open-loop type of control scheme and is what is considered in this paper [7, 8].
Part of the challenge of integration then is how to efficiently test the aggregated response from a huge number of DER units. As the number of active units involved is high, neither testing in a controlled laboratory environment nor measurements at the individual, distributed DER units are realistic.
Statistical method for in-situ testing of the aggregated response from many distributed
power units P. B. Nørgaard, P. Crolla (IEEE member), F. R. Isleifsson, O. Gehrke, and G. M. Burt (IEEE member)

2
II. DEMAND RESPONSE
Many of the appliances connected to the power system have an inherent storage capacity which, if properly utilized could increase the stability and efficiency of the power system.
These appliances include more power system loads that have some kind of thermal capacity attached to them or loads that have the function of charging battery powered appliances.
It is the potential storage capacity of controllable appliances that makes them an interesting addition to conventional control of the power system; the storage capacity of the appliance makes it possible to shift the loads in time without interfering with the appliances primary function and without the consumer perceiving a reduced performance from the appliance.
Another advantage of utilizing the demand side to provide power system services is that aggregated loads have the potential to react faster than production units in future power generation scenarios, which makes them ideal to respond to smaller and faster changes in the power system balance. The idea of using loads to support conventional power system control tasks is not new, the principle having been studied for over thirty years although actual applications are still very few, an overview of the topic is given in [9].
The most basic use of demand response is load-shedding when a power system or area has entered an emergency state due to large generator tripping off. This quickly closes the imbalance between demand and supply. The owners of such loads are contracted for these events and receive a financial reward for participating. Another example of using controllable loads to balance the power system is in using storage heaters that generate heat overnight which is stored for slow daytime release; these heaters use the excess power being generated in the nighttime hours by stations that cannot easily (if at all) reduce their power output (e.g. nuclear stations).
Advances in information and communication technology (ICT) will allow potentially many more small devices to take part in this market for large scale power system services if the correct aggregation and incentive schemes are put in place. To provide a multitude of different services from individual units could require large amounts of communication and control infrastructure to be put in place, however with some planning it could be possible to implement some control functions with only unidirectional or broadcast communication. Further it could be possible to system frequency or local voltage and act to support them to implement local controls on DER which respond automatically.
Currently most assets in the power system, such as large generators providing ancillary services, are monitored in real time by the system operator. The reason for this is to increase the reliability of the system through making planning and control simpler. For example a spinning reserve unit may disconnect from the grid and so before there is an emergency the system operator will be able to request non-spinning reserve to come online thus maintaining system security and quality of supply [9].
If the demand side of the power system is to take over some of the services provided by the larger generating units, it will
be necessary for the system operator to have some indication or forecast of the availability and response of aggregated loads. Due to the stochastic behavior of loads, it is necessary to use statistical methods to create forecasts of the aggregated load availability and response. Having a method to predict the reaction to a particular control signal would be required for the integration of demand response into the power system.
There exist procedures for testing of DER units’ ability to provide regulation of active and reactive power on request at the component level in a fully controlled testing environment. These procedures could be extended to also cover testing of the aggregated response from multiple units, but still in a controlled environment. However, it is typically not possible to test the aggregated response from a huge number of units, representing a town of 50,000 homes each with multiple DER devices, in a fully controlled testing environment, as the components to be included in the test are distributed in a power system, including other uncontrollable (to the operator) components (see Fig. 1). Tests of the aggregated responses from many distributed units could be performed by a registration and summation of the individual responses. However, this procedure requires on-line, simultaneous measurement of the response from each individual unit. For a huge number of units, this is normally not a feasible option.
This paper discusses a procedure to test the aggregated active and reactive power response from many DER units, distributed in a defined part of a power system, and detecting the changes in the presence of other components disturbing the test. The procedure is based on 1) one-way PSS request signal, common to all the DER units involved, and 2) measurements of the response only at the aggregated level.
The requested PSS response at the aggregated level is overlaid by the ‘noise’ from the operation of the other components in the selected part of the power system. The PSS response must therefore be extracted from the combined, noisy signal. As the actual states of the individual DER units are not known, the individual responses will to some extent be random. However, if the number of DER units involved is high and their operations are independent, the aggregated responses to a given control signal will to some extent be predictable.
III. PROBLEM STATEMENT
As has been described above there will be a need in the future to provide power system ancillary services (such as
Fig.1 The proposed method addresses the situation where the aggregated response from many DER units, distributed in a part of a power system, also including other components, is to be tested.

3
active power support) from aggregated flexible loads. A possible implementation is through the use of a unidirectional, or broadcast, communication system, for example power line carrier, to transmit a variable control signal that is based on the current need for a particular power system service.
This is an example of open-loop control of the DER device as there is no feedback from each device, only the measured aggregated response. Thus for an aggregator to participate in the energy/ power markets he must create a model of his controllable loads [8]. This model could initially be built from a database of connected devices; however he would have no knowledge of the availability of any particular device (or class of device) unless some testing is performed to inform his model.
Thus there is a need to develop a method for discovering the availability of DER devices and to be able to update predictive models based on this information.
IV. PROPOSED METHOD
It is proposed to request a square cyclic aggregated PSS response. The control signal is broadcast simultaneously to all involved DER units. If the control is a ‘demand’, the DER units will respond the best they can, depending on their capabilities and actual status. If the control is by a change in the electricity price, the DER units will respond on volunteer basis, depending on their individual states and control strategies.
A statistical analysis of the aggregated PSS response will (with a given uncertainty) indicate to what extent the required response is fulfilled on average. The cyclic period time should be long enough to cover the longest expected response time from the involved units, and long enough to stabilize the operation before the reference is changed. The amplitude should be as large as possible in order to overcome the noise. However, as the test is carried out in a real and life power system, the test must respect the general requirements to the power quality in the power system.
The proposed methodology will not be exact, and the accuracy depends on the ‘noise’ level from the other components in the defined part of the power system. The analysis of the responses should be divided into up-responses
and down-responses. The mean value of the responses indicates the expected response. The standard deviation of the responses is a combined indication of the variation in the responses and the uncertainties in the methodology due to the noise. The two components can be estimated by repeating the test with the reference signal at different amplitudes – giving different noise levels.
The method has yet to be evaluated in a real test; however this is planned to be performed initially in the power system laboratories at both the University of Strathclyde (D-NAP), and RISØ DTU (SYSlab).
V. MODELING AND SIMULATION DESIGN
The model of this system has been broken up into a number of sub-systems. The general demand data model (from day and day ahead demand predictions from the UK’s National Grid Company); the flexible/ responsive loads model; a price/ control signal function; a load decision system that decides whether a load is on or off. These subsystems are outlined below in qualitative detail.
A. Simulation components
1) General demand data model This takes a set of day and day ahead demand prediction
data from the Balancing Market Reports website [1] which has 96 time-steps (half hourly market settlements). These 96 demand points are put through an interpolation algorithm to convert them to 1000 demand points (approximately 172s.) These data points can then be affected by the flexible loads which could be controlled inside a settlement period. The interpolation is performed using the MATLAB cubic spline data interpolation function. 2) Price signal model
The sell balancing price signal is used to create a general underlying price signal, this data is taken from the BM Reports data site of National Grid Company [1]. Similar data is also available for the Danish markets [2]. This also comes as 96 data points for a 48 hour period; these data points are put through a similar spline as for the ‘General demand data model’ to give 1000 data points.
0 0,25 0,5 0,75 1 1,25 1,5 1,75 2 2,25 2,5
Frequency
Response
Up
Down
Fig. 3. Example of the statistical analysis of the responses, based on the measurements at aggregated level
0
0,5
1
1,5
2
2,5
3
3,5
0 20 40 60 80 100 120
Fig. 2. Example of a squared request signal and the measured power
exchange at the aggregated level
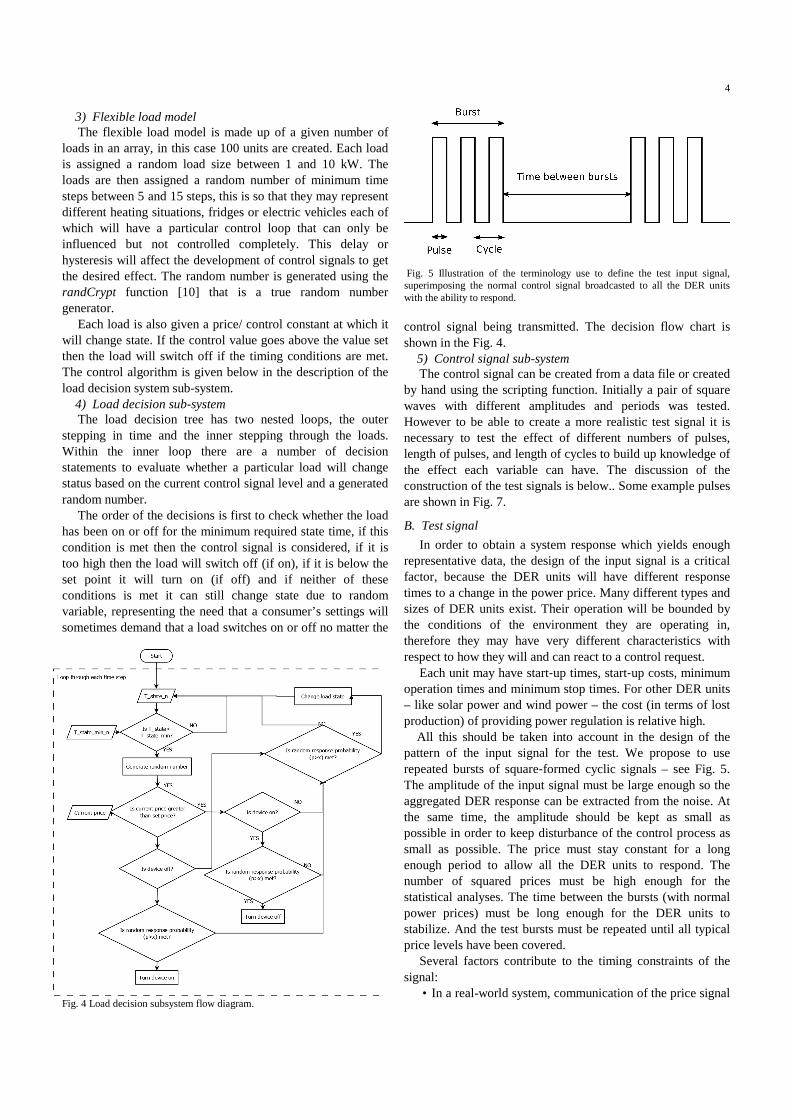
4
3) Flexible load model The flexible load model is made up of a given number of
loads in an array, in this case 100 units are created. Each load is assigned a random load size between 1 and 10 kW. The loads are then assigned a random number of minimum time steps between 5 and 15 steps, this is so that they may represent different heating situations, fridges or electric vehicles each of which will have a particular control loop that can only be influenced but not controlled completely. This delay or hysteresis will affect the development of control signals to get the desired effect. The random number is generated using the randCrypt function [10] that is a true random number generator.
Each load is also given a price/ control constant at which it will change state. If the control value goes above the value set then the load will switch off if the timing conditions are met. The control algorithm is given below in the description of the load decision system sub-system. 4) Load decision sub-system
The load decision tree has two nested loops, the outer stepping in time and the inner stepping through the loads. Within the inner loop there are a number of decision statements to evaluate whether a particular load will change status based on the current control signal level and a generated random number.
The order of the decisions is first to check whether the load has been on or off for the minimum required state time, if this condition is met then the control signal is considered, if it is too high then the load will switch off (if on), if it is below the set point it will turn on (if off) and if neither of these conditions is met it can still change state due to random variable, representing the need that a consumer’s settings will sometimes demand that a load switches on or off no matter the
control signal being transmitted. The decision flow chart is shown in the Fig. 4. 5) Control signal sub-system
The control signal can be created from a data file or created by hand using the scripting function. Initially a pair of square waves with different amplitudes and periods was tested. However to be able to create a more realistic test signal it is necessary to test the effect of different numbers of pulses, length of pulses, and length of cycles to build up knowledge of the effect each variable can have. The discussion of the construction of the test signals is below.. Some example pulses are shown in Fig. 7.
B. Test signal
In order to obtain a system response which yields enough representative data, the design of the input signal is a critical factor, because the DER units will have different response times to a change in the power price. Many different types and sizes of DER units exist. Their operation will be bounded by the conditions of the environment they are operating in, therefore they may have very different characteristics with respect to how they will and can react to a control request.
Each unit may have start‐up times, start‐up costs, minimum operation times and minimum stop times. For other DER units – like solar power and wind power – the cost (in terms of lost production) of providing power regulation is relative high.
All this should be taken into account in the design of the pattern of the input signal for the test. We propose to use repeated bursts of square‐formed cyclic signals – see Fig. 5. The amplitude of the input signal must be large enough so the aggregated DER response can be extracted from the noise. At the same time, the amplitude should be kept as small as possible in order to keep disturbance of the control process as small as possible. The price must stay constant for a long enough period to allow all the DER units to respond. The number of squared prices must be high enough for the statistical analyses. The time between the bursts (with normal power prices) must be long enough for the DER units to stabilize. And the test bursts must be repeated until all typical price levels have been covered.
Several factors contribute to the timing constraints of the signal:
• In a real-world system, communication of the price signal Fig. 4 Load decision subsystem flow diagram.
Fig. 5 Illustration of the terminology use to define the test input signal, superimposing the normal control signal broadcasted to all the DER units with the ability to respond.

5
from the source to a receiving DER unit will be associated with a finite communication delay Tc. Depending on the communication channel, this delay may be deterministic or random.
• In units with associated start-up times, start-up costs, stop times or minimum operation times, unit controllers may be programmed to analyze the incoming signal, trying to distinguish between short spikes and changes of longer duration. The unit may first respond to the signal after a certain amount of time has passed. For strictly square input signals, this (potentially very complex) behavior can be parameterized as a "hold time" Th, the minimum amount of time during which the input signal needs to stay at a certain level before the unit controller will respond.
• The actuation time, Ta, covers the physical response time of the unit, between the point in time where a set point decision is taken at the local unit controller, and the stabilization of the response. In many types of units, the worst-case actuation time is needed during the startup sequence.
• The measurement time, Tm, is the time passing between the registration of power consumption feedback at a measurement unit - e.g. at a substation - and the reception of the measured value at the power system controller. In most real-world systems, the measurement time will be dominated by communication delays.
Some basic requirements for the characteristics of the input signal can be derived from these factors:
• The minimum duration of a signal pulse must be the communication delay plus hold time to ensure actuation of the DER unit.
• The minimum duration of a signal cycle must be the sum
of all four factors in order to obtain measureable results. For the purpose of the simulation presented in this paper,
these time constants were assumed to fall within the following ranges:
• 1 second ≤ Tc ≤ 15 minutes • Th ≤ 15 minutes • 1 second ≤ Ta ≤ 1 minute • 1 second ≤ Tm ≤ 15 minutes Expressed in multiples of the simulation time step of 173
seconds (corresponding to 500 time steps per day), price signal time series were generated based on the following parameters:
• pulse duration = 1..10 time steps • cycle duration = 2..16 time steps • 1..5 pulses per cycle • Time between cycles = 1..5 times cycle duration.
0 5 10 15 20 25 30 35 40 45 50
0.05
0.1
0.15
0.2
0.25
0.3
Price signal against time for pulse number 20
Time (hr)0 5 10 15 20 25 30 35 40 45 50
0
0.05
0.1
0.15
0.2
0.25
0.3
0.35Price signal against time for pulse number 500
Time (hr)
0 5 10 15 20 25 30 35 40 45 500
0.05
0.1
0.15
0.2
0.25
0.3
0.35Price signal against time for pulse number 750
Time (hr)
Pric
e/ c
ontr
ol s
igna
l (m
onet
ary
units
per
kW
h/ n
orm
alis
ed s
igna
l)
0 5 10 15 20 25 30 35 40 45 500
0.05
0.1
0.15
0.2
0.25
0.3
0.35Price signal against time for pulse number 1250
Time (hr)
Pric
e/ c
ontr
ol s
igna
l (m
onet
ary
units
per
kW
h/ n
orm
alis
ed s
igna
l)
Fig. 7. Sample of different pulse trains generated for the test. (a )pulse 30: 1 cycle per burst, 2076s between bursts, pulse duration 864 seconds (b) pulse 500: 2 cycle per burst, 10368s between bursts, pulse duration 864 seconds (c) pulse 750: 3 cycles per burst, 20736s between bursts, pulse duration 1728 seconds (d) pulse 1250: 5 cycles per burst, 36288s between bursts, pulse duration 864 seconds.
Fig. 6. Illustration of the requirements to the minimum duration of the test pulse and of the test cycle

6
C. Statistical Analysis of the Control Signals
To enable the selection of the correct test signal or range of test signals it is necessary to have a selection criterion that is mathematically derivable. The desired effect of the test signals is that the demand of the system displays a reaction that is approximately linear to the test signal. That is if the control signal is a positive square wave then (as higher control signal means less desired load) the demand curve should have an approximately square decrease. When a very ‘noisy’ load is under test it will become impossible to tell by inspection whether the load responded in the desired manner hence a statistical analysis is required.
In this paper the proposed statistical method is the magnitude squared coherence found using the Welch method for estimating coherence [11]. This gives a value between 0 and 1 as a measure of how the output variable (demand) varied with the input variable (price/ control signal) with normalized
frequency. For each burst type a particular coherence curve is
generated. To enable the comparison of multiple pulse types the data generated by the mscohere function [12] must have a quality measure that takes into account the entire data set to give one comparable value. It is proposed here that the data is fitted to a sinc function and the value of the decay constant be used as the comparison value between different pulse types.
Analysis of the change in the coherence with burst length, pulse length, number of pulses and time between bursts will allow the creation of a useful test control signal. A useful test signal is created when there is high coherence between the requested response and the actual response.
D. Assumptions made in modeling process
This modeling process has a number of assumptions that must be remembered when making any general statements about the application of the process. Firstly the process does
0 5 10 15 20 25 30 35 40 45 500
200
400
600
800
1000
1200
1400
1600
1800
2000
Pow
er (
kW)
Time (hr)
Plot of total load, inflexible load, price signal and flexible load
Total active load of systemTotal active flexible loadFixed load
0 5 10 15 20 25 30 35 40 45 50
0
0.05
0.1
0.15
0.2
0.25
0.3
0.35
cont
rol/
pric
e si
gnal
(ar
brita
ry u
nits
)
Control/ price signal
Fig. 8 Example output from the simulation environment. This shows the Control/Price signal, the total load, the uncontrollable load, and the flexible load.
0 0.5 1 1.5 2 2.5 3 3.5 40
200
400
600
800
1000
1200
1400
Pow
er (
kW)
Time (hr)
Total active load of systemTotal active flexible loadFixed load
0 0.5 1 1.5 2 2.5 3 3.5 4
0
0.05
0.1
0.15
0.2
0.25
0.3
0.35
cont
rol/
pric
e si
gnal
(ar
brita
ry u
nits
)
Control/ price signal
Fig. 9 Close in of first burst for pulse number 1250. This shows there is no visible coherence between the load and the pulses, however it may be apparent in
the coherence test.

7
not have a detailed link with the underlying physical characteristics of the loads modeled. These have been assumed to be quite simple loads that only have a size, minimum time on, and a communication response probability along with a random switching on/off process. Reactive power within the system is assumed to be dealt with by other means here; a future extension of this model would be to include reactive power response testing in combination with active power.
Further the loads do not exhibit any change in priority over the test period, this would probably be the case in a real system.
VI. RESULTS
In Fig. 8 is shown the results from the simulation of applying a pulse to the control/ price signal and measuring the response of the loads to this signal. It can be seen easily from the plot that the loads respond most strongly to the parts of the price signal that are part of the signal from the data as these deviations from the average last for a significant amount of time. It is this response that is required to be tested for different aggregation areas. It is not obvious from the plot or even from the zoomed in plot, Fig. 9, whether there is significant coherence between the load online and the pulse test signal. It is only through a coherence analysis that this may become obvious.
In this simulation two pulse trains are applied to the control/ price signal, these have 5 cycles per burst, a pulse duration of 5 time steps (in this case 5 x173 second= 864s), a cycle duration of 14 time steps and time of 3 x 14 time steps between the bursts. The outputs are recorded and the load and the price signal are run through a coherence test as described above. This is shown in Fig.10 below, this plot shows that the highest coherence is at the lower frequencies, i.e. that the longer the pulse the more coherence there will be between the pulse and the load output.
Fig. 10 shows the coherence of the two signals (total load
and price signal.) The maximum coherence is seen at the lowest frequency range, this should be expected as the pulse frequency is much lower than the sample frequency and so it is expected that the maximum coherence will lie in the frequency range closest to zero.
VII. CONCLUSION
This paper has set-out the need for a procedure to test the open-loop control of many DER devices for providing power system ancillary services.
A method to test the aggregated response to a broadcasted control signal (a dynamic price signal) from a huge number of DER units in a defined part of a life power system (at distribution grid level) with a well-defined power exchange to the rest of the power system have been proposed and discussed in the present paper. The proposed method eliminates the need for having individual communication with and control of the involved DER units. The proposed method is less precise, but simple and cheap. The method is intended for applications where you want to have a good indication of the aggregated response to a given control signal – e.g. as a basis for the control. The method is however not intended for tests related to contractual matters.
This paper has also demonstrated a framework for the creation of different test signals that will be needed to investigate multiple power system services responses.
For tests like the proposed one, the test objective is not known to the operator, it will be dynamic and it will change over time. The actual units responding to the control signal is unknown in terms of the number types of units. And this will change over time – new responding DER units will be added to the power system, and old units will be taken out of operation without notice. In addition, the individual units actual responses to a given control signal will depend on their actual status, and the response will therefore differ from time to time.
0 0.1 0.2 0.3 0.4 0.5 0.6 0.7 0.8 0.9 10
0.1
0.2
0.3
0.4
0.5
0.6
0.7
0.8
0.9
1
Normalized Frequency (×π rad/sample)
Mag
nitu
de
Coherence Estimate via Welch for Pulse number 1250
Fig. 10 Example of the coherence against normalized frequency for pulse 1250. This shows that the coherence is highest at the lower frequencies

8
The proposed method shows how test signals can be applied by overriding the normal control signal. As the power system change over time, this identification of the aggregated response should be a continuous process. The design of the test signal should be adapted to the actual power system, with its actual number and types of responding DER units, in order to obtain the best response identification with the least disturbance of the regulation of the power system. This should be a continuous optimization. Simulations demonstrate the sensitivity to the test signal used for a given power system.
This paper has proposed an initial method for the assessment of different types of pulse types; this will need to be explored further before a real test can take place.
FUTURE WORK
The next steps in taking this work forward are to refine the test pulses, build a more comprehensive simulation environment that contains the electrical and thermal models of devices and systems.
After improving the simulation system, the test procedure will be applied in a real laboratory test system. Much further on it a real world system test could take place with many participants taking part.
REFERENCES
[1] P. Kundur, Power Systems Stability and Control. New York:
McGraw-Hill, 1994. [2] S. P. S. Ingram, K. Jackson, "The Impact of Small Scale
Embedded Generation on the Operating Parameters of Distribution Networks," D. o. T. a. Industry, Ed., ed, 2003.
[3] R. Mienski, et al., "Voltage dip compensation in LV networks using distributed energy resources," 2004 11th International Conference on Harmonics and Quality of Power, pp. 774-778 806, 2004.
[4] R. Mienski, et al., "Power quality improvement in LV networks using distributed generation," 2004 11th International Conference on Harmonics and Quality of Power, pp. 779-788 806, 2004.
[5] M. Biffoni , et al., "Opportunities and risks for distributed generation in the context of liberalised energy markets," Engineering Intelligent Systems for Electrical Engineering and Communications, vol. 11, pp. 169-175, Dec 2003.
[6] N. Ruiz, et al., "A Direct Load Control Model for Virtual Power Plant Management," Power Systems, IEEE Transactions on, vol. 24, pp. 959-966, 2009.
[7] e. a. D. J. Hammerstrom, "Pacfic Northwest GridWiseTM Testbed Demonstration Projects," Pacific NorthWest National Laboratory, Richland PNNL-17167, 2007.
[8] FlexPower Market Design Project. Available: http://www.ea-energianalyse.dk/projects-english/1027_flexpower_market_design.html
[9] B. J. Kirby, "Demand response for power system reliability: FAQ," Oak Ridge National Laboratory, Oak Ridge2006.
[10] P. Savicky. (2006). A strong nonrandom pattern in Matlab default random number generator [Online article (pdf)]. Available: http://www.cs.cas.cz/~savicky/papers/rand2006.pdf
[11] W. D. Penny. (2000). Signal Processing Course. Available: http://www.fil.ion.ucl.ac.uk/~wpenny/course/course.html
[12] "MATLAB," 2010a ed: The Mathworks Inc., 2010.
BIOGRAPHIES
Per Nørgaard (born 1951 in Denmark) received MSc in Electronic Engineering from Technical University of Denmark in 1976, and further a Master in Professional Communication from Roskilde University, Denmark, in 1985.
He is presently member of the Intelligent Energy System group at the Technical University of Denmark. His main research area is the development and testing of smart solutions in the power system as an efficient way of integrating intermittent renewable energy resources – in specific wind and solar power. Paul Crolla (M’06) received the MSci degree in physics from the University of Strathclyde, Glasgow, U.K. in 2005
He is currently a Research Assistant with the Protection, Automation and Control Team within the Institute for Energy and Environment. His main research interests lie in the development of power hardware-in-the-loop applications and laboratory demonstration. Fridrik Rafn Isleifsson received the M.Sc. degree in electrical engineering from the Technical University of Denmark in 2006
He is currently a Ph.D. student with the Intelligent Energy System Programme at the Technical University of Denmark. His research focuses on demand side participation in providing ancillary services to the power system and implementation of control strategies in laboratory demonstration. Oliver Gehrke (born 1975 in Germany) graduated in Electrical Power Engineering from Darmstadt University of Technology, Germany, and got his PhD degree at Risø National Laboratory in Denmark.
He is currently a Scientist at Risø DTU. His special fields of interest include the embedded and distributed control of power systems with a high penetration of renewable energy sources Graeme M. Burt (M’95) received the B.Eng. degree in electrical and electronic engineering and the Ph.D. degree from the University of Strathclyde, Glasgow, U.K., in 1988 and 1992, respectively, following research into fault diagnostic techniques for power networks.
He is currently the Director of the Institute for Energy and Environment, University of Strathclyde, where he also directs the University Technology Center in Electrical Power Systems sponsored by the Rolls-Royce Group plc. He is also a Professor of electrical power engineering. His main research interests include the integration of distributed generation, power system modeling and real-time simulation, power system protection and control, and microgrids and more-electric systems.


DERlab e.V. is the European association of independent laboratories working with the integration of distributed energy resources into power systems.The purpose of the Association is to achieve a more environmentally sustainable power generation by supporting the transition of energy supply systems towards more decentralised power generation.
This report was produced in the frame of the EC funded project „Network of DER Laboratories and Pre-Standardization – DERlab” under contract number SES6-CT-518299. The authors are solely respon-sible for the contents of the report and the report does not represent the opinion of the European Commission.
DERlab e.V. – European Distributed Energy Resources Laboratories
c/o Fraunhofer IWES Königstor 59 34119 Kassel / GermanyEmail: [email protected] Phone +49 561 7294 133Fax: +49 561 7294 400
www.der-lab.net9 783943 517040
ISBN 978-3-943517-04-0