research 357 - managing transport challenges when oil prices rise
TRANSCRIPT

Managing transport challenges when oil prices rise
Research Report 357 – August 2008


Managing transport challenges when oil prices rise
S. Donovan, J. Genter, B. Petrenas, and N. Mumby McCormick Rankin Cagney
T. Hazledine University of Auckland
T. Litman Victoria Transport Policy Institute
G. Hewison, T. Guidera, L. O’Reilly, and A. Green Brookfields Lawyers
G. Leyland Incremental
NZ Transport Agency Research Report 357
*ISBN 978-0-478-33416-6
**ISSN 1177-0600
© 2008, NZ Transport Agency
Private Bag 6995, Wellington 6141, New Zealand
Telephone 64-4 894 5400; Facsimile 64-4 894 6100
Email: [email protected]
Website: www.nzta.govt.nz
Donovan, S., Genter, J., Petrenas, B., Mumby, N., Hazledine, T., Litman, T.,
Hewison, G., Guidera, T., O’Reilly, L., Green, A., Leyland, G. 2008. Managing
transport challenges when oil prices rise. New Zealand Transport Agency
Research Report 04/08. 148pp.
Keywords: oil prices, central government, regional councils, local authorities, territorial authorities, light vehicles, commercial vehicles, forecasts, modelling, elasticities, New Zealand, transport planning, travel demand management, land use management, parking, minimum parking requirements, direct and efficient pricing, road pricing, infrastructure investment, alternative modes, public transport, walking, cycling, behaviour change and education, travel plans, car-share, freight management, road network maintenance, surface improvement, energy efficiency, economic development, transport strategy, oil intensity, uncertainty, variability.
An important note for the reader
The NZ Transport Agency is a Crown entity established under the Land
Transport Management Amendment Act 2008. The objective of the NZ
Transport Agency is to undertake its functions in a way that contributes to an
affordable, integrated, safe, responsive, and sustainable land transport
system. Each year, the NZ Transport Agency invests a portion of its funds on
research that contributes to this objective.
This report is the final stage of a project commissioned by Land Transport
New Zealand before 31 July 2008 and is published by the NZ Transport
Agency.
While this report is believed to be correct at the time of its preparation, the
NZ Transport Agency, and its employees and agents involved in its
preparation and publication, cannot accept any liability for its contents or for
any consequences arising from its use. People using the contents of the
document, whether directly or indirectly, should apply and rely on their own
skill and judgement. They should not rely on its contents in isolation from
other sources of advice and information. If necessary, they should seek
appropriate legal or other expert advice in relation to their own
circumstances, and to the use of this report.
The material contained in this report is the output of research and should not
be construed in any way as policy adopted by the NZ Transport Agency but
may be used in the formulation of future policy.

Abbreviations and Acronyms ARPES Auckland Road Pricing Evaluation Study BCR Benefit Cost Ratio BOP Bay Of Plenty BRT Bus Rapid Transit CDF Cumulative Distribution Function CCTV Closed Circuit Television CSIRO Commonwealth Scientific and Industrial Research Organisation EEM Economic Evaluation Manual EIA Energy Information Administration EV Electric Vehicles FBT Fringe Benefit Tax GB Giga Barrels GDP Gross Domestic Product HOV High Occupancy Vehicles HTS Household Travel Survey IEA International Energy Agency IMF International Monetary Fund LGAAA Local Government Auckland Amendment Act LRT Light Rail Transit MBPD Million Barrels Per Day MED Ministry of Economic Development MOT Ministry of Transport MUL Metropolitan Urban Limits NES National Environmental Statement NPS National Policy Statement NYMEX New York Mercantile Exchange NZD New Zealand Dollar NZTA New Zealand Transport Agency NZTS New Zealand Transport Strategy OECD Organisation for Economic Cooperation and Development OPEC Organisation of the Petroleum Exporting Countries PKT Passenger Kilometres Travelled PNR Park and Ride PT Public Transport RC Regional Council RMA Resource Management Act RPS Regional Policy Statement RUC Road User Charges SOV Single Occupant Vehicle TA Territorial Authority TMA Transport Management Association TOD Transit Oriented Development UDA Urban Development Authority USD United States Dollar VKT Vehicle Kilometres Travelled

5 5
Table of Contents
Executive summary .......................................................................................... 7
Abstract ............................................................................................................ 8
1. Introduction ............................................................................................. 16
1.1 Our Wheels May Fall Off – Or at Least Stop Turning ............................16
1.2 The Objective of this Report ............................................................17
1.3 Oil and the Domestic Economy.........................................................17
1.4 Divergent Views on Future Oil Prices .................................................18
1.5 The Importance of Uncertainty.........................................................19
1.6 Oil Spikes versus Sustained High Prices.............................................21
1.7 Improved Vehicle Technology ..........................................................22
2. Background............................................................................................... 24
2.1 Current Travel Demands .................................................................24
2.2 Trends in Passenger Travel ..............................................................26
2.3 Trends in Commercial Travel............................................................29
2.4 Oil Intensity as a Benchmark ...........................................................31
2.5 Summary of Key Texts....................................................................32
3. Modelling Prices for Transport Fuels......................................................... 34
3.1 Background to Oil Markets...............................................................34
3.2 Risk Factors ..................................................................................39
3.3 Modelling Future Oil Prices...............................................................43
3.4 Retail Fuel Price .............................................................................46
3.5 Seriousness of Sustained High Fuel Prices..........................................47
4. Modelling Future Travel Demands............................................................. 48
4.1 Introduction to Elasticities ...............................................................48
4.2 International Comparison of Fuel Prices.............................................50
4.3 Using Elasticities to Back-cast Travel Demands...................................52
4.4 Modelling Future Travel Demands .....................................................53
5. Responses to Rising Oil Prices .................................................................. 57
5.1 Transportation Market Distortions.....................................................57

6
5.2 Introducing the Recommended Responses ........................................ 59
5.3 Land Use Management ................................................................... 61
5.4 Direct and Efficient Pricing .............................................................. 68
5.5 Infrastructure Investment............................................................... 71
5.6 Behaviour Change and Education..................................................... 79
5.7 Freight Management ...................................................................... 83
5.8 Summary of Responses .................................................................. 84
5.9 General Legal Considerations .......................................................... 88
6. Impacts of the Recommended Responses .................................................89
6.1 How the Responses Impact Travel Demands...................................... 89
6.2 How the Responses Deliver Energy Efficiency .................................... 93
6.3 What are the Economic Benefits?..................................................... 94
6.4 What are the Risks?....................................................................... 99
7. Further Research.....................................................................................102
8. Summary.................................................................................................104
9. Conclusions.............................................................................................106
References.......................................................................................................107
Appendices
Appendix A Density and Amenity .................................................................115
Appendix B Economic Evaluation Processes ...................................................116
Appendix C The Meta Model ........................................................................118
Appendix D Modelling the Retail Price of Fuel.................................................124
Appendix E Back-casting Models ..................................................................125
Appendix F Base Travel Demand Factors.......................................................126
Appendix G Impacts of Responses on Travel..................................................129
Appendix H General Data............................................................................132
Appendix I Calculating Economic Benefits .....................................................133
Appendix J Review of Travel Demand Elasticities ............................................135
Appendix K Legal Implications.....................................................................139
Managing transport challenges when oil prices rise
7 7
Executive Summary
This report considers how central government, regional councils, and local authorities
may respond to the transport challenges associated with rising oil prices. This research
supports the environmental sustainability and economic development objectives of the
updated New Zealand Transport Strategy (MOT, 2008b), as well as the specific targets in
the recently released Government Policy Statement on transport (New Zealand
Government, 2008).
Oil currently plays an important role in the transport system in three primary ways.
Firstly, and most obviously, oil provides the fuel that powers the majority of vehicles.
Secondly, oil is the major input into the asphalt and bitumen used to construct and
maintain road surfaces. Finally, the majority of public transport (PT) services are
dependent on diesel – although to a lesser extent than private vehicles.
Thus, when oil prices rise and consumers are faced with higher prices for petrol and
diesel, government agencies are confronted with higher costs for maintaining and
constructing road infrastructure as well as higher costs for operating public transport
services. The price of oil is therefore a key driver of the cost of using, maintaining,
constructing, and operating the transport network.
This report aims to help government agencies understand the risks posed by high oil
prices and, ultimately, recommend changes so that the transport system develops in a
way that is less dependent on oil based transport fuels. The results of this research are
summarised into four key sections, namely: modelling prices for transport fuels,
modelling future travel demands, recommended responses to rising oil prices, and
potential impacts of the responses.
Modelling Prices for Transport Fuels
Oil prices hit record highs in the first half of 2008 and although prices have dropped in
recent weeks they remain at levels that are high by historical standards. This report has
found that recent high prices have been driven by a combination of the following four
factors:
• Increased demand for oil in developing countries, demand that is fuelled by subsidies
that insulate consumers from price signals, particularly in India and China;
• Shifts in the balance of demand towards oil products that require more intensive
processing, which is placing pressure on oil refining capacity;
• Laggard production from conventional sources which has led to demand growth being
increasingly met by unconventional and/or synthetic oil sources; and
• Increased production costs associated with unconventional and synthetic sources has
required higher prices to justify increases in production (Goldman-Sachs, 2008).
To gain insight into how these factors may affect future oil prices, a model was developed
to generate oil price projections for the period 2008-28. This model combined forecasts

Executive Summary
8
from a number of different sources to generate representative price projections. This
model attempted to capture underlying trends as well as the potential variability around
these trends. The figure below illustrates the High, Average (mean), and Low price
scenarios generated by this model.
$-
$25
$50
$75
$100
$125
$150
$175
$200
$225
$250
$275
2007 2008 2009 2010 2011 2012 2013 2014 2015 2016 2017 2018 2019 2020 2021 2022 2023 2024 2025 2026 2027 2028
Pric
e [2
008U
SD
/bar
rel]
High Average Low 2008 Average Current Price
Thus oil prices are expected to subside from their current level (indicated by the black
star) to average approximately $110 USD/barrel for the remainder of 2008. At the time
of writing, the current average for this year – as indicated above by the black circle – sits
very close to the projected price of $110 USD/barrel. This provides a certain degree of
confidence in the short term price projections generated by the model.
Looking ahead, prices may be expected to reach approximately $150 USD/barrel in 2012;
this is expected to combine with a depreciating New Zealand Dollar to push petrol and
diesel prices up to $2.80 and $2.50 per litre respectively. After this point prices may be
expected to plateau and possibly decline, although remain at historically high levels.
Declining prices may reflect new supply coming on-stream and/or dampened demand.
The High and Low price scenarios are considered unlikely but possible. Higher prices
might eventuate if new production or refining capacity is delayed or the rate of decline in
mature fields is more rapid than expected. On the other hand, the removal of fuel
subsidies in India and China may suppress demand, while OECD countries could respond
to sustained high prices by implementing more enduring responses that increase energy
efficiency – similar to those discussed in this report. Alternatively, recent credit issues
may weaken economic growth and take the wind out of current oil prices.
It is emphasised that the accuracy of the underlying forecasts declines the further into the
future one goes; more emphasis should therefore be placed on the short term price
projections. Forecasts are constantly being updated as new information comes to hand
and more advanced modelling techniques are developed. The price forecasts on which

Managing transport challenges when oil prices rise
9 9
these projections are based may be superseded in the near future. In particular,
modelling of resource depletion could increase price forecasts in the medium to long term.
Finally, it should be noted that the price projections illustrated above describe annual
average prices. Spot prices are expected to vary substantially around average prices,
reflecting the fact that oil markets are dominated by inelastic supply and demand. For
this reason unpredictable weather and geopolitical events may cause large spikes in spot
prices. Such spikes present specific challenges to consumers and government agencies
that should be the subject of further research.
Modelling Future Travel Demands
Future travel demands were modelled with respect to the three fuel price scenarios
identified in the previous section, as well as assumed trends in economic growth, vehicle
ownership, labour force participation, disposable income, and population growth.
Light passenger travel demands were found to be sensitive to a variety of factors,
especially fuel prices and vehicle ownership. Commercial travel demands were found to
be substantially less sensitive to fuel prices and more sensitive to economic growth. For
this reason the travel demands for light passenger and commercial vehicles were
evaluated separately and then combined to provide an overall indication of future travel
demands. Cross-elasticities for public transport and active modes were estimated using a
combination of local and international studies.
As illustrated below, in the Average fuel price scenario total VKT is expected to remain
below 2007 levels until circa 2016, after which the combined effects of economic growth,
income growth, and population growth are expected to become dominant.
0
10
20
30
40
50
60
2007 2008 2009 2010 2011 2012 2013 2014 2015 2016 2017 2018 2019 2020 2021 2022 2023 2024 2025 2026 2027 2028
Tota
l Tra
vel [
billio
n KT
per
yea
r]
Passenger Vehicles Commercial Vehicles Alternative Modes
This should be considered as the Base scenario, onto which the effects of the
recommended responses (summarised in the following section) are additional. It is noted
Executive Summary
10
that these results are based on a number of assumptions. Particularly important is the
assumption that economic growth, workforce participation, vehicle ownership and
disposable income are not related to oil prices. This means that aside from the direct fuel
prices impacts, oil prices are not considered to impact on economic performance; an
assumption that is likely to overestimate actual travel demands.
Despite these caveats, the results of this modelling suggest that the next 5-10 years
present an opportunity to reform our current land use and transport practices to ensure
that they support the goals of energy efficiency and economic development. The
following section recommends a number of responses that support these goals.
Responses to Rising Oil Prices
Previous sections highlighted that oil prices are expected to increase and be sustained at
relatively high levels and that these prices are likely to dampen demand for vehicle travel,
particularly over the next 5-10 years. In light of these results, this report identified a
toolbox of potential responses that enable government agencies to facilitate the
development of a more efficient transport system.
Central to these responses is the understanding that travel and land use have not
historically been effectively managed or priced. This has led to structural imbalances that
have subsidised private vehicle trips. Rectifying these structural imbalances so that road
users are faced with the true costs (both internal and external) of their choices is
expected to deliver travel and land use patterns that are significantly more energy
efficient and also support increased economic development. Identified responses were
grouped under the following five headings.
• Land Use Management addresses some of the major market distortions that increase
the need to travel by motor vehicle. Furthermore, they will be necessary to achieve
many of the growth objectives of current transport and land use strategies (such as
intensification around transport nodes);
• Direct and Efficient Pricing supports desired land use changes and provides the
economic incentives for the changes to happen more rapidly. Direct and efficient
pricing may also raise revenue to assist with the transition, e.g. by investing in more
energy efficient transport modes or location-efficient land development;
• Infrastructure Investment outlines recommended supply side responses to higher oil
prices, including greater emphasis on the quality rather than the capacity of the road
network. Land use and pricing responses are expected to generate increased demand
for alternative modes, which should be reflected in infrastructure priorities;
• Behaviour Change and Education campaigns are important to effectively communicate
the need for the paradigm shift that will enable New Zealand communities to adapt to
rising oil prices. An information campaign, in addition to other organisational
institutions, will further facilitate public acceptance, allow for more rapid progress,
and increase the effectiveness of the other responses; and

Managing transport challenges when oil prices rise
11 11
• Freight Management has its own specificities, but the principles of rectifying market
distortions through land use policies, direct pricing and infrastructure investment and
management remain the same. In general, freight management strategies recognise
that heavy vehicle travel is likely to continue to grow in spite of higher fuel prices.
Land use responses provide the greatest medium to long term benefits for energy
efficiency due to their ability to reduce the need for travel, while direct and efficient
pricing is important to ensure that road users pay the true costs of travel. Taken
together, land use management and direct and efficient pricing are expected to generate
additional demand for alternative transport modes, which is likely to require new
infrastructure solutions. Behaviour change and education recognises that providing early
and advanced information may help overcome behavioural inertia and imperfect
information that would otherwise impede efficient responses.
Some of the responses will require legislative change and will subsequently take time to
implement. Current legislative requirements for public consultation may reduce the
ability of government agencies to respond swiftly and effectively in the event that fuel
prices rose unexpectedly. New legal frameworks may be required to provide transport
agencies with the ability to accelerate strategic infrastructure investment when faced with
unexpectedly high fuel prices.
It is noted that the recommended responses are expected to deliver benefits in the
medium to long term and therefore do not provide specific guidance for government
agencies to deliver short-term relief to communities affected by higher transport costs.
This reflects the fact that almost all travel demands and transport costs are derived from
medium to long term locational decisions. There are few short-term silver bullets and the
most effective responses to sustained high oil prices will require time to take effect.
These responses are intended to illustrate the types of transport outcomes that can be
achieved through coordinated actions by local authorities, regional councils, and central
government. Fit for purpose solutions will be required to meet local needs and
circumstances, but this should not distract from the need for and benefits of strong
central government leadership on many of the responses identified in this report.
Ultimately, the implementation of this toolbox of responses is expected to prepare
households, businesses, and government agencies for the challenges of rising oil prices.
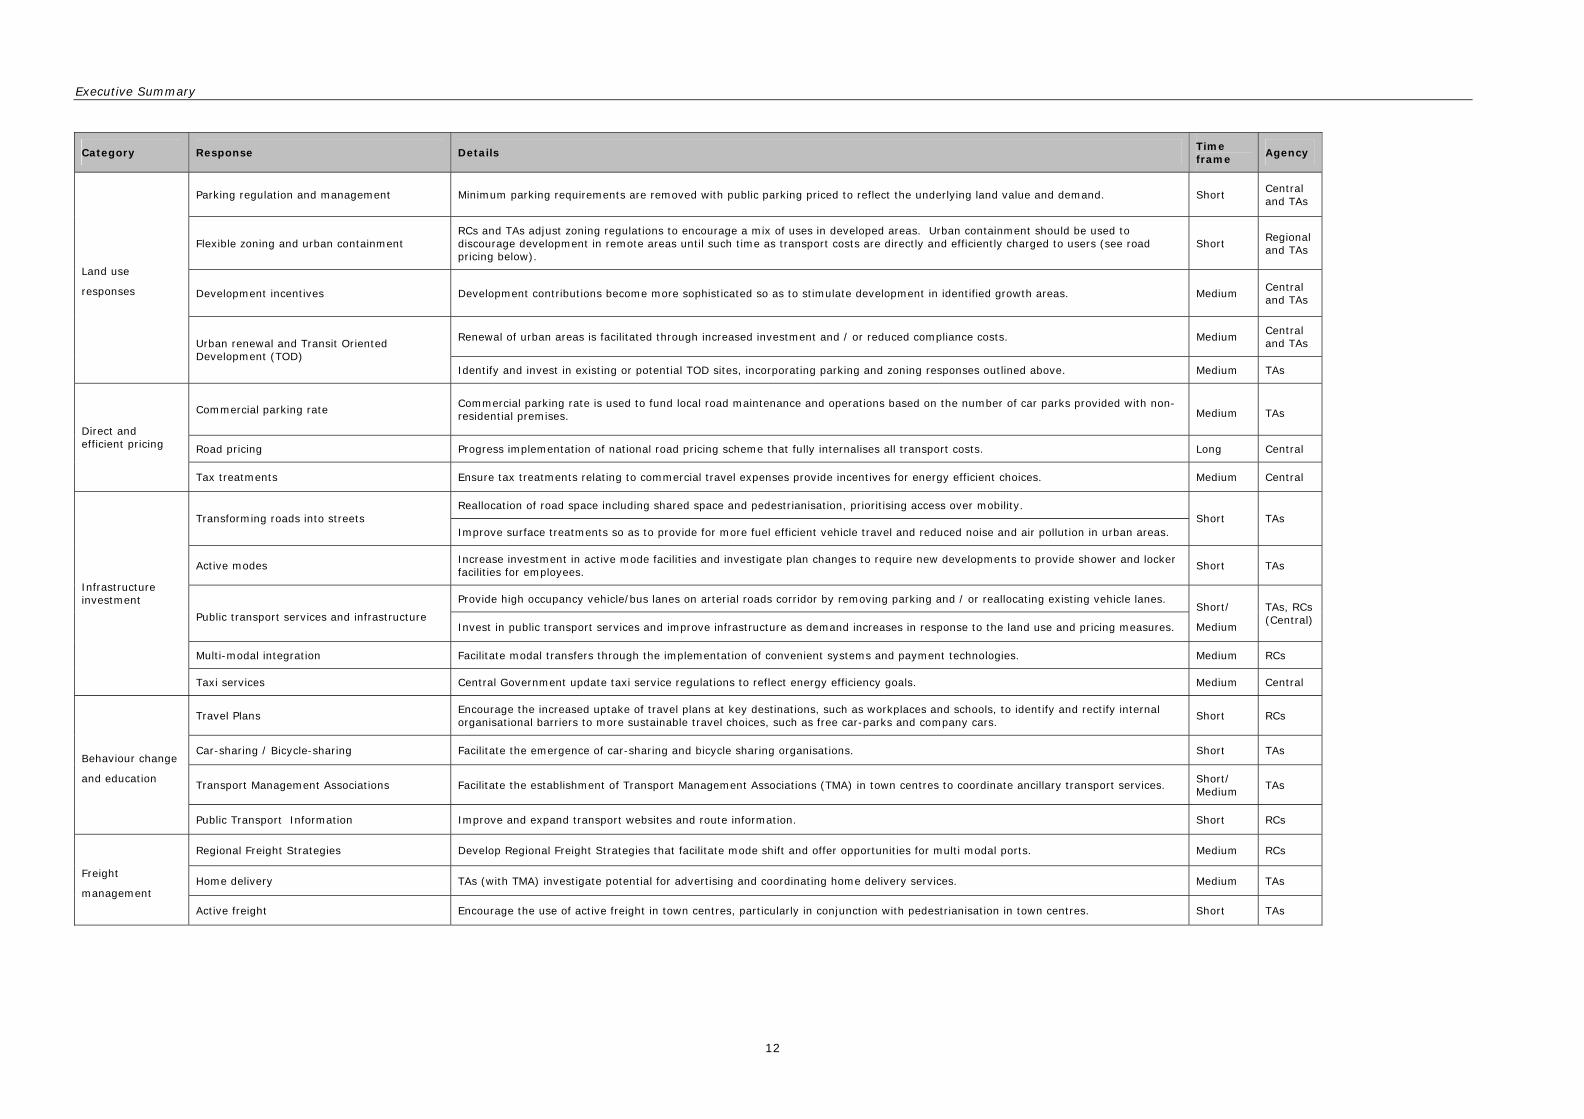
Details on the recommended responses are summarised in the following table.
Executive Summary
12
Category Response Details Time frame
Agency
Parking regulation and management Minimum parking requirements are removed with public parking priced to reflect the underlying land value and demand. Short Central and TAs
Flexible zoning and urban containment RCs and TAs adjust zoning regulations to encourage a mix of uses in developed areas. Urban containment should be used to discourage development in remote areas until such time as transport costs are directly and efficiently charged to users (see road pricing below).
Short Regional and TAs
Development incentives Development contributions become more sophisticated so as to stimulate development in identified growth areas. Medium Central and TAs
Renewal of urban areas is facilitated through increased investment and / or reduced compliance costs. Medium Central and TAs
Land use
responses
Urban renewal and Transit Oriented Development (TOD)
Identify and invest in existing or potential TOD sites, incorporating parking and zoning responses outlined above. Medium TAs
Commercial parking rate Commercial parking rate is used to fund local road maintenance and operations based on the number of car parks provided with non-residential premises. Medium TAs
Road pricing Progress implementation of national road pricing scheme that fully internalises all transport costs. Long Central
Direct and efficient pricing
Tax treatments Ensure tax treatments relating to commercial travel expenses provide incentives for energy efficient choices. Medium Central
Reallocation of road space including shared space and pedestrianisation, prioritising access over mobility. Transforming roads into streets
Improve surface treatments so as to provide for more fuel efficient vehicle travel and reduced noise and air pollution in urban areas. Short TAs
Active modes Increase investment in active mode facilities and investigate plan changes to require new developments to provide shower and locker facilities for employees.
Short TAs
Provide high occupancy vehicle/bus lanes on arterial roads corridor by removing parking and / or reallocating existing vehicle lanes.
Public transport services and infrastructure Invest in public transport services and improve infrastructure as demand increases in response to the land use and pricing measures.
Short/
Medium
TAs, RCs (Central)
Multi-modal integration Facilitate modal transfers through the implementation of convenient systems and payment technologies. Medium RCs
Infrastructure investment
Taxi services Central Government update taxi service regulations to reflect energy efficiency goals. Medium Central
Travel Plans Encourage the increased uptake of travel plans at key destinations, such as workplaces and schools, to identify and rectify internal organisational barriers to more sustainable travel choices, such as free car-parks and company cars.
Short RCs
Car-sharing / Bicycle-sharing Facilitate the emergence of car-sharing and bicycle sharing organisations. Short TAs
Transport Management Associations Facilitate the establishment of Transport Management Associations (TMA) in town centres to coordinate ancillary transport services. Short/ Medium
TAs
Behaviour change
and education
Public Transport Information Improve and expand transport websites and route information. Short RCs
Regional Freight Strategies Develop Regional Freight Strategies that facilitate mode shift and offer opportunities for multi modal ports. Medium RCs
Home delivery TAs (with TMA) investigate potential for advertising and coordinating home delivery services. Medium TAs Freight
management
Active freight Encourage the use of active freight in town centres, particularly in conjunction with pedestrianisation in town centres. Short TAs
Managing transport challenges when oil prices rise
13 13
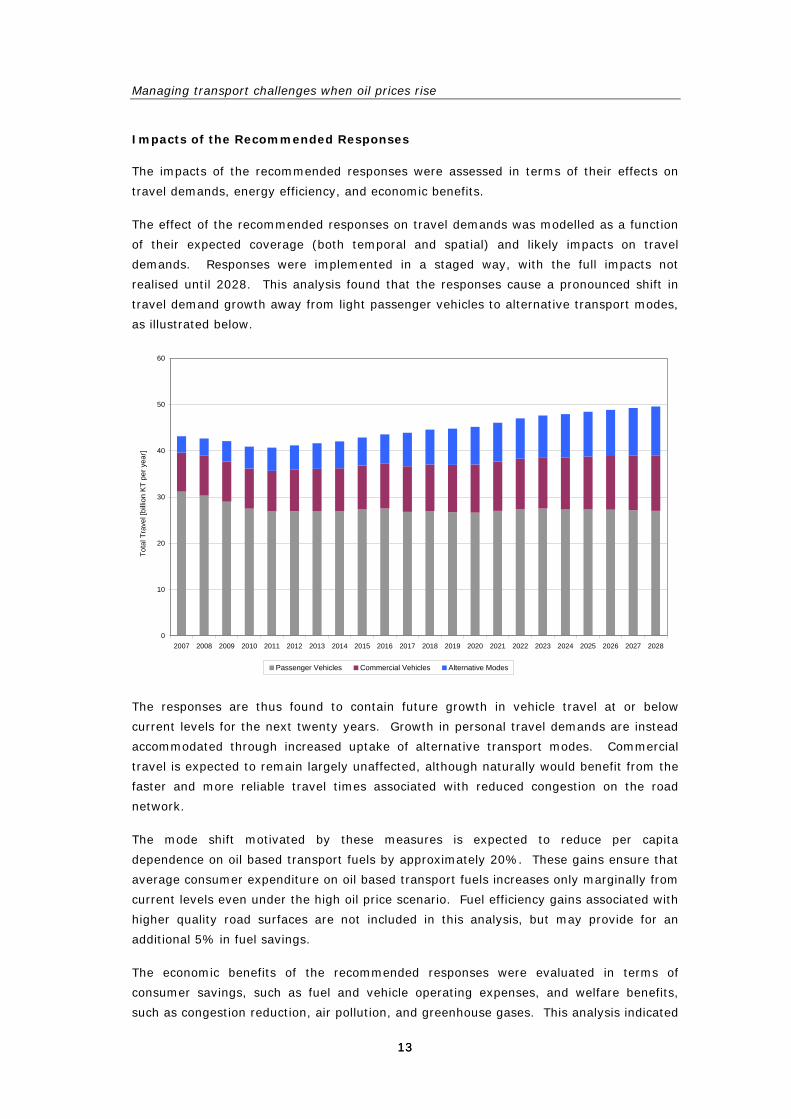
Impacts of the Recommended Responses
The impacts of the recommended responses were assessed in terms of their effects on
travel demands, energy efficiency, and economic benefits.
The effect of the recommended responses on travel demands was modelled as a function
of their expected coverage (both temporal and spatial) and likely impacts on travel
demands. Responses were implemented in a staged way, with the full impacts not
realised until 2028. This analysis found that the responses cause a pronounced shift in
travel demand growth away from light passenger vehicles to alternative transport modes,
as illustrated below.
0
10
20
30
40
50
60
2007 2008 2009 2010 2011 2012 2013 2014 2015 2016 2017 2018 2019 2020 2021 2022 2023 2024 2025 2026 2027 2028
Tota
l Tra
vel [
billio
n K
T pe
r yea
r]
Passenger Vehicles Commercial Vehicles Alternative Modes
The responses are thus found to contain future growth in vehicle travel at or below
current levels for the next twenty years. Growth in personal travel demands are instead
accommodated through increased uptake of alternative transport modes. Commercial
travel is expected to remain largely unaffected, although naturally would benefit from the
faster and more reliable travel times associated with reduced congestion on the road
network.
The mode shift motivated by these measures is expected to reduce per capita
dependence on oil based transport fuels by approximately 20%. These gains ensure that
average consumer expenditure on oil based transport fuels increases only marginally from
current levels even under the high oil price scenario. Fuel efficiency gains associated with
higher quality road surfaces are not included in this analysis, but may provide for an
additional 5% in fuel savings.
The economic benefits of the recommended responses were evaluated in terms of
consumer savings, such as fuel and vehicle operating expenses, and welfare benefits,
such as congestion reduction, air pollution, and greenhouse gases. This analysis indicated

Executive Summary
14
that a more efficiently managed and priced transport network may deliver annual benefits
in the order of $5 billion by 2028, with a net present value of approximately $15 billion.
The benefits are illustrated below.
$-
$500
$1,000
$1,500
$2,000
$2,500
$3,000
$3,500
$4,000
$4,500
$5,000
2007 2008 2009 2010 2011 2012 2013 2014 2015 2016 2017 2018 2019 2020 2021 2022 2023 2024 2025 2026 2027 2028
Wel
fare
Ben
efits
[milli
on 2
008N
ZD]
Consumer Congestion Air Pollution Greenhouse
In short, the responses recommended in this report are likely to deliver improved energy
efficiency and permanent ongoing economic benefits to consumers, business, and public
bodies. The recommended responses are considered to provide an effective way to
decouple New Zealand’s transport system and the wider economy) from the long term
risks of higher oil prices.
Conclusions
This research found that high oil prices are likely to be sustained over the next two
decades. It suggests these risks are best managed by implementing a package of
responses that seek to redress structural imbalances in transportation and land-use
planning. Implementing the recommended responses is expected to result in medium to
long term improvements in energy efficiency, while also delivering on-going economic
benefits. These responses are thus considered to be “no regrets” measures that deliver
“win-win” outcomes – regardless of the price of fuel. They are also expected to motivate
more innovative market driven responses to transport needs than may be achieved
through the current paradigm, which is characterised by underpriced vehicle travel and a
focus on supply side capacity expansions of the road network. Ultimately the
recommended responses are expected to manage total vehicle travel below current levels
and thereby allow government agencies to reprioritise investment in road network
maintenance and alternative transport modes.

Managing transport challenges when oil prices rise
15 15
Abstract
This report provides practical guidance to central, regional, and local
government agencies on how to manage the transport challenges associated
with rising oil prices. The three main sections of the report are:
• Modelling Prices for Transport Fuels – several oil price forecasts are
combined to develop a view on future oil prices. This shows annual
average oil prices staying around $110 USD/barrel in 2008, before
accelerating rapidly to reach approximately $150 USD/barrel in 2012.
After this point prices may stabilise or even decline. Retail prices for
petrol and diesel are expected to peak at approximately $2.80 and
$2.50 NZD/litre respectively in 2011. Upside and downside risks to
these price forecasts exist, particularly in relation to economic
growth.
• Modelling Future Travel Demands - travel demand elasticities and
cross-elasticities are used to model future travel demands. This
considered the effects of fuel prices, economic growth, vehicle
ownership, workforce participation, and disposable income on vehicle
kilometres travelled (VKT). Under the average fuel price scenario
total VKT falls below current levels until approximately 2016, after
which the combined effects of economic growth, increases in income,
and population growth become dominant.
• Responses to Rising Oil Prices – a range of responses are identified in
the areas of land use management, direct and efficient pricing,
infrastructure management, behaviour change and education, and
freight management. These responses are cumulatively expected to
shift travel demands from passenger vehicles to alternative modes,
such that total VKT remains at or below current levels. It is
recommended that the focus of infrastructure investment shift from
peak hour capacity expansion and instead prioritise investment in
road network maintenance and alternative transport modes. Both
these measures are likely to deliver a transport system that is more
energy efficient, as well as realising a range of wider economic
benefits.

1. Introduction
16
1. Introduction
This research report provides guidance to central government, regional councils, and
territorial authorities on how to manage transport challenges when oil prices rise. This
report evaluates the risk of sustained high oil prices and recommends how government
agencies may respond to this risk.
In many ways, the results of this research are intuitive and unsurprising to even a casual
observer. That is, sustained high oil prices are expected to reduce demand for private
vehicle travel and increase demand for other transport modes and more condensed land
use. This report attempts to provide a quantitative framework around these intuition
observations to assist government agencies manage the future development of New
Zealand’s transport system.
On a strategic level this report has been primarily guided by the economic development
and sustainability objectives of the New Zealand Transport Strategy (NZTS). The
following sections introduce the objectives and issues that have motivated this report.
1.1 Our Wheels May Fall Off – Or at Least Stop Turning
In 2007 the International Energy Agency’s (IEA) Chief Economist Fatih Birol stated that “if
we don’t do something very quickly, and in a bold manner, the wheels may fall off. Our
energy system’s wheels may fall off. This is the message that we want to give” (Birol,
2007). Birol later stated “I expect that for the next years to come, we will have a high
price trajectory. There may be zigzags, but I would be very surprised if prices go down to
the levels we saw three or four years ago, in the long term” (Birol, 2008).
These statements represent a marked shift in sentiment. Recent prices suggest oil
markets have indeed undergone a structural shift in response to surging demand in
developing countries, increasing demand for oil products that require more processing,
laggard production from conventional sources, and increasing production costs (IEA,
2007, IEA, 2008, Goldman-Sachs, 2008). These factors are discussed in more detail in
Section 3.
Oil prices impact on transport planning in three primary ways. Firstly, and most
obviously, oil provides the fuel through which most vehicles are powered. Secondly, oil is
the major input into the asphalt and bitumen used to construct and maintain road
surfaces. And finally, the majority of public transport services are dependent on diesel –
albeit to a reduced extent than private vehicles.
Thus, when oil prices rise and consumers face higher prices for petrol and diesel,
government agencies are confronted with higher costs for maintaining and constructing
road infrastructure as well as higher operating costs for public transport services. The
price of oil is therefore a key driver of the cost of using, maintaining, constructing, and
operating the transport network.
Managing transport challenges when oil prices rise
17
1.2 The Objective of this Report
The New Zealand Transport Agency (NZTA) is a crown entity formed to manage land
transport in a way that promotes sustainability and safety. In carrying out its functions,
NZTA seeks to contribute to the five objectives of the updated NZTS; namely (MOT,
2008b):
• Ensuring environmental sustainability.
• Assisting economic development;
• Assisting safety and personal security;
• Improving access and mobility; and
• Protecting and promoting public health.
This report directly supports the economic development and environmental sustainability
objectives of the NZTS.
Recent oil prices have placed pressure on central, regional, and local government
agencies. This pressure has motivated NZTA to commission this research into:
• The drivers of significant oil price movements;
• Impacts on transport decisions under several oil supply and price scenarios; and
• Recommended network and demand management responses to rising oil prices.
It is noted that various government agencies have roles in the management of travel and
land-use patterns. For this reason this report has attempted to adopt a style that is able
to communicate with a wide range of stakeholders. Parts of the report are subsequently
written so as to introduce broader concepts, rather than merely convey results. The
desire for this research to inform transport planning practices ‘on the ground’ has meant
that more detailed technical information is consigned to the appendices.
1.3 Oil and the Domestic Economy
Oil acts as a key input into a variety of end uses, including transport fuels, plastics,
pharmaceuticals, and fertilisers. In the year to March 2008 New Zealand imported $6.7
billion worth of petroleum products, which were the single largest commodity import by
value (Statistics NZ, 2008d). Approximately 86% of the oil consumed in New Zealand is
used for land transport purposes (MED, 2006). The remaining 14% of oil is used for
industrial, agricultural, commercial, and residential purposes.
Oil is not only a direct contributor to the economy via imports and exports, but also has a
specific and critical role to play in economic activity. Economists since Adam Smith have
noted that the economic development of industrialised societies is intertwined with
improved labour productivity brought about by the division of labour (Smith, 1776). And
a division of labour in the 21st century relies upon what economists call “exchange” of
1. Introduction
18
goods and services on a large scale. One of the most important factors that facilitate
“exchange” - both in a global marketplace and in the domestic market is an efficient
transport system and related infrastructure (other important factors include transparent
public institutions and the efficient transfer of information and knowledge). Transport is
therefore a pervasive economic activity - higher transport costs tend to increase the costs
of almost everything else. Higher transport costs create inflationary pressure that
contributes to higher interest rates and lower economic growth, which in some situations
may result in “stagflation” – a situation characterised by negative growth and high
inflation (IEA, 2004).
The negative economic effects of high oil prices tend to emerge over time, with research
suggesting the bulk of the impacts are felt four quarters after the initial price rise
(Jiménez-Rodríguez and Sánchez, 2004). This time lag may reflect some degree of
economic inertia; stock inventories for example slow the rate at which higher costs flow
through into the price of non-perishable goods, while forward hedging by airline
companies may serve to reduce price exposure in the short-term. Ultimately, however,
sustained high oil prices will be passed on to consumers. High dairy prices, record
domestic oil production, and a high New Zealand Dollar (NZD) have tended to buffer the
domestic economy from the recent effects of high oil prices. Should either or all of these
factors change then the domestic economy may become increasingly vulnerable.
High oil prices also have the potential to directly affect the costs of other energy forms.
Oil is the major pillar of an increasingly interlinked global energy market. These linkages
mean that the price of oil closely influences the price of other fuels, such as natural gas
(MED, 2006). Thus when the price of oil increases the price of natural gas tends to
follow. This has potential implications for electricity generation, which contributed
approximately 17% of electrical energy generated in 2005 (MED, 2006). Should domestic
gas supplies dwindle and be replaced by imported gas then New Zealand’s electricity
consumers may become increasingly exposed to international gas prices and, by default,
global oil prices.
International research suggests that high oil prices suppress overall economic growth,
although little research has been conducted into their effects on New Zealand’s economy.
For this reason, this report has been assumed that domestic economic growth is
effectively decoupled from oil prices. For this reason the travel demands modelled in this
report, particularly in the Average and High oil price scenarios, are likely to be
substantially higher than would eventuate in a situation where the relationships between
high oil prices and economic performance was more accurately modelled.
1.4 Divergent Views on Future Oil Prices
Discussions on future oil prices centre around two divergent views – commonly referred to
as “peak oil” and “mainstream” perspectives.
Peak oil proponents maintain that world oil production will soon plateau or decline,
causing increasingly high and unstable prices (EWG, 2007, Hirsch et al., 2005, USGAO,
2007). Peak oil projections are based on geological models of the historical performance

Managing transport challenges when oil prices rise
19
of oil and gas fields, such as the United States and North Sea, which have exhibited sharp
peaks in production.
At the other end of the spectrum, mainstream proponents maintain that high oil prices
will drive exploration, discovery, production, and innovation at a rate that is sufficient to
offset the drawdown in geological reserves, subsequently avoiding sustained high prices
(Lynch, 2001). Mainstream sources agree that a peak in conventional oil production is
likely to occur within the next two decades (Birol, 2008), but argue that innovation will
ameliorate or mitigate the impacts of this peak.
Peak and mainstream views differ less in terms of substance and more in terms of their
relative optimism on the accuracy of reserves, the potential for further discoveries, the
viability of technological efficiencies, and opportunities for energy substitution. It is
suggested that the terms “optimist” and “conservative” would more aptly describe the
mainstream and peak oil views respectively.
Both positions provide insight into future oil prices; it is likely that technological
innovations and geological realities will exert opposing influences on future oil prices. The
question is more about the relative size, timing, and balance of the effects of their effects.
This report has incorporated forecasts from both optimist and conservative sources in an
attempt to generate a consensus view on future oil prices and identify where the balance
of these effects may sit. The model used to generate future oil price projections is
discussed in more detail in Section 3.
As opposed to many forecasts that provide a single deterministic forecast, this report
develops three possible oil price scenarios – high, average, and low – so as to provide
insight into the range of price variability that may be expected. The need for multiple
scenarios also reflects that the risks and benefits associated with energy efficiency and
resilience may not be captured by simply considering the expected oil price scenario. The
importance of uncertainty is discussed in more detail in the following section.
1.5 The Importance of Uncertainty
The need for multiple oil price scenarios recognizes the importance of uncertainty in
informing good decision making. This section discusses the concept of uncertainty within
the context of oil prices and its potential implications for investment in transport
infrastructure.
Land Transport NZ’s Economic Evaluation Manual (EEM) guides the economic evaluation
of transport projects. Detailed discussion on the merits of the EEM is outside the scope of
this report, although a few general comments are warranted insofar as it relates to oil
prices. The EEM outlines the process by which Benefit Cost Ratios (BCR) are calculated
for transport infrastructure investment. This process considers the sensitivity of the BCR
to changes in demand and project costs – however these tests tend to treat these factors
independently of each other. As discussed earlier, high oil prices are likely to reduce
demand for vehicle travel, increase the costs of road construction and maintenance, and
generate higher demands for alternative modes at the same time. In other words, it is
the combined effects of high oil prices that are important.

1. Introduction
20
From a technical perspective, this reflects the significance of causally related variables,
asymmetric risks, and non-linear benefits. This is demonstrated by the following
example, which compares BCR associated with two transport projects, A and B, in three
different fuel price scenarios. Table 1.1 shows the probability and BCR under three fuel
price scenarios for each of the two projects.
Table 1.1: Risk weighted benefit cost ratios
BCR
A B Fuel Price Scenario Risk
Public Transport State Highway
High 25% 2.50 1.00
Average 50% 1.50 1.75
Low 25% 1.25 1.80
Expected BCR 1.69 1.56
The “Expected BCR” may be calculated by taking the sum of the product of the Risk and
BCR columns. This reveals that Project A, on average, delivers higher economic benefits
than Project B – a result that is not immediately obvious from inspection of the Average
or even Low fuel price scenarios. In other words, it is preferable to invest in Project A
even though it delivers below par economic returns 75% of the time, on the grounds that
it delivers exceptional economic returns for the balance of the time.
In this example Project A is intended to represent a public transport project that delivers
mediocre economic benefits under Average and Low fuel prices but much greater benefits
under High fuel price scenarios. In the High scenario Project A is able to cater for
additional demand through relatively inexpensive modifications, such as the removal of
seats to provide additional standing room. Higher load factors increase fare revenues and
provide direct savings to transport funders. The small reduction in BCR for Project A
under the Low price scenario reflects the fact that a reasonable proportion of public
transport patrons are “captive” and as a result relatively insensitive to lower fuel costs.
In contrast, Project B is intended to represent a state highway capacity expansion that
delivers reasonable economic benefits under Average and Low fuel prices. The increase in
benefits when moving from a Average to Low fuel prices is only marginal, however, due to
the fact that peak hour capacity constraints limit the highway’s ability to accommodate
additional vehicle travel. Under the High fuel price scenario the BCR drops significantly as
modest reductions in vehicle volumes flow through to undermine the congestion reduction
benefits associated with the project. Moreover, the High fuel scenario increases road
construction and maintenance costs, which reduces the BCR even further.
Decision making under uncertainty has well developed applications in other fields, such as
the management of hydro electric generators under uncertain supply and demand
conditions (Philpott et al., 2000). Regardless of the application, the general thrust
remains the same – performance under average operating conditions may not define the

Managing transport challenges when oil prices rise
21
optimal investment strategy. More specifically, undertaking Cost Benefit Analysis (CBA)
without accounting for the correlated impacts of oil prices may underestimate the
economic benefits delivered by alternative transport projects, albeit only under certain
conditions.
It is acknowledged that BCR are but one of several factors considered in the allocation of
transport funds - and that their primary purpose is to rank similar classes of projects,
rather than discriminate between different types of transport investment. Despite these
caveats, it is important to acknowledge that BCR influence the funding applications local
authorities are prepared to develop and also shape public and political perceptions of the
value delivered by different types of transport investment. For this reason, it is important
that the EEM is sufficiently sophisticated to realise the true economic benefits associated
with investment in alternative transport modes. Further discussion on the EEM is
contained in Appendix B.
1.6 Oil Spikes versus Sustained High Prices
This report draws a distinction between oil shocks and sustained high prices. A spike is
defined as a large transient increase in price which subsequently subsides. Sustained
high prices are, by contrast, a large and persistent increase in price. These two events
differ in terms of what responses people are prepared to take and also in terms of what
responses government agencies are able to provide.
The responses of individual households to an oil shock are likely to be dominated by short
term measures, such as telecommuting. These decisions are typically made in the
knowledge that reversion to standard travel patterns will be possible in the near future
(IEA, 2005). In contrast, when exposed to sustained high fuel prices individuals are likely
to opt for more permanent and enduring responses, such as locating closer to their usual
destinations.
Government responses to an oil shock are likely to be dominated by measures designed
to manage the fuel supply so as to maintain the integrity of essential services and the rule
of law. This may require the implementation of heavy handed measures, such as fuel
rationing programmes (IEA, 2005). In contrast, government responses to sustained high
oil prices may more reasonably focus on accommodating long term changes in demand
for certain travel and land use patterns.
The former generally falls under the responsibility of the Ministry of Economic
Development (MED) which has developed the Oil Emergency Response Strategy to
minimise the effects of a short term but severe oil supply disruption, and to ensure that
New Zealand is able to meet its obligations as a member of the IEA. The measures
outlined in the Strategy would only be used in circumstances where an industry response
is unlikely to be sufficient (MED, 2008c).
In contrast, this research report primarily focuses on developing policy responses to
sustained high oil prices, as opposed to oil shocks. Nevertheless, the recommended
responses are also expected to improve the resilience of the transport system to oil
1. Introduction
22
spikes. In other words, preparing for sustained high prices will leave New Zealand’s
transport system better able to negotiate unexpected spikes.
1.7 Improved Vehicle Technology
Improvements in vehicle technology may be expected to mitigate the impacts of rising
fuel prices by reducing the sensitivity of travel demands to increasing fuel prices.
Improvements in vehicle technology generally fall into one of two key categories:
improvements in fuel economy and alternatives to oil.
Fuel economy describes the amount of transport fuel consumed to travel a certain
distance, often in litres of fuel consumed per 100km travelled. Technological
improvements have resulted in sustained improvements in fuel economy. Uptake of
these vehicles tends to be related to the price of transport fuels – with the period
immediately following the oil shocks of the late 1970s and early 1980s seeing hitherto
unmatched improvements in average fuel economy of approximately 1.4% per annum
(MED, 2006).
This trend has been somewhat counter-acted in recent times by the increased prevalence
of large vehicles. To some degree this trend may reflect a type of arms race whereby the
increased prevalence of large vehicles increases the vulnerability, either real or perceived,
of smaller vehicles (Levinson and Krizek, 2008). Despite the element of ‘market failure’
associated with recent trends towards larger vehicles, the economic incentive provided by
sustained high oil prices may be expected to prevail over consumer preferences and drive
increased uptake of more efficient vehicles.
New Zealand’s current vehicle fleet is estimated to have an average fuel economy of 10.7
litres/100km (MED, 2006). Given that many new vehicles have fuel economies in the
range of 5-6 litres/100km, increased uptake of existing technology will certainly assist
consumers to offset the impacts of sustained high fuel prices. Mopeds and motorcycles
provide even greater fuel economies and have indeed seen rapid growth in numbers in
the wake of recent fuel prices (MOT, 2008c).
Alternative transport fuels are also receiving increasing attention as a means to decouple
motorised travel from oil based transport fuels. These fuels include technologies such as
electric vehicles (EV), hydrogen fuel cells, and compressed air (MED, 2007b, MDI, 2008).
EV, particularly plug in hybrids are expected to be available to New Zealand consumers
within the next 5-10 years. Ministry of Transport (MOT) estimates that approximately 6%
of the vehicle fleet will be electric by 2028 (MOT, 2008c) – although recent high oil prices
may be expected to accelerate this uptake.
Aside from EV, hydrogen fuel cells and compressed air technology may allow for the
substitution of oil based transport fuels with electrical energy. Both technologies require
technological developments that are likely to limit their deployment within the timelines
considered in this study (MED, 2007b, MDI, 2007). Compressed air uses comparatively
more established technology than hydrogen fuel cells but further investment in research,

Managing transport challenges when oil prices rise
23
development, and distribution infrastructure is required before it will constitute a viable
alternative to internal combustion engines.
This report has not considered the effects of improved vehicle technology, primarily
because this is a market driven response over which government agencies - particularly
at the regional and local levels - have little influence. Should the uptake of improved
vehicle technology reduce the sensitivity of travel demands to high fuel prices then the
results of this report may need to be re-evaluated, particularly in regard to the sensitivity
of travel demands to higher fuel prices. It is noted, however, that the responses
identified in this report are designed to affect the use of vehicles per se, regardless of
what fuels them.
For this reason the recommendations contained in this report are considered to apply
independently of improvements in vehicle technology. In other words, the economic
benefits delivered by these measures means they are worth pursuing despite the
uncertainty surrounding future fuel prices and vehicle technologies.

2. Background
24
2. Background
Travel patterns describe the means and ways in which people, goods, and services are
moved around. This section provides a background to New Zealand’s current and
emerging travel patterns and quantifies their reliance on oil based transport fuels. This
section concludes with a list of key studies that have informed this research.
2.1 Current Travel Demands
Travel demands are generated by a variety of different users. Figure 2.1 outlines travel
demand categories and the transport modes typically associated with these categories.
The estimated mode share for each travel category is indicated in brackets, where mode
share is measured in passenger kilometres travelled (PKT).
Figure 2.1: Travel Demand Categories and Estimated Current Mode Share [PKT]
Derived from MOT (2008a) and MOT (2008c), with some rounding of results.
This research focuses primarily on the second and third tiers – that is, the split in travel
demands between light passenger vehicles, alternative modes, and commercial vehicles.
It is noted the mode share indicated above does not include kilometres travelled by air,
rail, or coastal shipping. Figure 2.2 illustrates per capita vehicle kilometres travelled
(VKT) in the period 2001-07, broken down between light passenger vehicles and
commercial vehicles. Total per capita travel increased from 9,250 to 9,500 VKT/year,
which equate to annual average growth of 0.5%. Total VKT on New Zealand’s road
network increased from 35 billion in 2001 to approximately 40 billion in 2007, at an
annual average increase of 1.9%. Light vehicle and commercial travel grew by 1.8% and
4.5% per annum respectively. This discrepancy in annual growth rates highlights the fact
that the travel demands associated with light passenger and commercial vehicles are
generated by different factors. This is discussed in more detail in Section 4.
Travel Demands
Passenger [86%] Commercial [14%]
Alternative Modes [6%]
Public transport
[4%]
Active Modes
[2%]
Light Vehicles [80%]
Heavy Truck Heavy Bus
[5%]
Light Commercial
[9%]
SOV [51%]
Bus [3%]
Rail [1%]
Walk [1.5%]
Cycle [0.5%]
Passenger [29%]

Managing transport challenges when oil prices rise
25
Figure 2.2: Total VKT 2001-07
0
1,000
2,000
3,000
4,000
5,000
6,000
7,000
8,000
9,000
10,000
2001 2002 2003 2004 2005 2006 2007
Pas
seng
er T
rave
l [V
KT
per c
apita
]
Passenger Commercial
Derived from MOT (2008c)
The MOT’s Household Travel Survey (HTS) provides information on time spent travelling
by all modes, which is summarised in Figure 2.3 in terms of passenger kilometres
travelled (PKT) travelled.
Figure 2.3: Per capita Travel by Alternative Modes 2007
0
100
200
300
400
500
600
700
800
900
Trav
el D
eman
ds [A
nnua
l pas
seng
er k
ilom
etre
s]
Bicycle
Train passenger
Walk
Bus passenger
Derived from (MOT, 2008a)
It is important to note that when discussing travel demands for vehicles the most
appropriate measure of demand is VKT, while for alternative transport modes the most

2. Background
26
appropriate unite of measurement is PKT. Figure 2.4 illustrates the breakdown of for
travel demands associated with for light passenger vehicles, commercial vehicles, and
alternative transport modes.
Figure 2.4: Total travel demands by mode in 2007
0
1,000
2,000
3,000
4,000
5,000
6,000
7,000
8,000
9,000
10,000
11,000
Trav
el D
eman
ds[K
ilom
etre
s tra
velle
d]
Alternative
Commercial
Light passenger
2.2 Trends in Passenger Travel
Figure 2.1 defines passenger travel as that undertaken by either light vehicles or
alternative modes. This section considers trends in passenger travel in more detail.
Mode share for the home to work journeys of the 15+ population is collected each census.
The 2006 census saw increases in the use of single occupant vehicles (SOV) and public
transport, with reduced levels of car-pooling, walking, and cycling. Of people who
travelled to work on census day, almost 79% drove SOV. Despite starting from a small
base, rail experienced the largest relative increase in mode share – a result that reflects
increased investment in Auckland’s rail network.
Due to its focus on home to work patterns the census is unlikely to reflect overall travel
patterns and, in particular, will underestimate the role of walking and cycling – much of
which is undertaken for education and recreational travel purposes. Other transport
surveys are able to supplement census data in this regard. The HTS shows a somewhat
lower vehicle mode share of 54% of all trip legs (MOT, 2008a). Both census and HTS
data indicates that private vehicle mode share increased from 1996-2006.
The HTS also provides insight into demographic factors affecting travel patterns: those
outside the 40-59 age group drive significantly less than average, while women are found
to drive significantly less than men in all categories. An ageing population may therefore

Managing transport challenges when oil prices rise
27
be expected to result in reduced demand for private vehicle travel (O'Fallon and Sullivan,
2003).
New Zealand’s per capita vehicle ownership rates increased steadily until 2005, since
which time they have increased more slowly (MOT, 2008c). A number of factors may
have contributed to this growth, including growth in disposable income, the high value of
the NZD, changes in vehicle licensing standards, and sustained low fuel prices. Figure 2.5
illustrates vehicle ownership rates in New Zealand per thousand people for the period
2001-07.
The slow down in growth since 2005 may reflect the fact that ownership is approaching
saturation (Dargay and Gately, 1999). Alternatively, higher fuel prices in 2006 may have
reduced the attractiveness of vehicles and the amount of disposable income available to
purchase them.
Figure 2.5: Rates of Vehicle ownership in New Zealand 2001-2007
600
625
650
675
700
725
750
2001 2002 2003 2004 2005 2006 2007
Vehi
cles
per
100
0 po
pula
tion
Source: MOT (2008c)
The distribution of vehicles by household is likely to have a major influence on the extent
to which increasing vehicle ownership generates additional vehicle travel. For example,
the impacts of a household moving from zero vehicle to one vehicle is likely to have a
larger influence on VKT than the impact of moving from one vehicles to two vehicles etc
(Corpuz, 2007). Analysis of census data reveals a steady decline in the percentage of
households without access to a vehicle – from 11.4% in 1996 to 7.8% in 2006. Figure
2.6 compares New Zealand’s vehicle ownership rate in 2004 to a range of other countries.

2. Background
28
Figure 2.6: International Comparison of Vehicle Ownership Rates 2004
200 300 400 500 600 700 800
United Kingdom
France
Austria
Malta
Switzerland
Australia
Germany
Canada
Iceland
Portugal
Italy
Luxembourg
New Zealand
Liechtenstein
USA
Source: MOT (2008c)
Despite historical growth in vehicle ownership, demographic trends towards an older and
increasingly urbanised population, high fuel prices, and more stringent safety and
environmental conditions on imported vehicles may suggest that historical growth is not
necessarily an indication of future trends. Moreover, historical growth in vehicle
ownership is likely to have been partially supported by underpriced vehicle travel,
particularly regulations and subsidies related to parking. This is discussed in more detail
in Section 5, but it is important to note at this point that a combination of factors may
that peak vehicle ownership will be reached in the near future.
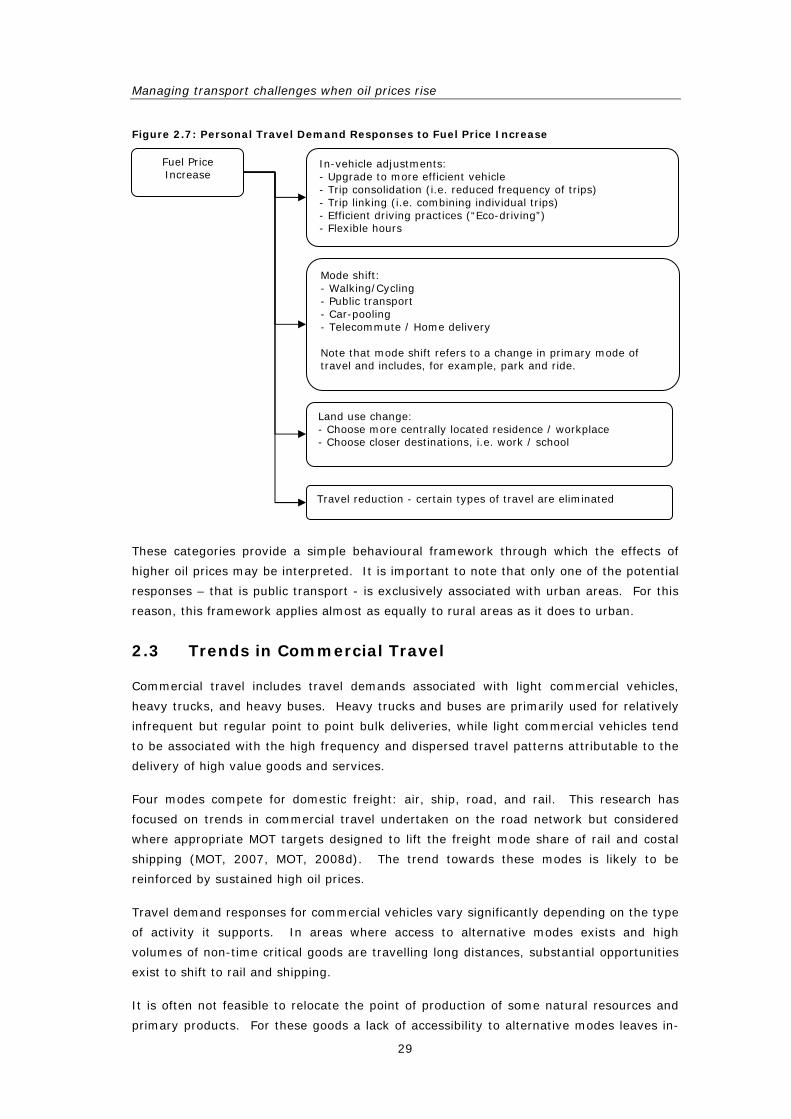
For the households that currently do have access to at least one vehicle, responses to
higher fuel prices are likely to fall within one of the following four categories: in-vehicle
adjustments; mode shift; land use changes; and travel reduction. These categories, and
examples of the types of responses they include, are illustrated in Figure 2.7.
Managing transport challenges when oil prices rise
29
Figure 2.7: Personal Travel Demand Responses to Fuel Price Increase
These categories provide a simple behavioural framework through which the effects of
higher oil prices may be interpreted. It is important to note that only one of the potential
responses – that is public transport - is exclusively associated with urban areas. For this
reason, this framework applies almost as equally to rural areas as it does to urban.
2.3 Trends in Commercial Travel
Commercial travel includes travel demands associated with light commercial vehicles,
heavy trucks, and heavy buses. Heavy trucks and buses are primarily used for relatively
infrequent but regular point to point bulk deliveries, while light commercial vehicles tend
to be associated with the high frequency and dispersed travel patterns attributable to the
delivery of high value goods and services.
Four modes compete for domestic freight: air, ship, road, and rail. This research has
focused on trends in commercial travel undertaken on the road network but considered
where appropriate MOT targets designed to lift the freight mode share of rail and costal
shipping (MOT, 2007, MOT, 2008d). The trend towards these modes is likely to be
reinforced by sustained high oil prices.
Travel demand responses for commercial vehicles vary significantly depending on the type
of activity it supports. In areas where access to alternative modes exists and high
volumes of non-time critical goods are travelling long distances, substantial opportunities
exist to shift to rail and shipping.
It is often not feasible to relocate the point of production of some natural resources and
primary products. For these goods a lack of accessibility to alternative modes leaves in-
Fuel Price Increase
Mode shift: - Walking/Cycling - Public transport - Car-pooling - Telecommute / Home delivery Note that mode shift refers to a change in primary mode of travel and includes, for example, park and ride.
Land use change: - Choose more centrally located residence / workplace - Choose closer destinations, i.e. work / school
In-vehicle adjustments: - Upgrade to more efficient vehicle - Trip consolidation (i.e. reduced frequency of trips) - Trip linking (i.e. combining individual trips) - Efficient driving practices (“Eco-driving”) - Flexible hours
Travel reduction - certain types of travel are eliminated

2. Background
30
vehicle efficiencies as the primary responses to mitigate higher fuel costs. Accessibility to
alternative modes is likely to be more adequately addressed at the regional level and is
thus not considered within the scope of this report.
Commercial travel demands are expected to be less sensitive to oil prices than light
passenger travel demands. This reflects the latter’s higher economic utility as well as the
fact that fuel represents only a small component of overall operating costs. Commercial
travel demands are thus more strongly linked to economic growth (Mackie et al., 2006).
This research has combined light commercial vehicles, heavy trucks, and buses. In
reality, light commercial vehicles are likely to exhibit price sensitivity somewhere between
light passenger vehicles and heavy vehicles. Commercial travel demand responses to
rising fuel prices are summarised in Figure 2.8. This is similar to that previously
considered for passenger vehicle.
Figure 2.8: Commercial Travel Demand Responses to Fuel Price Increase
Discussion of international freight movements is outside the scope of this report. Some
trends, however, are relevant to commercial travel undertaken on the road network.
High oil prices may be expected to give international shipping an increased price
advantage over air for the movement of non-time critical international freight. This is
likely to reinforce the importance of ports as the origin and destination of international
freight movements, as well as increase the importance of high capacity terminals able to
both physically accommodate and rapidly unload large ships.
High fuel prices may also drive consolidation in international freight movements around
fewer larger terminals located close to markets, increasing the potential benefits of
coordination, cooperation, and specialisation between individual port companies. In terms
of domestic shipping, where physical size and unloading capacities are possibly less
important, there may be a trend towards use of local ports.
Sustained high oil prices may have specific implications for major airports, which may be
expected to suffer from lower volumes of air passengers. Auckland International Airport,
for example, is the single largest traffic generator in the Auckland Region. For this reason
Fuel Price Increase
Mode shift to rail or coastal shipping
Land use changes: - Relocation, i.e. shift closer to market. - Restructuring, i.e. downsize distribution networks
In-vehicle responses: - Trip consolidation - Trip linking - Increased utilization and loading efficiencies
Travel Reduction

Managing transport challenges when oil prices rise
31
the travel demands in the south western sector of the region may be more sensitive to
sustained high fuel prices, all other things being equal.
2.4 Oil Intensity as a Benchmark
The term “oil intensity” is used to describe the quantity of oil based transport fuels
required to support certain travel patterns. Oil intensity combines data on mode share,
fuel economy, and travel distances into a simple measure of energy efficiency. The
individual oil intensity [IMode] for each mode is calculated as: IMode = MMode*FMode*DMode.
The total oil intensity [I] is then calculated by summing these individual oil intensities for
each mode. Travel by active modes, such as walking and cycling, do not rely on oil and
are thus excluded from this analysis; their ability to reduce oil intensity is implicitly
accounted for via mode share factor. Table 2.1 illustrates the individual oil intensities on
census data for 2006 and improvements in fuel economies.
Table 2.1: Oil Intensity [litres/trip] 20061
Parameter Mode
MMode [%] FMode [litres/km] DMode [km] IMode [litres/trip]
Car 51 0.108 9.11 0.50
Car passenger 30 0.058 11.2 0.19
Bus 3 0.046 11.7 0.02
Train 1 0.015 29.4 0.00
Derived from: MOT (2008a), MED (2006), Kenworthy (2003)
The total oil intensity [I] therefore is equal to the sum of the final column in Table 2.1, or
0.71 litres/trip. This analysis highlights that improvements in energy efficiency arise in
one of the following three ways:
• Increased uptake of energy efficient travel modes, such as bus and train;
• Improved fuel economy; and
• Reduced travel distances.
Technological improvements are expected to be driven by the private sector, where social
preferences and energy prices are expected to be key factors. These improvements are
likely to be driven by international factors more than local policy. For this reason the
focus of this report is on those areas where government agencies, particularly at the
regional and local levels, may affect energy efficiency. This lends itself to a focus on
1 It is important to draw a distinction between average and marginal oil intensities. Average values represent the fuel consumed divided by the total passengers travelled, whereas marginal values represent the fuel consumed for each additional trip. Table 2.1 presents average values, which are typically greater than marginal values. Shared modes, such as bus and train, are likely to have extremely low marginal values – as most of the fuel consumed is associated with vehicle operation rather than the weight of additional passengers.

2. Background
32
facilitating uptake of energy efficient modes and encouraging locational decisions that
lead to reduced travel distances.
HTS data indicates that the average person undertakes approximately 1500 trips per
year. Combining this figure with the oil intensity calculated previously (0.71*1500)
suggests that approximately 1,000 litres of oil-based petroleum fuels are required to
support the travel patterns of the average New Zealander per year.
In the year to the June 2008, average petrol prices rose from $1.51 to $2.11 per litre.
Assuming an own-price elasticity of fuel consumption with respect to price of -0.15 in the
short term, recent price rises have cost the average person just over $400 per year all
other things being equal (Kennedy and Wallis, 2007).
Urban areas that are characterised by access to multi-modal transport systems, mixed
land use patterns, and younger populations are likely to be less vulnerable to rising oil
prices. In contrast, vehicle dependent rural areas that support older populations are
likely to consume more energy for transport purposes. Table 2.2 illustrates the oil
intensity for the Bay of Plenty (BOP), Wellington, and Otago regions based on home to
work mode share data from the 2006 census.
Table 2.2: Regional and Local Oil Intensities 2006
National BOP Wellington Otago
Oil Intensity 0.71 0.74 0.53 0.61
% Difference - 5% -25% -14%
Table 2.2 reveals how Wellington and Otago, with their high alternative mode share, have
oil intensities 25% and 14% lower than the national average respectively. BOP supports
active mode share far less than Wellington and Otago, despite enjoying a more hospitable
climate, such that its oil intensity is higher than the national average.
The socio-economic burden of higher oil prices is expected to vary in relation to travel
patterns and household income. Dodson and Spie (2006) suggest that these factors are
correlated – such that areas with more oil intensive travel patterns also tend to have
lower disposable income. Further research could investigate these local variations in
more detail, identifying those areas at greatest risk from sustained high fuel prices.
2.5 Summary of Key Texts
Key texts that have informed this research are summarised in Table 2.3. More detailed
information on these texts is contained in the references to this report.

Managing transport challenges when oil prices rise
33
Table 2.3: Summary of Key Texts
Document Relevant Fields
Reference Title Energy Economics Transport Planning
Context Notes
IEA (2007) World Energy Outlook 2007 – China and India Insights Global IEA assessment of global energy outlook with particular focus on trends in China and India.
EWG (2007) Crude Oil – The Supply Outlook Global Provides a conservative perspective on trends in oil discovery and production.
IEA (2008) Medium Term Oil Market Report Global Discusses the confluence of factors that have contributed to recent prices and identifies how these factors may track over the medium term.
CSIRO (2008) Fuel for Thought: The future of Transport Fuels – Challenges and Opportunities Australia Models peak oil and technology scenarios so as to inform planning and policy decisions.
MED (2007b) New Zealand Energy Strategy to 2050 – Powering our Future Local Outlines the Government’s energy vision for New Zealand and discusses anticipated energy efficiency gains in the transport sector.
Dantas et al (2007) Energy Risk to Activity as a Function of Urban Form Local Quantifies the ability of several land use patterns to sustain travel demands in an energy constrained situation.
IEA (2005) Saving Oil in a Hurry Global Analyses the potential for saving oil using a variety of demand management responses.
Ewing et al (2007) Growing cooler the evidence on urban development and climate change Global Investigates relationships between climate change, land use, and travel demands and identifies the potential for a combination of pricing and land use mechanisms to reduce travel demands.
Levinson and Krizek (2008)
Planning for Place and Plexus – Metropolitan Land Use and Transport Global Challenges current transport and land use planning policies within a neo-classical economic
framework – provides examples of market failures and auto-catalytic2 processes.
Litman (2006b) Win-win Transportation Solutions – Mobility Management Strategies that Provide Economic, Social, and Environmental Benefits Global
Evaluates various demand side management transportation strategies within a comprehensive multi-criteria framework.
Litman (2007a) Market Principles - TDM Impacts on Market Efficiency and Equity
Global
Discusses the principles of an efficient market and how they relate to various travel demand management strategies.
Shoup (2005) The High Cost of Free Parking Global Highlights the inefficiencies associated with current parking management practices – in particular minimum parking requirements and the provision of free-parking.
Genter (2007) Economic evaluation and transport planning in New Zealand: assessing all potential costs of new motorway projects in the Auckland Region Local
Investigates the application of Land Transport New Zealand’s EEM to a state highway project and considers areas where costs may not be adequately evaluated.
Jakob et al (2006) Transport cost analysis: a case study of the total costs of private and public transport in Auckland Local
Compares the cost ($ per km) associated with private vehicle and public transport in Auckland, highlighting the large external costs borne by society to support vehicle travel in urban areas.
Dodson and Spie (2006)
Suburban Shocks: Assessing Locational Vulnerability to Rising Household Fuel and Mortgage Interest Costs Australia Analyses economic and travel data to identify areas with high vulnerability to increasing oil prices.
2 Auto-catalytic processes are also known as ‘positive feedback loops’ – they are self-reinforcing effects that are typical of complex and unstable systems, such as transport and land use.
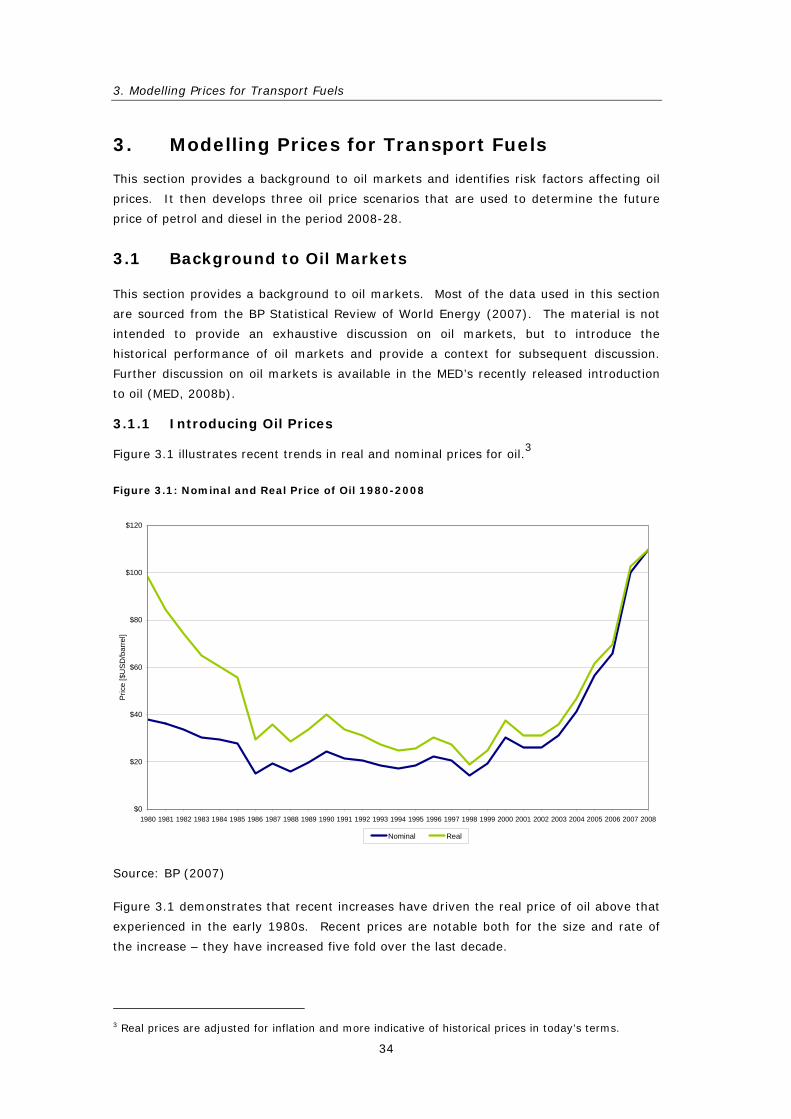
3. Modelling Prices for Transport Fuels
34
3. Modelling Prices for Transport Fuels
This section provides a background to oil markets and identifies risk factors affecting oil
prices. It then develops three oil price scenarios that are used to determine the future
price of petrol and diesel in the period 2008-28.
3.1 Background to Oil Markets
This section provides a background to oil markets. Most of the data used in this section
are sourced from the BP Statistical Review of World Energy (2007). The material is not
intended to provide an exhaustive discussion on oil markets, but to introduce the
historical performance of oil markets and provide a context for subsequent discussion.
Further discussion on oil markets is available in the MED’s recently released introduction
to oil (MED, 2008b).
3.1.1 Introducing Oil Prices
Figure 3.1 illustrates recent trends in real and nominal prices for oil.3
Figure 3.1: Nominal and Real Price of Oil 1980-2008
$0
$20
$40
$60
$80
$100
$120
1980 1981 1982 1983 1984 1985 1986 1987 1988 1989 1990 1991 1992 1993 1994 1995 1996 1997 1998 1999 2000 2001 2002 2003 2004 2005 2006 2007 2008
Pric
e [$
US
D/b
arre
l]
Nominal Real
Source: BP (2007)
Figure 3.1 demonstrates that recent increases have driven the real price of oil above that
experienced in the early 1980s. Recent prices are notable both for the size and rate of
the increase – they have increased five fold over the last decade.
3 Real prices are adjusted for inflation and more indicative of historical prices in today’s terms.

Managing transport challenges when oil prices rise
35
The annual average prices illustrated above obscure significant short term variability that
characterises oil prices (Krichene, 2008). This variability is primarily a reflection of low
supply and demand elasticities. In other words, there is little leeway to increase or
reduce oil production in response to changes in demand such that price becomes the
primary mechanism for controlling demand at a level commensurate with product
availability.
Demand is also relatively slow to respond to respond to price because much of the
equipment that depends on oil is sunk. High prices also indicate a high willingness to
pay; oil is required for the production of a number of high value products, such as
transport fuels, plastics, pharmaceuticals, and fertilisers. Consumers of such value added
products are willing to pay high prices in times of resource scarcity.
Oil prices are therefore set within a market characterised by producers and consumers
that are relatively insensitive to price. This on its own would be expected to result in
large prices swings, but added volatility is introduced by unforeseen events, such as
geopolitical uncertainties, that unexpectedly disrupt supply chains. More detailed
discussion on these events is provided in Section 3.2.
3.1.2 Demand
The demand for crude oil for the period 1980-2006 is illustrated in Figure 3.2. This shows
demand declining in the first half of the 1980s in response to the oil shocks of the late
1970s and early 1980s. From this point, demand has grown steadily to reach
approximately 85 million BPD in 2006.
Figure 3.2: Total demand for crude oil 1980-2006
0
10
20
30
40
50
60
70
80
90
1980 1981 1982 1983 1984 1985 1986 1987 1988 1989 1990 1991 1992 1993 1994 1995 1996 1997 1998 1999 2000 2001 2002 2003 2004 2005 2006
Dem
and
[Milli
on B
PD
Source: BP (2007)

3. Modelling Prices for Transport Fuels
36
Looking ahead the IEA expects demand for oil to grow from 86 million BPD to
approximately 96 million BPD by 2012. This represents an average annual growth rate of
just over 2%. Demand growth has increasingly been driven by developing countries,
such as India, China, and the Middle East. This growth is not solely the product of
economic development but also a result of price controls and subsidies that shield
consumers from increases in fuel prices, at least in the short term (IEA, 2008). In
economic terms, this means that the drivers of marginal demand growth are effectively
decoupled from prices, such that the swings required to manage the market (i.e. supply
and demand) are that much more brutal.
Rapid demand growth in developing countries has occurred in tandem with shifts in
demand towards lighter, more intensively processed products, such as transport fuels
(IEA, 2008). Increased demand for lighter oil products has coincided with laggard growth
in production from conventional oil sources, requiring increased production from
unconventional and heavier oil sources. Thus demand and supply for refined oil products
is diverging, placing additional pressure on the supply chain, which are discussed in more
detail in the following section.
3.1.3 Supply
Supply is used to define both the production (discovery and extraction) and processing of
oil products.
Oil supply is typically broken into conventional, unconventional, and synthetic sources.
Unconventional sources include oil produced from oil sands, heavy oil, and oil shale, while
synthetic fuels includes coal liquefaction, gas to liquids, and bio-fuels. A plateau in
production from conventional sources has seen the role of the swing producer shift to
unconventional and synthetic sources (IEA, 2008).
Production costs associated with unconventional and synthetic oil are substantially higher
than that of conventional oil, particularly if carbon emission charges are included (Birol
and David, 2001, MED, 2007a). Industry data suggests that production costs have
increased substantially in recent times with the price required to provide return on
investment rising steadily from approximately $20 USD/barrel in 2000 to approximately
$90 USD/barrel in 2008 (EIA, 2008a, Goldman-Sachs, 2008).
Not only are the costs of oil production increasing, but spare capacity within the oil supply
chain is tight by historical standards. Research by Goldman Sachs (2008) indicates that
the immediately deliverable spare capacity of OPEC is expected to remain at
approximately 2 Million Barrels Per Day (MBPD) until 2010 – in comparison to the average
of 6 MBDP spare capacity that existed during the 1980s and 1990s. The already limited
supply response is therefore pushing up against the physical limitations of the supply
chain. In other words, the ability to pump more oil is even tighter than normal.
The risk posed by tight supply chains is noted by the IEA in their World Energy Outlook
2007:
Although new oil-production capacity additions from greenfield projects are
expected to increase over the next five years, it is very uncertain whether they will

Managing transport challenges when oil prices rise
37
be sufficient to compensate for the decline in output at existing fields and keep
pace with the projected increase in demand. A supply-side crunch in the period to
2015, involving an abrupt escalation in oil prices, cannot be ruled out (IEA, 2007).
This warning reinforces the fact that resource availability is not equivalent to product
availability – especially given the restricted markets within which a large proportion of the
world’s oil is produced. Various risk factors that affect oil supplies are discussed in more
detail in Section 3.2. The following section discusses the issue of resource availability in
more detail.
3.1.4 Reserves
Approximately 1 Giga Barrels (GB) of oil has been produced thus far, with another 1-2GB
of conventional oil sources remaining (MED, 2007a). Proved reserves are defined as the
amount of oil that is economic to extract using existing technologies. Figure 3.3 indicate
that proved reserves have increased since 1980, although recently appear to have
reached a plateau.
Figure 3.3: Proved Reserves 1980-2006
0.0
0.2
0.4
0.6
0.8
1.0
1.2
1.4
1980 1981 1982 1983 1984 1985 1986 1987 1988 1989 1990 1991 1992 1993 1994 1995 1996 1997 1998 1999 2000 2001 2002 2003 2004 2005 2006
Pro
ved
Res
erve
s [G
iga
barr
els]
Source: BP (2007)
It is worth distinguishing between proved reserves and ultimately recoverable reserves
(URR). The latter describes, quite simply, the amount of oil considered to exist in the
ground that is able to be recovered and produced. This includes unconventional sources,
such as oil sands, heavy crude, and oil shales. Studies have indicated that URR may be
up to five times greater than proved reserves – approaching 5-6GB (SAUNER, 2000, MED,
2007a).
Thus URR are an effective upper bound on total oil production, while proved reserves
represent what is known to exist and feasible to extract under current conditions. Over

3. Modelling Prices for Transport Fuels
38
time, the amount of oil that becomes proved reserves may be expected to increase until
URR is reached. Estimates of URR are, of course, highly uncertain. There is no way to
know how much oil is in the ground without actually drilling for it.
It is noted that the accuracy of the proved reserves illustrated in Figure 3.3 is highly
disputed. Some commentators have questioned the validity of rapid increases in proved
reserves attributed to OPEC states in the mid 1980s (ASPO, 2008). These commentators
stress that OPEC’s production quota system provides incentives for member countries to
over-represent their proved reserves; countries with declining proved reserves may
expect a reduction in production quota and subsequent reduction in oil revenues. These
commentators note that the quota system was established in 1983, immediately prior to
the rapid increases in stated reserves evident in the mid-1980s.
There may be other incentives for oil producing countries to overstate their proved
reserves – major investment decisions require some degree of certainty of resource
availability. Awareness of lower reserves and/or limited supply may catalyse increased
technological efficiencies and/or substitution that would serve to reduce long term
demand and thereby weaken the economic position of oil producing countries. In this
situation, oil producing countries may indeed have an interest in blaming high prices on
external factors (such as speculation) rather than internal resource or production
limitations that would tend to result in more enduring market responses. The lack of
commercial transparency surrounding the activities of OPEC’s national oil companies
mean that uncertainty over the accuracy of proved reserves is likely to persist as a major
upside risk.
Should OPEC’s proved reserves be found to be lower than stated there will be a need for
more rapid ramp up in production from unconventional and synthetic sources; whether
such a ramp up is feasible remains to be seen.
3.1.5 Summary of Oil Markets
Previous sections have provided a brief background to the key factors driving oil prices in
recent times. It has highlighted the importance of:
• Low short term elasticities of supply and demand, which are structural realities of
international oil markets and the main driver of large short term price movements;
• Demand growth that is both accelerating and shifting, placing pressure on the
capacity of the oil industry to produce and process the volumes that are required;
• Static production from conventional sources has resulted in that marginal demand
being increasingly met by more expensive unconventional and synthetic oil sources;
• Higher supply costs associated with unconventional and synthetic sources mean that
high prices are required to provide return on investment (Goldman-Sachs, 2008); and
• Proved reserves appear sufficient in the short to medium term, although there are
risks over the veracity of OPEC reserves.

Managing transport challenges when oil prices rise
39
The recently released Medium Term Oil Market Report from the IEA summarises the
outlook as follows (IEA, 2008):
Despite a considerable downward revision to our global oil demand forecast due to
weaker economic growth projections and a doubling of oil prices over the past year,
structural demand growth in developing countries and ongoing supply constraints
continue to paint a tight market picture over the medium term. Oil demand
remains concentrated in developing economies, with 90% of the growth spread
between Asia, South America and the Middle East, reflecting the improving wealth
and accelerating energy use in several high-population countries. In spite of a
considerable increase in investment, non-OPEC crude supply will remain at or below
39 mb/d over the next five years, with the majority of the 1.2 mb/d of non-OPEC
liquids growth coming from NGLs, condensates and biofuels. Refining investments
continue apace, but with costs doubling over the past five years, planned
expansions are put under regular financial scrutiny and projects are subject to
ongoing slippage and are vulnerable to changes in refining margins. As such, with
48% of global product demand growth over the next five years concentrated in
middle distillate fuels, generating sufficient product to meet demand will continue to
be a challenge. Further, investment in upgrading capacity will lead to tighter fuel
oil markets and will expose the heavy end of the barrel to strong additional
pressures from tight LNG and coal markets.
Poor supply-side performance since 2004, in the face of strong demand pressures
from developing countries, has forced oil prices up sharply to curb demand. These
pressures have been exacerbated by refinery tightness, which limits the flexibility of
the industry to meet the structurally strong demand growth for middle distillate
fuel. While recognising that speculation can have a day-to-day impact on price
moves, the fact that all producers are working virtually flat out and that there is no
sign of any abnormal stock-build gives a strong indication that current oil prices are
justified by fundamentals. Similarly, while high forward prices may reflect concerns
about peak oil or sustained demand growth, they too could only impact spot prices
if they started to create a forward price premium sufficient to encourage stock-
building.
For this reason there would appear to be a number of market factors that point towards a
risk of sustained high oil prices, particularly in the short to medium term. Other more
pervasive risk factors are discussed in more detail in the following section.
3.2 Risk Factors
A number of factors may affect the supply and demand for oil at any point in time. Some
of these are internal to oil markets while other risks are more pervasive, and reflect the
uncertainties associated with the discovery, extraction, production, processing, and
delivery of a valuable resource in challenging natural and political environments. These
uncertainties are referred to in this report as “risk factors.”

3. Modelling Prices for Transport Fuels
40
Table 3.1 outlines risk factors, identifies their various components, and discusses
instances when they may arise. Table 3.2 then outlines examples of historical events that
have caused supply disruptions, including the magnitude of the disruption and estimates
of the subsequent impacts on price.
"Supply disruption" generally refers to a loss of oil from a particular country or group of
countries relative to a preceding month or months. The full extent and impact of a
disruption or loss depends on a variety of factors, including replacement production from
other, unaffected, countries; the level of oil inventories; and level and growth rate of
demand. Definitions of "oil supply disruptions" are not entirely consistent from one case
to the next, in part due to differing views of such events over time and amongst analysts.

Managing transport challenges when oil prices rise
41
Table 3.1: Risk factors
Factor Component Discussion Examples
Stability of oil producing nations
Political insecurity arising from instances of coups and civil unrest. This may be self-reinforcing, in that rising oil prices inflate food/energy prices and thereby further increase instability within oil producing countries.
Strikes in Venezuela 2003, unrest in Iran and Indonesia
Security of oil producing facilities
Potential attacks (successful or otherwise) from disaffected groups may target vulnerable links in oil supply chain. Unrest in Iraq
Hegemonic Adventurism Increasing tendency for states to undertake aggressive international actions to secure access to oil resources, from which the ensuing war/occupation may destabilise oil production.
US Occupation in Iraq
Embargos and Sanctions Foreign policy tensions may see an oil producing state retaliate with embargoes on oil exports. Iran Oil Embargo
Ethnic conflicts and strife Internal ethnic disagreements over the control of oil production and the resulting revenues may disrupt activities. Niger Delta
Geo
stra
tegic
Unce
rtai
nties
Natural disasters and accidents
Natural events, such as earthquakes and hurricanes, have the potential to disrupt oil production and distribution. Accelerating global warming and increased reliance on off-shore oil production may increase vulnerability to these events.
Hurricane Katrina
Domestic policy Countries with regulated energy markets, balance of payments shortfalls, or high levels of subsidies for oil and gas, may be vulnerable to rapid changes in the price of oil and internal policies. Resource nationalism threatens to restrict the amount of oil flowing to international markets
Oil subsidies in China, India, Indonesia, and Malaysia
Spare capacity of oil producing counties
Ability and willingness of oil producing countries to balance the market in response to fluctuations in supply and demand OPEC resistance to raising production in face of higher prices
Increasing costs of production
Production cost estimates are dated and do not account for costs associated with the advanced technologies and oil recovery techniques required to find and uplift oil from difficult locations, as discussed in Section 3.4.2.
Deep sea oil rigs have 4-5 times higher operating costs
Investment in sustaining and expanding production
Oil producing nations may not invest sufficient amounts in exploration and new production capacity. The dissemination of best practice production methods is also slower to infiltrate countries with insular oil industries.
Iran and Kuwait
Investment in sustaining and expanding processing
Appropriate mix of investment in processing capacity will shift as reliance on unconventional oil increases. Investment in refineries usually incurs a 3-5 year time lag before additional capacity comes on stream.
Current diesel prices are driven by lack of investment in diesel refining capacity
Uncertainty reduces investment
Infrastructure required to find, drill, produce, refine, and distribute oil products is typically long lived and uncertainty over future production may reduce willingness to invest in oil infrastructure.
Inve
stm
ent
Fact
ors
Supply and demand Alternative energy sources of energy may substitute demand for oil, but time lags, investment costs, and delivery prices are uncertain. EV and unconventional oil sources
True nature of reserves Incentives for individual OPEC countries to inflate proved reserves to secure production quota and sustain perception of long term oil supply. Non-backdated reserve history may overstate proved reserves.
Spikes in known reserves in OPEC post 1983 quota system cause erroneous predictions of peak oil production date by IEA and USGS
Technological challenges Ageing oil fields may suffer from higher water cuts and an inability to use vertical wells while enhanced Oil Recovery techniques may or may not result in desired production efficiencies.
North Sea and Mexico
Super-giant fields Approximately 50% of total oil production is derived from ageing super-giant and giant fields discovered in the 1950s. Recent discoveries are supplements to, rather than substitute for, these fields. Failure to replace these fields may predicate an earlier peak than otherwise expected.
Gharwar
Rate of decline in peaked fields
Uncertainty in field behaviour post peak production. Rate of decline may observe geometric or linear profiles. USA production declined approximately 8% per annum following 1970 peak while North Sea has seen a 14% decline rate
Nat
ure
of
Res
ourc
e Ris
ks
Exploration coverage Major areas of the world's potential oil producing regions remain largely unexplored, although recent estimates indicate the Arctic may hold only 3 years worth of additional supply.
Arctic and Siberia
Adapted from Cordesman and Al-Rodhan (2005) and Vail (2007).

3. Modelling Prices for Transport Fuels
42
Table 3.2: Historical influences of non-economic risks (EIA, 2008b, EIA, 2008a)
Risk
Date Duration [months]
Average Gross Supply
Shortfall [Million BPD]
% of World Production
Price Increase
[%]
Price Increase
[2008USD]
Reason for Oil Supply Disruption
Factor Component
Notes
3/73-5/73 2 0.5 0.0% 0.0% $0.00 Unrest in Lebanon; damage to transit facilities
Geostrategic Uncertainties
Stability of oil producing nations and Security of oil producing facilities
Saudi Price fixed, not part of spot market yet.
10/73-3/74 6 2.6 4.7% 364.8% $44.90 October Arab-Israeli War; Arab oil embargo
Geostrategic Uncertainties
Stability of oil producing nations and Embargos and Sanctions
4/76-5/76 2 0.3 0.5% -1.8% -$0.93 Civil war in Lebanon; disruption to Iraqi exports
Geostrategic Uncertainties
Ethnic conflicts and strife and Security of oil producing facilities
01/05/77 1 0.7 1.2% 2.4% $1.21 Damage to Saudi oil field
Geostrategic Uncertainties
Security of oil producing facilities
11/78-4/79 6 3.5 5.7% 14.2% $6.65 Iranian revolution Geostrategic Uncertainties
Stability of oil producing nations
10/80-12/80 3 3.3 5.8% 0.6% $0.56 Outbreak of Iran-Iraq War
Geostrategic Uncertainties
Stability of oil producing nations
06/90-10/90 5 1.8 3.0% 91.6% $27.73 Iraq invades Kuwait Geostrategic Uncertainties
Hegemonic Adventurism
Not on EIA list of disruptions
12/02-2/03 3 2.1 3.1% 34.6% $10.82 Venezuela strikes and unrest.
Economic Factors
Domestic policy
Venezuelan total oil production fell from 3.3 MBPD in November 2002 to less than 700,000 barrels per day in January 2003, increased to 2.6 MBPD in March 2003, and has now stabilized at around 2.8 MBPD. Although Venezuelan output has not returned to pre-strike levels, for purposes of this table the "disruption" period is defined as the period between December 2002 and February 2003, when the crisis was at its peak.
3/03-12/03 8 1.1 1.7% -10.9% -$4.59 Iraq Occupation & Nigeria unrest.
Geostrategic Uncertainties
Hegemonic Adventurism and Ethnic conflicts and strife
Iraq Occupation. (10 mo.) Combined with the shorter (6 mo.) disruption to Nigerian output, the effect was actually that of a modest linear recovery from the Venezuelan strikes, leading to price drops as Iraqi production gradually recovered. The next sequence is a similar combination of Iraqi and Nigerian unrest. Also note that Saudi Arabia boosted production by 0.5 MBPD in parallel with the invasion, substantially replacing the short term losses from Iraq.
10/04 1 0.06 0.0% 14.0% $6.64 Hurricane Ivan Geostrategic Uncertainties
Natural disasters and accidents
1/04-5/08 53 0.06 0.1% 182.9% $15.78 Continued Iraq and Nigerian unrest.
Geostrategic Uncertainties
Hegemonic Adventurism and Ethnic conflicts and strife
Combining the surpluses and shortfalls of Iraqi and Nigerian production since the end of the initial Iraqi conflict against their respective recent historical averages reveals that there has been in fact a negligible shortfall in production, despite what the EIA reports. Often the EIA figure is a shortfall measured against capacity rather than against any historical production level. This clearly indicates that supply from Iraq and Nigeria in particular does not underlie the dramatic price increases since 2004.
5/05-07/08 ? ? 0.0% 6.1% $57.00 Temporary World Production Plateau
Nature of Resource Risks
Production uncertainties
Work is pending regarding the predicted demand versus the actual production. (Failure of market expectations causing steady price rises, rather than declaring any kind of peak.) This data exists from the IEA.
Totals 424 $8.19 Average risk premium
Excludes temporary world production plateau
Managing transport challenges when oil prices rise
43
Note the average risk premium is calculated by taking the sum of the products of the
“Duration” and “Price Increase” columns, divided by the number of months affected by
the events, i.e. 424, resulting in a risk premium of $8.19 USD/barrel. The average real
price for oil over the period considered was $45.50, which suggests such events have
added an 18% premium to average oil prices in the period considered.
How this risk premium tracks in the future is not immediately apparent. It is clear that
the vast majority of actual and potential supply of oil has been effectively nationalised by
or is owned by national oil companies of countries whose governments view oil through a
strategic and political lens. In such an environment, oil prices may be expected to be
more volatile and attract a higher premium than in the past.
3.3 Modelling Future Oil Prices
Future oil prices were modelled on the basis of several oil price forecasts. The model is
referred to as the “Meta Model” – where Meta refers to the fact that it generates future
price projections on the basis of a number of individual forecasts, including:
• NYMEX (NYMEX, 2008);
• Goldman Sachs (Goldman-Sachs, 2008);
• EIA (EIA, 2007);
• MED (MED, 2006);
• CSIRO (CSIRO, 2008); and
• LOPEX (Rehrl and Friedrich, 2005).
It is noted that the assumptions and methodology underlying these forecasts is not
necessarily transparent – only the CSIRO and LOPEX forecasts discuss their methodology
and assumptions, which restricts the ability to evaluate their robustness. For this reason
the Meta Model is based on a Monte Carlo simulation that moulds individual forecasts into
a statistically representative distribution of prices over time. The advantage of this
approach is that it considers all the information associated with the individual forecasts,
but gives the most weight to prevailing trends. It also provides insight into extreme
possible price scenarios that may eventuate under rare circumstances.
Recent experience has demonstrated the uncertainty around oil price forecasts. For
example, the US Energy Information Administration's official 2007 prediction indicated
that even in the high-price scenario, oil prices would not exceed $100 USD/barrel until
2030, and in early 2008 predicted that oil prices would not exceed $100 USD/barrel until
2018 (EIA, 2007). Forecasters seem to predict on a “business as usual” basis – various
risk factors (summarised in the previous section) do not appear to be accounted for even
though they clearly have a significant effect on the price.
Recently there has been a shift from forecasts that assume a sufficient supply of oil in the
long term to those that explicitly model known reserves, discovery, and depletion. The

3. Modelling Prices for Transport Fuels
44
older forecasts often have a mean-reverting shape, while the newer ones have price
profiles that seem to increase exponentially – their modelling of the substitution of oil
with new technology tends to be limited. The notable exception is the CSIRO forecast
which combines a conservative supply side picture (i.e. peak oil perspective) with an
optimistic demand side response (i.e. fast rate of technological substitution). This
produces a relatively peaked price forecast that contrasts with others in the sample.
The forecasts listed above vary in their predictions of the price of oil in 2028 from a low of
$70 USD/barrel to a high of $240 USD/barrel. Goldman Sachs predicts oil at $120
USD/barrel by 2010; the EIA 2008 forecast, made in late 2007, never has the price
exceeding $90 USD/barrel (EIA, 2007, Goldman-Sachs, 2008). Naturally the accuracy of
the individual forecasts may be expected to reduce at longer time periods. This means
that the variation, or error, between the predicted price and the actual price is likely to
increase the further into the future one predicts. The results of the Meta Model should be
interpreted accordingly, with a greater emphasis placed on the near term price
projections.
The Meta Model generates annual prices and is therefore not intended to provide an
indication of short term price variability. Further research could seek to quantify this
short term variability in the context of the overall annual trends generated by the Meta
Model (Krichene, 2008). Intuitively, high prices are likely to be causally linked to
variability, which may increase the difficulties associated with understanding demand
response. The individual forecasts and the “Average” price projection are illustrated in
Figure 3.4, with adjustments for global consumer price inflation and different grades of
crude oil made to the individual forecasts as required (IMF, 2008). More technical
discussion on the methodology underlying the Meta Model is contained in Appendix C.
Figure 3.4: Oil Price Forecasts 2007-2028
$0
$25
$50
$75
$100
$125
$150
$175
$200
$225
$250
2008 2009 2010 2011 2012 2013 2014 2015 2016 2017 2018 2019 2020 2021 2022 2023 2024 2025 2026 2027 2028
Pric
e [2
008U
SD/b
arre
l]
NYMEX
Goldman Sachs
EIA
MED
CSIRO
LOPEX
Average
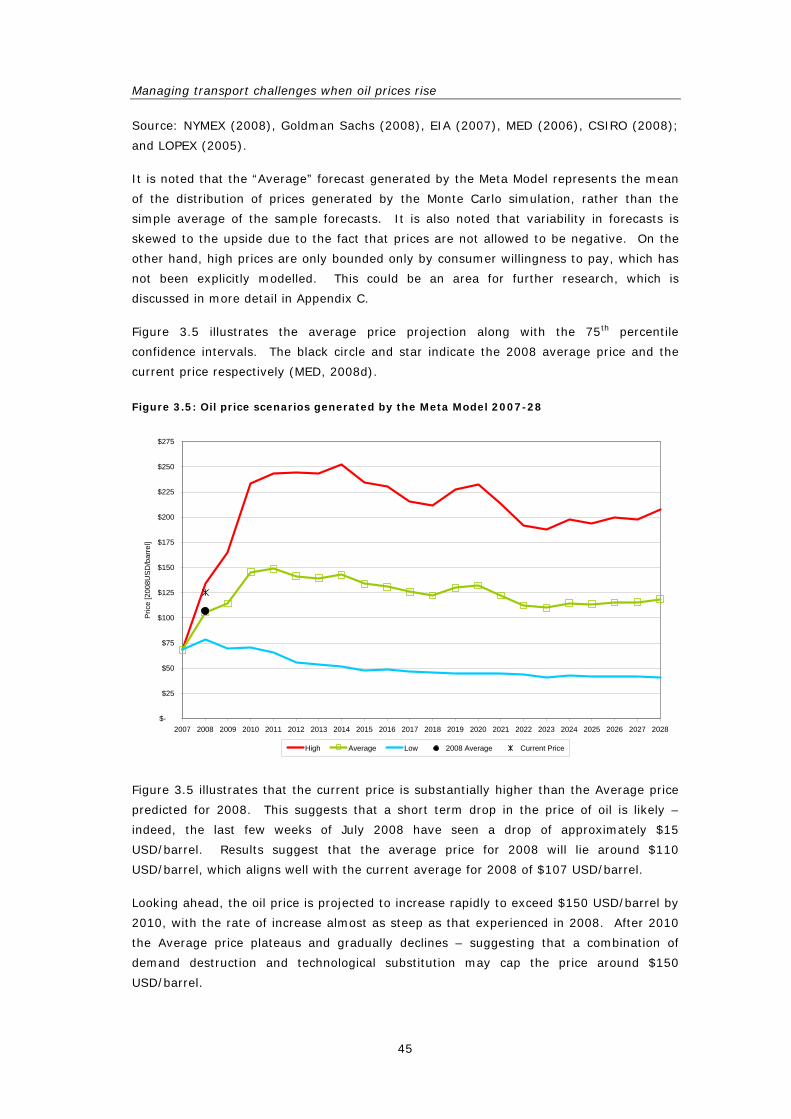
Managing transport challenges when oil prices rise
45
Source: NYMEX (2008), Goldman Sachs (2008), EIA (2007), MED (2006), CSIRO (2008);
and LOPEX (2005).
It is noted that the “Average” forecast generated by the Meta Model represents the mean
of the distribution of prices generated by the Monte Carlo simulation, rather than the
simple average of the sample forecasts. It is also noted that variability in forecasts is
skewed to the upside due to the fact that prices are not allowed to be negative. On the
other hand, high prices are only bounded only by consumer willingness to pay, which has
not been explicitly modelled. This could be an area for further research, which is
discussed in more detail in Appendix C.
Figure 3.5 illustrates the average price projection along with the 75th percentile
confidence intervals. The black circle and star indicate the 2008 average price and the
current price respectively (MED, 2008d).
Figure 3.5: Oil price scenarios generated by the Meta Model 2007-28
$-
$25
$50
$75
$100
$125
$150
$175
$200
$225
$250
$275
2007 2008 2009 2010 2011 2012 2013 2014 2015 2016 2017 2018 2019 2020 2021 2022 2023 2024 2025 2026 2027 2028
Pric
e [2
008U
SD
/bar
rel]
High Average Low 2008 Average Current Price
Figure 3.5 illustrates that the current price is substantially higher than the Average price
predicted for 2008. This suggests that a short term drop in the price of oil is likely –
indeed, the last few weeks of July 2008 have seen a drop of approximately $15
USD/barrel. Results suggest that the average price for 2008 will lie around $110
USD/barrel, which aligns well with the current average for 2008 of $107 USD/barrel.
Looking ahead, the oil price is projected to increase rapidly to exceed $150 USD/barrel by
2010, with the rate of increase almost as steep as that experienced in 2008. After 2010
the Average price plateaus and gradually declines – suggesting that a combination of
demand destruction and technological substitution may cap the price around $150
USD/barrel.
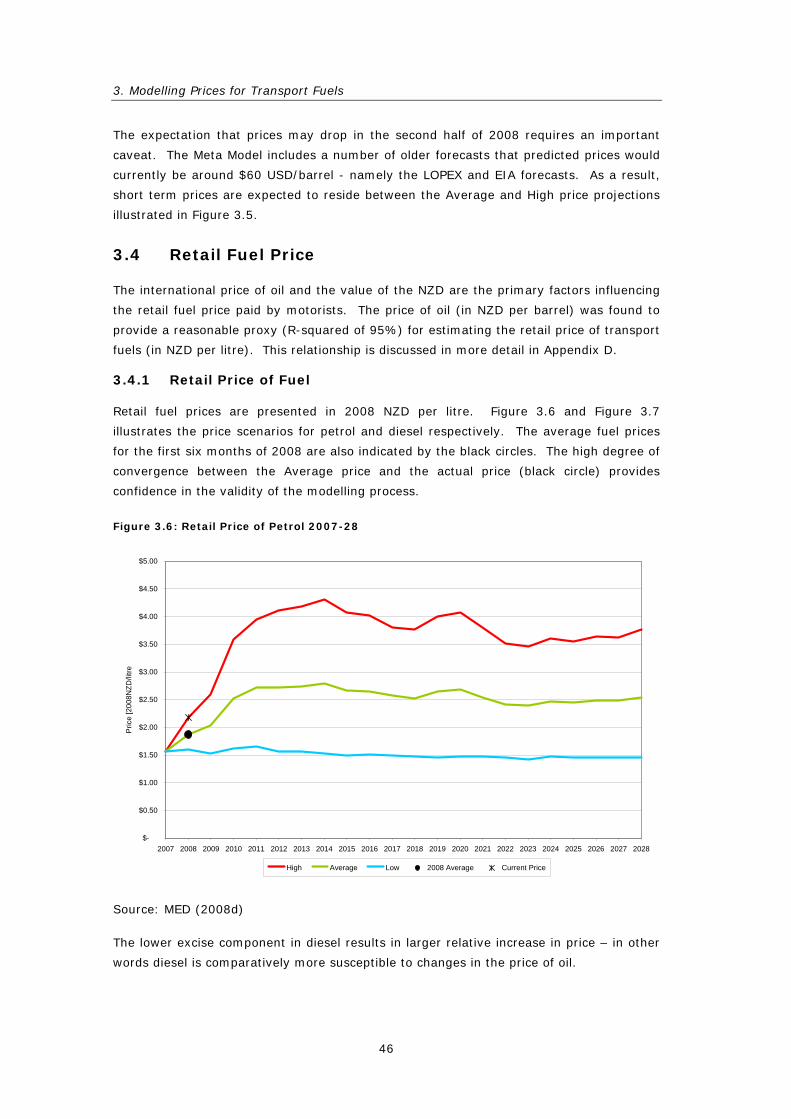
3. Modelling Prices for Transport Fuels
46
The expectation that prices may drop in the second half of 2008 requires an important
caveat. The Meta Model includes a number of older forecasts that predicted prices would
currently be around $60 USD/barrel - namely the LOPEX and EIA forecasts. As a result,
short term prices are expected to reside between the Average and High price projections
illustrated in Figure 3.5.
3.4 Retail Fuel Price
The international price of oil and the value of the NZD are the primary factors influencing
the retail fuel price paid by motorists. The price of oil (in NZD per barrel) was found to
provide a reasonable proxy (R-squared of 95%) for estimating the retail price of transport
fuels (in NZD per litre). This relationship is discussed in more detail in Appendix D.
3.4.1 Retail Price of Fuel
Retail fuel prices are presented in 2008 NZD per litre. Figure 3.6 and Figure 3.7
illustrates the price scenarios for petrol and diesel respectively. The average fuel prices
for the first six months of 2008 are also indicated by the black circles. The high degree of
convergence between the Average price and the actual price (black circle) provides
confidence in the validity of the modelling process.
Figure 3.6: Retail Price of Petrol 2007-28
$-
$0.50
$1.00
$1.50
$2.00
$2.50
$3.00
$3.50
$4.00
$4.50
$5.00
2007 2008 2009 2010 2011 2012 2013 2014 2015 2016 2017 2018 2019 2020 2021 2022 2023 2024 2025 2026 2027 2028
Pric
e [2
008N
ZD/li
tre
High Average Low 2008 Average Current Price
Source: MED (2008d)
The lower excise component in diesel results in larger relative increase in price – in other
words diesel is comparatively more susceptible to changes in the price of oil.
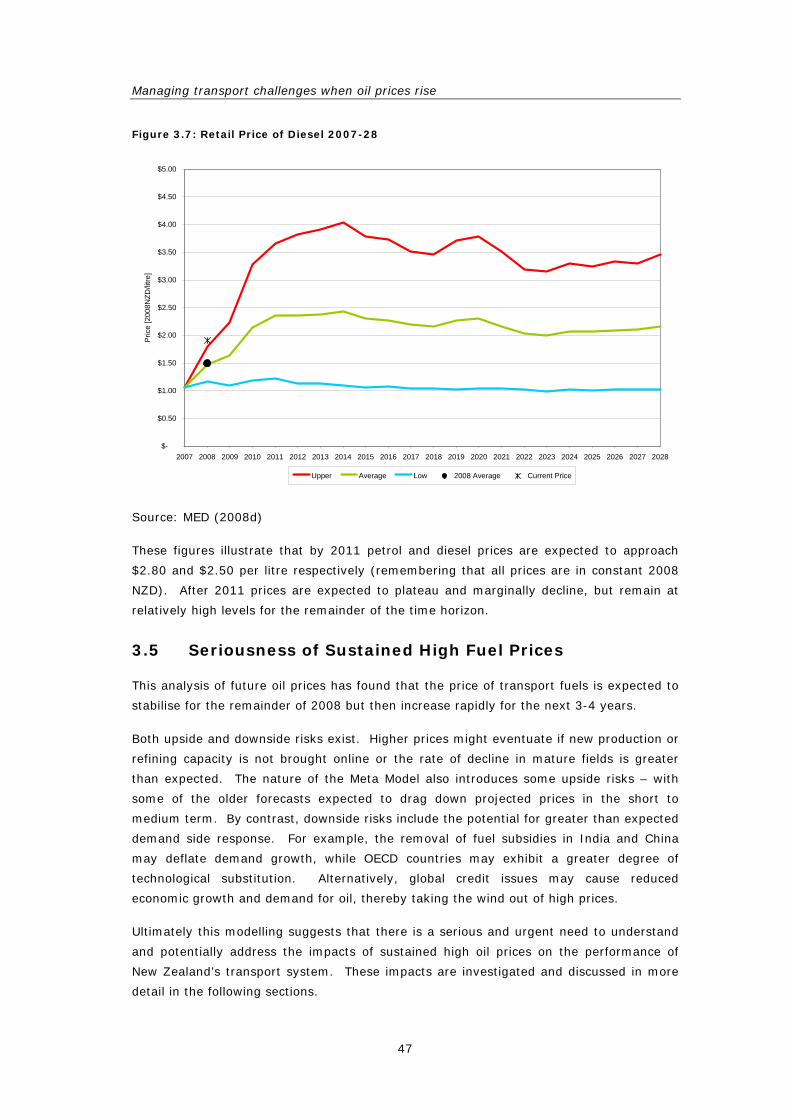
Managing transport challenges when oil prices rise
47
Figure 3.7: Retail Price of Diesel 2007-28
$-
$0.50
$1.00
$1.50
$2.00
$2.50
$3.00
$3.50
$4.00
$4.50
$5.00
2007 2008 2009 2010 2011 2012 2013 2014 2015 2016 2017 2018 2019 2020 2021 2022 2023 2024 2025 2026 2027 2028
Pric
e [2
008N
ZD/li
tre]
Upper Average Low 2008 Average Current Price
Source: MED (2008d)
These figures illustrate that by 2011 petrol and diesel prices are expected to approach
$2.80 and $2.50 per litre respectively (remembering that all prices are in constant 2008
NZD). After 2011 prices are expected to plateau and marginally decline, but remain at
relatively high levels for the remainder of the time horizon.
3.5 Seriousness of Sustained High Fuel Prices
This analysis of future oil prices has found that the price of transport fuels is expected to
stabilise for the remainder of 2008 but then increase rapidly for the next 3-4 years.
Both upside and downside risks exist. Higher prices might eventuate if new production or
refining capacity is not brought online or the rate of decline in mature fields is greater
than expected. The nature of the Meta Model also introduces some upside risks – with
some of the older forecasts expected to drag down projected prices in the short to
medium term. By contrast, downside risks include the potential for greater than expected
demand side response. For example, the removal of fuel subsidies in India and China
may deflate demand growth, while OECD countries may exhibit a greater degree of
technological substitution. Alternatively, global credit issues may cause reduced
economic growth and demand for oil, thereby taking the wind out of high prices.
Ultimately this modelling suggests that there is a serious and urgent need to understand
and potentially address the impacts of sustained high oil prices on the performance of
New Zealand’s transport system. These impacts are investigated and discussed in more
detail in the following sections.

4. Modelling Future Travel Demands
48
4. Modelling Future Travel Demands
This section models future travel demands on the basis of the fuel price scenarios
developed in the previous section.
It firstly introduces and explains the concept of elasticity. It then analyses transport and
energy data from a number of OECD countries to provide initial insight into energy
consumption with respect to prices and economic development. Although New Zealand
itself has not yet experienced sustained fuel price increases, other economies with higher
fuel tax regimes have and may provide an indication of likely outcomes.
This analysis is supplemented with reviews of local and international studies of elasticities
and cross-elasticities. Analyses of local VKT data are used to generate elasticities for a
range of additional factors, including vehicle ownership, workforce participation, and
income. The identified elasticities are then applied to back-cast VKT data, with the model
demonstrating a high degree of accuracy (R-squared of between 0.93 and 0.96).
These elasticities are applied to model future trends in travel demands. Travel demand
models for light passenger vehicles, commercial vehicles, and alternative modes are
modelled separately and then combined to provide an overall measure of expected travel
demand growth.
4.1 Introduction to Elasticities
There is little doubt about the general direction of the effect of a sustained and substantial
increase in the price of almost anything: people will use less of it. Also we will use less of
items that are linked to use of the increased-price commodity. So, if fuel prices go up we
will use less fuel and so also use fewer fuel-using vehicles. We say that two commodities
or items linked in this way are complements in consumption or demand.
On the other hand, a sustained fuel price increase is likely to encourage the use of
substitutes for fuel or fuel-using equipment: sales of bicycles, walking shoes and bus
tickets will go up, and so too may the total sales of smaller, fuel-efficient motor vehicles,
at the expense of the demand for “gas-guzzlers.”
Also, a large increase in any important component of the household shopping basket may
leave significantly less money for purchases on even intrinsically unrelated consumer
items. This, the income effect of higher prices, is probably of little direct concern to
transport planners, but should as it will affect the macroeconomic benefits of a given
transport project to the economy.
Responses to higher prices in general take time to work through. Economists believe - on
very good evidence, as we shall see – that, so long as the price increase is expected to
persist, private and business users of fuels will cut back their use more after a few years
than they will in the first months. This is because it takes time to, for example, replace
the vehicle fleet with smaller, more economical vehicles; it takes time for automobile
manufacturers to respond to the situation with innovations that improve the fuel economy
Managing transport challenges when oil prices rise
49
of all vehicles, and it takes time for governments agencies to make the infrastructure
changes (bus lanes, new rail capacity) that become viable when the price structure
undergoes a semi-permanent shift.
All these responses can be summarised quantitatively with the very useful concept of
elasticity. The elasticity of some variable Y with respect to some variable X is defined as
the percentage change in Y induced by a one percent change in X (holding all other prices
and relevant factors constant), with the imputation that, up to a point, a larger
percentage change in X would yield a proportionally larger change in Y. The beauty of the
elasticity concept is that it is “unit-free” - being defined in terms of percentage changes.
So, for example, if “X” is the price of petrol, and “Y” is the annual consumption of petrol
at the pump measured in volume terms, and if we say that the most likely or reasonable
mid-range estimate of the “price elasticity of demand for petrol” is -0.3, then we mean
that a sustained ten percent increase in the price of petrol would induce eventually a
three percent fall in the “demand” (actual consumption).
The size of any commodity’s price elasticity of demand is determined by its customers’
willingness and ability to, in a sense, “escape” from the commodity if its price goes up,
and this is in turn determined by the availability and attractiveness of substitutes, as well
as the time span available for adjustment. A good point to bear in mind is that elasticity
estimates are therefore likely to be smaller for more broadly defined commodities.
For example, the elasticity of demand for “transport fuels” (petrol and diesel) will be
smaller than the elasticity of demand for just one of these fuels by itself. This is because
if just, say, petrol prices increased but diesel prices did not, then many consumers would
take the opportunity to switch to (substitute) diesel-fuelled cars, whereas if both petrol
and diesel prices go up together, then there is, in a sense, nowhere to go, except to cut
back on vehicle use overall, which is more difficult.
The X and Y example given above is for what is called the “own-price” elasticity of
demand – that is, the effect on a commodity’s demand (quantity - not value – purchased)
of a change in its own price. The “cross-price” elasticity is the effect on demand of a
change in the price of a related good, defined mathematically the same way. So, the
cross-price elasticity of demand if the other good is a substitute is always a positive
number and of a complement is negative: if the price of a substitute goes up, the original
good becomes more popular; if it is the complement of which the price has risen, then the
demand for the original good will fall (the sign of the cross-price elasticity is actually used
to determine whether two goods are substitutes or complements for each other).
Note that although each elasticity is defined “holding all other prices and relevant factors
constant” - because they would be meaningless otherwise - the fact that in practice
usually more than one factor changes within the same time period can easily be handled
by considering all the relevant elasticities together to net out the effects.

4. Modelling Future Travel Demands
50
4.2 International Comparison of Fuel Prices
Our recommended estimates for transport fuel price elasticities are drawn from surveys of
dozens of studies. But the basic force that these studies uncover - the strong
responsiveness of demand to price – is so powerful that it can readily be spotted in
available data. For example, Table 4.1 presents data on energy use and related economic
and demographic variables for 27 OECD economies.
The first column shows the average price of premium grade petrol as observed in
November 2004, when the world price of Brent Crude Oil was $US43. Note the
substantial variation in retail prices, just about all of which is due to differences in
governments’ tax and/or subsidy policies, because of course all these countries faced
essentially the same price for oil. In particular, note that in several European countries
the retail price was around $2 per litre, and this is almost three times the price in the US.
Thus, these variations in retail prices can be taken as a natural experiment to enable us
to estimate the likely impact of sustained high fuel prices on a country like New Zealand
for which the 2004 and earlier prices were much lower. And, the results of this
experiment are fairly clear from just inspecting the second column of data, which
measures total energy consumption for transportation uses (most of this being petrol or
diesel): low-price countries consumed more; high-price less.
We can also discern another correlation, between energy use and per capita incomes or
GDP (gross domestic product): richer countries use more energy. If we plotted these
pairs of variables on graphs to get scatter diagrams, and then drew lines ‘fitting’ the
scatters of points as closely as possible, the line linking petrol price and energy
consumption would slope down, and the line through the scatter of energy consumption
and GDP data points would slope up. But of course it would be even better to plot energy
consumption against both incomes and price, which can be done accurately and
conveniently through an econometric regression model.
The slopes of the ‘lines’ from the model generate estimates of elasticities, which are
estimated to be -0.71 for the own-price elasticity of energy demand and +1.15 for the
income elasticity.4 These elasticities imply that countries which for a long time have
faced prices at the pump, say, twice as high as prices in the United States and which are
at a similar per capita income level will consume about 70% less energy per capita in
their transportation systems. A country with the same prices as the United States but
only half the income will consume rather less than one half as much energy per capita.
4 The OLS regression model is: log(energy consumption) = -3.84 – 0.71log(petrol price) + 1.15log(per capita GDP): t-statistics for the coefficients are -7.39 and +16.90; R2 = 0.938.

Managing transport challenges when oil prices rise
51
Figure 4.1: Transport and Energy Statistics for a number of OECD countries
Country
Pri
ce[U
SD
/Lit
re]
Tra
nsp
ort
En
erg
y
Co
nsu
mp
tio
n [
per
cap
ita]
Po
pu
lati
on
[1
00
0]
GD
P [
per
cap
ita]
Rail
Fre
igh
t
[Mil
lio
n t
on
nes
/
year]
Rail
Pass
en
gers
[mil
lio
ns/
year]
Are
a [
km
2]
Australia $0.85 1.47 20 111 32.9 166 11.3 7713
Austria $1.32 0.96 8 175 33.6 179 8.3 84
Belgium $1.50 1.00 10 399 32.5 8 8.7 31
Canada $0.68 1.72 31 946 33.6 298 1.4 9971
Czech $1.08 0.60 10 211 20.2 15 6.6 79
Denmark1 $1.51 0.94 5 401 34.4 2 5.7 43
Finland $1.42 0.88 5 228 31.4 10 3.4 338
France $1.54 0.91 60 200 30.2 45 74.3 549
Germany $1.46 0.78 82 491 29.8 86 72.6 357
Greece $1.14 0.73 11 060 23.2 1 1.7 132
Hungary $1.30 0.38 10 107 17.2 9 10.5 93
Ireland $1.29 1.14 4 044 39.2 0 1.6 70
Italy $1.53 0.77 57 553 28.5 23 45.6 301
Japan $1.26 0.73 127 687 30.5 23 385 378
Korea $1.35 0.72 48 082 21.9 11 28.5 100
Netherlands $1.62 0.93 16 275 34.2 5 14.7 42
New Zealand $0.77 1.38 4 061 25.3 270
Norway $1.61 1.05 4 592 43.2 2 3.1 324
Poland $1.20 0.30 38 180 12.8 52 18.6 313
Portugal $1.38 0.70 10 509 19.9 2 3.6 92
Slovakia $1.17 0.41 5 382 15 10 2.2 49
Spain $1.21 0.90 42 692 27.3 12 20.4 506
Sweden $1.51 0.94 8 994 32.7 21 8.7 450
Switzerland $1.29 0.96 7 391 36.2 10 14.9 41
Turkey $1.44 0.19 71 789 8.1 9 5.2 779
UK $1.56 0.90 59 778 32.1 21 41.8 245
USA $0.54 2.18 293 655 41.9 2341 8.9 9629
This data yields another interesting insight: we predict that in countries which price their
petrol high consumers will be keener to use public transport, and, presumably, their
governments will make such facilities more available, and so it proves. If we do a simple
regression of annual rail passengers (divided by country population) on petrol prices we
get a large elasticity estimate of +2.78. This actually means that, across the OECD,
countries with petrol prices twice those of the United States use rail transport nearly
seven times more often than do Americans.5
5 22.78 = 6.87. The regression equation is: log(rail passengers) = -8.2 + 2.78log(petrol price), with a t-statistic on the petrol price coefficient = 4.53 and an overall R2 = 0.461.

4. Modelling Future Travel Demands
52
4.3 Using Elasticities to Back-cast Travel Demands
This section applies and develops elasticities to predict historical travel demands – a
technique referred to as back-casting. Back-cast describes the application of a model to
historical data to assess how well it is able to predict changes in the relevant variable – in
our case this is VKT. Modelling future travel demands requires an expansion in the range
of factors beyond fuel prices and economic growth. Travel demands are also likely to be
particularly affected by changes in vehicle ownership, workforce participation, and
disposable income.
The following two sections present the result of back-casting VKT elasticities for light
passenger and commercial travel demands. Only the main results of the modelling
process are presented here, with detailed discussion provided in Appendix E. Back-
casting light passenger travel was first undertaken by applying “best-estimate” elasticities
for fuel price and economic growth as summarised in Table 4.1.
Table 4.1: Elasticity of Personal Travel Demands in response to Fuel Price and GDP
Elasticity Measure
Short Long
Fuel price -0.12 -0.24
Economic growth +0.3
Source: Kennedy and Wallis (2007)
These elasticities are referred to as the “Base” model. It is noted that rapid increases in
fuel prices may solicit more elastic consumer behaviour. Further research could seek to
quantify this trend. Modelling was undertaken to assess whether the additional factors
described above were able to further explain changes in the underlying VKT data. This
model is referred to as the “Expanded” model. Results from the Base and Expanded
models are summarised in Table 4.2.
Table 4.2: Comparison of elasticities associated with Base and Optimised VKT model
Elasticities Factor
Base Expanded
Fuel price -0.24 -0.27
Economic growth +0.3 +0.21
Vehicle ownership +0.62
Workforce participation +0.38
Income
N/A
+0.14
Sources: MED (2008a), Statistics NZ(2008a), MOT (2008c), Statistics NZ (2008b), and
Statistics (2008c).
The Expanded model reduces the positive travel demand effects attributed to economic
growth and includes the effects of vehicle ownership, workforce participation, and
disposable income. The R-squared associated with the Base and Expanded models (61%
and 96% respectively) suggests that the latter is more able to explain trends in the
underlying data. The primary caveat on these results is the limited sample size - only
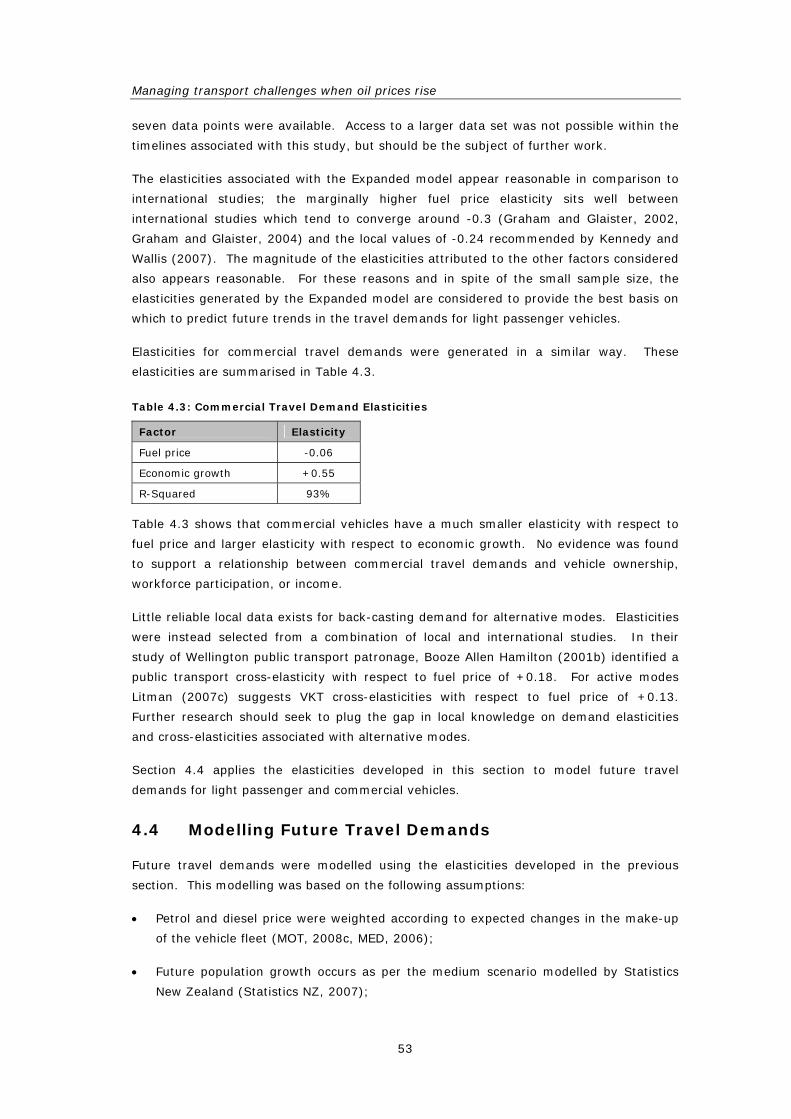
Managing transport challenges when oil prices rise
53
seven data points were available. Access to a larger data set was not possible within the
timelines associated with this study, but should be the subject of further work.
The elasticities associated with the Expanded model appear reasonable in comparison to
international studies; the marginally higher fuel price elasticity sits well between
international studies which tend to converge around -0.3 (Graham and Glaister, 2002,
Graham and Glaister, 2004) and the local values of -0.24 recommended by Kennedy and
Wallis (2007). The magnitude of the elasticities attributed to the other factors considered
also appears reasonable. For these reasons and in spite of the small sample size, the
elasticities generated by the Expanded model are considered to provide the best basis on
which to predict future trends in the travel demands for light passenger vehicles.
Elasticities for commercial travel demands were generated in a similar way. These
elasticities are summarised in Table 4.3.
Table 4.3: Commercial Travel Demand Elasticities
Factor Elasticity
Fuel price -0.06
Economic growth +0.55
R-Squared 93%
Table 4.3 shows that commercial vehicles have a much smaller elasticity with respect to
fuel price and larger elasticity with respect to economic growth. No evidence was found
to support a relationship between commercial travel demands and vehicle ownership,
workforce participation, or income.
Little reliable local data exists for back-casting demand for alternative modes. Elasticities
were instead selected from a combination of local and international studies. In their
study of Wellington public transport patronage, Booze Allen Hamilton (2001b) identified a
public transport cross-elasticity with respect to fuel price of +0.18. For active modes
Litman (2007c) suggests VKT cross-elasticities with respect to fuel price of +0.13.
Further research should seek to plug the gap in local knowledge on demand elasticities
and cross-elasticities associated with alternative modes.
Section 4.4 applies the elasticities developed in this section to model future travel
demands for light passenger and commercial vehicles.
4.4 Modelling Future Travel Demands
Future travel demands were modelled using the elasticities developed in the previous
section. This modelling was based on the following assumptions:
• Petrol and diesel price were weighted according to expected changes in the make-up
of the vehicle fleet (MOT, 2008c, MED, 2006);
• Future population growth occurs as per the medium scenario modelled by Statistics
New Zealand (Statistics NZ, 2007);

4. Modelling Future Travel Demands
54
• Economic growth (GDP/capita) is assumed to grow at the average rate of 2.4%, which
reflects the average rate from 200-08 (Statistics NZ, 2008a);
• Vehicle ownership was assumed to remain at the 2007 rate of 700 vehicles per 1000
people (MOT, 2008c);
• Workforce participation rates were assumed to vary in accordance with models of the
future composition of the workforce (Treasury, 2008a); and
• Disposable income (excluding transport expenditure) was assumed to grow at a
constant rate of 1.35% - the average for the period 2001-07 (Statistics NZ, 2008c).
Light passenger and commercial travel demands were modelled separately and then
summed to give total VKT. The travel demands associated with light passenger vehicles,
commercial vehicles, and alternative modes under the average fuel price scenario are
illustrated in Figure 4.2.
Figure 4.2: Total travel demands 2007-2028
0
10
20
30
40
50
60
2007 2008 2009 2010 2011 2012 2013 2014 2015 2016 2017 2018 2019 2020 2021 2022 2023 2024 2025 2026 2027 2028
Tota
l Tra
vel [
billio
n K
T pe
r yea
r]
Passenger Vehicles Commercial Vehicles Alternative Modes
It is important to note that this analysis is unable to account for major investment in new
transport infrastructure. Such investment is likely to induce additional demand for travel
above and beyond that considered in this analysis. Holmgren (2007), for example, found
public transport travel demands were highly elastic in response to deliberate service
improvements – recommending an elasticity of 1.05. It is also suggested that the
assumption of average per capita growth of 2.4% per year is likely to be optimistic in a
situation of sustained high oil prices. For this reason these travel demands are
considered to be conservative and lie at the upper end of what may be expected.
Figure 4.2 illustrates total travel demands increasing from 45 to 54 billion KT per year,
while travel demands placed on the road network are found to increase from

Managing transport challenges when oil prices rise
55
approximately 40 billion to 48 billion VKT. It is noted that total VKT is not expected to
exceed current levels until 2016, after which the positive effects of economic growth and
increases in disposable income dominate the fuel prices rises expected in the period
2008-11.
Annual average growth in travel demands is approximately 0.9%, with light vehicle and
commercial travel growing at approximately 0.7% and 1.6% per year respectively. Travel
demands for alternative modes are also expected to grow at 1.2%. This suggests that
total travel demands may be expected to grow at a lower average rate than in previous
years. It is noted that after 2016 VKT growth averages approximately 1.5%, which is
possibly slightly lower than historical experience due to the assumed plateau in vehicle
ownership rates.
Growth may be visualised by allocating the total demand growth from 2007-28 amongst
light passenger vehicles, commercial vehicles, and alternative modes, as illustrated in
Figure 4.3. Results for the other fuel price scenarios are summarised in Table 4.4.
Figure 4.3: Marginal Travel Demand Growth under Average Fuel Price 2007-28
52%
37%
11%
Passenger vehicles
Commercial vehicles
Alternative modes
Table 4.4: Marginal Travel Demand Growth under Different Fuel Price Scenarios
Fuel Price Scenario Travel Category
High Average Low
Light passenger vehicles 17% 52% 71%
Commercial vehicles 58% 37% 25%
Alternative modes 25% 11% 4%
Figure 4.3 illustrates that of the growth in travel demands that does occur, a larger
proportion is attributable to commercial vehicles and alternative modes than would be
suggested by their overall current mode share.
Table 4.4 illustrates that future demands for light passenger vehicles and alternative
modes is highly variable across the various fuel price scenarios, particularly for alternative
transport modes.

4. Modelling Future Travel Demands
56
In summary, this analysis of future travel demands indicates that the challenges
associated with managing transport challenges are likely to revolve around two key areas:
the effects of growing commercial travel demands on the structural integrity of the road
network and increased demand for alternative modes as a substitute for light passenger
travel.
It is also found that high fuel prices are likely to suppress total VKT below current levels
until approximately 2016. This suggests that the next 8 years may provide the ideal
opportunity to shift the focus of transport planning onto more energy efficient and
enduring practices. Examples of such practices are discussed in more detail in the
following section.
Managing transport challenges when oil prices rise
57
5. Responses to Rising Oil Prices
This section identifies responses to the risk of sustained high oil prices.
Previous sections have identified that New Zealand’s land use patterns and transport
system are energy intensive. Many of the assumptions and priorities that underlie current
transportation planning and funding decisions have unintentionally exacerbated
vulnerability to high oil prices. Transport and land use planning must therefore undergo a
paradigm shift.6 That is to say, to ensure that the transport system is more resilient to
sustained high oil prices, government agencies will need to fundamentally change the way
in which transport problems are defined and solutions delivered.
This section provides a toolbox of potential solutions that will facilitate the development of
a more efficient transport system. In many ways this section provides new perspectives
on old assumptions. Central among these is the understanding that travel and land use
have not historically been effectively managed or priced. This has led to structural
imbalances that have subsidised private vehicle trips. Rectifying these structural
imbalances so that road users are faced with the true costs (both internal and external) of
their choices is expected to deliver travel and land use patterns that are significantly more
energy efficient. A background explanation of transportation market distortions is
discussed in the following subsection.
5.1 Transportation Market Distortions
The steady decline in the price of oil following the second oil shock of the 1980s (see
Figure 3.1 on page 34) provided little financial incentive to increase energy efficiency for
approximately 20 years. However, transport and land use planning have also contributed
to a number of substantial market distortions that encourage vehicle use well beyond that
which is economically optimal. In other words, New Zealand’s transport and land use
resources have been managed and priced in ways that directly undermine economic and
energy efficiency. This relates not only to negative externalities, such as air pollution, but
also to direct costs that are not usually paid by road users, such as parking (OECD,
2008).
When users are not charged directly for a resource, the resource tends to be exploited
beyond the optimal point of economic efficiency (Litman, 2007b). As many of the costs of
motor vehicle use have been externalised or charged indirectly, current demand for
private vehicle travel in New Zealand is now higher than it would be if users were charged
completely and directly (Jakob et al., 2006, Booz Allen Hamilton, 2005).7 Common
transportation market distortions are outlined in Table 5.1.
6 “A paradigm refers to how people think about problems and develop solutions.” (Kuhn, T. 1962, cited in LITMAN, T. (2003) Reinventing Transportation: Exploring the Paradigm Shift Needed to Reconcile Transportation and Sustainability Objectives. Victoria Transport Policy Institute.) 7 The Sustainable Transport Discussion Paper refers to the need for road users to pay true costs MOT (2007).

5. Responses to Rising Oil Prices
58
Table 5.1: Key requirements and distortions affecting travel decisions (Litman, 2007b)
Market Requirements Common Transport Market Distortion
Economic neutrality. Public policies (laws, taxes, subsidies, and investment policies) must not favour one economic activity over others, unless specifically justified.
Many public policies favour automobile use including dedicated road funding, automobile-oriented planning and investment practices, and zoning rules that require generous parking.
Cost-based pricing. Consumer prices reflect marginal costs. There should be no significant external costs unless specifically justified.
Automobiles use is underpriced: most costs are either fixed or external. Lower-density, automobile dependent land use patterns are also underpriced.
Choice. Consumers need viable choices, and information about those choices.
Consumers often have few viable alternatives to owning and driving an automobile, and living in automobile dependent communities.
Many of the recommended responses in this section can be understood in terms of
addressing these market distortions. This will be necessary to support the development
of a land use pattern and transport system that is more energy efficient and closer to that
which is economically optimal. It will be less costly (and more energy efficient) in the
medium and long term to create economic conditions that allow for increased
accessibility, rather than provide ongoing subsidies for mobility.8
The role of pricing reform in increasing accessibility can be best illustrated by an
anecdotal example. Recently a newspaper reported that as fuel prices have been
increasing, residents of the rural East Cape region have been suffering from the increased
costs of travel (Tahana, 2008). When fuel prices were lower, most rural households
found it advantageous to drive into town (separately) and purchase goods at the
supermarket. As most households have not shopped locally, it has not been financially
viable for a local shop to stock a wide range of goods, and, because there is no local
competition or economies of scale, prices are significantly higher at the local shop, which
further motivates households to drive to larger commercial centres. While households
appear to benefit from reduced prices in larger commercial centres, there are external
and indirect costs engendered by each household making a round-trip into a central area
to purchase goods, and it is not energy efficient. Moreover, residents of the rural area
who cannot drive have very few options for accessing goods and services.
There are two possible responses to solve the problem of reduced access to goods due to
high fuel prices. One is to continue subsidising mobility – e.g. central government could
reduce fuel taxes or regional authorities could organise a public transport service at
subsidised rates from the area to town. However, these responses still cost tax payers
and rate-payers money, just not directly. As the price of fuel increases, continuing these
subsidies would become unsustainable. The other option is to increase accessibility by
reforming land use policies and charging motor vehicle users directly for all the costs
incurred by motor vehicle use. This has the effect of increasing private transport costs.
But, one may ask, how does increasing the direct costs of private vehicle use increase
accessibility?
8 This is particularly important in the context of NZTS objectives to improve “access and mobility.” MOT (2002).

Managing transport challenges when oil prices rise
59
Residents of the East Cape told the newspaper that high fuel prices had motivated them
to buy goods at the local shop, even though it was more expensive. Over time, if the
perceived cost of travelling to the supermarket increases, most households may find it
advantageous to patronise the local shop. As the demand for and revenue of the local
shop increases, there is greater incentive for the shop to provide a wider range of goods.
Eventually, as demand grows it creates an opportunity for a competing shop to set up in
the area, thereby offering greater choice and lower prices, in addition to creating local
jobs. Above all, one delivery truck visiting the rural area with goods is more energy
efficient than each household driving to town every week.
As oil prices rise, public bodies may wish to provide short term solutions to reduce the
costs of travel for households and businesses. However, reform of land use and transport
policies and practices will create opportunities for businesses and households to relocate
in ways that are less energy intensive, and which will shelter them from higher fuel prices
in the medium and long term. Failure to rectify structural distortions will only slow the
emergence of improved land use patterns, thereby increasing the risk to high oil prices.
It is also noted that providing a level playing field by removing subsidies for vehicle use is
the best means of encouraging solutions that are responsive to specific local needs and
circumstances.
It must be emphasised that the expectation of sustained high oil prices is not an effective
substitute for policy reform, because oil prices fluctuate and cannot provide certainty to
households and businesses. The High and Low price projections discussed in Section 3
show oil prices ranging from approximately $250 to $50 USD/barrel respectively - in the
face of such potential variability households and businesses may need to make long term
changes. Increasing some transportation costs in a measured, predictable and managed
way will be more beneficial than relying on volatile oil price fluctuations to deliver
strategic transport objectives. Moreover, it will enable authorities to raise revenue that
can be used to invest in alternatives.
The value of the recommended responses lies in the long-term structural incentive that
they provide to motivate more efficient travel and land use choices. It is the certainty
associated with the recommended responses that will allow for enduring decisions. Such
certainty is not delivered by oil price forecasts – including those developed in this report.
5.2 Introducing the Recommended Responses
The following sections identify a number of recommended responses. While these
responses have been motivated by the risk of sustained high oil prices, they are not solely
justified on these grounds – as to do so would fail to realise the potential of holistic
solutions that deliver a wide range of benefits. In other words, although energy efficiency
is the driver of these responses, other objectives of the NZTS, such as economic
development, have been considered in developing the recommended responses.
Recommended responses have been broken into the following five categories:
• Land Use - addresses some of the major market distortions that increase the need to
travel by motor vehicle. Furthermore, they will be necessary to achieve many of the

5. Responses to Rising Oil Prices
60
growth objectives of current strategies in New Zealand (such as intensification around
transport nodes);
• Direct and Efficient Pricing will support desired land use changes and provide the
economic incentives for the changes to happen more rapidly. Direct and efficient
pricing may also raise revenue to assist with the transition, e.g. by investing in more
energy efficient transport modes or location-efficient land development;
• Infrastructure Investment outlines recommended supply side responses to higher oil
prices, including greater emphasis on the quality rather than the capacity of the road
network. Land use and pricing responses are expected to generate increased demand
for alternative modes, which should be reflected in infrastructure priorities;
• Behaviour Change and Education campaigns are important to effectively communicate
the need for the paradigm shift that will enable New Zealand communities to adapt to
rising oil prices. A well managed and funded information campaign, in addition to
other organisational institutions, will further facilitate public acceptance, allow for
more rapid progress, and increase the effectiveness of other responses; and
• Freight Management has its own specificities, but the principles of rectifying market
distortions through land use policies, direct pricing and infrastructure investment and
management are the same. In general, freight management strategies recognise that
heavy vehicle travel is likely to continue to grow in spite of higher fuel prices.
The responses described in this report can be understood in terms of software changes,
i.e. those that affect information, regulations, or behaviour, and hardware changes, i.e.
those that affect infrastructure and the built environment. These approaches are
complementary.
Figure 5.1: Timing and nature of responses
Software Hardware
Short term
Next 3 years
Parking regulation and pricing
Flexible zoning and urban containment
Development incentives
Commercial parking rates
Tax treatments of transport expenses
PT information
Travel plans
Transport Management Associations
Regional Freight Strategies
Transforming roads into streets
Investment in active modes
Taxi services
PT services
Car-sharing and bike sharing
Home Delivery
Active Freight
Long term
5 to 10 years
Road pricing
Multi-modal integration
PT Infrastructure
Urban renewal and TOD
Each policy response on its own may be considered effective, and will have a more
beneficial outcome than doing nothing (business-as-usual). However, it is considered
that the adoption of a comprehensive programme of action will result in far better
outcomes than a few policies implemented in isolation. For this reason, it is important
Managing transport challenges when oil prices rise
61
that a number of responses are progressed concurrently and implemented in a
coordinated fashion by the agencies concerned. For example, investment in HOV and bus
lanes is likely to deliver benefits in some areas, although this investment is likely to be
most effective when combined with priced parking and park and ride (PNR) located on
urban fringes so as to both incentivise and facilitate increased car-pooling.
Most of the responses are revenue neutral or low cost and thus achievable within the
bounds of currently forecast land transport budgets. Most importantly, this package is
considered to comprise of “no-regrets” strategies that deliver widespread economic
benefits as well as improved energy efficiency. Some of the recommended responses will
require long timeframes for appropriate policy development, consultation, and legislative
processes. Regulatory and legislative delays are compounded by long time frames
associated with land use development; it may be several decades before truly efficient
land use patterns emerge. For this reason and in light of the uncertainty associated with
future oil prices, it is recommended that progress on these responses be initiated without
delay.
It is recognised that the reforms required to achieve the desired transition may seem
politically difficult to implement – there is no doubt that New Zealand is a highly vehicle
dependent nation, and the public may not immediately understand how increases in the
perceived cost of private vehicle travel will improve land use options and transport system
resilience. For example, current public opinion tends to see improved public transport as
a pre-requisite for the implementation of road or parking pricing. Instead, this report
argues that it is in our interests to manage demand for vehicle travel efficiently,
regardless of what alternatives are available. Indeed, experience suggests that reformed
land use policies and direct and efficient pricing are pre-requisites for efficient public
transport and increased accessibility.
The need for increased energy security justifies substantive reform of New Zealand’s
transport system, responsibility for which is shared between government agencies,
business, households, and individuals. Inaction, while initially convenient, is likely to
result in more discomfort than would be experienced in a well-managed transition to a
more energy intensive transport system.
5.3 Land Use Management
Land use management has the greatest potential to reduce vulnerability to rising oil
prices in the medium to long term. Travel demand is in large part a function of land use
patterns and access to a variety of destinations, markets and services. Changes in land
use development that improve accessibility by alternative modes will therefore reduce the
need to travel by private vehicle and thus improve resilience to sustained high oil prices.
For most of the second half of the 20th century in New Zealand (and many similar
countries, including the United States, Canada and Australia), land use planning and the
public provision of transportation infrastructure were not well coordinated. This resulted
in settlements that are sprawling and required transportation infrastructure solutions
aimed at reducing congestion by increasing road capacity.

5. Responses to Rising Oil Prices
62
Transportation research in the 1990s began to question the ability and utility of public
infrastructure providers to continually react to developer-led growth. Thus for the past
decade, a desire to coordinate the provision of public infrastructure in advance of private
development has led to increasing attempts to avoid urban sprawl with urban
containment. Infrastructure-led development recognises that uncontrolled development
on the fringe of urban areas incurs large infrastructure costs while also imposing high
external costs on society in terms of environmental effects, such as vehicle accidents, air
pollution, and noise (Jakob et al., 2006, MOT, 2005b).
Awareness of the need to integrate land use planning with transportation is reflected in
the New Zealand Transport Strategy, Regional Growth Strategies, and regional and
district transportation strategies. The Metropolitan Urban Limits (MUL) in the Auckland
Region are one example of new policies that seek to manage and stage growth within
designated areas, where investment in the requisite transport infrastructure can be
provided in a timely and efficient fashion.
The following responses present different tools to assist with the transition to integrated
land use patterns that efficiently reduce the need to travel by private vehicle.
5.3.1 Parking Regulations and Management
Recommendations: Central Government facilitate the removal of minimum parking requirements
and the institution of pay parking policies. This would ideally be implemented
through either a National Environmental Statement or a National Policy
Statement. TA’s implement priced parking and increased enforcement.
Responsibility Central Government, Territorial Authorities
Parking regulations have had a huge and often overlooked impact on our urban form, and
have significantly contributed to sprawl and vehicle use. Indeed, parking may be the
single most important transport – land use connection. In a review of parking policies
Marsden (2006) describes parking as the “glue between the implementation of land use
and transport policies.”
The supply of car parking that has accompanied increased urbanisation is in large part
due to district plan regulations called minimum parking requirements.9 Minimum parking
requirements are based on standards that assume each individual development should
provide on-site parking to cater for its peak demand for free parking. Parking demand is
assumed to be generated by the size and type of land use, which ignores other (more
relevant) factors such as ease of access to the site by other modes and existing capacity
on nearby sites that have complementary peak demand hours. The cost of providing the
9 It is noted that Auckland and Wellington District Plans have not applied minimum parking requirements for at least a decade within their CBD areas. In Wellington certain inner-suburban retail centres have even instituted parking maximums. Despite these measures a large surplus of parking seems to exist – demonstrated by car parks that are not used for significant portions of the day and fairly low hourly rates compared to property values for other uses. This experience suggests that the residual and path dependent effects of minimum parking requirements may take time to work through. This experience adds urgency to the need for substantial and comprehensive reform of the way that parking resources are regulated and managed.

Managing transport challenges when oil prices rise
63
land to meet parking requirements is not charged directly to the users of car parks, but is
bundled in the cost of the development, thereby favouring SOV trips over other modes.
The OECD describes the regulated provision of parking as follows (OECD, 2008):
The provision of free parking (or parking at below market rates) is a form of
government support that is almost universally recognised to be inefficient. Many
authors have referred to it as a perverse subsidy. Whether it ought in fact to be
classified as a subsidy, is not important. It is clearly a government policy that
reduces the costs of driving … If drivers had to pay fair market price for parking
spots, it would make driving more expensive for them. There is no reason for
governments to subsidise them yet further with the provision of cheap parking on
city streets.
In addition to subsidising SOV trips and increasing the vulnerability of the transport
system to high oil prices, minimum parking requirements have a wide range of negative
impacts including: inflated demand for land and increased costs of living, particularly for
medium to high density dwellings; increased costs of redevelopment in existing urban
areas, particularly town centres and historic buildings; reduced urban densities that result
in an autocatalytic cycle of motor vehicle dependence;10
and fragmented and inefficiently
utilised parking areas (Litman, 2006a, Shoup, 2005).
Territorial authorities need to be aware that their parking regulations are a significant
driver of low density urban sprawl, out-of-centre retailing, traffic congestion, and low
alternative transport mode share. Minimum parking requirements have been responsible
for a large portion of the compliance costs for redevelopment of urban areas and have
driven many large developments to the fringes of urban area where land is cheaper,
thereby undermining compact city development (Cervero, 1985).
Parking requirements drive higher demand for land, for which the costs are distributed
throughout the remainder of the economy in the form of higher prices for rents, goods
and services (Shoup, 2005). Moreover, as motorists do not pay directly for parking, SOV
trips are effectively subsidised, which induces extra vehicle trip, worsening congestion,
and reducing optimal public transport patronage (Shoup, 2005). Vehicles circulating
looking for “free” car parks are responsible for moderate (in the order of 20%) of the
congestion in busy town centres (Shoup, 2005). Pricing on-street parking more
accurately to reflect demand may discourage such unnecessary circulation, thereby
reducing congestion in town centres.
For these reasons it is urgently recommended that minimum parking requirements be
rolled back nationwide so that parking is managed in a way that does not place undue
demands on the transport system and inhibit compact growth. Given the national scale of
this issue, there is merit in car parking being addressed as part of an integrated national
10 Auto-catalytic refers to the process by which minimum parking requirements reduce land use densities and thereby increase travel distances. This increase in travel distance stimulates increased use of vehicles that is reflected in increased minimum parking requirements. Thus land use densities are lowered even further and the cycle begins anew. In this way minimum parking requirements initiate a positive feedback loop that culminates in excessive vehicle use.
5. Responses to Rising Oil Prices
64
response on energy matters. The advantage of making changes to the policy framework
at the national level is that time frames can be set that require the subsequent integration
of regional and district planning documents by the respective authorities.
An integrated and robust planning framework requires a consistent set of policies at the
national, regional and district level that deal with energy conservation, land-use and
transport matters – including car parking. This is because District Plans (which contain
the relevant car parking standards) are ultimately subject to appeal either during the plan
change process itself, or the subsequent resource consent process, and are the
instrument that is most often challenged by developers at the time of development.
In addition to rolling back minimum parking requirements, it is important that demand for
public parking be well managed. Most concerning is the practice of territorial authorities
to fund public parking facilities through general rates, a practice that is likely to be
regressive for those on low incomes. Priced parking is a crucial mechanism for
rationalising increased demand for parking. Priced parking not only manages demand but
incentivises more efficient use of vehicles, including car-pooling, trip-linking, and trip-
consolidation, but also increased use of alternative modes, such as walking, cycling, and
public transport. It is important to note that the value of and demand for parking spaces
provides the motivation from pricing parking.
Prices provide a signal for the emergence of market-led responses that reduce the need
to travel and/or own a vehicle, such as home delivery and car-sharing organisations
(more information on car-share and home delivery is provided in Sections 5.6.2 and
5.7.2). These types of market-led responses may also increase accessibility to goods and
services for those members of the population who are unable or cannot afford to drive.
Most importantly, in the medium and long term, direct charging for parking will ensure
more efficient use of land. In many instances, management practices can reduce demand
for parking by up to 30% in the short term, with even larger gains in the future as land
currently used for parking is redeveloped into other uses (Litman, 2006a). Reducing land
required for parking could be a boon to local authorities who could increase the value of
their land holdings by allowing them to be developed as dwelling, offices or retail
shops/kiosks. The latter is an example of the type of adaptive re-use than may occur
when the value of the land used by parking is able to be realised.
Ultimately, the removal of minimum parking requirements and the implementation of
efficient pricing are essential steps towards the development of a market for parking
resources. Expansion of the parking supply is driven by demand where the cost of
additional parking is paid fully and directly by users. It is important that the
implementation of parking management measures, particularly pricing, is coordinated so
as to minimise the risks of retail leakage and therefore ensure win-win outcomes.
Moreover, there will be an increased reliance on enforcement to ensure efficient and
equitable implementation of pricing and time restrictions; parking enforcement is typically
revenue neutral.

Managing transport challenges when oil prices rise
65
5.3.2 Flexible Zoning and Urban Containment
Recommendation: Regional and territorial authorities amend regional and district plans to:
1) Adjust zoning regulations to encourage a mix of uses in developed areas,
with appropriate provision for amenity; and
2) Implement stricter zoning or MUL to discourage residential or commercial
development in areas that require private automobiles for access.
Responsibility Regional and Territorial Authorities
Zoning is a planning instrument that has previously been used to separate land use
activities so as to minimise many of the negative external effects of commercial and
industrial activities, such as pollution and noise. Many zoning regulations now place a
large number of restrictions on land use activities, particularly type of activity, bulk of
building, and density.
In attempting to manage the negative external impacts of development, some zoning
regulations have contributed to a need for increased vehicle travel. One of the
unintended consequences of zoning for single land use activities is the need to use
vehicles to get from wholly residential areas to access the goods, service, employment,
education and recreation provided on wholly commercial areas. Zoning for low density
and single development inhibits the provision of efficient public transport services to these
areas, by creating dispersed and highly tidal flows.11
Ironically, much of the noise and air
pollution generated in urban areas is now directly attributable to the use of vehicles – in
other words zoning regulations have partly perpetuated the very issues that they were
designed to solve.
High fuel prices can be expected to generate demand for higher density and more diverse
urban areas, rather than homogenous tracts of single-uses. Transportation optimisation
models suggest that high fuel costs are likely to support a larger number of smaller more
evenly distributed nodes so as to reduce total travel costs (Gosier et al., 2008). For this
reason territorial authorities should be encouraged to create more flexible zoning
regulations that allow for higher densities and a variety of uses to occur in developed
areas. It is recognised that mixed-use zones have been tentatively introduced in some
urban district plans – which allow for combinations of retail, commercial, and residential
development – although this process tends to be haphazard.
It is acknowledged that density and diversity alone cannot ensure sustainable
settlements. Urban design standards, noise and light regulations, and sufficient green
space requirements will need to be introduced concurrently with mixed-use zoning to
ensure that urban areas are developed in a way that preserves or improves standards of
living and general amenity, to address the negative effects of development. Detailed
11 Tidal refers to the direction of travel. Single use zoning results in unbalanced travel demands, flowing from residential areas to business areas in the AM peak and vice versa in the PM peak. This means that public transport services tend to experience low occupancies in the counter peak direction, significantly increasing the capital and operating expenses they incur.

5. Responses to Rising Oil Prices
66
inquiry into appropriate and effective urban design standards is outside the scope of this
report, but a short discussion of the relationship between urban design and density is
included in Appendix A. Industrial uses also have specific demands and thus may be
better isolated from some land uses.
Another instrument to be used in conjunction with flexible zoning is that of urban
containment. That is, limiting growth to current urban areas or adjacent to planned
transport nodes, such as rail stations. This will likely be necessary to transition from a
low to a high oil price environment. Sustained high oil prices could limit urban sprawl in
the medium and long term irrespective of planning regulations; however it would take
much longer for the market to respond appropriately because of price fluctuations and
imperfect information on the future direction of oil prices. While the market can be
expected to respond with innovations and adaptations, it often cannot look further into
the future than six months to a year, and therefore is overly sensitive to short term
variations in oil price. The role of public authorities must be to keep long term trends in
sight; provide stability and certainty for development decisions; and thereby facilitate
development in a way that will be resilient over its entire life cycle.
Urban containment needs to be signalled at both the regional and territorial authority (TA)
level to ensure that a robust planning framework is in place. As discussed earlier an
example of urban containment already in place is the MUL that are currently applied in
the Auckland region. In this instance the extent of the MUL is set out in the regional
policy statement (RPS) and urban zonings (as provided for in territorial authorities’ district
plans) are consistent with the extent of the MUL. Proposed extensions to the MUL are
considered in a co-ordinated manner between the regional council and respective
territorial authority.
It has been argued that MUL is responsible for higher house prices, and therefore, a just
and equitable affordable housing policy would allow development to sprawl out,
unimpeded by regulation. However, this view implies a very narrow concept of housing
affordability – one that does not include transportation costs. An example of how this
argument can be misleading is seen in the census household expenditure surveys. While
housing costs are slightly higher in the central Wellington area compared to Auckland, the
household expenditure survey demonstrates that those in central Wellington spend the
lowest proportion of their income on transportation by a considerable amount.
The concept of urban containment, as exemplified by MUL, is a blunt but necessary tool
that reduces the incentive for urban sprawl resulting from a transport system that has
historically valued mobility over accessibility. As travel and land use patterns are more
efficiently priced and managed there may be a reduced need for some land use
regulations, which are really “second best” measures designed to redress short-comings
in other areas. Direct and efficient pricing is discussed in more detail in Section 5.4.

Managing transport challenges when oil prices rise
67
5.3.3 Development Incentives
Recommendation: Central Government commission research into sophisticated developer and
financial contribution schemes that will stimulate less oil intensive growth and
support other planning objectives.
Responsibility Central Govt / Territorial Authorities
A further tool available to territorial authorities to stimulate and guide development in a
less oil intensive fashion is the use of economic instruments, such as developer and
financial contributions.
By reducing developer contributions for mixed use developments that meet appropriate
amenity standards and reduce parking supply, TA’s can encourage development that will
assist communities to become more energy efficient and thereby help undo adverse
effects arising from single use low density zoning, minimum parking requirements, and
auto-centric infrastructure planning. Within urban areas, additional requirements for
developers to provide active mode infrastructure and green space can be offset by
eliminating the requirements to provide car parking, and can help reduce the costs of
traffic and storm water management for TA’s.
5.3.4 Urban Renewal Projects and Transit Oriented Development
Recommendation: Promote development in existing urban areas through plan changes and
structure plans that develop and facilitate urban renewal and TOD.
Responsibility Central Government and Territorial Authorities
Urban renewal projects convert strategically located areas that are currently underutilised
(often previously industrial, but this could also include areas previously used for parking)
into mixed-use precincts, usually by way of “up zoning.” In many cities, such as Brisbane
and Portland, successful urban renewal projects have transformed the local economy by
establishing a new cultural, recreational or educational centre supported by balanced
commercial and residential development that has led to an increase in jobs and in
property development in adjacent neighbourhoods.
Urban renewal projects may take several years to result in benefits, but they are long
lasting and have significant flow on effects that ultimately increase the prosperity of a
community. Investment by local authorities can be recouped through the substantial
increase in rating base. Concentrating development in this fashion will result in
economies of scale for local government services and ultimately can reduce the burden of
infrastructure provision. Ideal urban renewal projects are typically located on brown-
fields sites, such as those formerly used for industrial purposes.
Transit oriented development (TOD) is usually defined as development that is located
within a 10-minute walk, or approximately 1km from a rail station, heavily used bus
corridors and stations, or ferry terminals (American Planning Association, 2006). It has
been touted as a new approach to development that can help reduce the need to travel
by vehicle by concentrating residences, services (such as crèche and dry-cleaning

5. Responses to Rising Oil Prices
68
facilities), and work places within walking distance of public transport hubs. TOD have
higher than average densities to support the public transport services and the pedestrian
oriented design that permeates the area. It is essential that minimum parking
requirements are not applied to TOD, and perhaps that parking maximums are applied, to
ensure that the development makes best use of land and is not unduly influenced by the
vehicle dependent nature of contemporary land use development.
TA’s should be encouraged to actively allow and plan for TOD around planned high
frequency public transport nodes. Some TA’s may want to lead the way, by using a re-
location of their offices to catalyse a TOD, following the example of Waitakere City Council
in downtown Henderson in the Auckland Region. Public / private partnerships have been
successfully used to deliver TOD overseas. A high degree of community involvement is
often helpful to ensure the success of the project and a high quality outcome (American
Planning Association, 2006).
5.4 Direct and Efficient Pricing
This section outlines several pricing and regulatory mechanisms designed to improve the
way New Zealand’s transport system is priced. These mechanisms are largely designed
to redress subsidies and imbalances in the way that transport costs are levied. Current
pricing mechanisms are not direct or efficient and, when all costs are considered, appear
to subsidise the use of vehicles to a higher degree than alternative modes (Jakob et al.,
2006). Indirect and incomplete charging for vehicle use has resulted in a sprawling land
use pattern that is difficult to access by alternative transport modes, and this in turn
reduces the ability of individuals, households, and government agencies to adequately
prepare for the challenges of rising oil prices (Litman, 2002b, Litman, 2002a, Boarnet and
Chalermpong, 2002, Boarnet and Crane, 2001, Litman and Laube, 2002). This is most
evident in the case of parking, which has already been discussed in Section 5.3.1.
It is crucial to level the economic playing field so that land use and derived travel
demands are not overly reliant on motor vehicles, i.e. not reliant on vehicles beyond the
point of optimal economic efficiency. In 1963 William Vickrey wrote “in no other major
area are pricing practices so irrational, so out of date, and so conducive to waste as in
urban transportation” (Vickrey, 1963). The inefficiency associated with current transport
system pricing is thus not a new observation – with its slow implementation primarily due
to the intricacies associated with communicating the potential for direct and efficient
pricing to advance common economic, social, and environmental objectives (Litman,
2006b). A more direct and efficiently priced transport network is certain to be more
energy efficient.
Managing transport challenges when oil prices rise
69
5.4.1 Funding Local Roads through a Parking Rate
Recommendation: TA’s implement a system that seeks to partly fund local road improvements
from a rate on the number of parking spaces provided with commercial and
industrial properties. This should be implemented in conjunction with the
removal of minimum parking requirements so as to allow flexibility for
redevelopment of parking spaces as a means to reduce the rates burden for
these properties, and reduce demands on TAs to increase the capacity of the
road network.
Responsibility Territorial Authorities, with Central Government and Regional leadership
The construction and maintenance of local roads is generally funded from general rates on
property values. Such a funding mechanism is highly inefficient because road users are
not charged directly and as such there is no incentive for individuals to use the least
costly mode. More importantly, higher value properties located in dense town centres
generate less vehicle traffic but are subject to higher rates – such that they are
subsidising energy inefficient development on the urban fringes.
It is recommended that the contribution from commercial and industrial properties to the
local road network be rated on the basis of the number of car-parks dedicated to their
operation. Such a rating scheme funds the local road network in a way that is more
commensurate to the traffic demands placed on it by individual developments and
ensures that higher density, mixed-use, multi-modal developments are not subsidising
traffic generated by travel intensive developments, such as large format retail. Moreover,
when coordinated with the removal of minimum parking requirements, such a rating
system introduces incentive for commercial developments to consider adaptive reuse of
under-utilised parking areas.
It is acknowledged that such a rating system, while an improvement on the status quo,
does not directly charge for the use of the road. It is however more direct than the
current system and particularly effective when implemented in conjunction with the
removal of minimum parking requirements. This response is recommended as a short to
medium term response that will eventually become superfluous at a later point in time,
when a true cost road pricing system (described below) is able to be implemented.
5.4.2 Road Pricing
Recommendation: A road pricing scheme is implemented nationally, with an aim to recover full
costs of vehicle use. Price per km would ideally be a function of distance
travelled, vehicle weight, time of day, and environmental externalities
generated by their use.
Responsibility Central Government
Road pricing charges a direct fee for the use of the road network. It has been
implemented in a number of different settings to serve different objectives; a) cost
recovery for the initial provision of a facility, b) cost recovery for the ongoing

5. Responses to Rising Oil Prices
70
maintenance of a facility, or c) to directly charge the cost of additional vehicle travel in
congested conditions.
Road pricing should be an integral response to sustained high oil prices. These prices
may be expected to drive consumers towards substantially more fuel efficient vehicles
and thereby over-time reduce revenue from fuel excise tax at a time when government
agencies are facing spiralling costs for road construction, network maintenance, and
public transport services.
Road pricing is effectively a more sophisticated fuel excise tax that charges the cost of
providing road infrastructure to those who use it. An effective and comprehensive road
pricing programme should aim to internalise all costs associated with road use. The
imposition of congestion charges may be determined on a typical volume threshold that
reflects road capacity. In some situations sufficient congestion charges may be levied to
justify roadway capacity expansions. A balance is to be struck between the sophistication
of the pricing scheme and the need for easily communicated charges. To avoid
geographical discontinuities and benefit from economies of scale, road pricing is likely to
be most effective and equitable if applied at a national scale, to all vehicle trips.
New Zealand has past experience with some elements of road pricing. For example, tolls
have been used to partially or completely fund new dedicated motorways and bridges,
such as the Auckland and Tauranga Harbour Bridges, which were then removed. In New
Zealand, heavy freight vehicles are charged road user charges (RUC) targeted to
internalise the increased costs of road maintenance they incur. Linking road pricing to
fund specific infrastructure and the operating characteristics of individual vehicles are but
two examples of the types of nuanced infrastructure charges that become possible with a
comprehensive road pricing scheme.
A road pricing evaluation study of the Auckland region was published in 2006, which
considered various options. Parking charges were also considered as part of a congestion
pricing programme. The study found that different charging schemes would have
different costs and benefits, but that congestion and a reduction in vehicle travel could be
achieved to an extent that delivered overall benefits to the region.
Overseas experience is more similar to the type of road pricing recommended in this
study, such as that implemented in London, Stockholm and Singapore. These charges
recognise that the use of vehicles generates time specific costs – both direct, such road
capacity expansion, and indirect, such as congestion, air pollution, and storm-water run-
off. The efficiency of road pricing has been greatly improved through technical
advancements that allow for pricing to occur in a more accurate and convenient fashion,
as illustrated most evidently in Stockholm (Hugosson and Sjöberg, 2006).
Opposition to road pricing generally is typically based on concerns over social equity and
civil liberties. Concerns over civil liberties are typically overcome through providing an
option for non-electronic payment. Such an option may incur higher transaction costs
that are passed onto the user. Concerns over social equity may apply in some specific
areas to which targeted assistance may be appropriate. It is emphasised that income
growth tends to be associated with vehicle ownership and use, such that high income

Managing transport challenges when oil prices rise
71
households tend to place higher demands on the road network. Low fixed income
households may also have more flexibility to shift their travel to off-peak times and
subsequently benefit from reduced travel costs at those times. Road pricing is therefore
not as inequitable as it first appears, although further more localised research should be
undertaken before its implementation.
5.4.3 Tax treatments of Transport Expenses
Recommendation: Central government investigate reforming tax laws to ensure that the use of
vehicles is not favoured over other forms of transport. This may involve:
1) Incentives for fuel efficient vehicles;
2) Excluding employee benefits for alternative modes from FBT or,
alternatively, levy FBT on parking provided to employees.
Responsibility Central Government
Under New Zealand Income Tax Act 2007 ("IT'07") businesses are able to deduct
expenses from taxable income. Fuel costs are legitimate business expenses if the
expenditure is sufficiently related to the income earning process (incurred in the course of
work activities) and are therefore deductible. Neutral tax treatment for fuel consumption
fails to provide incentives to reduce consumption or switch to more efficient vehicles,
however alteration to the amount of deductions available and introducing differential
deductions would create such incentives.
It is important that tax practices do not inadvertently encourage vehicle use over other
alternatives. For example, Fringe Benefit Tax (FBT) applies to public transport benefits
but not employee car parks, under an Inland Revenue Department ruling. Tax reform
should seek to reconcile treatments of transport modes to ensure that businesses are not
incentivised to encourage the use of one transport mode over another.
5.5 Infrastructure Investment
Travel demands increased steadily during the second half of the 20th century, while
alternative mode shares fell. This trend is attributable to a number of factors that have
been discussed in previous sections.
Continued growth in travel demands resulted in a “predict and provide” transport planning
paradigm; the provision of infrastructure was prioritised for the sole use of private
vehicles. Previous discussion has also demonstrated how the trend towards increased
vehicle ownership and use has been exacerbated by a number of inequitable and
inefficient approaches to land use management and transport pricing. This has
highlighted why “manage and price” must predicate “predict and provide.”
In the first years of this decade, even before the dramatic rise in oil prices from 2004
through 2008, vehicle ownership and use was beginning to plateau in comparably
automobile dependent countries overseas (Litman, 2006b). In New Zealand, the rate of
growth in traffic volumes has, at least on a national level, been decreasing even as

5. Responses to Rising Oil Prices
72
population is increasing, and vehicle ownership has remained static over the last three
years (MOT, 2008c).
Previous sections have outlined recommendations that are designed to ensure that the
use of private vehicles occurs in a more economically neutral environment. These
responses are expected to further slow the rate of growth in vehicle ownership and use,
as well as generate increased demand for alternative modes. The following sections
outline the types of infrastructure responses that may be required in a future
characterised by sustained high fuel prices.
5.5.1 Transforming roads into streets
Recommendation: Transform roads into streets through reallocating road space, improving
surface treatments and prioritising access over mobility. In town centres,
shared space design and full pedestrianization should be implemented to
improve accessibility by alternative modes and free up space for alternative
land uses.
Responsibility Territorial Authorities (Central Government leadership)
Transport planning in New Zealand has typically sought to reduce or avoid vehicle
congestion primarily through expanding capacity. This focus has tended to underestimate
the effects of induced traffic, as well as the impacts of increased vehicle volumes have on
mobility and accessibility for alternative modes.
The following paragraphs discuss ways in which roads designed primarily for vehicles may
be transformed into streets catering for a wider range of modes and activities. Streets
are really a combination of multi-modal transport corridors and public space that are able
to safely cater for a diversity of activities and land uses. Streets are environments in
which the overall amenity (sounds levels and air quality) is preserved such that the use of
alternative modes and land uses are not adversely affected by vehicle volumes.
Examples of simple traffic engineering practices that will enhance New Zealand’s street
environment and allow for increased uptake of alternative modes include:
• Pedestrian crossings on all approaches to signalized intersections, unless alternative
crossing arrangements are available nearby;
• Coordination of pedestrian phases at signalized intersections, i.e. scramble crossings,
so as to allow for diagonal pedestrian movement;
• Elevating the road surface at intersections to be flush with the footpath, which serves
to increase accessibility and reduce vehicle speeds through intersections;
• Avoid slip lanes and free left hand turns that widen the footprint of the intersection,
reduce accessibility, and increase vehicle speeds; and
• Develop well connected fine-grained street networks that avoid no-exit cul-de-sacs,
particularly those that do not allow for pedestrian through traffic.

Managing transport challenges when oil prices rise
73
Transport engineering practices effectively need to be rebalanced to ensure that the
provision of capacity does not unduly detract from amenity or reduce accessibility for
alternative modes.
Street environments may more safely cater for pedestrians and cyclists if the volume and
speed of motor vehicles are reduced. Thus, measures to reduce the speed and volume of
motor vehicle traffic should be the greatest priority, and expanding or improving
infrastructure secondary. Simple measures, such as regular street cleaning and debris
removal and enhanced pedestrian-oriented street lighting can greatly enhance the
ambiance of the journey, and can be undertaken in a relatively short period of time over a
large area.
It is emphasised that vehicle speed should not be controlled solely through reduced speed
limits. A particularly useful tool for reducing traffic volumes and speeds while improving
the built environment for other modes is the “shared space” traffic design concept
pioneered by Dutch traffic engineer Hans Monderman. By redesigning roads for shared
use by all modes, removing curbs, signs and traffic signals, significant reductions in traffic
speeds and accidents have been realised, along with improvements in travel times
(Hamilton-Baillie, 2008, Hamilton-Baillie and Jones, 2005).
Rather than increasing regulation and traffic control signs, research suggests that
soliciting a driver’s sense of personal responsibility, and increasing awareness and
engagement with other road users, may reduce speeds and improve safety (Hamilton-
Baillie and Jones, 2005, Transport Research Laboratory, 2005). This concept is most
useful in town centres that may require some vehicle access, but could benefit from
reduced vehicle volumes and speeds. The shared space design should be investigated for
town centres that are zoned for intensification and areas where a large portion of vehicle
trips are less than 5km.
Full pedestrianisation of streets in areas with high mixed-use densities should also
pursued as a means to stimulate further re-development in town centres, encourage
alternative modes, and ensure that land is used for the most optimal economic purpose.
An example of how pedestrianisation increases accessibility and thereby drives increased
commercial opportunities and economic activity is evident in areas such as Queen Street
in Brisbane. The central area of the street is leased by the council to private operators to
provide undercover and outdoor seating for café’s, bars, and merchandise kiosks that
increase commercial activity, provide direct revenue to fund Council activities, and
increase passive surveillance in the Downtown area.
These responses may be expected to contribute to increased uptake of alternative modes,
reduced fuel consumption, lowered vehicle speeds, reduced vehicle volumes, reduced
vehicle accidents, improved accessibility, and valuable use of road space in town centres.

5. Responses to Rising Oil Prices
74
5.5.2 Investment in Active modes
Recommendation: Territorial Authorities increase investment in active mode facilities. District
Plan changes should be investigated for the provision of end of trip facilities,
such as showers and lockers. Infrastructure investment should be coordinated
with parking reform and road pricing so as to maximise benefits.
Responsibility Territorial Authorities
Walking and cycling are by far the least oil intensive means of transport, and are the least
costly forms of transportation in every measure except time; including resource use and
pollution, infrastructure requirements, operating and ownership costs, safety risks, and
health and fitness benefits.
Despite being slower, walking and cycling have the most reliable travel times. In urban
areas where peak congestion is a problem, average walking and cycling speeds can be
comparable to other modes, particularly if entire journey time (including walking to PT or
looking for parking) are considered. More important than travel time, however, is journey
quality and ambience. Nelson, Marlborough, West Coast, and Otago enjoy some of the
highest active mode share despite minimal congestion (Statistics NZ, 2006).
Low active mode share may also be partially due to subsidised vehicle use, such as
abundant “free” parking at most destinations, which artificially lowers the cost of driving
for short trips. In addition to economic incentives, research suggests that mode choice is
partially determined by the built environment. Transport infrastructure that has been
allocated in priority to motor vehicles has resulted in barriers to the uptake of other
modes. The first barrier is due to development occurring in patterns that are spread out
and therefore increase the distances that need to be travelled. The second is that it has
created an environment that is highly unpleasant and perceived to be unsafe for walking
and cycling, especially within dense urban areas.
Many urban vehicle trips, even those that are part of longer trip chains (that is trips with
multiple links) appear short enough distances to be considered appropriate for active
modes (O'Fallon and Sullivan, 2005). Based on the experience overseas in areas with
high rates of walking and cycling, New Zealand’s climate and topography is not
considered a major impediment to uptake of active modes. As mentioned earlier, some of
the highest active shares are associated with Wellington, West Coast, and Otago regions,
all of which have somewhat challenging climates and topography.
5.5.3 Investment in Public transport
Recommendation: Territorial Authorities and Regional Authorities increase investment in public
transport. Investment should prioritise high quality long term solutions that
are able to influence land use development
Responsibility Territorial Authorities and Regional Councils (Central Government leadership)
The following paragraphs identify opportunities for implementing cost-effective
improvements to public transport.

Managing transport challenges when oil prices rise
75
HOV and Bus Lanes
Reallocating existing road space to alternative modes is a sound means of providing for
additional demand at low cost. Rather than widening road corridors to add new High
Occupancy Vehicles (HOV) and/or bus lanes along key arterials, converting one lane in
each direction from regular traffic or on street car parking will achieve much higher
capacity. Examples of HOV/Bus lanes carrying a greater number of passengers in peak
hours than original traffic lanes already exist in New Zealand, such as Onewa Road in
Auckland.
Expanding capacity for HOV and buses, while simultaneously reducing capacity for SOV,
further boosts the viability of car pooling and public transport by reducing travel times
without expending additional resources to expand road capacity. HOV/Bus lanes on their
own may not generate significant mode shift; their potential is more fully realised when
applied in conjunction with other recommendations such as road and parking pricing.
Modelling should accurately account for the potential of new HOV/Bus lanes to avert
traffic and cause modal shift. This is particularly important in the medium and long term,
when the provision of new infrastructure and the implementation of demand management
measures may encourage sustained behaviour change.
Park and Ride supported by Bus and HOV lanes
Park and ride (PNR) provide a short to medium term opportunity to integrate the road
network with HOV and/or Bus lanes. As oil prices rise and parking and congestion costs
are internalised, PNR is likely to become very attractive to those who commute from
automobile dependent areas, in advance of more enduring transport and land use
responses.
PNR should ideally be combined with HOV and dedicated bus lanes so as to maximise
peak hour carrying capacities. This can be for a dedicated bus service, or a casual car
pool pick-up point. Casual carpool has evolved in places like the San Francisco Bay Area,
and allows people to take advantage of HOV lanes and waived bridge tolls through an
informal and flexible arrangement (Taylor, 2005). Drivers and passengers queue at a
designated location at peak hour travel times and usually form carpools of 3 people per
car. There is no exchange of money between drivers and passengers; the mutual benefit
is simply the ride and the use of the HOV lanes to avoid congestion or tolls. While casual
car-pool is not usually run by public transport authorities or any other organisation, it is
logical for it to be encouraged and supported by allowing it to evolve at PNR stations.
Safety issues should be addressed in the design of such facilities, such as installing CCTV
cameras; however there are no known instances of untoward events in several decades of
casual carpooling in the United States (Taylor, 2005). Websites exist for established
casual carpool sites that allow users to comment on drivers or passengers to avoid.
PNR stations should be located near main arterials and away from town centres, where
land is inexpensive. Ideal locations include land that would otherwise be unsuitable for
high intensity development, such as land situated on flood plains and beneath high
voltage power lines. If demand for PNR grows to fill available capacity, then pricing

5. Responses to Rising Oil Prices
76
should be progressively increased so as to internalise costs and encourage the use of
more efficient modes, such as alternative modes, car-pooling, or bus feeder services, to
access the PNR station.
Public transport and Rapid Transit Systems
Demand for public transport is expected to increase as oil prices rise. Research in the
United States suggests that consumers who live in automobile dependent suburbs are less
price sensitive than those who have alternative means of transportation available
(Congressional Budget Office, 2008). The more public transportation options that are
provided, the less vulnerable to rising oil prices the New Zealand transport system will be.
The table below displays the least oil intensive public transport services appropriate for
different land use densities and travel distance.
Table 5.2 Least oil-intensive public transport in different densities (Kenworthy, 2003)
Area Appropriate infrastructure
Rural Car and van-pooling offer greatest flexibility to service dispersed origins for
small numbers of passengers
PNR for public transport (rail or high level of service bus) or carpool Low density
suburbs Bus and HOV lanes (where there is congestion)
Bus and dedicated bus lanes
Electrified buses and light rail Urban
Electrified heavy rail and elevated rapid transport systems
Intercity Electrified heavy rail
A detailed examination of the merits of individual public transport modes lies outside the
scope of this report, but it is important to consider the potential for high quality rapid
transit systems to influence land use and encourage higher density development.
Quality of service is important, and can be cost effective to improve in comparison to
other infrastructure investment. Recent research into the value of comfort and
convenience of public transport service suggests that transport funding should take into
account more than one value of time when evaluating investment in services (Litman,
2007e).
When a service is comfortable and users are able to work while travelling, for example,
their time is less valuable than if they are waiting or having to stand in a crowded bus.
This suggests that improvements to level of service of transport and reliability may be
more cost effective and beneficial to users than improvements that seek only to reduce
travel time. A service may thus be greatly improved if it targets and enhances the ability
to productively use and enjoy time spent on public transport services. By targeting

Managing transport challenges when oil prices rise
77
convenience and comfort, transportation authorities can seek to reduce the costs of
travelling (as is now done through efforts to reduce congestion by expanding capacity)
without inadvertently increasing the oil intensity of the transportation system.
It is noted that subsidies for motorised travel, by whatever mode, generate less energy
efficient travel and land use patterns. Subsidies for public transport are currently
provided for both capital infrastructure and operating subsidies. Given the pervasive
nature of the subsidies for private vehicles and their large external costs, continuing
subsidies for public transport is recommended. However, the responses outlined in this
report are expected to result in substantially increased demand and subsequently reduce
the costs of operating public transport services in New Zealand, stimulating increased
investment from private operators as well as reducing operating subsidies and thereby
freeing up regional funds for additional capital investment.
Overseas experience has shown that public transport systems are able to operate at full
cost recovery, particularly for major investments that deliver step changes in both
accessibility and mobility to public transport networks. For example, Dublin’s recently
completed light rail transit (LRT) system – the Luas – carried 26 million passengers and
returned an operating profit in 2006, which was only its second year of operation. An
excerpt from the transport agency’s annual report is repeated in full below due to its
relevance to this report (RPA, 2006):
RPA earned a surplus of €5.6 million in 2006 on the provision of Luas infrastructure,
reflecting the continuing growth in passenger numbers travelling on Luas during the
year. Total passengers reached almost 25.8 million, an increase of 16% on 2005,
the first full year of passenger service. A feature of Luas that has attracted much
interest among transport specialists is the popularity of the service in the time of
day traditionally regarded as off-peak. By offering a high frequency service, with
high reliability, people within the catchment area of Luas have embraced the
service to a greater extent than would be suggested by the economic modelling,
which is based largely on the savings in journey time relative to other modes of
transport. This high quality service for passengers, which has resulted in high
capacity utilisation at all times of the day, has in turn contributed to the financial
success of RPA.
The optimal public transport mode will vary significantly depending on the context. Bus
Rapid Transit (BRT) may help minimise capital costs in the early stages of system
development as well as provide for increased service frequency. LRT may support higher
capacities and be more suited within existing town centres. Ultimately, the coordinated
deployment of rapid transit systems and the other responses identified in this report is
expected to catalyse a step change in the performance of New Zealand’s public transport
networks.
5.5.4 Multi-modal integration
Recommendation: Regional Councils work with Central Government to integrate transport modes.
Responsibility Regional Councils (Central Government leadership)

5. Responses to Rising Oil Prices
78
Sustained high fuel prices will increase the need for linked multi-modal journeys. Such
journeys may, for example, use vehicles to access a bus PNR station, after which a
walking trip is involved to the final destination.
In a vehicle dependent landscape where trips are dispersed, a combination of active
transport, PNR, and public transport is likely to be the most energy efficient means for
individuals to arrive at their destination. The ability to bring bicycles on trains and buses,
and/or park them securely at public transport stations, should also be universal and
convenient.
Public transport terminals need to become a highly visible focal point of surrounding
footpaths, cycle networks, and land use development. Integration between alternative
transport modes will thus assist travel patterns that do not use a private vehicle for most
if not all of the trip.
Integrated electronic ticketing should be a priority to enable flexible use of public
transport services, more flexible payment options, and more rapid boarding. Where PNR
incurs charges, this should be able to be paid using a public transport card. Additional
services could include using such cards to pay for taxi services where public transport
does not provide a viable option.
It is noted that some work is already underway in this area and the establishment of the
NZTA may accelerate progress towards an integrated transport system.
5.5.5 Taxi services
Recommendation: Central Government update taxi service regulations to reflect energy efficiency
goals.
Territorial authorities work with taxi services in medium and large cities to
ensure that services complement other transport and land use initiatives.
Responsibility Central Government and Territorial Authorities
Taxi services will remain important as the use of private vehicles for home to work
journeys reduces. It will be therefore important for cities in New Zealand to provide for
and manage taxi services, such as the location of taxi stands. On-street parking pricing
may be a good way to manage this. New York City has pioneered an approach to
greening the city’s taxi vehicle fleet through an incentive programme with taxi driver co-
ops and unions, and expects all taxis to be hybrid vehicles by 2012. Working with taxi
providers to ensure the greatest efficiency of the taxi fleet will have positive benefits for
both taxi service providers, in terms of reduced pollution and lower costs and prices.
It may also be possible to better integrate taxi services with public transport services,
through the installation of “free” taxi phones and taxi stalls at terminals.

Managing transport challenges when oil prices rise
79
5.6 Behaviour Change and Education
Rising oil prices will be a challenge to modern society because for many decades our
economy and lives have been predicated on cheap oil. One advantage of the recent oil
price spikes has been an increased awareness of vulnerability; it sends a clear signal to
consumers and producers that changes will have to be made. However, rapid price
increases will make the transition period more intense and difficult. Communication of
the situation and education around how individuals, households, and communities may
best respond will be essential to manage this transition effectively.
Strong coordinated relationships between infrastructure development and education and
social marketing are crucial to achieving behaviour change, as government agencies
cannot educate or market a transport 'product' (e.g. public transport) if that product does
not exist in a usable form. It is essential that travel behaviour change and the other
responses (land use, pricing and infrastructure) be considered together.
Conversely, education and advertising activities that solely focus on raising awareness are
unlikely to be a useful or effective approach to behaviour change. To achieve behaviour
change requires a ‘multi-channel, multi-activity’ approach. This refers to programmes that
combine a range of different communication messages, channels, and initiatives to reach
their audiences and address different emotional and practical barriers. These
programmes need to be on-going; not one-off events.
Understanding communities is essential to identifying which barriers prevent the uptake
of sustainable transport and land use choices and what motivators (e.g. fuel prices,
health, and environmental sustainability) would deliver more informed choices. It is
difficult to pitch schemes nationwide, as local differences are so pronounced. For example,
rural communities have fewer travel mode options.
Any travel behaviour change initiative should have a target audience. Understanding
businesses and individuals that are vulnerable to petrol prices is one form of market
segmentation, however being vulnerable to fuel cost does not equate to willingness to
change behaviour. Different audiences will be motivated by different things. Developing
sound research and a good evidence base on understanding the needs of the community,
segmenting the market, and identifying the target audience(s) is critical to the success of
any travel behaviour change programme.
For example, increased car-pooling has the potential to reduce congestion and mitigate
higher fuel costs, providing an effective short-term response to higher fuel prices.
However, government agencies should not solely focus on the provision of infrastructure
designed to increase rates of car-pooling, such as HOV lanes, but also softer measures,
such as websites through which people may register for car-pooling. These latter types of
measures are crucial for overcoming behavioural inertia and facilitating sustained change.
Behaviour change and education is a challenging area, but one where good case studies
exist. Examples include “Eco-driving” campaigns that increase awareness of efficient
driving practices and schemes that encourage people to scrap older vehicles in exchange
for monthly bus passes (IEA, 2005, MOT, 2008e).
5. Responses to Rising Oil Prices
80
5.6.1 Travel Plans
Recommendation: Travel Plan support programmes be developed and expanded to assist
organisations to undertake travel plans. Develop regulatory or financial
incentives for organisations to develop travel plans.
Responsibility Regional Councils and Territorial Authorities
Travel plans are a management tool that assists organisations, businesses and schools to
reduce travel demands associated with both home-to-work/school and work/school based
travel.
Travel plans help to address organisational issues affecting how people choose to travel,
such as company cars and free parking. Company policy changes have been shown
catalyse large reductions in employee vehicle use, including:
• Parking cash-out – provides commuters who normally receive free parking to take
cash instead;
• Company car cash-out – as per parking cash-out except for company cars;
• PT passes - involves providing employees with a subsidised PT pass in place of a
free car-park;
• Flexible working/school hours, shorter week – reduces the number of school/work
commute trips per week;
• End of trip facilities for cyclists, including showers and lockers; and
• Car pooling within the organization.
A primary motivation for businesses and schools to develop travel plans is often provided
by the accurate realisation of the costs associated with vehicle travel. For this reason, the
use of travel plans is expected to increase when the perceived value of driving reflects its
underlying costs. Moreover, the removal of minimum parking requirements may
encourage existing property owners to use travel plans to free up land to provide
redevelopment opportunities. Regional councils may be able to provide tools and services
that facilitate increased uptake of travel plans, particularly amongst large employers.
Additional reasons to adopt travel plans include improved health and fitness of
employees/students, increased motivation and reduced sick leave.
5.6.2 Car-share
Recommendation: Territorial authorities provide support for car-share organisations, particularly
co-operative or non-profits, in the form of information on how to start one,
subsidised parking, and/or organisational promotion. This may be by through
TMA (see below).
Responsibility Territorial Authorities

Managing transport challenges when oil prices rise
81
The responses outlined in this report may reduce the practicality of vehicle ownership, but
most households and businesses will still need occasional access to a private vehicle.
Car-share organisations provide convenient access to a vehicle that is paid for directly
commensurate to use. They manage a pool of vehicles parked at numerous locations
around urban areas, which are available for short and long term use. Members of the
organisation are able to book vehicles online and then access the vehicles via electronic
swipe cards. One car-share vehicle is typically utilised by a large number of people,
thereby distributing the costs of car-ownership, such as maintenance and parking, across
a larger number of people.
Membership in a car-share organisation is often most attractive to households that do not
rely on vehicles for home-to-work commuting, or small to medium sized companies that
do not need to manage their own pool car fleet. By removing the need for commercial
pool vehicles, the incentive for employer-funded vehicles is also removed. In this way,
car-share vehicles are frequently used for commercial purposes during the day and
residential needs during off-peak hours.
Numerous studies have indicated that members of car-sharing organisations have more
sustainable travel patterns, with higher reliance on walking, cycling, and PT. As discussed
above, residential use of vehicles is typically reduced to off-peak trips, such as grocery
shopping and recreational visits. Members of car-share organisations have been found to
reduce VKT by up to 40% compared to their previous travel patterns – which highlights
the effects of direct pricing on demand for vehicle travel (Shaheen et al., 2005).
5.6.3 Transport Management Associations
Recommendation: Territorial authorities establish TMA in town centres and key suburbs.
Responsibility Territorial Authorities
Transport management associations (TMA) are usually formed to manage the provision of
transport within a particular geographical area. They frequently involve both public and
commercial stakeholders so as to connect strategic directions with on the ground
community interests. The community and business roles in a TMA make it an ideal
structure for disseminating information, educating stakeholders, and engaging the
community to understand and help create the best solutions in a given locality.
Possible functions of TMA may include:
• Parking brokerage services – designed to connect demand for parking with
surplus private off-street parking resources.
• Input into the allocation of parking revenues – TMA provide an interface through
which small community projects are identified and funded using parking revenues.
• Over-seeing the management and implementation of travel plans and overflow
plans, such as for special events and seasonal shopping patterns.

5. Responses to Rising Oil Prices
82
• Coordination of car sharing, home delivery, or other mobility market solutions
that will work in the specific context of a given community.
The benefits of a TMA is that is provides an on the ground presence that manages smaller
scale transport issues that fall below the radar of territorial authorities, or where constant
community input in desired. TMA may also coordinate travel plans across multiple
businesses and organisations within an area, increasing opportunities for car-pooling and
resource sharing.
Lloyd District in Oregon, has had a TMA operating for approximately 10 years
(www.lloydtma.com). This encompasses 650 business and 21,000 employees. From
1997 to 2006 the Lloyd TMA was able to reduce drive alone mode share from 60% to
42% and increase public transport mode share has almost doubled from 21% to 39%.
The reductions in drive alone trips has significant implications for the amount of parking
required to support land use in the Lloyd District. The increased efficiencies catalysed
both by the reduced demand for parking and the increased transport accessibility has
facilitated an additional 20,000 employees and 4,000 housing units being located in with
the District.
5.6.4 Route Planning Information
Recommendation: Regional Councils work to improve and expand of route planning websites.
Responsibility Regional Councils
Route planning websites (such as MAXX in Auckland or Metlink in Wellington) are crucial
to enable people to find the best means of getting from an origin to a destination, at a
given time. They demystify public transport services for those who have never used
them, and they increase the convenience for all users. Such websites should be
expanded to other regions, even those that do not have extensive public transport
services. Estimated bicycling times and route information would be a valuable addition to
the current information provided on walking. Information on parking availability and
prices, and road pricing can also be incorporated into these sites eventually, enabling
people to quickly compare the cost and time of vehicle trips with alternative modes.
These sites should be easy to find; a Google search of “Wellington public transportation”
did not turn up the PT website in the top 10 hits, even though “Wellington public
transport” ranked it first.
Information on public transport routes and timetables is often quite poor and extremely
difficult for first time users. Route information should be clear and easy to read at
terminals and on vehicles themselves. Stops should have names that are clearly visible
from the vehicle. Route maps and timetables should be freely available at key locations.
Real time information may be useful in areas where services are unable to keep to a
regular timetable, although with the expansion of HOV lanes and the reduction in
congestion that is expected from regulatory and pricing mechanisms, this should be less
of a problem than is has been in the past. When a service is delayed or cancelled, there
should be sufficient warning or replacement services provided for users. All these
measures are designed to ensure that travel decisions are made in an environment

Managing transport challenges when oil prices rise
83
characterised by complete and convenient access to information on alternative modes,
thereby supporting more informed consumer choices and more relaxed public transport
experiences.
5.7 Freight Management
Freight movements are by their nature trips that have an economic function – they serve
to bring raw materials to producers, take goods to market, and deliver services. Freight
thus differs from personal transport in so far as it is usually more essential and of higher
value. For this reason freight travel deserves its own set of management responses.
Many freight movements by road will benefit from the management responses described
above: internalising the costs of road use will discourage passenger trips that are low
value or substitutable by other modes. This will reduce peak hour congestion allowing
freight vehicles to travel more freely. Direct and efficient pricing may also catalyse
effective market responses to reduce freight costs, such as the FreightHub
(www.freighthub.co.nz) model, which connects existing spare truck capacity with
customers to increase overall system utilization. An increased emphasis on surface
quality rather than capacity expansions is also expected to deliver fuel efficiency benefits
to freight operators. Finally, increased investment in road network maintenance may
mean that larger and heavier trucks are more readily accommodated.
The following sections outline more targeted responses that may deliver localised
improvements in the efficiency of freight movements.
5.7.1 Regional freight strategies
Recommendation: Regional authorities develop freight strategies, including opportunities for
integrated ports (rail and coastal shipping).
Regional freight strategies should seek to facilitate mode shift by using the
mechanisms described in the following section.
Responsibility Regional Councils (Central Government Leadership)
The government has a Rail to 2015 strategy (MOT, 2005a) and has recently released a
coastal shipping strategy, Sea Change (MOT, 2008). Improvements to rail and coastal
shipping infrastructure may be expected to provide improved options for freight mode
shift when faced with high transport costs. However, industries and access to coastal and
inland ports vary greatly by region. For this reason, specific freight strategies may need
to be advanced at the regional level to ensure modal integration. Such freight strategies
should seek to identify key freight routes and potential multi-modal hubs. Routes with a
high volume of heavy vehicles could be targeted for low friction surface improvements so
as to improve fuel efficiency.
5. Responses to Rising Oil Prices
84
5.7.2 Home delivery Services
Recommendation: Territorial authorities (TMA) investigate potential for advertising and
coordinating home delivery services
Responsibility Territorial Authorities (Central Government Leadership)
Home delivery of goods was once a common service in New Zealand, before car
ownership reached high levels. As costs of parking and vehicle trips are internalised and
oil prices rise, it is likely that home delivery will once again achieve economies of scale.
Home delivery services are expected to provide cost-effective access to goods and
services for households and communities that cannot afford to travel long distances and
those that cannot drive. Such services are expected to be particularly important in more
isolated rural communities. While this is primarily a market-led response, territorial
authorities may foster earlier development through information and coordination of
services though a TMA. Home delivery would have benefits for management of traffic and
parking demand, and would be facilitated by increasing levels of internet access.
5.7.3 Opportunities for Active Freight
Recommendation: Regional and territorial authorities include active freight delivery in freight and
transport strategies for town centres and areas that are suitable for vehicle-
free development.
Responsibility Regional Councils and Territorial Authorities (Central Government Leadership)
Solutions for freight delivery not reliant on motor vehicles should not be underestimated.
In European countries where vehicle-free zones are fairly common, such as St. Mark’s
Island in Venice, Italy, freight is delivered by active modes using a variety of small
wheeled equipment. These areas often have active retail and commercial zones that
require regular freight deliveries. Active freight delivery, if undertaken carefully, is a
beneficial means of delivery in terms of reduced dependence on oil and decreased
adverse effects within sensitive zones where land use intensification is desired. As part of
a regional freight and sustainable transport strategy, regional and territorial authorities
could work with delivery service providers and businesses to ensure that these solutions
are available in town centres that are likely to restrict vehicle access. TMA may also be
an appropriate institutional structure for coordinating such services where there is
demand, for example, by consolidating loading bays around pedestrian streets so that
access by active freight is possible.
5.8 Summary of Responses
This section summarises the recommended responses identified in the previous section.
An example from the East Cape was discussed at the beginning of Section 5. The
following discussion identifies how the recommended measures are able to influence the
travel and land use patterns of residents in isolated communities in ways that reduce their
vulnerability to rising oil prices. This focuses on the potential benefits to Te Araroa, a
Managing transport challenges when oil prices rise
85
small beach community located close to the East Cape. Travelling from Te Araroa to
Gisborne requires a 200km round trip, which in the average car at today’s fuel prices
would cost approximately $45 (excluding other variable operating costs). The
recommended measures are applied to both Gisborne and Te Araroa to highlight how
benefits are delivered to both communities, although naturally the isolation of the latter
means these benefits are more important in the context of high fuel prices.
The catalyst for change in Gisborne is the removal of minimum parking requirements,
which allows for redevelopment in the Town Centre. As denser and more diverse
development progresses in Gisborne, the available parking supply is reduced and prices
are implemented to manage demand. Retailers in Gisborne benefit from the larger
population of local residents and employees, which tend to provide more regular custom.
Parking prices affect people travelling from Te Araroa – they travel to Gisborne less
frequently and start to shop more at the local shop – a response identical to that
associated with higher fuel prices, although more permanent given the fact that parking
charges are less variable than fuel prices. When Te Araroa residents do need to travel to
Gisborne, they seek to coordinate their travel times through and car-pool and thereby
split fuel and parking costs. A local resident sees decides to formally respond to changing
travel demands and starts a daily shuttle service between Te Araroa and Gisborne, which
also stops at a number of other towns along the coast.
Despite enjoying increasing numbers of customers, businesses in Gisborne realise that a
combination of high fuel prices and parking fees is dissuading visits from people living in
more remote communities. These businesses subsequently establish a weekly home
delivery service to provide access to outlying communities. The service charge for using
this home delivery is approximately $20 per order – which is about half the combined cost
of driving and parking on its own. As well as reducing the need to travel, home delivery
provides suddenly provides access to goods and services for those households who do not
have access to a vehicle. At the same time, however, the local shop in Te Araroa has
used revenues from the upturn in business to provide home delivery services at a lower
charge than retailers from Gisborne – competition begins to emerge and deliver benefits
to isolated communities.
In the medium term the implementation of urban containment has focussed residential
development around the Te Araroa store. The local shop subsequently expands and
begins to stock a larger range of goods. The larger resident population also supports the
development of a small two-storey building with a butcher shop, fresh produce store,
café, restaurant, and automatic teller machine (ATM) on the ground floor along with
residential accommodation on the second level overlooking the beach. Te Araroa
residents now have access to a wider range of local goods and services, which once again
reduces the need to travel to Gisborne. In terms of the latter, the local business soon
realise that they are unable to compete for more remote customers and subsequently
focus on redeveloping the downtown area to attract those customers are tourists who
already reside or are travelling to Gisborne.
5. Responses to Rising Oil Prices
86
Thus even in the most isolated rural communities, the responses are able to reduce the
reliance on vehicle travel and increase local access to goods and services in a way that is
responsive to local needs.
There are a number of key messages that should be taken from this example, namely:
• Subsidised travel (i.e. parking) in urban centres directly undermines the viability of
more isolated rural communities from developing the types of local businesses and
services that they will need to manage sustained high oil prices.
• Subsidised travel is a net loss for both towns – it is beneficial for Gisborne to intensify
and diversify in ways that cater for local residents and employees, while it is beneficial
for Te Araroa residents to have access to local goods and services.
• Land use and pricing mechanisms are likely to be more relevant in rural situations
than infrastructure based responses. These mechanisms reduce the distance
travelled, allow for consolidated development, and support uptake of active modes.
• Direct and efficient pricing mechanisms are crucial for motivating the emergence of
market based outcomes, such as home delivery. Alternatively they may encourage a
van-pool services that connects isolated East Cape communities to Gisborne – which
is also more likely to emerge in situations where parking is priced.
• Expenditure on vehicles and fuel may be expected to reduce and free up disposable
income for reinvestment in local communities, some of which is likely to generate
additional development and support increased local employment – thus establishing a
feedback loop that may lead to further positive outcomes than those identified above.
In spite of the hypothetical nature of this example, the outcomes are realistic - indeed
some of them are happening already simply as a result of higher fuel prices. Reliance on
oil based transport fuels is reduced in both Te Araroa and Gisborne, which highlights the
potential for the recommended measures to deliver win-win solutions. It is beneficial for
business in Gisborne to have greater numbers of local residents and employees, thereby
reducing the demand for car-parking and increasing opportunities for redevelopment,
while it is also beneficial for Te Araroa residents to create demand for local shops,
businesses, and services.
The table below summarises the responses, identifies the agencies responsible, and
outlines the time-frames within which they may be implemented.

Managing transport challenges when oil prices rise
87
Table 5.3: Evaluation of Potential Responses to Rising Fuel Prices
Category Response Details Time frame
Agency
Parking regulation and management Central Government implement an NES or NPS that will direct TA's to remove minimum parking requirements and progressively manage and price public parking supply.
Short Central and TAs
Flexible zoning and urban containment RCs and TAs adjust zoning regulations to encourage a mix of uses in developed areas, with appropriate provision for amenity and implement stricter zoning or MUL to discourage residential or commercial development in areas that require private vehicles for access.
Short Regional and TAs
Development incentives Central Government research sophisticated development contributions that stimulate less oil intensive growth and support other planning objectives.
Medium Central and TAs
Central government enable TAs to stimulate renewal of urban areas through increasing investment and / or reducing compliance costs.
Medium Central and TAs
Land use
responses
Urban renewal and TOD
Identify and invest in existing or potential TOD sites, incorporating parking and zoning recommendations made previously Medium TAs
Commercial parking rate Implement a targeted rate to fund local road maintenance and operations based on the number of car parks provided with non-residential premises Medium TAs
Road pricing Progress implementation of national road pricing scheme that fully internalises all costs. Long Central
Direct and efficient pricing
Tax treatments Ensure tax treatments relating to commercial travel expenses provide appropriate incentives to travel and use fuel efficiently Medium Central
Reallocation of road space including shared space and pedestrianisation, prioritising access over mobility. Transforming roads into streets
Improve surface treatments Short TAs
Active modes Increase investment in active mode facilities and investigate plan changes for end of trip facilities Short TAs
Provide HOV and / or bus lanes on arterial roads corridor by removing parking and / or reallocating existing vehicle lanes
PT services and infrastructure Invest in PT services and improve infrastructure as demand increases
Short/
Medium
TAs, RCs (Central)
Multi-modal integration Facilitate modal transfers through the implementation of convenient systems and payment technologies Medium RCs
Infrastructure investment
Taxi services Central Government update taxi service regulations to reflect energy efficiency goals Medium Central
Travel Plans Encourage the increased uptake of travel plans at key destinations, such as workplaces and schools Short RCs and TAs
Car-sharing / Bicycle-sharing Facilitate the emergence of car-sharing and bicycle sharing organisations Short TAs
TMA Facilitate the establishment of TMAs in town centres to coordinate non-strategic transport services, such as parking management services
Short/ Medium
TAs
Behaviour change
and education
PT Information Improve and expand transport websites and route information Short RCs
Regional Freight Strategies Develop Regional Freight Strategies that facilitate mode shift and offer opportunities for multi modal ports Medium RCs
Home delivery TAs (with TMA) investigate potential for advertising and coordinating home delivery services Medium TAs Freight
management
Active freight Encourage the use of active freight in town centres Short TAs
5. Responses to Rising Oil Prices
88
5.9 General Legal Considerations
This section summarises general legal considerations that may affect the implementation
of responses to rising oil prices. Specific legal analysis of individual measures is
contained in Appendix K.
The existing transport and land use planning environment provide extensive opportunities
for public participation. Public participation can provide a direct barrier to swift action
where the public are afforded opportunities to appeal determinations and decisions. In
those circumstances proposals can quickly become bogged down and in some instances
never be implemented at all.
A relevant example is the policies proposed by the Local Government (Auckland)
Amendment Act 2004 (LGAAA). The LGAAA seeks to improve the integration of
Auckland's regional land transport system. This would require amendment to the
Auckland Regional Policy Statement and the district level planning documents. The
LGAAA came into force on 1 July 2004. Proposed changes to the RPS and district
planning documents were notified on 31 March 2005 and decisions on the submissions
received were released on 31 July 2007. The Environment Court received more than 160
appeals to those decisions raising issue with the changes. An optimistic assessment
suggests that the appeals will take until the end of 2009 to resolve.
In summary, the proposed changes took three years to develop including consultation
with communities and for decisions to be made following this consultation. Once the
decisions were released a huge number of appeals were lodged which will take up to two
years to resolve. Once the appeals are resolved and the RPS is finalised, the total time
taken from the date the Act came into force would accrue to at least five years.
This environment can make responsive action in a timely manner impossible. In response
to supply shortages of oil based fuels central government can introduce regulation by
Order in Council to bypass these processes and implement emergency measures under
the Petroleum Demand Restraint Act 1981. If the supply of petroleum dwindled to point
that insufficient stock is available to maintain ordinary prudent stocking levels then the
broad powers under section 4(2)(b) could be invoked to "Restrict, regulate, or prohibit the
use of motor vehicles or any class of motor vehicles."
Invoking emergency powers is not an appropriate approach to sustained high prices -
which may or may not reflect supply issues. This is more effectively addressed through
sustained and progressive reform in advance of the prices, as well as rapid roll out of
alternative infrastructure in the event of an unexpected price spike. For this reason there
is a need to reconsider the way that public consultation is integrated into the
development of the transport system, which balances the need for consultation against
the flexibility to chance tack in response to unforeseen energy prices. Measures could
seek, for example, to allow government agencies to accelerate certain projects that have
already been identified in long term strategic planning documents with the need for
further consultation. Exactly where the balance between consultation and flexibility is
outside the scope of this report, but should be the subject of further research.

Managing transport challenges when oil prices rise
89
6. Impacts of the Recommended Responses
This section assesses the impacts of the responses identified in the previous section.
Firstly, the recommended responses are assessed in terms of their impacts on VKT. This
analysis found that the recommended responses appear to cap demand for vehicle travel
at or below current levels. Static demand for vehicle travel corresponds to substantial
growth in demand for alternative modes.
Secondly, the energy efficiency benefits delivered by the recommended responses are
quantified in terms of expected mode shift and its consequential impacts on oil intensity.
This analysis does not include the effects of higher quality road surfaces on vehicle fuel
economy, which are expected to deliver substantial benefits, particularly for heavy
vehicles.
Thirdly, economic benefits were analysed on the basis of consumer costs savings (fuel
and operating costs) and welfare benefits (congestion costs, air quality, greenhouse gas
emissions, and physical activity). More pervasive but nonetheless tangible macro-
economic impacts are also identified, although these are difficult to quantify.
Finally, risks associated with the recommended responses are discussed in terms of their
potential to result in inadequate road capacity and localised economic shocks (defined in
subsequent sections). This identifies the need for coordinated, signalled, and staged
implementation so as to allow time for efficient and consistent behaviour change and
adaptation.
Ultimately, the results of this section highlight that the recommended responses may be
expected to deliver enduring economic, social, and environmental benefits. This transport
paradigm is different in that it seeks to place a balanced focus on both sides of the travel
equation and seeks to manage travel demand in addition to supply.
6.1 How the Responses Impact Travel Demands
The impacts of the recommended responses were assessed in terms of the following
parameters:
• Expected coverage: The proportion of vehicle travel affected by the response,
estimated as a combination of geographical and temporal (time based) factors;
• Implementation timelines: The time required to implement the responses in regard to
their operational complexity, regulatory requirements, and legislative changes;
• Nature of implementation: The way in which the responses are implemented, in terms
of incremental and/or step change; and
• Maximum impact: The maximum impact of the responses on VKT as estimated from
international and local studies and experiences.

6. Impacts of the Recommended Responses
90
Values for these parameters are summarised in Table 6.1, with further details on the
assumptions on which they are based contained in Appendix G. All responses were
assumed to be fully implemented by 2028. Not all responses are shown below as their
impacts on VKT were considered to be either negligible or too difficult to quantify.
Table 6.1: Parameters Controlling the Impacts of the Recommended Measures
Recommended response Affected areas Coverage
Maximum Impact
Start Step
change
Parking Management
Urban 26% 20% 2011 No
Road Pricing Urban 14% 20% 2017 Yes
Zoning Urban 78% 10% 2009 No
Public transport Urban centres > 100,000
19% 15% 2009 No
Alternative modes Urban 20% 10% 2009 No
Multi-modal Mainly Urban 80% 5% 2009 No
Information National 100% 2.5% 2009 Declining12
Travel Plans Urban workplaces 20% 5% 2009 No
Car-pool / Car-share
Urban 50% 5% 2009 No
Determining the individual impacts of these responses is complicated by their inter-
related effects. It is important that such effects are not ‘double-counted’ – hence the
relatively low impact attributed to some responses, such as car-pool and car-share.
Other responses such as parking management and road pricing may be expected to
increase rates of car-pooling, but this effect is factored into the relative attributed to
these responses. This is not to suggest that car-pooling is ineffective, but rather that it
has relatively limited potential to affect travel demands on its own. These inter-related
effects support the implementation of a broad package of responses, as opposed to
selectively ‘picking winners.’
It has been assumed that commercial travel demands are unaffected by these responses.
Increased costs associated with road and parking pricing may cause some reductions in
low value commercial travel, although reduced congestion on the road network may allow
for additional commercial travel demand that was previously suppressed.
12 Information and marketing campaigns are likely to bring forward or accelerate behaviour change that would otherwise occur more slowly. For this reason the impact of information declines over time, hence the declining impact attributed to this response.

Managing transport challenges when oil prices rise
91
The VKT reduction caused by recommended responses is expected to generate increased
demand for alternative modes. This demand was modelled using mode substitution
factors. Local data on these factors is not available, so it was assumed that 50% of the
reduction in VKT is taken up by public transport, 10% by car-pooling, and 15% active
modes respectively. The remaining 35% of VKT is averted through a combination of
subtle adjustments such as trip-linking, trip-consolidation, telecommuting, and avoided
travel. Figure 6.1 illustrates the resulting impact of the recommended responses on
future travel demands under the Average fuel price scenario.
Figure 6.1: Impact of Recommended Responses on Travel Demands 2007-28
0
10
20
30
40
50
60
2007 2008 2009 2010 2011 2012 2013 2014 2015 2016 2017 2018 2019 2020 2021 2022 2023 2024 2025 2026 2027 2028
Tota
l Tra
vel [
billio
n K
T pe
r yea
r]
Passenger Vehicles Commercial Vehicles Alternative Modes
The recommended responses thus appear to cap total VKT slightly below current levels,
while demand for alternative modes grows markedly.
Total travel by light passenger vehicle falls from 31 to 27 billion VKT per year and
kilometres travelled by commercial vehicles and alternative modes grow substantially.
From 2007 to 2028 travel by all modes increases from 44 to 48 billion VKT, at an annual
average rate of 0.5%, although travel on the road network reduces slightly at an annual
average rate of -0.2% with most the reduction in travel occurring in the period 2008-11.
There is a marked shift from light vehicle travel to alternative modes, such that the latter
increases from 8% to 19% by 2028 whereas the former declines from 72% to 56%.
Heavy vehicle mode share grows from 20% to 23%.
From 2008 to 2028 total travel demands are expected to grow – this growth can be
though of as the marginal increase in travel demands between now and then. During this
time the balance of growth is split unevenly between the different travel categories.
Figure 6.2 how the marginal travel demand growth (i.e. the travel demand growth from
2007 to 2028) is split between commercial vehicles and alternative modes. It is the
marginal demand growth which shows which where pressure on the transport system may
be expected.

6. Impacts of the Recommended Responses
92
Figure 6.2: Marginal Travel Demand Growth following implementation of Responses
32%
68%
Commercial vehicles
Alternative modes
Marginal travel demand growth under the three fuel price scenarios is summarised in
Table 6.2.
Table 6.2: Marginal Travel Demand Growth by Mode and Fuel Price Scenario 2007-28
Fuel Price Scenario Mode
High Average Low
Passenger vehicles 0% 0% 33%
Commercial vehicles 26% 32% 30%
Alternative modes 74% 68% 37%
Annual average VKT growth -0.98% -0.14% 0.88%
Annual average travel growth 0.13% 0.60% 1.25%
Marginal demand growth for the different modes is particularly stable across the various
fuel price scenarios. Most notably, however, even in the low fuel price scenario
alternative modes account for the largest proportion of the growth in travel demands.
Total travel demands grow in all fuel price scenarios, while travel on the road network
reduces in both the high and average fuel price scenarios and grows at just under 1% per
annum in the low fuel price scenario.
Detailed discussion on the implications of this analysis for transport funding is outside the
scope of this report, although some general comments are warranted. Firstly, it is
emphasised that these results do not necessarily suggest 68% of all transport funding
should be applied to alternative modes. A more appropriate interpretation is that the
breakdown in marginal demand provides a basis for allocating investment in additional
transport capacity. Maintaining and improving the existing transport network will be a
priority, particularly in the short-term and until the full impacts of the recommended
responses are worked through. Moreover, increased commercial vehicle travel may
require substantial improvements to the road surface on major routes, which will also
deliver improvements in energy efficiency. It does appear, however, that the application
of the recommended responses would support substantially increased investment in
alternative transport modes, particularly in the short term.

Managing transport challenges when oil prices rise
93
This modelling is intended to provide only a preliminary indication of the potential effects
of the recommended responses on future travel demands. Results are dependent on the
assumptions of the coverage (spatial and temporal), timing (start and rate of
implementation), and impacts (short and long term). Further work could refine this
modelling to provide a more detailed picture of the implementation timelines and the
complex travel demand responses that may arise.
The possibility for further work should not however be construed as suggesting the results
presented above are optimistic. Indeed it is possible that this approach has
underestimated the potential for these responses to initiate auto-catalytic processes (also
known as positive feedback loops) that motivate further reductions in vehicle ownership
and use and/or increased uptake of alternative modes. An example of such a process is
that reduced congestion on the road network will allow for more reliable bus journeys,
which increase the relative attractiveness of bus travel. This may subsequently increase
ridership and fare revenue and subsequently the viability improved services. These
improvements would once again increase the attractiveness of the service, attract new
riders, and thus begin the process anew (Levinson and Krizek, 2008).
Auto-catalytic processes may also cause more substantial reductions in light passenger
vehicle travel. In particular, the cumulative impacts on vehicle ownership of direct and
efficient pricing; denser and more diverse land use; and increased investment in
alternative modes have not been modelled. These responses would perceivably reduce
the economic utility associated with light passenger vehicles, which may cause long term
reductions in travel. Previous analysis indicated that changes in vehicle ownership may
account for historical growth in VKT, growth which the recommended responses are likely
to undo.
Less obvious are the impacts of innovative market responses that a more directly and
efficiently priced transport network may be able to generate. This may make use of
improving information technology to connect people and deliver information and services
without the need for travel. For example, higher transport costs may see greater use of
video-conferencing as a substitute for business travel.
6.2 How the Responses Deliver Energy Efficiency
This section identifies how the recommended responses result in more energy efficient
travel patterns.
Figure 6.3 illustrates the estimated mode share changes that are expected to result from
the recommended responses. This illustrates that PKT by alternative modes more than
doubles from 6% to 14%, whereas mode share for light vehicles drops from 51% to 40%.
Car-passenger mode share remains the same, suggesting that there is an increase in
average vehicle occupancy from approximately 1.6 to 1.7 people per vehicle. The mode
share for commercial vehicles increases from 14% to 18%.

6. Impacts of the Recommended Responses
94
Figure 6.3: Affect of recommended responses on VKT mode share by 2028
The recommended responses are anticipated to cause a 21% reduction in oil intensity
over the next 20 years. This would see, for example, average transport fuel consumption
declining from the 1,000 litres per capita discussed previously in Section 2.4 to
approximately 790 litres per capita by 2028 – all other things being equal. 13
The reduction in oil intensity provided by the recommended responses is approximately
three times that provided by the improvements in fuel economy considered in the Base
case. Only under the High fuel price scenario is travel expenditure on oil based transport
fuels expected to increase. This analysis is expected to be conservative because it does
not account for the effect of denser and more diverse land use patterns on average travel
distances.
6.3 What are the Economic Benefits?
The responses outlined in this report are likely to have major impacts on the way that
New Zealanders travel. Demand for vehicle travel is expected to reduce, both in total and
per capita terms, while demand for alternative modes is expected to increase.
13 Note that the mode shares illustrated in Figure 6.3 have been assumed on the basis of all other factors being equal. This is particularly problematic in the case of public transport, and especially rail. Rail accounted for the largest relative increase in mode share for home to work journeys in the 2006 census, while bus, walking, and cycling mode share fell. This is likely to reflect substantial investment in Auckland and Wellington’s rail networks as well as a tendency for rail to pick up longer distance trips that would otherwise be undertaken by light passenger vehicle – the same trips that are likely to be most affected by higher fuel prices. For these reasons the increase in rail mode share is likely to be under-estimated in relation to the other alternative modes. Further research should seek to expand on the analysis in this report so as to provide a more accurate indication of the relative breakdowns in mode share between alternative modes. Note also that this does not account for additional investment in public transport, which may be expected to cause more mode shift than that illustrated in Figure 6.3 – particularly in Auckland. For these reasons the mode share for alternative transport modes is likely to be relatively conservative.
Travel Demands
Passenger [82%] Commercial [18%]
Alternative Modes [14%]
Public transport [10%]
Active Modes
[4%]
Light Vehicle [68%]
Heavy Truck Heavy Bus
[7%]
Light Commercial
[11%]
Driver [40%] Bus [8%]
Rail [2%]
Walk [3%]
Cycle [1%]
Passenger [28%]

Managing transport challenges when oil prices rise
95
By virtue of their relative economic neutrality, the measures recommended in this report
are expected to manage travel demands at relatively low cost. This section provides a
preliminary examination of benefits to individuals, wider society, and the broader
domestic economy. The analysis that follows is based on the Average fuel price scenario.
6.3.1 Consumer Savings
This section quantifies the consumer savings resulting from reduced vehicle travel.
Consumer savings are a function of VKT. Fuel expenditure savings are estimated for each
year by multiplying the total annual VKT by the average fleet fuel economy (allowing for
expected improvements), and the price of fuel. Vehicle operating cost savings accrue
from reduced expenditure on maintenance, which were estimated at a flat rate of
$0.15/km. Figure 6.4 illustrates the consumer savings based on fuel and operating cost
savings for the total population.
It is recognised that consumer expenditure on other forms of transport modes may
increase as a result of the recommended measures. Increased uptake of alternative
transport will require expenditure on other items, such as bicycles and public transport
fares. These increased consumer costs are expected to be typically less than the averted
vehicle expenditure – particularly for those who elect to take up car-pooling or active
modes. Those who switch to public transport may effectively break even – although
should their mode shift allow a household to reduce the number of vehicles it supports
then consumer savings above and beyond those indicated above may be expected.
Figure 6.4: Consumer cost savings delivered by the Recommended Responses
$-
$500
$1,000
$1,500
$2,000
$2,500
$3,000
$3,500
$4,000
2007 2008 2009 2010 2011 2012 2013 2014 2015 2016 2017 2018 2019 2020 2021 2022 2023 2024 2025 2026 2027 2028
Wel
fare
Ben
efits
[mill
ion
2008
NZD
]
For those who continue to drive there will still be the benefit of a number of indirect
welfare benefits, particularly improved in travel times as a result of reduced congestion.
The primary difference is that when confronted with the certainty associated with these
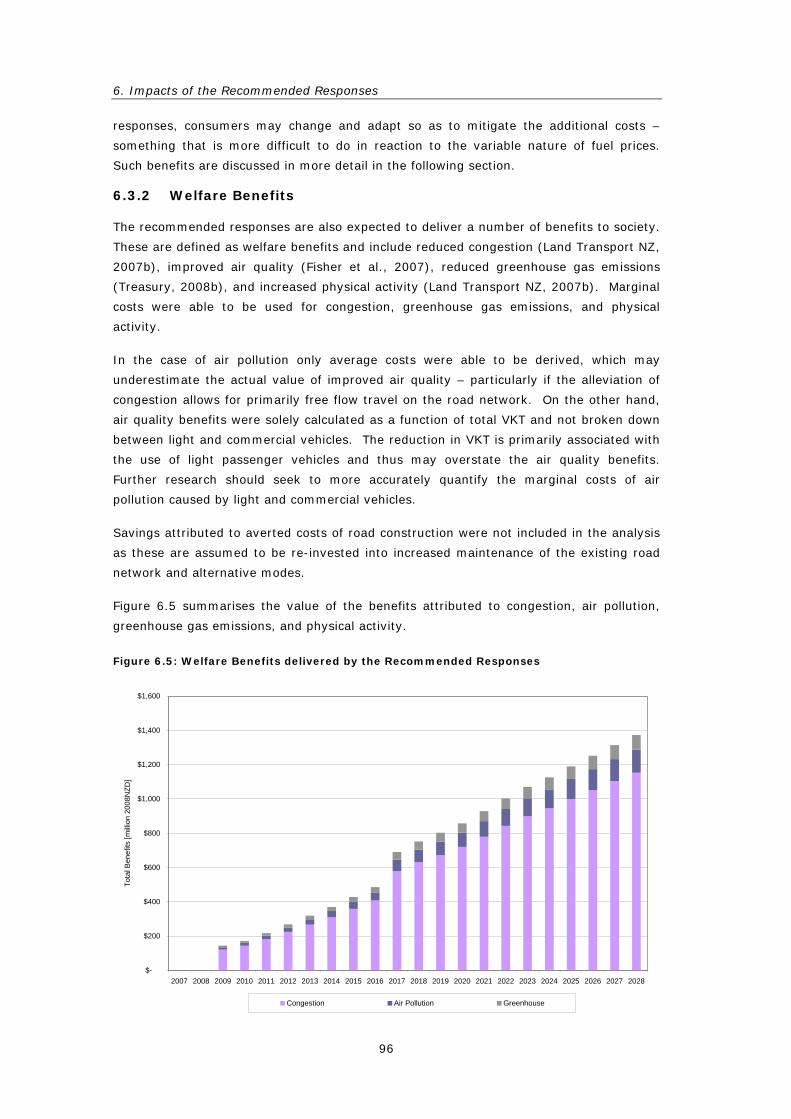
6. Impacts of the Recommended Responses
96
responses, consumers may change and adapt so as to mitigate the additional costs –
something that is more difficult to do in reaction to the variable nature of fuel prices.
Such benefits are discussed in more detail in the following section.
6.3.2 Welfare Benefits
The recommended responses are also expected to deliver a number of benefits to society.
These are defined as welfare benefits and include reduced congestion (Land Transport NZ,
2007b), improved air quality (Fisher et al., 2007), reduced greenhouse gas emissions
(Treasury, 2008b), and increased physical activity (Land Transport NZ, 2007b). Marginal
costs were able to be used for congestion, greenhouse gas emissions, and physical
activity.
In the case of air pollution only average costs were able to be derived, which may
underestimate the actual value of improved air quality – particularly if the alleviation of
congestion allows for primarily free flow travel on the road network. On the other hand,
air quality benefits were solely calculated as a function of total VKT and not broken down
between light and commercial vehicles. The reduction in VKT is primarily associated with
the use of light passenger vehicles and thus may overstate the air quality benefits.
Further research should seek to more accurately quantify the marginal costs of air
pollution caused by light and commercial vehicles.
Savings attributed to averted costs of road construction were not included in the analysis
as these are assumed to be re-invested into increased maintenance of the existing road
network and alternative modes.
Figure 6.5 summarises the value of the benefits attributed to congestion, air pollution,
greenhouse gas emissions, and physical activity.
Figure 6.5: Welfare Benefits delivered by the Recommended Responses
$-
$200
$400
$600
$800
$1,000
$1,200
$1,400
$1,600
2007 2008 2009 2010 2011 2012 2013 2014 2015 2016 2017 2018 2019 2020 2021 2022 2023 2024 2025 2026 2027 2028
Tota
l Ben
efits
[milli
on 2
008N
ZD]
Congestion Air Pollution Greenhouse
Managing transport challenges when oil prices rise
97
Congestion reduction benefits are calculated to be approximately $1.2 billion in 2028.
This is slightly less than the total costs of congestion costs (inflation adjusted) found in
other studies (Booz Allen Hamilton, 2005). This finding corroborates with the application
of a pure road pricing system that is able to manage travel demands below the level
where substantial queues builds. Further details on the assumptions underlying these
calculations are contained in Appendix I.
It is noted that the congestion reduction and physical activity benefits realised by these
responses are not delivered by either improved fuel economy or alternative fuels.
Technological developments may provide some benefit to society in terms of reduced air
pollution and greenhouse gas emissions, but these benefits are small in comparison to
that realised by averted vehicle travel.
6.3.3 Macro-economic Benefits
In addition to the consumer savings and welfare benefits discussed in the previous section
are a number of general macro-economic benefits.
In terms of commercial freight, the reduction in vehicle traffic resulting from the
implementation of these measures is expected to provide more reliable travel times.
Road pricing on its own is expected to eliminate significant amounts of low value travel
and free up road space for commercial vehicles, which is expected to deliver substantial
benefits. Fewer vehicles and fewer drivers travelling further distances at less cost, which
may reduce overall transport costs and thereby have flow on effects for prices for other
goods and services.
Other macro-economic benefits are less obvious but nonetheless tangible. Parking
management and car-sharing, for example, may be expected to concentrate vehicle
ownership in fewer vehicles. Investment in fuel efficient vehicles is more rapidly
recouped when vehicles travel longer distances. Thus reducing individual vehicle
ownership and consolidating vehicle travel into fewer more efficient vehicles is expected
to shift the relative investment balance and result in more rapid improvement in the fuel
economy of the national fleet.
International research has indicated that excessive vehicle travel tends to reduce
economic development, particularly in urban areas (Kenworthy and Laube, 1999). This
research finds that the total economic costs of increased vehicle travel outweigh the
benefits beyond approximately 7,500 VKT per capita per annum, although this does vary
depending on geographic and demographic factors (Kenworthy et al., 1997). Recent
research into the costs of travel associated with different modes found that the use of
private vehicles in Auckland generates larger total costs than the use of public transport,
even accounting for operating subsidies (Jakob et al., 2006).
The measures in this report are expected to reduce total (i.e. both light passenger and
commercial travel) per capita VKT from 9,500 VKT in 2007 to 7,800 VKT by 2028, which
is more in line with what is considered to be the optimum amount of travel, from an
economic perspective. Quantifying these more pervasive macro-economic benefits is
outside the scope of this report but should be the subject of further analysis.
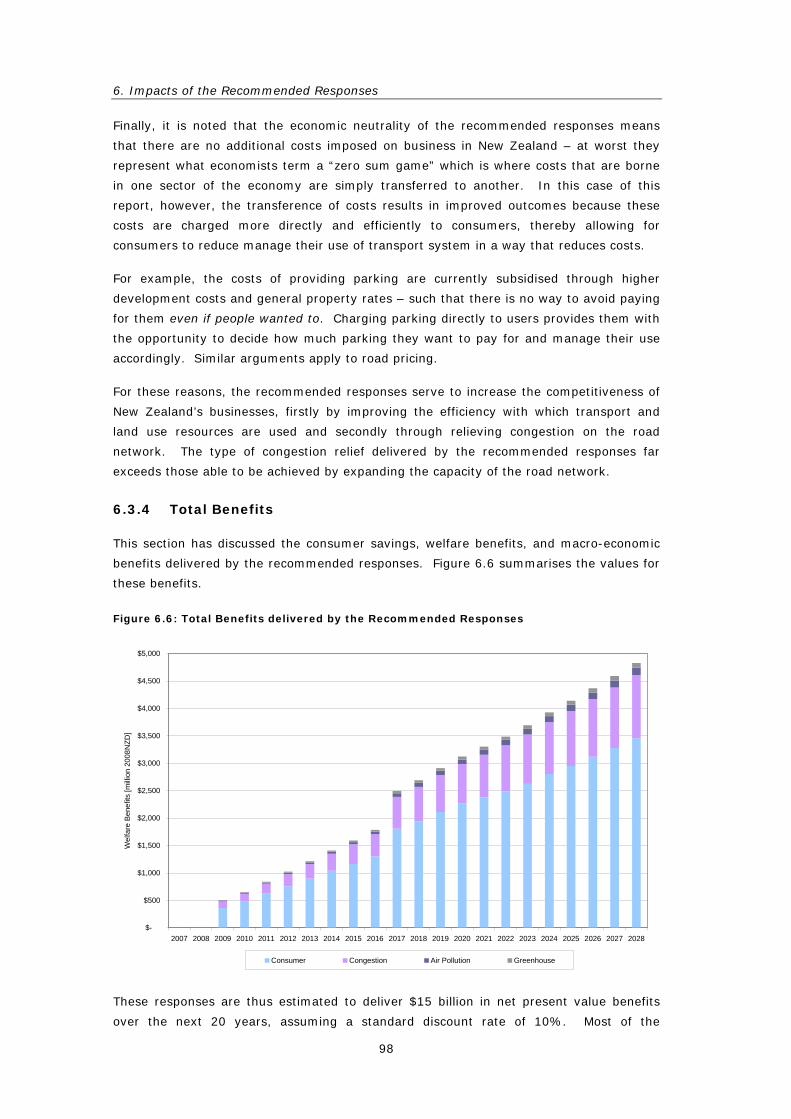
6. Impacts of the Recommended Responses
98
Finally, it is noted that the economic neutrality of the recommended responses means
that there are no additional costs imposed on business in New Zealand – at worst they
represent what economists term a “zero sum game” which is where costs that are borne
in one sector of the economy are simply transferred to another. In this case of this
report, however, the transference of costs results in improved outcomes because these
costs are charged more directly and efficiently to consumers, thereby allowing for
consumers to reduce manage their use of transport system in a way that reduces costs.
For example, the costs of providing parking are currently subsidised through higher
development costs and general property rates – such that there is no way to avoid paying
for them even if people wanted to. Charging parking directly to users provides them with
the opportunity to decide how much parking they want to pay for and manage their use
accordingly. Similar arguments apply to road pricing.
For these reasons, the recommended responses serve to increase the competitiveness of
New Zealand’s businesses, firstly by improving the efficiency with which transport and
land use resources are used and secondly through relieving congestion on the road
network. The type of congestion relief delivered by the recommended responses far
exceeds those able to be achieved by expanding the capacity of the road network.
6.3.4 Total Benefits
This section has discussed the consumer savings, welfare benefits, and macro-economic
benefits delivered by the recommended responses. Figure 6.6 summarises the values for
these benefits.
Figure 6.6: Total Benefits delivered by the Recommended Responses
$-
$500
$1,000
$1,500
$2,000
$2,500
$3,000
$3,500
$4,000
$4,500
$5,000
2007 2008 2009 2010 2011 2012 2013 2014 2015 2016 2017 2018 2019 2020 2021 2022 2023 2024 2025 2026 2027 2028
Wel
fare
Ben
efits
[milli
on 2
008N
ZD]
Consumer Congestion Air Pollution Greenhouse
These responses are thus estimated to deliver $15 billion in net present value benefits
over the next 20 years, assuming a standard discount rate of 10%. Most of the

Managing transport challenges when oil prices rise
99
responses are based on travel demand management, rather than infrastructure
investment, and are therefore relatively cost-effective. By 2028 total annual benefits are
expected to be approaching $5 billion annually.
6.4 What are the Risks?
This section examines some of the key risks associated with the recommended responses,
namely inadequate road capacity and localised shocks.
6.4.1 Inadequate Road Capacity
Modelling suggests that the comprehensive, coordinated, and staged implementation of
the recommended responses will enable a shift in focus away from supply side capacity
expansions of the road network and into increased investment in network maintenance
and alternative modes. One of the primary risks this raises is that shifting focus away
from capacity expansion may mean that unexpected growth in traffic volumes results in a
shortfall of road capacity.
Circumstances that may contribute to this situation emerging include lower than expected
fuel prices, higher than expected population growth, higher economic growth, and more
rapid growth in disposable incomes. The sensitivity of travel demands to these factors
was assessed by considering the Low fuel price scenario with high economic growth
(+10%), high growth in disposable income (+10%), and high population growth
(+2.5%), as illustrated in Figure 6.7.
Figure 6.7: Total Travel Demands under High Vehicle Travel Scenario
0
10
20
30
40
50
60
2007 2008 2009 2010 2011 2012 2013 2014 2015 2016 2017 2018 2019 2020 2021 2022 2023 2024 2025 2026 2027 2028
Tota
l Tra
vel [
billio
n K
T pe
r yea
r]
Passenger Vehicles Commercial Vehicles Alternative Modes
Even in this high travel demand the recommended responses restrict growth in VKT
growth to annual average growth of approximately 0.5% - which is well below historical
growth rates. This low overall growth reflects that the recommended responses direct

6. Impacts of the Recommended Responses
100
additional travel demands across a range of modes, rather than being automatically
funnelled onto the road network.
This discussion obscures a more fundamental reason why inadequate road capacity is not
considered a risk. Many of the measures, such as road pricing and parking pricing,
provide government agencies with a number of tools through which demand for transport
infrastructure may be managed. For example, unexpected demand may be met through
temporarily increased prices for the use of parking and road resources, with additional
revenue then able to be reinvested into the transport system to provide additional
capacity in the most efficient way to provide for higher demands. In this way investment
in capacity becomes more responsive to demand than the current system which depends
on the ability of government agencies to predict and provide for demand well in advance.
There is therefore a reduced risk of higher than expected demand growth with the
recommended approach than exists in the status quo. Instead of merely adding capacity,
government agencies may adjust prices in the short term to ensure the transport system
operates at near optimal efficiency, before the additional revenue is reinvested in the
requisite capacity. This situation appears to result in vastly reduced risks to government
agencies, both in terms of under-estimating or over-estimating future travel demands.
6.4.2 Localised Shocks
One of the primary risks associated with implementing major pricing based reforms is that
adverse effects may disadvantage certain communities and individuals. These effects are
defined in this report as localised shocks.
Localised shocks generally arise from step-changes in the price of travelling to a particular
area, where the step-change may occur in both time and space. For example, localised
shocks are likely to occur if road pricing mechanisms are implemented quickly and
without warning, so as that many travellers are unable to adjust their travel patterns.
Alternatively, localised shocks may eventuate if priced parking is implemented in one
town centre at $3/hour while parking at an adjacent town centre remains subsidised.
Minimising the impacts of localised shocks requires signalled, staged, and coordinated
implementation across a range of government agencies. Signalling changes in advance
allows affected parties to take steps to avoid or minimise potential prices. Staging
changes in a graduated manner allows affected parties to accommodate additional costs
through minor adjustments to expenditure priorities. Coordinating changes across
government agencies will provide to maximise benefits from a package of responses. For
example, investment in alternative transport modes will be most effective if it is backed
up by the coordinated application of pricing measures that directly and efficiently price the
use of vehicles.
The need for coordination does need not imply homogeneity. Pricing should, as much as
possible, reflect the value of the relevant resource being used. Value will differ
significantly from place to place in accordance with supply and demand, such that road
and parking prices in major urban areas are likely to be higher than in rural centres.
Indeed, a number of the responses identified in this report are designed to support more

Managing transport challenges when oil prices rise
101
diverse travel and land use patterns. For example, sophisticated road pricing is likely to
result in a reduced travel cost burden for low income households in rural areas than is
able to be realised through the homogenous application of a consumption based fuel
excise tax.
In some situations providing direct financial assistance, such as discounts for public
transport passes, may be required to minimise localised shocks as the transport system is
reshaped.

7. Further Research
102
7. Further Research
This research report highlighted the need for further research in the following areas:
• Feedback loops between higher global energy costs and domestic growth. It is likely
that sustained high oil prices would impact on the economic growth assumptions
considered in this research report. Further research could seek to identify the effects
of such prices for the global and domestic economy.
• The longitudinal effects of an ageing population on per capita travel demands. This
research could investigate how age affects the quantity of travel undertaken by
various modes and/or travel patterns across the day (O'Fallon and Sullivan, 2003).
This should aim to identify how overall VKT is split between peak and off-peak travel.
• The impacts of higher fuel prices on other commercial modes such as air, rail, and
coastal shipping. Research may need to occur on a relatively fine level to identify
regional and commercial parameters that affect uptake of alternative modes for
commercial travel (Clark et al., 2005). Elasticities of air passenger numbers to fuel
prices may also shed light on specific effects on travel patterns around major airports.
• Models of short term price variability using statistical methods such as Levy processes
(Krichene, 2008). Temporal granularity will be important; weekly oil price appear to
have the strongest relationship to fuel prices. More detailed research into the
relationship between oil and retail price of transport fuels may also be of interest.
• Methods to incorporate short term price oil price models within a long term modelling
framework, such as the Meta Model, to better understand future price variability. This
could inform, for example, the size of price swings government agencies may need to
incorporate into contingency estimates and risk management.
• Factors influencing travel demands, including but not limited to vehicle ownership,
economic growth, workforce participation, and disposable income. Local studies are
also required into the cross-elasticities of fuel prices with respect to demand for public
transport and active modes.
• More detailed modelling of the effects of both fuel prices and the recommended
responses on total travel demands, including quantification of the long term
autocatalytic processes the responses may initiate, such as reduced vehicle
ownership, reduced travel distances, and increased demand for alternative modes.
• Ways in which regulatory requirements for public consultation on transport projects
may be streamlined so that government agencies are able to move more swiftly in the
event that unexpected increases in fuel prices demands the acceleration of strategic
infrastructure responses.
• Ramifications of oil prices on regional and local travel demands, and how these
impacts may be incorporated into planning documents, such as Roading Management
Plans and Long Term Council Community Plans.

Managing transport challenges when oil prices rise
103
• Further research could seek to identify how the recommended responses lend support
to the targets outlined in the updated NZTS and associated Government Policy
Statement (MOT, 2008b, New Zealand Government, 2008).

8. Summary
104
8. Summary
This research report has considered how government agencies may manage the transport
challenges associated with rising oil prices. The key results of this research are
summarised in the following sections.
Modelling Prices for Transport Fuels
Recent high oil prices reflect a combination of increased production costs, growing
demand in developing countries, increased reliance on unconventional and synthetic
sources, and limited spare production capacity. Future oil prices were modelled using a
Monte Carlo simulation that combined a number of price forecasts to generate a
statistically representative distribution of future oil prices. High, Average, and Low price
scenarios were extracted from this distribution. The Average price projection indicated a
drop in oil prices may be expected in the second half of 2008 after which prices are
expected to escalate to reach approximately $155 2008USD/barrel by 2011. Looking
ahead prices appear to plateau and gradually drop to approximately $125
2008USD/barrel in 2028. High and Low price scenarios varied from $210 to $50
2008USD/barrel respectively. Care should be taken in interpreting the long term results
of the model, with a greater emphasis placed on near-term results. Future prices for
transport fuels were calculated on the basis of expected movements in the New Zealand
Dollar along with expected carbon and bio-fuel charges. This showed that prices for
petrol and diesel may be expected to peak in 2011 at approximately $2.80 and $2.50
2008NZD/litre. Risks to these price projections are expected to lie on the upside,
particularly in the short term.
Modelling Future Travel Demands
Travel demand elasticities were calculated with respect to fuel prices, economic growth,
vehicle ownership, workforce participation, and disposable income. Elasticities for light
passenger and commercial travel demands were evaluated separately. Light passenger
travel demands were found to be sensitive to a variety of factors, especially fuel prices
and vehicle ownership. Commercial travel demands were found to be substantially less
sensitive to fuel prices and more sensitive to economic growth – the other factors
considered in the analysis (that is vehicle ownership, workforce participation, and
disposable income) were not found to have a significant impact on travel patterns. Cross-
elasticities for public transport and active modes were estimated using a combination of
local and international studies. Under the Average fuel price scenario total VKT is
expected to remain below 2007 levels until circa 2016 after which the effects of economic
growth begin to dominate. There is also a shift in travel demand growth away from light
passenger vehicles towards commercial vehicles and alternative modes. This is likely to
require increased investment in road network maintenance and alternative transport
modes.

Managing transport challenges when oil prices rise
105
Responses to Rising Oil Prices
A toolbox of potential solutions is discussed to facilitate the development of a more
efficient transport system. Central to these responses is the understanding that travel
and land use have not historically been effectively managed or priced. This has led to
structural imbalances that have subsidised private vehicle trips. Rectifying these
structural imbalances so that road users are faced with the true costs (both internal and
external) of their choices is expected to deliver travel and land use patterns that are
significantly more energy efficient. Recommended responses include:
• Land Use – parking regulation and management; flexible zoning and urban
containment; development incentives; and urban renewal and TOD.
• Direct and Efficient Pricing – commercial parking rate, pay parking, road pricing, and
tax treatments.
• Infrastructure Investment – the transformation of roads into streets, investment in
active modes, investment in public transport services and infrastructure, multi-modal
integration, and taxi services.
• Behaviour Change and Education – travel plans, car-sharing/bike-sharing, Transport
Management Associations, and public transport information.
• Freight Management – regional freight strategies, home delivery, and active freight.
General legal considerations highlight how regulatory requirements for public consultation
may reduce the ability of government agencies to respond swiftly and effectively in the
event that fuel prices rose unexpectedly. In this event new measures should seek to
provide transport agencies will the ability to accelerate infrastructure investment.
Impacts of the Recommended Responses
The effect of the recommended responses on future travel demands was analysed by
estimating their expected coverage, maximum impacts, and implementation timelines.
The results of this analysis indicate that the recommended responses can be expected to
reduce total VKT below current levels. This suggests that land use management and
direct and efficient pricing, along with targeted infrastructure, is able to preserve road
network levels of service and allow for substantially increased investment in alternative
transport modes. Initial modelling indicates that alternative transport modes may
account for approximately two thirds of future growth in travel demands, with the balance
attributed to increasing commercial travel. Consumer savings associated with the
recommended responses were evaluated in terms of averted expenditure on fuel and
vehicle operating costs. Welfare benefits were evaluated for reduced congestion,
improved air quality, increased physical activity, and reduced greenhouse gases were also
estimated. By 2028 the recommended responses were found to deliver total savings in
the order of $5 billion per annum or approximately $16 billion in net present terms. The
recommended responses are conservatively estimated to reduce reliance on oil based
transport fuels by three times greater than that realised solely through improvements in
fuel economy.

9. Conclusions
106
9. Conclusions
This research concludes that:
9.1. There is a serious and urgent risk that high oil prices will eventuate within the next
five years. These prices appear likely to be sustained for the next two decades.
9.2. Prices for petrol and diesel are expected to rise to approximately $2.80 and $2.50
per litre by 2014 - suppressing total vehicle travel below current levels until 2016.
9.3. High fuel prices shift demand away from light passenger vehicles to commercial
vehicles and alternative transport modes.
9.4. The resilience of the transport system to high oil prices is currently being
undermined by market distortions that cause an over-reliance on private vehicles.
9.5. A paradigm shift is required away from “predict and provide” transport planning to
“manage and price” type measures.
9.6. Responses should focus initially on delivering reforms that allow for denser and
more diverse land use while also directly and efficiently pricing vehicle travel.
9.7. Efficient land use and pricing may be expected to generate additional demand for
infrastructure solutions that provide safely for a diverse range of modes.
9.8. Modelling indicates that these responses are able to contain total vehicle travel at
or below current levels and increase demand for alternative transport modes.
9.9. Containing growth in vehicle travel allows for increased investment in road network
maintenance (particularly low friction road surfaces) and alternative transport modes.
9.10. The recommended responses are “no regrets” measures which, once implemented,
deliver a range of economic, social, environmental benefits.

Managing transport challenges when oil prices rise
107
References ABDELWAHAB, W. & SARGIOUS, M. (1992) Modeling the Demand for Freight
Transportation. Journal of Transport Economics and Policy, 26, 49-70.
AMERICAN PLANNING ASSOCIATION (2006) Planning and urban design standards, Hoboken, N. J., John Wiley & Sons.
ASPO (2008) International Energy Agency accepts Peak Oil. Association for the Study of Peak Oil and Gas.
BASS, P. & LATTO, D. (2005) Heavy Vehicle Efficiency. Auckland, Energy Efficiency and Conservation Authority.
BENTO, A. M., CROPPER, M. L., MOBARAK, A. M. & VINHA, K. (2005) The Effects of Urban Spatial Structure on Travel Demand in the United States. Review of Economics and Statistics, 87, 466-478.
BIANCO, M. (2000) Effective Transportation Demand Management: Combining Parking Pricing, Transit Incentives, and Transportation Management in a Commercial District of Portland, Oregon. Journal of the Transportation Research Board, 1711 / 2000, 46-54.
BIROL, F. (2007) Transcript: Interview with IEA chief economist. Financial Times.
BIROL, F. (2008) Seven Questions: The New World Energy Order. Foreign Policy.
BIROL, F. & DAVID, W. (2001) Oil Supply Costs and Enhanced Productivity. Energy Prices and Taxes, xvii-xxiii.
BJÖRNER, T. B. (1999) Environmental Benefits from Better Freight Transport Management: Freight Traffic in a VAR Model. Transportation Research D, 4, 45-64.
BOARNET, M. & CHALERMPONG, S. T. (2002) New Highways, Induced Travel and Urban Growth Patterns: A "Before and After" Test. University of California Transportation Center.
BOARNET, M. & CRANE, R. (2001) Travel by design : the influence of urban form on travel, Oxford ; New York, Oxford University Press.
BOOZ ALLEN HAMILTON (2001a) Auckland regional parking study, Auckland, N.Z., Auckland Regional Council.
BOOZ ALLEN HAMILTON (2001b) Wellington Fares Study. Wellington, Booze Allen Hamilton.
BOOZ ALLEN HAMILTON (2005) Surface Transport Costs and Charges Study. Ministry of Transport, New Zealand.
BP (2007) Statistical Review of World Energy 2007. www.bp.com/statisticalreview.

Managing transport challenges when oil prices rise
108
CERVERO, R. (1985) DEREGULATING URBAN TRANSPORTATION. Cato Journal, 5.
CFIT (2001) Are we there yet? A comparison of travel in Europe. London, UK Commission for Integrated Transport.
CLARK, C., NAUGHTON, H., PROUIX, B. & THOMA, P. (2005) A Survey of the Freight Transportation Demand Literature and a Comparison of Elasticity Estimates. IN SINGLEY, J. (Ed.) Navigation Economic Technologies. Alexandria, Institute for Water Resources.
CONGRESSIONAL BUDGET OFFICE (2008) Effects of Gasoline Prices on Driving Behavior and Vehicle Markets. The Congress of the United States.
CORDESMAN, A. & AL-RODHAN, K. (2005) The Changing Risks in Global Oil Supply and Demand - Crisis or Evolving Solutions? , Center for Strategic and International Studies.
CORPUZ, G. (2007) Public Transport or Private Vehicle: Factors That Impact on Mode Choice. 30th Australasian Transport Research Forum. Melbourne, Australasian Transport Research Forum.
CSIRO (2008) Fuel for Thought: The future of transport fuels - challenges and opportunities.
DANTAS, D. A., KRUMDIECK, D. S. & PAGE, S. (2007) Energy Risk to Actvity as a Function of Urban Form. Wellington, Land Transport New Zealand.
DARGAY, J. & GATELY, D. (1999) Income's effect on car and vehicle ownership, worldwide: 1960-2015. Transportation Research Part A: Policy and Practice, 33, 101-138.
DARGAY, J. M. & HANLY, M. (2002) The Demand for Local Bus Services in England. Journal of Transport Economics and Policy, 36, 73-91.
DODSON, J. & SPIE, N. (2006) Suburban Shocks: Assessing Locational Vulnerability to Rising Household Fuel and Mortgage Interest Costs. 29th Australasian Transport Research Forum. Gold Coast, Griffith University.
DUNPHY, R., CERVERO, R., DOCK, F., MCAVEY, M., PORTER, D. & SWENSON, C. (2004) Developing Around Transit - Strategies and Solutions that work, Washington, Urban Land Institute.
EIA (2007) American Energy Outlook 2008. Washington, Energy Information Administration.
EIA (2008a) Annual Oil Market Chronology. Energy Information Adminstration.
EIA (2008b) Global Oil Supply Disruptions Since 1951. Energy Information Administration.
EWG (2007) Crude Oil - The Supply Outlook. IN ZITTEL, D. W. (Ed.). Ottobrun, Energy Watch Group.

Managing transport challenges when oil prices rise
109
EWING, R. H. (2007) Growing cooler the evidence on urban development and climate change. Washington, D.C., Urban Land Institute.
FISHER, G., KJELLSTROM, T., KINGHAM, S., HALES, S. & SHRESTHA, R. (2007) Health and Air Pollution in New Zealand. Wellington, Health Research Council of New Zealand.
FRIEDLAENDER, A. F. & SPADY, R. H. (1980) A Derived Demand Function for Freight Transportation. The Review of Economics and Statistics, 62, 432-441.
GENTER, J. (2007) Economic evaluation and transport planning in New Zealand: assessing all potential costs of new motorway projects in the Auckland Region. School of Architecture and Planning. Auckland, University of Auckland.
GIULIANO, G. & DARGAY, J. (2006) Car ownership, travel and land use: a comparison of the US and Great Britain. Transportation Research Part A: Policy and Practice, 40, 106-124.
GOLDMAN-SACHS (2008) $100 oil reality, part 2: Has the super-spike end game begun? , Goldman Sachs Global Investment Research: Global energy equity research team.
GOODWIN, P., DARGAY, J. & HANLY, M. (2004) Elasticities of Road Traffic and Fuel Consumption with Respect to Price and Income: A Review. Transport Reviews, 24, 275 - 292.
GOSIER, R., SIMCHI-LEVI, D., WRIGHT, J. & BENTZ, B. A. (2008) Past the Tipping Point - Record Oil Prices Require New Supply Chain Strategies To Enable Future High Performance. Accenture/ILOG.
GRAHAM, D. J. & GLAISTER, S. (2002) The Demand for Automobile Fuel: A Survey of Elasticities. Journal of Transport Economics and Policy, 36, 1-25.
GRAHAM, D. J. & GLAISTER, S. (2004) Road Traffic Demand Elasticity Estimates: A Review. Transport Reviews, 24, 261 - 274.
HAMILTON-BAILLIE, B. (2008) Shared Spce: Reconciling People, Places and Traffic. Built Environment, 34, 161-181.
HAMILTON-BAILLIE, B. & JONES, P. (2005) Improving traffic behaviour and safety through urban design. ICE Proceedings, Civil Engineering, 158, 39-47.
HIRSCH, R., BEZDEK, R. & WENDLING, R. (2005) Peaking of World Oil Production: Impacts, Mitigation, and Risk Management. US Government.
HOLMGREN, J. (2007) Meta-analysis of public transport demand. Transportation Research Part A: Policy and Practice, 41, 1021-1035.
HUGOSSON, M. B. & SJÖBERG, A. (2006) Facts and results from the Stockholm Trials. Stockholm, Congestion charge secretariat, City of Stockholm.
IEA (2004) Analysis of the Impact of High Oil Prices on the Global Economy. International Energy Agency.
Managing transport challenges when oil prices rise
110
IEA (2005) Saving Oil in a Hurry. International Energy Administration.
IEA (2007) World Energy Outlook 2007 - China and India Insights. International Energy Agency.
IEA (2008) Medium Term Oil Market Report. World Petroleum Congress. Madrid.
IMF (2008) World Economic and Financial Surveys - World Economic Outlook Database. Washington, International Monetary Fund.
JAKOB, A., CRAIG, J. L. & FISHER, G. (2006) Transport cost analysis: a case study of the total costs of private and public transport in Auckland. Environmental Science & Policy, 9, 55-66.
JIMÉNEZ-RODRÍGUEZ, R. & SÁNCHEZ, M. (2004) Oil Price Shocks and Real GDP Growth - Empricial Evidence for some OECD Countries. Applied Economics, 37, 28.
KENNEDY, D. & WALLIS, I. (2007) Impacts of Fuel Price Changes on New Zealand Transport. Wellington, Land Transport New Zealand.
KENWORTHY, J. (2003) Transport Energy Use and Greenhouse Gases in Urban Passenger Transport Systems: A Study of 84 Global Cities. Institute for Sustainability and Technology Policy.
KENWORTHY, J., LAUBE, F., NEWMAN, P. & BARTER, P. (1997) Indicators of Transport Efficiency in 37 Global Cities. Perth, Sustainable Transport Research Group.
KENWORTHY, J. R. & LAUBE, F. B. (1999) Patterns of automobile dependence in cities: an international overview of key physical and economic dimensions with some implications for urban policy Transportation Research Part A: Policy and Practice, 33.
KER, I. (1999) Evaluating Behaviour Change in Transport: Benefit Cost Analysis of Individualised Marketing for the City of South Perth. Perth, Western Australian Department of Transport.
KRICHENE, N. (2008) Crude Oil Prices: Trends and Forecast. IN CHRISTENSEN, B. V. (Ed.) Working Paper. IMF.
LAND TRANSPORT NZ (2007a) Economic Evaluation Manual. Wellington, Land Transport New Zealand.
LAND TRANSPORT NZ (2007b) Economic Evaluation Manual. Wellington, Land Transport New Zealand.
LEVINSON, D. M. & KRIZEK, K. J. (2008) Planning for Place and Plexus - Metropolitan Land Use and Transport, New York, Routledge.
LITMAN, T. (2002a) Generated Traffic: Implications for Tranport Planning. Institute of Transportation Engineers Journal, 71, 38-47.
LITMAN, T. (2002b) Transportation Land Use Impacts. Victoria Transport Policy Institute.

Managing transport challenges when oil prices rise
111
LITMAN, T. (2003) Reinventing Transportation: Exploring the Paradigm Shift Needed to Reconcile Transportation and Sustainability Objectives. Victoria Transport Policy Institute.
LITMAN, T. (2006a) Parking management best practices, Chicago, Ill. , American Planning Association.
LITMAN, T. (2006b) Win-Win Transportation Solutions Mobility Management Strategies That Provide Economic, Social and Environmental Benefits. Victoria Transport Policy Institute.
LITMAN, T. (2007a) Market Principles - Travel Demand Management Impacts on Market Efficiency and Equity. Victoria Transport Policy Institute.
LITMAN, T. (2007b) TDM Encyclodedia: Market Principles. Victoria Transport Policy Institute.
LITMAN, T. (2007c) Transit Price Elasticities and Cross-elasticities. Victoria Transport Policy Institute.
LITMAN, T. (2007d) Transportation Elasticities: How Prices and Other Factors Affect Travel Behavior. Victoria Transport Policy Institute.
LITMAN, T. (2007e) Valuing Transit Service Quality Improvements. Victoria Transport Policy Institute.
LITMAN, T. (2008) Land Use Impacts on Transport - How Land Use Factors Affect Travel Behavior. Victoria Transport Policy Institute.
LITMAN, T. & LAUBE, F. (2002) Automobile Dependency and Economic Development. Victoria Transport Policy Institute.
LUK, J. & HEPBURN, S. (1993) New Review of Australian Travel Demand Elasticities. Australian Road Research Board.
LYNCH, M. (2001) Forecasting oil supply: theory and practice. The Quarterly Review of Economics and Finance, 42, 373-389.
MACKIE, H., BAAS, P. & MANZ, H. (2006) Prediction of New Zealand's Freight Growth by 2020. Auckland, TERNZ.
MARSDEN, G. (2006) The evidence base for parking policies - a review. Journal of Transport Policy, 13, 447-457.
MDI (2007) An engine which uses air as fuel. IN MOTORS, T. (Ed.) Tata Motors and technology inventor, MDI of France, sign agreement. Mumbai, Tata Motors.
MDI (2008) Ecological vehicles and technologies. Nice.
MED (2006) New Zealand's Energy Outlook to 2030. Wellington, Ministry of Economic Development.

Managing transport challenges when oil prices rise
112
MED (2007a) Alternative Liquid Fuels: Global Availability, Economics and Environmental Impacts. Wellington, Ministry of Economic Development.
MED (2007b) New Zealand Energy Strategy to 2050 - Powering our Future. Wellington, Ministry of Economic Development.
MED (2008a) International and Domestic Petrol and Diesel Price Comparisons. Wellington, Ministry of Economic Development.
MED (2008b) Oil - An Introduction for New Zealanders. Wellington, Ministry of Economic Development.
MED (2008c) Oil Emergency Response Strategy - Government Response to an Oil Supply Disruption. Wellington, Ministry for Economic Development.
MED (2008d) Weekly Oil Price Graphs. Ministry of Economic Development.
MOT (2002) New Zealand Transport Strategy. Wellington, Ministry of Transport.
MOT (2005a) National Rail Strategy to 2015. Wellington, Ministry of Transport.
MOT (2005b) Surface Transport Costs and Charges. Wellington, Ministry of Transport.
MOT (2006) Tackling Congestion in Auckland - Auckland Road Pricing Evaluation Study. Wellington, Ministry of Transport.
MOT (2007) Sustainable Transport Discussion Paper - Update of the New Zealand Transport Strategy. Wellington, Ministry of Transport.
MOT (2008a) Comparing Travel Modes - Household Travel Survey. Wellington, Ministry of Transport.
MOT (2008b) The New Zealand Transport Strategy 2008. IN TRANSPORT, M. O. (Ed.). Wellington.
MOT (2008c) The New Zealand Vehicle Fleet: Data Spreadsheet. Wellington, Ministry of Transport.
MOT (2008d) Sea Change: New Zealand's Coastal Shipping Strategy. Wellington, MOT.
MOT (2008e) Trial Vehicle Scrappage Report. IN TRANSPORT, M. O. (Ed.). Wellington.
NEW ZEALAND GOVERNMENT (2008) Government Policy Statement on Land Transport Funding 2009/10 – 2018/19. IN TRANSPORT, M. O. (Ed.). Wellington.
NYMEX (2008) Light Sweet Crude Oil - Session Expanded Table. http://www.nymex.com/lsco_fut_csf.aspx?product=CL. New York, New York Mercantile Exchange.

Managing transport challenges when oil prices rise
113
O'FALLON, C. & SULLIVAN, C. (2003) Older People's Travel Patterns and Transport Sustainability in New Zealand Cities. 26th Australasian Transport Research Forum. Wellington, Pinnacle Research.
O'FALLON, C. & SULLIVAN, C. (2005) Trip Chaining: Understanding how New Zealanders Link their Travel. Wellington, Land Transport New Zealand.
OECD (2008) Environmentally Harmful Subsidies in the Transport Sector. IN POLICIES, W. P. O. N. E. (Ed.). Paris, Organisation for Economic Cooperation and Development.
OUM, T. H., II, W. G. W. & YONG, J.-S. (1992) Concepts of Price Elasticities of Transport Demand and Recent Empirical Estimates: An Interpretative Survey. Journal of Transport Economics and Policy, 26, 139-169.
PHILPOTT, A. B., CRADDOCK, M. & WATERER, H. (2000) Hydro-electric unit commitment subject to uncertain demand. European Journal of Operational Research, 125, 410-424.
REHRL, T. & FRIEDRICH, R. (2005) Modelling long-term oil price and extraction with a Hubbert approach: The LOPEX model. Energy Policy, 34, 2413-2428.
RPA (2006) Annual Report 2006. Dublin, Railway Procurement Agency.
RYE, T. (2002) Travel plans: do they work? Transport Policy, 9, 287-298.
SAUNER (2000) Sustainability and the Use of Non-Renewable Resources. Environment and Climate Change Programme. Brussels, European Commission DG XII.
SHAHEEN, S., ROBERTS, J. D. & COHEN, A. P. (2005) CARSHARING IN NORTH AMERICA: MARKET GROWTH, CURRENT DEVELOPMENTS, AND FUTURE POTENTIAL. Davis, University of California.
SHOUP, D. C. (2005) The high cost of free parking, Chicago, Planners Press, American Planning Association.
SMITH, A. (1776) An Inquiry into the Nature and Causes of the Wealth of Nations, London, Methuen.
STATISTICS NZ (2006) Census. www.stats.govt.nz/census/default.htm. Wellington, Statistics New Zealand.
STATISTICS NZ (2007) Moving Age Pyramids. www.stats.govt.nz/people/population/moving-age-sex-pyramids.htm. Wellington, Statistics New Zealand.
STATISTICS NZ (2008a) Gross Domestic Product (GDP). Wellington, Statistics New Zealand.
STATISTICS NZ (2008b) Key Labour Force Measures by Qualification, Age and Sex. Wellington, New Zealand.

Managing transport challenges when oil prices rise
114
STATISTICS NZ (2008c) New Zealand Income Survey Wellington, Statistics New Zealand.
STATISTICS NZ (2008d) Overseas Merchandise Trade: May 2008. Wellington, Statistics New Zealand.
TAHANA, Y. (2008) Prices fueling big changes. New Zealand Herald. Auckland.
TAYLOR, M. (2005) Easy riders -- casual carpooling rolls on with few hassles
30-year-old social experiment rated high by commuters. San Francisco Chronicle San Francisco.
THOMPSON, R. G., TAKADA, K. & KOBAYAKAWA, S. (2001) Optimisation of parking guidance and information systems display configurations. Transportation Research Part C: Emerging Technologies, 9, 69-85.
TRANSPORT RESEARCH LABORATORY (2005) 'Psychological' Traffic Calming. TRL. Crowthorne.
TREASURY (2008a) THE FISCAL STRATEGY MODEL (FSM) - BUDGET 2008 VERSION. Wellington, Treasury.
TREASURY (2008b) New Zealand's Liability Under the Kyoto Protocol. Wellington, Treasury.
TREASURY (2008c) New Zealand Economic and Financial Overview. Wellington, The Treasury.
TRPG (2004) Integrated Ticketing in Scotland - Needs Analysis and Options. Edinburgh, Scottish Executive Social Research.
USGAO (2007) Uncertainty about Future Oil Production Makes it Important to Develop a Strategy for Addressing a Peak and Decline in Oil Production. United States Government Accountability Office.
VAIL, J. (2007) Five Geopolitical Feedback-Loops in Peak Oil
VICKREY, W. S. (1963) Pricing in Urban and Suburban Transport. The American Economic Review, 53, 452-465.
WHELAN, G. (2007) Modelling car ownership in Great Britain. Transportation Research Part A: Policy and Practice, 41, 205-219.
WINSTON, C. (1983) A Disaggregate Model of the Demand for Intercity Freight Transportation. Econometrica, 49, 981-1006.

Appendix A Density and Amenity
115
Appendix A Density and Amenity
Increases in density alone do not control the quality of a development. The same density
can be manifested in a number of different ways, including:
• Low rise – High coverage
• Medium rise – Medium coverage
• High rise – Low coverage
Various typologies of the same density is illustrated in Figure 9.1.
Figure 9.1 Density and urban form (source Urban Design Compendium)
This report has noted that higher densities are expected to be more resilient to sustained
high oil prices. However, it is emphasised for urban intensification to create dynamic and
sustainable urban communities, a number of factors need to be considered in addition to
density. It is considered that medium rise and medium coverage development with
variations in building height will produce a preferable built form and good ratio of open
space to buildings in most areas of New Zealand. The Urban Design Compendium has
examples of good functional design parameters and case studies of where they have been
implemented. It is also noted that density alone does not deliver reduced reliance on oil
based transport fuels – allowing for a mixture of uses is also important, such as
residential, commercial, and retail.

Appendix B Economic Evaluation Processes
116
Appendix B Economic Evaluation Processes
This appendix highlights some potential issues with current economic evaluation
processes that may be exacerbated in a situation of high fuel prices. It is acknowledged
that economic evaluation processes, and the BCR they produce, are only one of three
factors considered when allocating transport funding; their primary purpose is to rank
similar classes of projects rather than discriminate between different types of transport
investment. Despite these caveats, BCR do play a role in shaping the type of funding
applications local authorities are prepared to investigate and develop, while also
influencing public and political perceptions of the economic benefits delivered by various
transport modes. The issues raised in this appendix include the treatment of induced
traffic and land value impacts.
Firstly, it is uncertain whether the EEM treats projects consistently in terms of generated,
or induced, traffic. The EEM Vol. 1 (EEM1), which applies to road transport projects,
discusses induced traffic in the following way:
In general it shall be assumed that [road] projects do not induce any new trips or
cause a re-distribution to new destinations. If there are cases where the effect of
excluding induced or redistributed trips seriously affects the evaluation, then a
variable matrix approach should be adopted (Land Transport NZ (2007b), p. A2-
12).
It is noted that this is somewhat circular – how may one assess whether induced traffic
affects the results until an assessment is undertaken? More important, however, is the
contrast to the EEM2, which applies to sustainable transport projects. The EEM2
discusses induced traffic in the following way:
It is important to consider generated traffic when evaluating congestion reduction
strategies … reduction of congestion is likely to make private vehicle travel more
appealing for other potential road users, which will partially offset the congestion
reduction benefits. This generated traffic effect should be valued as a disbenefit
equivalent to 50 percent of the congestion reduction benefit (Land Transport NZ
(2007a) pp. 3-19 to 3-20).
These two extracts suggest that the EEM1 allows for, but does not mandate, consideration
of induced traffic for road projects, whereas the EEM2 incorporates it automatically as a
50% disbenefit. Notwithstanding this apparent inconsistency, experience suggests that
induced traffic is often not accounted for in evaluating the economic benefits of major
road projects. For example, the SH18 Hobsonville Deviation and SH16 Brigham Creek
Extension on Auckland’s urban fringe, did not account for induced traffic – when it would
appear to be an exemplary situation where additional road infrastructure would induce
travel and development to a level that compromised travel time savings.14
14 In the context of oil prices and vehicle dependency it is noted that travel time savings may not fully capture the potential benefits delivered by active modes, such as walking and cycling, or public transport. The attractiveness of travel by active modes is generally a function of environmental
Managing transport challenges when oil prices rise
117
Secondly, the EEM is not considered to adequately deal with the impacts of transport
investment on land values. The EEM Vol. 1 currently excludes considerations of land
value impacts because it is considered to be “double-counting” of the positive effects of
improved level of service and increased “accessibility” (mobility is probably more
appropriately used in this context). There are several issues with this interpretation.
Firstly, it does not give consideration to the negative effects of vehicle volumes on land
values. For example, many of the studies surveyed in Ryan (1999) found negative
impacts in the area immediately surrounding transport infrastructure followed by positive
impacts further away. This suggests that transport infrastructure provides benefits for
land values that are not directly adjacent to the infrastructure in question. Such effects
have been quantified in other studies; Levinson and Krizek (2008) surveyed 35,000 house
sales and found that residential properties fronting onto a busy street sold for 1% less
than comparable properties on quiet streets. Similarly, the number of meters to the
nearest major highway was found to detrimentally impact on residential property values.
All variables in their analysis were statistically significant at p<0.01 (Levinson and Krizek,
2008). Negative land value effects may be important not only in determining the benefits
of investment in road infrastructure, but also for determining between different types of
sustainable transport investment. For example, it is apparent that electrified buses and
light rail will have less negative impacts on land values than standard diesel buses. Land
value impacts are likely to become more important as the density of New Zealand’s urban
centres continues to increase.
Finally, this research suggests that the use of roads has historically been underpriced, as
car parking, carbon emissions, accidents, air pollution, noise, and other external costs are
not directly borne by the road user. Growth in car ownership and other travel demand
factors used to project growth in traffic are based on the historical level of demand for
vehicle trips. Yet this historical level of demand is predicated on under-priced roads, and
is therefore not a reflection of the economically efficient level of demand. This report
suggests that full internalisation of costs, such as parking and congestion, may go a long
way towards suppressing growth in vehicle volumes and reducing the need for peak hour
capacity expansions. Notwithstanding these issues, this research has highlighted that fuel
price rises may cause a reduction in travel demands over the next 5 years. It may be
necessary to re-evaluating the BCR for major road projects in light of these traffic
volumes, and potentially delay expenditure where alternative transport investment
delivers greater transport benefits.
This appendix has noted some areas where the processes in the EEM may detract from
the ability of government agencies to respond to rising fuel prices. It is noted that the
EEM is part of both a wider and evolving process and, as such, should be considered a
living document. The authors suggest central government agencies may wish to
accelerate this process as part of the internal housekeeping required to prepare for the
challenges of rising oil prices.
amenity, as opposed to speed. Travel time savings also tend to place a focus on mobility over accessibility; the former is easier to quantify.

Appendix C The Meta Model
118
Appendix C The Meta Model
This Appendix provides further details on the inputs and methodology underlying the
model used to generate the oil price forecasts discussed in this report.
Forecasts
Forecast Name CSIRO MED Goldman
Sachs NYMEX IEA LOPEX
Denominated USD 2008 2005 2008 2008 2008 1998
Global CPI 1.00 1.08 1.00 1.00 1.00 1.50
Future Discount 0 0 0 -2%15
0 0
2008 $100 $90 $108 $126 $84 $33
2009 $95 $105 $110 $127 $77 $34
2010 $200 $120 $120 $125 $74 $35
2011 $210 $120 $120 $124 $71 $38
2012 $220 $120 $75 $123 $68 $41
2013 $215 $120 $75 $123 $66 $44
2014 $210 $120 $75 $123 $63 $47
2015 $175 $120 $75 $123 $60 $50
2016 $165 $114 $75 $123 $60 $53
2017 $155 $108 $75 $123 $60 $56
2018 $145 $102 $75 $123 $60 $59
2019 $175 $96 $75 $123 $60 $62
2020 $180 $90 $75 $123 $60 $65
2021 $140 $90 $75 $123 $61 $77
2022 $100 $90 $75 $123 $62 $88
2023 $95 $90 $75 $123 $63 $100
2024 $96 $90 $75 $123 $64 $111
2025 $97 $90 $75 $123 $64 $123
2026 $98 $90 $75 $123 $66 $134
2027 $99 $90 $75 $123 $67 $146
2028 $100 $90 $75 $123 $68 $157
2029 $101 $90 $75 $123 $69 $169
2030 $102 $90 $75 $123 $70 $180
Error Bounds
None of the mainstream forecasters offer a confidence interval on their results, and few
make their past predictions or model details freely available. However, EIA forecasts are
available from the early 1980s. These are shown, along with the actual price of oil, in
Figure 9.2.
15
Note that the future discount is applied only to NYMEX prices until 2016 (the last date for which prices are available) after which persistence forecasting is used to extend their price to the end of the time horizon.

Managing transport challenges when oil prices rise
119
Figure 9.2: EIA forecasts 1985-2005
0
0.5
1
1.5
2
2.5
3
3.5
4
4.5
5
1985 1986 1987 1988 1989 1990 1991 1992 1993 1994 1995 1996 1997 1998 1999 2000 2001 2002 2003 2004 2005
Given the shortage of data, the EIA history was used to generate synthetic error bounds
for all forecasts by assuming that the true oil price lay within the 95% error bounds of
past EIA forecasts. For scale invariance and to avoid negative prices, the logarithm of
years after the prediction and the error in the prediction of the logarithm of price was
compared, as shown in Figure 9.3.
Figure 9.3: SD of symmetric error versus log time for EIA forecasts
y = 0.0518x + 0.064R2 = 0.9442
0
0.05
0.1
0.15
0.2
0.25
0 0.5 1 1.5 2 2.5 3
Years Ahead
SD o
f Sym
met
ric E
rror

Appendix C The Meta Model
120
Applying historical error bounds to predict future prices resulted in a large degree of
variability – with a few rare extreme price forecasts in excess of $2,000 USD/barrel. It is
also considered likely that future forecasters will be more accurate than historical
forecasts – at least so long as oil a globally traded commodity. For this reason, both the
intercept and slope of the logarithmic error bounds illustrated above were reduced when
projecting future prices. This effectively reduced the “upside” risk to the price projections
beyond that which has been experienced in the past.
The forecasters seem to predict on a “business as usual” basis – various non-economic
risk factors are not taken into account, even though they clearly have a significant effect
on the price of oil. The LOPEX, CSIRO, and MED High forecasts do not appear to account
for these risk factors, while other forecasts remain silent on their methodology. For this
reason, it assumed that there is a 5% risk premium to the base forecasts generated by
the model. The price generation process is discussed in the following section.
Generating Price Forecasts
In order to generate an “expected forecast” and error bounds on that forecast, a large
number of candidate forecasts were generated by sampling for each year from the set of
forecasts, the error distribution for that year (discussed in the previous section), and
“non-economic” risk factors, which were assumed to add approximately 5% to the underlying price forecast. That is, for a single trajectory t , the prediction in year y , the
price ( )yPt is:
( ) ( )[ ] ( )[ ]∏−+=Risks
ryybaNyf
t ZeyP tU 0ln,1ln
Where Uf is the U th forecast, tU is a randomly chosen forecast used for the whole
trajectory, N is a normal random variable sampled every year, a and b are parameters
of the error correlation, and rZ is a random variable for each risk element that is
fractional change in cost with the probability that the modelled event occurs, and 1
otherwise.
The merits of this modelling approach rest broadly on the robustness of the various
forecasts used and to a lesser degree the magnitude of the risk premium added by non-
economic risk factors. Most forecasts are made on an annual basis and will therefore not
incorporate the most recent price trends. It is emphasised that the ability of such a
model to generate representative price projections may be expected to improve in the
future, as more forecasts become available and there is larger amount of historical data
on which to base error estimates.
Results
The cumulative distribution function (CDF) associated with forecasts prices in 2028 is
illustrated below. This analysis illustrates large degree of uncertainty associated with oil
price forecasts; prices range from a low of $8 in 2028 to a high of $1,170.
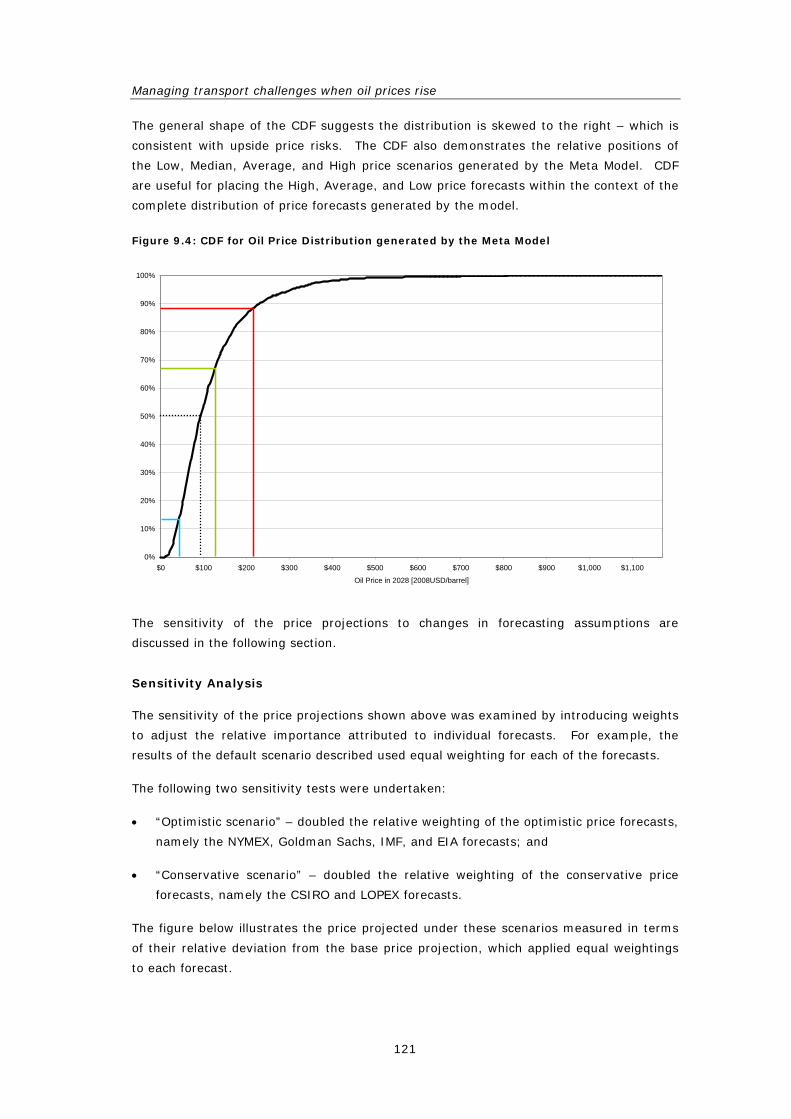
Managing transport challenges when oil prices rise
121
The general shape of the CDF suggests the distribution is skewed to the right – which is
consistent with upside price risks. The CDF also demonstrates the relative positions of
the Low, Median, Average, and High price scenarios generated by the Meta Model. CDF
are useful for placing the High, Average, and Low price forecasts within the context of the
complete distribution of price forecasts generated by the model.
Figure 9.4: CDF for Oil Price Distribution generated by the Meta Model
0%
10%
20%
30%
40%
50%
60%
70%
80%
90%
100%
$0 $100 $200 $300 $400 $500 $600 $700 $800 $900 $1,000 $1,100
Oil Price in 2028 [2008USD/barrel]
The sensitivity of the price projections to changes in forecasting assumptions are
discussed in the following section.
Sensitivity Analysis
The sensitivity of the price projections shown above was examined by introducing weights
to adjust the relative importance attributed to individual forecasts. For example, the
results of the default scenario described used equal weighting for each of the forecasts.
The following two sensitivity tests were undertaken:
• “Optimistic scenario” – doubled the relative weighting of the optimistic price forecasts,
namely the NYMEX, Goldman Sachs, IMF, and EIA forecasts; and
• “Conservative scenario” – doubled the relative weighting of the conservative price
forecasts, namely the CSIRO and LOPEX forecasts.
The figure below illustrates the price projected under these scenarios measured in terms
of their relative deviation from the base price projection, which applied equal weightings
to each forecast.
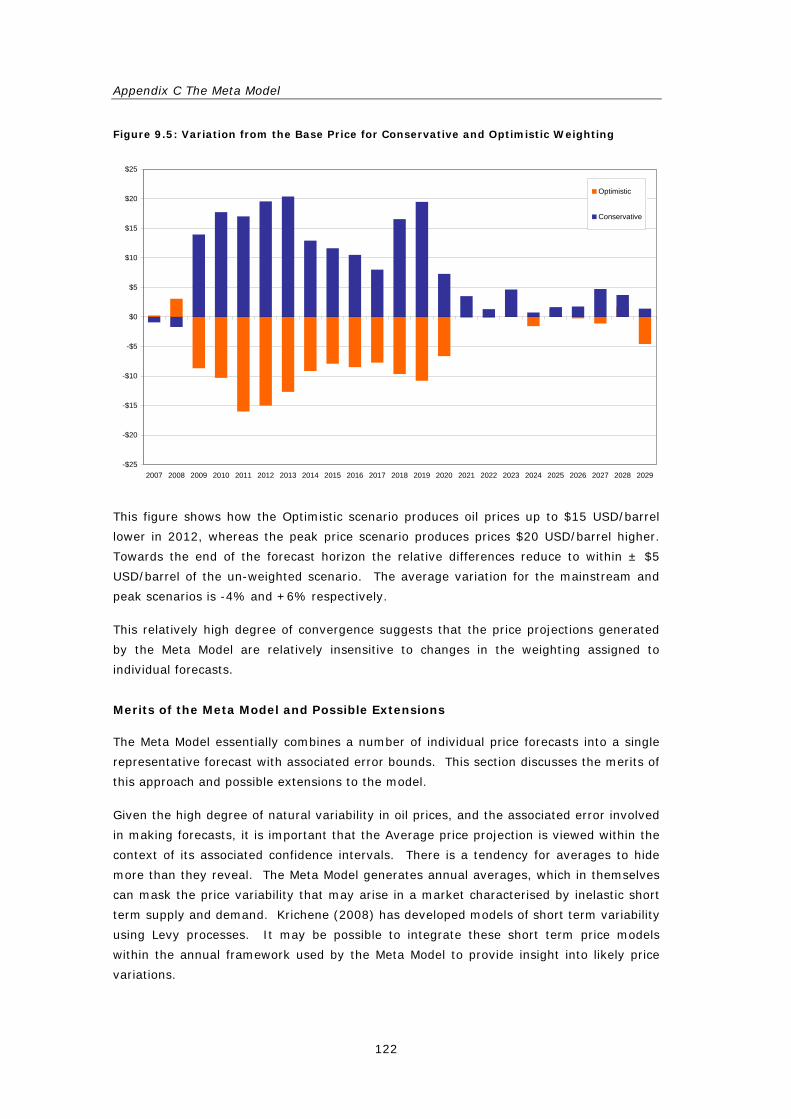
Appendix C The Meta Model
122
Figure 9.5: Variation from the Base Price for Conservative and Optimistic Weighting
-$25
-$20
-$15
-$10
-$5
$0
$5
$10
$15
$20
$25
2007 2008 2009 2010 2011 2012 2013 2014 2015 2016 2017 2018 2019 2020 2021 2022 2023 2024 2025 2026 2027 2028 2029
Optimistic
Conservative
This figure shows how the Optimistic scenario produces oil prices up to $15 USD/barrel
lower in 2012, whereas the peak price scenario produces prices $20 USD/barrel higher.
Towards the end of the forecast horizon the relative differences reduce to within ± $5
USD/barrel of the un-weighted scenario. The average variation for the mainstream and
peak scenarios is -4% and +6% respectively.
This relatively high degree of convergence suggests that the price projections generated
by the Meta Model are relatively insensitive to changes in the weighting assigned to
individual forecasts.
Merits of the Meta Model and Possible Extensions
The Meta Model essentially combines a number of individual price forecasts into a single
representative forecast with associated error bounds. This section discusses the merits of
this approach and possible extensions to the model.
Given the high degree of natural variability in oil prices, and the associated error involved
in making forecasts, it is important that the Average price projection is viewed within the
context of its associated confidence intervals. There is a tendency for averages to hide
more than they reveal. The Meta Model generates annual averages, which in themselves
can mask the price variability that may arise in a market characterised by inelastic short
term supply and demand. Krichene (2008) has developed models of short term variability
using Levy processes. It may be possible to integrate these short term price models
within the annual framework used by the Meta Model to provide insight into likely price
variations.

Managing transport challenges when oil prices rise
123
The Meta Model does not attempt to explicitly model the supply and demand factors
affecting oil prices. However, the underlying forecasts (on which the Meta model is
based) do explicitly model these market factors. The CSIRO forecast, for example,
models the effect of declining resource availability, increasing production costs, and
technological substitution, whereas the LOPEX forecast considers the cartel behaviour of
OPEC member countries as well as technological improvements in oil extraction.
All these factors are likely to play a role in determining the price of oil, but it is difficult to
say in advance which factor will be the most relevant. By basing price projections on a
number of forecasts the Meta Model is able to account for a wider range of supply and
demand factors than may be considered by any individual forecast. The multiple factors
affecting oil prices are therefore modelled implicitly, as opposed to explicitly.
One area where the model could be extended is by incorporating information on upper
and lower price bounds. The CDF illustrated previously has a small number of extremely
low or high forecasts that may be dealt with such price bounds. Alternatively, the model
could seek to incorporate a supply and demand stack so as to model price behaviour
outside of the normal range of prices.
Such measures may help to reduce the range of the confidence intervals and provide
increased certainty about the future price path. Given that the measures would control
extreme forecasts at both the lower and upper end of the price scale, they would be
expected to have only a minimal effect on the average price.
In the event that a particular forecaster become preferred in relation to other forecasters,
then this preference may be incorporated into the weightings attributed to individual
forecasts. This would proceed in similar way to the sensitivity testing undertaken in the
previous section. In this way the model is able to place a higher value on information
from certain forecasters without completely disregarding information from other sources.
One of the primary limitations of the Meta Model is the limited availability of long term
forecasts. Many forecasts only provide prices for 1-5 years ahead - with prices in the
longer term assumed to revert to a baseline price. For example the “MED High” and
“Goldman Sachs” forecasts revert to $90 USD/barrel and $75 USD/barrel after 2020 and
2012 respectively.
For this reason the Meta Model provides a higher degree of granularity in the short term,
with more limited insight in the medium to long term. It is important that the medium to
long term trends are thus interpreted with a certain degree of caution – particularly given
that many of the models do not appear to explicitly model depletion of oil reserves, which
may be expected to play an increasing role in determining future prices.

Appendix D Modelling the Retail Price of Fuel
124
Appendix D Modelling the Retail Price of Fuel
This Appendix discusses the relationship between the international price of fuel and the
retail price of petrol paid at the pump. The figure below illustrates the correlations
between prices for crude oil and retail transport fuels.
Figure 9.6: Crude oil versus Retail Fuel Price for Diesel 2004-2008
y = 0.8752x + 72.333R2 = 0.9416
y = 0.8503x + 30.456R2 = 0.9491
0
50
100
150
200
250
$- $20 $40 $60 $80 $100 $120 $140 $160 $180
Crude Oil [NZD $/barrel]
Ret
ail P
rice
[NZD
cen
ts/li
tre
U91Diesel
The linear regression for diesel and petrol are summarised in Table 9.1.
Table 9.1: Summary of Linear Regression relating Crude Oil to Retail Fuel Price
Linear Regression Fuel R2
Gradient Intercept
Regular Petrol 94% 0.8752 72.3
Diesel 95% 0.8503 30.5
This analysis indicates that a simple linear regression model of the price of crude oil
explains 94% and 95% of the variation in retail fuel price. This relationship was stronger
than the relationship between crude oil and the landed price, and thus provided a
reasonable basis for predicting the future retail price. Premium petrol accounts for
approximately 25% of New Zealand’s petrol consumption and retails for approximately
6c/litre more than Regular Petrol. For this reason 0.25*6 = 1.5c/litre was incorporated
into the modelled Petrol price to account for a proportion of Premium Petrol. Thus the
petrol prices discussed section represents a simple weighted average of both grades.
The following additional cost components were added to the expected price projection:
• Greenhouse gas emission charges increasing from 3.5c to 11.5c/litre in 2011-28; and
• Biofuels sales obligation causes increase in fuel margins of 0.5c/litre in 2012
increasing to 3c/litre by 2028.

Managing transport challenges when oil prices rise
125
Appendix E Back-casting Models
This Appendix discusses results of the Back-casting model in more detail. The structure
of the back-casting spreadsheet is outlined in the table below.
Figure 9.7: Light Passenger Travel back-casting error 2001-07
-2.0%
-1.8%
-1.5%
-1.3%
-1.0%
-0.8%
-0.5%
-0.3%
0.0%
0.3%
0.5%
0.8%
1.0%
2001 2002 2003 2004 2005 2006 2007
Bac
k-ca
stin
g er
ror [
%]
BaseOptimised
The Optimised model is thus able to model historical VKT within approximately ±0.5% of
actual values. Table 9.2 illustrates the time spread accompanying the elasticities
generated by the Optimised model. This reveals that the impacts of the different factors
varies significantly over time – with the impacts of fuel prices limited to the first 2 years
and the impacts of economic growth and vehicle ownership spread equally over the five
year period. The impacts of fuel prices on commercial travel appear to be more
concentrated in the first year in comparison to light passenger travel.
Table 9.2: Time spread of elasticities for Optimised Light Vehicle travel demands
Year Travel Factor
1 2 3 4 5
Fuel Price 57% 43% 0% 0% 0%
Economic Growth 20% 20% 20% 20% 20%
Vehicle Ownership 20% 20% 20% 20% 20%
Workforce Participation 25% 25% 25% 25% 0%
Light passenger
Disposable Income 29% 29% 29% 14% 0%
Fuel Price 91% 9% 0% 0% 0% Commercial
Economic Growth 20% 20% 20% 20% 20%
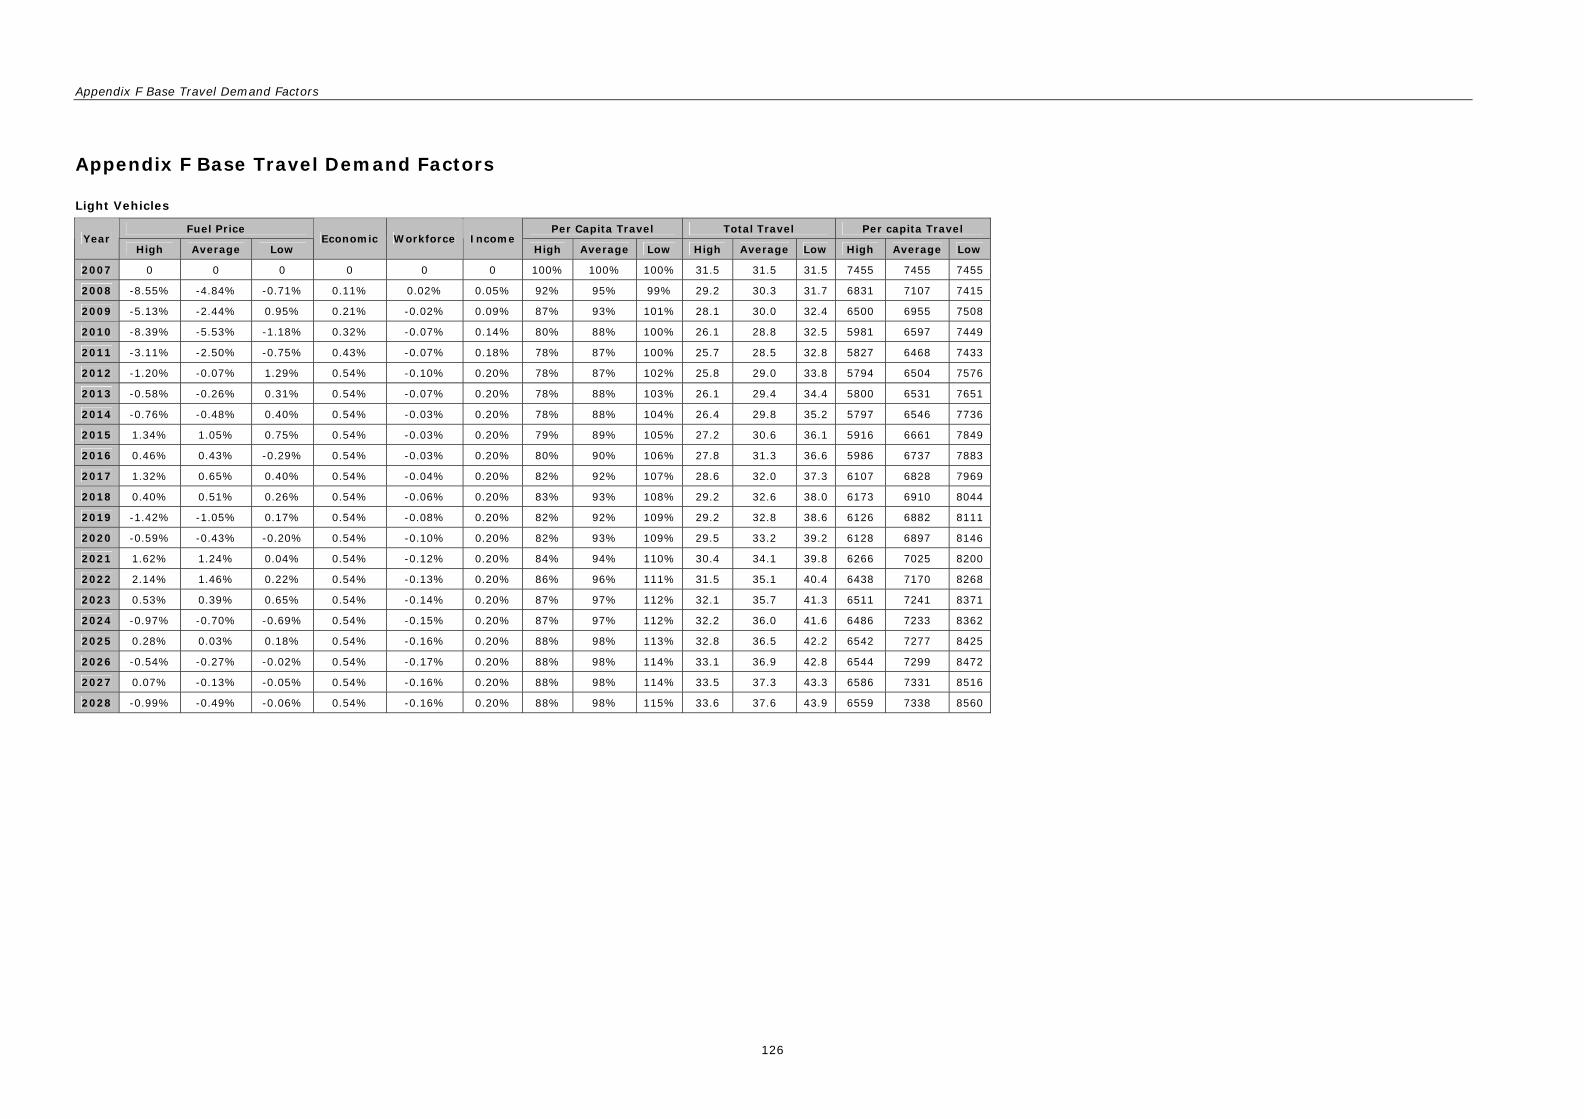
Appendix F Base Travel Demand Factors
126
Appendix F Base Travel Demand Factors
Light Vehicles
Fuel Price Per Capita Travel Total Travel Per capita Travel Year
High Average Low Economic Workforce Income
High Average Low High Average Low High Average Low
2007 0 0 0 0 0 0 100% 100% 100% 31.5 31.5 31.5 7455 7455 7455
2008 -8.55% -4.84% -0.71% 0.11% 0.02% 0.05% 92% 95% 99% 29.2 30.3 31.7 6831 7107 7415
2009 -5.13% -2.44% 0.95% 0.21% -0.02% 0.09% 87% 93% 101% 28.1 30.0 32.4 6500 6955 7508
2010 -8.39% -5.53% -1.18% 0.32% -0.07% 0.14% 80% 88% 100% 26.1 28.8 32.5 5981 6597 7449
2011 -3.11% -2.50% -0.75% 0.43% -0.07% 0.18% 78% 87% 100% 25.7 28.5 32.8 5827 6468 7433
2012 -1.20% -0.07% 1.29% 0.54% -0.10% 0.20% 78% 87% 102% 25.8 29.0 33.8 5794 6504 7576
2013 -0.58% -0.26% 0.31% 0.54% -0.07% 0.20% 78% 88% 103% 26.1 29.4 34.4 5800 6531 7651
2014 -0.76% -0.48% 0.40% 0.54% -0.03% 0.20% 78% 88% 104% 26.4 29.8 35.2 5797 6546 7736
2015 1.34% 1.05% 0.75% 0.54% -0.03% 0.20% 79% 89% 105% 27.2 30.6 36.1 5916 6661 7849
2016 0.46% 0.43% -0.29% 0.54% -0.03% 0.20% 80% 90% 106% 27.8 31.3 36.6 5986 6737 7883
2017 1.32% 0.65% 0.40% 0.54% -0.04% 0.20% 82% 92% 107% 28.6 32.0 37.3 6107 6828 7969
2018 0.40% 0.51% 0.26% 0.54% -0.06% 0.20% 83% 93% 108% 29.2 32.6 38.0 6173 6910 8044
2019 -1.42% -1.05% 0.17% 0.54% -0.08% 0.20% 82% 92% 109% 29.2 32.8 38.6 6126 6882 8111
2020 -0.59% -0.43% -0.20% 0.54% -0.10% 0.20% 82% 93% 109% 29.5 33.2 39.2 6128 6897 8146
2021 1.62% 1.24% 0.04% 0.54% -0.12% 0.20% 84% 94% 110% 30.4 34.1 39.8 6266 7025 8200
2022 2.14% 1.46% 0.22% 0.54% -0.13% 0.20% 86% 96% 111% 31.5 35.1 40.4 6438 7170 8268
2023 0.53% 0.39% 0.65% 0.54% -0.14% 0.20% 87% 97% 112% 32.1 35.7 41.3 6511 7241 8371
2024 -0.97% -0.70% -0.69% 0.54% -0.15% 0.20% 87% 97% 112% 32.2 36.0 41.6 6486 7233 8362
2025 0.28% 0.03% 0.18% 0.54% -0.16% 0.20% 88% 98% 113% 32.8 36.5 42.2 6542 7277 8425
2026 -0.54% -0.27% -0.02% 0.54% -0.17% 0.20% 88% 98% 114% 33.1 36.9 42.8 6544 7299 8472
2027 0.07% -0.13% -0.05% 0.54% -0.16% 0.20% 88% 98% 114% 33.5 37.3 43.3 6586 7331 8516
2028 -0.99% -0.49% -0.06% 0.54% -0.16% 0.20% 88% 98% 115% 33.6 37.6 43.9 6559 7338 8560

Managing transport challenges when oil prices rise
127
Commercial Vehicles
Fuel Price Combined Total Travel Per capita Travel Year
High Average Low Economic
High Average Low
Mode shift High Average Low High Average Low
2007 0 0 0 0 100% 100% 100% 0% 8.7 8.7 8.7 2052 2052 2052
2008 -2.67% -1.65% -0.45% 0.26% 98% 99% 100% 0.0% 8.5 8.6 8.7 2003 2024 2048
2009 -1.43% -0.72% 0.27% 0.52% 96% 98% 100% -0.3% 8.5 8.7 8.9 1980 2015 2059
2010 -2.19% -1.52% -0.36% 0.79% 95% 97% 101% -0.3% 8.5 8.7 9.0 1947 1995 2063
2011 -0.79% -0.67% -0.22% 1.05% 95% 97% 101% -0.3% 8.5 8.8 9.1 1947 1997 2075
2012 -0.30% -0.02% 0.40% 1.31% 96% 98% 103% -0.3% 8.7 8.9 9.3 1962 2018 2105
2013 -0.15% -0.07% 0.10% 1.31% 96% 99% 104% -0.3% 8.8 9.1 9.5 1980 2038 2129
2014 -0.19% -0.13% 0.13% 1.31% 97% 100% 105% -0.3% 9.0 9.3 9.7 1997 2057 2155
2015 0.34% 0.28% 0.24% 1.31% 99% 102% 106% -0.3% 9.2 9.5 9.9 2025 2084 2182
2016 0.12% 0.12% -0.09% 1.31% 100% 103% 107% -0.3% 9.4 9.7 10.1 2048 2109 2204
2017 0.34% 0.18% 0.13% 1.31% 101% 104% 109% -0.3% 9.6 9.9 10.3 2077 2135 2230
2018 0.10% 0.14% 0.08% 1.31% 102% 105% 110% -0.3% 9.8 10.1 10.5 2101 2161 2255
2019 -0.36% -0.29% 0.06% 1.31% 103% 106% 111% -0.3% 9.9 10.2 10.7 2116 2177 2280
2020 -0.15% -0.12% -0.06% 1.31% 104% 107% 112% -0.3% 10.1 10.4 10.9 2135 2198 2303
2021 0.41% 0.34% 0.01% 1.31% 106% 109% 113% -0.3% 10.3 10.6 11.1 2166 2228 2328
2022 0.55% 0.40% 0.07% 1.31% 107% 110% 115% -0.3% 10.6 10.9 11.3 2201 2261 2354
2023 0.14% 0.11% 0.21% 1.31% 109% 111% 116% -0.3% 10.8 11.1 11.5 2228 2287 2384
2024 -0.25% -0.19% -0.22% 1.31% 109% 112% 117% -0.3% 10.9 11.2 11.7 2246 2307 2404
2025 0.07% 0.01% 0.06% 1.31% 111% 114% 118% -0.3% 11.1 11.4 11.9 2271 2332 2431
2026 -0.14% -0.07% -0.01% 1.31% 112% 115% 120% -0.3% 11.3 11.6 12.1 2292 2355 2456
2027 0.02% -0.04% -0.01% 1.31% 113% 116% 121% -0.3% 11.5 11.8 12.3 2317 2379 2482
2028 -0.25% -0.13% -0.02% 1.31% 114% 117% 122% -0.3% 11.7 12.0 12.5 2335 2401 2508

Appendix F Base Travel Demand Factors
128
Alternative Transport Modes
Active modes Public transport
Cross-elastic demand Combined Total [million km] Cross-elastic demand Combined Total [million km] Year
High Average Low High Average Low High Average Low High Average Low High Average Low High Average Low
2007 0 0 0 100% 100% 100% 1.33 1.33 1.33 0.00% 0.00% 0.00% 100% 100% 100% 2.24 2.24 2.24
2008 4.57% 2.59% 0.38% 105% 103% 100% 1.40 1.37 1.34 6.33% 3.58% 0.52% 106% 104% 101% 2.41 2.35 2.28
2009 2.29% 1.05% -0.55% 107% 104% 100% 1.45 1.40 1.35 3.18% 1.46% -0.76% 110% 105% 100% 2.51 2.41 2.29
2010 4.26% 2.85% 0.69% 112% 107% 101% 1.53 1.46 1.38 5.90% 3.95% 0.95% 116% 109% 101% 2.69 2.53 2.33
2011 1.24% 1.06% 0.33% 113% 108% 101% 1.56 1.49 1.40 1.72% 1.47% 0.46% 118% 111% 101% 2.77 2.60 2.37
2012 0.52% -0.06% -0.72% 114% 108% 100% 1.59 1.51 1.40 0.72% -0.09% -1.00% 119% 111% 100% 2.82 2.62 2.37
2013 0.26% 0.15% -0.09% 114% 108% 100% 1.61 1.52 1.41 0.36% 0.20% -0.13% 119% 111% 100% 2.85 2.65 2.39
2014 0.38% 0.24% -0.21% 114% 108% 100% 1.63 1.54 1.42 0.53% 0.33% -0.29% 120% 111% 100% 2.90 2.69 2.41
2015 -0.75% -0.58% -0.38% 113% 107% 99% 1.63 1.55 1.43 -1.04% -0.81% -0.53% 119% 110% 99% 2.90 2.69 2.42
2016 -0.17% -0.17% 0.19% 113% 107% 100% 1.65 1.56 1.45 -0.24% -0.24% 0.26% 119% 110% 99% 2.92 2.71 2.45
2017 -0.69% -0.33% -0.23% 112% 107% 99% 1.65 1.57 1.46 -0.96% -0.46% -0.32% 117% 110% 99% 2.92 2.73 2.46
2018 -0.15% -0.24% -0.12% 112% 107% 99% 1.66 1.58 1.47 -0.20% -0.34% -0.16% 117% 109% 99% 2.94 2.74 2.48
2019 0.77% 0.59% -0.08% 113% 107% 99% 1.69 1.60 1.48 1.07% 0.81% -0.11% 118% 110% 99% 3.00 2.79 2.50
2020 0.24% 0.17% 0.12% 113% 107% 99% 1.71 1.62 1.50 0.34% 0.24% 0.16% 119% 110% 99% 3.03 2.82 2.53
2021 -0.89% -0.68% -0.03% 112% 107% 99% 1.71 1.62 1.51 -1.23% -0.94% -0.04% 117% 109% 99% 3.02 2.82 2.55
2022 -1.06% -0.71% -0.11% 111% 106% 99% 1.71 1.63 1.52 -1.47% -0.99% -0.16% 116% 108% 99% 3.00 2.81 2.57
2023 -0.18% -0.14% -0.34% 111% 106% 99% 1.72 1.64 1.53 -0.25% -0.19% -0.46% 115% 108% 98% 3.02 2.83 2.57
2024 0.54% 0.39% 0.40% 112% 106% 99% 1.74 1.66 1.55 0.74% 0.54% 0.56% 116% 109% 99% 3.07 2.87 2.61
2025 -0.20% -0.05% -0.13% 111% 106% 99% 1.75 1.67 1.56 -0.28% -0.07% -0.19% 116% 109% 99% 3.08 2.89 2.63
2026 0.31% 0.15% 0.03% 112% 106% 99% 1.77 1.69 1.57 0.43% 0.21% 0.04% 116% 109% 99% 3.12 2.92 2.65
2027 -0.07% 0.06% 0.02% 112% 106% 99% 1.78 1.70 1.58 -0.10% 0.08% 0.03% 116% 109% 99% 3.14 2.94 2.67
2028 0.54% 0.25% 0.03% 112% 107% 99% 1.80 1.72 1.60 0.75% 0.35% 0.04% 117% 109% 99% 3.19 2.97 2.69

Managing transport challenges when oil prices rise
129
Appendix G Impacts of Responses on Travel
The following table summarises the assumptions used to estimate the impacts of the
recommended responses on travel demands.
The coverage of the measure is defined by the areas and times during which it is likely to
affect travel patterns. In terms of area, Statistics NZ sub-national population estimates
were used to breakdown the population into three categories:
• Major Urban;
• Secondary Urban; and
• Other.
The breakdown of the population in these three categories is highlighted in Figure 9.8.
Figure 9.8: Relative sub-national population by population density
72%
22%
6%
Major Urban
Secondary Urban
Other
From 2001-07 there was an overall increase in the percentage of population living in
major urban areas and reductions in the other two categories. This continues a long
historical trend that is expected to accelerate as oil prices rise.
The recommended responses were assessed in terms of their relationship to the above
areas. This assumed values for their spatial and temporal coverage. Some responses,
such as PNR, may be expected to reach across categories and provide more energy
efficient access to urban areas for those living in rural areas.
An explanation of the information used to guide these assumptions is provided below.

Appendix G Impacts of Responses on Travel
130
Table 9.3: Determining the coverage of the recommended responses
Coverage Response
Spatial Notes Temporal Notes Overall
Parking Management
78% Urban 33% Daytime trips 26%
Road Pricing 72% Major Urban 20% Peak trips 14%
Zoning 78% Urban 100% All urban trips 78%
Public transport
59% Urban > 100,000 33% High quality service 8 hours per day
19%
Active Modes 78% Assumes no rural uptake
20% Daylight and good weather
16%
Multi-modal 89% All urban plus half rural
90% Alternative modes suitable most times of day
80%
Information 100% National 100% Information available all times of day
100%
Travel Plans 78% Urban workplaces 25% Most peak trips + some day trips
20%
Car-pool / Car-share
75% Large urban + some small urban
67% Car-pool and car-share available 18 hours/day
50%
The impact of the recommended responses was then estimated from the sources
summarised in Table 9.4.

Managing transport challenges when oil prices rise
131
Table 9.4: Determining the impacts of the recommended responses
Response Impacts Notes Sources
Parking Management 20% Pricing parking typically reduces VKT by -0.15 to -0.30. Removing minimum parking requirements will increase demand for existing parking and thereby drive the price up to more efficient level. It is noted that these measures are more comprehensive than those tested in ARPES study and therefore the effects are commensurately larger.
Bianco (2000), Booz Allen Hamilton (2001a), Litman (2006a), Shoup (2005)
Road Pricing 20% Road pricing typically reduces trips by 15-30% although this is highly dependent on the nature of the scheme and associated pricing schedule. In general the effects of road pricing is often greater than modeling suggest, possibly due to higher motorist resistance to out of pocket expenses (as with parking).
MOT (2006), Hugosson and Sjöberg (2006)
Zoning 10% Flexible zoning is expected to result in increased density and diversity of uses with travel demands approximately 10% lower than average. TOD and urban renewal projects will allow for increased development around transport stations and in existing urban areas with more multi-modal access
Litman (2008), Dunphy (2004)
Public transport 15% PT home-to-work mode share is approximately 4%, although VKT is higher at 7% as it tends to replace longer journeys. Continued investment in high quality PT, such as rail and/or BRT, suggests 15% VKT offset is achievable. PT in Finland (population 5.2 million people) currently has VKT mode share of approximately 18%.
Statistics (2006), MOT (2008a), CFIT (2001)
Active Modes 5% Active modes may be expected to primarily replace trips less than 5km. While these trips account for approximately 33% of total trips, many of these short trips are actually individual car trips are part of longer “trip chains” or “journeys.” Local research suggests that only 20% of trip chains are less than 5km and therefore suitable for uptake by alternative modes. Moreover, as active modes are replacing primarily short trips, their overall impact on VKT is likely to be even lower.
O’Fallon and Sullivan (2005)
Multi-modal 5% Multi-modal integration is expected to occur on a number of fronts - such as integrated ticketing for PT, PNR to connect road and PT systems, improved walking and cycling connections reduce need to drive and increase accessibility to PT.
TRPG (2004)
Information 2.5% Effects are difficult to estimate. Information tends to increase the effectiveness of other measures. In general should seek to correct "imperfect information" in regard to: future price of oil and investment in alternative modes; awareness of parking/congestion costs; and promote use of alternative modes and travel demand management. Dynamic information systems may help convey information congestion charges, parking prices, delays etc.
Thompson et al (2001), Ker (1999)
Travel Plans 5% Effectiveness of travel plans appears to vary between 5-15% depending on the comprehensiveness of the measures implemented, and in particular whether they introduce incentives to reduce parking demands.
Rye (2002)
Car-pool / Car-share 5% Car-share may reduce per-capita VKT by anywhere between 5-80% with 40% a general average. Information systems to assist with car-pooling (ride-share websites etc) may be important for establishing initial connections esp. for small workplaces in rural areas.
Shaheen (2005)
Table 9.5: Travel Demand Reduction Factors 2007-2028
Year Parking Road Pricing Zoning PT Active Multi-modal Information Travel Plans Car-Sharing / Car-pooling Total
2007 100% 100% 100% 100% 100% 100% 100% 100% 100% 100.0%
2008 100% 100% 100% 100% 100% 100% 100% 100% 100% 100.0%
2009 100% 100% 100% 100% 100% 100% 98% 100% 100% 96.8%
2010 100% 100% 99% 100% 100% 100% 98% 100% 100% 96.0%
2011 100% 100% 99% 100% 100% 99% 98% 100% 100% 94.9%
2012 99% 100% 99% 100% 100% 99% 98% 100% 100% 93.8%
2013 99% 100% 98% 99% 100% 99% 98% 100% 99% 92.7%
2014 99% 100% 98% 99% 100% 99% 98% 100% 99% 91.6%
2015 98% 100% 97% 99% 100% 99% 98% 100% 99% 90.5%
2016 98% 100% 97% 99% 100% 98% 98% 100% 99% 89.4%
2017 97% 97% 97% 99% 100% 98% 99% 100% 99% 85.3%
2018 97% 97% 96% 99% 100% 98% 99% 100% 99% 84.2%
2019 97% 97% 96% 98% 100% 98% 99% 99% 99% 83.2%
2020 96% 97% 96% 98% 100% 98% 99% 99% 99% 82.2%
2021 96% 97% 95% 98% 100% 97% 99% 99% 98% 81.3%
2022 96% 97% 95% 98% 100% 97% 99% 99% 98% 80.3%
2023 95% 97% 94% 98% 99% 97% 99% 99% 98% 79.3%
2024 95% 97% 94% 98% 99% 97% 99% 99% 98% 78.3%
2025 95% 97% 94% 98% 99% 97% 100% 99% 98% 77.4%
2026 94% 97% 93% 97% 99% 96% 100% 99% 98% 76.4%
2027 94% 97% 93% 97% 99% 96% 100% 99% 98% 75.5%
2028 94% 97% 93% 97% 99% 96% 100% 99% 98% 74.6%

Appendix H General Data
132
Appendix H General Data
Year Population NZD/USD Economic Growth
Disposable Income
Workforce Participation
2008 4264000 0.780468 2.37% 1.35% 0.66751
2009 4306000 0.744647 2.37% 1.35% 0.66475
2010 4348000 0.684945 2.37% 1.35% 0.66157
2011 4390000 0.641525 2.37% 1.35% 0.66102
2012 4430000 0.615474 2.37% 1.35% 0.66060
2013 4470000 0.600000 2.37% 1.35% 0.66014
2014 4510000 0.600000 2.37% 1.35% 0.65959
2015 4550000 0.600000 2.37% 1.35% 0.65918
2016 4590000 0.600000 2.37% 1.35% 0.65869
2017 4626000 0.600000 2.37% 1.35% 0.65727
2018 4662000 0.600000 2.37% 1.35% 0.65554
2019 4698000 0.600000 2.37% 1.35% 0.65383
2020 4734000 0.600000 2.37% 1.35% 0.65176
2021 4770000 0.600000 2.37% 1.35% 0.64941
2022 4804000 0.600000 2.37% 1.35% 0.64685
2023 4838000 0.600000 2.37% 1.35% 0.64409
2024 4872000 0.600000 2.37% 1.35% 0.64143
2025 4906000 0.600000 2.37% 1.35% 0.63863
2026 4940000 0.600000 2.37% 1.35% 0.63581
2027 4970000 0.600000 2.37% 1.35% 0.63315
2028 5000000 0.600000 2.37% 1.35% 0.63081
Derived from Statistics NZ (2006)
Treasury (2008c)
Average 2000-08
Average 2001-07
Treasury (2008a)

Managing transport challenges when oil prices rise
133
Appendix I Calculating Economic Benefits
Benefit Summary
VKT Cost Savings Year
Base Option Reduction Congestion Air Pollution Greenhouse Consumer Total
2007 31.19 31.19 0.00 $0 $0 $0 $0 $0
2008 30.30 30.30 0.00 $0 $0 $0 $0 $0
2009 29.93 28.97 0.97 $120,968,292 $14,121,932 $9,642,132 $362,260,498 $506,992,855
2010 28.66 27.51 1.15 $143,763,720 $16,783,088 $11,365,200 $478,337,167 $650,249,175
2011 28.35 26.90 1.45 $181,914,964 $21,236,894 $14,263,946 $624,799,076 $842,214,879
2012 28.75 26.96 1.79 $224,409,859 $26,197,781 $17,459,824 $756,603,975 $1,024,671,438
2013 29.11 26.98 2.14 $267,286,113 $31,203,188 $20,633,099 $896,965,565 $1,216,087,965
2014 29.42 26.94 2.48 $310,273,422 $36,221,559 $23,773,600 $1,041,968,717 $1,412,237,298
2015 30.19 27.32 2.87 $359,169,822 $41,929,763 $27,339,156 $1,163,886,854 $1,592,325,595
2016 30.78 27.52 3.26 $407,494,545 $47,571,228 $30,821,787 $1,301,935,958 $1,787,823,519
2017 31.42 26.79 4.63 $579,295,788 $67,627,439 $43,585,941 $1,808,220,767 $2,498,729,935
2018 32.02 26.97 5.04 $631,102,137 $73,675,352 $47,268,579 $1,939,086,833 $2,691,132,900
2019 32.12 26.73 5.38 $673,543,659 $78,630,008 $50,248,793 $2,112,334,230 $2,914,756,690
2020 32.41 26.65 5.75 $720,149,133 $84,070,767 $53,542,775 $2,267,331,858 $3,125,094,533
2021 33.24 27.01 6.23 $779,860,143 $91,041,477 $57,836,655 $2,376,282,381 $3,305,020,655
2022 34.15 27.41 6.74 $843,069,044 $98,420,533 $62,413,005 $2,485,566,049 $3,489,468,631
2023 34.70 27.52 7.18 $899,103,996 $104,962,096 $66,470,886 $2,625,400,833 $3,695,937,811
2024 34.88 27.33 7.56 $945,833,375 $110,417,320 $69,874,312 $2,805,484,001 $3,931,609,008
2025 35.32 27.33 7.99 $999,799,978 $116,717,423 $73,843,025 $2,952,346,690 $4,142,707,115
2026 35.65 27.24 8.40 $1,051,362,725 $122,736,898 $77,653,672 $3,119,341,094 $4,371,094,389
2027 36.00 27.17 8.82 $1,104,015,968 $128,883,678 $81,569,804 $3,279,095,152 $4,593,564,602
2028 36.22 27.01 9.21 $1,153,133,370 $134,617,682 $85,228,037 $3,457,149,684 $4,830,128,773
Congestion Reduction
Congestion Benefits Congestion Rates Population Notes
Auckland $1.27 33%
Wellington $0.98 11%
Christchurch $0.09 13%
2002NZD/km $0.54
CPI 116%
2008NZD/km $0.63
The congestion reduction benefits per kilometre removed from the road network were calculated as the weighted sum of the percentage of the population living in one of the three major urban centres (adjusted for CPI) inflation. This assumes that the recommended responses reduce VKT in proportion to the percentage of population living in urban areas. Such an assumption is likely to underestimate the actual VKT reductions in urban areas and therefore expected to be a conservative estimate of the congestion reduction benefits associated with the recommended responses.
Air Pollution
2008 Total Average per km Source
Air Pollution $578682000 $0.015 Fisher et al., (2007)

Appendix I Calculating Economic Benefits
134
Greenhouse gases
Fuel saved Petrol Diesel Total CO2 Year
VKT saved [litres/km] Litres Split Saved kt CO2 Split Saved kt CO2 tonnes Benefits
2007 0.00 0.1080 0 90% 0 - 10% 0 0 - $0
2008 0.00 0.1073 0 89% 0 - 11% 0 0 - $0
2009 0.97 0.1064 102827005 89% 91748607 212 11% 11078398 29 241,053 $9,642,132
2010 1.15 0.1055 121159658 89% 107791118 249 11% 13368540 35 284,130 $11,365,200
2011 1.45 0.1046 152008381 89% 134840826 311 11% 17167555 45 356,599 $14,263,946
2012 1.79 0.1037 186000742 88% 164510549 380 12% 21490194 56 436,496 $17,459,824
2013 2.14 0.1029 219728452 88% 193770125 448 12% 25958327 68 515,827 $20,633,099
2014 2.48 0.1021 253083512 88% 222526660 514 12% 30556851 80 594,340 $23,773,600
2015 2.87 0.1014 290938462 88% 255054632 589 12% 35883831 94 683,479 $27,339,156
2016 3.26 0.1007 327884609 87% 286591407 662 13% 41293202 109 770,545 $30,821,787
2017 4.63 0.1001 463507614 87% 403929172 933 13% 59578441 157 1,089,649 $43,585,941
2018 5.04 0.0996 502493299 87% 436597225 1,009 13% 65896074 173 1,181,714 $47,268,579
2019 5.38 0.0992 533987019 87% 462572548 1,069 13% 71414471 188 1,256,220 $50,248,793
2020 5.75 0.0988 568791818 86% 491243756 1,135 14% 77548061 204 1,338,569 $53,542,775
2021 6.23 0.0986 614190470 86% 528855943 1,222 14% 85334528 224 1,445,916 $57,836,655
2022 6.74 0.0983 662555865 86% 568778891 1,314 14% 93776974 246 1,560,325 $62,413,005
2023 7.18 0.0982 705385342 86% 603712358 1,395 14% 101672984 267 1,661,772 $66,470,886
2024 7.56 0.0981 741242169 85% 632473617 1,461 15% 108768553 286 1,746,858 $69,874,312
2025 7.99 0.0980 783068417 85% 666126378 1,539 15% 116942040 307 1,846,076 $73,843,025
2026 8.40 0.0980 823189725 85% 698115748 1,613 15% 125073977 329 1,941,342 $77,653,672
2027 8.82 0.0980 864400742 85% 730817794 1,688 15% 133582948 351 2,039,245 $81,569,804
2028 9.21 0.0980 902850869 84% 760978495 1,758 16% 141872374 373 2,130,701 $85,228,037
Fuel kt C02/PJ kt CO2/J MJ/litre J/litre kt CO2/litre
Petrol 70 7.0E-14 33 33000000 2.3E-06
Diesel 73 7.3E-14 36 36000000 2.6E-06

Managing transport challenges when oil prices rise
135
Appendix J Review of Travel Demand Elasticities
Light vehicle travel
This section reports on the evidence of the quantitative magnitudes of consumer
(household) responses to fuel prices. For transportation planning, there are two types of
response that are of particular interest: the direct response of consumers in their
purchases of fuels, and the embodied response in terms of VKT. Even in the short term
and especially over the long term we expect fuel demand elasticities to be larger than VKT
price elasticities. This is because, faced with higher petrol or diesel prices, consumers can
economise not just by driving less, but also by driving more slowly and/or by switching to
more economical vehicles with higher fuel mileages, so that a, say, ten percent reduction
in petrol consumption will be associated with a smaller reduction in kilometres driven.
There is one recent econometric study of fuel demand and VKT in New Zealand, by
Kennedy and Wallis (2007). These researchers find relatively small elasticities: the long-
run fuel consumption elasticity estimate is about -0.2, and the long run VKT elasticity is -
0.3. Apart from the finding that the VKT elasticity is larger than the consumption
elasticity, which seems anomalous, we do not consider that the Kennedy/Wallis study,
thorough and competently executed though it certainly is, is a good guide to the likely
responses of NZ households to a future regime of sustained very high fuel prices, well
beyond prices ever experienced here, though not so far beyond prices in high-tax
economies, as illustrated in Table 4.1. The Kennedy/Wallis data series cover the years
from 1974-2006. This period began with what were at the time unprecedentedly high
petrol prices, as a result of the 1970s OPEC oil price spikes, followed by a long period
during which real (inflation adjusted) fuel prices actually trended downwards, and with
just the beginnings of the current upturn at the end of the data series (cf. their figure
2.2). Thus, the fuel demand responses tracked over this period include factors operating
in opposing directions. First, there will be the long-term responses to the ‘high’ late
1970s prices, which, in NZ as elsewhere, stimulated various economising measures on the
part of consumers and producers, such as more fuel-efficient vehicles. But then there will
also be the short-term responses to the gently downward trending prices in the 1980s
and 1990s, which will have encouraged a more easy-going attitude to fuel consumption.
To complement this local study we have consulted several comprehensive and detailed
surveys of the literature of empirical studies of energy elasticities around the world
(Goodwin et al., 2004, Graham and Glaister, 2004, Graham and Glaister, 2002, Litman,
2007d). Graham and Glaister (2004) survey 213 long run fuel demand price elasticities
from 113 studies, and report that the mean estimate is -0.77. Goodwin et al (2004)
surveyed 46 estimates of long run fuel consumption elasticities and average these to be -
0.64. Their surveyed value for the income elasticity of fuel demand, from 20 studies, is
quite low, at 0.49. Graham and Glaister (2002) conclude that the ‘overwhelming
evidence from our survey suggests that long run [gasoline consumption] elasticities will
typically tend to fall in the -0.6 to -0.8 range (2002, p22), whereas the long run traffic
(VKT) elasticity is likely to be about -0.3. The long run income elasticity of fuel demand is
in the range 1.1 to 1.13.
Appendix J Review of Travel Demand Elasticities
136
Litman (2008) is the most up to date survey, and includes an illustration of how sustained
differences in fuel prices play out in consumer demand and technology choices:
‘Fuel taxes are about 8 times higher in the UK than in the US, resulting in fuel
prices that are about three times higher. UK vehicles are about twice as fuel
efficient, automobiles are driven about 20% less per year, so annual fuel costs
are only 1.25 times higher than in the U.S. since per capita vehicle ownership is
lower, average per capita fuel expenditures are similar in both countries… Similar
patterns can be found when comparing other countries with different fuel prices.
This indicates that automobile use is sensitive to price.’ (2008, p7)
Note that the quality of travel and location options affects the elasticity of vehicle travel
with respect to price. Consumers who live in automobile dependent communities, or who
lack suitable housing options in accessible, multi-modal locations (for example, if urban
neighbourhoods are considered unsafe or stigmatized compared with automobile-
dependent suburban locations) are less able to reduce their vehicle travel in response to
rising fuel prices. There is some research on this, with a recent study finding that higher
fuel prices caused a reduction in traffic on highways with parallel rail transit services, but
not on highways that lack such service (Congressional Budget Office, 2008). Public
transport demand elasticities are discussed in more detail in the following section.
Public transport
The evidence presented above suggests that rising fuel prices indeed cause a reduction in
demand for vehicle travel. But what happens to the kilometres not driven in private
vehicles when fuel prices increase; to what extent are private automobile trips replaced
by trips on alternative modes? More specifically, to what extent is the choice of
alternative modes a reflection of social preferences or a reflection of availability?
Naturally, we expect private transport demands to be more elastic in situations where
attractive and accessible alternatives exist. We have found a number of good studies of
the determinants of public transport (PT) usage, though somewhat fewer than there are
studies of private vehicle and fuel elasticities.
The quality (not just the price) of options is likely to be an important factor in VKT
responses to higher fuel prices in New Zealand, because there is more room for
improvement in the public transit systems here. In particular in Europe higher population
densities and comprehensive public bus and rail systems have been in place, often for a
century or more. In Section 4.5 below we note the evidence that service quality is
directly related to PT usage; there is less direct evidence on what must be the other side
of this coin - that improved PT service reduces VKT, but it must be so. Litman’s survey of
elasticities, which is the most up to date of all the surveys, cites several very recent
studies that approach this issue (Bento et al., 2005, Giuliano and Dargay, 2006, Whelan,
2007).
Bresson et al (2003) focus on a comparison of the demand for PT in England and France,
and determine that long-run price (fare) elasticities are in the range -0.5 to -0.8. They
find interesting differences in the two nations’ income elasticities: in England this is -0.9,

Managing transport challenges when oil prices rise
137
reflecting the conventional view that public transport is what economists call (without
pejorative intent) an “inferior good”, meaning simply that people use less of it as they get
wealthier (and thus able to afford to buy and use their own private vehicle). In France, in
contrast, there is no significant evidence for a non-zero income elasticity. The income
elasticity of PT services is therefore more complicated than often assumed - in a high-car
ownership society like New Zealand, we might expect income elasticities of demand for PT
to be quite small, reflecting the fact that other factors are more important determinants
of the choice of transport mode.
Bresson et al also note Goodwin’s 1992 survey of 50 demand elasticity estimates for bus
use, implying a summary figure of -0.4. And they note a 1998 survey paper by Preston,
which finds ‘service elasticities’ of the use of bus transport at 0.49 for large cities
(population > 0.5 million) and 0.33 for smaller cities. Service elasticities refer to the
responsiveness of consumers to changes in the service quality of PT. Dargay and Hanly
(2002) find a service elasticity of +1.0 for local bus services in England, as well as a cross
elasticity with respect to motoring costs of +0.66, a fare elasticity of -0.9, and an income
elasticity of -0.8 (Dargay and Hanly, 2002).
A problem with estimating service elasticities is identifying causation as opposed to
correlation. The most common measure used for service quality is simply the number of
bus kilometres travelled, as a proxy for the frequency and breadth of the service. But of
course the supply of bus kilometres could and indeed should be responsive to the
demand, so it is difficult to infer that the first causes the second, even though nearly all
studies apparently do make this assumption.
One article which used econometric methods to control for endogeneity (as it is called) is
Holmgren’s ‘Meta-analysis of Public Transit Demand’ (Holmgren, 2007). A meta-analysis
is a “model of the models” which doesn’t just report or survey previous studies, but
attempts to explain why the results of these studies differ in terms of differences in model
specifications. Holmgren finds that the “famous rule of thumb” that the service elasticity
of bus transport demand is +0.3 does emerge from the meta-analysis, but only if the
quality of service is assumed to be exogenous. If, instead, service quality is endogenous,
so that service levels, at least in part, are themselves responsive to demand, then the
true service elasticity (ie, the response to a truly exogenous service quality shift, such as
one initiated as a deliberate government initiative to induce people to change their
transportation mode, rather than responding to demand changes) is apparently much
larger than the rule of thumb, being around 1.05. His meta analysis reveals numbers for
the price (fare) elasticity (-0.59), the income elasticity (-0.62), the petrol price cross-
elasticity (+0.4) and the elasticity of public transport use to car ownership rates, which is
-1.48.
Commercial Vehicles
A survey of international studies into commercial travel demand elasticities are
summarised in Table 9.6 (Clark et al., 2005).

Appendix J Review of Travel Demand Elasticities
138
Table 9.6: Commercial Travel Demand Elasticities
Product Study
Produce Wood Chemical Metal Plastic Stone Electrical
Oum et al (1992) -0.52 -0.56 -0.98 -0.41 - - -
Friedlander and Spady (1980)
-1.01 -1.72 - -1.58 -1.08 -1.06 -1.31
Winston (1983) -0.99 -0.14 -1.87 -0.18 -2.01 -2.04 -0.78
Abdelwahab and Sargious (1992)
-1.2 -1.06 -0.93 -0.8 -1.14 -0.75 -1.19
Luk and Hepburn (1993)
-0.8
Björner (1999) -0.81
The contribution of various sectors to commercial travel demands in New Zealand was
sourced from Bolland et al (2005) and categorised according to the product types listed in
Table 9.6.
The weighted average of the elasticities for these sectors provided an estimated
commercial elasticity of -0.95 for New Zealand’s overall commercial travel demands in
response to general price increases. Assuming that fuel accounts for 11% of total
operating costs, then the elasticity in response to rising fuel costs may be estimated at
11% of -0.95 = -0.104 (Bass and Latto, 2005).

Managing transport challenges when oil prices rise
139
Appendix K Legal Implications
Minimum Parking Requirements
Minimum parking requirements are typically set out in local authority District Plans. The
general process for changing District Plans to amend minimum parking requirements is
slow and dependent upon the priority given to the change by each individual local
authority. Plan changes are also subject to appeal to the Environment Court. Plan
changes effected this way will almost inevitably produce divergent outcomes.
The most efficient way to implement the recommendation may be for central government
to enact a National Environmental Standard (“NES”) or a National Policy Statement
("NPS") under sections 43 and 45 of the Resource Management Act 1991 (RMA).
A NES under section 43 RMA sets minimum standards that must be met as a matter of
law and do not require amendment to bylaws, district or regional plans to take effect.
Where an NES states that an activity is permitted or does not require resource consent
section 43A(5) acts to relegate the role of planning instruments to addressing those
effects of the activity not addressed by the NES. Sections 43B(3) and 43E(3) prohibit
bylaws, district or regional plan rules, and resource consent conditions from being more
lenient than a NES. These regulatory documents can provide for more stringent
measures but not more lenient measures. Section 43D RMA limits the application of an
NES to existing designations. Where car parks have been created by RMA designation an
NES would not apply until the designation lapses or the conditions of the designation are
altered.
Section 43(1) RMA permits regulations that prescribe any or all of the technical
standards, methods, or requirements for district plans restricting use of land and
subdivisions as well as regional plans for water use and discharge of contaminants into
the environment. The proposal of minimum parking requirements is a use of land and
relevant to subdivision consents also.
A NPS under section 45(1) RMA provides a broad power to "state objectives and polices
for matters of national significance that are relevant to achieving the purpose of the Act",
namely to promote the sustainable management of natural and physical resources. The
proposal to remove minimum parking requirements is arguably a nationally significant
issue, in the context of rising oil prices and the effects on long term land use patterns. A
different approach to the provision of parking would promote sustainable management of
natural and physical resources.
Section 55 RMA requires local authorities to amend a district plan to give effect to and
take any action required by a NPS, within the timeframe specified in the NPS.
Both NES and NPS mechanisms provide opportunity for public input in the development of
the NES and NPS, and can relieve local authorities of the obligation to publicly notify and
hold hearings to consider submissions prior to incorporation of changes to the district
plan.

Appendix K Legal Implications
140
Pay Parking
Pay parking on roads and public property can be implemented through local authority
bylaws. local authorities have powers to make bylaws under sections 145 and 146 of the
Local Government Act 2002 ("LGA'02") and section 72 of the Land Transport Act 1962.
Section 146(b)(vi) LGA'02 provides express power to create bylaws for the management
of land under the control of the local authority, including roads.
Bylaws created by local authorities must be promulgated under the special consultative
procedure prescribed by sections 83, 86 and 156(1) LGA'02.
Local authorities are also free to set user charges as they choose in relation to
commercial parking facilities under their control.
It is not clear how parking pricing could be regulated in relation to the use of privately
operated parking facilities. Legislative intervention would be required to empower local
authorities to regulate privately operated parking facilities.
The rededication by local authorities of land currently used for parking to other uses will
require consideration of land status issues. For example: in some cases land vested in a
local authority may be constrained by a designation, underlying district zone rue, the
vesting document such as a trust, Public Works Act 1981 action or the provisions of the
Reserves Act 1977. In such cases change of the use of the land may be prohibited or
restricted and if the land use cannot be changed, legislative intervention by central
government may be required.
In the case of private land, changes to land use rules in district plans would be required,
and subject to rights of objection and appeal.
Flexible Zoning and Urban Containment
A number of local authorities are seeking to provide for flexible zoning and urban
containment through the development and implementation of growth strategies. While
the Auckland Regional Council is required under sections 37SE to 37SH of the Local
Government Act 1974 to adopt a growth strategy for its region, all other growth
strategies have been adopted at the discretion of the particular local authority.
Nonetheless, a number of growth strategies have been adopted, such as the BOP Smart
Growth Strategy.
In addition, but again specific only to Auckland, the Local Government (Auckland)
Amendment Act 2004 (LGAAA) mandates that all councils in the Region integrate their
land transport and land use provisions and ensure these are consistent with the Auckland
Regional Growth Strategy (“RGS”), give effect to its Growth Concept and contribute to the
land transport and land use matters specified in Schedule 5 (sections 39 and 40, LGAAA).
Again, although a number of local authorities have sought to integrate their land transport
and land use planning at a regional level, this is at the discretion of the local authorities
concerned.

Managing transport challenges when oil prices rise
141
Any proposal to make this mandatory for all councils would require legislative
amendment.
Development Contributions
Sub-part 5 of Part 8 of the Local Government Act 2002 provides for territorial authorities
to set development contributions. Regional councils may not set development
contributions. This is a separate and additional power to that given to local authorities
(both regional and territorial councils) to impose financial contribution conditions in
resource consents in section 108(2)(a) of the RMA 1991 (and, on a transitional basis, in
sections 407 and 409 of that Act).
Development contributions may need to be made if a development has the effect
(including any cumulative effects from a grouping of developments) of requiring new or
additional assets, or assets of increased capacity, that result in the territorial authority
incurring capital expenditure for reserves or network or community infrastructure. To
avoid the danger of overpayment by developers or “double dipping” by territorial
authorities (ie obtaining funding from more than one source for the same purpose) a
territorial authority cannot require a development contribution where it has taken a
financial contribution for the same development or for the same purpose. The territorial
authority must ensure that it accurately identifies the purpose for the development
contribution so that these requirements are met, as there may be many instances where
a development will be subject to financial as well as development contributions.
Before a territorial authority can require development contributions, it must adopt a
development contributions policy that includes: (a) an explanation of, and justification
for, the way in which development contributions are calculated; (b) the significant
assumptions underlying those calculations; (c) any conditions and criteria for remission,
postponement or refund of contributions or return of land; and (d) the basis of valuing
land for the purposes of assessing money contributions for reserves.
While it is possible for territorial authorities to differentiate between developments that
contribute more to the need for new or additional transport assets, or transport assets of
increased capacity, in our experience few territorial authorities have calculated
development contributions in this way or provided for remissions on this basis. While it
may be technically difficult to make these calculations or justify them, there appears to be
no legal impediment to doing so. In addition, any choice to do so will be at the discretion
of the territorial authorities concerned, although central government could seek legislative
change to the Local Government Act 2002 to mandate this consideration or provide
guidelines/technical assistance to achieve this. Development contributions policies may
be amended or a new policy adopted, subject to the special consultative procedure, at
any time.
Urban Renewal Projects and Transit Oriented Development
We understand Cabinet has recently considered proposals on how to manage urban
renewal projects in New Zealand. While there are general statutory powers, such as the
RMA 1991 and the Public Works Act 1981, there are no specific legal powers that local

Appendix K Legal Implications
142
authorities have regarding urban renewal. Cabinet has considered proposals for new
institutional arrangements and legislative change to assist moving beyond one-off
projects, to a more comprehensive, integrated and transformational approach to urban
development. (See Gray, R.N. 2006. Towards an Urban Transformation Framework for
New Zealand: A discussion paper prepared for the Ministry for the Environment).
Public sector agencies in Australia, the United Kingdom and the United States all play
significant roles in leading urban renewal and all use a form of Urban Development
Authority (UDA) with a variety of legal tools and powers. Urban Development Authorities
(UDAs) are considered to be the most appropriate response in areas that experience: land
fragmentation; uncoordinated central government responses and conflicting objectives as
well as funding inconsistencies associated with this; and property market disinterest and
deprivation.
In addition UDAs are often used, because of their specialised legal tools and powers,
where there are under-utilised land-holdings of a significant scale, such as
decommissioned government sites and assets such as railway yards, hospitals and
teaching institutions.
We note that the legal tools discussed in the previous sections concerning land use
responses will also be applicable to TOD. In addition, in overseas jurisdictions (such as
California), specific legislation has been passed to support TOD. For example, in
Californian the Transit Village Act (Assembly Bill 3152) was passed in 1993 to encourage
California cities and counties to build higher density housing and compact communities
around the state’s rail stops. The Act stipulated that no public works projects, tentative
subdivision maps, or parcel maps could be approved, nor zoning ordinances adopted or
amended, within an area covered by a transit village plan unless the map, project, or
ordinance was consistent with the transit village plan.
Commercial Parking Rate
It should be noted that local roads are not solely funded through rates. The construction
of local roads is sometimes funded by developers by way of financial contributions or
development contributions levied on a subdivision consent. Maintenance and operation of
roads is generally funded through rates.
Targeted rates under sections 16 to 18 of the Local Government (Rating) Act 2002 can be
set for the purpose of funding local roads, subject to the procedural requirement that the
activities or groups of activities are identified in the local authority's funding impact
statement, created pursuant to the LGA'02.
Road Pricing
Road pricing is not provided for under the current regulatory environment. Legislative
intervention would be required to introduce this proposal.

Managing transport challenges when oil prices rise
143
Section 361 of the Local Government Act 1974 provides a mechanism for councils to
establish toll gates on any bridges, tunnels or ferries within the district or under the
control of the Council.
Section 46 of the Land Transport Management Act 2003 provides limited ability to levy
tolls, and is restricted to new roads only. Tolls can be levied in relation to "the planning,
design, supervision, construction, maintenance, or operation of a new road" only.
We referred earlier to the emergency powers in the Petroleum Demand Restraint Act
1981. If the supply of petroleum dwindled to such a point that these powers were
invoked, section 4(2)(b) allows for regulations created by Order in Council to "Restrict,
regulate, or prohibit the use of motor vehicles or any class of motor vehicles". A road
pricing mechanism could be introduced swiftly in the event of supply shortages although
its operational complexity may mean this is a difficult task.
Tax Treatment
We note that the government through Land Transport NZ introduced a fuel efficiency
scale for the sale of vehicles. Amendment to the IT'07 to provide for differential
deductions could be applied on the basis of a minimum point on that scale, with periodic
adjustments over time to account for alteration in the efficiency of vehicles. We also note
the Emissions Trading (Climate Change and Renewable Preference) Bill proposes a
mechanism to account for the pollutants produced by combustion engines within vehicles.
The Bill essentially addresses externalities from the operation of motor vehicles but fails
to address fuel consumption choices.
Transforming Roads into Streets
Reduction in speed and volume of motor vehicle traffic can be achieved through a
combination of amendment to regulations promulgated under the Land Transport Act
1998 (“LTA’98”) relating to the setting of speed limits, and bylaws under the LGA02 or
section 72 LTA’98.
Shared spaces can be incorporated through Bylaws, the provisions of the Local
Government Act 1974 relating to malls under section 336, and stopping roads under
section 342 and the tenth schedule of the Act. Shared spaces could also be created
through zoning or other planning mechanisms under RMA District Plans.
Pedestrianisation of roads and road stopping are not easy processes and in our experience
can be time consuming and expensive. The processes under sections 336, 342 and the
tenth schedule of the Local Government Act 1974 involve public notification, consideration
of public submissions, determination, and rights of appeal to the Environment Court. The
outcome cannot be guaranteed. Legislative amendment could be sought to simplify the
process, reduce costs and increase the speed by which these events can occur.

Appendix K Legal Implications
144
Park and Ride
PNR services / facilities can be developed and implemented voluntarily by local authorities
through annual works programmes or by inclusion in the Regional Transport Strategy
("RTS"), subject to the appropriate resource consents being obtained.
Under section 175 LTA'98 Regional Councils are required to prepare a RTS. A RTS must,
among other things, "contribute to the overall aim of achieving an integrated, safe,
responsive, and sustainable land transport system" and "take into account how the
strategy ensures environmental sustainability."
Development of PNR services / facilities is a responsive measure to assist in meeting the
objective of a sustainable land transport system.
In creating a RTS, Regional Councils are required by section 179 LTA'98 to use the special
consultative process prescribed by sections 83 and 156(1) LGA'02. Section 175(4) LTA'98
states that a RTS must not be inconsistent with any National Land Transport Strategy
("NLTS").
We consider a RTS is the appropriate mechanism to deliver PNR services/ facilities to the
communities within a region. Where a RTS fails to make adequate provision for polices to
develop and implement PNR services and facilities, central government can prescribe,
within a NLTS, objectives which a RTS must adopt so as to not be inconsistent with the
NLTS.
These RTS and NLTS processes provide opportunities for public input at the development
stage. The processes do not, however, provide submitters with rights of appeal.
Public transport Investment
Regional Council's are able to plan to expand PT services and facilities. The current
process requires coordination of priorities through a RTS made under section 175 LTA'98.
This process includes input from local authorities, affected communities, land transport
network providers and the general public.
Sections 174 and 181 of the LTA'98 require Transit New Zealand and Land Transport New
Zealand ("LTNZ") in performing their functions (including LTNZ's function of allocating
funding), duties and powers to ensure they take account of any current national or
regional transport strategies.
In order for PT investment to receive priority over road funding the NLTS would need to
be amended to prescribe that position.
Central government funding is allocated under Part 2 of the Land Transport Management
Act 2003. Funding is allocated pursuant to a national land transport programme
produced annually from land transport programmes submitted by local authorities. Under
the Land Transport Management Amendment Bill, government funding would change.
Central government would still provide funding through NLTPs, and the Bill provides for a
restructuring of the current LTNZ, the office of the Director General of Land Transport and

Managing transport challenges when oil prices rise
145
Transit New Zealand into one entity. The Bill will push annual programme development
to a three year cycle and local authorities would need to combine and submit one regional
programme instead of individual programmes. This may have a side effect of restricting
the ability to obtain a place on the programme, and may cause innovative or urgent
proposals to stagnate while waiting for a place.
Funding from local authorities is coordinated through local authority annual plan
processes under the LGA'02. These processes require use of the special consultative
procedure prescribed in sections 85 and 156(1) LGA'02. Under the Land Transport
Management Bill regional councils will be able to collect revenue from a regional fuel tax.
This tax will enable regional councils to provide their own priorities for projects with
regional priority, and may overcome timing lags created by a three year cycle.
Funding is also available from the private sector though working partnerships.
Multi-modal Integration
The discussion under proposal is directly applicable to the proposal for multi-modal
integration. Integrated ticketing is an issue complicated by the subsidisation of public
transport services. Services are subsidised in different ways and for different reasons.
This issue is yet to be resolved and may need to be addressed beyond a regional level to
a national level and be considered by central Government in terms of a resolution. If
change is to occur quickly legislative change is required.
Taxi Services
Regulation of taxi services is currently a central government function under LTA’98. The
current transport regulatory environment does not provide for specific integration of taxi
services with other modes.
To enable local authorities to integrate taxis services into regional transport planning
would require legislative intervention.
We note that in spite of the lack of coercive powers it is open to local authorities to
consult with taxi service providers and, where appropriate, for the RTS to provide for a
commercial arrangement to be entered into via a public private sector partnership, to
secure the desired transport outcome.
Travel Plans
We expect that there will be individual and collective employment contract obligations
negotiated under the Employment Relations Act 2000 that will impact upon the ability of
employers to provide for the changes envisaged (such as parking cash-out, company car
cash-out and PT passes). Coercive measures may be required for employers to
participate. If so amendment to the Employment Relations Act 2000 would be required.
There are also likely to be FBT issues associated with the provision of these benefits. For
administrative efficiency FBT is taxed on an employer to encourage remuneration
payment in cash, rather than payments in kind. Measures such as parking cash-outs

Appendix K Legal Implications
146
would reduce compliance costs associated with FBT. If an employer is paying in cash,
FBT is not levied. This would result in a reduction in the FBT tax take, which would be
replaced by an increased income tax take.
Car-sharing
From a legal perspective, car-sharing is mainly governed by the contractual relationship
(or terms and conditions of membership) between the car-share company and the
account holder and driver. These activities would be covered by the general law of
contract and tort. They would also be afforded the protection of the Commerce Act 1986,
the Fair Trading Act 1986 and the Consumer Guarantees Act 1993. Until these activities
are well established and specific concerns arise, we expect further regulation would not be
required.
In addition, it has been noted that application procedures to apply for parking spaces can
be cumbersome in some countries. In Italy, for example, the lack of legal definitions and
restrictions for car-sharing has created challenges for legal shared-vehicle parking.
Experts from a number of countries have indicated that supportive parking policies are a
key opportunity for car-sharing in their countries. Vehicle insurance is a major operational
cost of car-sharing, with some few countries (such as Australia) indicating that finding
insurance is an ongoing problem, especially for younger drivers, international, older, and
lower-income drivers.
Transport Management Associations
From a legal perspective, as well as the issues discussed regarding travel plans (e.g.
employment and taxation issues) and car-sharing, the appropriate legal structure for
these associations (such as incorporated societies) should be considered.
In addition, with carpooling, there may be legal issues if the driver begins to offer these
services on a commercial basis. However, if there is no financial transaction between the
driver and passenger or there is a donation, the activity should not be classified as
commercial. Again, as long as the activity is not commercial, no tax issues should arise.
With regard to insurance and accident compensation, non-commercial rules should apply.
Facilitating Mode Shift, Multi-modal Ports, Home Delivery, Active Freight
There appear to be no legal impediments to government agencies planning for facilitating
mode shift, multi-modal ports, Home Delivery, or Active Freight.