research article ars: an adaptive retransmission...
TRANSCRIPT

Research ArticleARS An Adaptive Retransmission Scheme for Contention-BasedMAC Protocols in Underwater Acoustic Sensor Networks
Thi-Tham Nguyen and Seokhoon Yoon
Department of Electrical and Computer Engineering University of Ulsan Ulsan 680-749 Republic of Korea
Correspondence should be addressed to Seokhoon Yoon seokhoonyoonulsanackr
Received 11 August 2014 Accepted 13 January 2015
Academic Editor Nianbo Liu
Copyright copy 2015 T-T Nguyen and S Yoon This is an open access article distributed under the Creative Commons AttributionLicense which permits unrestricted use distribution and reproduction in any medium provided the original work is properlycited
Due to the limited capacity and high propagation delay of underwater communication channels contention-based media accesscontrol (MAC) protocols suffer from a low packet delivery ratio (PDR) and a high end-to-end (E2E) delay in underwater acousticsensor networks due to the reliance on packet retransmission for reliable data delivery In order to address the problem of lowperformance we propose a novel adaptive retransmission scheme named ARS which dynamically selects an optimal value of themaximum number of retransmissions such that the successful delivery probability of a packet is maximized for a given networkload ARS can be used for various contention-based protocols and hybrid MAC protocols that have contention periods In thispaper ARS is applied to well-known contention-based protocols Aloha and CSMA Simulation results show that ARS can achievesignificant performance improvement in terms of PDR and E2E delay over original MAC protocols
1 Introduction
Underwater acoustic sensor networks (UASNs) have receivedgrowing interest due to their potential application to oceano-graphic data collection environment monitoring underseaexploration disaster prevention assisted navigation andtactical surveillance [1 2]
Unfortunately establishing an effective UASN bringsabout new challenges due to unique characteristics of theunderwater acoustic communication channel First theunderwater acoustic communication channel has a highpropagation delay due to the low speed of acoustic signalswhich is approximately 1500ms five orders of magnitudeslower than radio waves Second the available bandwidth foran acoustic channel is limited which leads to a low data ratetypically only tens of kilobits per second [1 3 4] Third thehigh bit error rate is another challenge on an underwateracoustic communication channel [1]
Media access control (MAC) protocols for UASNs havebeen extensively studied to mitigate the limitations of under-water communication channels Among a lot of MAC pro-tocols that have been studied for UASNs contention-basedMAC protocols most of which are based on Aloha [5ndash8]
and CSMA [9ndash14] have particularly received a great deal ofattention due to their low complexity and high applicabilityin UASNs [5ndash17] It has also been shown that a simplecontention-based MAC protocol can achieve acceptablethroughput and low latency with a low network load withoutrequiring time synchronization [14 16]
Contention-based MAC protocols for a UASN can befurther classified into handshake-based and random access-based protocols There have been a lot of studies onhandshake-based protocols [10 15 16 18 19] that attemptedto address the long propagation delay in UASNs Howeverthe exchange of control packets causes a long packet delayand control packets also have a long preamble which leadsto degraded network performance [20] As a result thoseprotocols are not appropriate for applications that require alow delay
There have also been a considerable number of studieson random access-based MAC protocols in UASNs [5 6 89 12] A drawback to random access-based MAC protocolscomes from their reliance on packet retransmission Morespecifically they depend on retransmission for reliable datadelivery which is suitable for terrestrial wireless networksHowever in a UASN packet retransmission can quickly
Hindawi Publishing CorporationInternational Journal of Distributed Sensor NetworksVolume 2015 Article ID 826263 15 pageshttpdxdoiorg1011552015826263
2 International Journal of Distributed Sensor Networks
saturate the network due to the limited channel capacitywhich results in a high level of packet collisions and theconsequent low PDR
Moreover due to the high propagation delay of the under-water acoustic communication channel the MAC protocolrequires a long slot duration which leads to a long back-offinterval and end-to-end delay In other words the uniquecharacteristics of the underwater acoustic communicationchannel make existing packet retransmission strategies pro-posed for terrestrial wireless networks unsuitable for UASNs
Therefore in a communication environment with a lim-ited channel capacity the decision on retransmission shouldbe carefullymade so as not to impose a high network load thatcan inadvertently result in very low performance in terms ofPDR and E2E delay
In order to address this issue we propose an adaptiveretransmission based MAC scheme named ARS whichselects an optimal value of maximum number of retransmis-sions that is adapted to the network load such that successfulpacket delivery probability (PDP) is maximized
ARS periodically calculates a PDP value using the currentmaximum number of retransmissions (or maximum retrans-missions) and then compares it with the estimated PDPvalues that are calculated by increasing and decreasing themaximum number of retransmissions Then ARS choosesa new value for the maximum retransmissions with whicha higher PDP value can be achieved Simulation resultsshow that ARS can achieve higher performance in termsof PDR and E2E delay compared to the existing schemesIn particular when the network load changes ARS alsoshows higher performance than the existing algorithms Notethat sensors in a sensor network may increase the sensordata transmission rate when specific events occur or someconditions are met
It is also worthwhile to note that ARS can be appliednot only to pure contention-basedMAC protocols (includingAloha Aloha-CS and CSMA) but also to hybrid MACprotocols that employ contention periods (ie by using ARSthe performance of data transmission in contention periodscan be improved)
The rest of this paper is organized as follows Sections2 and 3 present the related work and the system modelrespectivelyThen we elaborate on the proposed ARS schemein detail in Section 4The simulation results are presented andanalyzed in Section 5 Finally Section 6 concludes the paperand suggests future work
2 Related Work
MAC protocols for a UASN can be divided into contention-free and contention-based protocols The contention-freeprotocols consist of frequency division multiple access(FDMA) time division multiple access (TDMA) and codedivision multiple access (CDMA) in which they assigndifferent frequency bands time slots or spreading codes todifferent users to avoid collisions among transmissions Inthe contention-based protocols on the other hand the nodesneed to compete to access the shared channel
It is already known that FDMA is not suitable forUASNs due to the limited available bandwidth of underwateracoustic channels TDMA requires a large guard time andstrict synchronization which limits its efficiency [4] Alsoit is known that CDMA-based protocols require a high-complexity design for UASNs In particular it is necessaryto design access codes with high autocorrelation and lowcross-correlation properties to achieve minimum interfer-ence among users in CDMA-based protocols [1]
In contrast contention-based MAC protocols most ofwhich are based on Aloha [5ndash8] and CSMA [9ndash13] haverecently received significant attention for UASNs due totheir simplicity and acceptable throughput [5ndash7 9ndash11 14ndash17] Contention-basedMAC protocols for UASNs can be fur-ther classified into handshake-based protocols and randomaccess-based protocols
A lot of handshake-based protocols have been studied[10 15 16 18 19] For example Guo et al [15] introducedthe propagation delay tolerant collision avoidance protocol(PCAP) In PCAP in order to take advantage of a long prop-agation delay while the sender is waiting for the clear to send(CTS) packet it is allowed to transmit another data packetor perform a handshake for the next queued data packetPCAP requires clock synchronization between neighboringnodes Another handshake-based protocol called distance-aware collision avoidance protocol (DACAP) was proposedby Peleato and Stojanovic [16] Under DACAP after receivingCTS the sender waits for a specific time before transmittingthe data packet in order to ensure the sender can receive anywarning from the intended receiver to avoid the collisionsThe length of the waiting period depends on the distancebetween sender and receiver
Note that those handshake-based protocols can cause along packet delay due to the exchange of control packetsprior to actual data transmission Moreover those controlpackets also have a long preamble in a practical underwatercommunication environment which results in low networkperformance [20]
Another approach to channel contention resolution is touse tone signals For example Syed et al [17] proposed a tone-based protocol called T-Lohi In T-Lohi prior to data trans-mission a node transmits a short tone to inform its neighborsabout the transmission and receives tone signals from othernodes (which may arrive at different time instances due todifferent propagation delays) to detect the number of channelcontenders If the node does not receive any tones it startsdata transmission Otherwise it performs a backoff witha back-off interval calculated using the number of tonesreceived However T-Lohi nodes need special hardware fora wake-up tone receiver to detect tones using low energyconsumption
There have also been a lot of studies on random access-based MAC protocols in UASNs [5 6 8 9 12] In particularChirdchoo et al [5] proposed two enhancements to AlohaAloha with collision avoidance (Aloha-CA) and Aloha withadvance notification (Aloha-AN) These two schemes utilizeinformation obtained from overheard packets plus informa-tion about propagation delays between every node pair in thenetwork to calculate other nodesrsquo busy durations which are
International Journal of Distributed Sensor Networks 3
maintained in the local database table of each node Whena node has a packet to transmit in Aloha-CA the nodechecks the busy durations of other nodes in its databasetable to determine whether its transmission would cause acollision In the event of a possible collision the node deferstransmission for a random time In Aloha-AN a sender alsoperforms a collision check using its database table If nocollision is foreseen it transmits a small notification packetto inform other nodes about its pending data transmission
Another extension of the Aloha protocol is Aloha-CS[14 16 21] According to Petrioli et al [14] and Peleato andStojanovic [16] an Aloha-based protocol can be a potentialprotocol forUASNs because it offers high throughput and lowlatency and does not require time synchronization or a hand-shake mechanism Ahn et al [6] proposed another Aloha-based protocol called propagation delay tolerant Aloha(PDT-Aloha) where the authors try to handle the space-timeuncertainty in underwater acoustic channels Nodes transmitonly at the start of globally synchronized slots The spatialuncertainty is handled by adding a guard time which isproportional to the propagation delay
A major disadvantage to these random access-basedMAC protocols is that they need to rely on a retrans-mission mechanism for reliable data delivery Since packetretransmissions can increase network traffic significantlythe decision on packet retransmission should be carefullymade so as not to degrade network performance In order toaddress this issue the goal of our work is to design a MACscheme that can determine an optimal value of themaximumnumber of retransmissions based on network load so thatthe packet delivery ratio is maximized with a low end-to-enddelay andwithout requiring time synchronization and specialhardware
Note that some protocols take a hybrid approach thatuses features of both TDMA or CDMA and random-accessprotocols [22 23] In particular Hsu andHong [22] proposeda hybrid of scheduling and a random-access protocol forUASNs They divided the channel into several superframeswhich contain broadcast gathering and event report periodsDuring the broadcast and gathering periods each sensorbroadcasts and gathers data in a predetermined time slotwhere it can transmit data while avoiding collisions On theother hand during the event report period sensor nodes usea random-access protocol to report the sensed events that cannot be transmitted using prescheduled time slots
One benefit of a hybrid protocol is that it can providedifferentiated services and quality of service (QoS) Forexample the superframe in a hybrid protocol can consistof a contention-free period (CFP) and contention period(CP) In the CFP time slots are assigned to sensor nodes sothat the high-priority data (or data that require a low delay)can be transmitted without collisions In contrast for low-priority data or non-real-time data sensor nodes contend forchannel access using a random-access protocol (eg CSMAand Aloha) during the CP Note that ARS can be appliedto those hybrid protocols to increase network performanceduring CPs
It is worthwhile to note that our work is significantlydifferent from the existing studies on retransmission schemes
[24ndash27] for terrestrial wireless networks in terms of systemmodels assumptions and algorithms For example the studyin [24] assumes a slotted and time synchronized channel andalso assumes that the transmitting node can detect packetcollision during transmission In [24] it is also assumed thatthe number of blocked stations is known for optimal retrans-mission Those assumptions are not practical in underwaternetworks due to a high propagation delay In contrastour work does not require time synchronization packetcollision detection during transmission and information onthe number of blocked stations
The authors of [25] assumed that the base station knowswhich nodes would transmit a packet in advance and thebase station monitors whether or not all expected packetsare successfully received Then it uses a separate controlchannel to transmit a busy signal to all successful nodesuntil all collided packets are retransmitted successfully Ourprotocol does not use a separate control channel and nodesdo not need towait until all collided packets are retransmittedsuccessfully
Our work also significantly differs from the studies in [2627] The work in [26 27] considered a network that consistsof transmitter-only nodes which have only an RF transmitterwithout an RF receiver The sending nodes transmit eachpacket fixed and predetermined times that is the numberof total transmissions of each packet is predetermined beforethe network is deployed Also the work in [26 27] assumesthat the network status (eg the number of nodes andnetwork loads) does not change during the network life timeSince the network status information is known and eachnode transmits each packet predetermined times finding asolution that maximizes the packet delivery probability israther simple and straightforward
In contrast we assume that the network status variesover time Therefore the algorithm repeatedly compares thePDP (packet delivery probability) value when the value ofthemaximumnumber of retransmissions is decremented andincrementedThis process continues to find the optimal valueof the maximum number of retransmissions Note that thisapproach involves another algorithm approximation of thePDP values with the incremented and decremented valuesof the maximum number of retransmission In addition in[26 27] the off-line optimization formulation was possiblesince every node transmits the packet predetermined timesand thus the total traffic can be controlled However in thiswork the total traffic can not be known since the number ofpacket transmissions are not predetermined
3 System Model
The UASN under consideration has a cluster-based networktopology where each underwater sensor node belongs toone cluster governed by a clusterhead It is known that acluster-based UASN provides suitable network connectivityand scalability in underwater communication environments[28ndash30]
Each underwater sensor node transmits sensing datausing a direct acoustic channel to its clusterhead which
4 International Journal of Distributed Sensor Networks
performs data aggregation and then forwards the data to thesink node Clusterheads are equipped with two underwatercommunication interfaces one for intracluster communi-cations the other for intercluster communications It isassumed that communications in one cluster do not interferewith communications in other clusters because they usedifferent carriers or channels [31] Assigning channels toadjacent clusters or nodes is a well studied area [32ndash34]
Each sensor node transmits to the clusterhead a datapacket of 119871data bytes including data payload and the headerThe data rate is 119877119887 bps Thus the transmission delay of a datapacket is 119905tr = 119871data119877119887 Upon receiving the data packet theclusterhead immediately responds with an acknowledgement(ACK) packet to the source node
In this paper to facilitate presentation we focus on anarbitrary cluster that has 119873 underwater sensor nodes Eachsensor node can transmit to the clusterhead the same copy ofthe original packet up to 119909 times including both original andretransmitted packets if it has not received an ACK packetwithin the ACK timeout interval
Also the packet delivery probability represents the suc-cessful delivery probability of a packet when the packet canbe transmitted up to 119909 times Meanwhile the packet deliveryratio (PDR) refers to the ratio of the number of successfullydelivered packets to the number of the packets transmittedwhich is usually collected by simulations and experiments
4 Algorithms
In this section we describe the detailed algorithm of ARSARS selects an optimal value of 119909 (the maximum numberof retransmissions) to maximize packet delivery probability(PDP) which leads to a high PDR and a low end-to-end delay
First we discuss the assumption that packet arrivalsfollow a Poisson process andwe justify that the assumption isacceptable in a UASN where underwater nodes may performexponential back-off and carrier sensing Then we elaborateon how to obtain the PDP value with the current maximumnumber of retransmissions 119909 We also discuss the estimationof PDP values with different 119909 values which also involvesthe approximation of network load changes over different 119909values Finally we describe the selection of an optimal valueof 119909 based on PDP estimation
41 Preliminary When the packet arrivals follow a Poissonprocess the probability of 119896 packetsrsquo arrival during an intervalof time 119905 is given by
119875 [119899 = 119896] = 119890minus120582119905 (120582119905)
119896
119896 119896 = 0 1 2 (1)
where 120582 represents the arrival rate of the background trafficin a time interval of 119905 (119905 gt 0) [35]
In this paper the arrival rate of the background trafficfrom the other 119873 minus 1 nodes (except the current node) isassumed to follow a Poisson process and is denoted by 120582119887
Now suppose that a data packet arrives at the clusterheadat time 119905119900 with a transmission delay of 119905tr In order for the datapacket not to collide at the clusterhead none of the packets
from the other 119873 minus 1 nodes should arrive at the clusterheadduring the interval [1199050 minus 119905tr 1199050 + 119905tr]
Therefore the probability that a data packet is successfullydelivered without retransmission 119875119904 at the clusterhead isgiven by
119875119904 = 119890minus2120582119887119905tr (2)
42 Estimating PDP with the Current Maximum Numberof Retransmissions In this subsection we first calculate 119875119904Then we extend our discussion to obtain the packet deliveryprobability with up to 119909 retransmissions
As discussed in Section 41 in order to calculate 119875119904 theinformation needed is the arrival rate of background trafficgenerated by the other119873 minus 1 nodes
In ARS each node periodically reports to the clusterheadthe load it has generated More specifically an arbitrary node119894 counts the number of original packets transmitted (say 119888119894ori)and the total number of transmitted packets including thoseretransmitted (say 119888119894tot) at every time interval 119879119897 Then node119894 appends the values of 119888119894ori and 119888
119894
tot to the data packet headerand sends it to the clusterhead
Also let 119862ori and 119862tot denote the total number of originalpackets and the total number of packets transmitted respec-tively by all sensor nodes in the network during 119879119897 Then thevalues of119862ori and119862tot can be approximated by the clusterheadas follows
119862ori =119873
sum
119894=1
119888119894
ori
119862tot =119873
sum
119894=1
119888119894
tot
(3)
The clusterhead then calculates the average number ofretransmissions for each packet 119903119888 (ie 119903119888 = 119862tot119862ori) Thusthe arrival rate of background traffic generated by the other119873 minus 1 nodes during the interval of 119879119897 can be calculated asfollows
120582119887 =119862tot119879119897
times(119873 minus 1)
119873= 119903119888 times
119862ori119879119897
times(119873 minus 1)
119873 (4)
Then the probability that a single packet transmissionis successfully delivered to the clusterhead can be calcu-lated according to (2) using the rate of background trafficcalculated by (4) Also the probability that a single packettransmission fails can be calculated as 119875119891 = 1 minus 119875119904
Now we discuss the calculation of the PDPwhen a packetcan be retransmitted up to 119909 times In order to facilitatediscussion we define 119875(119904119895) and 119875(119891119895) as the probability of thesuccessful and failed delivery of the 119895th transmission of apacket respectively
Also let 119875(119909) denote the PDP with up to 119909 retransmis-sions Then 119875(119909) becomes
119875 (119909) = 119875(1199041) + 119875(1198911)119875(1199042) + sdot sdot sdot + 119875(1198911) sdot sdot sdot 119875(119891119909minus1)119875(119904119909) (5)
Since each packet transmission can be regarded as anindependent event based on the assumption of a Poisson
International Journal of Distributed Sensor Networks 5
process 119875(119904119895) = 119875119904 and 119875(119891119895) = 119875119891 for all 119895 Therefore PDPcan be expressed as
119875 (119909) = 119875119904
1 minus 119875119909
119891
1 minus 119875119891
= 1 minus 119875119909
119891= 1 minus (1 minus 119890
minus2120582119887119905tr)119909
(6)
43 Estimating PDP with the Maximum Number of Retrans-missions of 119909 + 1 and 119909 minus 1 Now we estimate PDPvalues with two different values of the maximum number ofretransmissions 119909 + 1 and 119909 minus 1 Note that (6) cannot bedirectly used to estimate PDP with 119909 + 1 and 119909 minus 1 sincethe arrival rate of background traffic 120582119887 will be altered witha different value of 119909 Instead we use an observation from(4) that the arrival rate 120582119887 depends on the average numberof retransmissions 119903119888 More specifically we first approximatethe average number of retransmissions over different valuesof 119909 to estimate the new arrival rate 1205821015840
119887 which will be used to
obtain new PDP valuesFirst let 119903119909+1 and 119903119909minus1 denote the average actual retrans-
missions when the maximum retransmissions are 119909 + 1 and119909 minus 1
In addition we define a random variable 119884119909 whichrepresents actual retransmissions when the maximum num-ber of retransmissions is 119909 Without loss of generality weassume that 119909 is an integer greater than 1 Then the expectednumber of transmissions 119864(119884119909) can be calculated usingthe probability that the actual number of retransmissions isexactly 119896 where 119896 = 1 119909 That is
119864 (119884119909) =
119909
sum
119896=1
119896 times 119875 (119884119909 = 119896)
= 119875119904 +
119909minus1
sum
119896=2
119896119875119896minus1
119891119875119904 + 119909119875
119909minus1
119891
(7)
Note that there is no 119875119904 in the last term in (7) sincewhether the 119909th transmission is successful or not the sensornode will not transmit the packet any more
Now we take into account the fact that for a given integer119899 sum119899119896=1119896119903119896minus1
= (1 minus 119903119899+1)(1 minus 119903)
2minus (119899 + 1)119903
119899(1 minus 119903) where
119903 isin R and 119903 = 1 Then (7) can be expressed as follows
119864 (119884119909) = 119875119904 + 119875119904(
1 minus 119875119909
119891
(1 minus 119875119891)2minus
119909119875119909minus1
119891
1 minus 119875119891
minus 1) + 119909119875119909minus1
119891
= 119875119904 + (
1 minus 119875119909
119891
119875119904
minus 119909119875119909minus1
119891minus 119875119904) + 119909119875
119909minus1
119891
=
1 minus 119875119909
119891
119875119904
=
1 minus 119875119909
119891
1 minus 119875119891
(8)
Now expected retransmissions with maximum retrans-missions of 119909 + 1 and 119909 minus 1 119864(119884119909+1) and 119864(119884119909minus1) areapproximated by replacing 119909with 119909+1 and 119909minus1 respectivelyAlso let 120575inc = 119864(119884119909+1) minus 119864(119884119909) and 120575dec = 119864(119884119909) minus 119864(119884119909minus1)
Then we approximate values of 119903119909+1 and 119903119909minus1 using 120575inc and120575dec as follows
119903119909+1 = 119903119888 + 120573 times 120575inc
119903119909minus1 = 119903119888 minus 120573 times 120575dec(9)
where 120573 is a system parameter that puts a weight on 120575inc and120575dec
Finally we estimate the new PDP values using (4) and (6)based on the obtained 119903119909+1 and 119903119909minus1
Note that the obtained PDP values based on 119903119909+1 and119903119909minus1 are also approximated values since 119903119909+1 and 119903119909minus1 arecalculated based on 119875119891 with the current network load Oursimulation results show that this approximation works wellas an indicator to determine whether the value of 119909 shouldbe increased decreased or stay the same In fact all theinformation needed is whether the PDP value is increasingor decreasing as 119909 grows or if the PDP value is around thepeak with the current 119909 value
44 Selecting an Optimal Value of the Maximum Numberof Retransmissions Using Estimated PDP Values The mainobjective of ARS is to keep an optimal value of 119909 thatmaximizes PDPTherefore from among the values of 119909 119909+1and 119909minus1 the clusterhead chooses the one that has the highestcorresponding PDP value as the new 119909 value
Intuitively when the network load is low the clusterheadraises the value of 119909 until no higher PDP can be achievedWhen the network load is too heavy on the other hand theachievable PDP value is low due to network congestion anda high level of packet collisions In that case the clusterheaddecides to reduce the119909 value as long as it can achieve a higherPDP value
In order to avoid an unnecessary fluctuation of 119909 theclusterhead uses a threshold value for a gain in the PDPvalue More specifically the decision to change the currentvalue of 119909 to other values is made only if the PDP gainis higher than a given threshold value 120576 Selection of the119909 value is repeated at every interval 119879119897 by the clusterheadwhich publishes this value to the network Upon receiving thenew 119909 value each underwater sensor updates the maximumnumber of transmissions accordingly Algorithm 1 presentsthe adaptive selection process
5 Performance Study
51 Simulation Setup In order to verify thatARS can improvenetwork performance in terms of PDR and E2E delay wecompare the performance of ARS-applied protocols with thatof the existing contention-based MAC protocols
In this paper we select Aloha andCSMA for performancecomparison since a lot of contention-based MAC protocolsare based on Aloha and CSMA The design simulate emu-late and realize test-beds (DESERT) underwater simulationframework [21] based on NS2 Miracle is used to simulate theprotocols in a realistic underwater communication environ-ment
The cluster considered for the simulation consists of 50underwater sensor nodes randomly deployed over an area of
6 International Journal of Distributed Sensor Networks
Inputs119873 number of sensor nodes119879119897 time interval119909 maximum number of retransmissions for first interval 119879119897119905tr transmission delay119862ori total number of original packets in the network after duration of 119879119897119862tot total number of packets transmitted in the network after duration of 119879119897119903119888 average number of retransmissions for each packet120573 system parameter120576 threshold value (120576 gt 0)Outputs119909opt The optimal value of number of retransmissions for next interval 119879119897(1) while (true) do
Estimate the PDP at current maximum number of retransmissions 119875(119909)(2) 119903119888 =
119862tot
119862ori
(3) 120582119887 = 119903119888 times119862ori
119879119897
times(119873 minus 1)
119873
(4) 119875119904 = 119890minus2120582119887119905tr
(5) 119875119891 = 1 minus 119890minus2120582119887119905tr
(6) 119875(119909) = 1 minus (1 minus 119890minus2120582119887119905tr)
119909
Estimate the PDP at incremented and decremented value of current maximum retransmissions 119875(119909 + 1) and 119875(119909 minus 1)
(7) 119864(119884119909) =
1 minus 119875119909
119891
1 minus 119875119891
119864 (119884119909+1) =1 minus 119875119909+1
119891
1 minus 119875119891
119864 (119884119909minus1) =1 minus 119875119909minus1
119891
1 minus 119875119891
(8) 120575inc = 119864 (119884119909+1) minus 119864 (119884119909) 120575dec = 119864 (119884119909) minus 119864 (119884119909minus1)(9) 119903119909+1 = 119903119888 + 120573 times 120575inc 119903119909minus1 = 119903119888 minus 120573 times 120575dec
(10) 120582119887(119909+1) = 119903119909+1 times119862ori
119879119897
times(119873 minus 1)
119873
(11) 120582119887(119909minus1) = 119903119909minus1 times119862ori
119879119897
times(119873 minus 1)
119873
(12) 119875(119909 + 1) = 1 minus (1 minus 119890minus2120582119887(119909+1)119905tr)
119909+1
(13) 119875(119909 minus 1) = 1 minus (1 minus 119890minus2120582119887(119909minus1)119905tr)
119909minus1
Select the optimal value of maximum number of retransmissions 119909opt(14) if (119875(119909 + 1) gt 119875(119909 minus 1)) then(15) if 119875(119909 + 1) minus 119875(119909) ge 120576 then(16) 119909opt = 119909 + 1 ⊳ Increase 119909(17) else(18) 119909opt = 119909 ⊳ Remain 119909(19) end if(20) else(21) if 119875(119909 minus 1) minus 119875(119909) ge 120576 then(22) 119909opt = 119909 minus 1 ⊳ Decrease 119909(23) else(24) 119909opt = 119909 ⊳ Remain 119909(25) end if(26) end if(27) Output 119909opt(28) Re-read 119862ori 119862tot(29) end while
Algorithm 1 The adaptive selection algorithm
International Journal of Distributed Sensor Networks 7
1 2 3 4 5 60
01
02
03
04
05
06
07
08
09
1
Network load (kbps)
Pack
et d
eliv
ery
ratio
(PD
R)
CSMA-ARSCSMA CSMA
CSMA CSMAw x = 1
w x = 3
w x = 5
w x = 7
(a)
1 2 3 4 5 6
Network load (kbps)
CSMA-ARSCSMA CSMA
CSMA CSMA
0
5
10
15
20
25
30
35
40
45
Del
ay (s
)
w x = 1
w x = 3
w x = 5
w x = 7
(b)
Figure 1 CSMA effects of network load on (a) PDR and (b) average end-to-end delay
1555m times 1555m Each underwater sensor node is equippedwith a half-duplex acoustic transceiver that has a data rateof 14 kbps at a distance of 1100m It is assumed that eachunderwater sensor node periodically generates a data packetof 160 bytes and sends the data packet to the clusterheadThe speed of underwater acoustic signals is assumed to be1500ms
The back-off time is calculated as back-off-duration =
rand() times 2counter times 119904 where counter is the current number ofretransmission times (beginning from 0) of the packet and 119904is set to 01The initial value of 119909 for ARS is set to 5The valueof factor 120573 is set to 2
52 Simulation Results We analyze network performancein terms of PDR and average end-to-end delay First wediscuss the effects of network load on network performanceThe dynamic network load during the simulation is alsoconsidered to show that ARS can adaptively find an optimalvalue ofmaximumretransmissions based on varying networktraffic Then we analyze network performance over differentnumbers of data flows Finally we present the effects of theweighted factor on performance
521 Effects of Network Load In order to examine the effectsof network load the data transmission rate of the nodes variesover the simulations The transmission rate of each node isvaried from 20 bps to 120 bps which results in total networkload from 1 kbps to 6 kbps Different values for the maximumnumber of retransmissions underCSMAandAloha protocolsare tested (ie 1 3 5 and 7 are used for the maximumretransmissions)
Figure 1 compares the effects of network load on CSMAwith ARS (referred to as simply CSMA-ARS hereafter) and
CSMA As shown in Figure 1(a) CSMA-ARS can find anoptimal value of119909 adapting to the network load For examplewhen network load is low (eg 1 kbps) the achieved PDRby CSMA-ARS is similar to CSMA with a large value ofthe maximum retransmissions (eg 5 and 7) On the otherhand when network load is high (eg from 4 kbps to 6 kbps)CSMA-ARS can achieve a similar performance toCSMAwiththe maximum number of retransmissions of 1 CSMA-ARShas a slightly lower PDR than CSMA with 119909 = 1 when thenetwork load is between 4 kbps and 6 kbps This is becausethe initial value of 119909 in CSMA-ARS is 5 and it takes time toreach an optimal point
Figure 1(a) also indicates that if network load variesover time CSMA-ARS can achieve over 20 higher PDRthan CSMA with any value of 119909 by adaptively choosing anoptimal value of themaximum retransmissions over differentnetwork loads
The end-to-end delays over different network loads arecompared in Figure 1(b) As shown in Figure 1(b) CSMA-ARS shows a low delay compared to CSMAwith 119909 = 3 5 and7 In particular CSMA with 119909 = 5 and 7 shows a delay longerthan 20 seconds in some cases due to a large number of packetcollisions and backoffs CSMAwith119909 = 1 has the lowest delayby sacrificing PDR at a low network load Note that the E2Edelay reaches a peak and decreases since most packets aredropped under a very high network load and those droppedpackets are not considered when calculating the delay
ARS keeps adjusting the value of maximum number ofretransmissions 119909 such that the estimated PDP value ismaximized From Figures 1(a) and 1(b) the approach thatARS takes can actually achieve a higher PDR value with a lowE2E delay compared to the CSMA protocol
Figure 2 compares the performance of Aloha with ARSand Aloha as network load varies Similar to the simulation
8 International Journal of Distributed Sensor Networks
1 2 3 4 5 60
01
02
03
04
05
06
07
08
09
1
Network load (kbps)
Pack
et d
eliv
ery
ratio
(PD
R)
Aloha-ARSAloha Aloha
Aloha Aloha w x = 1
w x = 3
w x = 5
w x = 7
(a)
0
5
10
15
20
25
30
35
40
45
Del
ay (s
)
1 2 3 4 5 6
Network load (kbps)
Aloha-ARSAloha Aloha
Aloha Aloha w x = 1
w x = 3
w x = 5
w x = 7
(b)
Figure 2 Aloha effects of network load on (a) PDR and (b) average end-to-end delay
under CSMA as shown in Figure 2 Aloha-ARS can alwaysobtain the PDR value that is close to the maximum PDRvalue that Aloha can achieve using different 119909 values Morespecifically when network load is low (1 kbps or 2 kbps)Aloha-ARS can achieve similar PDR and E2E delay values toAloha that uses a high value of 119909 (119909 = 5 or 119909 = 7) On theother hand the achieved PDR and E2E delay values of Aloha-ARS are similar to those ofAlohawhenAloha uses a low valueof 119909 (119909 = 1) at the higher network load (5 kbps or 6 kbps)
Another interesting point is that as shown in Figures1(a) and 2(a) the PDR of Aloha decreases more sharply thanCSMAas the network load growsThis is becausemore packetcollisions can occur in Aloha under a high network loaddue to the lack of carrier sensing However Aloha-ARS andCSMA-ARS show a similar PDR over different network loadswhich indicates that ARS can lower the number of packetcollisions by adaptively changing the value of 119909
Figure 3 compares the PDR and delay between CSMA-ARS and Aloha-ARS As shown in Figure 3 when networkload is low CSMA-ARS and Aloha-ARS achieve a similarPDR which is close to one However when network load isrelatively high (around 3 kbps) CSMA-ARS shows a higherPDR since carrier sensing can reduce packet collisionsIn case network load is very high both protocols achieverelatively low PDR values due to the limited channel capacityIn addition as shown in Figure 3 Aloha-ARS always achievesa lower delay because it does not have latency for carriersensing
In order to show the detailed operation of ARS Figure 4compares 119875(119909) 119875(119909 minus 1) and 119875(119909 + 1) and the instantaneousPDR values during each round when the network load is4 kbps and it also shows howARS interacts with those valuesThe instantaneous PDR which is collected from simulationsis defined as the ratio of the number of received packets to
1 2 3 4 5 60
01
02
03
04
05
06
07
08
09
1
Pack
et d
eliv
ery
ratio
(PD
R)
Network load (kbps)
0
1
2
3
4
5
Del
ay (s
)PDR (CSMA-ARS)PDR (Aloha-ARS)
Delay (CSMA-ARS)Delay (Aloha-ARS)
Figure 3 PDR and delay between CSMA-ARS and Aloha-ARS withdifferent network load
the number of packets transmitted to the channel within oneround In Figures 4(a) and 4(b) the 119883 -axis represents theround with 119909 value determination In Figure 4(a) the 119884 -axis represents the selected value of 119909 and in Figure 4(b)it represents the estimated 119875(119909) 119875(119909 minus 1) 119875(119909 + 1) and theinstantaneous PDR
As shown in Figure 4(a) the value of 119909 is initially 5During round 1 the clusterhead compares 119875(119909)with 119875(119909minus1)and 119875(119909 + 1) based on the traffic reported by sensor nodesSince 119875(119909 minus 1) has a higher value the 119909 decreases to 1 untilround 4 This value of 119909 remains at 1 until round 6 Then
International Journal of Distributed Sensor Networks 9
0 5 10 15 20 25 30 351
2
3
4
5
Round of x determination
Sele
cted
max
imum
retr
ansm
issio
ns (x
)
(a)
0 5 10 15 20 25 30 35
Round of x determination
0
01
02
03
04
05
06
07
08
09
1
Inst
anta
neou
s PD
R an
dP
(x)
Instantaneous PDRP(x)
P(x + 1)P(x minus 1)
(b)
Figure 4 CSMA (a) adaptive maximum number of retransmissions and (b) comparison of instantaneous PDR and 119875(119909)
0 5 10 15 20 25 30 351
2
3
4
5
Round of x determination
Sele
cted
max
imum
retr
ansm
issio
ns (x
)
(a)
0 5 10 15 20 25 30 35
Round of x determination
0
01
02
03
04
05
06
07
08
09
1
P(x)P(x + 1)P(x minus 1)
Instantaneous PDR
P(x
)In
stan
tane
ous P
DR
and
(b)
Figure 5 Aloha (a) adaptive maximum number of retransmissions and (b) comparison of instantaneous PDR and 119875(119909)
at round 7 the clusterhead decides to increase the value of119909 to 2 since 119875(119909 + 1) is higher than 119875(119909) and keeps thisvalue during the rest of the simulation The value 119909 = 2
is considered as an optimal value of 119909 at a network load of4 kbps Figure 4(b) also shows that the estimated 119875(119909) (iePDP) can closely approximate the instantaneous PDR as thenetwork load becomes stable after round 7 (ie the network
load is relatively unstable until round 7 due to the rapidchange of 119909)
Figure 5 indicates the detailed operation of Aloha-ARSwhen the network load is 4 kbps Initially the value of 119909 is5 Similar to the CSMA-ARS scenario 119909 decreases to 1 untilround 4 There is a fluctuation in 119909 from round 5 to round8 due to the unstable network traffic as the 119909 value changes
10 International Journal of Distributed Sensor Networks
0 096 14 17 19 245
times105
0
01
02
03
04
05
06
07
08
09
1
Simulation time (s)
Inst
anta
neou
s pac
ket d
eliv
ery
ratio
CSMA-ARSCSMA CSMA
CSMA CSMA w x = 1
w x = 3
w x = 5
w x = 7
(a)
0
01
02
03
04
05
06
07
08
09
1
Inst
anta
neou
s pac
ket d
eliv
ery
ratio
0 096 14 17 19 245
times105Simulation time (s)
Aloha-ARSAloha Aloha
Aloha Aloha w x = 1
w x = 3
w x = 5
w x = 7
(b)
Figure 6 Instantaneous PDR when varying the network load over time (a) under CSMA and (b) under Aloha
The value of 119909 remains at 2 from round 9 to the end ofthe simulation since the clusterhead determines the optimalvalue of 119909 is 2 Figure 5(b) also shows that the estimated 119875(119909)(ie PDP) can closely approximate the instantaneous PDR
522 Varying Network Load Over Time In some sensornetwork applications sensors may increase the sensor datatransmission rate when specific events occur or some con-ditions are satisfied (eg a specific level of vibration ortemperature)
In order to see howARS can adapt to a change in networkload over time every node varies its packet generation rateover a simulation time of 245000 seconds More specificallyfrom the beginning each node has a rate of 20 bps for 96000seconds which results in a network load of 1 kbps Thenthe generation rate of each node increases to 40 bps in thenext round time period of 44000 seconds (the network loadbecomes 2 kbps) For the next 30000 seconds the rate ofeach node becomes 80 bps and then it becomes 120 bps (thenetwork load is 6 kbps) for the next 20000 seconds Theneach node decreases its traffic rate to 20 bps for the rest of thesimulation
Figures 6(a) and 6(b) compare the instantaneous PDR(or ldquoinst PDRrdquo for short) of CSMA-ARS and Aloha-ARSwith those of CSMA and Aloha with different values for themaximum number of retransmissions
From Figure 6(a) we can see that CSMA-ARS adapts wellto the change in network load and achieves the highest ornear the highest inst PDR over the entire simulation timeWhen the network load is low ARS selects a high 119909 value formaximum retransmissions to obtain a high PDR value Forexample in the interval from 0 to 96000 seconds CSMA-ARS shows a PDR (around 099) similar to CSMAwith 119909 = 5
and 119909 = 7 On the other hand when the network load is highARS selects a low 119909 value for maximum retransmissions toavoid excessive collisions For instance CSMA-ARS obtainsan inst PDR (around 05 and 038) similar to CSMA with119909 = 1 from 140000 to 190000 seconds when network load isvery high
In contrast the original CSMA protocol cannot adaptto the network load changes and shows poor performancedepending on network load For example CSMA with 119909 =
5 shows a PDR value of around 099 in the time periodbetween 0 and 96000 seconds However it obtains a PDRvalue lower than 02 between 170000 and 190000 secondswhereas CSMA-ARS achieves a PDR value of around 038 inthe period Similarly CSMA with 119909 = 1 only obtains a PDRof less than 085 on average when network load is low (from0 to 96000 seconds) whereas CSMA-ARS can achieve a PDRof around 099
The results are also similar when Aloha-ARS is com-pared with Aloha that uses different 119909 values as shown inFigure 6(b) Aloha-ARS can adaptively determine an optimalvalue of 119909 based on changing network load over the simula-tion time so it can also achieve the highest or near the highestinst PDR value
In fact ARS shows a higher advantage in this case sinceAloha is more sensitive to the network load For exampleAloha with 119909 = 5 only obtains a PDR value lower than 01when the network load is high (from 170000 and 190000seconds) whereas it achieves a PDR value of around 099when the network load is low In contrast Aloha-ARS shows aconsistently high PDR value compared to the original AlohaIt can also be seen that Aloha-ARS has similar PDR values toCSMA-ARS in most time periods
Figure 7 compares the average PDR and end-to-end delayof CSMA-ARS and Aloha-ARS with those of CSMA and
International Journal of Distributed Sensor Networks 11
18
16
14
12
10
8
6
4
2
0ARS X = 1 X = 3 X = 5 X = 7
PDR
08
07
06
05
04
03
02
01
09
0
Aver
age P
DR
E2E delay
E2E
delay
(s)
XProtocol CSMA-ARS and CSMA w given
(a)
PDRE2E delay
9
8
7
6
5
4
3
2
1
0ARS X = 1 X = 3 X = 5 X = 7
XProtocol Aloha-ARS and Aloha w given
08
07
06
05
04
03
02
01
09
0
Aver
age P
DR
E2E
delay
(s)
(b)
Figure 7 Average PDR when varying the network load over time (a) under CSMA and (b) under Aloha
Aloha respectively In Figure 7 the left 119884-axis represents theaverage PDR and the right 119884-axis represents the E2E delayAs shown in Figures 7(a) and 7(b) the average PDR valuesof ARS-based protocols are higher than those of the originalprotocols that have different values for themaximumnumberof retransmissions For example CSMA-ARS achieves anaverage PDR of 074 whereas the greatest value for CSMArsquosaverage PDR is lower than 066 Asan another example Alohawith 119909 = 1 3 5 can only obtain an average PDR of about 060whereas Aloha-ARS achieves an average PDR of 068
Figure 7 also indicates that the E2E delay values of ARS-based protocols are lower than those of CSMA and Alohawith 119909 = 3 5 7 Note that CSMA and Aloha with 119909 =
1 achieve the lowest E2E delay by sacrificing average PDR(ie their average PDR is 10 lower than those of ARS-based protocols) The simulation results in Figure 7 indicatethat ARS-based protocols can achieve a higher average PDRthan original contention-based protocols with an acceptablepacket delay
523 Effects of the Number of Data Flows In this subsectionthe effects of the number of data flows on network perfor-mance are examined The number of data flows varies from10 to 50 whereas the node load remains at 80 bps CSMA andAloha are tested with different 119909 values from 1 to 7
As shown in Figures 8 and 9 CSMA-ARS and Aloha-ARS achieve the highest PDR values in most cases withouta significant E2E delay by adaptively selecting an 119909 valueappropriate to the network status For example if CSMAwith119909 = 1 is used for the network and the number of data flowsis 20 CSMA can only obtain a PDR around 083 whereasCSMA-ARS can achieve a PDR higher than 098 Similarlyif CSMA with 119909 = 5 is used and the number of data flows
becomes 40 CSMA-ARS achieves a 23 higher PDR and anaverage E2E delay nine times shorter than CSMA
The results shown in Figure 9 also indicate that a higherPDR gain can be obtained when the ARS scheme is applied toAlohaTherefore we can say that CSMA-ARS andAloha-ARScan find an optimal value of the maximum retransmissionsover different numbers of flows which results in higherperformance than the original CSMA and Aloha
In Figure 10 the performances of CSMA-ARS andAloha-ARS are compared when the number of data flows changesAs shown in Figure 10 both protocols show a similar PDRWhen the number of flows is 30 CSMA-ARS obtains aslightly higher PDR With respect to E2E delay CSMA-ARSalways shows a longer delay due to carrier sensing before datatransmission
524 Effects of theWeighted Factor120573 In Section 43 a systemparameter 120573 is used when the values of 119903119909+1 and 119903119909minus1 areestimated in (9) Recall that 119903119909+1 and 119903119909minus1 represent theaverage retransmissions whenmaximum retransmissions are119909 + 1 and 119909 minus 1 respectively
Since the value of 120573 affects the accuracy of the 119903119909+1 and119903119909minus1 value estimations in this subsection we examine hownetwork performance will change based on different valuesof 120573
As shown in Figure 11 the value of 120573 varies from 10 to25 CSMA-ARS with various values of 120573 is also compared toCSMA with 119909 = 5 in terms of PDR and E2E delay
We can see that network performance can be improvedby selecting an appropriate value for 120573 For example CSMA-ARS with 120573 = 10 obtains a PDR value of around 055 whenthe network load is 3 kbps However when the value of 120573is 20 a PDR value of 068 can be obtained As also shown
12 International Journal of Distributed Sensor Networks
CSMA-ARSCSMA CSMA
CSMA CSMAw x = 1
w x = 3
w x = 5
w x = 7
2010 30 40 500
01
02
03
04
05
06
07
08
09
1Pa
cket
del
iver
y ra
tio (P
DR)
Number of data flows
(a)
CSMA-ARSCSMA CSMA
CSMA CSMAw x = 1
w x = 3
w x = 5
w x = 7
10 20 30 40 500
10
20
30
40
50
60
70
Del
ay (s
)
Number of data flows
(b)
Figure 8 CSMA effects of the number of data flows on (a) PDR and (b) average end-to-end delay
10 20 30 40 500
01
02
03
04
05
06
07
08
09
1
Pack
et d
eliv
ery
ratio
(PD
R)
Number of data flows
Aloha-ARSAloha Aloha
Aloha Aloha w x = 1
w x = 3
w x = 5
w x = 7
(a)
10 20 30 40 500
10
20
30
40
50
60
70
Del
ay (s
)
Number of data flows
Aloha-ARSAloha Aloha
Aloha Aloha w x = 1
w x = 3
w x = 5
w x = 7
(b)
Figure 9 Aloha effects of the number of data flows on (a) PDR and (b) average end-to-end delay
in Figure 11(a) there is no significant gain in PDR when thevalue of 120573 is greater than 20 Therefore 120573 = 20 is used forsimulations in this paper The value of 120573 does not show aremarkable impact on the delay as shown in Figure 11(b) Wecan see that the performance of CSMA with 119909 = 5 is muchlower than CSMA-ARS with all values of 120573 particularly athigh network loads
6 Conclusions and Future Work
In order to address the problems of a low packet deliveryratio and high end-to-end delay under contention-basedMAC protocols in UASNs we have proposed a novel adap-tive retransmission scheme named ARS which dynami-cally selects an optimal value of the maximum number ofretransmissions such that the successful delivery probability
International Journal of Distributed Sensor Networks 13
10 20 30 40 500
01
02
03
04
05
06
07
08
09
1
Pack
et d
eliv
ery
ratio
(PD
R)
0
1
2
3
4
5
Del
ay (s
)
PDR (CSMA-ARS)PDR (Aloha-ARS)
Delay (CSMA-ARS)Delay (Aloha-ARS)
Number of data flows
Figure 10 PDR and delay between CSMA-ARS and Aloha-ARS with the different flows
CSMA-ARS w 120573 = 10
CSMA-ARS w 120573 = 15
CSMA-ARS w 120573 = 20
CSMA-ARS w 120573 = 25
CSMA w x = 5
1 2 3 4 5 60
01
02
03
04
05
06
07
08
09
1
Network load (kbps)
Pack
et d
eliv
ery
ratio
(PD
R)
(a)
CSMA-ARS w 120573 = 10
CSMA-ARS w 120573 = 15
CSMA-ARS w 120573 = 20
CSMA-ARS w 120573 = 25
CSMA w x = 5
1 2 3 4 5 6
Network load (kbps)
0
5
10
15
20
25
30
35
Del
ay (s
)
(b)
Figure 11 CSMA Effects of factor 120573 on (a) PDR and (b) average end-to-end delay
of a packet is maximized for a given network load ARSperiodically compares the current PDP against estimatedPDPs with incremented and decremented values for themaximum number of retransmissions Then ARS selectsa new value for the maximum retransmissions to achievea higher PDP value In this paper we have applied ARSto Aloha and CSMA in order to evaluate the performancegain According to simulation results ARS can significantlyimprove network performance in terms of PDR and E2Edelay
For future work we plan to extend ARS to supportdifferent performance requirements in UASNs such that
each node can adapt its transmissions to satisfy a specificperformance requirement from applications or users
Conflict of Interests
The authors declare that there is no conflict of interestsregarding the publication of this paper
Acknowledgment
This work was supported by the 2013 Research Fund ofUniversity of Ulsan
14 International Journal of Distributed Sensor Networks
References
[1] I F Akyildiz D Pompili and TMelodia ldquoUnderwater acousticsensor networks research challengesrdquo Ad Hoc Networks vol 3no 3 pp 257ndash279 2005
[2] J Heidemann W Ye J Wills A Syed and Y Li ldquoResearchchallenges and applications for underwater sensor networkingrdquoin Proceedings of the IEEE Wireless Communications ans Net-working Conference (WCNC rsquo06) pp 228ndash235 Las Vegas NevUSA April 2006
[3] J HeidemannM Stojanovic andMZorzi ldquoUnderwater sensornetworks applications advances and challengesrdquo PhilosophicalTransactions of the Royal Society A vol 370 no 1958 pp 158ndash175 2012
[4] J G Proakis EM Sozer J A Rice andM Stojanovic ldquoShallowwater acoustic networksrdquo IEEE Communications Magazine vol39 no 11 pp 114ndash119 2001
[5] N Chirdchoo W-S Soh and K C Chua ldquoAloha-based MACprotocols with collision avoidance for underwater acoustic net-worksrdquo in Proceedings of the 26th IEEE International Conferenceon Computer Communications (INFOCOM rsquo07) pp 2271ndash2275Anchorage Alaska USA May 2007
[6] J Ahn A Syed B Krishnamachari and J Heidemann ldquoDesignand analysis of a propagation delay tolerant ALOHA protocolfor underwater networksrdquo Ad Hoc Networks vol 9 no 5 pp752ndash766 2011
[7] P Mandal S De and S S Chakraborty ldquoA receiver synchro-nized slotted Aloha for underwater wireless networks withimprecise propagation delay informationrdquo Ad Hoc Networksvol 11 no 4 pp 1443ndash1455 2013
[8] L Vieira J Kong U Lee and M Gerla ldquoAnalysis of alohaprotocols for underwater acoustic sensor networksrdquo in Proceed-ings of the 1st International Workshop on Underwater Networks(WUWNet rsquo06) Los Angeles Calif USA September 2006
[9] S M Smith J C Park and A Neel ldquoA peer-to-peer commu-nication protocol for underwater acoustic communicationrdquo inProceedings of the MTSIEEE Conference (OCEANS rsquo97) pp268ndash272 IEEE Halifax Canada October 1997
[10] M Molins and M Stojanovic ldquoSlotted FAMA a MAC pro-tocol for underwater acoustic networksrdquo in Proceedings of theOCEANS 2006mdashAsia Pacific pp 1ndash7 Singapore May 2007
[11] D Fang Y Li H Huang and L Yin ldquoA CSMACA-basedMACprotocol for underwater acoustic networksrdquo in Proceedings ofthe 6th International Conference on Wireless CommunicationsNetworking and Mobile Computing (WiCOM rsquo10) pp 1ndash4Chengdu China September 2010
[12] D Wang X Hu F Xu H Chen and Y Wu ldquoPerformanceanalysis of P-CSMA for underwater acoustic sensor networksrdquoin Proceedings of the OCEANS pp 1ndash6 Yeosu Republic ofKorea May 2012
[13] L Jin and D Huang ldquoA slotted CSMA based reinforcementlearning approach for extending the lifetime of underwateracoustic wireless sensor networksrdquo Computer Communicationsvol 36 no 9 pp 1094ndash1099 2013
[14] C Petrioli R Petroccia and M Stojanovic ldquoA comparativeperformance evaluation of MAC protocols for underwatersensor networksrdquo in Proceedings of the OCEANS 2008 pp 1ndash10Quebec City Canada September 2008
[15] X Guo M R Frater and M J Ryan ldquoA propagation-delay-tolerant collision avoidance protocol for underwater acousticsensor networksrdquo in Proceedings of the Asia Pacific (OCEANSrsquo06) pp 1ndash6 Singapore May 2007
[16] B Peleato and M Stojanovic ldquoDistance aware collision avoid-ance protocol for ad-hoc underwater acoustic sensor networksrdquoIEEECommunications Letters vol 11 no 12 pp 1025ndash1027 2007
[17] A A Syed W Ye and J Heidemann ldquoT-Lohi a new class ofMAC protocols for underwater acoustic sensor networksrdquo inProceedings of the 27th IEEE Communications Society Confer-ence on Computer Communications (INFOCOM rsquo08) pp 789ndash797 Phoenix Ariz USA April 2008
[18] N Chirdchoo W-S Soh and K C Chua ldquoRIPT a receiver-initiated reservation-based protocol for underwater acousticnetworksrdquo IEEE Journal on Selected Areas in Communicationsvol 26 no 9 pp 1744ndash1753 2008
[19] N Chirdchoo W-S Soh and K C Chua ldquoMACA-MN aMACA-basedMAC protocol for underwater acoustic networkswith packet train for multiple neighborsrdquo in Proceedings of theIEEE 67th Vehicular Technology Conference-Spring (VTC rsquo08)pp 46ndash50 May 2008
[20] Y Zhu Z Jiang Z Peng M Zuba J-H Cui and H ChenldquoToward practical MAC design for underwater acoustic net-worksrdquo in Proceedings of the 32nd IEEE Conference on ComputerCommunications (INFOCOM rsquo13) pp 683ndash691 IEEE TurinItalia April 2013
[21] R Masiero S Azad F Favaro et al ldquoDESERT Underwateran NS-Miracle-based framework to design simulate emulateand realize test-beds for underwater network protocolsrdquo in Pro-ceedings of the MTSIEEE Yeosu Conference The Living Oceanand CoastmdashDiversity of Resources and Sustainable Activities(OCEANS rsquo12) pp 1ndash10 May 2012
[22] C-S Hsu and X-Z Hong ldquoAn efficient scheduling and randomaccess hybrid medium access control protocol for underwatersensor networksrdquo inProceedings of the 15th International Sympo-siumonWireless PersonalMultimedia Communications (WPMCrsquo12) pp 207ndash211 Taipei Taiwan September 2012
[23] D Pompili T Melodia and I F Akyildiz ldquoA CDMA-basedmedium access control for underwater acoustic sensor net-worksrdquo IEEE Transactions on Wireless Communications vol 8no 4 pp 1899ndash1909 2009
[24] J S Meditch and C T A Lea ldquoStability and optimizationof the csma and csmacd channelsrdquo IEEE Transactions onCommunications vol 31 no 6 pp 763ndash774 1983
[25] M Z Ali and M Torlak ldquoRetransmission optimization inCDMA random access networksrdquo in Proceedings of the MilitaryCommunications Conference (MILCOM rsquo02) pp 799ndash803 Ana-heim Calif USA October 2002
[26] R S Sudhaakar S Yoon J Zhao and C Qiao ldquoA novel QoS-aware MAC scheme using optimal retransmission for wirelessnetworksrdquo IEEE Transactions on Wireless Communications vol8 no 5 pp 2230ndash2235 2009
[27] S Yoon C Qiao R S Sudhaakar J Li and T Talty ldquoQoMORa QoS-aware MAC protocol using optimal retransmission forwireless intra-vehicular sensor networksrdquo in Proceedings of theMobile Networking for Vehicular Environments (MOVE rsquo07) pp121ndash126 IEEE Anchorage Alaska USA May 2007
[28] I F Akyildiz D Pompili and T Melodia ldquoState of the art inprotocol research for underwater acoustic sensor networksrdquoACM SIGMOBILE Mobile Computing and CommunicationsReview vol 11 no 4 pp 11ndash22 2007
[29] M C Domingo and R Prior ldquoA distributed clustering schemefor underwater wireless sensor networksrdquo in Proceedings ofthe 18th Annual IEEE International Symposium on PersonalIndoor andMobile Radio Communications (PIMRC rsquo07) pp 1ndash5Athens Ga USA September 2007
International Journal of Distributed Sensor Networks 15
[30] S Saxena S Mishra and M Singh ldquoClustering based onnode density in heterogeneous under-water sensor networkrdquoInternational Journal of Information Technology and ComputerScience vol 5 no 7 pp 49ndash55 2013
[31] J Jagannath A Saji H Kulhandjian Y Sun E Demirors andT Melodia ldquoA hybrid MAC protocol with channel-dependentoptimized scheduling for clustered underwater acoustic sensornetworksrdquo in Proceedings of the 8th ACM International Con-ference on Underwater Networks and Systems (WUWNet rsquo13)Kaohsiung Taiwan November 2013
[32] H Skalli S Ghosh S K Das L Lenzini and M ContildquoChannel assignment strategies for multiradio wireless meshnetworks issues and solutionsrdquo IEEE Communications Maga-zine vol 45 no 11 pp 86ndash95 2007
[33] A Naveed and S S Kanhere ldquoCluster-based channel assign-ment in multi-radio multi-channel wireless mesh networksrdquoin Proceedings of the IEEE 34th Conference on Local ComputerNetworks (LCN rsquo09) pp 53ndash60 Zurich Switzerland October2009
[34] K N Ramachandran E M Belding K C Almeroth andM M Buddhikot ldquoInterference-aware channel assignment inmulti-radio wireless mesh networksrdquo in Proceedings of the 25thIEEE International Conference on Computer Communications(INFOCOM rsquo06) pp 1ndash12 Barcelona Spain April 2006
[35] A Papoulis and S U Pillai ldquoRandom walks and other applica-tionsrdquo inProbability RandomVariables and Stochastic Processeschapter 10 p 456 McGraw-Hill 4th edition 2002
International Journal of
AerospaceEngineeringHindawi Publishing Corporationhttpwwwhindawicom Volume 2014
RoboticsJournal of
Hindawi Publishing Corporationhttpwwwhindawicom Volume 2014
Hindawi Publishing Corporationhttpwwwhindawicom Volume 2014
Active and Passive Electronic Components
Control Scienceand Engineering
Journal of
Hindawi Publishing Corporationhttpwwwhindawicom Volume 2014
International Journal of
RotatingMachinery
Hindawi Publishing Corporationhttpwwwhindawicom Volume 2014
Hindawi Publishing Corporation httpwwwhindawicom
Journal ofEngineeringVolume 2014
Submit your manuscripts athttpwwwhindawicom
VLSI Design
Hindawi Publishing Corporationhttpwwwhindawicom Volume 2014
Hindawi Publishing Corporationhttpwwwhindawicom Volume 2014
Shock and Vibration
Hindawi Publishing Corporationhttpwwwhindawicom Volume 2014
Civil EngineeringAdvances in
Acoustics and VibrationAdvances in
Hindawi Publishing Corporationhttpwwwhindawicom Volume 2014
Hindawi Publishing Corporationhttpwwwhindawicom Volume 2014
Electrical and Computer Engineering
Journal of
Advances inOptoElectronics
Hindawi Publishing Corporation httpwwwhindawicom
Volume 2014
The Scientific World JournalHindawi Publishing Corporation httpwwwhindawicom Volume 2014
SensorsJournal of
Hindawi Publishing Corporationhttpwwwhindawicom Volume 2014
Modelling amp Simulation in EngineeringHindawi Publishing Corporation httpwwwhindawicom Volume 2014
Hindawi Publishing Corporationhttpwwwhindawicom Volume 2014
Chemical EngineeringInternational Journal of Antennas and
Propagation
International Journal of
Hindawi Publishing Corporationhttpwwwhindawicom Volume 2014
Hindawi Publishing Corporationhttpwwwhindawicom Volume 2014
Navigation and Observation
International Journal of
Hindawi Publishing Corporationhttpwwwhindawicom Volume 2014
DistributedSensor Networks
International Journal of
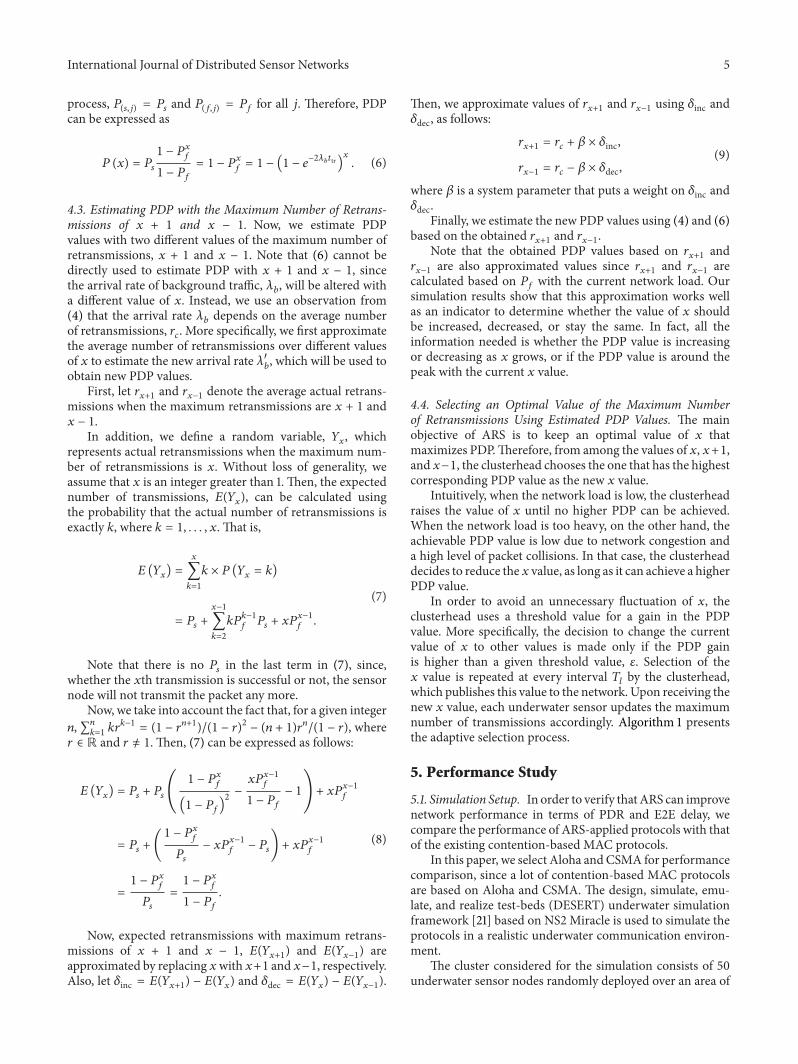
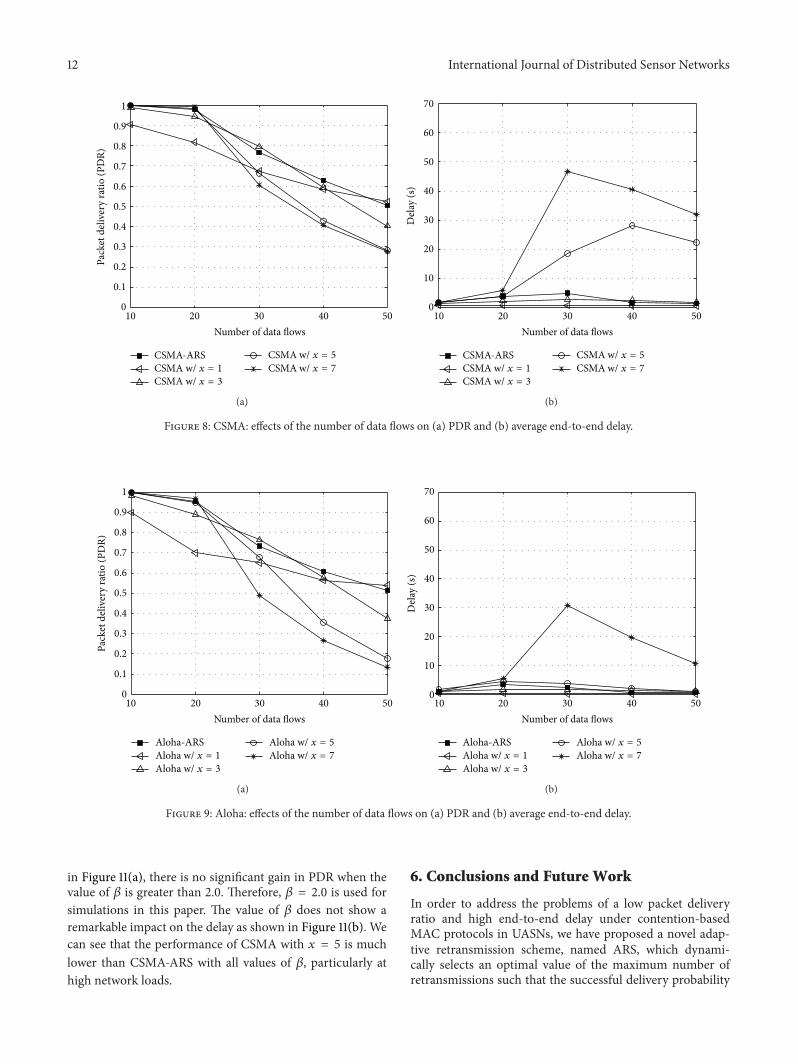

International Journal of
AerospaceEngineeringHindawi Publishing Corporationhttpwwwhindawicom Volume 2014
RoboticsJournal of
Hindawi Publishing Corporationhttpwwwhindawicom Volume 2014
Hindawi Publishing Corporationhttpwwwhindawicom Volume 2014
Active and Passive Electronic Components
Control Scienceand Engineering
Journal of
Hindawi Publishing Corporationhttpwwwhindawicom Volume 2014
International Journal of
RotatingMachinery
Hindawi Publishing Corporationhttpwwwhindawicom Volume 2014
Hindawi Publishing Corporation httpwwwhindawicom
Journal ofEngineeringVolume 2014
Submit your manuscripts athttpwwwhindawicom
VLSI Design
Hindawi Publishing Corporationhttpwwwhindawicom Volume 2014
Hindawi Publishing Corporationhttpwwwhindawicom Volume 2014
Shock and Vibration
Hindawi Publishing Corporationhttpwwwhindawicom Volume 2014
Civil EngineeringAdvances in
Acoustics and VibrationAdvances in
Hindawi Publishing Corporationhttpwwwhindawicom Volume 2014
Hindawi Publishing Corporationhttpwwwhindawicom Volume 2014
Electrical and Computer Engineering
Journal of
Advances inOptoElectronics
Hindawi Publishing Corporation httpwwwhindawicom
Volume 2014
The Scientific World JournalHindawi Publishing Corporation httpwwwhindawicom Volume 2014
SensorsJournal of
Hindawi Publishing Corporationhttpwwwhindawicom Volume 2014
Modelling amp Simulation in EngineeringHindawi Publishing Corporation httpwwwhindawicom Volume 2014
Hindawi Publishing Corporationhttpwwwhindawicom Volume 2014
Chemical EngineeringInternational Journal of Antennas and
Propagation
International Journal of
Hindawi Publishing Corporationhttpwwwhindawicom Volume 2014
Hindawi Publishing Corporationhttpwwwhindawicom Volume 2014
Navigation and Observation
International Journal of
Hindawi Publishing Corporationhttpwwwhindawicom Volume 2014
DistributedSensor Networks
International Journal of