research article benefits and limitations of lab-on-a-chip
TRANSCRIPT

Research ArticleBenefits and Limitations of Lab-on-a-Chip Method overReversed-Phase High-Performance Liquid ChromatographyMethod in Gluten Proteins Evaluation
Dragan CivanIev,1 Daniela Horvat,2 Aleksandra Torbica,1 Miona BeloviT,1
Gordana ŠimiT,2 Damir MagdiT,3 and Nevena YukiT4
1 Institute of Food Technology, University of Novi Sad, Bulevar Cara Lazara 1, 21000 Novi Sad, Serbia2Agricultural Institute Osijek, Juzno Predgrađe 17, 31000 Osijek, Croatia3Faculty of Food Technology, J.J. Strossmayer University of Osijek, Franje Kuhaca 18, 31000 Osijek, Croatia4Faculty of Natural Science, University of Kragujevac, Radoja Domanovica 12, 34000 Kragujevac, Serbia
Correspondence should be addressed to Aleksandra Torbica; [email protected]
Received 28 November 2014; Revised 28 January 2015; Accepted 5 February 2015
Academic Editor: Marcone A. L. de Oliveira
Copyright © 2015 Dragan Zivancev et al. This is an open access article distributed under the Creative Commons AttributionLicense, which permits unrestricted use, distribution, and reproduction in any medium, provided the original work is properlycited.
RP-HPLC (reversed-phase high-performance liquid chromatography) is widely used to determine the amounts of the differentgluten protein types. However, this method is time-consuming, especially at early stages of wheat breeding, when large numberof samples needs to be analyzed. On the other hand, LoaC (Lab-on-a-Chip) technique has the potential for a fast, reliable, andautomatable analysis of proteins. In the present study, benefits and limitations of Lab-on-a-Chip method over RP-HPLCmethod ingluten proteins evaluation were explored in order to determine in which way LoaC method should be improved in order to makeits results more compliant with the results of RP-HPLC method. Strong correlation (𝑃 ≤ 0.001) was found between numbers ofHMW glutenin peaks determined by LoaC and RP-HPLC methods. Significant correlations (𝑃 ≤ 0.05) were obtained betweenpercentages of HMW and LMW glutenin subunits calculated with regard to total HMW + LMW area. Even more significantcorrelation (𝑃 ≤ 0.001) was found when percentages of individual HMW areas were calculated with regard to total HMW. RP-HPLC method showed superiority in determination of gliadins since larger number and better resolution of gliadin peaks wereobtained by this method.
1. Introduction
In the past decade,much attention has been focused on devel-oping microfluid or Lab-on-a-Chip (LoaC) technique andits application for sensitive biochemical analyses.This systemhas the potential for a fast, reliable, and automatable analysisin the field of proteins’ separation and quantification [1,2]. Complete analysis of 10 protein samples (number ofsamples analysed per one chip), including sizing and quan-tification, lasts for 25min, including the start-up phase ofthe instrument [3]. The LoaC method for protein analysisallows the integration of electrophoretic separation, staining,destaining, and fluorescence detection into a single processcombined with data analysis. Also, current LoaC method
showed quite comparable results with the conventionalsodium dodecyl sulfate polyacrylamide gel electrophoresis(SDS-PAGE) in determination of proteins: the linear dynamicrange or resolution is superior in case of LoaC [3], whereasin a study of Torbica et al. [4] LoaC showed superiority overSDS-PAGE in selectivity and sensitivity when Kunitz trypsininhibitor in soybean was analysed. Today, various LoaCinstruments are available and they are often used for determi-nation of gluten proteins [5–10], which are the most respon-sible for the viscoelastic properties of dough and bakingquality of wheat (Triticum aestivum L.) [11].
In the late 90s of the last century, Wieser et al. [12] devel-oped a combined extraction-RP-HPLC procedure for deter-mination of the amounts of the different gluten protein types
Hindawi Publishing CorporationJournal of ChemistryVolume 2015, Article ID 430328, 9 pageshttp://dx.doi.org/10.1155/2015/430328

2 Journal of Chemistry
(𝜔-, 𝛼-, and 𝛾-gliadins; high molecular weight (HMW); andlow molecular weight (LMW) glutenin subunits) in wheatflour. Wieser et al. [13, 14] used the procedure to examine theimpact of nitrogen fertilisation on their amounts and ratiosin wheat and how they are connected with wheat quality.RP-HPLC technique is quite time-consuming for separationof gluten proteins since analysis time is between 30 and80min per sample, whereas the number of samples that canbe analyzed daily per instrument is less than 30. A cost-effective method is required in order to meet the demandsof increasing number of samples that need to be analyzed atearly stages of breeding.
The aim of this study was to determine in which wayLoaCmethod should be improved in order tomake its resultsmore compliant with the results of RP-HPLC method. Thisis of high importance since LoaC method is superior inperformance speed but lacks merits of conventional, widelyapplied methods, and therefore their characteristics shouldbe integrated with LoaC method. Consequently, samplepreparation was not unified for these two methods.
2. Materials and Methods
2.1. Materials. Examinations have been carried out on ninecommon wheat (Triticum aestivum L.) cultivars (“Divana,”“Aida,” “Felix,” “Seka,” “Renata,” “Soissons,” “Olimpija,”“Vulkan,” and “Tihana”) grown in Croatia at the AgriculturalInstitute in Osijek and nine common wheat cultivars(“Dragana,” “Ljiljana,” “Pobeda,” “Bastijana,” “Nevesinjska,”“Simonida,” “Etida,” “Zvezdana,” and “NS3-5299/2”) grownin Serbia at the Institute of Field and Vegetable Crops in NoviSad in harvest season 2009.
2.2. Milling. Wheat samples were milled by MLU-202(Buhler, Uzwil, Switzerland) and the obtained flour was usedfor further analysis.
2.3. Extraction for LoaC. The percentage of gliadin andglutenin subunits was determined from 30mg of flour afterremoval of albumins and globulins. The gliadins were subse-quently extracted with 300𝜇L of 70% ethanol and 200𝜇L wastransferred into test tube (1.5mL), whereas the rest of thesolution was removed for glutenin extraction. After evapora-tion of ethanol, gliadins were treated with 350 𝜇L of 2% SDSsolution containing 5% 𝛽-mercaptoethanol and afterwardsheated for 5 minutes to 100∘C. For extraction of full range ofthe glutenin subunits the same volume of treatment solution(2% SDS solution containing 5% 𝛽-mercaptoethanol and0.0625M Tris-base) and temperature conditions was used.
2.4. LoaC. Final solutions of glutenins were prepared bymixing of 4 𝜇L of the clarified sample extract with 2𝜇L ofAgilent sample buffer and 84 𝜇L of deionized water. Sepa-ration of proteins was performed using chip electrophoresistechnique onAgilent 2100Bioanalyzer (Agilent Technologies,Santa Clara, CA) with Protein 230 Plus Lab-on-a-Chip kit,which determined molecular weights of proteins in rangefrom 12.5 to 230 kDa (Figure 1). After analysis, every subunit
LMW-GS
HMW-GS
−50
0
50
100
150
200
250
300
350
(FU
)
4.5 15 28 46 63 95 150 240
(kDa)
1.8
4.5
240.0
7.6
10.4
Figure 1: Electrophoregram of glutenins of cultivar “Renata.”
was manually integrated and their percentage was calculatedfrom the time-corrected area.
2.5. Extraction for RP-HPLC. The wheat proteins extractionfrom wholemeal flour (Retsch, Type ZM1 mill equipped witha 1mm sieve) as well as the reversed-phase high-performanceliquid chromatography (RP-HPLC) method was based onWieser et al. [12] with slight modifications.
2.6. RP-HPLC. Perkin Elmer LC 200 chromatograph wasused with a Supelco Discovery BIO Wide Pore C18 column(300 A pore size, 5 𝜇m particle size, and 4.6 × 250mmi.d.). Solvent was composed of water containing 0.1% (v/v)trifluoroacetic acid (TFA) and acetonitrile (ACN), while20𝜇L of sample was injected for analyses. Glutenin fractionswere eluted with a linear gradient from 24% to 58%ACNover30min at 1mL/min, using a column temperature of 50∘C. Allsamples were detected by UV absorbance at 210 nm in tworeplicates. The obtained chromatograms were analyzed byTotal-Chrome software package (Perkin Elmer Instruments,USA). The peak areas (expressed in arbitrary units = AU)under gliadins and glutenin chromatograms are used forfurther calculations.
2.7. Statistical Analysis. The data were statistically analyzedby STATISTICA 12.0 software (StatSoft Inc., USA, 2013).Descriptive statistics was used to explore the molecularweights and percentage amounts of gluten proteins andfor that purpose mean values and coefficients of variation(CV) were calculated. Pearson correlation coefficients werecalculated in order to explore correlations between differentparameters determined by LoaC and RP-HPLC methods aswell as to determine the degree of linearitywithin theworkingrange of standards used in LoaC method.
3. Results and Discussion
3.1. Application of LoaC Method. The molecular weightreproducibility of HMW-GS (highmolecular weight gluteninsubunits) determined by LoaC method was evaluated byexamining two replicates of each sample. Coefficient of vari-ation (CV) was calculated as a relative measure of error sinceit weights the standard deviation for the size of mean. The

Journal of Chemistry 3
Table 1: Apparent sizes and quantification of individual HMW-GS subunits for all examined bread wheat cultivars by LoaC method andquantification of individual HMW-GS subunits by RP-HPLC.
Subunits Molecular weight (kDa) Relative amount (%)a Relative amount (%)b
Mean CV (%) Mean CV (%) Mean CV (%)2 & 5 230.9 0.55 5.32 6.25 — —2 230.9 1.00 3.51 37.74 10.29 7.035 229.6 2.10 3.34 41.91 10.71 18.845 & 2 & 9 — — — — 14.43 1.715 & 9 — — — — 10.16 1.062∗ 212.6 3.08 1.93 64.82 1.47 25.431 212.2 1.11 1.21 32.43 1.75 49.857 178.0 2.41 3.92 59.37 9.32 15.3817 + 18 (2)c 160.6 2.03 0.99 27.98 — —10 144.4 2.24 2.71 47.14 2.99 37.078 134.8 1.36 0.50 44.77 2.16 26.319 131.7 1.60 2.47 51.37 3.99 27.3212 130.0 0.00 0.79 16.75 3.86 26.2512 & 9 128.0 0.52 5.51 27.80 — —17 + 18 (1)c 124.8 2.83 1.67 14.66 — —17 — — — — 10.80 1.7718 — — — — 4.67 4.53aExpressed as relative amount: percentage of individual HMW area to total LMW + HMW area.bExpressed as relative amount: percentage of individual HMW area to total LMW + HMW area.cSubunits 17 and 18 were clearly distinguished by LoaC method, whereas by SDS-PAGE method these two subunits were overlapped (Marchetti-Deschmannet al., 2011) [8]. Therefore it was not possible to determine molecular weight of each separate subunit by LoaC method and they will be labelled as 17 + 18 (1)and 17 + 18 (2).
apparent sizes of glutenin subunits 2 & 5, 2, 5, 2∗, 1, 7, 17 + 18,10, 8, 9, 12, and 12& 9 and their relative amounts are presentedin Table 1. In general, the apparent sizes determined by LoaCmethodwere at the same level as those obtained byMarchetti-Deschmann et al. [8] using Protein 230 Plus Lab-on-a-Chipkit for glutenin subunits 2 & 5, 2, 5, 7, and 10, whereas for2∗, 9, 12 & 9, and 17 + 18 (1) subunits they were higher andfor 1, 17 + 18 (2), and 8 subunits they were lower. Consideringcultivars containing subunits 12 and 9, their peaks were barelyresolved and only a shoulder peak was observed for subunit 9with quite smaller area than subunit 12. The similar situationwas observed with cultivars which possess subunits 2 and5, where it was not possible to distinguish between thesetwo subunits. The other authors had similar situation whenexamining wheat samples that contained subunit pairs 12 &18, 16 & 10, 1 & 4 [7], and 12 & 9 [14]. The results werehighly reproducible, since CVs of molecular weights wereabout or less than 2% for eleven determined subunits which isin accordance with results of other authors [6–8], except forglutenin subunits 2∗ and 17 + 18 (1) whose CVs were 3.08%and 2.83%, respectively.These two values are also satisfactorysince they are not higher than 5%which is in accordance withthe results of Balazs et al. [9, 10].
The relative amount of some HMW-GS (2 & 5 and17 + 18 (1)) fluctuated slightly among genotypes whichpossess these combinations of HMW-GS, whereas significantvariations in the relative amount of other detected HMW-GS were observed (Table 1). Therefore it could be possible toobtain different percentage in total sum of HMW-GS among
cultivars where it is necessary to compare their quantityin detailed examination. The determination of the amountof HMW-GS is important for prediction of wheat qualityparameters [15–17]. Furthermore, according to Rhazi et al.[7] the quantification of HMW-GS could be used to detect anoverexpression of HMW-GS; for example, an overexpressionof the subunit 7 is encountered in certain cultivars. Also,subunit 7 possesses one of the highest CVs of all examinedcultivars in this study.
Molecular weight and quantification of individualHMW-GS by the LoaC method of nine Croatian and Serbian breadwheat cultivars are represented in Tables 2 and 3, respectively.The most frequent HMW-GS combination in both assort-ments are 2∗, 7 + 9, and 5 + 10 (“Divana,” “Zlata,” “Pobeda,”“Bastijana,” and “NS3-5299”) for which the authors [18–20]suppose that, together with N, 7 + 9, and 5 + 10, HMW-GScombination dominates in European winter wheat cultivars.Beside this combination, HMW-GS combinations 7 + 9and 2 + 12 (“Dragana,” “Simonida,” and “Zvezdana”); 2∗, 7 +8, and 5 + 10 (“Soissons” and “Felix”), and N, 7 + 9, and 5 +10 (“Ljiljana” and “Etida”) are also frequent in this study.When subunits separated byHMW-GSwithin assortment arecompared with each other, it can be observed that HMW-GSmolecular weights are almost identical, except subunits 2∗and 5, whereas the highest variation in the HMW-GS quan-tities was found for subunits 7, 10, 9, and 12 & 9 (Tables 2 and3). The average relative standard deviation of the peak time-corrected areas (CV) was 18.44% (data not shown) whichis on the levels obtained by Balazs et al. [9]. Also, average

4 Journal of Chemistry
Table 2: Apparent sizes and quantification of individual HMW-GS subunits of nine bread wheat cultivars grown in Croatia by LoaCmethodand quantification of individual HMW-GS subunits by RP-HPLC.
Cultivar Subunits Molecular weight (kDa) Relative amount (%)a Relative amount (%)b
Mean CV (%) Mean CV (%) Mean CV (%)
Soissons
5 228.1 1.43 2.54 16.82 11.64 0.002∗ 221.0 0.19 4.18 18.65 1.68 16.647 171.2 0.08 1.26 1.55 7.63 5.5110 139.9 0.25 3.29 4.75 1.93 14.508 133.3 0.53 0.26 14.07 1.92 4.56
Felix
5 223.8 1.04 1.68 19.98 12.25 4.422∗ 202.2 0.73 1.07 7.07 1.42 11.317 171.9 1.15 1.47 1.33 10.25 1.1810 140.3 0.76 1.95 18.56 1.95 1.038 133.2 0.74 0.39 0.66 2.53 11.12
Divana
5 226.8 1.87 3.17 32.06 11.21 6.492∗ 205.5 1.65 1.21 3.59 2.17 14.387 174.7 0.89 2.09 8.66 12.95 5.0110 142.4 0.89 2.30 3.13 3.88 7.379 129.0 0.38 2.88 30.37 6.56 1.19
Zlata
5 229.8 1.38 3.07 30.43 6.77 5.342∗ 208.0 2.07 0.96 2.91 1.00 12.577 176.4 1.48 2.83 10.02 9.34 5.0510 143.9 1.87 1.99 10.63 1.58 21.919 130.3 1.03 2.45 22.73 3.55 9.31
Seka
5 226.4 0.94 1.72 71.31 10.80 2.491 210.9 1.24 0.85 10.64 1.17 0.007 174.9 0.85 2.09 23.06 9.31 2.8910 142.4 1.19 1.71 34.37 2.00 17.909 135.4 0.63 0.74 16.32 2.05 8.73
Vulkan
5 225.5 0.35 2.49 66.87 6.82 3.067 174.1 0.57 1.47 0.60 8.18 1.4510 142.6 1.14 1.46 11.61 3.28 4.538 135.0 0.63 0.53 57.52 2.76 6.48
Renata
5 229.1 0.56 2.30 19.53 13.55 2.581 212.6 1.10 1.09 13.28 1.25 13.997 176.2 1.12 1.87 8.03 9.01 5.1710 143.3 1.83 1.17 8.03 2.23 6.988 135.0 0.84 0.65 49.25 1.44 9.43
Aida
5 224.2 2.56 3.00 23.59 10.82 3.922∗ 209.3 1.62 0.83 20.23 1.30 24.38
17 + 18 (2) 160.6 2.03 0.99 27.98 — —10 140.8 1.66 1.78 10.74 2.37 12.53
17 + 18 (1) 124.8 2.83 1.67 14.66 — —17 — — — — 10.80 1.7718 — — — — 4.67 4.53
Tihana
2 232.8 1.49 1.75 48.76 9.79 2.721 213.2 1.49 1.69 1.80 2.83 17.327 175.5 0.93 2.31 7.34 8.39 2.93
12 & 9 127.2 0.67 7.00 26.59 — —12 — — — — 3.02 4.749 — — — — 4.89 3.35
aExpressed as relative amount: percentage of individual HMW area to total LMW + HMW area.bExpressed as relative amount: percentage of individual HMW area to total LMW + HMW area.

Journal of Chemistry 5
Table 3: Apparent sizes and quantification of individual HMW-GS subunits of nine bread wheat cultivars grown in Serbia by LoaC methodand quantification of individual HMW-GS subunits by RP-HPLC.
Cultivar Subunits Molecular weight (kDa) Relative amount (%)a Relative amount (%)b
Mean CV (%) Mean CV (%) Mean CV (%)
Etida
5 237.8 0.15 3.53 30.28 9.72 0.207 184.0 0.46 4.30 35.62 10.49 3.1210 148.1 0.62 2.70 23.92 3.62 7.449 133.6 1.16 2.38 22.13 3.37 1.14
Ljiljana
5 233.4 1.27 4.58 20.94 — —5 & 9 — — — — 10.16 1.067 183.8 1.23 6.50 13.02 9.91 0.7310 147.8 0.67 4.52 9.30 5.27 1.029 131.1 0.70 1.12 14.79 — —
Pobeda
5 232.1 0.79 5.68 9.24 11.79 2.662∗ 216.3 0.26 3.35 24.39 1.65 0.007 181.3 0.35 7.21 34.01 9.91 1.1310 147.0 0.29 4.34 26.86 4.28 10.489 130.9 0.59 4.27 40.61 4.06 18.78
Bastijana
5 234.6 1.27 5.04 8.97 11.91 0.502∗ 216.4 0.39 1.07 66.38 1.65 1.217 182.5 0.08 7.51 19.71 8.74 2.7410 147.9 0.29 4.89 12.12 2.27 7.919 131.8 0.16 3.62 16.12 3.62 0.55
NS3-5299
5 233.5 1.91 4.58 9.12 11.25 0.362∗ 218.5 0.29 1.75 18.35 1.25 3.687 182.7 1.47 4.18 34.82 7.67 1.0510 147.8 0.57 1.84 0.10 4.15 0.979 131.5 1.61 2.32 24.33 3.95 1.02
Simonida
2 229.1 0.65 4.24 2.90 9.50 1.337 177.9 0.32 3.04 11.50 6.69 1.35
12 & 9 128.3 0.17 3.96 16.46 — —9 — — — — 3.95 0.9112 — — — — 5.24 3.10
Dragana
2 229.8 0.46 3.15 8.06 10.75 1.547 177.0 0.28 6.59 1.13 10.04 2.88
12 & 9 127.9 0.33 6.25 6.39 — —9 — — — — 4.25 0.4912 — — — — 4.20 3.93
Zvezdana
2 232.2 0.70 4.91 3.88 11.11 1.387 179.1 0.20 5.17 2.60 9.42 0.61
12 & 9 128.6 0.06 4.83 21.549 — — — — 3.63 4.2212 — — — — 2.95 1.30
Nevesinjska
5 & 2 230.9 0.55 5.32 6.25 — —5 & 2 & 8 — — — — 14.43 1.71
2∗ 216.5 0.36 2.96 11.42 1.11 3.727 183.4 0.04 6.73 17.34 10.52 1.7610 147.0 0.43 4.05 6.18 3.04 0.688 137.7 0.21 0.67 9.24 — —12 130.0 0.00 0.79 16.75 — —
aExpressed as relative amount: percentage of individual HMW area to total LMW + HMW area.bExpressed as relative amount: percentage of individual HMW area to total LMW + HMW area.
6 Journal of Chemistry
values of relative standard deviation obtained for severalcultivars examined in this study were on the same level as inprevious research [21], in which only one cultivar had beenanalysed.
Calibration curves of all determined chips were linearwithin the working range of standards from 4.5 kDa to240 kDa. Squared correlation coefficients (𝑅2) showed goodlinearity in the range from 0.9448 to 0.9455, whereas LODand LOQ were not determined in this paper since they werethe topics of the paper previously published by Zivancev et al.[21], with detailed explanation of glutenin subunits determi-nation by LoaC method.
3.2. Comparison of LoaC and HPLC Methods. The quan-tification of HMW-GS by RP-HPLC (Tables 1, 2, and 3)showed why this method has been routinely applied incereal chemistry for several decades for identifying particularglutenin subunits related to bread-making quality [22–24].The relative amount of all HMW-GS determined by RP-HPLC method was higher than that determined by LoaCmethod (Table 1) except for glutenin subunit 2∗. Also, inmost cases the CVs of HMW-GS gained by RP-HPLC werelower than those gained by LoaC method (Table 1). Only forglutenin subunits 1 and 12 CVs gained by LoaC method werelower than those gained by RP-HPLC method. LoaC hadadvantage in determination of HMW-GS in two cases sinceRP-HPLC method was not able to resolve subunit 5 fromsubunits 8 and 9 of cultivars “Nevesinjska” and “Ljiljana,”respectively (Table 3).
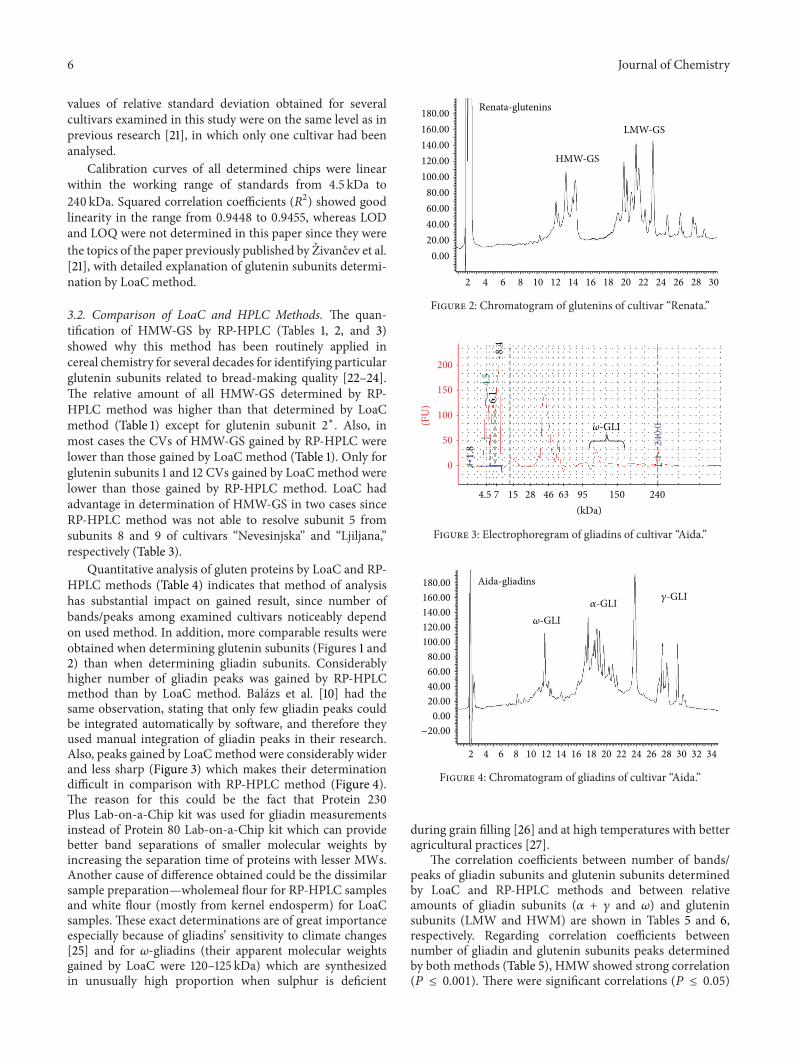
Quantitative analysis of gluten proteins by LoaC and RP-HPLC methods (Table 4) indicates that method of analysishas substantial impact on gained result, since number ofbands/peaks among examined cultivars noticeably dependon used method. In addition, more comparable results wereobtained when determining glutenin subunits (Figures 1 and2) than when determining gliadin subunits. Considerablyhigher number of gliadin peaks was gained by RP-HPLCmethod than by LoaC method. Balazs et al. [10] had thesame observation, stating that only few gliadin peaks couldbe integrated automatically by software, and therefore theyused manual integration of gliadin peaks in their research.Also, peaks gained by LoaCmethod were considerably widerand less sharp (Figure 3) which makes their determinationdifficult in comparison with RP-HPLC method (Figure 4).The reason for this could be the fact that Protein 230Plus Lab-on-a-Chip kit was used for gliadin measurementsinstead of Protein 80 Lab-on-a-Chip kit which can providebetter band separations of smaller molecular weights byincreasing the separation time of proteins with lesser MWs.Another cause of difference obtained could be the dissimilarsample preparation—wholemeal flour for RP-HPLC samplesand white flour (mostly from kernel endosperm) for LoaCsamples. These exact determinations are of great importanceespecially because of gliadins’ sensitivity to climate changes[25] and for 𝜔-gliadins (their apparent molecular weightsgained by LoaC were 120–125 kDa) which are synthesizedin unusually high proportion when sulphur is deficient
Renata-glutenins
HMW-GS
LMW-GS
2 4 6 8 10 12 14 16 18 20 22 24 26 28 30
0.00
20.00
40.00
60.00
80.00
100.00
120.00
140.00
160.00
180.00
Figure 2: Chromatogram of glutenins of cultivar “Renata.”
6.1
8.4
0
50
100
150
200
(FU
)
4.5 157 28 46 63 95 150 240
(kDa)
1.8
4.5
240.0𝜔-GLI
Figure 3: Electrophoregram of gliadins of cultivar “Aida.”
2 4 6 8 10 12 14 16 18 20 22 24 26 28 32 3430
0.00
20.00
40.00
60.00
80.00
100.00
120.00
140.00
160.00
180.00 Aida-gliadins
𝜔-GLI𝛼-GLI 𝛾-GLI
−20.00
Figure 4: Chromatogram of gliadins of cultivar “Aida.”
during grain filling [26] and at high temperatures with betteragricultural practices [27].
The correlation coefficients between number of bands/peaks of gliadin subunits and glutenin subunits determinedby LoaC and RP-HPLC methods and between relativeamounts of gliadin subunits (𝛼 + 𝛾 and 𝜔) and gluteninsubunits (LMW and HWM) are shown in Tables 5 and 6,respectively. Regarding correlation coefficients betweennumber of gliadin and glutenin subunits peaks determinedby both methods (Table 5), HMW showed strong correlation(𝑃 ≤ 0.001). There were significant correlations (𝑃 ≤ 0.05)

Journal of Chemistry 7
Table 4: Comparison between number of bands as determined by LoaC and number of peaks as determined by RP-HPLC.
Cultivar
LoaC number of bands RP-HPLC number of peaksGLI GLU GLI GLU
Total Omega Alpha +Gamma Total HMW LMW Total Omega Alpha +
Gamma Total HMW LMW
Soissons 33 8 25 22 5 17 36 9 27 20 5 15Divana 25 6 19 20 5 15 39 10 29 21 5 16Seka 30 6 24 19 5 14 37 9 28 21 5 16Vulkan 29 8 21 20 4 16 38 10 28 20 4 16Renata 26 6 20 21 5 16 39 11 28 21 5 16Zlata 29 6 23 21 5 16 39 10 29 23 5 18Aida 25 6 17 20 5 15 40 10 30 22 5 17Felix 28 6 22 22 5 17 41 10 31 21 5 16Tihana 28 6 22 19 5 14 38 8 30 23 5 18Dragana 26 6 20 18a 3a 15a 34 7 27 22 4 18Ljiljana 26 6 20 20 4 16 35 8 27 21 4 17Pobeda 30 7 23 21 5 16 36 8 28 22 5 17Bastijana 30 6 24 21 5 16 33 8 25 23 5 18Nevesinjska 26 6 20 22b 6b 35b 35 7 28 24 5 19Simonida 28 6 22 19a 3a 16a 33 10 23 20 4 16Etida 27 6 21 20 4 16 30 8 22 21 4 17Zvezdana 31 6 25 19a 3a 16a 31 8 23 21 4 17NS3-5299/2 28 7 21 22 5 17 29 8 21 24 5 19aOverlapping of subunits 9 and 12.bOverlapping of subunits 2 and 5.
Table 5: Correlation coefficients between number of bands/peaks of gliadin and glutenin subunits determined by LoaC and RP-HPLCmethods.
LoaC GLItotal
LoaCGLI 𝜔 LoaC GLI 𝛼 + 𝛾 LoaC GLU
totalLoaC GLUHMW
LoaC GLULMW
HPLC GLI total −0.20HPLC GLI 𝜔 0.07HPLC GLI 𝛼 + 𝛾 −0.25HPLC GLU total 0.31HPLC GLU HMW 0.88∗∗∗
HPLC GLU LMW 0.41Values are means (𝑁 = 18); ∗∗∗𝑃 ≤ 0.001.
Table 6: Correlation coefficients between relative amounts of gliadin subunits (𝛼 + 𝛾 and 𝜔) and glutenin subunits (LMW and HWM)determined by LoaC and RP-HPLC methodsa.
% 𝜔 LoaCb % 𝛼 + 𝛾LoaCb
% HMWLoaCc
% LMWLoaCc
% HMW/LMWLoaC
% HMW LoaCtotald
% 𝜔HPLCb−0.127
% 𝛼 + 𝛾HPLCb−0.118
% HMWHPLCc 0.338∗
% LMWHPLCc 0.341∗
%HMW/LMWHPLC 0.308% HMWHPLC totald 0.554∗∗∗aValues are means (𝑁 = 36); ∗𝑃 ≤ 0.05, ∗∗∗𝑃 ≤ 0.001.bExpressed as relative amount: percentage of individual 𝛼 + 𝛾 and 𝜔 area to total area of gliadins.cExpressed as relative amount: percentage of individual LMW and HMW area to total area of glutenins.dExpressed as relative amount: percentage of individual HMW area to total HMW area.

8 Journal of Chemistry
Table 7: Quantification of individual HMW-GS subunits for allexamined bread wheat cultivars by RP-HPLC and LoaC methods.
SubunitsLoaC RP-HPLC
Amount(%)∗ CV (%) Amount
(%)∗ CV (%)
5 & 2 34.0 5.62 40.0 1.062 25.8 40.69 37.2 7.425 27.5 27.16 38.9 15.752∗ 13.8 68.72 5.3 18.711 13.4 14.81 6.3 44.607 27.6 29.45 34.0 13.3710 21.9 30.25 10.9 38.908 6.4 49.85 8.8 35.219 17.6 26.67 13.4 22.7712 & 9 40.4 25.20 29.2 15.87∗Expressed as relative amount: percentage of individual HMW area to totalHMW area.
between percentages ofHMWandLMWdetermined by bothmethods, whereas strong correlation (𝑅 = 0.554, 𝑃 ≤ 0.001)was obtained between total amounts of HMW (Table 6).Better correlations for LMW were not obtained probablybecause all subunits could not be separated and quantifieddue to closeness of large number of subunits [10].
Table 7 illustrates the comparison of the quantitativedata of cultivars HMW-GS determined by LoaC and RP-HPLC. The quantitative LoaC data, when expressed as apercentage of total HMW-GS peak area, were diverse to thosedetermined by RP-HPLC.Themain difference existed amongamounts and CVs of HMW-GS with high molecular weight(2, 5, 2∗, and 1), whereas the rest of HMW-GS showed slightlyhigher similarity. However, the main disadvantage of RP-HPLC method when compared to LoaC method representsseparation time which limits number of analysed samples,whereas gliadin peaks resolution and lower peaks numbergained by LoaC method are shortcoming in comparison toRP-HPLC method.
4. Conclusions
In conclusion, strong correlation (𝑃 ≤ 0.001) was foundbetween numbers of HMW glutenin peaks determined byLoaC and RP-HPLC methods in this study. The existence ofsignificant correlations (𝑃 ≤ 0.05) between percentages ofHMW and LMW glutenin subunits calculated with regard tototal HMW + LMW area was also demonstrated. Moreover,when percentages of individual HMW areas were calculatedwith regard to totalHMWarea, evenmore significant correla-tion was found (𝑃 ≤ 0.001). RP-HPLCmethod showed supe-riority in determination of gliadins since higher numbers andbetter resolution of gliadin peaks were gained by RP-HPLCmethod than by LoaC method. For further research ofgliadins by LoaC method it is necessary to use Protein 80Lab-on-a-Chip kit which can provide better band separationsof smaller molecular weights. Sample preparation should
be unified in further researches in order to achieve bettercorrelation between results obtained by these methods.
Conflict of Interests
The authors declare that there is no conflict of interestsregarding the publication of this paper.
Acknowledgments
This work was supported by the Ministry of Education,Science and Technological Development of the Republicof Serbia within the Project of technological developmentno. TR 31007 (2011–2014) and bilateral cooperation betweenSerbia and Croatia—Genetic polymorphism of gluten pro-teins and its relationship to bread-making quality of wheat(Triticum aestivum L.). Dr. Nikola Hristov from Instituteof Field and Vegetable Crops (Novi Sad, Serbia) is alsoacknowledged for providing one set of examined cultivars.
References
[1] H. Goetz, M. Kuschel, T. Wulff et al., “Comparison of selectedanalytical techniques for protein sizing, quantitation andmolecular weight determination,” Journal of Biochemical andBiophysical Methods, vol. 60, no. 3, pp. 281–293, 2004.
[2] J. S. Hey, “Advances in microscale protein fractionation andanalysis,” The American Biotechnology Laboratory, vol. 25, no.1, pp. 12–16, 2007.
[3] M. Kuschel, T. Neumann, P. Barthmaier, and M. Kratzmeier,“Use of lab-on-a-Chip technology for protein sizing and quan-titation,” Journal of Biomolecular Techniques, vol. 13, no. 3, pp.172–178, 2002.
[4] A. M. Torbica, D. R. Zivancev, Z. T. Nikolic, V. B. Ðorđevic, andB. G. Nikolovski, “Advantages of the lab-on-a-chip method inthe determination of the kunitz trypsin inhibitor in soybeanvarieties,” Journal of Agricultural and Food Chemistry, vol. 58,no. 13, pp. 7980–7985, 2010.
[5] S. Uthayakumaran, I. L. Batey, and C.W.Wrigley, “On-the-spotidentification of grain variety and wheat-quality type by Lab-on-a-chip capillary electrophoresis,” Journal of Cereal Science,vol. 41, no. 3, pp. 371–374, 2005.
[6] S. Uthayakumaran, Y. Listiohadi, M. Baratta, I. L. Batey, andC. W. Wrigley, “Rapid identification and quantitation of high-molecular-weight glutenin subunits,” Journal of Cereal Science,vol. 44, no. 1, pp. 34–39, 2006.
[7] L. Rhazi, A.-L. Bodard, B. Fathollahi, and T. Aussenac, “Highthroughput microchip-based separation and quantitation ofhigh-molecular-weight glutenin subunits,” Journal of CerealScience, vol. 49, no. 2, pp. 272–277, 2009.
[8] M.Marchetti-Deschmann, A. Lehner, V. Peterseil, F. Sovegjarto,R.Hochegger, andG.Allmaier, “Fast wheat variety classificationby capillary gel electrophoresis-on-a-chip after single-step one-grain high molecular weight glutenin extraction,” Analyticaland Bioanalytical Chemistry, vol. 400, no. 8, pp. 2403–2414, 2011.
[9] G. Balazs, I. Baracskai, M. Nadosi, A. Harasztos, F. Bekes, andS. Tomoskozi, “Lab-on-a-chip technology in cereal science:analytical properties and possible application areas,” Acta Ali-mentaria, vol. 41, no. 1, pp. 73–85, 2012.
[10] G. Balazs, S. Tomoskozi, A. Harasztos et al., “Advantages andlimitation of lab-on-a-chip technique in the analysis of wheat

Journal of Chemistry 9
proteins,” Cereal Research Communications, vol. 40, no. 4, pp.562–572, 2012.
[11] J. F. Panozzo,H.A. Eagles, andM.Wootton, “Changes in proteincomposition during grain development in wheat,” AustralianJournal of Agricultural Research, vol. 52, no. 4, pp. 485–493, 2001.
[12] H. Wieser, S. Antes, and W. Seilmeier, “Quantitative determi-nation of gluten protein types in wheat flour by reversed-phasehigh-performance liquid chromatography,” Cereal Chemistry,vol. 75, no. 5, pp. 644–650, 1998.
[13] H. Wieser and W. Seilmeier, “The influence of nitrogen fertili-sation on quantities and proportions of different protein typesin wheat flour,” Journal of the Science of Food and Agriculture,vol. 76, no. 1, pp. 49–55, 1998.
[14] H. Wieser and G. Zimmermann, “Importance of amounts andproportions of high molecular weight subunits of glutenin forwheat quality,”European FoodResearch andTechnology, vol. 210,no. 5, pp. 324–330, 2000.
[15] M. Rakszegi, G. Pastori, H. D. Jones et al., “Technological qual-ity of field grown transgenic lines of commercial wheat cultivarsexpressing the 1Ax1 HMW glutenin subunit gene,” Journal ofCereal Science, vol. 47, no. 2, pp. 310–321, 2008.
[16] D. Horvat, Z. Kurtanjek, G. Drezner, G. Simic, and D. Magdic,“Effect of HMM glutenin subunits on wheat quality attributes,”Food Technology and Biotechnology, vol. 47, no. 3, supplement 1,pp. 253–259, 2009.
[17] D. Horvat, N. Crossed D. Signukic, D. Magdic et al., “Charac-terization of bread wheat cultivars (Triticum aestivum L.) byglutenin proteins,”Cereal Research Communications, vol. 41, no.1, pp. 133–140, 2013.
[18] M. Tohver, “High molecular weight (HMW) glutenin subunitcomposition of some Nordic and Middle European wheats,”Genetic Resources and Crop Evolution, vol. 54, no. 1, pp. 67–81,2007.
[19] S. Dencic, D. Obreht, B. Kobiljski, S. Statkic, and B. Bede,“Genetic determination of bread making quality in wheat,” inProceedings of the 43rd Croatian and 3rd International Sympo-sium on Agriculture, pp. 278–281, Opatija, Croatia, February2008.
[20] N. Tsenov, D. Atanasova, I. Todorov, I. Ivanova, and I. Stoeva,“Allelic diversity in Bulgarian winter wheat varieties basedon polymorphism of glutenin subunit composition,” CerealResearch Communication, vol. 37, pp. 551–558, 2009.
[21] D. R. Zivancev, B. G. Nikolovski, A. M. Torbica, J. S. Mastilovic,and N. H. Dukic, “Lab-on-a-chip method uncertainties indetermination of high-molecular- weight glutenin subunits,”Chemical Industry and Chemical Engineering Quarterly, vol. 19,no. 4, pp. 553–561, 2013.
[22] B. A. Marchylo, J. E. Kruger, and D. W. Hatcher, “Quantita-tive reversed-phase high-performance liquid chromatographicanalysis of wheat storage proteins as a potential quality predic-tion tool,” Journal of Cereal Science, vol. 9, no. 2, pp. 113–130,1989.
[23] K.Dong,C. Y.Hao,A. L.Wang,M.H.Cai, andY.M.Yan, “Char-acterization of HMW glutenin subunits in bread and tetraploidwheats by reversed-phase high-performance liquid chromatog-raphy,” Cereal Research Communications, vol. 37, no. 1, pp.65–73, 2009.
[24] L. Gao,W.Ma, J. Chen et al., “Characterization and comparativeanalysis of wheat high molecular weight glutenin subunits bySDS-PAGE, RP-HPLC, HPCE, and MALDI-TOF-MS,” Journalof Agricultural and FoodChemistry, vol. 58, no. 5, pp. 2777–2786,2010.
[25] R. A. Graybosch, C. J. Peterson, P. S. Baenziger, and D. R.Shelton, “Environmental modification of hard red winter wheatflour protein composition,” Journal of Cereal Science, vol. 22, no.1, pp. 45–51, 1995.
[26] S. Uthayakumaran, F. J. Zhao, D. Sivri, M. Roohani, I. L. Batey,and C. W. Wrigley, “Defect identification in wheat grain bymicro-fluidic electrophoresis: sulfur deficiency and bug dam-age,” Cereal Chemistry, vol. 84, no. 4, pp. 301–303, 2007.
[27] F. M. DuPont, S. Altenbach, R. Chan, K. Cronin, and D. Lieu,“Interactions between fertilizer, temperature and drought indetermining flour composition and quality for bread wheat,” inWheat Gluten, P. R. Shewry andA. S. Tatham, Eds., pp. 488–491,Gluten Royal Society of Chemistry, Cambridge, UK, 2000.

Submit your manuscripts athttp://www.hindawi.com
Hindawi Publishing Corporationhttp://www.hindawi.com Volume 2014
Inorganic ChemistryInternational Journal of
Hindawi Publishing Corporation http://www.hindawi.com Volume 2014
International Journal ofPhotoenergy
Hindawi Publishing Corporationhttp://www.hindawi.com Volume 2014
Carbohydrate Chemistry
International Journal of
Hindawi Publishing Corporationhttp://www.hindawi.com Volume 2014
Journal of
Chemistry
Hindawi Publishing Corporationhttp://www.hindawi.com Volume 2014
Advances in
Physical Chemistry
Hindawi Publishing Corporationhttp://www.hindawi.com
Analytical Methods in Chemistry
Journal of
Volume 2014
Bioinorganic Chemistry and ApplicationsHindawi Publishing Corporationhttp://www.hindawi.com Volume 2014
SpectroscopyInternational Journal of
Hindawi Publishing Corporationhttp://www.hindawi.com Volume 2014
The Scientific World JournalHindawi Publishing Corporation http://www.hindawi.com Volume 2014
Medicinal ChemistryInternational Journal of
Hindawi Publishing Corporationhttp://www.hindawi.com Volume 2014
Chromatography Research International
Hindawi Publishing Corporationhttp://www.hindawi.com Volume 2014
Applied ChemistryJournal of
Hindawi Publishing Corporationhttp://www.hindawi.com Volume 2014
Hindawi Publishing Corporationhttp://www.hindawi.com Volume 2014
Theoretical ChemistryJournal of
Hindawi Publishing Corporationhttp://www.hindawi.com Volume 2014
Journal of
Spectroscopy
Analytical ChemistryInternational Journal of
Hindawi Publishing Corporationhttp://www.hindawi.com Volume 2014
Journal of
Hindawi Publishing Corporationhttp://www.hindawi.com Volume 2014
Quantum Chemistry
Hindawi Publishing Corporationhttp://www.hindawi.com Volume 2014
Organic Chemistry International
ElectrochemistryInternational Journal of
Hindawi Publishing Corporation http://www.hindawi.com Volume 2014
Hindawi Publishing Corporationhttp://www.hindawi.com Volume 2014
CatalystsJournal of