research article conditional granger causality analysis...
TRANSCRIPT
Research ArticleConditional Granger Causality Analysis of Effective Connectivityduring Motor Imagery and Motor Execution in Stroke Patients
Li Wang,1 Jingna Zhang,1 Ye Zhang,1 Rubing Yan,2 Hongliang Liu,2 and Mingguo Qiu1
1Department of Medical Image, College of Biomedical Engineering, Third Military Medical University, No. 30,Gaotanyan Street, Shapingba District, Chongqing 400038, China2Department of Rehabilitation, Southwest Hospital, Third Military Medical University, No. 30, Gaotanyan Street,Shapingba District, Chongqing 400038, China
Correspondence should be addressed to Hongliang Liu; [email protected] and Mingguo Qiu; [email protected]
Received 22 December 2015; Revised 1 March 2016; Accepted 10 March 2016
Academic Editor: Eiji Kirino
Copyright © 2016 Li Wang et al.This is an open access article distributed under the Creative Commons Attribution License, whichpermits unrestricted use, distribution, and reproduction in any medium, provided the original work is properly cited.
Aims. Motor imagery has emerged as a promising technique for the improvement of motor function following stroke, but themechanism of functional network reorganization in patients during this process remains unclear. The aim of this study is toevaluate the cortical motor network patterns of effective connectivity in stroke patients. Methods. Ten stroke patients with righthand hemiplegia and ten normal control subjects were recruited. We applied conditional Granger causality analysis (CGCA) toexplore and compare the functional connectivity betweenmotor execution andmotor imagery. Results.Compared with the normalcontrols, the patient group showed lower effective connectivity to the primary motor cortex (M1), the premotor cortex (PMC), andthe supplementarymotor area (SMA) in the damaged hemisphere but stronger effective connectivity to the ipsilesional PMCandM1in the intact hemisphere duringmotor execution.There were tighter connections in the cortical motor network in the patients thanin the controls during motor imagery, and the patients showed more effective connectivity in the intact hemisphere. Conclusions.The increase in effective connectivity suggests that motor imagery enhances core corticocortical interactions, promotes internalinteraction in damaged hemispheres in stroke patients, and may facilitate recovery of motor function.
1. Introduction
Stroke patients often exhibit a variety of impairments inmotor ability [1]. These motor deficits are typically treatedwith physical therapy. However, current physical treatmentmethods lack patient activity, which impacts the outcome oftreatment. A new approach is therefore needed to remedy thisdeficiency of physical therapy. Functional recovery in strokepatients is achieved largely through reorganization processesin the damaged brain, and studies have suggested that repet-itive mental practice could cause plastic changes in the brain[2–4]. To this end,motor imagery has emerged as a promisingtechnique to improve motor function. Motor imagery is acognitive rehearsal of physical movements that is defined asthe internal reactivation of any first-person motor programwithout overt motor output [5, 6]. Some studies have usedmotor imagery as an auxiliary treatment in combination withphysical therapy, particularly in the treatment of upper
limb impairment after stroke [7, 8]. A few groups havedemonstrated that motor imagery plays an important rolein the recovery of motor abilities in patients with movementdisorders [9–11]. Functional imaging studies have shown thatthe primary motor cortex (M1), the premotor cortex (PMC),and the supplementary motor area (SMA) were all activatedduring both motor execution and motor imagery tasks andthat the activation of brain regions uponmotor execution andmotor imagery exhibited a large overlap [12, 13].
Neural reorganization depends on the information pro-vided by sensorimotor efferent-afferent feedback loops [14].Therefore, elucidation of neural connectivity is important forunderstanding the mechanisms underlying motor controland motor recovery. Although functional imaging studieshave found that motor imagery activates the motor area instroke patients, the information exchangemechanism in theseareas is not clearly understood. Recently, there have beenseveral studies investigating direct causality among different
Hindawi Publishing CorporationBioMed Research InternationalVolume 2016, Article ID 3870863, 9 pageshttp://dx.doi.org/10.1155/2016/3870863

2 BioMed Research International
activated brain regions in stroke patients using differentanalytical methods for fMRI data. Sharma et al. analyzedthe interactions between brain regions by structural equationmodeling (SEM) of the fMRI signal in stroke patients andobserved abnormal corticocortical connectivity in the motorsystem after subcortical stroke, even after significant recovery[7]. Bajaj et al. used a dynamical causal modeling (DCM)approach to task-based fMRI data to study brain effectiveconnectivity within motor networks of stroke patients andfound that PMC and M1 play a crucial role during motorimagery, as well as during motor execution [15]. However,these methods have some limitations. SEM is not a timeseries model and can even randomly change the data in atime sequence; because the same result can be obtained usingmodel analysis, SEM analysis is more suitable for PET data.DCM is dependent on the selection of an interaction area inadvance and assumes that there is an influence between thetwo regions. If the area selection and estimation of the influ-ence on the connected brain area are not accurate, the finalresult will lead to incorrect conclusions.
Granger causality analysis (GCA) was formalized in thecontext of linear vector autoregression (VAR)models in 1969.A time series 𝑥 is said to “G-causes” 𝑦 if 𝑦 can be betterpredicted using the past values of both 𝑦 and 𝑥 (full model)compared with the prediction of 𝑦 using only the past valuesof 𝑦 (restricted model) [16]. Without a priori knowledge ofthe directional connectivity among brain regions,GCA is bet-ter suited than SEMandDCMmethods for the study of directinteractions between brain regions [17, 18]. However, GCAdoes not make use of multivariate data and can only addressbivariate time series.The conditionalGranger causality analy-sis (CGCA) extends Granger’s original definition of causalityto multivariate cases, the linear direct influence from 𝑥(origin) to 𝑦 (target) conditional on 𝑧 (𝐹𝑥 → 𝑦 | 𝑧). Eachsimultaneous time series is chosen alternatively as the originor target. When two of the series were chosen as the originand target, the remaining series were composed of 𝑧 valuesand served as conditions of the CGC analysis. Thus, we usedCGCA to analyze fMRI data and could examine abnormalinteractions among motor networks in stroke patients to bet-ter understand the neurobiological basis of these disorders.
In the present study, we used CGCA analysis of fMRI datato investigate the effective connectivity patterns ofmotor net-works during motor execution and motor imagery in strokepatients and age-matched normal controls. We hypothesizedthat (1) the effective connectivity in the corticalmotor networkwould be decreased in patients comparedwith controls due tobrain damage; (2) the same changes in effective connectivitywould be found in those patients whose motor networkwas changed during motor imagery; and (3) interactionswithin regions restricted to the motor network would reveala specific compensatory mechanism in stroke patients thataffected the motor network.
2. Materials and Methods
2.1. Subjects. Twelve stroke patients with right hand hemiple-giawere prospectively recruited (50.60±10.80 years). A strokeneurologist selected stroke patients by magnetic resonance
imaging and Fugal-Meyer Assessment (FMA) motor func-tion scores, which required initial disease occurrence andobvious right hand hemiplegia. All stroke patients had onlyunilateral left brain damaged. The specific inclusion criteriaincluded extension of the ipsilateral wrist >10∘ and extensionbetween the thumb, the metacarpophalangeal joint, and theinterphalangeal joints of at least two fingers >10∘. Ten age-matched control subjects (50.10±16.20 years) were recruitedthrough a local advertisement. The control subjects had nohistory of medical disorders and did not regularly take med-ication. All of the subjects were right-handed. Handednesswas based on the hand currently used for lateralized tasks,such as writing. Written consent was obtained from eachparticipant, and the protocol was approved by the EthicsCommittee of the Third Military Medical University.
For each subject, mental status was assessed by theMini-Mental State Examination (MMSE), andmotor imageryperformance was evaluated by theMovement Imagery Ques-tionnaire, Revised Second Edition (MIQ-RS) [19]. AMIQ-RSscore below 28 indicates that subjects unable to adequatelycomplete the MI were excluded. Fugal-Meyer Assessment(FMA) [20]motor function scores were applied in the patientgroup.
2.2. Scanning Procedures. The experiment was performedusing a 3.0 T MRI scanner (Trio, Siemens Medical Erlangen,Germany) using a gradient-recalled echo planar imaging(EPI) sequence. The acquisition parameters were as follows:TR = 2000ms, TE = 30ms, flip angle = 90∘, 64 × 64 voxelmatrix, FoV = 220mm, 27 contiguous axial slices acquired ininterleaved order, and thickness = 4.0mm. High-resolutionT1-weighted structural images were also acquired using the3DMP-RAGE pulse sequence with the following parameters:TR = 1900ms, TE = 2.52ms, flip angle = 15∘, voxel matrix =256 × 256 and FoV= 240mm, 176 contiguous axial slices, andthickness = 1.0mm.
2.3. Experiment. The fMRI experiment performed in ourprevious study was repeated in the present study [21]. Allsubjects experienced 2 sequential runs: right hand motorexecution and right hand motor imagery. Each run includedfive stimulation blocks, and each block lasted 60 seconds,including 30 seconds formotor execution/motor imagery and30 seconds for the rest. During the motor execution run,the screen presented a picture of the corresponding fingermovement at a frequency of 1Hz. During the motor imagerysession, the screen presented the direction indicated by thecorresponding arrowhead: the left arrow indicates the motorimagery of the left hand and the right arrow indicates theright hand. During the rest period, the black central cross onthe screen reminded participants to place their hands on thesides of the body and to breathe quietly [21]. We apply thecalibrated bilateral fiber optic-gloves to monitor the partici-pants’ behavior during the entire process of the experiment(Fifth Dimension Technologies, Pretoria, South Africa).
2.4. Data Preprocessing. Theexperimental datawere preproc-essed using statistical parametric mapping software (SPM8,http://www.fil.ion.ucl.ac.uk/spm/software/spm8/). All the 150
BioMed Research International 3
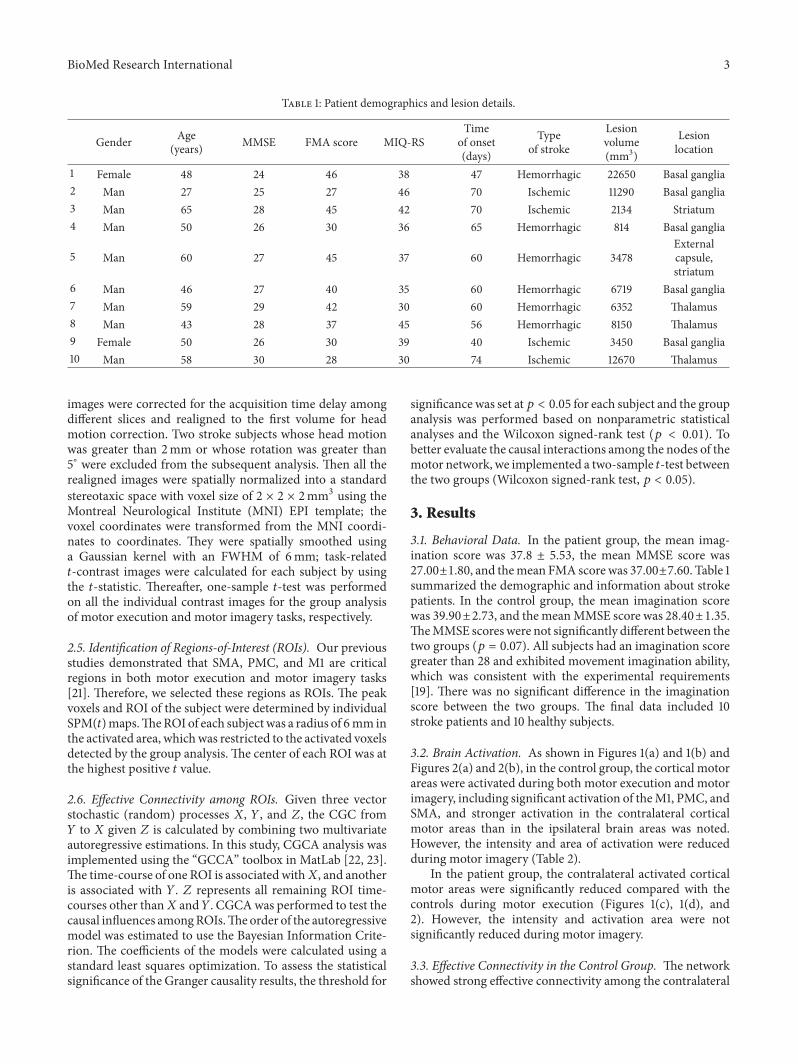
Table 1: Patient demographics and lesion details.
Gender Age(years) MMSE FMA score MIQ-RS
Timeof onset(days)
Typeof stroke
Lesionvolume(mm3)
Lesionlocation
1 Female 48 24 46 38 47 Hemorrhagic 22650 Basal ganglia2 Man 27 25 27 46 70 Ischemic 11290 Basal ganglia3 Man 65 28 45 42 70 Ischemic 2134 Striatum4 Man 50 26 30 36 65 Hemorrhagic 814 Basal ganglia
5 Man 60 27 45 37 60 Hemorrhagic 3478Externalcapsule,striatum
6 Man 46 27 40 35 60 Hemorrhagic 6719 Basal ganglia7 Man 59 29 42 30 60 Hemorrhagic 6352 Thalamus8 Man 43 28 37 45 56 Hemorrhagic 8150 Thalamus9 Female 50 26 30 39 40 Ischemic 3450 Basal ganglia10 Man 58 30 28 30 74 Ischemic 12670 Thalamus
images were corrected for the acquisition time delay amongdifferent slices and realigned to the first volume for headmotion correction. Two stroke subjects whose head motionwas greater than 2mm or whose rotation was greater than5∘ were excluded from the subsequent analysis. Then all therealigned images were spatially normalized into a standardstereotaxic space with voxel size of 2 × 2 × 2mm3 using theMontreal Neurological Institute (MNI) EPI template; thevoxel coordinates were transformed from the MNI coordi-nates to coordinates. They were spatially smoothed usinga Gaussian kernel with an FWHM of 6mm; task-related𝑡-contrast images were calculated for each subject by usingthe 𝑡-statistic. Thereafter, one-sample 𝑡-test was performedon all the individual contrast images for the group analysisof motor execution and motor imagery tasks, respectively.
2.5. Identification of Regions-of-Interest (ROIs). Our previousstudies demonstrated that SMA, PMC, and M1 are criticalregions in both motor execution and motor imagery tasks[21]. Therefore, we selected these regions as ROIs. The peakvoxels and ROI of the subject were determined by individualSPM(𝑡)maps.TheROI of each subjectwas a radius of 6mm inthe activated area, whichwas restricted to the activated voxelsdetected by the group analysis. The center of each ROI was atthe highest positive 𝑡 value.
2.6. Effective Connectivity among ROIs. Given three vectorstochastic (random) processes 𝑋, 𝑌, and 𝑍, the CGC from𝑌 to 𝑋 given 𝑍 is calculated by combining two multivariateautoregressive estimations. In this study, CGCA analysis wasimplemented using the “GCCA” toolbox in MatLab [22, 23].The time-course of one ROI is associated with𝑋, and anotheris associated with 𝑌. 𝑍 represents all remaining ROI time-courses other than𝑋 and𝑌. CGCAwas performed to test thecausal influences amongROIs.Theorder of the autoregressivemodel was estimated to use the Bayesian Information Crite-rion. The coefficients of the models were calculated using astandard least squares optimization. To assess the statisticalsignificance of the Granger causality results, the threshold for
significance was set at𝑝 < 0.05 for each subject and the groupanalysis was performed based on nonparametric statisticalanalyses and the Wilcoxon signed-rank test (𝑝 < 0.01). Tobetter evaluate the causal interactions among the nodes of themotor network, we implemented a two-sample 𝑡-test betweenthe two groups (Wilcoxon signed-rank test, 𝑝 < 0.05).
3. Results
3.1. Behavioral Data. In the patient group, the mean imag-ination score was 37.8 ± 5.53, the mean MMSE score was27.00±1.80, and themean FMA score was 37.00±7.60. Table 1summarized the demographic and information about strokepatients. In the control group, the mean imagination scorewas 39.90±2.73, and themeanMMSE score was 28.40±1.35.TheMMSE scoreswere not significantly different between thetwo groups (𝑝 = 0.07). All subjects had an imagination scoregreater than 28 and exhibited movement imagination ability,which was consistent with the experimental requirements[19]. There was no significant difference in the imaginationscore between the two groups. The final data included 10stroke patients and 10 healthy subjects.
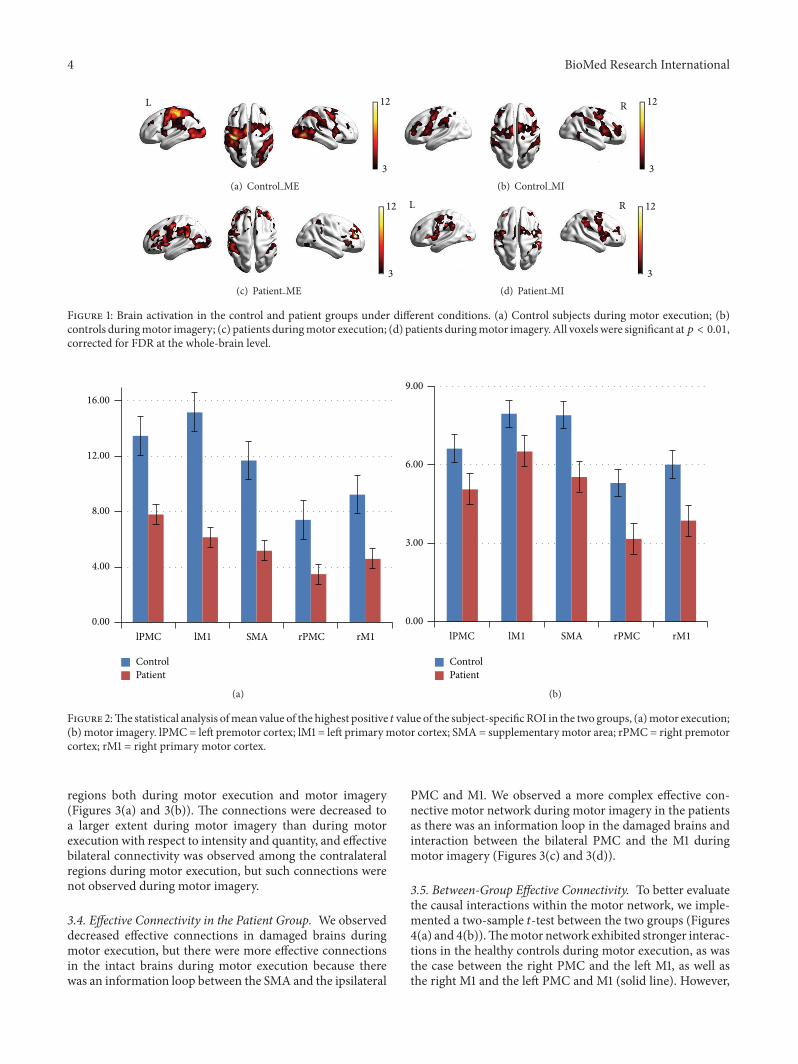
3.2. Brain Activation. As shown in Figures 1(a) and 1(b) andFigures 2(a) and 2(b), in the control group, the cortical motorareas were activated during both motor execution and motorimagery, including significant activation of theM1, PMC, andSMA, and stronger activation in the contralateral corticalmotor areas than in the ipsilateral brain areas was noted.However, the intensity and area of activation were reducedduring motor imagery (Table 2).
In the patient group, the contralateral activated corticalmotor areas were significantly reduced compared with thecontrols during motor execution (Figures 1(c), 1(d), and2). However, the intensity and activation area were notsignificantly reduced during motor imagery.
3.3. Effective Connectivity in the Control Group. The networkshowed strong effective connectivity among the contralateral
4 BioMed Research International
12
3
L
(a) Control ME
12
3
R
(b) Control MI
12
3
(c) Patient ME
12
3
RL
(d) Patient MI
Figure 1: Brain activation in the control and patient groups under different conditions. (a) Control subjects during motor execution; (b)controls duringmotor imagery; (c) patients duringmotor execution; (d) patients duringmotor imagery. All voxels were significant at𝑝 < 0.01,corrected for FDR at the whole-brain level.
lPMC lM1 SMA rPMC rM1
ControlPatient
0.00
4.00
8.00
12.00
16.00
(a)
lPMC lM1 SMA rPMC rM10.00
3.00
6.00
9.00
ControlPatient
(b)
Figure 2:The statistical analysis ofmean value of the highest positive 𝑡 value of the subject-specificROI in the two groups, (a)motor execution;(b) motor imagery. lPMC = left premotor cortex; lM1 = left primary motor cortex; SMA = supplementary motor area; rPMC = right premotorcortex; rM1 = right primary motor cortex.
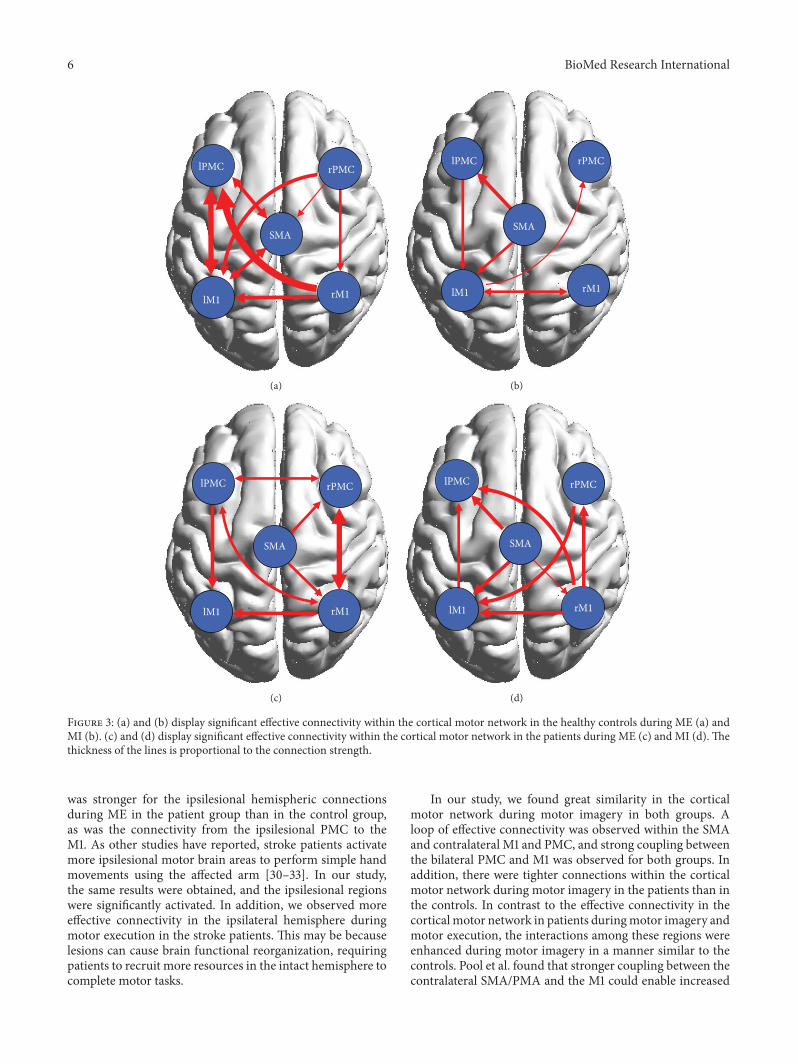
regions both during motor execution and motor imagery(Figures 3(a) and 3(b)). The connections were decreased toa larger extent during motor imagery than during motorexecution with respect to intensity and quantity, and effectivebilateral connectivity was observed among the contralateralregions during motor execution, but such connections werenot observed during motor imagery.
3.4. Effective Connectivity in the Patient Group. We observeddecreased effective connections in damaged brains duringmotor execution, but there were more effective connectionsin the intact brains during motor execution because therewas an information loop between the SMA and the ipsilateral
PMC and M1. We observed a more complex effective con-nective motor network during motor imagery in the patientsas there was an information loop in the damaged brains andinteraction between the bilateral PMC and the M1 duringmotor imagery (Figures 3(c) and 3(d)).
3.5. Between-Group Effective Connectivity. To better evaluatethe causal interactions within the motor network, we imple-mented a two-sample 𝑡-test between the two groups (Figures4(a) and 4(b)).Themotor network exhibited stronger interac-tions in the healthy controls during motor execution, as wasthe case between the right PMC and the left M1, as well asthe right M1 and the left PMC and M1 (solid line). However,
BioMed Research International 5
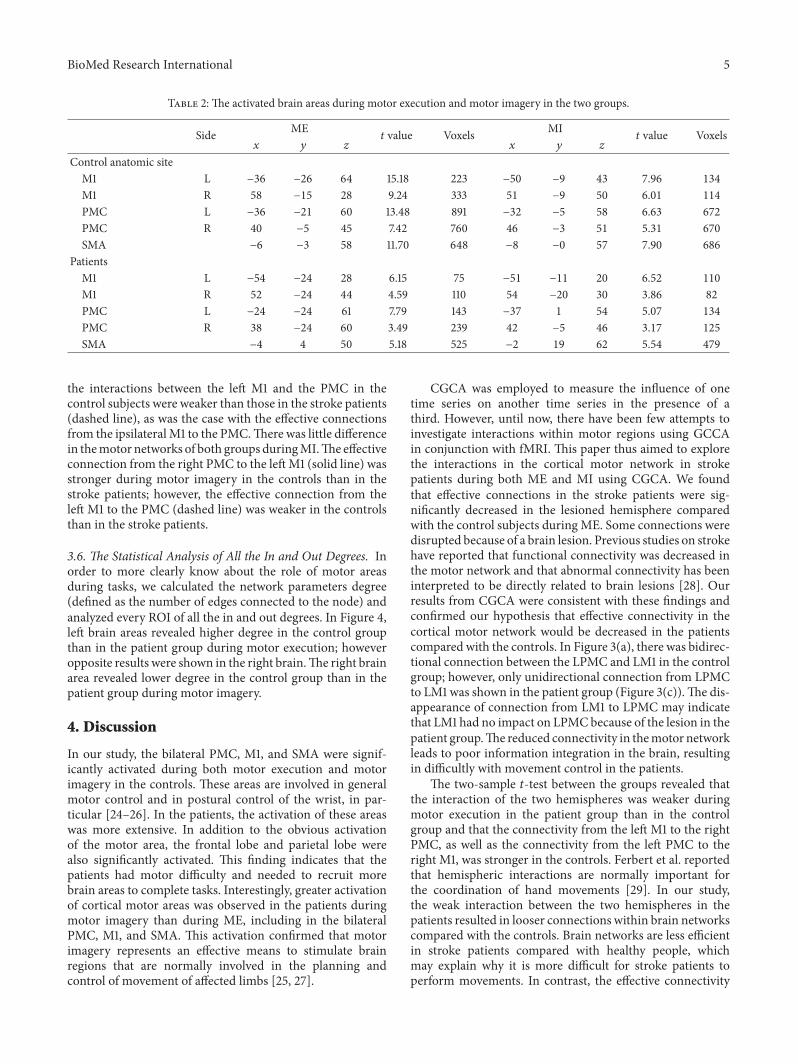
Table 2: The activated brain areas during motor execution and motor imagery in the two groups.
Side ME𝑡 value Voxels MI
𝑡 value Voxels𝑥 𝑦 𝑧 𝑥 𝑦 𝑧
Control anatomic siteM1 L −36 −26 64 15.18 223 −50 −9 43 7.96 134
M1 R 58 −15 28 9.24 333 51 −9 50 6.01 114
PMC L −36 −21 60 13.48 891 −32 −5 58 6.63 672
PMC R 40 −5 45 7.42 760 46 −3 51 5.31 670
SMA −6 −3 58 11.70 648 −8 −0 57 7.90 686
PatientsM1 L −54 −24 28 6.15 75 −51 −11 20 6.52 110
M1 R 52 −24 44 4.59 110 54 −20 30 3.86 82
PMC L −24 −24 61 7.79 143 −37 1 54 5.07 134
PMC R 38 −24 60 3.49 239 42 −5 46 3.17 125
SMA −4 4 50 5.18 525 −2 19 62 5.54 479
the interactions between the left M1 and the PMC in thecontrol subjects were weaker than those in the stroke patients(dashed line), as was the case with the effective connectionsfrom the ipsilateralM1 to the PMC.There was little differencein themotor networks of both groups duringMI.The effectiveconnection from the right PMC to the leftM1 (solid line) wasstronger during motor imagery in the controls than in thestroke patients; however, the effective connection from theleft M1 to the PMC (dashed line) was weaker in the controlsthan in the stroke patients.
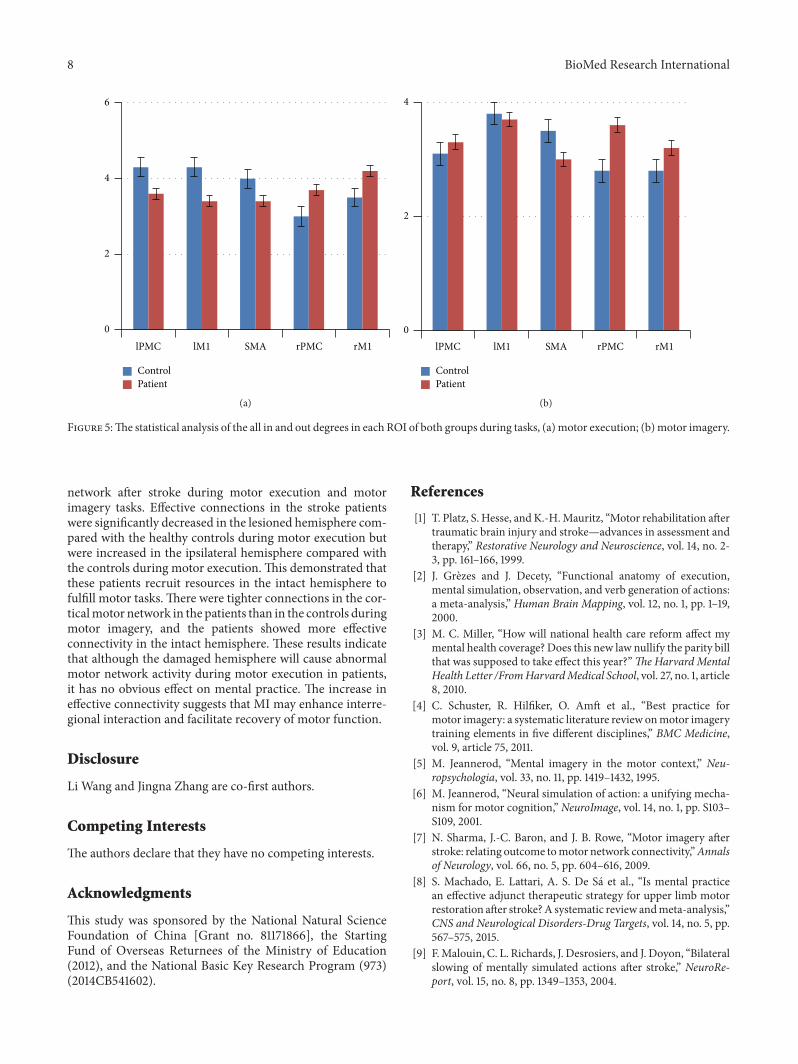
3.6. The Statistical Analysis of All the In and Out Degrees. Inorder to more clearly know about the role of motor areasduring tasks, we calculated the network parameters degree(defined as the number of edges connected to the node) andanalyzed every ROI of all the in and out degrees. In Figure 4,left brain areas revealed higher degree in the control groupthan in the patient group during motor execution; howeveropposite results were shown in the right brain.The right brainarea revealed lower degree in the control group than in thepatient group during motor imagery.
4. Discussion
In our study, the bilateral PMC, M1, and SMA were signif-icantly activated during both motor execution and motorimagery in the controls. These areas are involved in generalmotor control and in postural control of the wrist, in par-ticular [24–26]. In the patients, the activation of these areaswas more extensive. In addition to the obvious activationof the motor area, the frontal lobe and parietal lobe werealso significantly activated. This finding indicates that thepatients had motor difficulty and needed to recruit morebrain areas to complete tasks. Interestingly, greater activationof cortical motor areas was observed in the patients duringmotor imagery than during ME, including in the bilateralPMC, M1, and SMA. This activation confirmed that motorimagery represents an effective means to stimulate brainregions that are normally involved in the planning andcontrol of movement of affected limbs [25, 27].
CGCA was employed to measure the influence of onetime series on another time series in the presence of athird. However, until now, there have been few attempts toinvestigate interactions within motor regions using GCCAin conjunction with fMRI. This paper thus aimed to explorethe interactions in the cortical motor network in strokepatients during both ME and MI using CGCA. We foundthat effective connections in the stroke patients were sig-nificantly decreased in the lesioned hemisphere comparedwith the control subjects during ME. Some connections weredisrupted because of a brain lesion. Previous studies on strokehave reported that functional connectivity was decreased inthe motor network and that abnormal connectivity has beeninterpreted to be directly related to brain lesions [28]. Ourresults from CGCA were consistent with these findings andconfirmed our hypothesis that effective connectivity in thecortical motor network would be decreased in the patientscompared with the controls. In Figure 3(a), there was bidirec-tional connection between the LPMC and LM1 in the controlgroup; however, only unidirectional connection from LPMCto LM1 was shown in the patient group (Figure 3(c)).The dis-appearance of connection from LM1 to LPMC may indicatethat LM1 had no impact on LPMCbecause of the lesion in thepatient group.The reduced connectivity in themotor networkleads to poor information integration in the brain, resultingin difficultly with movement control in the patients.
The two-sample 𝑡-test between the groups revealed thatthe interaction of the two hemispheres was weaker duringmotor execution in the patient group than in the controlgroup and that the connectivity from the left M1 to the rightPMC, as well as the connectivity from the left PMC to theright M1, was stronger in the controls. Ferbert et al. reportedthat hemispheric interactions are normally important forthe coordination of hand movements [29]. In our study,the weak interaction between the two hemispheres in thepatients resulted in looser connections within brain networkscompared with the controls. Brain networks are less efficientin stroke patients compared with healthy people, whichmay explain why it is more difficult for stroke patients toperform movements. In contrast, the effective connectivity
6 BioMed Research International
SMA
rPMC
lM1 rM1
lPMC
(a)
rM1
SMA
lPMC rPMC
lM1
(b)
lPMC
rM1
rPMC
SMA
lM1
(c)
lPMC rPMC
rM1
SMA
lM1
(d)
Figure 3: (a) and (b) display significant effective connectivity within the cortical motor network in the healthy controls during ME (a) andMI (b). (c) and (d) display significant effective connectivity within the cortical motor network in the patients during ME (c) and MI (d). Thethickness of the lines is proportional to the connection strength.
was stronger for the ipsilesional hemispheric connectionsduring ME in the patient group than in the control group,as was the connectivity from the ipsilesional PMC to theM1. As other studies have reported, stroke patients activatemore ipsilesional motor brain areas to perform simple handmovements using the affected arm [30–33]. In our study,the same results were obtained, and the ipsilesional regionswere significantly activated. In addition, we observed moreeffective connectivity in the ipsilateral hemisphere duringmotor execution in the stroke patients. This may be becauselesions can cause brain functional reorganization, requiringpatients to recruit more resources in the intact hemisphere tocomplete motor tasks.
In our study, we found great similarity in the corticalmotor network during motor imagery in both groups. Aloop of effective connectivity was observed within the SMAand contralateral M1 and PMC, and strong coupling betweenthe bilateral PMC and M1 was observed for both groups. Inaddition, there were tighter connections within the corticalmotor network during motor imagery in the patients than inthe controls. In contrast to the effective connectivity in thecortical motor network in patients duringmotor imagery andmotor execution, the interactions among these regions wereenhanced during motor imagery in a manner similar to thecontrols. Pool et al. found that stronger coupling between thecontralateral SMA/PMA and the M1 could enable increased

BioMed Research International 7
lPMC rPMC
lM1 rM1
SMA
(a)
lM1 rM1
SMA
lPMC rPMC
(b)
Figure 4: Results of the motor network causal interactions in the controls versus the stroke patients during ME and MI. Solid lines indicatesignificantly stronger connections in the control group than in the patient group, and dashed lines indicate the opposite.
motor performance in unilateral hand movements in healthypeople [34]. In our study, there was no such couplingwithin the contralateral regions in the patients during motorexecution, which may be related to brain damage; however,the interactions were observed during motor imagery in thepatients. These results indicate that although the lesionedhemisphere will cause abnormal network activity duringmotor execution in patients, it has no obvious effect onmotor imagination. These findings suggested that our sec-ond hypothesis is false. The increased effective connectivitysuggested thatmotor imagery enhanced corticocortical inter-actions; in particular, it promoted internal interaction in thedamaged hemispheres in stroke patients and may have facili-tated recovery of motor function. These results explain thefunction of motor imagery in the rehabilitation of patientswith stroke to a certain extent.
Although the two groups of human motor networksexhibited great similarity during motor imagery, significantdifferences in effective connectivity were also observed. Thestroke patients showed more effective connectivity in theintact hemisphere. In the two-sample 𝑡-test between the twogroups, we found that ipsilesional PMC and M1 increasedconnections in the patient group. Sharma et al. found thatcoupling between the ipsilesional PMC and the M1 wasincreased during motor imagery tasks, thereby enhancingcortical–cortical interactions [7]. Our study confirmed thechanges of effective connectivitywithin the intact hemisphereby CGCA and suggested that motor imagery could increaseinteractions within intact brain. Furthermore, lesions werelikely to cause the reorganization of the motor system andto alter motor imagery-related neurological function [7, 35].In another study, the effective connectivity from the ipsile-sional PMC to the contralateral M1 was weaker in patientsthan in controls. The decreased coupling between the two
hemispheres suggested that although motor imagery coulddrive the interaction between the two hemispheres in thepatients, the connectivity strength was weaker than in thecontrols.Thus, the lesionmay lead to increased difficulty withintegrating information and controlling motion.
In the brain network, the degree of ROI indicates its cen-tricity and importance. As shown in Figure 5(a), ROI had ahigher degree in the contralateral hemisphere than in the ipsi-lateral hemisphere during right hand motor execution in thecontrol group, while the patient group had opposite results.These suggested that the lesions were affecting the centricityof the contralateral hemisphere.The increased degree of ipsi-lateral brain regions may be a compensation for brain injuryduring motor execution in the patient group. Figure 5(b)showed that the centricity and importance of the ipsilateralhemisphere was also improved during movement imagery inpatients group.
Our study has some limitations. First, the sample sizewas limited. Second, we used CGCA and found that themotor network changed in stroke patients.These results werelimited to the motor cortical region and did not involvesubcortical areas. Many subcortical regions are known to beinvolved in movement, especially in stroke patients, becauseof the reorganization of brain function. Our next study willattempt to expand the research sample size and to furtherstudy the functional connectivity of the subcortical regionsto more clearly understand the mechanisms of functionalnetwork reorganization in stroke patients.
5. Conclusions
In conclusion, the results of the current CGCA study describethe effective connectivity patterns in the cortical motor
8 BioMed Research International
0
2
4
6
lPMC lM1 SMA rPMC rM1
ControlPatient
(a)
0
2
4
lPMC lM1 SMA rPMC rM1
ControlPatient
(b)
Figure 5:The statistical analysis of the all in and out degrees in each ROI of both groups during tasks, (a) motor execution; (b)motor imagery.
network after stroke during motor execution and motorimagery tasks. Effective connections in the stroke patientswere significantly decreased in the lesioned hemisphere com-pared with the healthy controls during motor execution butwere increased in the ipsilateral hemisphere compared withthe controls during motor execution.This demonstrated thatthese patients recruit resources in the intact hemisphere tofulfill motor tasks. There were tighter connections in the cor-ticalmotor network in the patients than in the controls duringmotor imagery, and the patients showed more effectiveconnectivity in the intact hemisphere. These results indicatethat although the damaged hemisphere will cause abnormalmotor network activity during motor execution in patients,it has no obvious effect on mental practice. The increase ineffective connectivity suggests that MI may enhance interre-gional interaction and facilitate recovery of motor function.
Disclosure
Li Wang and Jingna Zhang are co-first authors.
Competing Interests
The authors declare that they have no competing interests.
Acknowledgments
This study was sponsored by the National Natural ScienceFoundation of China [Grant no. 81171866], the StartingFund of Overseas Returnees of the Ministry of Education(2012), and the National Basic Key Research Program (973)(2014CB541602).
References
[1] T. Platz, S. Hesse, and K.-H.Mauritz, “Motor rehabilitation aftertraumatic brain injury and stroke—advances in assessment andtherapy,” Restorative Neurology and Neuroscience, vol. 14, no. 2-3, pp. 161–166, 1999.
[2] J. Grezes and J. Decety, “Functional anatomy of execution,mental simulation, observation, and verb generation of actions:a meta-analysis,” Human Brain Mapping, vol. 12, no. 1, pp. 1–19,2000.
[3] M. C. Miller, “How will national health care reform affect mymental health coverage? Does this new law nullify the parity billthat was supposed to take effect this year?”TheHarvard MentalHealth Letter /FromHarvardMedical School, vol. 27, no. 1, article8, 2010.
[4] C. Schuster, R. Hilfiker, O. Amft et al., “Best practice formotor imagery: a systematic literature review onmotor imagerytraining elements in five different disciplines,” BMC Medicine,vol. 9, article 75, 2011.
[5] M. Jeannerod, “Mental imagery in the motor context,” Neu-ropsychologia, vol. 33, no. 11, pp. 1419–1432, 1995.
[6] M. Jeannerod, “Neural simulation of action: a unifying mecha-nism for motor cognition,” NeuroImage, vol. 14, no. 1, pp. S103–S109, 2001.
[7] N. Sharma, J.-C. Baron, and J. B. Rowe, “Motor imagery afterstroke: relating outcome tomotor network connectivity,”Annalsof Neurology, vol. 66, no. 5, pp. 604–616, 2009.
[8] S. Machado, E. Lattari, A. S. De Sa et al., “Is mental practicean effective adjunct therapeutic strategy for upper limb motorrestoration after stroke?A systematic review andmeta-analysis,”CNS and Neurological Disorders-Drug Targets, vol. 14, no. 5, pp.567–575, 2015.
[9] F.Malouin, C. L. Richards, J. Desrosiers, and J. Doyon, “Bilateralslowing of mentally simulated actions after stroke,” NeuroRe-port, vol. 15, no. 8, pp. 1349–1353, 2004.
BioMed Research International 9
[10] F. Malouin, C. L. Richards, J. Doyon, J. Desrosiers, and S.Belleville, “Training mobility tasks after stroke with combinedmental and physical practice: a feasibility study,” Neurorehabili-tation and Neural Repair, vol. 18, no. 2, pp. 66–75, 2004.
[11] T. J. Kimberley, G. Khandekar, L. L. Skraba, J. A. Spencer, E.A. Van Gorp, and S. R. Walker, “Neural substrates for motorimagery in severe hemiparesis,” Neurorehabilitation and NeuralRepair, vol. 20, no. 2, pp. 268–277, 2006.
[12] S. H. Johnson, M. Rotte, S. T. Grafton, H. Hinrichs, M. S. Gaz-zaniga, andH.-J.Heinze, “Selective activation of a parietofrontalcircuit during implicitly imagined prehension,” NeuroImage,vol. 17, no. 4, pp. 1693–1704, 2002.
[13] M. Lotze, P. Montoya, M. Erb et al., “Activation of corticaland cerebellar motor areas during executed and imagined handmovements: an fMRI study,” Journal of Cognitive Neuroscience,vol. 11, no. 5, pp. 491–501, 1999.
[14] S. de Vries and T. Mulder, “Motor imagery and stroke rehabili-tation: a critical discussion,” Journal of Rehabilitation Medicine,vol. 39, no. 1, pp. 5–13, 2007.
[15] S. Bajaj, A. J. Butler, D. Drake, andM. Dhamala, “Brain effectiveconnectivity during motor-imagery and execution followingstroke and rehabilitation,”NeuroImage: Clinical, vol. 8, pp. 572–582, 2015.
[16] H. J. Granger andA. C. Guyton, “Autoregulation of the total sys-temic circulation following destruction of the central nervoussystem in the dog,” Circulation Research, vol. 25, no. 4, pp. 379–388, 1969.
[17] L. Q. Uddin, A. M. C. Kelly, B. B. Biswal, F. X. Castellanos, andM. P. Milham, “Functional connectivity of default mode net-work components: correlation, anticorrelation, and causality,”Human Brain Mapping, vol. 30, no. 2, pp. 625–637, 2009.
[18] H. Chen, Q. Yang,W. Liao, Q. Gong, and S. Shen, “Evaluation ofthe effective connectivity of supplementary motor areas duringmotor imagery using Granger causality mapping,”NeuroImage,vol. 47, no. 4, pp. 1844–1853, 2009.
[19] M. Gregg, C. Hall, and A. Butler, “The MIQ-RS: a suitableoption for examining movement imagery ability,” Evidence-Based Complementary and AlternativeMedicine, vol. 7, no. 2, pp.249–257, 2010.
[20] F. De Vico Fallani, F. Pichiorri, G. Morone et al., “Multiscaletopological properties of functional brain networks duringmotor imagery after stroke,” NeuroImage, vol. 83, pp. 438–449,2013.
[21] L. Wang, M. Qiu, C. Liu et al., “Age-specific activation of cere-bral areas in motor imagery—a fMRI study,” Neuroradiology,vol. 56, no. 4, pp. 339–348, 2014.
[22] A.K. Seth, “AMATLAB toolbox forGranger causal connectivityanalysis,” Journal of Neuroscience Methods, vol. 186, no. 2, pp.262–273, 2010.
[23] A. K. Seth, “Measuring autonomy and emergence via Grangercausality,” Artificial Life, vol. 16, no. 2, pp. 179–196, 2010.
[24] A. J. Suminski, S. M. Rao, K. M. Mosier, and R. A. Scheidt,“Neural and electromyographic correlates of wrist posturecontrol,” Journal of Neurophysiology, vol. 97, no. 2, pp. 1527–1545,2007.
[25] E. Gerardin, A. Sirigu, S. Lehericy et al., “Partially overlappingneural networks for real and imagined hand movements,”Cerebral Cortex, vol. 10, no. 11, pp. 1093–1104, 2000.
[26] P. E. Roland, “Organization of motor control by the normalhuman brain,” Human Neurobiology, vol. 2, no. 4, pp. 205–216,1984.
[27] A. Wohlschlager, “Mental object rotation and the planning ofhand movements,” Perception and Psychophysics, vol. 63, no. 4,pp. 709–718, 2001.
[28] J. L. Chen and G. Schlaug, “Resting state interhemisphericmotor connectivity and white matter integrity correlate withmotor impairment in chronic stroke,” Frontiers in Neurology,vol. 4, article 178, 2013.
[29] A. Ferbert, A. Priori, J. C. Rothwell, B. L. Day, J. G. Colebatch,and C. D. Marsden, “Interhemispheric inhibition of the humanmotor cortex,” Journal of Physiology, vol. 453, pp. 525–546, 1992.
[30] F. Chollet, V. DiPiero, R. J. S. Wise, D. J. Brooks, R. J. Dolan,and R. S. J. Frackowiak, “The functional anatomy of motorrecovery after stroke in humans: a study with positron emissiontomography,” Annals of Neurology, vol. 29, no. 1, pp. 63–71, 1991.
[31] C. Weiller, F. Chollet, K. J. Friston, R. J. S. Wise, and R. S. J.Frackowiak, “Functional reorganization of the brain in recoveryfrom striatocapsular infarction in man,” Annals of Neurology,vol. 31, no. 5, pp. 463–472, 1992.
[32] M. Honda, T. Nagamine, H. Fukuyama, Y. Yonekura, J. Kimura,and H. Shibasaki, “Movement-related cortical potentials andregional cerebral blood flow change in patients with stroke aftermotor recovery,” Journal of the Neurological Sciences, vol. 146,no. 2, pp. 117–126, 1997.
[33] Y. Cao, K. P. George, J. R. Ewing, E. M. Vikingstad, and A. F.Johnson, “Neuroimaging of language and aphasia after stroke,”Journal of Stroke and Cerebrovascular Diseases, vol. 7, no. 4, pp.230–233, 1998.
[34] E.-M. Pool, A. K. Rehme, G. R. Fink, S. B. Eickhoff, and C.Grefkes, “Network dynamics engaged in the modulation ofmotor behavior in healthy subjects,” NeuroImage, vol. 82, pp.68–76, 2013.
[35] N. S. Ward, M. M. Brown, A. J. Thompson, and R. S. J.Frackowiak, “Neural correlates of motor recovery after stroke: alongitudinal fMRI study,” Brain, vol. 126, no. 11, pp. 2476–2496,2003.

Submit your manuscripts athttp://www.hindawi.com
Stem CellsInternational
Hindawi Publishing Corporationhttp://www.hindawi.com Volume 2014
Hindawi Publishing Corporationhttp://www.hindawi.com Volume 2014
MEDIATORSINFLAMMATION
of
Hindawi Publishing Corporationhttp://www.hindawi.com Volume 2014
Behavioural Neurology
EndocrinologyInternational Journal of
Hindawi Publishing Corporationhttp://www.hindawi.com Volume 2014
Hindawi Publishing Corporationhttp://www.hindawi.com Volume 2014
Disease Markers
Hindawi Publishing Corporationhttp://www.hindawi.com Volume 2014
BioMed Research International
OncologyJournal of
Hindawi Publishing Corporationhttp://www.hindawi.com Volume 2014
Hindawi Publishing Corporationhttp://www.hindawi.com Volume 2014
Oxidative Medicine and Cellular Longevity
Hindawi Publishing Corporationhttp://www.hindawi.com Volume 2014
PPAR Research
The Scientific World JournalHindawi Publishing Corporation http://www.hindawi.com Volume 2014
Immunology ResearchHindawi Publishing Corporationhttp://www.hindawi.com Volume 2014
Journal of
ObesityJournal of
Hindawi Publishing Corporationhttp://www.hindawi.com Volume 2014
Hindawi Publishing Corporationhttp://www.hindawi.com Volume 2014
Computational and Mathematical Methods in Medicine
OphthalmologyJournal of
Hindawi Publishing Corporationhttp://www.hindawi.com Volume 2014
Diabetes ResearchJournal of
Hindawi Publishing Corporationhttp://www.hindawi.com Volume 2014
Hindawi Publishing Corporationhttp://www.hindawi.com Volume 2014
Research and TreatmentAIDS
Hindawi Publishing Corporationhttp://www.hindawi.com Volume 2014
Gastroenterology Research and Practice
Hindawi Publishing Corporationhttp://www.hindawi.com Volume 2014
Parkinson’s Disease
Evidence-Based Complementary and Alternative Medicine
Volume 2014Hindawi Publishing Corporationhttp://www.hindawi.com