research article identification of phenolic acids and...
TRANSCRIPT
Research ArticleIdentification of Phenolic Acids and Flavonoids in MonofloralHoney from Bangladesh by High Performance LiquidChromatography: Determination of Antioxidant Capacity
Mohammed Moniruzzaman,1 Chua Yung An,1 Pasupuleti Visweswara Rao,2,3
Mohammad Nurul Islam Hawlader,4 Siti Amirah Binti Mohd Azlan,1
Siti Amrah Sulaiman,1 and Siew Hua Gan2
1 Department of Pharmacology, School of Medical Sciences, Universiti Sains Malaysia, 16150 Kubang Kerian, Kelantan, Malaysia2Human Genome Centre, School of Medical Sciences, Universiti Sains Malaysia, 16150 Kubang Kerian, Kelantan, Malaysia3 Faculty of Agro Based Industry, Universiti Malaysia Kelantan, Jeli Campus, Locked Bag No. 100, 17600 Jeli, Kelantan, Malaysia4Department of Biochemistry and Molecular Biology, Faculty of Biological Sciences, Jahangirnagar University,Savar, Dhaka 1342, Bangladesh
Correspondence should be addressed to Mohammed Moniruzzaman; [email protected] and Siew Hua Gan; [email protected]
Received 3 March 2014; Revised 15 May 2014; Accepted 21 May 2014; Published 24 June 2014
Academic Editor: Hongjuan Liu
Copyright © 2014 Mohammed Moniruzzaman et al. This is an open access article distributed under the Creative CommonsAttribution License, which permits unrestricted use, distribution, and reproduction in any medium, provided the original work isproperly cited.
The aim of the present study was to characterize the phenolic acids, flavonoids, and antioxidant properties of monofloral honeycollected from five different districts in Bangladesh. A new high performance liquid chromatography (HPLC) equipped with aUV detector method was developed for the identification of the phenolic acids and flavonoids. A total of five different phenolicacids were identified, with the most abundant being caffeic acid, benzoic acid, gallic acid, followed by chlorogenic acid and trans-cinnamic acid. The flavonoids, kaempferol, and catechin were most abundant, followed by myricetin and naringenin. The meanmoisture content, total sugar content, and color characteristics of the honey samples were 18.36 ± 0.95%, 67.40 ± 5.63 g/100 g, and129.27 ± 34.66mm Pfund, respectively. The mean total phenolic acids, total flavonoid content, and proline content were 199.20 ±135.23, 46.73 ± 34.16, and 556.40 ± 376.86mg/kg, respectively, while the mean FRAP values and DPPH radical scavenging activitywere 327.30 ± 231.87 𝜇MFe (II)/100 g and 36.95 ± 20.53%, respectively. Among the different types of honey, kalijira exhibited thehighest phenolics and antioxidant properties. Overall, our study confirms that all the investigated honey samples are good sourcesof phenolic acids and flavonoids with good antioxidant properties.
1. Introduction
Honey is a natural product consisting of a highly concen-trated solution of a complex mixture of sugar and minutequantities of other constituents, such as minerals, proteins,vitamins, organic acids, flavonoids, phenolic acids, enzymes,and volatile compounds [1, 2]. The quantity of these differentcompounds varies greatly depending on the floral and geo-graphical origin of the honey. Additionally, the compositionof honey is influenced by processing, handling, and storagetime [3, 4].
The components in honey reported to be responsible forits antioxidant effects are flavonoids, phenolic acids, ascorbicacid, catalase, peroxidase, carotenoids, and the products ofMaillard reactions [2, 4]. However, the amount and typeof these antioxidants are largely dependent on the floralsource or honey variety and a correlation between antioxidantactivity and total phenolic content has been established [4].
Bangladesh is a country with a subtropical monsoonclimate and experiences wide seasonal variations in rainfall,moderately warm temperatures, and high humidity. Honeyhas been used traditionally over the years by the people
Hindawi Publishing CorporationBioMed Research InternationalVolume 2014, Article ID 737490, 11 pageshttp://dx.doi.org/10.1155/2014/737490
2 BioMed Research International
of Bangladesh as food and as a traditional medicine inthe treatment of several diseases. Although honey is widelyconsumed by locals, very few data are available to supportthemedicinal claims of different types of honey samples fromBangladesh. Several types of honey, such asmustard (Brassicanigra), Kalijira (Nigella sativa), Padma flower (Nelumbonucifera), sesame (Sesamum indicum), drumstick (Moringaoleifera), blackberry (Syzygium cumini), and lychee (Litchichinensis), are available in Bangladesh. Although honey iswidely consumed in Bangladesh, few data are available onthe quality of commonly consumed honey. Investigations ofhoney samples collected from different floral sources andgeographic locations are necessary to provide local data. Fur-thermore, the data available for honey reported from othercountries are not applicable to Bangladesh because honeyvaries in antioxidant capacity, physicochemical properties,and composition based on its floral sources. In this study,we aimed to investigate different types of honey samplescollected from different regions in Bangladesh and to identifythe different phenolic acids, flavonoids, and antioxidant prop-erties of some monofloral honey samples from Bangladesh.To the best of our knowledge, this is the first study toextensively investigate the different types of antioxidantspresent in various types of honey samples from Bangladesh.
2. Materials and Methods
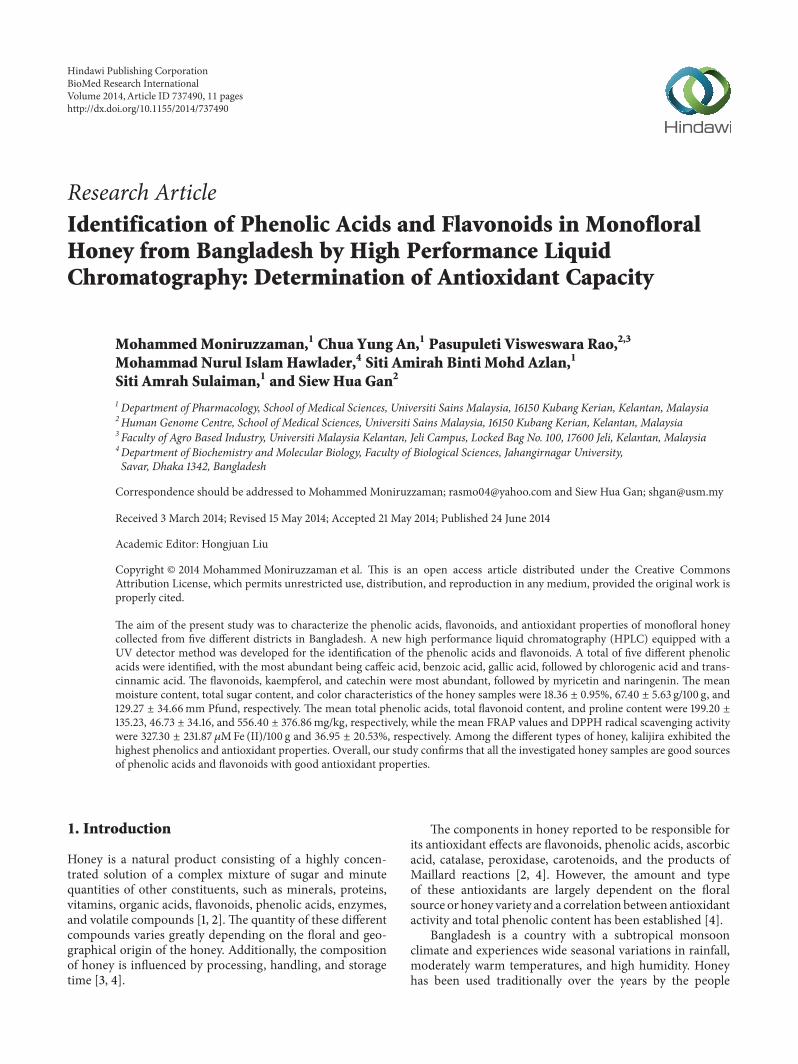
2.1. Honey Samples. A total of ten monofloral honey (𝑛 = 10)samples (BH-1 to BH-10) were collected from eight differentlocations in five different districts (Tangail, Jamalpur, Khulna,Madaripur, and Munshigonj) in Bangladesh (Figure 1). Thedetails of the honey, including the honey’s local and scientificnames, are described in Table 1. All honey collections wereperformed between January andDecember 2012.The sampleswere refrigerated (4-5∘C) in airtight plastic containers untilfurther analysis. All analyses were conducted in triplicate.
2.2. Chemicals and Reagents. The phenolic acids (gal-lic, syringic, caffeic, vanillic, benzoic, and trans-cinnamicacids) and flavonoids (catechin, naringenin, luteolin, hes-peretin, kaempferol, apigenin, and naringin), 2,2-diphenyl-1-picrylhydrazyl (DPPH), 2,4,6-tris(1-pyridyl)-1,3,5-triazine(TPTZ), Folin-Ciocalteu’s reagent, and gallic acid were pur-chased from Sigma-Aldrich (St. Louis, MO, USA). Sodiumcarbonate (Na
2CO3), aluminum chloride (AlCl
3), sodium
nitrite (NaNO2), and sodium hydroxide (NaOH) were pur-
chased from Merck (Darmstadt, Germany). All chemicalswere of analytical grade.
2.3. Physical Analysis
2.3.1. Moisture Content. The moisture content was deter-mined by using a refractometric method. In general, therefractive index increaseswith an increase in the solid contentof the sample. The refractive indices of honey samples weremeasured at ambient temperature using an Atago hand-held refractometer (KRUSS, HRH30, Hamburg, Germany).
Bangladesh
Sample locations
JamalpurTangail
Munshiganj
Madaripur
Khulna
Figure 1: Sources of honey.
The measurements were further corrected for the stan-dard temperature of 20∘C by adding a correction factor of0.00023/∘C. The moisture content was measured in triplicateand the percentage of moisture content that corresponds tothe corrected refractive index was calculated using Wed-more’s table [5].
2.3.2. Total Sugar Content. Honey was suspended in Milli-Q water to make a 25% (w/v) solution. The total sugarcontent of each honey sample was then determined usinga refractometric method (Atago handheld refractometer,ATAGO, N-1𝛼, Tokyo, Japan). The percentage of sucrosecontent was measured per g/mL of honey.
2.3.3. Honey Color Analysis. The color intensity of honeysamples was measured according to the Pfund classifier.Briefly, homogeneous honey samples devoid of air bubbleswere transferred into a cuvette with a 10mm light path untilthe cuvette was approximately half full. The cuvette wasinserted into a color photometer (HI 96785, Hanna Instru-ment, Cluj County, Romania). Color grades were expressedin millimeter (mm) Pfund grades when compared to ananalytical-grade glycerol standard. Measurements were per-formed in triplicate for each sample using the approved colorstandards of the United States Department of Agriculture(USDA) [6].
BioMed Research International 3
Table 1: Floral type and source of the investigated Bangladeshi monofloral honey.
Sample ID number Local and scientific name of source Location of source Time of collectionBH-1 Mustard flower (Brassica nigra) Mirzapur, Tangail December 2012BH-2 Mustard flower (Brassica nigra) Melandah, Jamalpur February 2012BH-3 Kalijira (Nigella sativa) Khulna Sadar, Khulna March 2012BH-4 Padma flower (Nelumbo nucifera) Khalishpur, Khulna March 2012BH-5 Mustard flower (Brassica nigra) Shakipur, Tangail December 2012BH-6 Mustard flower (Brassica nigra) Shakipur, Tangail November 2012BH-7 Mustard flower (Brassica nigra) Shakipur, Tangail December 2012BH-8 Teel/sesame (Sesamum indicum) Kalkini, Madaripur June 2012BH-9 Mustard flower (Brassica nigra) Tangail Sadar, Tangail January 2012BH-10 Mustard flower (Brassica nigra) Gazaria, Munshigonj May 2012
2.3.4. Color Intensity (ABS450
). The mean absorbance ofhoney sampleswas determined using themethod of Beretta etal. [7]. Briefly, honey samples were diluted to 50% (w/v) withwarm (45–50∘C) Milli-Q water and the resulting solutionwas filtered using a 0.45𝜇m filter to remove large particles.The absorbance was measured at 450 and 720 nm usinga spectrophotometer and the difference in absorbance wasexpressed as mAU.
2.4. Analysis of Antioxidant Properties
2.4.1. Determination of Total Phenolic Compounds. The con-centration of phenolic compounds in honey samples was esti-mated using a modified spectrophotometric Folin-Ciocalteumethod [8]. Briefly, 1mL of honey extract was mixed with1mL of Folin and Ciocalteu’s phenol reagent. After 3min,1mL of Na
2CO3(10%) solution was added to the mixture
and adjusted to 10mL with distilled water. The reaction waskept in the dark for 90min, after which the absorbance wasread at 725 nm using a T 60 UV/VIS spectrophotometer (PGInstruments Ltd., UK). Gallic acid was used to calculate astandard curve (20, 40, 60, 80, and 100 𝜇g/mL; 𝑟2 = 0.996).The concentration of phenolic compounds was measuredin triplicate. The results were reported as mean ± standarddeviation and expressed as mg of gallic acid equivalents(GAEs) per kg of honey.
2.4.2. Determination of Total Flavonoid Content. The totalflavonoid content in each honey sample was measured usingthe colorimetric assay developed by Zhishen et al. [9]. Honeyextract (1mL) was mixed with 4mL of distilled water. At thebaseline, 0.3mL of NaNO
2(5%, w/v) was added. After five
min, 0.3mL of AlCl3(10% w/v) was added, followed by the
addition of 2mL of NaOH (1M) 6min later. The volume wasthen increased to 10mL by the addition of 2.4mL distilledwater.Themixture was vigorously shaken to ensure adequatemixing and the absorbance was read at 510 nm. A calibrationcurve was created using a standard solution of catechin (20,40, 60, 80, and 100 𝜇g/mL; 𝑟2 = 0.998). The results wereexpressed as mg catechin equivalents (CEQ) per kg of honey.
2.4.3. Ferric Reducing/Antioxidant Power Assay (FRAPAssay).The FRAP assay was performed according to a modifiedmethod described by Benzie and Strain [10]. Briefly, 200𝜇Lof properly diluted honey (0.1 g/mL) was mixed with 1.5mLof FRAP reagent.The reaction mixture was then incubated at37∘C for 4min and its absorbance was read at 593 nm againsta blank that was prepared with distilled water. Fresh FRAPreagent was prepared by mixing 10 volumes of 300mM/Lacetate buffer (pH 3.6) with 1 volume of 10mM TPTZsolution in 40mM HCl containing 1 volume of 20mMferric chloride (FeCl
3⋅6H2O).The resulting mixture was then
prewarmed at 37∘C. A calibration curve was prepared usingan aqueous solution of ferrous sulfate (FeSO
4⋅7H2O) at 100,
200, 400, 600, and 1000 𝜇M. FRAP values were expressedas micromoles of ferrous equivalent (𝜇M Fe [II]) per kg ofhoney.
2.4.4. DPPH Free Radical-Scavenging Activity. The antioxi-dant properties of each honey sample were also investigatedby determining the free radical-scavenging activity of theDPPH radical based on the method proposed by Ferreiraet al. [11]. Briefly, honey extract (0.5mL) was mixed with2.7mL of methanolic solution containing DPPH radicals(0.024mg/mL).Themixturewas vigorously shaken and left tostand for 15min in the dark (until the absorbance stabilized).The reduction of the DPPH radical was determined bymeasuring the absorbance of the mixture at 517 nm.
Butylated hydroxytoluene (BHT) was used as a reference.The radical-scavenging activity (RSA) was calculated asthe percentage of DPPH discoloration using the followingequation: % RSA = ([𝐴DPPH − 𝐴𝑆]/𝐴DPPH) × 100, where 𝐴𝑆is the absorbance of the solution when the sample extract isadded at a particular level and𝐴DPPH is the absorbance of theDPPH solution.
2.4.5. Proline Content. The proline content in the honeysamples was measured using a method established by theInternationalHoneyCommission (IHC) [12]. Briefly, approx-imately 5 g of honey was transferred to a beaker and dissolvedin 50mLwater.The solution was quantitatively transferred toa 100mL volumetric flask before further dilution to 100mL
4 BioMed Research International
with distilled water. After that, approximately 0.5mL of thesample solution was transferred to a tube, while 0.5mL ofwater (blank test) was transferred to a second tube and0.5mL of proline standard solution was dispensed into threeother tubes. To each tube, approximately 1mL of formicacid and 1mL of ninhydrin solution were added. The tubeswere capped carefully and shaken vigorously for 15min. Thetubes were then placed in a boiling water bath for 15minand immersed below the level of the solution. The tubeswere further transferred to another water bath and incubatedat 70∘C for 10min. Approximately 5mL of the 2-propanolwater solution was added to each tube followed by immediatecapping.The tubes were left to cool for approximately 45minafter removal from the 70∘C water bath and the absorbancevalues were measured at 510 nm (near the maximum wave-length).
2.5. HPLC Analysis of Phenolic Acids and Flavonoids
2.5.1. Extraction of Phenolic Compounds. A modified solid-phase extraction (SPE) procedure was developed to extractthe phenolic compounds present in honey. Briefly, honey (2 g)was dissolved in 10mL of acidified deionized water (pH 2)that was pH adjusted using orthophosphoric acid (85%) andthe solution was run through Bond Elut C18 cartridges (3mL× 500mg) (Agilent Technologies, Santa Clara, CA, USA).The cartridges were preconditioned by sequentially passing3mL of methanol followed by the addition of acidified water(pH 2) dropwise. An aqueous honey solution (5mL) wasthen applied to the preconditioned cartridges drop by dropto ensure efficient adsorption of the investigated compoundsto the bonded phase. The adsorbed phenolic compoundswere then eluted from the cartridges with 2mL of 90% (v/v)methanol/water solution dropwise.The eluates were collectedand evaporated to dryness under a gentle flow of nitrogen gas.Finally, the extract was reconstituted with 1mL of methanolbefore HPLC analysis.
2.5.2. HPLC Analysis. A new HPLC method was developedfor the detection of phenolic acids and flavonoids by employ-ing an HPLC system (Waters 2695, Milford, MA, USA)equipped with a photodiode array detector (Waters 2996).The HPLC column was a Merck Purospher Star, RP-18e (150× 4.6mm, 5𝜇m), fitted with a guard cartridge that had beenpacked with a similar type of stationary phase (Merck). Alinear gradient flowwas employed at a flow rate of 0.5mL/minthroughout and the total analytical time was approximately40min.
The binary mobile phase consisted of solvent A (ultra-pure water with 0.1% phosphoric acid) and solvent B (puremethanol with 0.1% phosphoric acid). Elution from thecolumn was achieved with the following gradients: 0 to20min of solvent B, increasing from 10% to 85%; 20 to 25minof solvent B at 85% throughout; 25 to 26min of solvent Bfrom 85% decreasing to 10%; and a final composition at 10%that was kept constant to 40min. The detection wavelengthwas set between 200 and 450 nm, with specific monitoringconducted at 220 nm. Identification of the phenolic and
flavonoid compounds was performed by comparing theretention times of the analytes with reference standards.
2.6. Statistical Analysis. Assays were performed in triplicateand the results were expressed as the mean values with stan-dard deviations (SD). The significant differences representedby letters were obtained by a one-way analysis of variance(ANOVA) followed by Tukey’s honestly significant difference(HSD) post hoc test (𝑃 < 0.05). Correlations were establishedusing Pearson’s correlation coefficient (𝑟) in bivariate linearcorrelations (𝑃 < 0.01). These correlations were calculatedusingMicrosoft office Excel 2007 and SPSS version 16.0 (IBMcorporation, New York, USA).
3. Results and Discussion
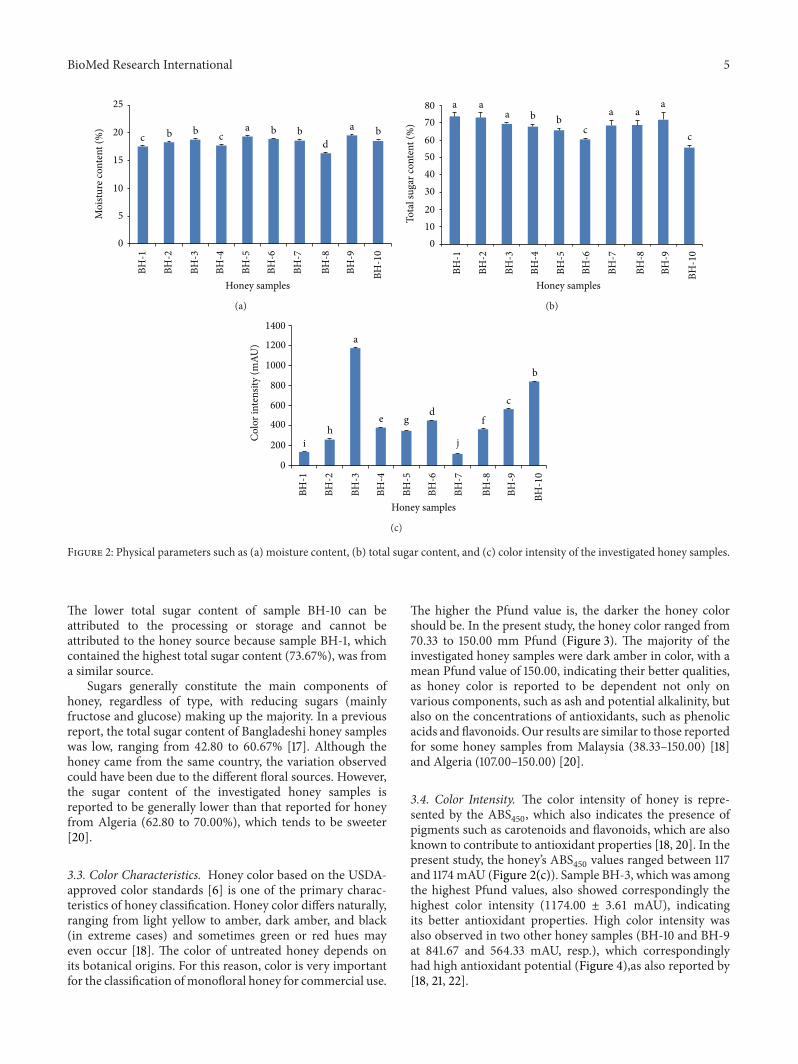
3.1. Moisture Content. Moisture is a physicochemical param-eter of honey associated with the climatic conditions of thelocation from which the honey was gathered as well as thedegree of honey maturity [13]. It is one of the key factorsthat determine the quality of honey. In the present investi-gation, the moisture content was between 16.33 and 19.53%(Figure 2(a)), which was within the limit of ≤20% set by theinternational regulations for honey quality [14].Themoisturecontent present in honey samples is important because itcontributes to the honey’s ability to resist fermentation andcrystallization during storage [15, 16].
Significant variations in moisture content were observedin the investigated monofloral honey. The mean moisturecontent was 18.36 ± 0.95%, with the lowest moisture content(16.33%) exhibited by sample BH-8, which was collected inJune 2012, while sample BH-9 exhibited the highest moisturecontent (19.53%). Low moisture content in honey can confera protective effect against microbial attack, especially duringlong term storage [15, 16]. On the other hand, high moisturecontent can promote honey fermentation during storageas a result of the activity of osmotolerant yeasts and theconsequent formation of ethyl alcohol and carbon dioxide[16]. The lower moisture content exhibited by most of theinvestigated honey samples ensures the better quality of thesehoney samples, which allows them to be stored for a longerduration.
The moisture contents of the analyzed samples wereconsistent with previously reported values of honey samplesfrom Bangladesh of 12.79% to 22.32% [17]. Moreover, themoisture contents for the investigated honey samples weresimilar to those from countries of similar climates, includinghoney from India (17.20 to 21.60%) [16] and Malaysia (14.86–17.53%) [18].
3.2. Total Sugar Content. The total sugar content of theinvestigated honey samples ranged from 55.67 to 73.67%,with a mean value of 67.40 ± 5.63% (Figure 2(b)). Accordingto the European Commission directive, the total glucoseand fructose content of honey should exceed 60 g per 100 gof honey for natural honey [19]. All of the investigatedhoney samples contained total sugar contents higher thanthe recommended level, except for sample BH-10 (55.67%).
BioMed Research International 5
c b b ca b b
da b
0
5
10
15
20
25M
oistu
re co
nten
t (%
)
Honey samples
BH-1
BH-2
BH-3
BH-4
BH-5
BH-6
BH-7
BH-8
BH-9
BH-10
(a)
Honey samples
a aa b b
c
a aa
c
0
10
20
30
40
50
60
70
80
Tota
l sug
ar co
nten
t (%
)
BH-1
BH-2
BH-3
BH-4
BH-5
BH-6
BH-7
BH-8
BH-9
BH-10
(b)
Honey samples
ih
a
e gd
j
f
c
b
0
200
400
600
800
1000
1200
1400
Col
or in
tens
ity (m
AU)
BH-1
BH-2
BH-3
BH-4
BH-5
BH-6
BH-7
BH-8
BH-9
BH-10
(c)
Figure 2: Physical parameters such as (a) moisture content, (b) total sugar content, and (c) color intensity of the investigated honey samples.
The lower total sugar content of sample BH-10 can beattributed to the processing or storage and cannot beattributed to the honey source because sample BH-1, whichcontained the highest total sugar content (73.67%), was froma similar source.
Sugars generally constitute the main components ofhoney, regardless of type, with reducing sugars (mainlyfructose and glucose) making up the majority. In a previousreport, the total sugar content of Bangladeshi honey sampleswas low, ranging from 42.80 to 60.67% [17]. Although thehoney came from the same country, the variation observedcould have been due to the different floral sources. However,the sugar content of the investigated honey samples isreported to be generally lower than that reported for honeyfrom Algeria (62.80 to 70.00%), which tends to be sweeter[20].
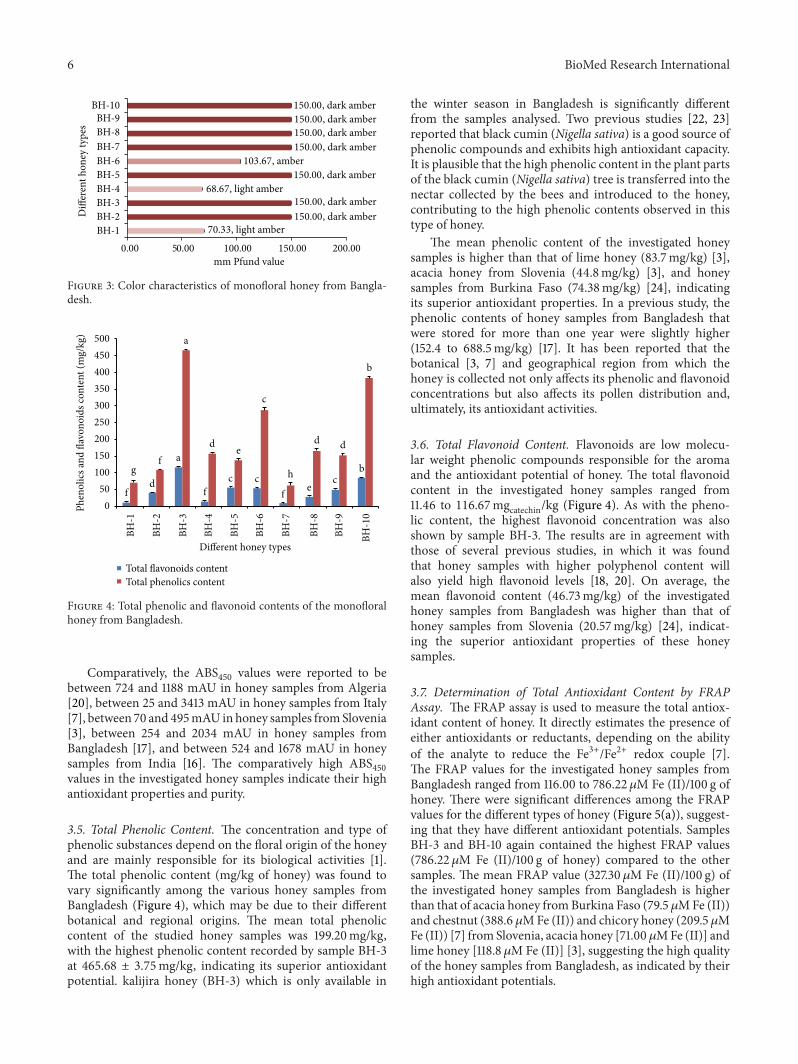
3.3. Color Characteristics. Honey color based on the USDA-approved color standards [6] is one of the primary charac-teristics of honey classification. Honey color differs naturally,ranging from light yellow to amber, dark amber, and black(in extreme cases) and sometimes green or red hues mayeven occur [18]. The color of untreated honey depends onits botanical origins. For this reason, color is very importantfor the classification ofmonofloral honey for commercial use.
The higher the Pfund value is, the darker the honey colorshould be. In the present study, the honey color ranged from70.33 to 150.00 mm Pfund (Figure 3). The majority of theinvestigated honey samples were dark amber in color, with amean Pfund value of 150.00, indicating their better qualities,as honey color is reported to be dependent not only onvarious components, such as ash and potential alkalinity, butalso on the concentrations of antioxidants, such as phenolicacids and flavonoids. Our results are similar to those reportedfor some honey samples from Malaysia (38.33–150.00) [18]and Algeria (107.00–150.00) [20].
3.4. Color Intensity. The color intensity of honey is repre-sented by the ABS
450, which also indicates the presence of
pigments such as carotenoids and flavonoids, which are alsoknown to contribute to antioxidant properties [18, 20]. In thepresent study, the honey’s ABS
450values ranged between 117
and 1174 mAU (Figure 2(c)). Sample BH-3, which was amongthe highest Pfund values, also showed correspondingly thehighest color intensity (1174.00 ± 3.61 mAU), indicatingits better antioxidant properties. High color intensity wasalso observed in two other honey samples (BH-10 and BH-9at 841.67 and 564.33 mAU, resp.), which correspondinglyhad high antioxidant potential (Figure 4),as also reported by[18, 21, 22].
6 BioMed Research International
0.00 50.00 100.00 200.00
mm Pfund value
Diff
eren
t hon
ey ty
pes
BH-1BH-2BH-3BH-4BH-5BH-6BH-7BH-8BH-9
BH-10
150.00
150.00, dark amber150.00, dark amber150.00, dark amber150.00, dark amber
150.00, dark amber
150.00, dark amber150.00, dark amber
103.67, amber
68.67, light amber
70.33, light amber
Figure 3: Color characteristics of monofloral honey from Bangla-desh.
fd
a
fc c
f ec
bgf
a
d e
c
h
d d
b
0
50
100
150
200
250
300
350
400
450
500
Different honey types
Total flavonoids contentTotal phenolics content
Phen
olic
s and
flav
onoi
ds co
nten
t (m
g/kg
)
BH-1
BH-2
BH-3
BH-4
BH-5
BH-6
BH-7
BH-8
BH-9
BH-10
Figure 4: Total phenolic and flavonoid contents of the monofloralhoney from Bangladesh.
Comparatively, the ABS450
values were reported to bebetween 724 and 1188 mAU in honey samples from Algeria[20], between 25 and 3413 mAU in honey samples from Italy[7], between 70 and 495mAU inhoney samples fromSlovenia[3], between 254 and 2034 mAU in honey samples fromBangladesh [17], and between 524 and 1678 mAU in honeysamples from India [16]. The comparatively high ABS
450
values in the investigated honey samples indicate their highantioxidant properties and purity.
3.5. Total Phenolic Content. The concentration and type ofphenolic substances depend on the floral origin of the honeyand are mainly responsible for its biological activities [1].The total phenolic content (mg/kg of honey) was found tovary significantly among the various honey samples fromBangladesh (Figure 4), which may be due to their differentbotanical and regional origins. The mean total phenoliccontent of the studied honey samples was 199.20mg/kg,with the highest phenolic content recorded by sample BH-3at 465.68 ± 3.75mg/kg, indicating its superior antioxidantpotential. kalijira honey (BH-3) which is only available in
the winter season in Bangladesh is significantly differentfrom the samples analysed. Two previous studies [22, 23]reported that black cumin (Nigella sativa) is a good source ofphenolic compounds and exhibits high antioxidant capacity.It is plausible that the high phenolic content in the plant partsof the black cumin (Nigella sativa) tree is transferred into thenectar collected by the bees and introduced to the honey,contributing to the high phenolic contents observed in thistype of honey.
The mean phenolic content of the investigated honeysamples is higher than that of lime honey (83.7mg/kg) [3],acacia honey from Slovenia (44.8mg/kg) [3], and honeysamples from Burkina Faso (74.38mg/kg) [24], indicatingits superior antioxidant properties. In a previous study, thephenolic contents of honey samples from Bangladesh thatwere stored for more than one year were slightly higher(152.4 to 688.5mg/kg) [17]. It has been reported that thebotanical [3, 7] and geographical region from which thehoney is collected not only affects its phenolic and flavonoidconcentrations but also affects its pollen distribution and,ultimately, its antioxidant activities.
3.6. Total Flavonoid Content. Flavonoids are low molecu-lar weight phenolic compounds responsible for the aromaand the antioxidant potential of honey. The total flavonoidcontent in the investigated honey samples ranged from11.46 to 116.67mgcatechin/kg (Figure 4). As with the pheno-lic content, the highest flavonoid concentration was alsoshown by sample BH-3. The results are in agreement withthose of several previous studies, in which it was foundthat honey samples with higher polyphenol content willalso yield high flavonoid levels [18, 20]. On average, themean flavonoid content (46.73mg/kg) of the investigatedhoney samples from Bangladesh was higher than that ofhoney samples from Slovenia (20.57mg/kg) [24], indicat-ing the superior antioxidant properties of these honeysamples.
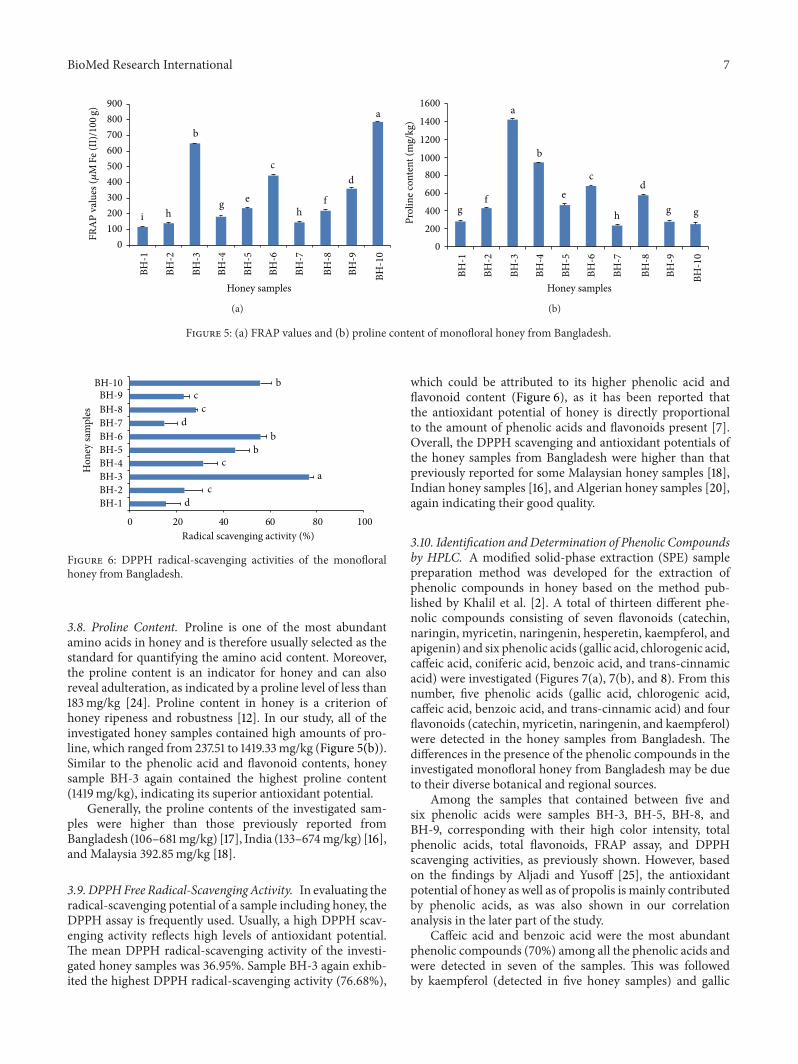
3.7. Determination of Total Antioxidant Content by FRAPAssay. The FRAP assay is used to measure the total antiox-idant content of honey. It directly estimates the presence ofeither antioxidants or reductants, depending on the abilityof the analyte to reduce the Fe3+/Fe2+ redox couple [7].The FRAP values for the investigated honey samples fromBangladesh ranged from 116.00 to 786.22 𝜇M Fe (II)/100 g ofhoney. There were significant differences among the FRAPvalues for the different types of honey (Figure 5(a)), suggest-ing that they have different antioxidant potentials. SamplesBH-3 and BH-10 again contained the highest FRAP values(786.22 𝜇M Fe (II)/100 g of honey) compared to the othersamples. The mean FRAP value (327.30 𝜇M Fe (II)/100 g) ofthe investigated honey samples from Bangladesh is higherthan that of acacia honey fromBurkina Faso (79.5 𝜇MFe (II))and chestnut (388.6 𝜇MFe (II)) and chicory honey (209.5𝜇MFe (II)) [7] from Slovenia, acacia honey [71.00 𝜇MFe (II)] andlime honey [118.8 𝜇M Fe (II)] [3], suggesting the high qualityof the honey samples from Bangladesh, as indicated by theirhigh antioxidant potentials.
BioMed Research International 7
i h
b
g e
c
hf
d
a
0
100
200
300
400
500
600
700
800
900
Honey samples
BH-1
BH-2
BH-3
BH-4
BH-5
BH-6
BH-7
BH-8
BH-9
BH-10
FRA
P va
lues
(𝜇M
Fe (I
I)/100
g)
(a)
gf
a
b
e
c
h
d
g g
0
200
400
600
800
1000
1200
1400
1600
Prol
ine c
onte
nt (m
g/kg
)
Honey samples
BH-1
BH-2
BH-3
BH-4
BH-5
BH-6
BH-7
BH-8
BH-9
BH-10
(b)
Figure 5: (a) FRAP values and (b) proline content of monofloral honey from Bangladesh.
dc
ac
bb
dc
cb
0 20 40 60 80 100
Radical scavenging activity (%)
Hon
ey sa
mpl
es
BH-1BH-2BH-3BH-4BH-5BH-6BH-7BH-8BH-9
BH-10
Figure 6: DPPH radical-scavenging activities of the monofloralhoney from Bangladesh.
3.8. Proline Content. Proline is one of the most abundantamino acids in honey and is therefore usually selected as thestandard for quantifying the amino acid content. Moreover,the proline content is an indicator for honey and can alsoreveal adulteration, as indicated by a proline level of less than183mg/kg [24]. Proline content in honey is a criterion ofhoney ripeness and robustness [12]. In our study, all of theinvestigated honey samples contained high amounts of pro-line, which ranged from 237.51 to 1419.33mg/kg (Figure 5(b)).Similar to the phenolic acid and flavonoid contents, honeysample BH-3 again contained the highest proline content(1419mg/kg), indicating its superior antioxidant potential.
Generally, the proline contents of the investigated sam-ples were higher than those previously reported fromBangladesh (106–681mg/kg) [17], India (133–674mg/kg) [16],and Malaysia 392.85mg/kg [18].
3.9. DPPHFree Radical-ScavengingActivity. In evaluating theradical-scavenging potential of a sample including honey, theDPPH assay is frequently used. Usually, a high DPPH scav-enging activity reflects high levels of antioxidant potential.The mean DPPH radical-scavenging activity of the investi-gated honey samples was 36.95%. Sample BH-3 again exhib-ited the highest DPPH radical-scavenging activity (76.68%),
which could be attributed to its higher phenolic acid andflavonoid content (Figure 6), as it has been reported thatthe antioxidant potential of honey is directly proportionalto the amount of phenolic acids and flavonoids present [7].Overall, the DPPH scavenging and antioxidant potentials ofthe honey samples from Bangladesh were higher than thatpreviously reported for some Malaysian honey samples [18],Indian honey samples [16], and Algerian honey samples [20],again indicating their good quality.
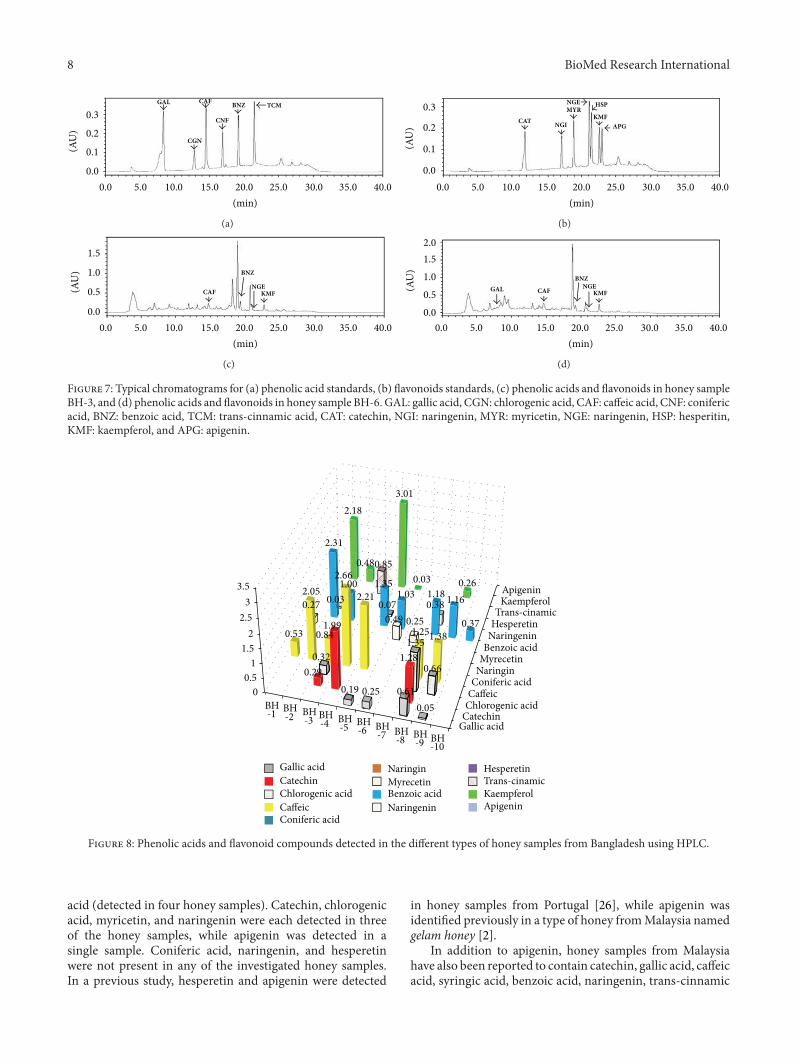
3.10. Identification and Determination of Phenolic Compoundsby HPLC. A modified solid-phase extraction (SPE) samplepreparation method was developed for the extraction ofphenolic compounds in honey based on the method pub-lished by Khalil et al. [2]. A total of thirteen different phe-nolic compounds consisting of seven flavonoids (catechin,naringin, myricetin, naringenin, hesperetin, kaempferol, andapigenin) and six phenolic acids (gallic acid, chlorogenic acid,caffeic acid, coniferic acid, benzoic acid, and trans-cinnamicacid) were investigated (Figures 7(a), 7(b), and 8). From thisnumber, five phenolic acids (gallic acid, chlorogenic acid,caffeic acid, benzoic acid, and trans-cinnamic acid) and fourflavonoids (catechin, myricetin, naringenin, and kaempferol)were detected in the honey samples from Bangladesh. Thedifferences in the presence of the phenolic compounds in theinvestigated monofloral honey from Bangladesh may be dueto their diverse botanical and regional sources.
Among the samples that contained between five andsix phenolic acids were samples BH-3, BH-5, BH-8, andBH-9, corresponding with their high color intensity, totalphenolic acids, total flavonoids, FRAP assay, and DPPHscavenging activities, as previously shown. However, basedon the findings by Aljadi and Yusoff [25], the antioxidantpotential of honey as well as of propolis is mainly contributedby phenolic acids, as was also shown in our correlationanalysis in the later part of the study.
Caffeic acid and benzoic acid were the most abundantphenolic compounds (70%) among all the phenolic acids andwere detected in seven of the samples. This was followedby kaempferol (detected in five honey samples) and gallic
8 BioMed Research International
0.0
GAL
CGN
CAF
CNF
BNZ TCM
(min)
0.3
0.2
0.1
0.0
5.0 10.0 15.0 20.0 25.0 30.0 35.0 40.0
(AU
)
(a)
CAT NGI
MYRNGE HSP
KMFAPG
0.0
(min)
0.3
0.2
0.1
0.0
5.0 10.0 15.0 20.0 25.0 30.0 35.0 40.0
(AU
)
(b)
CAF
BNZ
NGEKMF
0.0
(min)
1.5
1.0
0.5
0.0
5.0 10.0 15.0 20.0 25.0 30.0 35.0 40.0
(AU
)
(c)
GAL CAF
BNZNGE
KMF
0.0
(min)
2.0
0.5
1.5
1.0
0.0
5.0 10.0 15.0 20.0 25.0 30.0 35.0 40.0
(AU
)
(d)
Figure 7: Typical chromatograms for (a) phenolic acid standards, (b) flavonoids standards, (c) phenolic acids and flavonoids in honey sampleBH-3, and (d) phenolic acids and flavonoids in honey sample BH-6. GAL: gallic acid, CGN: chlorogenic acid, CAF: caffeic acid, CNF: conifericacid, BNZ: benzoic acid, TCM: trans-cinnamic acid, CAT: catechin, NGI: naringenin, MYR: myricetin, NGE: naringenin, HSP: hesperitin,KMF: kaempferol, and APG: apigenin.
Gallic acid
CatechinChlorogenic acidCaffeicConiferic acidNaringinMyrecetinBenzoic acidNaringeninHesperetinTrans-cinamic
KaempferolApigenin
Apigenin
0
0.5
1
1.5
2
2.5
3
3.5
0.61
0.05
0.29
1.99
1.280.32
1.35
0.66
0.53
2.05
0.84
2.66
2.210.27
0.49
0.25
2.31
1.00 1.351.03
0.37
0.030.07 0.38
0.85
2.18
0.48
3.01
0.03 0.26
Gallic acid
CatechinChlorogenic acidCaffeicConiferic acid
NaringinMyrecetinBenzoic acidNaringenin
HesperetinTrans-cinamicKaempferol
1.181.16
1.38
0.251.25
0.19
BH-1 BH
-2 BH-3 BH
-4 BH-5 BH
-6 BH-7 BH
-8 BH-9 BH
-10
Figure 8: Phenolic acids and flavonoid compounds detected in the different types of honey samples from Bangladesh using HPLC.
acid (detected in four honey samples). Catechin, chlorogenicacid, myricetin, and naringenin were each detected in threeof the honey samples, while apigenin was detected in asingle sample. Coniferic acid, naringenin, and hesperetinwere not present in any of the investigated honey samples.In a previous study, hesperetin and apigenin were detected
in honey samples from Portugal [26], while apigenin wasidentified previously in a type of honey fromMalaysia namedgelam honey [2].
In addition to apigenin, honey samples from Malaysiahave also been reported to contain catechin, gallic acid, caffeicacid, syringic acid, benzoic acid, naringenin, trans-cinnamic
BioMed Research International 9
acid, and kaempferol apigenin [2]. In another study, gelamand coconut honey samples from Malaysia were found tocontain gallic, caffeic, benzoic, ferulic, and cinnamic acids[25]. Honey samples fromAustralia contained gallic acid, caf-feic acid, chlorogenic acid, myricetin, kaempferol, coumaricacid, ferulic acid, and quercetin [27]. Honey samples fromPortugal contained coumaric acid, ferulic acid, quercetin,vanillic acid, rosmarinic acid, and kaempferol [26, 28]. Thevariations observed may be due to the different botanicalsources of honey from Bangladesh compared with honeyfrom other parts of the world.
Kaempferol, gallic acid, and catechin are well known fortheir antioxidant properties, as described in previous studies[25, 28].The phenolic compounds present in the investigatedhoney samples from Bangladesh possess several medicinalproperties, such as antioxidant, antibacterial, and antimicro-bial properties. In particular, benzoic acid, chlorogenic acid,and caffeic acid were found to exhibit antibacterial properties[25, 28].
The most abundant phenolic acids were caffeic acid(0.00–2.66mg/kg), benzoic acid (0.00–2.31mg/kg), gallicacid (0.00–0.61mg/kg) and chlorogenic acid (0.00–1.35mg/kg), followed by trans-cinnamic acid (0.00–0.85mg/kg). The gallic acid contents in the investigatedBangladeshi honey are similar to those of honey samplesreported fromMalaysia (0.43mg/kg) [2] but lower than thoseof Australian honey (1.58mg/100 g) [27], while chlorogenicacid was detected in Polish honey at 0.098 to 3.342mg/100 g[29]. Similar to our findings, trans-cinnamic acid wasreported at 0.01 to 0.50mg/kg in Malaysian honey samples[2]. Benzoic acid was found at 0.20–11.33mg/kg in differenthoney samples from Malaysia [2]. On the other hand, caffeicacid was found at 0.001mg/kg in Malaysian Borneo tropicalhoney [2], 1.08mg/100 g in Australian honey [27], and0.021–0.101mg/100 g in Polish honey [29].
For flavonoids, kaempferol (0.00–3.01mg/kg) and cat-echin (0.00–1.99mg/kg) were most abundant, followedby myricetin (0.00–0.49mg/kg) and naringenin (0.00–0.38mg/kg). Kaempferol was detected at 0.02 to 0.81mg/kgin Malaysian honey [2] and 0.01 to 0.099mg/100 g in Polishhoney [29].
Themajority of phenolic compounds are small molecularweight compounds that have the tendency to elute fasterfrom the column, with retention times varying between 8and 24min. When some of the compounds coeluted duringthe analysis, gradient elution was employed to produce betterseparated peaks and facilitate identification. In addition,there were some unknown peaks having similar spectra tothose of flavonoids and phenolic acids. Unfortunately, theycould not be fully identified due to the lack of standards forHPLC for these compounds.
Previous reports on phenolics compound concentrationsin honey that utilized spectrophotometry methods [2, 30]typically reported higher levels of phenolic compoundscompared with those determined by HPLC methods. Thiscould be due to the interference of nonphenolic materialspresent in the extracts, which may interfere with spectropho-tometric analysis by causing higher readings, as suggested byEscarpa andGonzalez [30]. Overall, the phenolic compounds
detected in the honey samples from Bangladesh have highantioxidant properties and may show promising pharmaco-logical effects in the treatment of chronic diseases, whichshould be further confirmed in clinical trials.
3.11. Correlation Analysis. Several strong correlations wereobserved amongst some of the biochemical and antioxidantparameters. A strong correlation was established between thecolor intensities of the honey samples and their antioxidantparameters: phenolic acids, flavonoids, DPPH, and FRAPvalues at 0.943, 0.926, 0.838, and 0.894.The color intensity ofthe honey also increased with higher phenolic and flavonoidcontent in the honey. For example, BH-3 honey, which hadthe highest color intensity, also showed the highest phenoliccontent, suggesting that honey color pigments conferred bythe phenolic compounds may play a role in the observedantioxidant activities of honey samples.
Another strong correlation was established between theABS450
, DPPH, and FRAP values, again indicating theinvolvement of pigments that ultimately confer antioxi-dant potential to honey. In a previous study conducted byBertoncelj et al. [3], a strong correlation (r = 0.850) betweenthe ABS
450and FRAP values was established in Slovenian
honey. The correlation between the ABS450
and FRAP valueswas also high (r = 0.83) in Indian honey [16], indicatingthat ABS
450, DPPH, and FRAP values are good predictors of
antioxidant properties in honey.Thus, the higher correlationsestablished in our study (ABS
450and DPPH, r = 0.838;
ABS450
and FRAP, 0.894) suggest that the investigatedmonofloral honey samples from Bangladesh have a strongerantioxidant capacity when compared to Indian and Slovenianhoney.
A positive significant linear correlation was also observedfor the phenolic and flavonoid contents with the DPPH(𝑟 = 0.915) and FRAP values (𝑟 = 0.876), respectively,which indicates the involvement of these compounds withthe antioxidant properties of the investigated honey samplesfrom Bangladesh, as phenolic acids and flavonoids are wellknown for their antioxidant potential. Generally, these strongpositive correlations suggest that the monofloral honey sam-ples from Bangladesh have strong antioxidant potential.
4. Conclusion
This is the first study to identify the phenolic compounds inhoney samples from Bangladesh. Caffeic acid and benzoicacid were the most abundant phenolic compounds (70%)among all the phenolic acids, followed by kaempferol andgallic acid. In addition to these compounds, catechin, chloro-genic acid, myricetin, naringenin, and apigenin were alsodetected. Coniferic acid, naringenin, and hesperetin were notpresent in any of the investigated honey samples. The meantotal phenolic acids, total flavonoid content, and prolinecontent were 199.20, 46.73, and 556.40mg/kg, respectively,while the mean FRAP values and DPPH radical-scavengingactivity were 327.30 𝜇MFe (II)/100g and 36.95%, respectively.Among the different types of honey, the honey samplescollected from the Nigella sativa plant typically exhibited the
10 BioMed Research International
highest phenolic content and antioxidant properties. A strongcorrelation was established between the color intensitiesof the honey samples and their antioxidant parameters:phenolic acids, flavonoids, and DPPH and FRAP values.However, further studies investigating on several differenttypes of honey samples including Kalijira, Padma, and Teelhoney are warranted. Overall, our study confirms that allthe investigated honey samples from Bangladesh are goodsources of phenolic acids and flavonoids, which confer theirgood antioxidant potential.
Conflict of Interests
The authors declare that there is no conflict of interestsregarding the publication of this paper.
Acknowledgment
The authors would like to acknowledge the Universiti SainsMalaysia, Research Grant 1001/PPSP/815058.
References
[1] M. Al-Mamary, A. Al-Meeri, and M. Al-Habori, “Antioxidantactivities and total phenolics of different types of honey,”Nutrition Research, vol. 22, no. 9, pp. 1041–1047, 2002.
[2] M. I. Khalil, N. Alam,M.Moniruzzaman, S. A. Sulaiman, and S.H. Gan, “Phenolic acid composition and antioxidant propertiesof Malaysian honeys,” Journal of Food Science, vol. 76, no. 6, pp.C921–C928, 2011.
[3] J. Bertoncelj, U.Dobersek,M. Jamnik, andT.Golob, “Evaluationof the phenolic content, antioxidant activity and colour ofSlovenian honey,” Food Chemistry, vol. 105, no. 2, pp. 822–828,2007.
[4] N. Gheldof, X.-H.Wang, andN. J. Engeseth, “Identification andquantification of antioxidant components of honeys from vari-ous floral sources,” Journal of Agricultural and Food Chemistry,vol. 50, no. 21, pp. 5870–5877, 2002.
[5] K. Helrich, Ed., Official Methods of Analysis, Association ofofficial Analytical Chemists (AOAC), Arlington, VA, USA, 15thedition, 1990.
[6] USDA, United States Standards for Grades of Extracted Honey,Agricultural Marketing Service, Fruit and Vegetable Division,Processed Products Branch, Washington, DC, USA, 1985.
[7] G. Beretta, P. Granata, M. Ferrero, M. Orioli, and R. M.Facino, “Standardization of antioxidant properties of honey bya combination of spectrophotometric/fluorimetric assays andchemometrics,” Analytica Chimica Acta, vol. 533, no. 2, pp. 185–191, 2005.
[8] V. L. Singleton, R. Orthofer, and R. M. Lamuela-Raventos,“Analysis of total phenols and other oxidation substrates andantioxidants by means of folin-ciocalteu reagent,” Methods inEnzymology, vol. 299, pp. 152–178, 1998.
[9] J. Zhishen, T.Mengcheng, andW. Jianming, “Thedeterminationof flavonoid contents in mulberry and their scavenging effectson superoxide radicals,” Food Chemistry, vol. 64, no. 4, pp. 555–559, 1999.
[10] I. F. F. Benzie and J. J. Strain, “Ferric reducing/antioxidant powerassay: direct measure of total antioxidant activity of biologicalfluids and modified version for simultaneous measurement
of total antioxidant power and ascorbic acid concentration,”Methods in Enzymology, vol. 299, pp. 15–27, 1998.
[11] I. C. F. R. Ferreira, E. Aires, J. C. M. Barreira, and L. M.Estevinho, “Antioxidant activity of Portuguese honey sam-ples: different contributions of the entire honey and phenolicextract,” Food Chemistry, vol. 114, no. 4, pp. 1438–1443, 2009.
[12] S. Bogdanov, P. Martin, and C. Lullmann,Harmonised Methodsof the International Honey Commission, Swiss Bee ResearchCentre, FAM, Liebefeld, Switzerland, 2002.
[13] M. V. Baroni, C. Arrua, M. L. Nores et al., “Composition ofhoney from Cordoba (Argentina): assessment of North/Southprovenance by chemometrics,” Food Chemistry, vol. 114, no. 2,pp. 727–733, 2009.
[14] C. Alimentarius, “Revised codex standard for honey,” CODEXSTAN 12-19811, 2001.
[15] J. Chirife, M. C. Zamora, and A. Motto, “The correlationbetween water activity and % moisture in honey: fundamentalaspects and application to Argentine honeys,” Journal of FoodEngineering, vol. 72, no. 3, pp. 287–292, 2006.
[16] S. Saxena, S. Gautam, and A. Sharma, “Physical, biochemicaland antioxidant properties of some Indian honeys,” FoodChemistry, vol. 118, no. 2, pp. 391–397, 2010.
[17] A. Islam, I. Khalil, N. Islam et al., “Physicochemical andantioxidant properties of Bangladeshi honeys stored for morethan one year,” BMC Complementary and Alternative Medicine,vol. 12, article 177, 2012.
[18] M. Moniruzzaman, M. I. Khalil, S. A. Sulaiman, and S. H. Gan,“Physicochemical and antioxidant properties ofMalaysian hon-eys produced by Apis cerana, Apis dorsata and Apis mellifera,”BMC Complementary and Alternative Medicine, vol. 13, no. 1,article 43, 2013.
[19] Council Directive of the European Union, “Council Directive2001/110/EC of 20 December 2001 relating to honey,” OfficialJournal of the European Communities, vol. L10, pp. 47–52, 2002.
[20] M. I. Khalil, M. Moniruzzaman, L. Boukraa et al., “Physic-ochemical and antioxidant properties of algerian honey,”Molecules, vol. 17, no. 9, pp. 11199–11215, 2012.
[21] S. Antony, J. R. Rieck, and P. L. Dawson, “Effect of dry honey onoxidation in Turkey breast meat,” Poultry Science, vol. 79, no. 12,pp. 1846–1850, 2000.
[22] A. A. Mariod, R. M. Ibrahim, M. Ismail, and N. Ismail,“Antioxidant activity and phenolic content of phenolic richfractions obtained from black cumin (Nigella sativa) seedcake,”Food Chemistry, vol. 116, no. 1, pp. 306–312, 2009.
[23] A.Meziti, H. Meziti, K. Boudiaf, B. Mustapha, andH. Bouriche,“Polyphenolic profile and antioxidant activities ofNigella sativaseed extracts in vitro and in vivo,” World Academy of Science,Engineering and Technology, vol. 64, no. 6, pp. 24–32, 2012.
[24] A. Meda, C. E. Lamien, M. Romito, J. Millogo, and O. G.Nacoulma, “Determination of the total phenolic, flavonoid andproline contents in Burkina Fasan honey, as well as their radicalscavenging activity,” Food Chemistry, vol. 91, no. 3, pp. 571–577,2005.
[25] A. M. Aljadi and K. M. Yusoff, “Isolation and identification ofphenolic acids in Malaysian honey with antibacterial proper-ties,” Turkish Journal of Medical Sciences, vol. 33, no. 4, pp. 229–236, 2003.
[26] P. Andrade, F. Ferreres, and M. Teresa Amaral, “Analysisof honey phenolic acids by HPLC, its application to honeybotanical characterization,” Journal of Liquid Chromatographyand Related Technologies, vol. 20, no. 14, pp. 2281–2288, 1997.
BioMed Research International 11
[27] L. Yaoa, Y. Jiang, R. Singanusong, N. Datta, and K. Raymont,“Phenolic acids in Australian Melaleuca, Guioa, Lophostemon,Banksia and Helianthus honeys and their potential for floralauthentication,” Food Research International, vol. 38, no. 6, pp.651–658, 2005.
[28] L. Estevinho, A. P. Pereira, L.Moreira, L. G. Dias, and E. Pereira,“Antioxidant and antimicrobial effects of phenolic compoundsextracts of Northeast Portugal honey,” Food and ChemicalToxicology, vol. 46, no. 12, pp. 3774–3779, 2008.
[29] I. Jasicka-Misiak, A. Poliwoda, M. Deren, and P. Kafarski,“Phenolic compounds and abscisic acid as potential markers forthe floral origin of two Polish unifloral honeys,” FoodChemistry,vol. 131, no. 4, pp. 1149–1156, 2012.
[30] A. Escarpa and M. C. Gonzalez, “Approach to the contentof total extractable phenolic compounds from different foodsamples by comparison of chromatographic and spectrophoto-metricmethods,”Analytica ChimicaActa, vol. 427, no. 1, pp. 119–127, 2001.
Submit your manuscripts athttp://www.hindawi.com
Hindawi Publishing Corporationhttp://www.hindawi.com Volume 2014
Anatomy Research International
PeptidesInternational Journal of
Hindawi Publishing Corporationhttp://www.hindawi.com Volume 2014
Hindawi Publishing Corporation http://www.hindawi.com
International Journal of
Volume 2014
Zoology
Hindawi Publishing Corporationhttp://www.hindawi.com Volume 2014
Molecular Biology International
GenomicsInternational Journal of
Hindawi Publishing Corporationhttp://www.hindawi.com Volume 2014
The Scientific World JournalHindawi Publishing Corporation http://www.hindawi.com Volume 2014
Hindawi Publishing Corporationhttp://www.hindawi.com Volume 2014
BioinformaticsAdvances in
Marine BiologyJournal of
Hindawi Publishing Corporationhttp://www.hindawi.com Volume 2014
Hindawi Publishing Corporationhttp://www.hindawi.com Volume 2014
Signal TransductionJournal of
Hindawi Publishing Corporationhttp://www.hindawi.com Volume 2014
BioMed Research International
Evolutionary BiologyInternational Journal of
Hindawi Publishing Corporationhttp://www.hindawi.com Volume 2014
Hindawi Publishing Corporationhttp://www.hindawi.com Volume 2014
Biochemistry Research International
ArchaeaHindawi Publishing Corporationhttp://www.hindawi.com Volume 2014
Hindawi Publishing Corporationhttp://www.hindawi.com Volume 2014
Genetics Research International
Hindawi Publishing Corporationhttp://www.hindawi.com Volume 2014
Advances in
Virolog y
Hindawi Publishing Corporationhttp://www.hindawi.com
Nucleic AcidsJournal of
Volume 2014
Stem CellsInternational
Hindawi Publishing Corporationhttp://www.hindawi.com Volume 2014
Hindawi Publishing Corporationhttp://www.hindawi.com Volume 2014
Enzyme Research
Hindawi Publishing Corporationhttp://www.hindawi.com Volume 2014
International Journal of
Microbiology