research article morphology controlled synthesis of -gao
TRANSCRIPT

Research ArticleMorphology Controlled Synthesis of 𝛼-GaO(OH) Nanoparticles:Thermal Conversion to Ga2O3 and Photocatalytic Properties
Ayse Dulda
Department of Mechatronics Engineering, Mevlana University, Ardıclı Mah., Yeni Istanbul Cad. No. 235,Selcuklu, 42250 Konya, Turkey
Correspondence should be addressed to Ayse Dulda; [email protected]
Received 11 November 2015; Accepted 16 February 2016
Academic Editor: Peter Majewski
Copyright © 2016 Ayse Dulda. This is an open access article distributed under the Creative Commons Attribution License, whichpermits unrestricted use, distribution, and reproduction in any medium, provided the original work is properly cited.
Morphology controlled 𝛼-GaO(OH) particles have been synthesized via precipitation method which allows the tuning of relativegrowth rates of crystal facets. The effects of alkali addition rate and the type of alkali on the growth rates of the crystal facetsduring hydrolysis were also investigated. XRD and TG analysis confirmed that there was a phase transition from GaO(OH) toGa2O3when precursor sample was calcined to 750∘C. The single phase 𝛼-Ga
2O3was obtained after thermal treatment of NaOH
precipitated precursor, while 𝛽-Ga2O3was formed when the urea or NH
4OH precipitated precursor was calcinated. Furthermore,
the thermal, spectral, and photocatalytic properties connected to the crystal structure and morphology were discussed.
1. Introduction
Recently, wide band gap transparent conductive oxides(TCO) attracted great attention due to their applicabilityin diverse fields from catalysis to biotechnology. Semicon-ducting oxides, especially of band gap larger than 4 eV,are promising for the newly developed UV optoelectronicdevices such as Thin Film Transistor (TFT), Solar Cells,UV LEDs, displays, and sensors [1–3]. For example, ITOconventional TCO electrode is opaque in the deep UV region(∼300 nm) due to its small band gap energy (∼3.2 eV) whilewide band gap semiconducting oxide such as Ga
2O3with
a band gap of 4.8–4.9 eV is transparent to deep UV light.Hence, Ga
2O3as a new TCO electrode can play a major
role in increasing the performance of many optoelectronicdevices. Researchers have employed Ga
2O3as a new TCO
[4] in various other applications [5–7]. Orita et al. reportedGa2O3to be the best candidate for a new TCO, because it
shows high transmittance to deep UV, presents controlledelectrical conductivity, and is thermally stable even whenapplied to high voltage [4]. Oshima et al. used Ga
2O3as a
TCO to fabricate deep UV photo detector [5]. Matsuzaki etal. fabricated Field Effect Transistor (FET) using the Ga
2O3
films for the channel in Metal-Insulator-Semiconductor
(MIS) structure [3]. Applications of Ga2O3are not limited
to optoelectronic device. The large band gap of Ga2O3is
believed to be an important factor that contributes to asuperior photocatalytic performance. Hou et al. reportedthat Ga
2O3when used as a catalyst over benzene presents
a better photocatalytic property than that of commercialTiO2[6]. Due to the structure stability and electronic con-
ductivity at high temperature, 𝛽-Ga2O3was pointed out to
be good candidate for gas sensor applications. Ogita et al.reported that Ga
2O3based gas sensor works with superior
performance at high temperatures of more than 600∘C [7].Ga2O3has also been widely used as a host material for
phosphors [8]. And because Ga2O3has a strong redox ability
to produce radical oxygen species, considering DNA andproteins absorption/fluorescence ability in deep UV region,we believe that Ga
2O3nanostructured materials can be a
powerful theragnostic agent for future light based therapyand diagnosis.
Size and shape of nanoparticles such as Ga2O3are very
important factor for those aforementioned applications. Forexample, spherical shape nanoparticles less than 20 nm arepreferred in biological applications. However for phosphorapplication, micron size particles give better luminescenceintensity [9]. On the other hand, shape is very important
Hindawi Publishing CorporationAdvances in Materials Science and EngineeringVolume 2016, Article ID 3905625, 9 pageshttp://dx.doi.org/10.1155/2016/3905625

2 Advances in Materials Science and Engineering
for photocatalysis since large surface area contributes tohigh redox ability [10]. Therefore, size and shape controlledsynthesis of these nanoparticles is highly needed. The mostcommon approach for controlling the size and shape ofnanoparticles (monodisperse nanoparticles) is the hydrolysisof metal salts from homogenous solution in either the pres-ence or absence of a surfactant. Cuneyt Tas et al. synthesizedquadrilateral prisms and spindle-like gallium oxide hydrox-ide (GaOOHxH
2O) single crystals by hydrolysis of Ga3+
ions in the presence of decomposing urea [11]. Matijevic andHsu observe effect of surfactant on agglomeration by prepar-ing Gd
2O3nanoparticles via surfactant free and surfactant
assisted homogenous precipitation method [12]. Hemmeret al. prepared Gd
2O3nanoparticles through hydrolysis
reactionswithmorphology controlling surfactant (CTAB andPEG) [13]. Chen and Chang reported that the addition of lowdielectric medium to the aqueous solution could change thethermodynamics of reaction system and nucleation kinetics[14]. Yoo et al. prepared spherical monodisperse nanoparti-cles in a low dielectric medium [15]. Moscolo et al. studiedthe effect of slow or fast alkaline addition on the precipitationkinetics of iron chloride solution in a large pH window usingdifferent bases [16].
In this study, our objective is to investigate the effectof addition rate of alkali and the type of used alkali onthe particle growth and the implications of final size andmorphology on the photocatalytic property of Ga
2O3.
2. Synthesis
2.1. Chemicals. GaCl3(ultra dry 99.99%Abcr), urea (>99%
pure, Merck), sodium hydroxide (reagent grade, ≥98%, pel-lets anhydrous Sigma-Aldrich), and ammonia solution (25%Merck) were used without further purification.
2.2. Procedure. For the alkaline precipitation, 25 g GaCl3
(ultra dry 99.999%Abcr) was dissolved in 100mL deionizedwater. An aqueous NaOH solution (𝑐 = 0.5mol/L, 𝑉 =100mL) or (1000 𝜇L) ammonia solution was added to theGaCl3solution and vigorously stirred and centrifuged at
room temperature.For the homogeneous precipitation, 758.3mg
(1.68mmol) GaCl3
was dissolved in 250mL H2O and
9.01 g (150mmol) urea was added to the pure solution andthe mixture was kept stirring for 10min. For precipitation,themixture was stirred at 85∘C for 30–45min.When solutionpH reached 5, the solution was cooled to room temperaturein an ice bath and centrifuged with 15000 rpm to collectresulting nanoparticles.The above obtained fresh precipitateswere dried at room temperature and fired at 750∘C for 1 h.
2.3. Instrumentation. The crystalline phase of the sampleswas determined by powder X-Ray diffraction method usinga Bruker D8 Advance X-ray diffractometer with CuK𝛼radiation. A scan rate of 2∘ 2𝜃/min was set over the rangeof 10–75∘. The morphological characterization of the sampleswas monitored using scanning electron microscopy (ZeissLS-10GmbH, Germany).
Thermogravimetric and differential thermal analysis ofsamples was performed (Mettler Toledo TGA/DSC 2 StarSystem) in an air atmosphere at a heating rate of 5∘C/min upto 1000∘C.
Fourier transform infrared (FT-IR) spectrawere recordedon a Tensor 27 spectrometer (Bruker Optics, Wissembourg,France). It was equipped with a horizontal attenuated totalreflectance (ATR) accessory composed of a ZnSe.
UV-vis absorption spectra were recorded using a Shi-madzu UV-1800 spectrophotometer in the wavelength rangeof 250–800 nm.
2.4. Photodegradation Measurement. First, 240mL of RBsolution with a concentration of 6mg/L was prepared.Total 6 samples (GaO(OH) and Ga
2O3) were weighed for
photodegradation measurements. 20mg of each sample wasseparately added to 40mL of the above RB containingsolutions and kept for 30min in the dark with mechanicalstirring. An 8W lamp (Phillips, UVC 254 nm made inPoland) was placed at 20 cm above the mixed solutions. Tomeasure photocatalytic degradation of RB, each solution wastaken out at 15min intervals by pipet and centrifuged toseparate nanoparticles from RB containing solution. UV-visadsorption spectra were recorded at different intervals tomonitor the degradation process (absorption max. of RB at554 nm) using a Shimadzu UV-1800 spectrophotometer.
3. Results and Discussions
3.1. Morphology and Crystallinity. Size and morphology con-trol of 𝛼-GaOOH nanoparticles were reported by previousresearchers via hydrolysis by varying the pH, temperature,anion concentration, and aging time of metal salt solutionsin the presence or absence of a surfactant. In most ofthese studies, hydrolysis of the metal salt solutions wastypically achieved by dropwise addition of an alkali such asNaOH, KOH, NH
4OH, and Na
2CO3[17]. Dropwise addition
involves addition of a single drop of an alkali one at atime repeatedly until the needed pH level is reached. In thisresearch, instead of the dropwise addition method, a newstrategy is devised that involves one time addition of the alkalineeded to reach a specific pH. Experiments were conductedto verify the effect of the addition rate and effect of the alkalitype on particle size and morphology. At first, experimentswere conducted to verify the effect of pH on morphologyand aspect ratio. Figure 1 shows themorphology of GaO(OH)precipitates obtained via hydrolysis fromGaCl
3solution with
dropwise addition of dilute ammonia (NH4OH, 25% Merck)
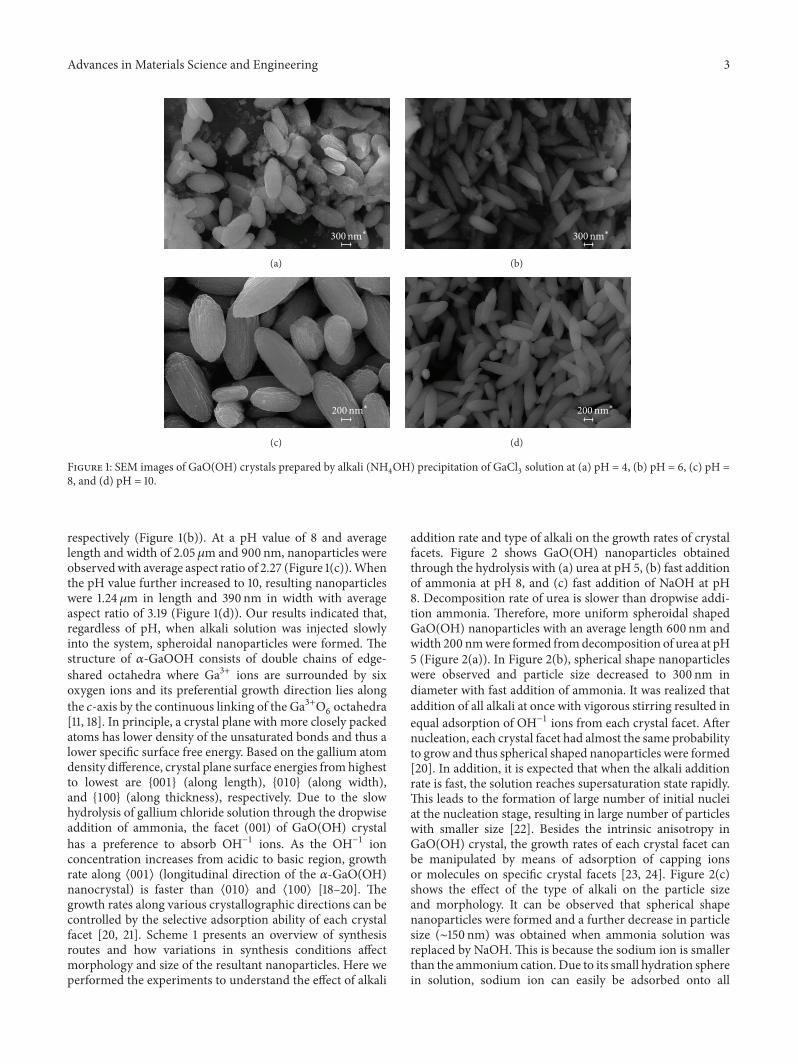
solution at (a) pH = 4, (b) pH = 6, (c) pH = 8, and (d) pH = 10.Our results agreed with previous reports indicating effect ofpHonmorphology and aspect ratio [11, 18]. It can be observedin all these results that spheroidal shape nanoparticles wereobtained and their morphology did not change from acidicto basic region. However, except for pH = 8, the aspect ratioof nanoparticles increased. At a pH value of 4.0, spheroidalshape nanoparticles 1.35 𝜇m in length and 550 nm in widthwere observed (Figure 1(a)). When the pH value increased to6 the aspect ratio of nanoparticles increased from 2.43 to 3.35and nanoparticles length and width were 1.3 𝜇m and 400 nm,
Advances in Materials Science and Engineering 3
300nm∗
(a)
300nm∗
(b)
200nm∗
(c)
200nm∗
(d)
Figure 1: SEM images of GaO(OH) crystals prepared by alkali (NH4OH) precipitation of GaCl
3solution at (a) pH = 4, (b) pH = 6, (c) pH =
8, and (d) pH = 10.
respectively (Figure 1(b)). At a pH value of 8 and averagelength and width of 2.05 𝜇m and 900 nm, nanoparticles wereobservedwith average aspect ratio of 2.27 (Figure 1(c)).Whenthe pH value further increased to 10, resulting nanoparticleswere 1.24 𝜇m in length and 390 nm in width with averageaspect ratio of 3.19 (Figure 1(d)). Our results indicated that,regardless of pH, when alkali solution was injected slowlyinto the system, spheroidal nanoparticles were formed. Thestructure of 𝛼-GaOOH consists of double chains of edge-shared octahedra where Ga3+ ions are surrounded by sixoxygen ions and its preferential growth direction lies alongthe 𝑐-axis by the continuous linking of the Ga3+O
6octahedra
[11, 18]. In principle, a crystal plane with more closely packedatoms has lower density of the unsaturated bonds and thus alower specific surface free energy. Based on the gallium atomdensity difference, crystal plane surface energies fromhighestto lowest are {001} (along length), {010} (along width),and {100} (along thickness), respectively. Due to the slowhydrolysis of gallium chloride solution through the dropwiseaddition of ammonia, the facet (001) of GaO(OH) crystalhas a preference to absorb OH−1 ions. As the OH−1 ionconcentration increases from acidic to basic region, growthrate along ⟨001⟩ (longitudinal direction of the 𝛼-GaO(OH)nanocrystal) is faster than ⟨010⟩ and ⟨100⟩ [18–20]. Thegrowth rates along various crystallographic directions can becontrolled by the selective adsorption ability of each crystalfacet [20, 21]. Scheme 1 presents an overview of synthesisroutes and how variations in synthesis conditions affectmorphology and size of the resultant nanoparticles. Here weperformed the experiments to understand the effect of alkali
addition rate and type of alkali on the growth rates of crystalfacets. Figure 2 shows GaO(OH) nanoparticles obtainedthrough the hydrolysis with (a) urea at pH 5, (b) fast additionof ammonia at pH 8, and (c) fast addition of NaOH at pH8. Decomposition rate of urea is slower than dropwise addi-tion ammonia. Therefore, more uniform spheroidal shapedGaO(OH) nanoparticles with an average length 600 nm andwidth 200 nmwere formed fromdecomposition of urea at pH5 (Figure 2(a)). In Figure 2(b), spherical shape nanoparticleswere observed and particle size decreased to 300 nm indiameter with fast addition of ammonia. It was realized thataddition of all alkali at once with vigorous stirring resulted inequal adsorption of OH−1 ions from each crystal facet. Afternucleation, each crystal facet had almost the same probabilityto grow and thus spherical shaped nanoparticles were formed[20]. In addition, it is expected that when the alkali additionrate is fast, the solution reaches supersaturation state rapidly.This leads to the formation of large number of initial nucleiat the nucleation stage, resulting in large number of particleswith smaller size [22]. Besides the intrinsic anisotropy inGaO(OH) crystal, the growth rates of each crystal facet canbe manipulated by means of adsorption of capping ionsor molecules on specific crystal facets [23, 24]. Figure 2(c)shows the effect of the type of alkali on the particle sizeand morphology. It can be observed that spherical shapenanoparticles were formed and a further decrease in particlesize (∼150 nm) was obtained when ammonia solution wasreplaced by NaOH.This is because the sodium ion is smallerthan the ammonium cation. Due to its small hydration spherein solution, sodium ion can easily be adsorbed onto all

4 Advances in Materials Science and Engineering
200nm∗
200nm∗
(a) (d)
(b) (e)
(c) (f)
200nm∗
200nm∗
200nm∗
200nm∗
Figure 2: SEM images of GaO(OH) crystals precipitated from GaCl3solution with (a) decomposition of urea, (b) NH
4OH, and (c) NaOH;
SEM images of Ga2O3crystals after thermal conversion of (d) urea precipitated, (e) NH
4OH precipitated, and (f) NaOH precipitated
GaO(OH) crystals.
the crystal facets without any selectivity and thus hinderingsubsequent growth [25].
After calcination at 750∘C almost all samples preservedtheir particle size and morphology (Figures 2(d), 2(e), and2(f)). The crystalline structure and phase purity of thesynthesized samples were examined by powder XRD pattern.Figure 3 shows the XRD patterns of precursor (GaO(OH))and calcined (Ga
2O3) samples obtained through the hydrol-
ysis with urea, ammonia, and NaOH, respectively. Precursorsamples prepared by urea, NH
4OH, and NaOH displayed
sharp and narrow peaks indicating the high crystallinityof obtained nanoparticles (Figures 3(a), 3(b), and 3(c)).Peak positions of precursor samples well matched withorthorhombic phase of 𝛼-GaO(OH) (JCPDS card number01-071-2778) [26]. Both XRD and TGA results confirmedthat there was a phase transition from GaO(OH) to Ga
2O3
when precursor sample was calcined to 750∘C. The sample
prepared with hydrolysis of NaOH displayed rhombohedralpolymorph of Ga
2O3(JCPDS card number 06-0503) after
calcination (Figure 3(d)). Other calcined samples preparedby NH
4OH and urea (Figures 3(e) and 3(f)) agreed with
monoclinic phase of 𝛽-Ga2O3(JCPDS card number 11-0370)
[11]. Lower crystallinity of NaOH precipitated sample canbe attributed to a higher phase transformation temperatureconnected to particle size.
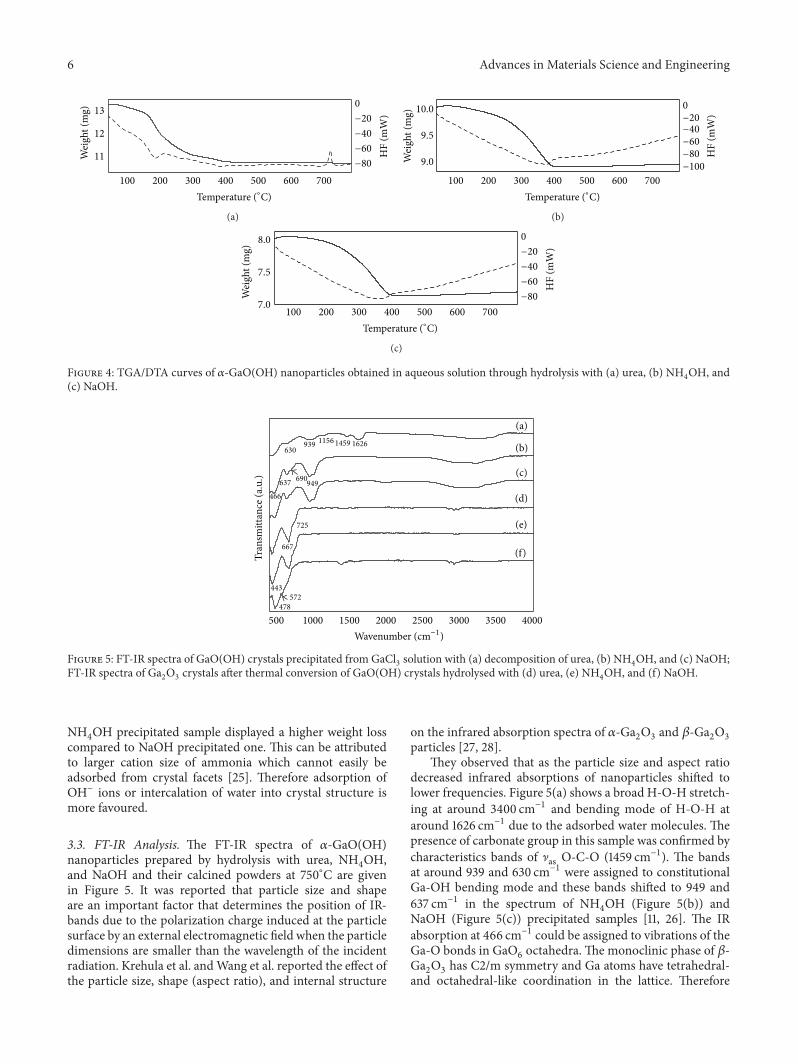
3.2. TG/DTA Analysis. Figure 4 shows the TGA/DTA curvesof GaO(OH) precipitates obtained by hydrolysis of galliumchloride aqueous solutions with (a) urea, (b) NH
4OH, and (c)
NaOH. DTA results of urea precipitated sample demonstratethat there were two endothermic peaks during the tempera-ture increment up to 800∘C with 18.4 wt% total weight loss.These endothermic peaks at around 182∘C and 378∘C can

Advances in Materials Science and Engineering 5
Urea decomposition
pH 5
Dropwise alkali addition
Hydrolysis rateSlow Fast
Ammonia
pH 8
Fast alkali addition
Ammonia NaOH
pH 8
OH−1
Na+1
Scheme 1: An overview of the synthesis routes and crystal growth mechanism.
Inte
nsity
(a.u
.)
(f)
(e)
(d)
(c)
(b)
(a)
11-0370
06-0503
01-071-2778
2𝜃 (deg.)10 20 30 40 50 60 70
Figure 3: XRDdiffraction pattern of GaO(OH) crystals precipitated fromGaCl3solutionwith (a) NaOH, (b)NH
4OH, and (c) decomposition
of urea; XRD diffraction pattern of Ga2O3crystals after thermal conversion of GaO(OH) crystals hydrolysed with (d) NaOH, (e) NH
4OH,
and (f) urea.
be assigned to simultaneous dehydration and decompositionof residual carbonates. Beyond 480∘C there was no signifi-cant difference in weight loss with increase in temperature.However there was a strong exothermic peak between 700∘Cand 750∘C indicating phase transformation to 𝛽-Ga
2O3. Urea
precipitated sample displayed higher weight loss compared
to the precipitation with NH4OH (11.89wt%) and NaOH
(10.94wt%). A higher weight loss in urea precipitated samplewas probably caused by higher water content and amorphousgallium hydroxide phase which is also confirmed by XRDwith slightly lower crystallinity (Figure 3(a)) [27]. In addition,urea precipitated sample contains residual carbonates [11].
6 Advances in Materials Science and EngineeringW
eigh
t (m
g) 13
12
11 HF
(mW
)
0
−20
−40
−60
−80
Temperature (∘C)100 200 300 400 500 600 700
(a)
10.0
9.5
9.0
HF
(mW
)
0
−20−40
−60
−80
−100
Temperature (∘C)100 200 300 400 500 600 700
Wei
ght (
mg)
(b)
Wei
ght (
mg)
8.0
7.5
7.0
HF
(mW
)
0
−20
−40
−60
−80
Temperature (∘C)100 200 300 400 500 600 700
(c)
Figure 4: TGA/DTA curves of 𝛼-GaO(OH) nanoparticles obtained in aqueous solution through hydrolysis with (a) urea, (b) NH4OH, and
(c) NaOH.
Tran
smitt
ance
(a.u
.)
500 1000 1500 2000 2500 3000 3500 4000
Wavenumber (cm−1)
(a)
(b)
(c)
(d)
(e)
(f)
630939
11561459 1626
637690
949
466
725
667
443
572
478
Figure 5: FT-IR spectra of GaO(OH) crystals precipitated from GaCl3solution with (a) decomposition of urea, (b) NH
4OH, and (c) NaOH;
FT-IR spectra of Ga2O3crystals after thermal conversion of GaO(OH) crystals hydrolysed with (d) urea, (e) NH
4OH, and (f) NaOH.
NH4OH precipitated sample displayed a higher weight loss
compared to NaOH precipitated one. This can be attributedto larger cation size of ammonia which cannot easily beadsorbed from crystal facets [25]. Therefore adsorption ofOH− ions or intercalation of water into crystal structure ismore favoured.
3.3. FT-IR Analysis. The FT-IR spectra of 𝛼-GaO(OH)nanoparticles prepared by hydrolysis with urea, NH
4OH,
and NaOH and their calcined powders at 750∘C are givenin Figure 5. It was reported that particle size and shapeare an important factor that determines the position of IR-bands due to the polarization charge induced at the particlesurface by an external electromagnetic field when the particledimensions are smaller than the wavelength of the incidentradiation. Krehula et al. andWang et al. reported the effect ofthe particle size, shape (aspect ratio), and internal structure
on the infrared absorption spectra of 𝛼-Ga2O3and 𝛽-Ga
2O3
particles [27, 28].They observed that as the particle size and aspect ratio
decreased infrared absorptions of nanoparticles shifted tolower frequencies. Figure 5(a) shows a broad H-O-H stretch-ing at around 3400 cm−1 and bending mode of H-O-H ataround 1626 cm−1 due to the adsorbed water molecules. Thepresence of carbonate group in this sample was confirmed bycharacteristics bands of ]as O-C-O (1459 cm−1). The bandsat around 939 and 630 cm−1 were assigned to constitutionalGa-OH bending mode and these bands shifted to 949 and637 cm−1 in the spectrum of NH
4OH (Figure 5(b)) and
NaOH (Figure 5(c)) precipitated samples [11, 26]. The IRabsorption at 466 cm−1 could be assigned to vibrations of theGa-O bonds in GaO
6octahedra. The monoclinic phase of 𝛽-
Ga2O3has C2/m symmetry and Ga atoms have tetrahedral-
and octahedral-like coordination in the lattice. Therefore

Advances in Materials Science and Engineering 7
Abso
rban
ce (a
.u.)
300 350 400 450 500 550 600 650
Wavelength (nm)
0 min15 min30 min
45 min60 min90 min
0 15 30 45 60 90
(a)A/A
0
1.0
0.8
0.6
0.4
0.2
0.0
Time (min)0 15 30 45 60 75 90
Ga2O3-ureaGa2O3-NH4OHGa2O3-NaOH
(b)
Figure 6: (a) The UV-visible absorption spectra of RhB solution in the presence of Ga2O3crystals (prepared by the precipitation of GaCl
3
solution with NH4OH) under UVC light (254 nm) irradiation; (b) photodegradation curve of Ga
2O3samples as a function of irradiation
time.
two stretching modes of Ga-O bonds associated with GaO6
octahedra and GaO4tetrahedra at 667 cm−1 and 730 cm−1
were observed in Figures 5(d) and 5(e), respectively. Therhombohedral phase of𝛼-Ga
2O3has the corundum structure
with R 3 c symmetry. The oxygen ions are approximatelyhexagonally close packed and the gallium ions occupy two-thirds of the octahedral sites. Each Ga octahedron sharesone face and three edges with three other octahedra; the Gaoctahedra are moderately distorted in the lattice. Two peaksat 478 and 572 cm−1 can be assigned to vibrations of the Ga-Obonds in GaO
6octahedra (Figure 5(f)) [29].
3.4. Photocatalytic Activity. The photocatalytic activity ofthe catalyst depends on the crystallinity, surface area, bandgap energy, absorption ability towards the reactants, andthe separation or the transportation rate of photogeneratedelectron/hole pairs [30]. The photocatalytic activities of 𝛼-GaO(OH), 𝛼-Ga
2O3, and 𝛽-Ga
2O3nanoparticles were eval-
uated by the photocatalytic degradation of Rhodamine Blue(RB) under UVC (254 nm) irradiation. Figure 6(a) showsabsorption spectra of RB solution in the presence of 𝛽-Ga2O3nanoparticles. The major absorption band of RB at
554 nmdecreased as a function of irradiation time and almostdisappeared after 90min. Inset shows the time dependentphotographs of solution after UVC irradiation. This samplewas obtained by thermal conversion of ammonia precipitatedGaO(OH) nanoparticles at 750∘C as shown in Figure 2(e). Incomparison to the spheroidal shaped 𝛽-Ga
2O3nanoparticles
(600 nm in length), the spherical shaped 𝛽-Ga2O3nanopar-
ticles (300 nm in diameter) displayed higher activity (Fig-ure 6(b)). As the surface area increases by decreasing particlesize, higher photocatalytic activity can be obtained due to the
larger contact area between photocatalyst and targetmaterial.Although the particle size of NaOH precipitated sample ismuch smaller thanNH
4OHprecipitated sample (Figures 3(d)
and 3(e)) higher activity of NH4OH precipitated sample can
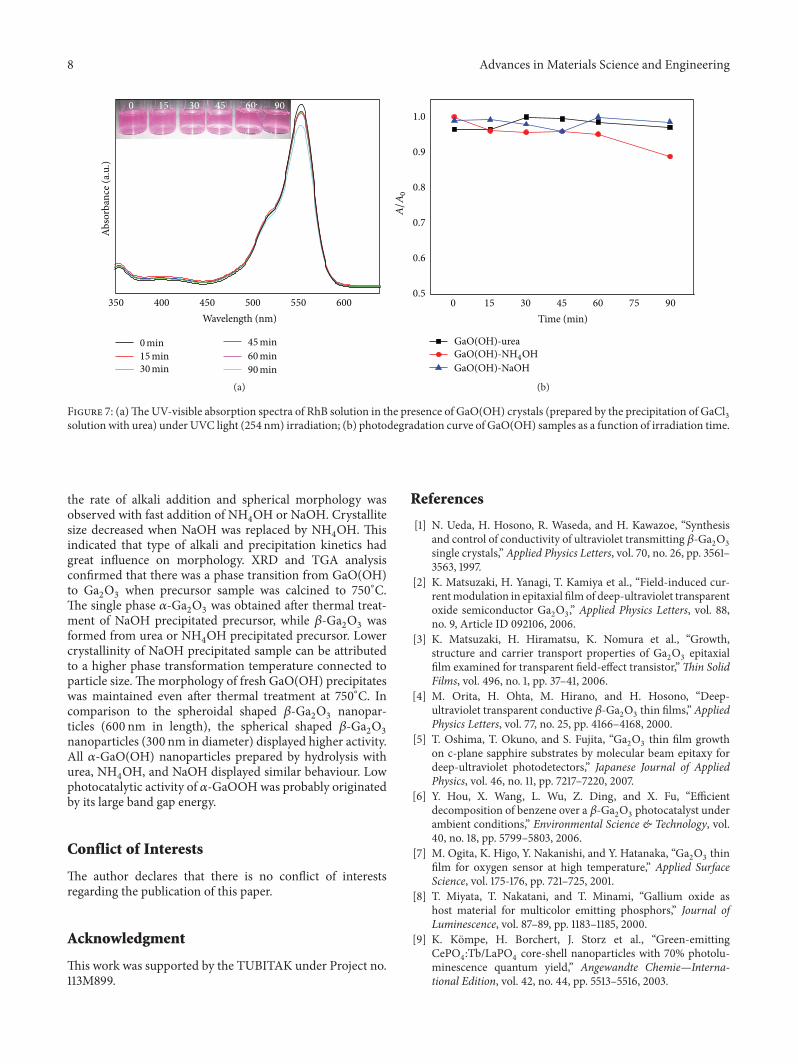
be attributed to its higher crystallinity (Figure 4) [31, 32].Absorption spectra of a solution of RB in the presence of𝛼-GaO(OH) nanoparticles prepared by hydrolysis with ureaare given in Figure 7(a). Under the irradiation of UVC lightfor 90min, only 3% of RB is degraded. All 𝛼-GaO(OH)nanoparticles prepared by hydrolysis with urea, NH
4OH,
and NaOH displayed similar behaviour. Low photocatalyticactivity of 𝛼-GaOOH was probably originated by its largeband gap energy. According to previous report estimatedoptical band gap value for 𝛼-GaOOH (𝐸
𝑔= 5.27 eV) was
higher than those of 𝛼-Ga2O3(4.98 eV) or 𝛽-Ga
2O3(4.8 eV)
[33]. Therefore for the degradation of RB in the presence of𝛼-GaOOH nanoparticles light energy should be higher thanUVC (254 nm) irradiation.
4. Conclusions
𝛼-GaO(OH) particles of various sizes and shapes were syn-thesized via precipitation method by controlling the growthkinetics of crystal facets. Our results indicated that type ofalkali and rate of alkali addition into gallium(III) chloridesolution had a great influence on nucleation and growthkinetics and thus on morphology. Spheroidal morphologywas observed when gallium(III) chloride hydrolysed withdropwise addition of ammonia at wide pH range (4, 6, 8, and10). Similar spheroidal morphology was obtained by uniformand slow release of OH−1 ions from decomposing urea.Preferential growth directionswere suppressed by controlling
8 Advances in Materials Science and Engineering
0 15 30 45 60 90
350 400 450 500 550 600
Wavelength (nm)
0 min15 min30 min
45 min60 min90 min
Abso
rban
ce (a
.u.)
(a)
Time (min)0 15 30 45 60 75 90
GaO(OH)-ureaGaO(OH)-NH4OHGaO(OH)-NaOH
A/A
0
1.0
0.8
0.9
0.7
0.6
0.5
(b)
Figure 7: (a)TheUV-visible absorption spectra of RhB solution in the presence of GaO(OH) crystals (prepared by the precipitation of GaCl3
solution with urea) under UVC light (254 nm) irradiation; (b) photodegradation curve of GaO(OH) samples as a function of irradiation time.
the rate of alkali addition and spherical morphology wasobserved with fast addition of NH
4OH or NaOH. Crystallite
size decreased when NaOH was replaced by NH4OH. This
indicated that type of alkali and precipitation kinetics hadgreat influence on morphology. XRD and TGA analysisconfirmed that there was a phase transition from GaO(OH)to Ga
2O3when precursor sample was calcined to 750∘C.
The single phase 𝛼-Ga2O3was obtained after thermal treat-
ment of NaOH precipitated precursor, while 𝛽-Ga2O3was
formed from urea or NH4OH precipitated precursor. Lower
crystallinity of NaOH precipitated sample can be attributedto a higher phase transformation temperature connected toparticle size. The morphology of fresh GaO(OH) precipitateswas maintained even after thermal treatment at 750∘C. Incomparison to the spheroidal shaped 𝛽-Ga
2O3nanopar-
ticles (600 nm in length), the spherical shaped 𝛽-Ga2O3
nanoparticles (300 nm in diameter) displayed higher activity.All 𝛼-GaO(OH) nanoparticles prepared by hydrolysis withurea, NH
4OH, and NaOH displayed similar behaviour. Low
photocatalytic activity of 𝛼-GaOOHwas probably originatedby its large band gap energy.
Conflict of Interests
The author declares that there is no conflict of interestsregarding the publication of this paper.
Acknowledgment
This work was supported by the TUBITAK under Project no.113M899.
References
[1] N. Ueda, H. Hosono, R. Waseda, and H. Kawazoe, “Synthesisand control of conductivity of ultraviolet transmitting 𝛽-Ga
2O3
single crystals,” Applied Physics Letters, vol. 70, no. 26, pp. 3561–3563, 1997.
[2] K. Matsuzaki, H. Yanagi, T. Kamiya et al., “Field-induced cur-rentmodulation in epitaxial film of deep-ultraviolet transparentoxide semiconductor Ga
2O3,” Applied Physics Letters, vol. 88,
no. 9, Article ID 092106, 2006.[3] K. Matsuzaki, H. Hiramatsu, K. Nomura et al., “Growth,
structure and carrier transport properties of Ga2O3epitaxial
film examined for transparent field-effect transistor,”Thin SolidFilms, vol. 496, no. 1, pp. 37–41, 2006.
[4] M. Orita, H. Ohta, M. Hirano, and H. Hosono, “Deep-ultraviolet transparent conductive 𝛽-Ga
2O3thin films,” Applied
Physics Letters, vol. 77, no. 25, pp. 4166–4168, 2000.[5] T. Oshima, T. Okuno, and S. Fujita, “Ga
2O3thin film growth
on c-plane sapphire substrates by molecular beam epitaxy fordeep-ultraviolet photodetectors,” Japanese Journal of AppliedPhysics, vol. 46, no. 11, pp. 7217–7220, 2007.
[6] Y. Hou, X. Wang, L. Wu, Z. Ding, and X. Fu, “Efficientdecomposition of benzene over a 𝛽-Ga
2O3photocatalyst under
ambient conditions,” Environmental Science & Technology, vol.40, no. 18, pp. 5799–5803, 2006.
[7] M. Ogita, K. Higo, Y. Nakanishi, and Y. Hatanaka, “Ga2O3thin
film for oxygen sensor at high temperature,” Applied SurfaceScience, vol. 175-176, pp. 721–725, 2001.
[8] T. Miyata, T. Nakatani, and T. Minami, “Gallium oxide ashost material for multicolor emitting phosphors,” Journal ofLuminescence, vol. 87–89, pp. 1183–1185, 2000.
[9] K. Kompe, H. Borchert, J. Storz et al., “Green-emittingCePO
4:Tb/LaPO
4core-shell nanoparticles with 70% photolu-
minescence quantum yield,” Angewandte Chemie—Interna-tional Edition, vol. 42, no. 44, pp. 5513–5516, 2003.

Advances in Materials Science and Engineering 9
[10] J. Sun, L. Gao, and Q. Zhang, “Synthesizing and comparing thephotocatalytic properties of high surface area rutile and anatasetitania nanoparticles,” Journal of the American Ceramic Society,vol. 86, no. 10, pp. 1677–1682, 2003.
[11] A. Cuneyt Tas, P. J. Majewski, and F. Aldinger, “Synthesis ofgallium oxide hydroxide crystals in aqueous solutions with orwithout urea and their calcination behavior,” Journal of theAmerican Ceramic Society, vol. 85, no. 6, pp. 1421–1429, 2002.
[12] E. Matijevic and W. P. Hsu, “Preparation and properties ofmonodispersed colloidal particles of lanthanide compounds. I.Gadolinium, europium, terbium, samarium, and cerium(III),”Journal of Colloid And Interface Science, vol. 118, no. 2, pp. 506–523, 1987.
[13] E. Hemmer, N. Venkatachalam, H. Hyodo, and K. Soga, “Therole of pH in PEG-b-PAAc modification of gadolinium oxidenanostructures for biomedical applications,” Advances in Mate-rials Science and Engineering, vol. 2012, Article ID 748098, 15pages, 2012.
[14] H.-I. Chen and H.-Y. Chang, “Homogeneous precipitationof cerium dioxide nanoparticles in alcohol/water mixed sol-vents,”Colloids and Surfaces A: Physicochemical and EngineeringAspects, vol. 242, no. 1–3, pp. 61–69, 2004.
[15] H. S. Yoo, H. S. Jang, W. B. Im, J. H. Kang, and D. Y. Jeon,“Particle size control of a monodisperse spherical Y
2O3: Eu3+
phosphor and its photoluminescence properties,” Journal ofMaterials Research, vol. 22, no. 7, pp. 2017–2024, 2007.
[16] M. C. Mascolo, Y. Pei, and T. A. Ring, “Room temperature co-precipitation synthesis of magnetite nanoparticles in a large pHwindow with different bases,”Materials, vol. 6, no. 12, pp. 5549–5567, 2013.
[17] T. Sato and T. Nakamura, “Studies of the crystallisation ofgallium hydroxide precipitated from hydrochloric acid solu-tions by various alkalis,” Journal of Chemical Technology andBiotechnology, vol. 32, no. 3, pp. 469–475, 1982.
[18] H.-S. Qian, P. Gunawan, Y.-X. Zhang, G.-F. Lin, J.-W. Zheng,and R. Xu, “Template-free synthesis of highly uniform 𝛼-GaOOH spindles and conversion to 𝛼-Ga
2O3and 𝛽-Ga
2O3,”
Crystal Growth & Design, vol. 8, no. 4, pp. 1282–1287, 2008.[19] G. Li, C. Peng, C. Li et al., “Shape-controllable synthe-
sis and morphology-dependent luminescence properties ofGaOOH:Dy3+ and𝛽-Ga
2O3:Dy3+,” Inorganic Chemistry, vol. 49,
no. 4, pp. 1449–1457, 2010.[20] G. Liu, X. Duan, H. Li, and D. Liang, “Preparation and
photoluminescence properties of Eu-doped Ga2O3nanorods,”
Materials Chemistry and Physics, vol. 110, no. 2-3, pp. 206–211,2008.
[21] C. Lu, L. Qi, J. Yang, D. Zhang, N. Wu, and J. Ma, “Simpletemplate-free solution route for the controlled synthesis ofCu(OH)
2and CuO nanostructures,” Journal of Physical Chem-
istry B, vol. 108, no. 46, pp. 17825–17831, 2004.[22] G. Gnanaprakash, J. Philip, T. Jayakumar, and B. Raj, “Effect of
digestion time and alkali addition rate on physical properties ofmagnetite nanoparticles,” Journal of Physical Chemistry B, vol.111, no. 28, pp. 7978–7986, 2007.
[23] J. Liu, X. Du, Y. Yang, Y. Deng, W. Hu, and C. Zhong, “Aone-step, clean, capping-agent-free electrochemical approachto prepare Pt nanoparticles with preferential (100) orientationand their high electrocatalytic activities,” Electrochemistry Com-munications, vol. 58, pp. 6–10, 2015.
[24] T. S. Ahmadi, Z. L. Wang, T. C. Green, A. Henglein, and M.A. El-Sayed, “Shape-controlled synthesis of colloidal platinumnanoparticles,” Science, vol. 272, no. 5270, pp. 1924–1926, 1996.
[25] C. Henrist, J.-P. Mathieu, C. Vogels, A. Rulmont, and R. Cloots,“Morphological study of magnesium hydroxide nanoparticlesprecipitated in dilute aqueous solution,” Journal of CrystalGrowth, vol. 249, no. 1-2, pp. 321–330, 2003.
[26] Y. Zhao, R. L. Frost, J. Yang, and W. N. Martens, “Size andmorphology control of gallium oxide hydroxide GaO(OH),nano- to micro-sized particles by soft-chemistry route withoutsurfactant,” Journal of Physical Chemistry C, vol. 112, no. 10, pp.3568–3579, 2008.
[27] S. Krehula,M. Ristic, S. Kubuki, Y. Iida,M. Fabian, and S.Music,“The formation and microstructural properties of uniform 𝛼-GaOOH particles and their calcination products,” Journal ofAlloys and Compounds, vol. 620, pp. 217–227, 2015.
[28] Y. Wang, A. Muramatsu, and T. Sugimoto, “FTIR analysisof well-defined 𝛼-Fe
2O3particles,” Colloids and Surfaces A:
Physicochemical and Engineering Aspects, vol. 134, no. 3, pp. 281–297, 1998.
[29] Y. Quan, D. Fang, X. Zhang, S. Liu, and K. Huang, “Syn-thesis and characterization of gallium oxide nanowires via ahydrothermal method,” Materials Chemistry and Physics, vol.121, no. 1-2, pp. 142–146, 2010.
[30] Y. Park, Y. Na, D. Pradhan, B.-K. Min, and Y. Sohn, “Adsorptionand UV/Visible photocatalytic performance of BiOI for methylorange, Rhodamine B and methylene blue: Ag and Ti-loadingeffects,” CrystEngComm, vol. 16, no. 15, pp. 3155–3167, 2014.
[31] Y. Hou, J. Zhang, Z. Ding, and L. Wu, “Synthesis, characteri-zation and photocatalytic activity of 𝛽-Ga
2O3nanostructures,”
Powder Technology, vol. 203, no. 3, pp. 440–446, 2010.[32] M. Muruganandham, R. Amutha, M. S. M. A. Wahed et
al., “Controlled fabrication of 𝛼-GaOOH and 𝛼-Ga2O3self
assembly and its superior photocatalytic activity,” The Journalof Physical Chemistry C, vol. 116, no. 1, pp. 44–53, 2012.
[33] C.-C. Huang and C.-S. Yeh, “GaOOH, and 𝛽- and 𝛾-Ga2O3
nanowires: preparation and photoluminescence,” New Journalof Chemistry, vol. 34, no. 1, pp. 103–107, 2010.

Submit your manuscripts athttp://www.hindawi.com
ScientificaHindawi Publishing Corporationhttp://www.hindawi.com Volume 2014
CorrosionInternational Journal of
Hindawi Publishing Corporationhttp://www.hindawi.com Volume 2014
Polymer ScienceInternational Journal of
Hindawi Publishing Corporationhttp://www.hindawi.com Volume 2014
Hindawi Publishing Corporationhttp://www.hindawi.com Volume 2014
CeramicsJournal of
Hindawi Publishing Corporationhttp://www.hindawi.com Volume 2014
CompositesJournal of
NanoparticlesJournal of
Hindawi Publishing Corporationhttp://www.hindawi.com Volume 2014
Hindawi Publishing Corporationhttp://www.hindawi.com Volume 2014
International Journal of
Biomaterials
Hindawi Publishing Corporationhttp://www.hindawi.com Volume 2014
NanoscienceJournal of
TextilesHindawi Publishing Corporation http://www.hindawi.com Volume 2014
Journal of
NanotechnologyHindawi Publishing Corporationhttp://www.hindawi.com Volume 2014
Journal of
CrystallographyJournal of
Hindawi Publishing Corporationhttp://www.hindawi.com Volume 2014
The Scientific World JournalHindawi Publishing Corporation http://www.hindawi.com Volume 2014
Hindawi Publishing Corporationhttp://www.hindawi.com Volume 2014
CoatingsJournal of
Advances in
Materials Science and EngineeringHindawi Publishing Corporationhttp://www.hindawi.com Volume 2014
Smart Materials Research
Hindawi Publishing Corporationhttp://www.hindawi.com Volume 2014
Hindawi Publishing Corporationhttp://www.hindawi.com Volume 2014
MetallurgyJournal of
Hindawi Publishing Corporationhttp://www.hindawi.com Volume 2014
BioMed Research International
MaterialsJournal of
Hindawi Publishing Corporationhttp://www.hindawi.com Volume 2014
Nano
materials
Hindawi Publishing Corporationhttp://www.hindawi.com Volume 2014
Journal ofNanomaterials