research article neural circuit activity in freely...
TRANSCRIPT

1028
INTRODUCTIONThe zebrafish is well established as a vertebrate model system withsubstantial advantages for studying nervous system development(Hatta and Kimmel, 1993; Blader and Strähle, 2000; Mione et al.,2008; Abraham et al., 2009). It is also emerging as an excellentsystem for investigating the function of neural circuits and the neuralcontrol of behavior (Drapeau et al., 1999; Fetcho and Higashijima,2004; McDearmid and Drapeau, 2006; Fetcho, 2007). In recentyears, electrophysiological, Ca2+-imaging and optogeneticapproaches have been developed to record neuronal activity in thezebrafish spinal cord and brain (Fetcho et al., 1997; Fetcho andHigashijima, 2004; Kohashi and Oda, 2008; Yaksi et al., 2009).Expression of light-activated glutamate receptors, channelrhodopsin-2 and halorhodopsin has made it feasible to control the activity ofparticular neural circuits and determine the behavioral consequencesin living animals (Petreanu et al., 2007; Wyart et al., 2009). Oneoutcome has been to identify some of the cellular components ofspinal cord circuits that mediate swimming and startle or escapebehavior (Fetcho and O’Malley, 1997; Fetcho et al., 1997; Saint-Amant and Drapeau, 1998a; Drapeau et al., 1999; Brustein et al.,2003; Higashijima et al., 2003). Despite this progress, our abilityto monitor the activation of these circuits in freely behaving animalsremains limited. Here, we describe a method for recording theactivity of distinct neural circuits that control fast and slow escapebehavior in completely unfettered zebrafish.
Fast escape behavior, also called the startle response, has beenwell characterized in zebrafish (Eaton et al., 2001). Zebrafishrespond to unexpected or potentially threatening stimuli by quicklyturning away from the source and rapidly swimming away (Fig.1A).The initial deep bend is called the C-start after the shape the bodyassumes at its maximum angle. The C-start response is triggeredby activation of the Mauthner cell, one of a pair of large, bilaterallysymmetric reticulospinal neurons whose network is distributed fromthe caudal midbrain to the spinal cord. Mauthner cells receive inputfrom sensory neurons conveying mechanical, chemical, auditory,vibrational or visual information (Peterson, 1984; Grantyn et al.,1992; Zottoli et al., 1995; Tanimoto et al., 2009). Mauthner-mediatedescapes have a rapid onset and are highly stereotyped (Kimmel etal., 1974). In addition to the Mauthner cells, two sets of smallersegmental homologs, called MiD2cm and MiD3cm, are thought tofine tune the trajectory of the escape and may be sufficient to initiaterapid escapes in the absence of the Mauthner cell under somecircumstances (Zottoli, 1977; Faber et al., 1989; Liu and Fetcho,1999; Zottoli and Faber, 2000). Many of the individual types ofneurons involved in Mauthner-mediated escape behavior have beenidentified (Faber et al., 1989).
When sensory stimuli are insufficient to bring the Mauthner cellto threshold, zebrafish exhibit escape behavior that is slower in onsetand execution and more variable in form than the C-start response(Kohashi and Oda, 2008). The circuitry underlying non-Mauthner
The Journal of Experimental Biology 214, 1028-1038© 2011. Published by The Company of Biologists Ltddoi:10.1242/jeb.048876
RESEARCH ARTICLE
Neural circuit activity in freely behaving zebrafish (Danio rerio)
Fadi A. Issa1, Georgeann O’Brien2, Petronella Kettunen3,*, Alvaro Sagasti2, David L. Glanzman3 and Diane M. Papazian1,†
1Department of Physiology, David Geffen School of Medicine at UCLA, Los Angeles, CA 90095-1751, USA, 2Department ofMolecular, Cell, and Developmental Biology, UCLA, Los Angeles, CA 90095-1606, USA and 3Department of Integrative Biology and
Physiology, UCLA, Los Angeles, CA 90095-1568, USA*Present address: Institute of Neuroscience and Physiology, University of Gothenburg, Box 100, S-405 30 Gothenburg, Sweden
†Author for correspondence ([email protected])
SUMMARYExamining neuronal network activity in freely behaving animals is advantageous for probing the function of the vertebrate centralnervous system. Here, we describe a simple, robust technique for monitoring the activity of neural circuits in unfettered, freelybehaving zebrafish (Danio rerio). Zebrafish respond to unexpected tactile stimuli with short- or long-latency escape behaviors,which are mediated by distinct neural circuits. Using dipole electrodes immersed in the aquarium, we measured electric fieldpotentials generated in muscle during short- and long-latency escapes. We found that activation of the underlying neural circuitsproduced unique field potential signatures that are easily recognized and can be repeatedly monitored. In conjunction withbehavioral analysis, we used this technique to track changes in the pattern of circuit activation during the first week ofdevelopment in animals whose trigeminal sensory neurons were unilaterally ablated. One day post-ablation, the frequency ofshort- and long-latency responses was significantly lower on the ablated side than on the intact side. Three days post-ablation, asignificant fraction of escapes evoked by stimuli on the ablated side was improperly executed, with the animal turning towardsrather than away from the stimulus. However, the overall response rate remained low. Seven days post-ablation, the frequency ofescapes increased dramatically and the percentage of improperly executed escapes declined. Our results demonstrate thattrigeminal ablation results in rapid reconfiguration of the escape circuitry, with reinnervation by new sensory neurons andadaptive changes in behavior. This technique is valuable for probing the activity, development, plasticity and regeneration ofneural circuits under natural conditions.
Key words: escape behavior, field potential, Mauthner, neural circuit, trigeminal neuron, zebrafish, startle response.
Supplementary material available online at http://jeb.biologists.org/cgi/content/full/214/6/1028/DC1
THE JOURNAL OF EXPERIMENTAL BIOLOGY

1029Electric field potentials in behaving zebrafish
escapes is not well defined, although some components have beenidentified (Kohashi and Oda, 2008).
Here we demonstrate the advantages of using electric fieldpotentials generated during escape behavior to monitor the outputof the underlying neural circuits (Eaton and Farley, 1975; Eaton etal., 1977b; Prugh et al., 1982). We show that the distinct neuralcircuits that control fast and slow escape behaviors generate uniqueelectric field signatures. We used this technique in conjunction withbehavioral analysis to study the plasticity of the escape networkafter ablation of the trigeminal sensory neurons. This simpletechnique makes it feasible to monitor neural circuit activationwithout compromising the animal’s natural behavior.
MATERIALS AND METHODSAnimal maintenance
AB wild-type zebrafish, Danio rerio (Hamilton 1822), embryos wereraised at 28.5°C using a 14h:10h light:dark cycle. Animalprocedures were approved by the Chancellor’s Animal ResearchCommittee at UCLA.
Experimental setupExperiments were conducted at 27°C using larval zebrafish at2–5days post-fertilization (d.p.f.). The test chamber measured2.5�1.0�0.5cm and was made of Sylgard® (Dow Corning,Midland, MI, USA) (Fig.1B). Stainless steel insect pins (250mdiameter) were inserted at either end of the chamber and used asbath electrode leads. Steel electrodes were chosen because they areinexpensive and readily detect the field potential signals generatedby behaving zebrafish. The chamber contained double-distilled waterwith a resistance of ~15M. Zebrafish are freshwater animals thatcan be exposed to high-resistance distilled water for as long as 6hwith no obvious ill effects. No changes in escape behaviors evokedby tactile or visual stimuli were detected in animals maintained indistilled water for up to 6h. Highly resistive water preventeddissipation of the electric field and enhanced the signal-to-noise ratio.Electric field potentials were measured in 20 animals testedindividually. Each animal was tested 20–25 times at intervals of5min to prevent habituation. Each animal was transferred to thechamber and acclimated for 15min. Behavioral responses wereevoked by a 3ms water jet applied using a Picospritzer III (ParkerInstrumentation, Cleveland, OH, USA) to the left or right side ofthe head in random order. Stimuli were delivered using a glassmicropipette with a tip diameter of ~0.2–0.4mm. Picospritzerpressure was adjusted to ~103–138kPa. Under these conditions, themajority of stimuli produced behavioral responses.
Electric field potentials were recorded using an AC Cornerstonedifferential amplifier (Dagan Corp., Minneapolis, MN, USA),kindly provided by Dr Franklin Krasne (UCLA). Field potentialsignals were amplified 2000-fold, low-pass filtered at 300Hz andhigh-pass filtered at 500Hz. Filter settings were selected to optimizethe signal-to-noise ratio and thereby facilitate detection of an initial,small-amplitude component of the field potential signal (see Fig.2B).Bath electrode signals, the high-speed camera transistor–transistorlogic (TTL) pulse and the Picospritzer pulse were digitized with aDigidata-1322A and acquired using Axoscope software (MolecularDevices, Inc., Sunnyvale, CA, USA). Just prior to the water pulse,the Picospritzer activated the video camera via its digital input,thereby time-locking the water jet to the exact video frame at whichthe pulse was delivered.
The amplitude of electric field potentials generated duringzebrafish behavior depended on the orientation of the animalrelative to the bath electrodes. In control and Mauthner cell ablation
1.0
cm
2.5 cm
TT
L ou
t
Trig
ger
in
0.5
cm
–
– +
Picospritzer
On/Off
Pico
Video
Potential
+Bath
electrode
Bathelectrode
A
B
θ
C
13 ms
19 ms
24 ms
–1 ms 13 ms 19 ms 24 ms 26 ms
26 ms
Stimulus
Fig.1. Zebrafish escape circuit and experimental setup. (A)A simplifieddiagram of the Mauthner-mediated escape circuit. Mechanosensory stimuliactivate trigeminal sensory neurons (blue) that synapse onto the ipsilateralMauthner neuron (red). The Mauthner cell axon crosses the midline andactivates the axial motor neurons and respective muscles on the contralateralside. (B)The setup for recording electric field potentials generated duringescape behavior. Behavior was evoked by applying a jet of water to the headand was recorded by high-speed videography (1000framess–1).Simultaneously, electric field potentials (red ovals surrounding behavinganimal in chamber) were measured using a differential amplifier. Electric fieldrecordings and videos of behavior (red and blue components on computerdisplay) were digitally synchronized with the onset of the Picospritzer waterjet (green component on display). This ensured time-locking of the fieldpotential, escape behavior and water jet pulse. (C)Changes in headtrajectory during escape behavior were measured as the angle between theoriginal body axis (–1ms, just prior to the first detectable movement) andlines drawn through the head at subsequent time points (13, 19, 24 and26ms later). In this example, the maximal change in head trajectory occurred26ms after the first detectable movement. Angular velocity was calculated bymeasuring the change in head trajectory as a function of frame number, witheach frame corresponding to 1ms.
THE JOURNAL OF EXPERIMENTAL BIOLOGY

1030
experiments, trials were excluded from analysis if the animal’sbody axis deviated by more than ±10deg relative to a line drawnbetween the bath electrodes. In the trigeminal neuron ablationexperiments, all trials were analyzed regardless of animalorientation because few animals were tested and field potentialsignals were scored but not analyzed quantitatively. Field potentialsignals were not produced by water turbulence because agitatingthe water in the absence of an animal did not generate electricfield potentials (data not shown).
Behavioral analysisBehavioral responses were recorded at 1000framess–1 using aRedlake Motion Meter high-speed digital video camera (DELImaging Systems, Cheshire, CT, USA). Frames were imported intoNIH ImageJ for analysis (http://rsbweb.nih.gov/ij/index.html). Thelatency of the behavioral response was measured from the arrivalof the stimulus to the onset of movement. The time the stimulusreached the animal was readily determined because the water jetwas sufficiently strong to push the animal back upon contact. Theamplitude of the behavioral response was characterized bymeasuring the change in head trajectory, which was defined as the
F. A. Issa and others
angle between the original body axis and an intersecting line drawnthrough the head at the maximum bending response (, Fig.1C).To calculate the angular velocity of the response, intermediatetrajectory angles were measured from each video frame (Fig.1C).Typically, ~10 short-latency and approximately six long-latencyescapes, corresponding to trials in which the animal was in theoptimal orientation, were averaged per animal and an overall meanwas calculated across animals. Values provided in the textcorrespond to the overall means ± s.d.
Analysis of field potentialsField potential amplitudes were measured as the difference betweenthe maximum and minimum values recorded in the experiment (seeFigs3, 4). The duration of short-latency field potentials was definedas the duration of the large, phasic potential signal (see Fig.2B).The duration of long-latency potentials was measured from the onsetto the end of the signal (see Fig.4A). For fast escapes, the latencyof the electrical signal was defined as the time difference betweenthe arrival of the stimulus and the beginning of the large phasicpotential change (see Fig.2B). For slow escapes, the latency of theelectric signal was defined as the time difference between the arrival
Max. am
plitude
–8 ms –6 ms –4 ms –2 ms
1 ms 3 ms 5 ms 7 ms
9 ms 11 ms 13 ms 15 ms
17 ms 19 ms 21 ms 23 ms
25 ms 27 ms 29 ms 31 ms
B
6 ms
A
0.5
mV
5 msField recording
TTL pulse
Jet
–8 –6 –4 –2 1 3 5 7 9 11 13 15 17 19 21 23 25 27 29 31
Stimulus
0.05
mV
0.5 ms
Duration
0 ms
Fig.2. Large, phasic electric field potential generatedduring short-latency escape behavior. (A)Selectedframes recorded during a representative fast escaperesponse evoked at 5d.p.f. are shown. Themicropipette tip used to deliver the stimulus can beseen at the left side of each frame. The black squarein the second frame indicates the start of thePicospritzer pulse. Time0ms (not shown)corresponds to the time the stimulus contacted theanimal. (B)Electric field potential recorded during theescape response shown in A (top trace). The fieldpotential delay (horizontal double-headed arrow) wasmeasured as the time between arrival of the stimulus(downward arrow, 0ms) and the beginning of thephasic component of the signal. The middle trace isthe camera’s TTL pulse, which is time-locked withthe field potential recording. Numbers represent theframe time (ms) corresponding to images shown inA. The bottom trace indicates the time course of thePicospritzer water jet pulse. In this and subsequentfigures, the upward arrow indicates the start of thewater jet. The downward arrow indicates the time atwhich the stimulus contacted the animal (t0ms).Left inset: enlarged view of a small potentialpreceding the phasic potential. Right inset: the large,phasic component of the field potential signal.Brackets denote the duration of the phasiccomponent and the maximum field potentialamplitude measured from peak to peak. Results arerepresentative of experiments using 20 controlanimals in which 350 stimuli were applied. Short-latency escape behavior was evoked in 190 trials.
THE JOURNAL OF EXPERIMENTAL BIOLOGY

1031Electric field potentials in behaving zebrafish
of the stimulus and the beginning of the field potential change (seeFig.4B).
d-Tubocurarine applicationTo facilitate curare access to the musculature, a tiny incision wasmade at the base of the tail using a glass micropipette. Animalswere bathed for 10min in 10M d-tubocurarine chloride hydrate,which was added to the test chamber and then washed out withdouble-distilled water. Treatment with curare effectively paralyzedthe zebrafish, abolishing behavioral responses. Application of waterjet stimuli and recordings of field potentials began immediately aftercurare treatment and continued for 1h.
Mauthner neuron backfillingZebrafish (3d.p.f.) were anesthetized in 0.02% tricainemethylsulfonate and placed dorsal side up on an agarose-lined Petridish thinly covered with water. Dextran fluorescein dye(10,000MW; Invitrogen, Carlsbad, CA, USA) was dissolved inwater and pressure-injected into the caudal (postanal) spinal cordusing glass microelectrode pipettes (2–10M) (O’Malley et al.,1996). Picospritzer pressure was adjusted so that the injected dyecould be detected visually. Generally, the pressure did not exceed103kPa. Animals were returned to the aquarium for 24h prior toablation.
Trigeminal and Mauthner neuron ablationTo inhibit pigment formation, fish were kept continuously in 5%1-phenyl-2-thiourea (PTU) Ringer’s solution starting at 24h post-fertilization (h.p.f.). Animals were anesthetized in 0.02% tricaine30min prior to laser ablation and immobilized in 1% low-meltagarose. Transgenic zebrafish that express green fluorescent protein(GFP) in sensory neurons [Tg:(isl2b-GFP)] were used to laser ablatetrigeminal neurons, which was performed at 3d.p.f. (Pittman et al.,2008). The cell bodies of GFP-expressing trigeminal neurons or dye-
filled Mauthner cells were ablated on one side of the body using acustom-built scanning two-photon microscope with a ChameleonTi:Sapphire laser located in the Portera-Cailliau laboratory atUCLA. Cells were imaged using a wavelength of 850nm and apower of 30mW at the sample, and ablated using an optical zoomof 20� and power of 180mW at the sample (40� water immersionOlympus objective, 0.8 numerical aperture). Animals were removedfrom agarose and put into tricaine- and PTU-free Ringer’s solutionfor 16–24h prior to testing (O’Brien et al., 2009).
RESULTSShort-latency escape response is associated with large,
phasic electric field potentialTo determine whether escape behavior generates detectable electricfield potentials, animals were placed in a distilled water chamberwith two dipole electrodes immersed at either end. Behavior wasevoked by applying an unexpected jet of water to the head and wasrecorded by high-speed videography (1000framess–1) using adigital camera. Concurrently, electric field potentials were measuredusing a differential amplifier (Fig.1A,B).
In 54% of trials, a brief water jet pulse evoked rapid escapebehavior initiated by a characteristic C-start bend, which turned theanimal away from the stimulus (Fig.1C, Fig. 2A) (Eaton et al.,1977a; Zottoli, 1977). The C-bend was usually followed by acounterbend, after which the animal swam away from the sourceof the stimulus. Each rapid escape was accompanied by a large,phasic electric field potential that was highly stereotyped inwaveform and amplitude (Fig.2B). The latency between the stimulusand the phasic potential was 7.1±3.7ms. There was a strongtemporal correlation between the large field potential signal and theinitial movement of the escape behavior, which lagged the onset ofthe field potential by 5±1ms (Fig.2B). The large phasic signal wasconsistently preceded by a much smaller potential with a durationof 1.2±0.3ms (Fig.2B, inset). The interval between this small signaland the large phasic potential was 1.2±0.4ms. After the large phasiccomponent of the signal, additional fluctuations of the field potentialwere detected. These varied in amplitude and duration, and may beassociated with the more variable counterbend and swimming phasesof the escape response.
To determine whether the field potential signal reflected electricalactivity in nerve, muscle or both, animals were treated with curareto block nicotinic acetylcholine receptors at the neuromuscularjunction. The resulting paralysis eliminated the behavioral responseas well as the large phasic component and the later variablefluctuations of the field potential signal (Fig.3A). These dataindicate that the bulk of the potential signal results from electricalactivity in muscle. Therefore, the 5ms lag between the large phasicpotential and the start of the escape response likely reflects the timebetween the muscle action potential and generation of sufficienttension in the contractile apparatus to produce detectable motion(Eaton et al., 2001).
Although curare abolished the bulk of the electric field potential,the small initial component of the signal persisted in paralyzedanimals, suggesting that this portion of the field potential resultsfrom electrical activity in neurons (Fig.3B). Because of its smallamplitude, this component was most readily detected when theanimal was oriented lengthwise between the bath electrodes.
The amplitude of the initial, neurogenic spike was decreased inthe curare experiment by a mean of 36.7% (cf. Fig.3A with 3B),probably because a small incision was made to optimize drug accessto the musculature. The field potentials measured in our experimentsare generated by electric currents passing through the least resistive
B Curare
Field recording
A Control
Field recording
0.5
mV
5 ms
0.5
mV
5 ms
0.04
mV
1 ms
5 μV
1 ms
Fig.3. Large, phasic field potential eliminated by curare. (A)Arepresentative recording of an electric field potential generated during ashort-latency escape response evoked at 5d.p.f. (top). Inset: enlarged viewof small, initial field potential signal. (B)A representative recording of thefield potential after curare treatment. Inset: enlarged view of the remainingsmall potential signal. The lower traces in A and B show the time course ofthe water jet pulse. Results are representative of experiments using fiveanimals. Prior to addition of curare, 69 stimuli resulted in 57 short- and 12long-latency escapes. After addition of curare, 54 stimuli were applied butno escape behavior was evoked.
THE JOURNAL OF EXPERIMENTAL BIOLOGY

1032
parts of the animal’s body, probably between the mouth and theanus or gills. The incision likely provided an alternative, lowerresistance pathway, thereby decreasing the size of the potential signaldetected by the bath electrodes. To test this interpretation, wemeasured field potential amplitudes before and after introducing anincision (supplementary material Fig.S1). The amplitudes of theneurogenic and muscle field potentials decreased in parallel by 32and 37%, respectively. These results are comparable to the declineobserved in the curare experiment and support the idea that theincision creates a lower resistance pathway, thereby reducing theamplitudes of field potentials measured in our experiments.
Long-latency behavioral response is associated with variable,low-amplitude electric field potential
In some trials, the water jet stimulus failed to evoke a rapid, C-startescape response. In these cases, the animal typically turned awayfrom the stimulus after a prolonged delay of 26.6±11.8ms (Fig.4A).This bend was shallower and slower than the C-start observed duringfast escape behavior. This delayed avoidance behavior, which wasless stereotyped than the C-start response, may correspond to a long-latency escape or evoked swimming. Similar movements can bevoluntarily initiated at this stage of development (Didomenico etal., 1988). This slow escape behavior was accompanied by low-amplitude, long-duration field potentials (Fig.4B). Like the behavior,
F. A. Issa and others
these electrical signals were more variable than the stereotyped large-amplitude phasic potentials associated with the C-start escaperesponse (cf. Fig.4B with Fig. 2B).
Short- and long-latency escape responses generatequantitatively distinct electric field potential signals
To characterize quantitatively the short- and long-latency behavioralresponses and their associated electric field potentials, we binnedthe measured behavioral latencies and plotted them in histogramform (Fig.5A). The data were well fitted by the sum of two Gaussianfunctions. On the basis of the fitted distributions, responses withlatencies from 3–16 or 17–40ms were categorized as short- or long-latency escape behaviors, respectively. As expected from qualitativeanalysis of the behavioral videos, the change in head trajectoryduring the initial bend was significantly larger for short-latency thanfor long-latency responses (Fig.5B).
We analyzed the electric field potentials associated with short-and long-latency behavioral responses by measuring the delaybetween the stimulus and the start of the potential signal as well asthe initial amplitude and duration of the signal (Fig.6A–C, leftpanels). Field potentials associated with short-latency escapesoccurred with significantly shorter delays and had larger amplitudesand shorter durations than those associated with long-latencyescapes (Fig.6A–C, right panels; Table1). Thus, the field potential
27 ms
B
–8 ms –5 ms –2 ms 2 ms
5 ms 8 ms 11 ms 14 ms
17 ms 20 ms 23 ms 26 ms
29 ms 32 ms 35 ms 38 ms
41 ms 44 ms 47 ms 50 ms
A
Field recording
TTL pulse–8 2 8 11 14 23 32 3526 41–5 5 20 29 38
0.05
mV
10 ms
–2 17 47 5044
Duration of response
Max. amplitude
Fig.4. Small-amplitude, variable electric fieldpotential generated during long-latencyescape behavior. (A)Selected framesrecorded during a representative slowescape response evoked at 5d.p.f.(B)Electric field potential recorded during theescape response shown in A (top). The fieldpotential delay (horizontal double-headedarrow) was measured as the time betweenarrival of the stimulus (downward arrow) andthe beginning of the signal. The middle andlower traces are arranged and labeled asdescribed in the legend to Fig.2. Thebracket denotes the duration of the fieldpotential signal. The amplitude of the signalwas calculated from the maximum andminimum values recorded (filled circles).Results are representative of experimentsusing 20 control animals in which 350 stimuliwere applied. Long-latency escape behaviorwas evoked in 90 trials.
THE JOURNAL OF EXPERIMENTAL BIOLOGY

1033Electric field potentials in behaving zebrafish
parameters reflect the differences in time of onset, bend angles andduration that are characteristic of the short- and long-latencybehaviors (Fig.6, Table1).
The amplitudes of the field potential signals are of particularinterest because they indicate the strength of muscle contraction,which translates behaviorally to angular velocity. We measured themaximum angular velocities of short- and long-latency escapes,which averaged 20±3.1 and 8.4±4.4degms–1, respectively, andcompared the velocity to the amplitude of the field potentials. Wefound that high velocity escapes consistently produced large fieldpotential amplitudes whereas slower escapes produced smaller fieldpotential amplitudes (N20) (Fig.6D).
These results strongly support the conclusion that the fieldpotential signals are generated by the electrical activity underlyingthe escape behaviors. Furthermore, distinct field potential profilesare associated with short- and long-latency escapes.
Ablation of Mauthner neuron selectively affects short-latencyescape response and field potential
The fast C-start escape response is known to be mediated byactivation of the Mauthner cell, one of a pair of hindbrain neuronsthat, in response to sufficient sensory stimulation, fires once toinitiate strong, rapid muscle contraction contralateral to the stimulus(Fig.1A) (Eaton et al., 2001). In contrast, longer-latency escapesdo not involve Mauthner cell activation (Didomenico et al., 1988;Eaton et al., 2001).
To test the hypothesis that the large field potentials generatedduring short-latency escapes require Mauthner cell activation, weunilaterally ablated the Mauthner neuron in nine animals at 4d.p.f.(Fig.7A). Behavior and electric field potentials were assessed 24hafter ablation by an experimenter who did not know which side hadbeen ablated. The animals were stimulated on the left and right sidesin random order. We found that stimuli applied to the intact sidecontinued to produce fast escape responses that generated large,phasic electric field potentials (Fig.7B–D). The mean values forlatency and amplitude of the behavioral responses and associatedfield potentials did not differ significantly from those of control(unablated) animals (data not shown). In contrast, stimuli appliedto the ablated side were much less likely to generate fast escaperesponses, whereas the occurrence of longer-latency, slowerbehavioral responses accompanied by smaller, delayed electric fieldpotentials increased significantly (Fig.7B–D) (Wilcoxon matchedpairs, short-latency escapes intact vs ablated, P0.0273; long-latencyescapes intact vs ablated, P0.0488). These data support theconclusion that activation of the Mauthner cell is required to generatethe phasic electric field potentials associated with fast, C-start escaperesponses. In addition, the results suggest that the small-amplitude,curare-resistant field potential that precedes the large, phasic signalduring C-start responses is generated by the Mauthner cell actionpotential (see Fig.3).
Sensory denervation reduces behavioral responsiveness andgeneration of electric field potentials
The surface of the head is innervated by mechanosensitive trigeminalneurons that are expected to mediate the sensory component ofbehaviors evoked by head-directed water jets (Kimmel andWesterfield, 1990; Saint-Amant and Drapeau, 1998b). Trigeminalcell bodies are located behind the eye and extend their peripheralaxon arbors into the skin (Sagasti et al., 2005). To determine theeffect of sensory denervation on escape behavior and the generationof electric field potentials, the neurons of the trigeminal ganglionwere unilaterally ablated in four animals at 3d.p.f. (Fig.8A).Ablations were performed using transgenic zebrafish[Tg(isl2b:GFP)] that express GFP in early-arising trigeminal neurons(Pittman et al., 2008). Behavioral responses and electric field
0
10
20
30
40
50
60
2 6 10 14 18 22 26 30 34 38
Short latency
Long latency
A
0
5
15
20
25
Long latency
Short latencyB
Angle (5 deg bin–1)
Latency (2 ms bin–1)
Num
ber
of e
vent
s
15 45 75 105 135 165 195 225 255
10
Fig.5. Bimodal distribution of escape behaviors. (A)Values of responselatencies evoked at 3–5d.p.f. were binned and plotted in histogram form.The data were fitted with the sum of two Gaussian functions using theequation:
(dashed gray line). This bimodal distribution defined short- and long-latencyescapes with mean (±s.d.) latencies of 5.7±2 and 23±1ms, respectively.(B)Changes in head trajectory were binned, plotted in histogram form andfitted as described in A. Filled and open bars correspond to short- andlong-latency responses defined in A, respectively. Mean (±s.d.) changes intrajectory were 185.1±2.5deg and 64.8±6deg for short- and long-latencyescapes, respectively, N=20 animals. In response to 350 stimuli, escapebehavior was evoked in 280 trials. The remaining 70 stimuli failed to elicitescape behavior. Included in this category are trials in which the animalrighted itself after being knocked over by the stimulus jet. Trials that did notresult in escape behavior are not shown.
f (x ) = Aii = 2
n
∑ e− (x − μi )2 /2Qi2
Qi 2π+ C ,
Table1. Electrical field potential and behavioral responseparameters (N20 animals) (see Fig.6)
Short latency Long latency
Electric field potentialDelay (ms) 7.1±3.7 26.6±11.8Duration (ms) 1.7±0.4 24.9±14.3Amplitude (mV) 0.83±0.4 0.07±0.05
Behavioral responseDelay (ms) 11±3 33±11Duration (ms) 12±2 20±6Angle (deg) 174±16 84±35
Values are means ± s.d.
THE JOURNAL OF EXPERIMENTAL BIOLOGY

1034
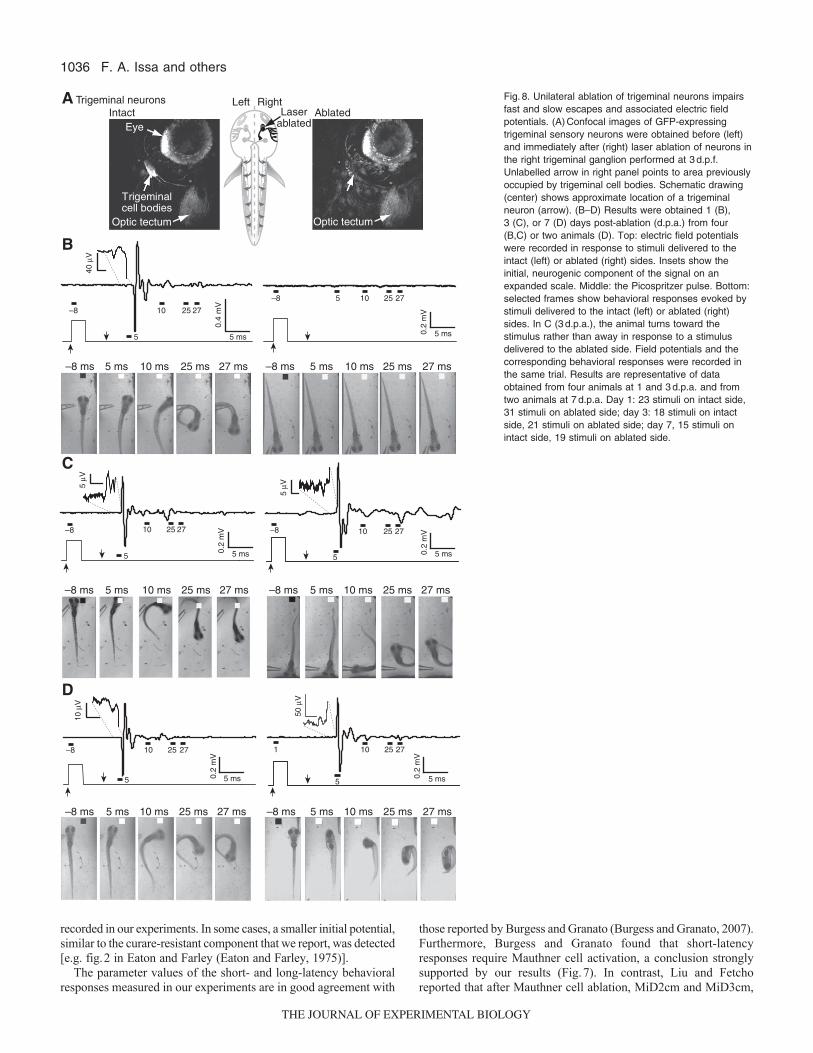
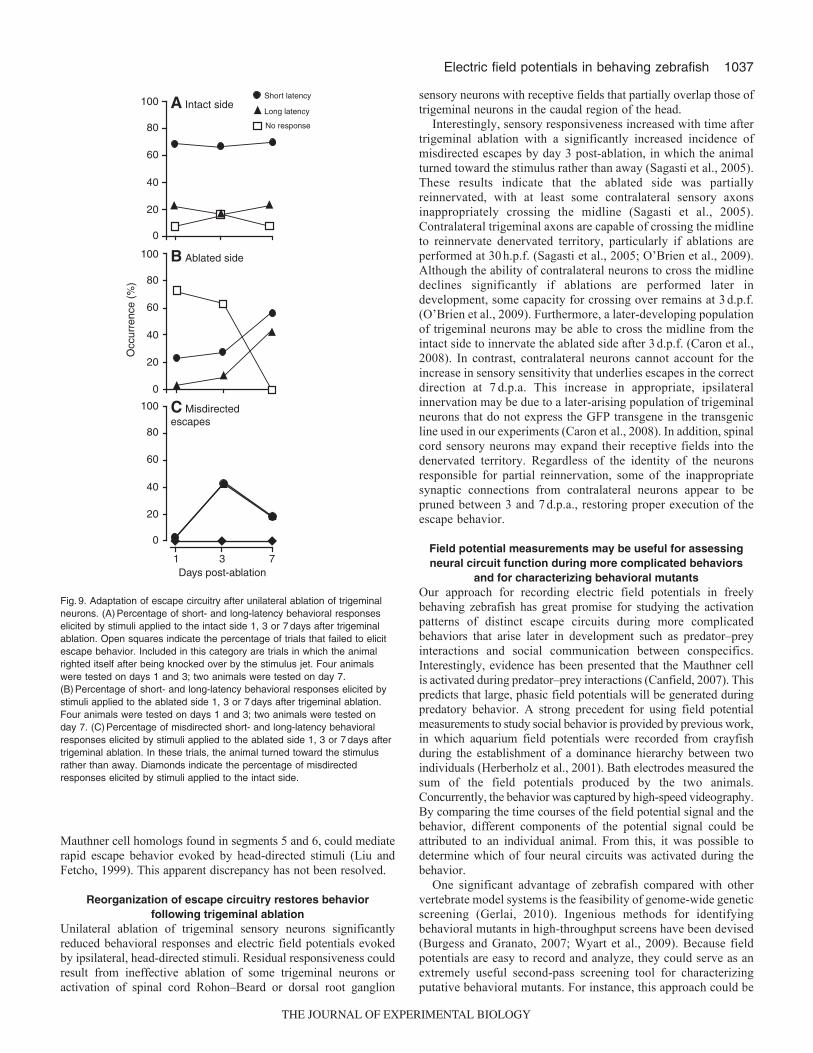
potentials were recorded 16–24h following ablation. One day afterablation, more than 90% of stimuli applied to the intact side evokedbehavioral responses, the majority of which were fast escapesaccompanied by large, phasic field potential signals (Fig.8B, leftpanel; Fig.9A). In contrast, fewer than 30% of stimuli delivered tothe ablated side evoked behavioral responses, the majority of whichwere short-latency escapes (Fig.8B, right panel; Fig.9B). UnlikeMauthner cell ablation, which increased the frequency of long-latency escapes (Fig.7D), trigeminal ablation significantly reducedthe occurrence of both short- and long-latency escape behaviors,consistent with diminished sensory sensitivity (Fig.9B). As
F. A. Issa and others
expected, in the absence of escape behavior, electric field potentialsignals were not detected (Fig.8B).
Escape behavior and associated field potentials partiallyrecover after sensory ablation
To determine whether there were behavioral and/or physiologicaladaptations to trigeminal denervation, we tested the animals’sensitivity to sensory stimulation 3 and 7days post-ablation (d.p.a.).After 3d.p.a., a significant fraction of escapes evoked by stimuli onthe ablated side were improperly executed, with the animal turningtowards the stimulus rather than away in 43% of trials (Fig.8C;Fig.9C). However, the overall response rate remained low (Fig.9B).This behavioral abnormality was not observed when stimuli weredelivered to the intact side (Fig.9C). In control (unablated) animals,misdirected escapes were seen in less than 2% of trials (7 out of436) (data not shown).
Two of the four ablated animals survived 7d.p.a. In theseanimals, the effectiveness of stimuli delivered to the ablated sidehad improved significantly so that all stimuli evoked either short-or long-latency escape responses accompanied by their characteristicfield potential signals (Fig.8D, Fig.9B). Furthermore, the animalswere more likely to turn in the correct direction at 7d.p.a. than at3d.p.a. The percentage of improperly executed escapes declined to18% (Fig.9C).
DISCUSSIONField potential signals monitor activity of distinct neural
circuits controlling short- and long-latency escape behaviorin freely behaving zebrafish
We have shown that electric field potentials generated by zebrafishduring short- and long-latency escapes can be readily detected inhigh resistance (15M) water using dipole electrodes immersed inthe bath. This approach makes it feasible to monitor activation ofthe distinct neural circuits that underlie these behaviors in completelyunfettered animals (Eaton and Farley, 1975; Eaton et al., 1977a;Prugh et al., 1982). In contrast, animals must be restrained to studycircuit activation optically using Ca2+-sensitive dyes or proteins(Fetcho and Higashijima, 2004; Arrenberg et al., 2009; Wyart etal., 2009). We found that short-latency, C-start escapes requiredactivation of the Mauthner cell and were accompanied bystereotyped large, phasic field potentials. In contrast, long-latencyescapes were independent of the Mauthner cell and were associated
A
B
0
10
20
30
40
50
60D
elay
(m
s)
0
10
20
30
40
50
Du
ratio
n (
ms)
0
0.2
0.4
0.6
0.8
1
1.2
Am
plit
ud
e (m
V)
0
10
20
30
40
50
Del
ay (
ms)
0
10
20
30
Du
ratio
n (
ms)
Shortlatency
Longlatency
0
40
80
120
160
200
An
gle
(de
g)
C
*** ***
***
***
***
***
Shortlatency
Longlatency
60
40
50
0 1 20
10
20
30
Short latencyLong latency
Amplitude (mV)
Max
. ang
ular
velo
city
(de
g m
s–1) D
Fig.6. Quantitative differences between field potentials generated by short-(filled) and long-latency (open) behaviors evoked at 3–5d.p.f. (A)Meandelay values for electric field potential signals (left) and escape behaviors(right). Field potential delays were measured as described in the legends toFig.2B and Fig. 4B. Behavioral delays were measured as the intervalbetween arrival of the stimulus and the first detectable movement. (B)Meandurations of electric field potential signals (left) and escape behaviors(right). Field potential durations were measured as described in the legendsto Fig.2B and Fig.4B. Escape behavior durations were measured from thefirst detectable movement to full flexion. (C)Mean amplitudes of electricfield potential signals (left) and maximum changes in head trajectory (right)during escape behaviors. Field potential amplitudes were measured asdescribed in the legends to Fig.2B and Fig.4B. Changes in head trajectorywere measured as described in the legend to Fig.1C. Numerical values forall parameters (±s.d.) are provided in Table1, N20. ***, P<0.0005 (two-tailed Wilcoxon matched-pairs test). Escape behavior was elicited in 280out of 350 trials. Trials that failed to evoke escape behavior are not shown.(D)Relationship between the maximal angular velocities of short- and long-latency escapes and the corresponding field potential signals. Each symbolrepresents the mean of data collected from an individual animal.
THE JOURNAL OF EXPERIMENTAL BIOLOGY

1035Electric field potentials in behaving zebrafish
with more variable, smaller amplitude field potentials. The fieldpotential signals measured in our experiments originate primarilyfrom muscle, although an initial, small, curare-resistant componentassociated with C-start escapes is likely to correspond to theMauthner cell action potential. We were able to record this smallneurogenic spike because the chamber was filled with distilled water,thereby reducing the dissipation of the electric field and enhancingthe signal-to-noise ratio.
The field potential signals associated with short- and long-latencybehavioral responses are quantitatively distinct and highlyreproducible. These signals can be measured repeatedly within asingle experimental session or in the same animal at differentdevelopmental times (supplementary material Fig.S2). Therefore,this approach is advantageous for studying changes in sensorysensitivity, short-term plasticity, long-term memory and remodelingof the underlying neural circuitry during behavioral adaptation inresponse to experimental perturbations.
The amplitude and time course of field potential signals associatedwith short- and long-latency escapes differed significantly. This
reflects differences in the neural circuits that control these behaviors.During short-latency escapes, the Mauthner cell directly activateslarge, contralateral primary motor neurons that innervate fast twitchmuscles, which contract rapidly and nearly synchronously (McLeanet al., 2008). Field potentials generated by individual muscle fiberssum to generate the large, phasic signal measured in our experiments.In contrast, during Mauthner-independent, long-latency escapes,sensory neurons recruit different classes of premotor excitatoryinterneurons depending on stimulus strength (McLean et al., 2008).Activation of the multi-synaptic and variable circuits that underlielong-latency escapes results in asynchronous activation of musclefibers, which generates the heterogeneous field potential signalsmeasured in our experiments.
Previously, phasic field potentials have been recorded fromzebrafish embedded in gelatin or confined to a drop of saline toosmall to accommodate the entire escape response (Eaton and Farley,1975; Eaton et al., 1977b; Prugh et al., 1982). Although these signalswere attributed to Mauthner cell activity, they strongly resemble thelarge, phasic, myogenic potentials associated with C-start escapes
A Mauthner neuron
Intact Ablated
Mauthnercell body AblatedIntact
B
0.2
mV
5 ms
Field recording
C–8 ms 5 ms 10 ms 15 ms 20 ms
–8
5
10 15 20
–8 ms 32 ms 42 ms 52 ms 72 ms
0.2
mV
20 ms
Field recording
–8 32 42 52 72
Intact side Ablated side
Occ
urre
nce
(%)
0
20
40
60 D
Left Right
Laserablated
Short latency
Long latency
No response
Fig.7. Unilateral Mauthner ablationimpairs fast escape and associatedelectric field potentials. (A)Confocalimages of dye-filled Mauthner cellbodies were obtained before (left) andimmediately after (right) laser ablation ofthe right Mauthner cell performed at4d.p.f. Schematic drawing (center)shows approximate Mauthner celllocation (arrow). (B)Electric fieldpotentials (top) were recorded inresponse to stimuli delivered to theintact (left) or ablated (right) sides at5d.p.f. The lower trace corresponds tothe Picospritzer pulse. (C)Selectedframes show behavioral responsesevoked by stimuli delivered to the intact(left) or ablated (right) sides. Behavioralresponses correspond with the fieldpotentials shown in B. Representativeresults are shown in B and C.(D)Percentage of short- and long-latency scape responses to stimulidelivered to the intact and ablated sides.Results were obtained from nineanimals in which 81 and 94 stimuli wereapplied to the intact and ablated sides,respectively. Gray bars indicate thepercentage of trials that failed to elicitescape behavior. Included in thiscategory are trials in which the animalrighted itself after being knocked over bythe stimulus jet.
THE JOURNAL OF EXPERIMENTAL BIOLOGY
1036
recorded in our experiments. In some cases, a smaller initial potential,similar to the curare-resistant component that we report, was detected[e.g. fig.2 in Eaton and Farley (Eaton and Farley, 1975)].
The parameter values of the short- and long-latency behavioralresponses measured in our experiments are in good agreement with
F. A. Issa and others
those reported by Burgess and Granato (Burgess and Granato, 2007).Furthermore, Burgess and Granato found that short-latencyresponses require Mauthner cell activation, a conclusion stronglysupported by our results (Fig.7). In contrast, Liu and Fetchoreported that after Mauthner cell ablation, MiD2cm and MiD3cm,
–8
5
10 25 27
–8 5 10 25 27
Left RightLaser
ablatedAblated
Optic tectum
IntactEye
Trigeminalcell bodies
Optic tectum
A Trigeminal neurons
0.4
mV
5 ms
B
–8 ms 5 ms 10 ms 25 ms 27 ms
–8
5
10 25 27 1
5
10 25 27
D
5 ms0.2
mV
–8
5
10 25 27 –8
5
10 25 27
C
5 ms0.2
mV
5 ms0.2
mV
5 ms0.2
mV
5 ms0.2
mV
–8 ms 5 ms 10 ms 25 ms 27 ms
–8 ms 5 ms 10 ms 25 ms 27 ms –8 ms 5 ms 10 ms 25 ms 27 ms
–8 ms 5 ms 10 ms 25 ms 27 ms –8 ms 5 ms 10 ms 25 ms 27 ms
10 µ
V40
µV
50 µ
V
5 µV5
µV
Fig.8. Unilateral ablation of trigeminal neurons impairsfast and slow escapes and associated electric fieldpotentials. (A)Confocal images of GFP-expressingtrigeminal sensory neurons were obtained before (left)and immediately after (right) laser ablation of neurons inthe right trigeminal ganglion performed at 3d.p.f.Unlabelled arrow in right panel points to area previouslyoccupied by trigeminal cell bodies. Schematic drawing(center) shows approximate location of a trigeminalneuron (arrow). (B–D) Results were obtained 1 (B),3 (C), or 7 (D) days post-ablation (d.p.a.) from four(B,C) or two animals (D). Top: electric field potentialswere recorded in response to stimuli delivered to theintact (left) or ablated (right) sides. Insets show theinitial, neurogenic component of the signal on anexpanded scale. Middle: the Picospritzer pulse. Bottom:selected frames show behavioral responses evoked bystimuli delivered to the intact (left) or ablated (right)sides. In C (3d.p.a.), the animal turns toward thestimulus rather than away in response to a stimulusdelivered to the ablated side. Field potentials and thecorresponding behavioral responses were recorded inthe same trial. Results are representative of dataobtained from four animals at 1 and 3d.p.a. and fromtwo animals at 7d.p.a. Day 1: 23 stimuli on intact side,31 stimuli on ablated side; day 3: 18 stimuli on intactside, 21 stimuli on ablated side; day 7, 15 stimuli onintact side, 19 stimuli on ablated side.
THE JOURNAL OF EXPERIMENTAL BIOLOGY
1037Electric field potentials in behaving zebrafish
Mauthner cell homologs found in segments 5 and 6, could mediaterapid escape behavior evoked by head-directed stimuli (Liu andFetcho, 1999). This apparent discrepancy has not been resolved.
Reorganization of escape circuitry restores behaviorfollowing trigeminal ablation
Unilateral ablation of trigeminal sensory neurons significantlyreduced behavioral responses and electric field potentials evokedby ipsilateral, head-directed stimuli. Residual responsiveness couldresult from ineffective ablation of some trigeminal neurons oractivation of spinal cord Rohon–Beard or dorsal root ganglion
sensory neurons with receptive fields that partially overlap those oftrigeminal neurons in the caudal region of the head.
Interestingly, sensory responsiveness increased with time aftertrigeminal ablation with a significantly increased incidence ofmisdirected escapes by day 3 post-ablation, in which the animalturned toward the stimulus rather than away (Sagasti et al., 2005).These results indicate that the ablated side was partiallyreinnervated, with at least some contralateral sensory axonsinappropriately crossing the midline (Sagasti et al., 2005).Contralateral trigeminal axons are capable of crossing the midlineto reinnervate denervated territory, particularly if ablations areperformed at 30h.p.f. (Sagasti et al., 2005; O’Brien et al., 2009).Although the ability of contralateral neurons to cross the midlinedeclines significantly if ablations are performed later indevelopment, some capacity for crossing over remains at 3d.p.f.(O’Brien et al., 2009). Furthermore, a later-developing populationof trigeminal neurons may be able to cross the midline from theintact side to innervate the ablated side after 3d.p.f. (Caron et al.,2008). In contrast, contralateral neurons cannot account for theincrease in sensory sensitivity that underlies escapes in the correctdirection at 7d.p.a. This increase in appropriate, ipsilateralinnervation may be due to a later-arising population of trigeminalneurons that do not express the GFP transgene in the transgenicline used in our experiments (Caron et al., 2008). In addition, spinalcord sensory neurons may expand their receptive fields into thedenervated territory. Regardless of the identity of the neuronsresponsible for partial reinnervation, some of the inappropriatesynaptic connections from contralateral neurons appear to bepruned between 3 and 7d.p.a., restoring proper execution of theescape behavior.
Field potential measurements may be useful for assessingneural circuit function during more complicated behaviors
and for characterizing behavioral mutantsOur approach for recording electric field potentials in freelybehaving zebrafish has great promise for studying the activationpatterns of distinct escape circuits during more complicatedbehaviors that arise later in development such as predator–preyinteractions and social communication between conspecifics.Interestingly, evidence has been presented that the Mauthner cellis activated during predator–prey interactions (Canfield, 2007). Thispredicts that large, phasic field potentials will be generated duringpredatory behavior. A strong precedent for using field potentialmeasurements to study social behavior is provided by previous work,in which aquarium field potentials were recorded from crayfishduring the establishment of a dominance hierarchy between twoindividuals (Herberholz et al., 2001). Bath electrodes measured thesum of the field potentials produced by the two animals.Concurrently, the behavior was captured by high-speed videography.By comparing the time courses of the field potential signal and thebehavior, different components of the potential signal could beattributed to an individual animal. From this, it was possible todetermine which of four neural circuits was activated during thebehavior.
One significant advantage of zebrafish compared with othervertebrate model systems is the feasibility of genome-wide geneticscreening (Gerlai, 2010). Ingenious methods for identifyingbehavioral mutants in high-throughput screens have been devised(Burgess and Granato, 2007; Wyart et al., 2009). Because fieldpotentials are easy to record and analyze, they could serve as anextremely useful second-pass screening tool for characterizingputative behavioral mutants. For instance, this approach could be
0
20
40
60
80
100
0
20
40
60
80
100
1 3 7
0
20
40
60
80
100
Occ
urre
nce
(%)
Short latency
Long latency
No response
Days post-ablation
A Intact side
B Ablated side
C Misdirectedescapes
Fig.9. Adaptation of escape circuitry after unilateral ablation of trigeminalneurons. (A)Percentage of short- and long-latency behavioral responseselicited by stimuli applied to the intact side 1, 3 or 7days after trigeminalablation. Open squares indicate the percentage of trials that failed to elicitescape behavior. Included in this category are trials in which the animalrighted itself after being knocked over by the stimulus jet. Four animalswere tested on days 1 and 3; two animals were tested on day 7.(B)Percentage of short- and long-latency behavioral responses elicited bystimuli applied to the ablated side 1, 3 or 7days after trigeminal ablation.Four animals were tested on days 1 and 3; two animals were tested onday 7. (C)Percentage of misdirected short- and long-latency behavioralresponses elicited by stimuli applied to the ablated side 1, 3 or 7days aftertrigeminal ablation. In these trials, the animal turned toward the stimulusrather than away. Diamonds indicate the percentage of misdirectedresponses elicited by stimuli applied to the intact side.
THE JOURNAL OF EXPERIMENTAL BIOLOGY

1038 F. A. Issa and others
used to identify mutations that specifically affect one of the distinctneural circuits that control short- and long-latency escapebehaviors.
CONCLUSIONSRecording electric field potentials generated during escape behavioris a simple and robust technique for monitoring the activation andfunction of neural circuits in zebrafish. Circuit activity and plasticitycan be tracked with minimal impact on natural behavior. Individualanimals can be tested repeatedly to address behavioral,developmental and regenerative questions related to the function ofthe Mauthner and non-Mauthner escape circuits. Future applicationsof this approach include studies of learning and memory, analysisof neural circuit function during more complicated behaviors andcharacterization of putative behavioral mutants identified in high-throughput genetic screens.
ACKNOWLEDGEMENTSWe are grateful to members of the Papazian laboratory for their comments on themanuscript. We thank Dr Franklin Krasne (UCLA) for providing the differentialamplifier. Supported by NIH grant NS058500 to D.M.P. Deposited in PMC forrelease after 12 months.
REFERENCESAbraham, E., Palevitch, O., Gothilf, Y. and Zohar, Y. (2009). The zebrafish as a
model system for forebrain GnRH neuronal development. Gen. Comp. Endocrinol.164, 151-160.
Arrenberg, A. B., Del Bene, F. and Baier, H. (2009). Optical control of zebrafishbehavior with halorhodopsin. Proc. Natl. Acad. Sci. USA 106, 17968-17973.
Blader, P. and Strähle, U. (2000). Zebrafish developmental genetics and centralnervous system development. Hum. Mol. Genet. 9, 954-951.
Brustein, E., Marandi, N., Kovalchuk, Y., Drapeau, P. and Konnerth, A. (2003). “Invivo” monitoring of neuronal network activity in zebrafish by two-photon Ca2+
imaging. Pflügers Arch. 446, 766-773.Burgess, H. A. and Granato, M. (2007). Sensorimotor gating in larval zebrafish. J.
Neurosci. 27, 4984-4994.Canfield, J. (2007). Some voluntary C-bends may be Mauthner neuron initiated. J.
Comp. Physiol. 193, 1055-1064.Caron, S. J., Prober, D., Choy, M. and Schier, A. F. (2008). In vivo birthdating by
BAPTISM reveals that trigeminal sensory neuron diversity depends on earlyneurogenesis. Development 135, 3259-3269.
Didomenico, R., Nissanov, J. and Eaton, R. C. (1988). Lateralization and adaptationof a continuously variable behavior following lesions of a reticulospinal commandneuron. Brain Res. 473, 15-28.
Drapeau, P., Ali, D. W., Buss, R. R. and Saint-Amant, L. (1999). In vivo recordingfrom identifiable neurons of the locomotor network in the developing zebrafish. J.Neurosci. Methods 88, 1-13.
Eaton, R. C. and Farley, R. D. (1975). Mauthner neuron field potential in newlyhatched larvae of the zebra fish. J. Neurophysiol. 38, 502-512.
Eaton, R. C., Bombardieri, R. A. and Meyer, D. L. (1977a). Mauthner-initiated startleresponse in teleost fish. J. Exp. Biol. 66, 65-81.
Eaton, R. C., Farley, R. D., Kimmel, C. B. and Schabtach, E. (1977b). Functionaldevelopment in Mauthner cell system of embryos and larvae of zebra fish. J.Neurobiol. 8, 151-172.
Eaton, R. C., Lee, R. K. K. and Foreman, M. B. (2001). The Mauthner cell and otheridentified neurons of the brainstem escape network of fish. Prog. Neurobiol. 63, 467-485.
Faber, D. S., Fetcho, J. R. and Korn, H. (1989). Neuronal networks underlying theescape response in goldfish-general implications for motor control. Ann. N. Y. Acad.Sci. 563, 11-33.
Fetcho, J. R. (2007). The utility of zebrafish for studies of the comparative biology ofmotor systems. J. Exp. Zool. B Mol. Dev. Evol. 308, 550-562.
Fetcho, J. R. and Higashijima, S. (2004). Optical and genetic approaches towardunderstanding neuronal circuits in zebrafish. Integr. Comp. Biol. 44, 57-70.
Fetcho, J. R. and O’Malley, D. M. (1997). Imaging neuronal networks in behavinganimals. Curr. Opin. Neurobiol. 7, 832-838.
Fetcho, J. R., Cox, K. J. A. and O’Malley, D. M. (1997). Imaging neural activity withsingle cell resolution in an intact, behaving vertebrate. Biol. Bull. 192, 150-153.
Gerlai, R. (2010). High-throughput behavioral screens: the first step towards findinggenes involved in vertebrate brain function using zebrafish. Molecules 15, 2609-2622.
Grantyn, A., Hardy, O. and Gourdon, A. (1992). Relationships between task-relateddischarge patterns and axonal morphology of brainstem projection neurons involvedin orienting eye and head movements. In Vestibular and Brain Stem Control of Eye,Head and Body Movements (ed. H. Shimazu and Y. Shinoda), pp. 255-273. Tokyo:Karger.
Hatta, K. and Kimmel, C. B. (1993). Midline structures and central nervous systemcoordinates in zebrafish. Perspect. Dev. Neurobiol. 1, 257-268.
Herberholz, J., Issa, F. A. and Edwards, D. H. (2001). Patterns of neural circuitactivation and behavior during dominance hierarchy formation in freely behavingcrayfish. J. Neurosci. 21, 2759-2767.
Higashijima, S., Masino, M. A., Mandel, G. and Fetcho, J. R. (2003). Imagingneuronal activity during zebrafish behavior with a genetically encoded calciumindicator. J. Neurophysiol. 90, 3986-3997.
Kimmel, C. B. and Westerfield, M. (1990). Primary neurons of the zebrafish. InSignals and Senses (ed. M. Wiederhold), pp. 561-588. New York: Wiley Liss.
Kimmel, C. B., Patterson, J. and Kimmel, R. O. (1974). The development andbehavioral characteristics of the startle response in the zebra fish. Dev. Psychobiol.7, 47-60.
Kohashi, T. and Oda, Y. (2008). Initiation of Mauthner- or non-Mauthner-mediated fastescape evoked by different modes of sensory input. J. Neurosci. 28, 10641-10653.
Liu, K. S. and Fetcho, J. R. (1999). Laser ablations reveal functional relationships ofsegmental hindbrain neurons in zebrafish. Neuron 23, 325-335.
McDearmid, J. R. and Drapeau, P. (2006). Rhythmic motor activity evoked by NMDAin the spinal zebrafish larva. J. Neurophysiol. 95, 401-417.
McLean, D. L., Masino, M. A., Koh, I. Y. Y., Lindquist, W. B. and Fetcho, J. F.(2008). Continuous shifts in the active set of spinal interneurons during changes inlocomotor speed. Nat. Neurosci. 11, 1419-1429.
Mione, M., Baldessari, D., Deflorian, G., Nappo, G. and Santoriello, C. (2008). Howneuronal migration contributes to the morphogenesis of the CNS: insights from thezebrafish. Dev. Neurosci. 30, 65-81.
O’Brien, G. S., Rieger, S., Martin, S. M., Cavanaugh, A. M., Portera-Cailliau, C.and Sagasti, A. (2009). Two-photon axotomy and time-lapse confocal imaging inlive zebrafish embryos. J. Vis. Exp. 24, 1129.
O’Malley, D. M., Kao, Y.-H. and Fetcho, J. F. (1996). Imaging the functionalorganization of zebrafish hindbrain segments during escape behaviors. Neuron 17,1145-1155.
Peterson, B. W. (1984). The reticulospinal system and its role in the control ofmovement. In Brain Stem Control of Spinal Cord Function (ed. C. D. Barnes), pp.27-86. New York: Academic Press.
Petreanu, L., Huber, D., Sobczyk, A. and Svoboda, K. (2007). Channelrhodopsin-2-assisted circuit mapping of long-range callosal projections. Nat. Neurosci. 10, 663-668.
Pittman, A. J., Law, M. Y. and Chien, C. B. (2008). Pathfinding in a large vertebrateaxon tract: Isotypic interactions guide retinotectal axons at multiple choice points.Development 135, 2865-2871.
Prugh, J. I., Kimmel, C. B. and Metcalfe, W. K. (1982). Noninvasive recording of theMauthner neurone action potential in larval zebrafish. J. Exp. Biol. 101, 83-92.
Sagasti, A., Guido, M. R., Raible, D. W. and Schier, A. F. (2005). Repulsiveinteractions shape the morphologies and functional arrangement of zebrafishperipheral sensory arbors. Curr. Biol. 15, 804-814.
Saint-Amant, L. and Drapeau, P. (1998a). Motoneuron activity patterns duringspontaneous locomotor behavior of the zebrafish embryo. Soc. Neurosci. Abstr. 24,1667.
Saint-Amant, L. and Drapeau, P. (1998b). Time course of the development of motorbehaviors in the zebrafish embryo. J. Neurobiol. 37, 622-632.
Tanimoto, M., Ota, Y., Horikawa, K. and Oda, Y. (2009). Auditory input to CNS isacquired coincidentally with development of inner ear after formation of functionalafferent pathway in zebrafish. J. Neurosci. 29, 2762-2767.
Wyart, C., Del Bene, F., Warp, E., Scott. E. K., Trauner, D., Baier, H. and Isacoff,E. Y. (2009). Optogenetic dissection of a behavioural module in the vertebrate spinalcord. Nature 461, 407-410.
Yaksi, E., von Saint Paul, F., Niessing, J., Bundschuh, S. T. and Friedrich, R. W.(2009). Transformation of odor representations in target areas of the olfactory bulb.Nat. Neurosci. 12, 474-482.
Zottoli, S. J. (1977). Correlation of startle reflex and Mauthner cell auditory responsesin unrestrained goldfish. J. Exp. Biol. 66, 243-254.
Zottoli, S. J. and Faber, D. S. (2000). The Mauthner cell: what has it taught us?Neuroscientist 6, 26-38.
Zottoli, S. J., Bentley, A. P., Prendergast, B. J. and Rieff, H. I. (1995). Comparativestudies on the Mauthner cell of teleost fish in relation to sensory input. Brain Behav.Evol. 46, 151-164.
THE JOURNAL OF EXPERIMENTAL BIOLOGY