research article prevention altered gene expression in...
TRANSCRIPT

48
Research Article Cancer
PreventionResearchAltered Gene Expression in Morphologically Normal EpithelialCells from Heterozygous Carriers of BRCA1or BRCA2 Mutations
Alfonso Bellacosa1,9, Andrew K. Godwin2, Suraj Peri3, Karthik Devarajan3, Elena Caretti6, Lisa Vanderveer2,Betsy Bove2, Carolyn Slater2, Yan Zhou3, Mary Daly5, Sharon Howard4, Kerry S. Campbell4,Emmanuelle Nicolas4, Anthony T. Yeung6, Margie L. Clapper5, James A. Crowell7,Henry T. Lynch8, Eric Ross3, Levy Kopelovich7, and Alfred G. Knudson6
Abstract
Authors' AGeneticsBiostatistiControl PrCancer CPrevention,of PreventiNebraska;Regina Ele
Note: Supption Resea
Correspon333 CottmFax: 215-2
doi: 10.115
©2010 Am
Cancer P
Down
We hypothesized that cells bearing a single inherited “hit” in a tumor suppressor gene express analtered mRNA repertoire that may identify targets for measures that could delay or even prevent pro-gression to carcinoma. We report here on the transcriptomes of primary breast and ovarian epithelialcells cultured from BRCA1 and BRCA2 mutation carriers and controls. Our comparison analyses iden-tified multiple changes in gene expression, in both tissues for both mutations, which were validatedindependently by real-time reverse transcription-PCR analysis. Several of the differentially expressedgenes had been previously proposed as cancer markers, including mammaglobin in breast cancerand serum amyloid in ovarian cancer. These findings show that heterozygosity for a mutant tumorsuppressor gene can alter the expression profiles of phenotypically normal epithelial cells in a gene-specific manner; these detectable effects of “one hit” represent early molecular changes in tumorigenesisthat may serve as novel biomarkers of cancer risk and as targets for chemoprevention. Cancer Prev Res;
3(1); 48–61. ©2010 AACR.
Introduction
The notion of multistep carcinogenesis posits that rate-limiting mutations accumulate in a single cell and itsprogeny, marking recognizable histopathologic transi-tions in the target tissues (1, 2). The time required forthis accumulation affords the opportunity to test whetherpharmacologic and/or dietary interventions can delay orprevent the transition to malignancy (3). Early targetedintervention would be optimally performed on personswith a very high risk of developing a specific cancer, as withthose individuals who carry a germline mutation in a geneknown to impose such a risk. Rationale for such an inter-vention is provided by early studies that showed that cells
ffiliations: 1Epigenetics and Progenitor Cells and HumanPrograms, 2Ovarian Cancer Program, 3Department ofcs, 4Division of Basic Science, 5Cancer Prevention andogram, and 6Division of Population Science, Fox Chaseenter, Philadelphia, Pennsylvania; 7Division of CancerNational Cancer Institute, Bethesda, Maryland; 8Department
ve Medicine and Public Health, Creighton University, Omaha,and 9Laboratory of Developmental Therapeutics, Istitutona, Rome, Italy
lementary data for this article are available at Cancer Preven-rch Online (http://cancerprevres.aacrjournals.org/).
ding Author: Alfonso Bellacosa, Fox Chase Cancer Center,an Avenue, Philadelphia, PA 19111. Phone: 215-728-4012;14-1623; E-mail: [email protected].
8/1940-6207.CAPR-09-0078
erican Association for Cancer Research.
rev Res; 3(1) January 2010
Cancer Resecancerpreventionresearch.aacrjournals.orloaded from
heterozygous for a cancer-predisposing mutation couldshow abnormalities in tissue cultures; “one-hit” effectsin heterozygous cells were seen in morphologically nor-mal cultured fibroblasts and in epithelial cells derivedfrom familial adenomatous polyposis patients (4–6). Fur-thermore, we have recently reported specific changes inprotein expression in colonic epithelial cells from familialadenomatous polyposis patients (7). Support for the sig-nificance of these early changes comes from observationsof similar aberrations in corresponding cancer cells (7–9).Such changes may play a role in progression to malignan-cy and therefore constitute targets for strategies to delay orprevent such progression in familial adenomatous poly-posis and in other genetic predispositions to cancer.With this rationale in mind, we have undertaken an in-
vestigation of two of the most common predisposinggenes, BRCA1 (10, 11) and BRCA2 (refs. 12, 13, and refer-ences therein), in two important target tissues, breast andovary. We note that previous reports on benign cells asso-ciated with breast cancer already suggest the possibility ofsuch heterozygous effects.We have compared the transcriptomes of primary
breast and ovarian epithelial cultures from patients pre-disposed to cancer, bearing monoallelic BRCA1 orBRCA2 mutations, with corresponding cultures fromcontrol individuals. We show that the morphologicallynormal epithelial cells from mutation carriers exhibitabnormalities in a gene- and tissue-specific manner, consis-tent with detectable single-hit effects. These alterations
arch. on June 18, 2018. © 2010 American Association forg

mRNA Changes in Single-Hit BRCA1/2 Primary Cells
constitute possiblemolecular targets for intervention on thepath to cancer.
Materials and Methods
Subject accrual and biopsy specimensAll the subjects were recruited with the approval of the
Fox Chase Cancer Center Institutional Review Board,irrespective of gender, race, and age. Individuals witha personal history of cancer and subjects treated previouslywith either chemotherapy or radiation were ineligible. Eli-gible cases included unaffected at-risk women in the FoxChase Family Risk Assessment Program who were shownto be carriers of BRCA1 or BRCA2 mutations. In particular,six BRCA1, six BRCA2 mutation carriers, and six healthycontrols were accrued for breast specimens and an equalnumber for ovary specimens. Normal breast and ovaryspecimens were obtained by prophylactic oophorectomyor mastectomy or breast reduction surgery.
Cell culture establishmentSurgical breast specimens were placed in transport me-
dium (serum-free Ham's F-12), containing 100 U/mLpenicillin, 100 μg/mL of streptomycin, 10 μg/mL cipro-floxacin, 10 μg/mL gentamicin, 2.5 μg/mL of Amphoter-icin B, and 100 U/mL of Nystatin. The tissue was finelyminced using sterile disposable scalpels and was trans-ferred to a tube containing 25 mL of 200 U/mL solutionof collagenase (Sigma) prepared in DMEM with 2 g/liter
www.aacrjournals.org
Cancer Resecancerpreventionresearch.aacrjournals.orDownloaded from
of NaHCO3, supplemented with 160 U/mL of Hyaluron-idase, 0.5 μg/mL hydrocortisone, 10 μg/mL insulin, 10mL of Antibiotic/Antimycotic (Life Technologies), and10% horse serum. The tissue was digested overnight at37°C in a rotating water bath and then centrifuged at2,200 rpm for 10 min. The supernatant was carefullydecanted to a sterile tube. The tissue was rinsed fourtimes with transport medium, resuspended in culturemedium, and centrifuged one last time. The tissue wasthen plated in a swine skin gelatin–coated (Sigma) T-25 flask. Cells were cultured for 24 h in high-calciummedium and then refed with low-calcium medium 24h later. High-calcium medium consists of DMEM/F121:1 without calcium (Life Technologies), supplementedwith 5% chelated horse serum, 20 ng/mL epidermalgrowth factor, 100 ng/mL cholera toxin, 10 μg/mL insu-lin, 0.5 μg/mL hydrocortisone, 1.05 mmol/L calciumchloride, 100 U/mL penicillin, 100 μg/mL streptomycin,10 μg/mL ciprofloxacin, and 0.25 μg/mL AmphotericinB. Low-calcium medium was the same recipe supple-mented with 0.04 mmol/L calcium chloride (14). Cellswere cultured 4 to 6 wk until the flask was confluent.Oophorectomy specimens were collected under aseptic
conditions and placed in a transport medium (M199:MCDB105, 1:1) supplemented with 100 U/mL penicil-lin, 100 μg/mL streptomycin, and 2 mmol/L L-gluta-mine. The ovaries were processed to establishepithelial cell cultures by gently scraping the ovariansurface with a rubber policeman. Cells were centrifugedand resuspended in fresh medium (M199:MCDB105,
Fig. 1. Primary cultures of normal breast(A-C) and ovarian (D-F) epithelial cellsfrom control individuals (A and D), BRCA1mutation carriers (B and E), and BRCA2mutation carriers (C and F). For eachtissue of origin, cellular morphology issimilar, irrespective of genotype.
Cancer Prev Res; 3(1) January 2010 49
arch. on June 18, 2018. © 2010 American Association forg

Bellacosa et al.
Ca50
Table 1. Demographic and mutation data of the patients enrolled in this study
SampleID
ncer Prev R
Download
Epithelialculture
es; 3(1) Janu
caned from
BRCA
ary 2010
cerpreve
Mutation Ag
Cancer ntionresearch.aacrjourna
e
Resls.o
Race
earch. on Jrg
Parity
une 18,
Menopausestatus
C
2018. © 2010
Weight(pounds)
ancer Pre
American
Height(inches)
vention R
Associati
Bodymassindex
218
Breast B1 2800delAA; BRCA1c.2681_2682del4
5 C 2 Post 165 70 23.7256
Breast B1 R1835X; BRCA1c5503C>T (p.R1835X)5
0 C 2 Post 137 62 25.1288
Breast B1 185delAG; BRCA1c.68_69delAG7
0 C 2 Post 116 NA NA349
Breast B1 1997insTAGT; BRCA1c.1878_1879insTAGT2
8 C 0 Pre 127 64 22.5425
Breast B1 T1194I, BRCA1c.3581C>T (pT119I)*4
5 C 5 Pre 126 64 22.3479
Breast B1 R1751X; BRCA1c.5251C>T (p.R1751X)4
8 C 3 Post 211 64 37.4182
Breast B2 6174delT; BRCA2c.5945delT4
4 C 0 Pre 115 66 19.1197
Breast B2 2912delC; BRCA2c.2683delC4
7 C 4 Pre 138 62 25.2285
Breast B2 R2394X; BRCA2c.7181A>T3
7 AA 3 Pre 234 63 41.4300
Breast B2 UN 4 5 C 2 Pre 131 64 23.2 304 Breast B2 K745E; BRCA2c.2233A>G (p.K745E)*6
1 AA 2 Post 204 64 36.1308
Breast B2 UN 5 1 C 0 Post NA NA NA 158 Breast WT — 5 9 C 2 Post 170 NA NA 162 Breast WT — 7 4 C NA Post 130 NA NA 161 Breast WT — 6 9 C 3 Post 125 NA NA 169 Breast WT — 4 9 C 3 Pre NA NA NA 187 Breast WT — 3 1 C 0 Pre 161 65 27.6 181 Breast WT — 3 9 C 0 Post 102 NA NA 166 Ovary B1 IVS16-581del1014;BRCA1-c.4986-581del1014
2
8 C 2 Pre NA NA 18.3183
Ovary B1 IVS12-1632del3835;BRCA1-c.4185-1632del38554
3 C 2 Pre NA NA NA193
Ovary B1 IVS16-581del1014;BRCA1-c.4986-581del10143
7 C 0 Pre NA NA 20.8194
Ovary B1 1632del5-ter503;BRCA1 c.1513del5(p.503X)
4
3 C 2 Pre NA NA NA201
Ovary B1 IVS12-1632del3835;BRCA1-c.4185-1632del3855
4
4 C 3 Pre NA NA 29.4217
Ovary B1 UN 4 6 C NA NA NA NA NA 302 Ovary B2 9663delGT; BRCA1c9434_9435del4
4 C 3 Pre 184 66 28.2206
Ovary B2 9132delC-ter2975;BRCA2 c.8903delC(p.2975X)
3
9 C 2 Pre 110 64 18.9(Continued on the following page)
esearch
on for
mRNA Changes in Single-Hit BRCA1/2 Primary Cells
1:1); supplemented with 5% fetal bovine serum, penicil-lin, streptomycin, glutamine, and 0.3 U/mL insulin; andtransferred to tissue culture flasks coated with skin gela-tin; they were refed every 4 d and passaged once theyreached confluency.All the breast and ovarian samples were treated with the
same tissue-specific culture conditions, including timing forpassaging and harvesting. Importantly, all the samples weredeidentified, including notation on carrier or control status,and no significant difference in growth or apoptosis amongthemwas noted. At harvest, all the cultureswere in log phase.
RNA extraction and amplificationTotal RNA was prepared from cultured cells by extrac-
tion in guanidinium isothiocyanate–based buffer contain-ing β-mercaptoethanol and acid phenol. RNA integritywas evaluated on the Agilent 2100 Bioanalyzer. All sam-ples showed distinct peaks corresponding to intact 28Sand 18S rRNAs and therefore were included in the analy-sis. Amplification of total RNAs was achieved using theone-cycle Ovation biotin system (NuGEN Technologies,Inc.) as described previously (15).
Hybridization and microarray analysisFor each sample, a total of 2.2 μg of ssDNA, labeled
and fragmented with the NuGEN kit, was hybridized toAffymetrix arrays (Human U133 plus 2.0), followingthe manufacturer's instructions as described previously(15). After washing and staining with biotinylated anti-body and streptavidin phycoerythrin, the arrays werescanned with the Affymetrix GeneChip Scanner 3000 fordata acquisition.
www.aacrjournals.org
Cancer Resecancerpreventionresearch.aacrjournals.orDownloaded from
Real-time reverse transcriptase-PCR validation ofmicroarray dataValidation of microarray findings was conducted by real-
time RT-PCR using Taqman low-density arrays (LDA; mi-crofluidic cards from Applied Biosystems). A 48-genecustom-made array (44 candidate biomarkers plus 4house keeping genes) was designed and prepared by Ap-plied Biosystems. The entire panel of 48 genes was testedacross breast and ovarian samples. All samples were testedin quadruplicate to ensure accuracy and reproducibility.Data were obtained in the form of threshold-cycle num-
ber (Ct) for each candidate biomarker identified and thehousekeeping gene HPRT1 for each genotype (BRCA1,BRCA2, and WT). For each gene, the Ct values were nor-malized to the housekeeping gene and the correspondingΔCt values were obtained for each genotype. Relativequantitation was computed using the Comparative Ct
method (Applied Biosystems Reference Manual, User Bul-letin no.2) between BRCA1 mutants and WT primary cellRNAs. The relative quantitation is the ratio of the normal-ized amounts of target for BRCA1 mutant for WT RNAs,and is computed as 2^(−ΔCt) where ΔCt is the differencebetween the mean ΔCt values for BRCA1 mutant and themean ΔCt values for WT RNAs. We repeated the relativequantitation analyses for BRCA2 mutant and WT RNAsamples.
Statistical analysisWe considered breast and ovarian samples for each of
the three genotypes: BRCA1, BRCA2, andmutation negativeor WT. There were six biological replicates in each experi-mental condition resulting in a total of 18 samples for eachtarget organ. For each sample, we obtained probe-leveldata in the form of raw signal intensities for 54,675 probe
Table 1. Demographic and mutation data of the patients enrolled in this study (Cont'd)Table 1. Demographic and mutation data of the patients enrolled in this study (Cont'd)
SampleID
Epithelialculture
BRCA
Mutation Ag e Racearch. on Jg
Parity
une 18,
Menopausestatus
Can
2018. © 2010
Weight(pounds)
cer Prev Re
American
Height(inches)
s; 3(1) Jan
Associati
Bodymassindex
328
Ovary B2 UN 38 C 3 Pre 189 NA NA 431 Ovary B2 6174delT; BRCA2c.5945delT
54 C 0 Post 137 64 24.3470
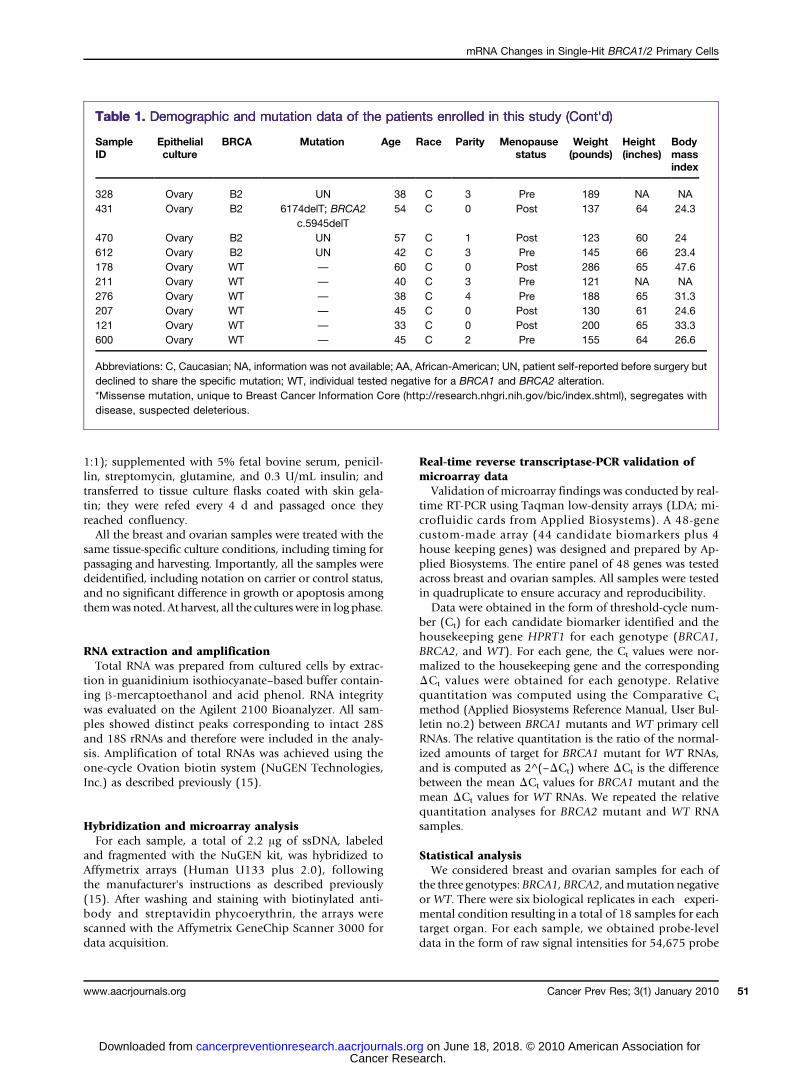
Ovary B2 UN 57 C 1 Post 123 60 24 612 Ovary B2 UN 42 C 3 Pre 145 66 23.4 178 Ovary WT — 60 C 0 Post 286 65 47.6 211 Ovary WT — 40 C 3 Pre 121 NA NA 276 Ovary WT — 38 C 4 Pre 188 65 31.3 207 Ovary WT — 45 C 0 Post 130 61 24.6 121 Ovary WT — 33 C 0 Post 200 65 33.3 600 Ovary WT — 45 C 2 Pre 155 64 26.6Abbreviations: C, Caucasian; NA, information was not available; AA, African-American; UN, patient self-reported before surgery butdeclined to share the specific mutation; WT, individual tested negative for a BRCA1 and BRCA2 alteration.*Missense mutation, unique to Breast Cancer Information Core (http://research.nhgri.nih.gov/bic/index.shtml), segregates withdisease, suspected deleterious.
uary 2010 51
on for

0 http://www.r-project.org1 http://www.bioconductor.org2 http://www.tm4.org3 http://www.ingenuity.com
1
Bellacosa et al.
52
sets from Affymetrix.CEL files. Raw data for each target or-gan were preprocessed separately using the Robust Multi-chip Average method proposed by Irizarry et al. (16, 17).We applied the variance-stabilizing and normalizing
logarithmic transformation to the data before analysis,and used the Local Pooled Error method (18) for classcomparisons. Local Pooled Error is based on pooling er-rors within genes and between replicate arrays for geneswhose expression values are similar. All comparisonswere two sided. The Benjamini-Hochberg step-up method(19) was applied to control the false discovery rate (FDR).Geneswere defined as differentially expressed, based on sta-tistical significance as well as biological significance. Genesshowing a FDR of less than the desired cutoff were consid-ered statistically significant. We accepted a FDR cutoff of0.20 for breast and 0.10 for ovary. These cutoffs were select-ed toobtain similar numbers of genes. Biological significancewas measured as fold change, i.e., the ratio of the mean ex-pression profiles between two conditions. Genes showing>2-fold change in either direction (upregulatedor downregu-lated) were considered biologically significant. Differentiallyexpressed genes from each of the above filters were com-bined, and a list of common genes showing statistical
Cancer Prev Res; 3(1) January 2010
Cancer Resecancerpreventionresearch.aacrjournals.orDownloaded from
and biological significance was identified. These geneswere subsequently validated using RT-PCR. The analytictools available in the R/BioConductor package,10,11
bioNMF (20), and TMev12 were used in these computations.
Data mining analysisPathway and association analyses were conducted to
obtain additional insight into the functional relevance ofthe changes observed. Upregulated and downregulatedgenes for these exploratory analyses were selected as de-scribed above, but using a more relaxed P value cutoff of0.001. Gene ontology functional categories enriched indifferentially expressed genes were identified using condi-tional hyper-geometric tests in the GOstats package (R/BioConductor). A P value cutoff of 0.01 was used in select-ing the Gene ontology terms. Furthermore, gene networkswere generated using Ingenuity Pathways Analysis version6.5 (Ingenuity Systems).13 Gene Set Enrichment Analysis
1
1
1
1
Table 2. Comparison between microarray and LDA data for the candidate breast biomarkers; foldchanges are shown for BRCA1 versus WT and for BRCA2 versus WT comparisons
A. BRCA1 vs WT comparison
Gene symbol
Gene namearch. on June 18g
Affymetrix
C
, 2018. © 2010
LDA
ancer Pre
American A
Taq Man assay
SCGB1D2
Secretoglobin, family 1D, member 2 12 5.2 Hs00255208_m1 SCGB2A1 Secretoglobin, family 2A, member 1 12 2.68 Hs00267180_m1 SCGB2A2 Secretoglobin, family 2A, member 2 3 3.8 Hs00267190_m1 CHI3L1 Chitinase 3-like 1 3 2.24 Hs00609691_m1 MCM6 Minichromosome maintenance complex component 6 2.8 1.37 Hs00195504_m1 MUC1 Mucin 1, cell surface associated 0.5 0.25 Hs00159357_m1 LGALS1 Lectin, galactoside-binding, soluble, 1 0.5 0.33 Hs00169327_m1 KLK10 Kallikrein-related peptidase 10 0.5 0.15 Hs00173611_m1 ANXA8 Annexin A8 0.4 0.14 Hs00179940_m1 TNS4 Tensin 4 0.3 0.08 Hs00262662_m1 MUC16 Mucin 16, cell surface associated 0.3 0.17 Hs00226715_m1 GJB2 Gap junction protein, β 2, 26 kDa 0.2 0.12 Hs00269615_s1B. BRCA2 vs WT comparison
IGFBP5
Insulin-like growth factor-binding protein 5 10 0.99 Hs00181213_m1 SPP1 Secreted phosphoprotein 1 (osteopontin) 3 2.3 Hs00167093_m1 RRM2 Ribonucleotide reductase M2 polypeptide 0.58 0.39 Hs00357247_g1 TNS4 Tensin 4 0.5 0.45 Hs00262662_m1 TNFSF13 Tumor necrosis factor superfamily, member 13 0.5 0.56 Hs00601664_g1 SFN Stratifin 0.5 0.34 Hs00356613_m1 KRT14 Keratin 14 0.5 0.07 Hs00559328_m1 CENPA Centromere protein A 0.5 0.57 Hs00156455_m1 BIRC5 Baculoviral IAP repeat-containing 5 0.5 0.43 Hs00153353_m1 MUC16 Mucin 16, cell surface associated 0.25 0.2 Hs00226715_m1 PAX8 Paired box gene 8 0.2 0.61 Hs00247586_m1vention Research
ssociation for

mRNA Changes in Single-Hit BRCA1/2 Primary Cells
(GSEA; ref. 21) was performed against the lists of differ-entially expressed genes for BRCA1-WT and BRCA2-WTcomparisons. Gene sets from MSigDB (21), includingpositional, curated, motif, and computational sets, weretested. Default parameters were chosen, except that themaximum intensity of probes was only selected whilecollapsing probe sets for a single gene.Next, we compiled and analyzed publicly available mi-
croarray gene expression data from the following: (a) astudy of mammary gland side population cells (22);(b) a study of two different human breast epithelial celltypes, breast primary epithelial cells (BPEC) and humanmammary epithelial cells (HMEC), compared with theirtransformed counterparts (23); (c) a molecular character-ization of cancer stem cells in MMTV-Wnt1 murinebreast tumors (24); (d) profiles of hereditary breast can-cer (25); and (e) a set of annotated genes involvedin DNA damage repair. The data from these studies
www.aacrjournals.org
Cancer Resecancerpreventionresearch.aacrjournals.orDownloaded from
were analyzed (a description of the methods is given inSupplementary Materials). The differentially expressedgenes between BRCA1, BRCA2, and WT from our studywere compared against the above mentioned gene setsusing GSEA.
Results
Genome-wide transcriptome analysis of single-hitBRCA1 and BRCA2 and mutation-negative breast andovarian epithelial cell culturesWe are interested in the growth behavior of cells that are
precursors of cancer; therefore, we chose to study primary cellsmultiplying in culture. Morphologically normal primarybreast and ovarian epithelial cells were established fromBRCA1 and BRCA2 mutation carriers, and mutation-negativeindividuals (Fig. 1). Demographic and mutation data of
Fig. 2. Gene expression differences in BRCA1 and BRCA2 heterozygous epithelial cells. Box plots are shown for the top differentially expressed genes for(A) breast BRCA1 and (B) ovary BRCA1 heterozygous cells. Values are normalized expression values (intensity produced by Robust Multichip Averageanalysis).
Cancer Prev Res; 3(1) January 2010 53
arch. on June 18, 2018. © 2010 American Association forg

Bellacosa et al.
54
mutation carriers and control individuals are shown in Ta-ble 1. Table 1 shows that our population is mostly Cauca-sian, and that carriers and controls are well matched forage, race, parity, menopausal status, and bodymass index,with the only exception being the group of BRCA1 carriersdonating ovarian epithelial cells in which there is a pre-dominance of premenopausal women. This is due to thefact that carriers of highly penetrant BRCA1mutations wereadvised to undergo prophylactic oophorectomy. We con-ductedmicroarray studies of these primary epithelial culturesto identify differentially expressed genes between BRCA1mutant and BRCA2 mutant single-hit cells and WT cells,for each target organ.Class comparison analyses (BRCA1 versus WT, and
BRCA2 versus WT) revealed notable changes in gene ex-pression, indicating that the heterozygous mutations inBRCA1 and BRCA2 do indeed affect the expression profilesof cultured primary epithelial cells from the relevant targetorgans, breast and ovary.
Breast epithelial cellsTable 2 summarizes selected gene expression fold
changes on a linear scale in breast cells versus controls. Thesecretoglobin family of genes (SCGB2A1, SCGB2A2, andSCGB1D2), of unknown function, is highly upregulated inBRCA1mutant breast cells. The genes have been recently de-scribed as novel serum markers of breast cancer with signifi-cant prognostic value (26, 27); ∼80% of all breast cancersoverexpress this complex (26). In BRCA1 cells, we observed
Cancer Prev Res; 3(1) January 2010
Cancer Resecancerpreventionresearch.aacrjournals.orDownloaded from
a 3-fold upregulation of mammaglobin (SCGB2A2: FDR,0.06; P = 4 × 10⁻¹⁰) and a 12-fold increase of lipophilin Band C (SCGB1D2 and SCGB2A: FDR, 0.06 and P = 2 ×10⁻⁸; and FDR, 0.16; P = 0.0002, respectively). In BRCA1cells,we also detected a 3-fold upregulationof the chitinase 3–like 1 gene (FDR, 0.06; P = 1.2 × 10⁻⁷), which has proliferativeeffects on stromal fibroblasts and chemotactic effects on en-dothelial cells. It can promote angiogenesis, and high se-rum levels of this protein have been found in patients withglioblastoma (28). IGFBP5wasupregulated10-fold inBRCA2breast cells (FDR, 0.04; P = 1.9 × 10⁻⁷). It is involved in thestimulation of growth and binding to extracellular matrix,independently of insulin-like growth factor, and is highlyoverexpressed in breast cancer tissues (29).Several cell-to-cell interactions and cell-to-matrix ad-
hesion genes were found to be downregulated in breastcells, including those that code for tensin 4 (TNS4: foldchange, 0.26; FDR, 0.06; P = 2.2 × 10⁻⁷ in BRCA1; andfold change, 0.5; FDR, 0.03; P = 3.7 × 10⁻⁶ in BRCA2),for mucin 16 (MUC16: fold change, 027; FDR, 0.08;P = 3 × 10⁻⁵ in BRCA1; and fold change, 024; FDR, 0.03;P = 2 × 10⁻⁶ in BRCA2), and for keratin 14 (KRT14: foldchange, 0.5; FDR, 0.12; P = 0.0001 in BRCA1; and foldchange, 0.5; FDR, 0.03; P = 2.2 × 10⁻¹⁰ in BRCA2). Lackof tensin 4 expression has been reported in prostate andbreast cancers (30), suggesting that the downregulationof tensin expression is a functional marker of cell transfor-mation. In addition, loss of keratins, which are necessaryfor proper structure and function of desmosomes, can
Table 3. Comparison between microarray and LDA data for the candidate ovarian biomarkers; foldchanges are shown for the BRCA1 versus WT comparison and BRCA2 versus WT comparisons
A. BRCA1 vs WT comparison
Gene symbol
Gene namearch. on Jug
Affymetrix
ne 18, 2018. © 20
LDA
Cancer Pre
10 American A
Taq Man assay
SORBS1
Sorbin and SH3 domain containing 1 7 1.78 Hs00908953_m1 SAA2 Serum amyloid A2 5 9.18 Hs00763479_s1 SAA1;SAA2 Serum amyloid A1 and A2 5 17.47 Hs00761940_s1 CD24 CD24 5 49.89 Hs00273561_s1 MFI2 Antigen p97 3.5 7.47 Hs00195551_m1 SPON1 Spondin 1 2.5 8.22 Hs00391824_m1 THBS1 Thrombospondin 1 2 3.96 Hs00170236_m1 GAS6 Growth arrest–specific 6 2 5.91 Hs00181323_m1 CSPG4 Chondroitin sulfate proteoglycan 4 0.3 0.6 Hs00426981_m1 CCNB1 Cyclin B1 0.2 0.55 Hs00259126_m1 TOP2A Topoisomerase (DNA) II α 0.1 0.07 Hs00172214_m1 NUSAP1 Nucleolar and spindle-associated protein 1 0.1 0.22 Hs00251213_m1 CDC2 Cell division cycle 2, G1-S, and G2-M 0.1 0.09 Hs00364293_m1B. BRCA2 vs WT comparison
MMP3
Matrix metallopeptidase 3 12.14 6.37 Hs00233962_m1 PTGS1 Prostaglandin-endoperoxide synthase 1 6.60 6.56 Hs00326564_s1 MMP1 Matrix metallopeptidase 1 2.05 24.16 Hs00233958_m1 KRT18 Keratin 18 0.35 0.18 Hs01920599_gHvention Research
ssociation for
mRNA Changes in Single-Hit BRCA1/2 Primary Cells
cause an increase in cell flexibility and deformability, andmay enable a tumor cell to detach from its epithelial layer,and metastasize. Finally, mucin 1 (MUC1 or CA15-3),which is known to be overexpressed in breast cancer (31),is downregulated in “single-hit” BRCA1 cells (fold change,0.5; FDR, 0.99; P = 0.02). Overrepresentation of even oneglycoprotein may affect cell surface protein distribution,with effects on other membrane proteins, such as thedownregulation of genes encoding mucin 16 and mucin 1that we have detected in mutant breast cells. A box plotrepresentation of the top differentially expressed genesfor breast epithelial cells is shown in Fig. 2A.
Ovarian epithelial cellsTable 3 summarizes expression changes for selected
genes in ovarian epithelial cultures. For example, 5-folddownregulation of the cyclin B1/cdc2 complex (CDC2:FDR, 0.04; P = 7 × 10⁻⁵), a key regulator controlling theG2M checkpoint, was observed in BRCA1 mutant ovariancells. Multiple genes implicated in the mitotic spindlecheckpoint, such as nucleolar and spindle-associated pro-tein 1 (NUSAP-1: fold change, 0.08; FDR, 0.02; P = 9 × 10⁻⁹
in BRCA1) were downregulated. NUSAP-1 plays a crucialrole in spindle microtubule organization, whereasCENP-A,which is downregulated in BRCA2 mutants of breast cells(fold change, 0.5; FDR, 0.03; P = 9 × 10⁻⁶), is essential forcentromere structure, function, and kinetochore assembly.
www.aacrjournals.org
Cancer Resecancerpreventionresearch.aacrjournals.orDownloaded from
Because BRCA1 and BRCA2, in addition to their role inDNA repair, are also involved in checkpoint pathways, wesuggest that inappropriate expression of these proteins couldinduce abnormal kinetochore function and chromosomemissegregation, a potential cause of aneuploidy and a crit-ical contributor to oncogenesis. Among the upregulatedgenes in BRCA1 heterozygous ovarian epithelial cells isSAA2, an acute phase component of the innate immunesystem (fold change, 6.4; FDR, 0.02; P = 2 × 10⁻⁷), a can-didatemarker of epithelial ovarian cancer (refs. 32, 33 andreferences therein). Among the differentially expressedgenes in BRCA2 mutant ovarian epithelial cells, matrixmetalloproteinase 3 (MMP3) was upregulated 9- to 12-fold(FDR, 0.1; P = 2 × 10⁻⁷); the same tendency has been re-ported for MMP1 and MMP2 in ovarian cancers (34, 35).Our data also show upregulation of COX1 (PTGS1: foldchange, 6.6; FDR, 0.1; P = 8 × 10⁻⁹) in BRCA2 ovarian ep-ithelial cells, a finding that is consistent with the reportedupregulation of cyclooxygenase 1, but not cyclooxygenase2, in ovarian cancer (36, 37). A box plot representation ofthe top differentially expressed genes for ovarian epithe-lial cells is shown in Fig. 2B.
Real-time reverse transcriptase-PCR validation ofmicroarray dataA validation study on select genes for breast and ovary
was done with total RNA using quantitative, real-time
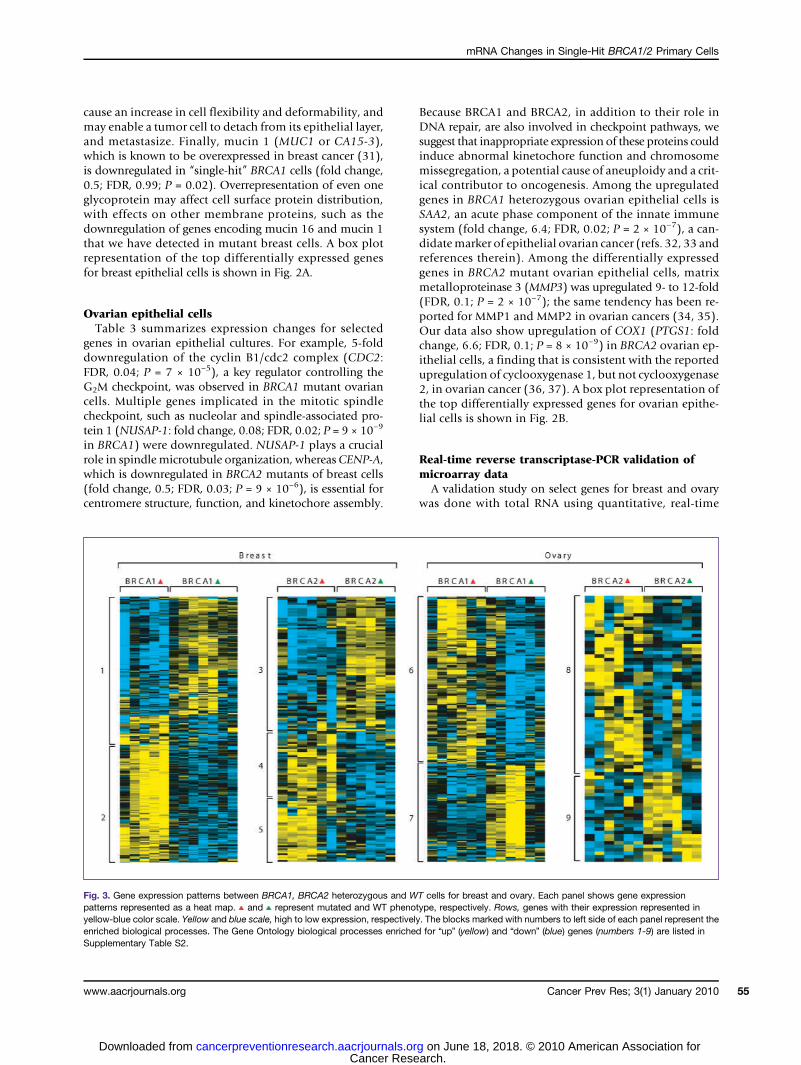
Fig. 3. Gene expression patterns between BRCA1, BRCA2 heterozygous and WT cells for breast and ovary. Each panel shows gene expressionpatterns represented as a heat map. and represent mutated and WT phenotype, respectively. Rows, genes with their expression represented inyellow-blue color scale. Yellow and blue scale, high to low expression, respectively. The blocks marked with numbers to left side of each panel represent theenriched biological processes. The Gene Ontology biological processes enriched for “up” (yellow) and “down” (blue) genes (numbers 1-9) are listed inSupplementary Table S2.
Cancer Prev Res; 3(1) January 2010 55
arch. on June 18, 2018. © 2010 American Association forg

Bellacosa et al.
56
RT-PCR on low-density arrays. We selected 44 candidatebiomarker genes and 4 housekeeping genes, and the en-tire panel of 48 genes was tested by the Comparative C1
method across all breast and ovarian samples in quadru-plicate using a custom-made array to ensure accuracyand reproducibility. The real-time RT-PCR validation re-sults and the comparisons with the original Affymetrixdata are shown in Tables 2 and 3 for breast and ovary,respectively. There was a good correlation (Spearman'sρ) between microarray and LDA data for fold changesof candidate biomarkers in breast and ovarian culturesheterozygous for BRCA1 (0.94 in each case). For candi-date biomarkers originally identified in breast and ovar-ian cultures for one genotype (BRCA1 or BRCA2), therewas also a moderate to good correlation between micro-array and LDA data for the other genotype (BRCA2 or
Cancer Prev Res; 3(1) January 2010
Cancer Resecancerpreventionresearch.aacrjournals.orDownloaded from
BRCA1). This is described in more detail in the Supple-mentary Section and the results are presented in Supple-mentary Table S1.
Functional mining of microarray dataTo define the biological underpinnings of the observed
gene expression differences, we conducted additional min-ing of the microarray data using gene ontology, pathway,and association analyses. Gene ontology analysis revealedoverrepresentation of several biological processes inBRCA1 and BRCA2mutant cells (see Supplementary Infor-mation; Fig. 3). Next, using differentially expressed genesas input to the Ingenuity Pathway Analysis software, wegenerated networks and overlaid pathways onto genes tounderstand their interactions and functional importance.In the case of breast BRCA1 cells, two gene networks had
Fig. 4. Ingenuity Pathway Analysis showing functional networks in one-hit cells. Selected significant canonical pathways are shown in relation to genes thatare differentially expressed for breast BRCA1 (A), breast BRCA2 (B), and ovarian BRCA1 heterozygous cells (C).
Cancer Prevention Research
arch. on June 18, 2018. © 2010 American Association forg

Fig. 4. Continued.
mRNA Changes in Single-Hit BRCA1/2 Primary Cells
Cancer Prev Res; 3(1) January 2010www.aacrjournals.org 57
Cancer Research. on June 18, 2018. © 2010 American Association forcancerpreventionresearch.aacrjournals.org Downloaded from

Bellacosa et al.
58
Cancer Prev Res; 3(1) January 2010Cancer Research. on June 18, 2018cancerpreventionresearch.aacrjournals.org Downloaded from
Fig. 5. Association heat maps showingunion of gene sets enriched for both BRCA1and BRCA2 in breast and ovary heterozygouscells. Each row represents a gene whereascolumns are gene sets enriched. Blue, thegenes are downregulated; red, upregulation.A, association heat map of genes in commonbetween the indicated data sets (listed inSupplementary Table S3) and primary breastBRCA1 and BRCA2 mutant cells. B, associationheat map of genes in common betweentransformed HMECs and primary breastBRCA1 and BRCA2 heterozygous cells.In this figure, HMEC refers to genesdifferentially expressed between HMEC-transformed (HMLER) versus parental HMECcells. Blue, downregulation; red, upregulation.Breast.BRCA1 column, genes differentiallyexpressed in BRCA1 heterozygous cells frombreast. SP.NSP column, differentiallyexpressed genes between mouse mammary sidepopulation and nonside population cells (22). TG.NTG column, genes differentiallyexpressed between mouse cancer stemcells and noncancerous stem cells (24).Columns in blue box (BRCA1.MCF, BRCA2.MCF,and SPO.MCF), differentially expressed genesets from Hedenfalk et al. (25).Genes in red box, the genes commonto Hedenfalk and Breast.BRCA1.
Cancer Prevention Research
. © 2010 American Association for

mRNA Changes in Single-Hit BRCA1/2 Primary Cells
many downregulated genes involved in G2-M DNA dam-age checkpoint regulation, DNA damage response, p38mitogen-activated protein kinase signaling, and tight junc-tion signaling. Genes such as ATR, PMS1, and MCM6 thatare involved in BRCA1-related DNA damage response wereupregulated in BRCA1 heterozygous cells (Fig. 4A). Simi-larly, in breast BRCA2 cells, one significant network thatcontained genes involved in G1-S checkpoint regulationand ephrin receptor signaling was identified (Fig. 4B). InBRCA1 ovarian cells, two significant networks, involved incell cycle control (G2-M DNA damage checkpoint regula-tion) and pyrimidine metabolism, and in glucocorticoidreceptor signaling, contained downregulated genes(Fig. 4C). We did not find any significant networks forgenes differentially expressed in ovarian BRCA2 hetero-zygous cells.To identify unifying biological themes central to mutant
breast and ovarian cells compared with WT cells, we usedthe GSEA for the detection of complex relationshipsamong coregulated genes. GSEA is an analytic method thatallows the evaluation of lists of differentially expressedgenes of interest against known biological modules, suchas gene sets specific to pathways, processes, and profiles, ofprevious profiling experiments (21). To determine wheth-er any specific pathway or profile is enriched in the fourdifferent gene lists, we tested 1,892 curated gene sets ob-tained through MsigDB, which is a constituent database ofgene sets available through GSEA. Supplementary Table S3shows the gene sets from MsigDb that are enriched inbreast and ovarian samples. Figure 5A is a heat map of dif-ferentially expressed genes in both breast and ovary show-ing various gene sets that were identified to be enriched.We did not find any significant enrichment for canonicalpathways. However, we found a variety of gene sets thatare listed in Supplementary Table S3. Among these, wefound two stem cell–related gene sets.Because the gene expression profiles in BRCA1 and
BRCA2 mutant cells have similarities to those of stemand progenitor cells, we tested the four gene lists from thisstudy against a cohort of gene sets obtained from variousstudies including breast stem cells from both human andmouse and DNA repair genes (22–24). Breast BRCA1 andBRCA2 cells show significant enrichment with the differen-tially expressed gene sets of transformed HMECs versuscontrol HMEC cells and BPECs versus control BPEC pop-ulation (Fig. 5B). We observed that downregulated genesfrom breast BRCA1 heterozygous cells show significant as-sociation with transformed HMEC and BPEC cells, sug-gesting that BRCA1 single-hit cells and transformedbreast primary cells share a common fingerprint.Finally, we compared our breast BRCA1 data set to the
three data sets of Hedenfalk et al. (25) on sporadic breastcancers as well as breast cancers in families with BRCA1and BRCA2 mutations. The GSEA comparison revealedthat our breast epithelial BRCA1 data set is most similarto the BRCA1 tumors with matching hits correspondingto the following genes: KRT8, TGFB1, S100A2, S100P,EPHA2, TRIM29, OSBP2, FLNB, and MUC1. Figure 5B
www.aacrjournals.org
Cancer Resecancerpreventionresearch.aacrjournals.orDownloaded from
shows that genes from BRCA1 and BRCA2 mutant andsporadic tumors associated with breast BRCA1 heterozy-gous cells. These genes have already been implicated inbreast cancer. For instance, decreased levels of KRT8 in cy-toplasm are detected in breast cancer cells (38). TGFB1 ishighly expressed in sporadic breast tumors or tumors fromBRCA1 and BRCA2 kindreds, whereas it is downregulatedin heterozygous BRCA1 breast cells. Calcium binding pro-teins A2 and P are downregulated across all tissues. Aber-rant expression of S100A2 has been implicated in breastcancer. In all genes that are common to three tumor types(BRCA1, BRCA2, and sporadic) and heterozygous BRCA1cells, expression of TGFB1 is observed to be different. Thisfinding confirms our hypothesis of the earliest significantmolecular changes in one-hit cells and their relationshipwith transformed breast cells.
Discussion
Our study shows that mRNA expression profiles are al-tered in morphologically normal breast and ovarian epi-thelial cells heterozygous for mutation in BRCA1 orBRCA2, and include functionally critical genes. Remark-ably, these single-hit cells bear significant transcriptomicchanges that share features of the profiles of thecorresponding cancer cells. It is well known that BRCA1and BRCA2 mutant breast cancers exhibit distinct expres-sion profiles (25), and the same is true for ovarian cancer(39). In the case of our single-hit breast and ovarian epi-thelial cell cultures, gene expression differences related to agiven genotype clearly emerge when supervised methodsare used (Tables 2 and 3), and they are reflected in sepa-rate clusters (Fig. 3). On the other hand, genome-wide un-supervised analyses using hierarchical clustering andnonnegative matrix factorization revealed clusters that dif-ferentiate tissue of origin but not genotype (see Supple-mentary Material and Supplementary Fig. S2).Although these specific molecular changes are yet to be
placed in the context of cancer initiation and progression,it should be noted that both BRCA proteins have clear func-tional links to transcription. Indeed, both are mediators ofthe cellular response to DNA damage that includes a tran-scriptional component (40, 41). Of course, damage doesoccur in normal cells as a consequence of physiologicDNA replication processes, although it is repaired with highefficiency (42), and BRCA1 and BRCA2 are part of a proteincomplex with RNA polymerase II and the CREB-bindingprotein and p300 histone acetyltransferases that is involvedin chromatin remodeling and transcription (43). Because ofthese links to transcription (44), alterations in the levels ofBRCA1 and BRCA2 proteins in single-hit cells might be ex-pected to lead to multiple gene expression differences.Intriguingly, some of the gene expression profiles en-
riched in breast BRCA1 one-hit cells are similar to thosedetected in stem and progenitor cells (Fig. 5A). This doesnot seem to be true for one-hit BRCA2 breast epithelialcells. Indeed, recent findings from the Wicha laboratoryindicate that the BRCA1 gene is involved in regulating
Cancer Prev Res; 3(1) January 2010 59
arch. on June 18, 2018. © 2010 American Association forg

Bellacosa et al.
60
stemness and differentiation of breast progenitor cells(45). In addition, more recently, HMECs from BRCA1mu-tation carriers were found to form progenitor cell colonieson semisolid medium with higher plating efficiency com-pared with mammary epithelial cells from reductionmammoplasty controls (46).In general, we found more expression changes in
BRCA1 versus WT cells than with BRCA2 versus WT cells(Table 2), which may reflect the fact that BRCA2 is primar-ily involved in double-strand break repair, whereas BRCA1may also bridge double-strand break repair and signaltransduction pathways. Thus, BRCA1 may act both as asensor of DNA damage and as a repair factor, whereasBRCA2 is thought to be involved primarily in actual re-pair. Even small alterations in levels of the sensor(BRCA1) may have phenotypic consequences in terms ofdifferentially expressed genes. This is reminiscent of ani-mal models with hypomorphic alleles of the mismatch re-pair protein MSH2 (part of the damage sensor) that areproficient for mismatch repair per se but defective for ac-tivation of the cellular DNA damage response (47).An additional important finding from this study is that
some of the molecular changes detected correspondto candidate biomarkers described previously for breastand ovarian cancer, such as mammaglobin and serumamyloid protein for breast and ovarian cancer, respectively(Tables 2 and 3). Furthermore, GSEA analysis reveals thatthe data set of breast epithelial BRCA1 one-hit cells showssimilarities to that of hereditary breast carcinomas associ-ated with BRCA1 mutations (Fig. 5B).In conclusion, the findings from this study are largely
consistent with what is known about the pathophy-siology of BRCA1 and BRCA2 and sporadic cancers.However, there are genes with abnormal patterns of ex-pression that seem unrelated. Both their number andtheir unrelatedness are unexplainable based on whatis known about BRCA1 and BRCA2 cancers, but theymay be early changes associated indirectly with cancer
Cancer Prev Res; 3(1) January 2010
Cancer Resecancerpreventionresearch.aacrjournals.orDownloaded from
initiation (7, 8). For example, heterozygosity may trig-ger a phenomenon such as induction of expression ofsmall interfering RNAs, each of which might affect theexpression of multiple genes.In principle, therefore, the genetic approach used in this
study may serve as a model for the identification of bio-markers for epithelial malignancies in general, and for theuse of such markers as targets for chemoprevention mea-sures that would decrease the probability of a second “hit”or greatly reduce its occurrence.
Disclosure of Potential Conflicts of Interest
No potential conflicts of interest were disclosed.
Acknowledgments
We thank Dr. Jeff Boyd for the critical reading of themanuscript, R. Sonlin for the expert secretarial assistance,Fannie E. Rippel Biotechnology Facility, the Biomarkerand Genotyping Facility, the Cell Culture Facility, andthe Biosample Repository at the Fox Chase CancerCenter for the technical support.
Grant Support
NIH contracts N01 CN-95037, N01-CN-43309, theOvarian Cancer Specialized Programs of Research Excel-lence at Fox Chase Cancer Center (P50 CA083638), NIHgrant P30 CA06927, an appropriation from the Common-wealth of Pennsylvania to the Fox Chase Cancer Center,and the Eileen Stein Jacoby Fund.The costs of publication of this article were defrayed in
part by the payment of page charges. This article musttherefore be hereby marked advertisement in accordancewith 18 U.S.C. Section 1734 solely to indicate this fact.Received 4/15/09; revised 8/27/09; accepted 9/30/09;
published on 1/5/10.
References
1. Fearon ER, Vogelstein B. A genetic model for colorectal tumorigen-esis. Cell 1990;61:759–67.2. Armitage P, Doll R. The age distribution of cancer and a multistage
theory of carcinogenesis. Br J Cancer 1954;8:1–12.3. Erickson LC. The role of O-6 methylguanine DNA methyltransferase
(MGMT) in drug resistance and strategies for its inhibition. SeminCancer Biol 1991;2:257–65.
4. Danes BS. Increased in vitro tetraploidy: tissue specific within theheritable colorectal cancer syndromes with polyposis coli. Cancer1978;41:2330–4.
5. Kopelovich L. Phenotypic markers in human skin fibroblasts as pos-sible diagnostic indices of hereditary adenomatosis of the colon andrectum. Cancer 1977;40:2534–41.
6. Kopelovich L. Heritable colorectal cancer and cancer genes: system-ic expressions. Mol Carcinog 1993;8:3–6.
7. Yeung AT, Patel BB, Li XM, et al. One-hit effects in cancer: alteredproteome of morphologically normal colon crypts in familial adeno-matous polyposis. Cancer Res 2008;68:7579–86.
8. Kopelovich L. Genetic predisposition to cancer in man: in vitro stud-ies. Int Rev Cytol 1982;77:63–88.
9. Stoyanova R, Clapper ML, Bellacosa A, et al. Altered gene expres-sion in phenotypically normal renal cells from carriers of tumor sup-pressor gene mutations. Cancer Biol Ther 2004;3:1313–21.
10. Futreal PA, Liu Q, Shattuck-Eidens D, et al. BRCA1 mutations in pri-mary breast and ovarian carcinomas. Science 1994;266:120–2.
11. Miki Y, Swensen J, Shattuck-Eidens D, et al. A strong candidate forthe breast and ovarian cancer susceptibility gene BRCA1. Science1994;266:66–71.
12. Tavtigian SV, Simard J, Rommens J, et al. The complete BRCA2gene and mutations in chromosome 13q-linked kindreds. Nat Genet1996;12:333–7.
13. Wooster R, Bignell G, Lancaster J, et al. Identification of the breastcancer susceptibility gene BRCA2. Nature 1995;378:789–92.
14. Soule HD, Maloney TM, Wolman SR, et al. Isolation and character-ization of a spontaneously immortalized human breast epithelial cellline, MCF-10. Cancer Res 1990;50:6075–86.
15. Caretti E, Devarajan K, Coudry R, et al. Comparison of RNA amplifi-cation methods and chip platforms for microarray analysis of sam-ples processed by laser capture microdissection. J Cell Biochem2008;103:556–63.
Cancer Prevention Research
arch. on June 18, 2018. © 2010 American Association forg

mRNA Changes in Single-Hit BRCA1/2 Primary Cells
16. Irizarry RA, Bolstad BM, Collin F, Cope LM, Hobbs B, Speed TP.Summaries of Affymetrix GeneChip probe level data. Nucleic AcidsRes 2003;31:e15.
17. Irizarry RA, Hobbs B, Collin F, et al. Exploration, normalization, andsummaries of high density oligonucleotide array probe level data.Biostatistics 2003;4:249–64.
18. Jain N, Thatte J, Braciale T, LeyK, O'Connell M, Lee JK. Local-pooled-error test for identifying differentially expressed genes with a smallnumber of replicated microarrays. Bioinformatics 2003;19:1945–51.
19. Benjamini Y, Hochberg Y. Controlling the false discovery rate: apractical and powerful approach to multiple testing. J Royal StatSoc B 1995;57:289–300.
20. Pascual-Montano A, Carmona-Saez P, ChagoyenM, Tirado F, CarazoJM, Pascual-Marqui RD. bioNMF: a versatile tool for non-negativematrix factorization in biology. BMC Bioinformatics 2006;7:366–74.
21. Subramanian A, Tamayo P, Mootha VK, et al. Gene set enrich-ment analysis: a knowledge-based approach for interpretinggenome-wide expression profiles. Proc Natl Acad Sci U S A 2005;102:15545–50.
22. Behbod F, Xian W, Shaw CA, Hilsenbeck SG, Tsimelzon A, RosenJM. Transcriptional profiling of mammary gland side population cells.Stem Cells 2006;24:1065–74.
23. Ince TA, Richardson AL, Bell GW, et al. Transformation of differenthuman breast epithelial cell types leads to distinct tumor pheno-types. Cancer Cell 2007;12:160–70.
24. Cho RW, Wang X, Diehn M, et al. Isolation and molecular character-ization of cancer stem cells in MMTV-Wnt-1 murine breast tumors.Stem Cells 2008;26:364–71.
25. Hedenfalk I, Duggan D, Chen Y, et al. Gene-expression profiles inhereditary breast cancer. N Engl J Med 2001;344:539–48.
26. Bernstein JL, Godbold JH, Raptis G, et al. Identification of mamma-globin as a novel serum marker for breast cancer. Clin Cancer Res2005;11:6528–35.
27. Ntoulia M, Stathopoulou A, Ignatiadis M, et al. Detection ofMammaglobin A-mRNA-positive circulating tumor cells in peripheralblood of patients with operable breast cancer with nested RT-PCR.Clin Biochem 2006;39:879–87.
28. Junker N, Johansen JS, Hansen LT, Lund EL, Kristjansen PE.Regulation of YKL-40 expression during genotoxic or microenvir-onmental stress in human glioblastoma cells. Cancer Sci 2005;96:183–90.
29. Li X, Cao X, Zhang W, Feng Y. Expression level of insulin-like growthfactor binding protein 5 mRNA is a prognostic factor for breast can-cer. Cancer Sci 2007;98:1592–6.
30. Lo SH, Lo TB. Cten, a COOH-terminal tensin-like protein with pros-tate restricted expression, is down-regulated in prostate cancer.Cancer Res 2002;62:4217–21.
31. von Mensdorff-Pouilly S, Snijdewint FG, Verstraeten AA, Verheijen
www.aacrjournals.org
Cancer Resecancerpreventionresearch.aacrjournals.orDownloaded from
RH, Kenemans P. Human MUC1 mucin: a multifaceted glycoprotein.Int J Biol Markers 2000;15:343–56.
32. Khan N, Cromer CJ, Campa M, Patz EF, Jr. Clinical utility of serumamyloid A and macrophage migration inhibitory factor as serum bio-markers for the detection of nonsmall cell lung carcinoma. Cancer2004;101:379–84.
33. Moshkovskii SA, Serebryakova MV, Kuteykin-Teplyakov KB, et al.Ovarian cancer marker of 11.7 kDa detected by proteomics is a se-rum amyloid A1. Proteomics 2005;5:3790–7.
34. Wenham RM, Calingaert B, Ali S, et al. Matrix metalloproteinase-1gene promoter polymorphism and risk of ovarian cancer. J Soc Gy-necol Investig 2003;10:381–7.
35. Kenny HA, Kaur S, Coussens LM, Lengyel E. The initial steps of ovar-ian cancer cell metastasis are mediated by MMP-2 cleavage of vitro-nectin and fibronectin. J Clin Invest 2008;118:1367–79.
36. Daikoku T, Wang D, Tranguch S, et al. Cyclooxygenase-1 is a poten-tial target for prevention and treatment of ovarian epithelial cancer.Cancer Res 2005;65:3735–44.
37. Gupta RA, Tejada LV, Tong BJ, et al. Cyclooxygenase-1 is overex-pressed and promotes angiogenic growth factor production in ovar-ian cancer. Cancer Res 2003;63:906–11.
38. Iwaya K, Ogawa H, Mukai Y, Iwamatsu A, Mukai K. Ubiquitin-immu-noreactive degradation products of cytokeratin 8/18 correlate withaggressive breast cancer. Cancer Sci 2003;94:864–70.
39. Jazaeri AA, Yee CJ, Sotiriou C, Brantley KR, Boyd J, Liu ET. Geneexpression profiles of BRCA1-linked, BRCA2-linked, and sporadicovarian cancers. J Natl Cancer Inst 2002;94:990–1000.
40. Harper JW, Elledge SJ. The DNA damage response: ten years after.Mol Cell 2007;28:739–45.
41. Zhou BB, Elledge SJ. The DNA damage response: putting check-points in perspective. Nature 2000;408:433–9.
42. Vilenchik MM, Knudson AG. Endogenous DNA double-strandbreaks: production, fidelity of repair, and induction of cancer. ProcNatl Acad Sci U S A 2003;100:12871–6.
43. Welcsh PL, Owens KN, King MC. Insights into the functions ofBRCA1 and BRCA2. Trends Genet 2000;16:69–74.
44. Yoshida K, Miki Y. Role of BRCA1 and BRCA2 as regulators of DNArepair, transcription, and cell cycle in response to DNA damage.Cancer Sci 2004;95:866–71.
45. Liu S, Ginestier C, Charafe-Jauffret E, et al. BRCA1 regulates humanmammary stem/progenitor cell fate. Proc Natl Acad Sci U S A 2008;105:1680–5.
46. Burga LN, Tung NM, Troyan SL, et al. Altered proliferation and dif-ferentiation properties of primary mammary epithelial cells fromBRCA1 mutation carriers. Cancer Res 2009;69:1273–8.
47. Claij N, Te Riele H. Methylation tolerance in mismatch repair pro-ficient cells with low MSH2 protein level. Oncogene 2002;21:2873–9.
Cancer Prev Res; 3(1) January 2010 61
arch. on June 18, 2018. © 2010 American Association forg

2010;3:48-61. Cancer Prev Res Alfonso Bellacosa, Andrew K. Godwin, Suraj Peri, et al. Mutations
BRCA2 or BRCA1Cells from Heterozygous Carriers of Altered Gene Expression in Morphologically Normal Epithelial
Updated version
http://cancerpreventionresearch.aacrjournals.org/content/3/1/48
Access the most recent version of this article at:
Material
Supplementary
http://cancerpreventionresearch.aacrjournals.org/content/suppl/2010/01/05/3.1.48.DC2
http://cancerpreventionresearch.aacrjournals.org/content/suppl/2010/01/05/3.1.48.DC1Access the most recent supplemental material at:
Cited articles
http://cancerpreventionresearch.aacrjournals.org/content/3/1/48.full#ref-list-1
This article cites 47 articles, 12 of which you can access for free at:
Citing articles
http://cancerpreventionresearch.aacrjournals.org/content/3/1/48.full#related-urls
This article has been cited by 5 HighWire-hosted articles. Access the articles at:
E-mail alerts related to this article or journal.Sign up to receive free email-alerts
Subscriptions
Reprints and
To order reprints of this article or to subscribe to the journal, contact the AACR Publications
Permissions
Rightslink site. Click on "Request Permissions" which will take you to the Copyright Clearance Center's (CCC)
.http://cancerpreventionresearch.aacrjournals.org/content/3/1/48To request permission to re-use all or part of this article, use this link
Cancer Research. on June 18, 2018. © 2010 American Association forcancerpreventionresearch.aacrjournals.org Downloaded from