research article qprd: qos-aware peering routing...
TRANSCRIPT

Research ArticleQPRD: QoS-Aware Peering Routing Protocol for Delay-SensitiveData in Hospital Body Area Network
Zahoor A. Khan,1 Shyamala Sivakumar,2 William Phillips,3
Bill Robertson,3 and Nadeem Javaid4
1CIS, Higher Colleges of Technology, Fujairah Campus, P.O. Box 4114, Fujairah, UAE2Saint Mary’s University, Halifax, NS, Canada B3H 3C33Internetworking Program, FE, Dalhousie University, Halifax, NS, Canada B3H 4R24COMSATS Institute of Information Technology, Islamabad 44000, Pakistan
Correspondence should be addressed to Zahoor A. Khan; [email protected]
Received 10 November 2014; Accepted 15 January 2015
Academic Editor: Haroon Malik
Copyright © 2015 Zahoor A. Khan et al.This is an open access article distributed under theCreativeCommonsAttribution License,which permits unrestricted use, distribution, and reproduction in any medium, provided the original work is properly cited.
Consistent performance, energy efficiency, and reliable transfer of data are critical factors for real-time monitoring of a patient’sdata, especially in a hospital environment. In this paper, a routing protocol is proposed by considering the QoS requirements of theBody Area Network (BAN) data packets. Amechanism for handling delay-sensitive packets is provided by this protocol. Moreover,linear programming based modeling along with graphical analysis is also done. Extensive simulations using the OMNeT++ basedsimulator Castalia 3.2 illustrate that the proposed algorithm provides better performance than other QoS-aware routing protocolsin terms of higher successful transmission rates (throughputs), lower overall network traffic, no packets dropped due to MACbuffer overflow, and fewer numbers of packet time outs in both the mobile and static patient scenarios. The scalability of theprotocol is demonstrated by simulating a 24-bed real hospital environment with 49 nodes. It is shown that, even in the larger realhospital scenario requiring the transmission of delay-sensitive data packets with stringent delay requirements, QPRD outperformscomparable protocols.
1. Introduction
A patient’s real-time health-related data monitoring is pos-sible with the help of a new emerging field, Body AreaNetworks (BANs). Body Area Network is a small wirelessnetwork which consists of sensors placed inside or outsideof the human body. The body implant or wearable sensorstransmit the data to a central device called Body AreaNetwork Coordinator (BANC). BANC is computationallymore powerful device then the body sensors. BANC isresponsible for transferring the sensors’ data to the next nodeor destination reliably.
Some important issues of BAN data transmission are toensure the high reliability, low latency, compatibility withmovable sensors, and low energy consumption. The specificneed of BAN communication is not fulfilled by the existingPersonal Area Network (PAN) standards [1]. IEEE task group6 was assigned a job in November 2007 to suggest a BAN
communication standard 802.15.6 by the consideration ofshort range transmission, reliability and latency requirementsof QoS, and less energy consumption [2]. The real-timemonitoring of patients requires the transmission of delay-sensitive data such as video imaging, motion sensing, andElectromyography (EMG) using BAN. Some projects likeSMART [3], CareNet [4], AID-N [5], and ALARM-NET [6]provide different methods to monitor the patient data. Inthese methods, the transmission of BAN data from bodysensors to the central database is considered and then BANdata is downloaded andmonitored from the central database.However, these techniques do not monitor or display inreal-time BAN data in hospital environment.The advantagesof using a centralized system are to have better controland maintain the data privacy of the patient. However,traffic congestion, server failure, or link failure can causeconsiderable delays in monitoring the patient data whichcan badly affect treatment. On the other hand, distributed
Hindawi Publishing CorporationMobile Information SystemsVolume 2015, Article ID 153232, 16 pageshttp://dx.doi.org/10.1155/2015/153232

2 Mobile Information Systems
data approaches help to reduce the traffic load and canbetter accommodate patient mobility. The ZK-BAN peeringframework proposed in [7] suggests a semicentralized systemfor reliably monitoring BAN data. The hybrid ZK-BAN usesboth centralized and distributed techniques.
The routing protocols EPR, proposed and discussed in[7], resolves the problem of handling ordinary data pack-ets. The QoS-aware peering routing protocol for reliability-sensitive data (QPRR) [8, 9] provides a mechanism of han-dling the reliability-sensitive packets in addition to the ordi-nary data packets. The requirement of real-time display fordelay-sensitive packets is different from those of ordinary andreliability-sensitive packets. Hence, a newQoS-aware routingprotocol is required to handle delay-sensitive packets. A novelrouting protocol that addresses the issue of handling delay-sensitive data anddisplaying in real-time delay-sensitive BANdata is proposed in this paper. The proposed QoS-awarepeering routing protocol for delay-sensitive packets (QPRD)is designed for the ZK-BAN peering framework discussed in[7]. QPRD provides an innovative approach to the reliabletransmission of ordinary packets (OPs) and delay-sensitivepackets (DSPs). The initial results and architecture of QPRDwere presented in IEEE conference proceedings [10].
This paper is organized as follows: Section 2 provides therelated work; Section 3 discusses the problem formulationand modeling; Section 4 provides the proposed QoS-awarepeering routing protocol for delay-sensitive data (QPRD);Section 5 describes the performance evaluation; Section 6discusses the scalability test of QPRD and Section 7 presentsthe conclusions.
2. Related Work
A smart monitoring system of BAN data in hospital environ-ment can resolve the challenges related to the managementof patients’ medical information [11]. The Scalable MedicalAlert and Response Technology (SMART) [3] is designed tomonitor the patient’s data in hospital emergency area. Thedata from sensors is transferred to the PDA and then the PDAsends it to the next tier by using wireless standard 802.11b.CareNet [4] provides an integrated wireless sensor basedsolution to monitor the patient’s data from remote hospitals.The two-tier wireless communication is used in the projects[3, 4]. A GPS system is used in [5] to monitor the patient’sdata only in outdoor BAN communication. A wireless sensornetwork for assisted-living and residentialmonitoring systemwith a query based protocol is provided in ALARM-NET[6]. A three-tier communication approach is used in [12] tostore the BAN data on the server and then make this dataavailable for the physician to analyze the patient’s data. Theprojects [3–6, 12] used a centralized approach to monitorthe patient’s data. However, the real-time display of data byconsidering the delay requirements of delay-sensitive packetsis not considered. To access the data from a centralized servermay cause delay and even a simple link failure can completelydisconnect the healthcare system from the central server.
In [7], an energy-aware peering routing protocol (EPR)was presented which considers the energy level and geo-graphic information of the neighbor nodes for choosing the
best next hop. The EPR only considers ordinary packets. Itwas shown that EPRhas an overall lower energy consumptionthan comparable protocols [11, 13–16] and provides betterresults in terms of reduced overall network traffic, reducednumber of packets forwarded by intermediate nodes, andhigher successful data transmission rates. However, EPR doesnot provide a mechanism for dealing with delay-sensitivepackets (DSPs). In this paper, delay-sensitive packets areconsidered by the proposed QoS-aware peering routing pro-tocol for delay-sensitive data (QPRD) and their performanceis investigated by comparing it to the existing DMQoSprotocol [13]. In [13], DMQoS categorizes the data packetsinto four types: ordinary packets (OPs), critical packets (CPs),reliability-driven packets (RPs), and delay-driven packets(DPs). The DMQoS [13] provides better results for delay-driven packets than several previously investigated methods[11, 14–16] in terms of end-to-end path delay. However,DMQoS employs a hop-by-hop approach to determine thenext hop. DMQoS considers the neighbor device with thelowest delay, and the next hop then determines the bestnext upstream hop with least delay. The disadvantage of thishop-by-hop delay-driven approach employed in DMQoS isthat only neighboring nodes delay information is consideredby source node. The source node forwards the packet to aparticular neighbor node which has lower node delay thanthe required delay. The neighbor node sends the acknowl-edgement of the successfully received packet to the sourcenode. Now, the packet receiving neighbor node determinesits best upstream node in terms of delay requirement andforwards the packet to the upstream node if the node delayof upstream node is less than the required delay. In case theneighbor node does not find any upstream node with nodedelay less than required delay, then the packet is dropped. Inthis case, the packet does not reach the destination, but thesource node assumes that the packet has been successfullyreceived by the destination. Furthermore, the hop-by-hopapproach used in DMQoS causes an increase in overallnetwork traffic, and the required end-to-end latency may notbe guaranteed. In this paper, the proposed QPRD addressesthese shortcomings by selecting and choosing the next hopdevice based on the lowest end-to-end path delay from thesource node to the destination.
3. Problem Formulation and Modeling
The motivation that BAN consists of nodes connected witheach other via wireless links leads us to model it as a directedgraph. This section focuses on two points: (i) to maximizethroughput, and (ii) to minimize the end-to-end delay.Thesetwo problems are modeled via linear programming [17, 18]because requirements to these problems could easily berepresented by linear relationships.
3.1. Throughput Maximization. We consider BAN as adirected graph 𝐺 = (𝑆, 𝐿), |𝑆| = 𝑠, and |𝐿| = 𝑙; 𝑆 is the setof nodes and 𝐿 is the set of directed graphs (links). If thenetwork operations are divided into rounds, each round 𝑟 isthe duration from the network establishment till the death
Mobile Information Systems 3
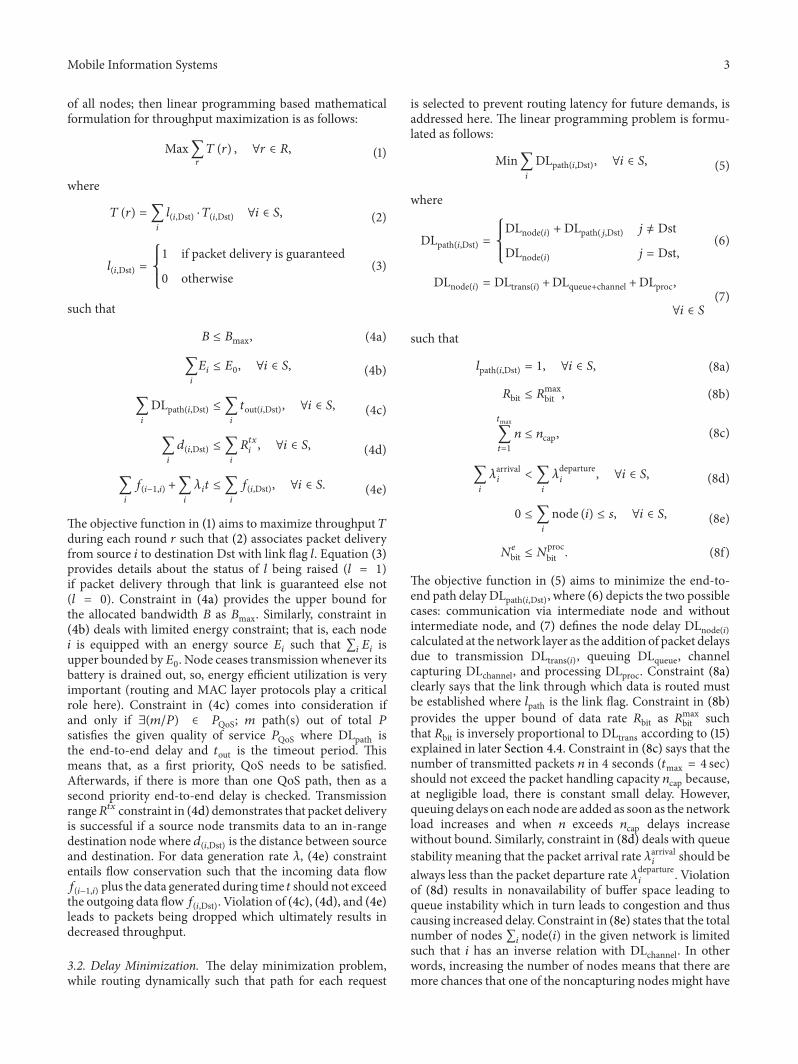
of all nodes; then linear programming based mathematicalformulation for throughput maximization is as follows:
Max∑𝑟
𝑇 (𝑟) , ∀𝑟 ∈ 𝑅, (1)
where
𝑇 (𝑟) = ∑
𝑖
𝑙(𝑖,Dst) ⋅ 𝑇(𝑖,Dst) ∀𝑖 ∈ 𝑆, (2)
𝑙(𝑖,Dst) =
{
{
{
1 if packet delivery is guaranteed
0 otherwise(3)
such that
𝐵 ≤ 𝐵max, (4a)
∑
𝑖
𝐸𝑖≤ 𝐸0, ∀𝑖 ∈ 𝑆, (4b)
∑
𝑖
DLpath(𝑖,Dst) ≤ ∑𝑖
𝑡out(𝑖,Dst), ∀𝑖 ∈ 𝑆, (4c)
∑
𝑖
𝑑(𝑖,Dst) ≤ ∑
𝑖
𝑅𝑡𝑥
𝑖, ∀𝑖 ∈ 𝑆, (4d)
∑
𝑖
𝑓(𝑖−1,𝑖) +∑
𝑖
𝜆𝑖𝑡 ≤ ∑
𝑖
𝑓(𝑖,Dst), ∀𝑖 ∈ 𝑆. (4e)
The objective function in (1) aims to maximize throughput 𝑇during each round 𝑟 such that (2) associates packet deliveryfrom source 𝑖 to destination Dst with link flag 𝑙. Equation (3)provides details about the status of 𝑙 being raised (𝑙 = 1)if packet delivery through that link is guaranteed else not(𝑙 = 0). Constraint in (4a) provides the upper bound forthe allocated bandwidth 𝐵 as 𝐵max. Similarly, constraint in(4b) deals with limited energy constraint; that is, each node𝑖 is equipped with an energy source 𝐸
𝑖such that ∑
𝑖𝐸𝑖is
upper bounded by𝐸0. Node ceases transmissionwhenever itsbattery is drained out, so, energy efficient utilization is veryimportant (routing and MAC layer protocols play a criticalrole here). Constraint in (4c) comes into consideration ifand only if ∃(𝑚/𝑃) ∈ 𝑃QoS; 𝑚 path(s) out of total 𝑃satisfies the given quality of service 𝑃QoS where DLpath isthe end-to-end delay and 𝑡out is the timeout period. Thismeans that, as a first priority, QoS needs to be satisfied.Afterwards, if there is more than one QoS path, then as asecond priority end-to-end delay is checked. Transmissionrange𝑅𝑡𝑥 constraint in (4d) demonstrates that packet deliveryis successful if a source node transmits data to an in-rangedestination node where 𝑑
(𝑖,Dst) is the distance between sourceand destination. For data generation rate 𝜆, (4e) constraintentails flow conservation such that the incoming data flow𝑓(𝑖−1,𝑖) plus the data generated during time 𝑡 should not exceed
the outgoing data flow𝑓(𝑖,Dst). Violation of (4c), (4d), and (4e)
leads to packets being dropped which ultimately results indecreased throughput.
3.2. Delay Minimization. The delay minimization problem,while routing dynamically such that path for each request
is selected to prevent routing latency for future demands, isaddressed here. The linear programming problem is formu-lated as follows:
Min∑𝑖
DLpath(𝑖,Dst), ∀𝑖 ∈ 𝑆, (5)
where
DLpath(𝑖,Dst) ={
{
{
DLnode(𝑖) + DLpath(𝑗,Dst) 𝑗 ̸= Dst
DLnode(𝑖) 𝑗 = Dst,(6)
DLnode(𝑖) = DLtrans(𝑖) +DLqueue+channel +DLproc,
∀𝑖 ∈ 𝑆
(7)
such that
𝑙path(𝑖,Dst) = 1, ∀𝑖 ∈ 𝑆, (8a)
𝑅bit ≤ 𝑅maxbit , (8b)
𝑡max
∑
𝑡=1𝑛 ≤ 𝑛cap, (8c)
∑
𝑖
𝜆arrival𝑖
< ∑
𝑖
𝜆departure𝑖
, ∀𝑖 ∈ 𝑆, (8d)
0 ≤ ∑𝑖
node (𝑖) ≤ 𝑠, ∀𝑖 ∈ 𝑆, (8e)
𝑁𝑒
bit ≤ 𝑁procbit . (8f)
The objective function in (5) aims to minimize the end-to-end path delay DLpath(𝑖,Dst), where (6) depicts the two possiblecases: communication via intermediate node and withoutintermediate node, and (7) defines the node delay DLnode(𝑖)calculated at the network layer as the addition of packet delaysdue to transmission DLtrans(𝑖), queuing DLqueue, channelcapturing DLchannel, and processing DLproc. Constraint (8a)clearly says that the link through which data is routed mustbe established where 𝑙path is the link flag. Constraint in (8b)provides the upper bound of data rate 𝑅bit as 𝑅
maxbit such
that 𝑅bit is inversely proportional to DLtrans according to (15)explained in later Section 4.4. Constraint in (8c) says that thenumber of transmitted packets 𝑛 in 4 seconds (𝑡max = 4 sec)should not exceed the packet handling capacity 𝑛cap because,at negligible load, there is constant small delay. However,queuing delays on each node are added as soon as the networkload increases and when 𝑛 exceeds 𝑛cap delays increasewithout bound. Similarly, constraint in (8d) deals with queuestability meaning that the packet arrival rate 𝜆arrival
𝑖should be
always less than the packet departure rate 𝜆departure𝑖
. Violationof (8d) results in nonavailability of buffer space leading toqueue instability which in turn leads to congestion and thuscausing increased delay. Constraint in (8e) states that the totalnumber of nodes ∑
𝑖node(𝑖) in the given network is limited
such that 𝑖 has an inverse relation with DLchannel. In otherwords, increasing the number of nodes means that there aremore chances that one of the noncapturing nodes might have

4 Mobile Information Systems
a lower backoff time as compared to that of the capturingnode, thereby increasing the idle time due the backing off ofnoncapturing nodes. Constraint in (8f) deals with DLproc. Itis obvious that the total bit level errors𝑁𝑒bit should not exceeda certain threshold𝑁proc
bit ; otherwise increased erroneous bitswould increaseDLproc andperformance of the networkwoulddegrade in terms of processing delays at the nodes.
3.3. Graphical Analysis. Consider the simplified pathB3-B1-NSC where B3 can directly send data to NSC as well asvia B1 (refer to Figure 3 in Section 4.4). Moreover, NSC canalso send data to itself. For typically assumed delay values,path delay is maximum when B1 is involved in forwardingthe data of B3 intended for the destination NSC (i.e., 50ms),and path delay is minimum when B3 directly communicateswith NSC (i.e., 20ms). Let 𝑧 = DLpath(𝑖,Dst), 𝑥 = DLnode(𝑖),and 𝑦 = DLpath(𝑗,Dst). The objective function in (5) can bereformulated as
Min (𝑧) , (9)
where
𝑧 = 𝑥+𝑦 (10)
such that
𝑥+𝑦 ≥ 20, (11a)
𝑥+𝑦 ≤ 50, (11b)
0 ≤ 𝑥 ≤ 20,
0 ≤ 𝑦 ≤ 30.(11c)
The objective function in (9) aims to minimize end-to-enddelay regarding the selected path, whereas (10) illustratesnature of the objective function, that is, two-dimensionallinear programming problem. Constraints in (11a) and (11b)provide lower and upper bounds for the selected path,respectively, whereas constraint in (11c) deals with similarbounds for 𝑥 as well as 𝑦. For simplicity in calculation,we replace the inequalities in (11a), (11b), and (11c) withequalities, respectively. In subject to the given constraints,Figure 1 shows the set of feasible solutions which is obtainedby the intersection of lines,𝐿1,𝐿2,𝐿3, and𝐿4, and is indicatedby coloured region such that each point in the feasible regionsatisfies each constraint. We can find the minimum value of𝑧 by testing it at each of the vertices (refer to 𝑃1, 𝑃2, 𝑃3, and𝑃4 in Figure 1) as follows:
at 𝑃1(0, 0): 𝑧 = 0ms,at 𝑃2(20, 0): 𝑧 = 20 + 0 = 20ms,at 𝑃3(0, 30): 𝑧 = 0 + 30 = 30ms,at 𝑃4(20, 30): 𝑧 = 20 + 30 = 50ms.
The minimum value of 𝑧 is 0ms at 𝑥 = 0 and𝑦 = 0. However, this value indicates self transmissionor communication within NSC. The next minimum valueis 𝑧 = 20ms showing the case of direct communication
0 10 20 30 40 50 60 70 800
10
20
30
40
50
60
70
80
x (ms)
y (m
s)
L1: x + y = 50
P4(20, 30)P3(0, 30)
L4: x = 0
L5: y = 0
P1(0, 0)P2(20, 0)
L2: x = 20
L3: y = 30
Figure 1: Feasible region.
between B3 and NSC. Similarly, 𝑧 = 30ms when B1 directlycommunicates with NSC. On the other hand, end-to-endpath delay is maximumwhen B3 communicates withNSC viaan intermediate B1; 𝑧 = 50ms.
4. QoS-Aware Peering Routing Protocol forDelay-Sensitive Data (QPRD)
Based on the mathematical analysis in Section 3, the pro-posedQoS-aware routing protocol used in an indoor hospitalZK-BAN peering framework [7] is discussed in this section.The proposed QPRD provides a mechanism to (1) calculatethe node delays and path delays of all possible paths fromthe source node to the destination, (2) determine the bestpath, and (3) choose the best next hop NH
𝐷based on the
delay requirements of the packet. For each destination, therouting table contains information about the next hop deviceconnected to the path with the least end-to-end latency. Forany DSP, if the path delay (DLpath(𝑖,Dst)) is less than or equalto the delay requirement, the source node sends the DSPthrough that path.
The architecture of proposed QPRD, based on themathe-matical formulation of the end-to-end path delay problem,is shown in Figure 2. It consists of seven modules: MACreceiver, delay module (DM), packet classifier (PC), Helloprotocol module (HPM), routing services module (RSM),QoS-aware queuing module (QQM), and MAC transmitter.The modules are discussed below.
4.1. MAC Receiver. The MAC receiver receives the data orHello packets from other nodes (BAN, MDC, or NSC). Itchecks the MAC address of the packet. It only forwards thebroadcast packets or the packets which have the same node’sMAC address as destination address to the network layer.
4.2. Delay Module (DM). The delay module monitors thetime required to capture the channel (DLchannel(𝑖)), MAClayer queuing delay (DLMAC queue(𝑖)), and transmission time

Mobile Information Systems 5
MAC receiver MAC transmitter
Hello protocol
Packet classifier
QoS-aware queuing
Layer 3
Layer 2
Higher priority
To other nodes (i.e. BAN, MDC, or NSC)
Routing services
Path selectorQoSclassifier
Routingtable
Neighbor table
Delay module
DSP
Data packets
Hello packet
Data or Hello packets
From other nodes (i.e. BAN, MDC, or NSC)
Hello packets DSPOP
Routing table constructor
Delay algorithm
Energy-aware algorithm
OP
Neighbor table constructor
Delay calculation
From upper layers
Data packets
Data or Hello packets
Data or Hello packets
Figure 2: QPRD protocol architecture.
(DLtrans(𝑖)) of a packet. The delay module sends this infor-mation to the network layer. The network layer uses thisinformation to calculate the node delay (DLnode(𝑖)).
4.3. Packet Classifier (PC). The packet classifier (PC) receivesall the packets from the MAC receiver. The data packets andHello packets are differentiated by the PC. The PC forwardsthe data andHello packets to the routing servicesmodule andHello protocol module, respectively.
4.4. Hello Protocol Module (HPM). The neighbor table con-structor and the neighbor table are the two submodules ofHello protocol module. The information received from thedelay module of the MAC layer and the Hello packets is usedby the neighbor table constructor to construct the neighbortable. Initially, Hello packets are broadcasted by each of type1 (NSC) and type 2 (MDC) devices. The node 𝑖 receivesthe Hello packet. The neighbor table constructor of node 𝑖
calculates its ownDLpath(𝑖,Dst) based on the information in theHello packets. The Hello packet is updated and forwarded bynode 𝑖 to the other nodes. The Hello packet fields of node 𝑗are shown as follows.
Hello Packet Structure. Consider
IDDst 𝐿Dst ID𝑗𝐿𝑗𝐷(𝑗,Dst) 𝐸𝑗 𝑇𝑗 DLpath(𝑗,Dst) (12)
The commonly used notations in this paper and their descrip-tions are summarized in notations section.
The neighbor table contains fields for both hop-by-hopdelay (DLnode(𝑖)) and end-to-end path delay (DLpath(𝑖,Dst)).The neighbor table constructor updates the neighbor tableperiodically after receiving every new Hello packet. Theneighbor table structure of node 𝑖 is shown as follows.
The Neighbor Table Structure. Consider
IDDst 𝐿Dst ID𝑗𝐿𝑗𝐷(𝑗,Dst) 𝐷(𝑖,𝑗) 𝐶𝑗 𝑇𝑗 DLnode(𝑖) DLpath(𝑖,Dst) (13)

6 Mobile Information Systems
The node delay (DLnode(𝑖)) can be found by adding the packetdelays due to transmission, queuing, processing, and channelcapturing:
DLnode(𝑖) = DLtrans(𝑖) +DLqueues+channel +DLproc. (14)
The node updates its Hello packets periodically; 4 seconds areused in QPRD for simulation purposes. The time interval 4seconds is used because the delay module sends the delays ofMAC queue and channel capture after every 4 seconds. Theaverage transmission delay (DLtrans) before sending the Hellopackets is calculated by using
DLtrans =1𝑅bit
∑𝑛
𝑧=1𝑁bit(𝑧)
𝑛, (15)
where 𝑅bit is the data rate and as per BAN requirement250 kbps is used in the simulations. 𝑁bit is the total numberof bits in each packet. 𝑛 is the number of packets transmittedin 4 seconds.
The delay due to the MAC and network layers’ queuesand capturing the channel can be calculated by using theExponentially Weighted Moving Average (EWMA) formulaand is given in
DLqueues+channel = (1−𝜌) ∗ DLqueues+channel +𝜌
∗ DLqueues+channel,(16)
where queues are both network and MAC layers’ queues.Initial values of DLqueues+channel are the delay of the first
packet sent by the node. 𝜌 is the average weighting factorthat satisfies 0 < 𝜌 ≤ 1. The selection of 𝜌 value isheuristic and was chosen based on simulations experience.The recommended values are 0.2 ≤ 𝜌 ≤ 0.3. The best suitedvalue of 𝜌 found for QPRD simulations is 0.2.
The path delay between node 𝑖 and destination node Dst(DLpath(𝑖,Dst)) is calculated by using
DLpath(𝑖,Dst) = DLnode(𝑖) +DLpath(𝑗,Dst), (17)
where initial value of DLpath(𝑗,Dst) is zero when 𝑗 = Dst.An example of finding the path delay from node 𝑖
(B3) to Dst (NSC) is shown in Figure 3. The delay cal-
culation of two paths B3-B1-MDC2-NSC (path 1) andB3-MDC
3-B2-MDC1-NSC (path 2) is given for illustrative
purposes. The typical assumed values are chosen for illus-trated purposes. The individual node delays used in thisexample are given below:
DLnode(NSC) = 20ms, (18a)
DLnode(MDC2)= 40ms, (18b)
DLnode(B1)= 30ms, (18c)
DLnode(B3)= 20ms, (18d)
DLnode(MDC1)= 20ms, (18e)
DLnode(B2)= 30ms, (18f)
DLnode(MDC3)= 10ms. (18g)
The path delay of destination (DLpath(Dst,Dst)) is approximatelyzero, because the time required to receive the packet fromMAC to network layer is negligible. So, in this example initialpath delay is given below:
DLpath(NSC,NSC) = 0ms. (19)
Each node calculates the path delay from itself to theNSC. First, the calculations of the path delay for path 1(B3-B1-MDC2-NSC) are considered.
The path delay of MDC2(DLpath(MDC
2,NSC)) is calculated
by using (17):
DLpath(MDC2,NSC) = DLnode(MDC2) +DLpath(NSC,NSC). (20)
Using the values from (18a) and (19) in the above equation,we get
DLpath(MDC2,NSC) = 40+ 0 = 40ms. (21)
The path delay of BAN B1is calculated below:
DLpath(B1,NSC) = DLnode(B
1)+DLpath(MDC
2,NSC),
DLpath(B1,NSC) = 30+ 40 = 70ms.
(22)
The node B3determines the path delay by using the values
from (18d) and (22):
DLpath(B3,NSC) = DLnode(B
3)+DLpath(B
1,NSC),
DLpath(B3,NSC) = 20+ 70 = 90ms.
(23)
In the same manner, the path delay of path 2(B3-MDC3-B2-MDC1-NSC) can be calculated as follows:
DLpath(MDC1,NSC) = 20+ 0 = 20ms,
DLpath(B2,NSC) = 30+ 20 = 50ms,
DLpath(MDC3,NSC) = 10+ 50 = 60ms,
DLpath(B3,NSC) = 20+ 60 = 80ms.
(24)
Equations (23) and (24) show that the path delays of path1 and path 2 are 90ms and 80ms, respectively. It is quitepossible that the path with less delay is longer (has morehops) than the other paths. As it is observed from the aboveexample, path 2 includes five devices and path 1 has fourdevices. However, the path delay of path 2 is lower than thepath delay of path 1.
4.5. Routing Services Module (RSM). The routing servicesmodule is responsible for constructing the routing table,categorizing the data packets into delay-sensitive packets(DSPs) and ordinary packets (OPs). It also chooses the bestpath(s) for each category (DSPs or OPs) of traffic. QoSclassifier, routing table constructor, path selector, and routingtable are the submodules of routing services module. Therouting table structure for node 𝑖 is shown as follows.
The Routing Table Structure for QPRD. Consider
IDDst 𝐿Dst NH𝐸
NH𝐷
DLpath(𝑖,Dst) (25)

Mobile Information Systems 7
DLpath(B3,NSC) = DLnode(B3) + DLpath(B1,NSC)= 20ms + 70ms = 90ms
DLpath(B1,NSC) = DLnode(B1) + DLpath(MDC2 ,NSC)= 30ms + 40ms = 70ms
DLpath(MDC2,NSC) = DLnode(MDC2) + DLpath(NSC,NSC)= 40ms + 0ms = 40ms
Path1
MDC2
DLpath(B3,NSC) = DLnode(B3) + DLpath(MDC3,NSC)= 20ms + 60ms = 80ms
DLpath(B3,NSC) = DLnode(MDC3) + DLpath(B2 ,NSC)= 10ms + 50ms = 60ms
DLpath(B2 ,NSC) = DLnode(B2) + DLpath(MDC1,NSC)= 30ms + 20ms = 50ms
DLpath(MDC1,NSC) = DLnode(MDC1) + DLpath(NSC,NSC)= 20ms + 0ms = 20ms
B1
B3
MDC1
MDC3
DLpath(NSC,NSC) = 0
DLnode(NSC) = 20msNSC
Path2
B2
Figure 3: Example of finding the path delay.
The notations and their descriptions are listed in notationsection. Two next hop entries NH
𝐸and NH
𝐷are given
for each destination Dst in routing table. The routing tableconstructor contains the energy-aware and delay algorithms.The energy-aware algorithm discussed in [7] is used to findnext hop NH
𝐸for OPs. Residual energy and geographic
location of the neighbor nodes are considered for choosingNH𝐸. For DSPs, the new proposed algorithm finds the
best possible path to ensure the minimum required pathdelay. The routing table is constructed by using the neighbortable entries. Neighbor table contains multiple records foreach destination. For example, Figure 3 shows that thereare many paths from B
3to NSC. Some of these paths are
B3-B1-MDC2-NSC, B3-MDC3-B2-MDC1-NSC, and so forth.For each destination, the routing table constructor stores thenext hop (NH
𝐷) which has the lowest latency.
Algorithm 1 shows that node 𝑖 identifies the next hop can-didates by searching the records which have the same IDDstin the neighbor table. The path delay has been calculated byusing the neighbor table constructor and stored in neighbortable for each next hop candidate, using (17). The node storesthe neighbor nodes’ IDs in the variable NH (line 2). If NH hasonly one entry, thismeans there is only one path available.Thenode stores this entry to NH
𝐷(line 4).
Otherwise, the node sorts the NH entries in ascendingorder of delay and then stores the first entry which has thelowest path delay in NH
𝐷(lines 6-7).The next hop candidate
NH𝐷is then stored with its path delay value (DLpath(𝑖,Dst)) in
the routing table. The data packets from both upper layersand packet classifier are received by QoS classifier. The QoSclassifier classifies the packets into DSP and OP data. For
each data packet, the path selector (PS) checks the QoSrequirement and chooses the most appropriate next hop(s)by using Algorithm 2.
The path selector compares the delay requirement (DLreq)with the path delay (DLpath(𝑖,Dst)) of NH𝐷 which is stored inthe routing table. If the path delay (DLpath(𝑖,Dst)) is lower thanrequired delay (DLreq), the packet is sent to NH𝐷 (lines 3-4).Otherwise, the packet is dropped (line 6).
For ordinary packets, the PS returns the next hop NH𝐸
which is discussed by the EPR (lines 8-9); else the packet isdropped.
4.6. QoS-Aware Queuing Module (QQM). The routing ser-vices module passes the data packets to the QoS-awarequeuing module (QQM) after choosing the appropriate nexthop(s). The QQM receives the data packets and separatesthese packets in two classes (DSP and OP). An individualqueue is used for each class of packets. QQM functions arethe same as discussed in [13]. The priority of the DSP queueis higher than that of theOP queue. By default, theDSP queuewith higher priority sends the packets first. The packets fromlower priorityOPqueuewill be sent onlywhen theDSPqueueis empty. However, for fair treatment of OP data, a timeoutis used by all the queues. A queue sends the packets to theMAC layer within the period specified by the timeout for thatqueue. QQM changes the control from higher priority queueto lower priority queue after the queue timeout occurs orwhen the higher priority queue is empty whichever is earlier.
4.7.MACTransmitter. TheMAC transmitter receives the dataand Hello packets from the network layer and stores it in

8 Mobile Information Systems
INPUT: Neighbor table, 𝑖’s neighbor table records NH(𝑖,Dst), ∀Dst ∈ {MDC,NSC, BAN}
(1) for each destination Dst ∈ {NSC,MDC, BAN} do(2) NH = {All neighbor nodes𝑗 ∈ NH(𝑖,Dst)}
(3) if (|NH| == 1) then(4) NH
𝐷← NH
(5) else if (|NH| > 1) then(6) Sort NH in ascending order of DLpath(𝑖,Dst)(7) NH
𝐷= first neighbor node 𝑗 ∈ NH;
(8) end if(9) end for
Algorithm 1: Routing table construction algorithm for delay-sensitive packets.
INPUT: Routing table, 𝑖’s routing table records NH(𝑖,Dst), ∀Dst ∈ {MDC,NSC, BAN}
(1) for each data packet do(2) if data packet is delay-sensitive packet (DSP)(3) if (DLpath(𝑖,Dst) ≤ DLreq) then(4) send to NH
𝐷
(5) else(6) Drop the packet immediately(7) end if(8) else if data packet is Ordinary Packet (OP)(9) send to NH
𝐸
(10) else(11) drop the packet immediately(12) end if(13) end for
Algorithm 2: Path selector algorithm for delay-sensitive packets.
the queue. The queue works in a First-In-First-Out (FIFO)fashion. It transmits the packets after capturing the channelby using CSMA/CA algorithm.
5. Performance Evaluation
Simulations are performed on OMNeT++ based simulatorCastalia 3.2 [19]. In this section, the proposed QPRD algo-rithm is compared with the DMQoS [13] and noRoutingprotocols. In noRouting, the delay-sensitive data packets areforwarded to random next hop devices instead of algorithm’snext hop based on end-to-end path delay routes.The networkparameters used in simulations are shown in Table 1.
Three scenarios are considered for simulation. All thenodes used in scenario 1 are static, whereas the source node𝐵4is moving in scenario 2. Scenario 3 is used for the
scalability test of the protocol. The transmit power used inthe simulations is −25 dBm.The performance of the QPRD ismeasured by calculating the throughput, number of packetsforwarded by the intermediate nodes, overall network traffic,packets timeout due to not fulfilling the required delaycondition, and packets dropped due to the buffer overflow.The better results provided by QPRD are in accordance withthe equations used in Section 4.The higher throughput is dueto the use of objective function in QPRD, as described in (1),and the least violations of (4c), (4d), and (4e).The simulation
MDC1 B1
NSC and MDC4 MDC3 B3 B4
B2MDC2
(5, 5)
(9, 3)(3, 3)(0, 3)
(5, 1)
(6, 3)
(2, 1)
(2, 5)
Figure 4: Node deployment for scenario 1.
results show that the end-to-end path delay mechanism, asdiscussed in Sections 3.2 and 4.4, used in QPRD helps toreduce the packets forwarded by intermediate nodes and thepackets dropped due to the buffer overflow, which resultsin higher throughput and lower overall network traffic. Toachieve a 97% confidence interval for the illustrative results,the average of three runs is simulated in every experimentwhich may introduce a maximum error of 3 × 10⁻³, based onthe error calculation done by Castalia 3.2 simulator [20]. Theresults obtained for first two scenarios are discussed below.
5.1. Scenario 1: Static Nodes. Figure 4 shows the deploymentof the experimental network for scenario 1. All the nodes are

Mobile Information Systems 9
0
10
20
30
40
50
60
70
80
90
100
Number of packets sent by source nodes (k)
Succ
essfu
l tra
nsm
issio
n ra
te (%
)
1 2 3 4 8 12 16 20
QPRDDMQoS
noRouting
(a) Throughput
0
5
10
15
20
25
30
35
40
45
Forw
arde
d pa
cket
s (k
pack
ets)
Number of packets sent by source nodes (k)1 2 3 4 8 12 16 20
QPRDDMQoS
noRouting
(b) Packets forwarded by intermediate nodes
0
10
20
30
40
50
60
70
Traffi
c loa
d (k
pac
kets)
Number of packets sent by source nodes (k)1 2 3 4 8 12 16 20
QPRDDMQoS
noRouting
(c) Overall network traffic
0
2
4
6
8
10
12N
umbe
r of p
acke
ts tim
e out
s (k)
Number of packets sent by source nodes (k)1 2 3 4 8 12 16 20
QPRDDMQoS
noRouting
(d) Packets timeout
0
1
2
3
4
5
6
7
8
Buffe
r ove
rflow
(k p
acke
ts)
Number of packets sent by source nodes (k)1 2 3 4 8 12 16 20
QPRDDMQoS
noRouting
(e) Packets dropped due to MAC buffer overflow
0
50
100
150
200
250
300
Ener
gy co
nsum
ptio
n (J
)
Number of packets sent by source nodes (k)1 2 3 4 8 12 16 20
QPRDDMQoS
noRouting
(f) Overall energy consumption
Figure 5: Performance comparison for different parameters when source nodes are static.

10 Mobile Information Systems
Table 1: Parameters information.
Deployment
Area Scenarios 1 and 2: 9m by 9mScenario 3: 21m × 16m
Deployment typeScenario 1: all nodes are staticScenario 2: movable source node B4
Scenario 3: hospital environment
Number of nodes Scenarios 1 and 2: 8 nodes (4 BANs, 3MDCs, 1 NSC)Scenario 3: 49 nodes (24 BANs, 24MDCs, 1 NSC)
Initial nodes locations
Scenarios 1 and 2: NSC(0,3),MDC1(2,5), MDC2(2,1), MDC3(3,3)B1(5,5), B2(5,1), B3(6,3), B4(9,3)
Scenario 3: shown in Figure 8Initial node energy 18720 J (= 2AA batteries)Buffer size 32 packetsLink layer trans. rate 250KbpsTransmit power −25 dBm
TaskApplication type Event-drivenMax. packet size 32 bytesTraffic type CBR (Constant Bit Rate)
MAC IEEE 802.15.4 Default values
Simulation Time2003 seconds(3 seconds are setup time. Simulation results are theaverage of three rotations.)
static in this scenario. The type 1 devices (BANCs: B1, B2, B3,
and B4) are considered as source nodes, and type 2 devices
(NSC andMDCs) are the destination nodes. B1sends packets
to MDC1, B2sends packets to MDC
2, B3sends packets to
MDC3, and B
4sends packets to NSC. The data of B
4has to
go through the other devices to reach NSC.The source nodessend a total of 20 k delay-sensitive packets. The throughput,packets forwarded by intermediate nodes, overall networktraffic, number of packets timeout, packets dropped due toMAC buffer overflow, and overall energy consumption arecalculated after every 1000 packets until 4 k and then every4000 packets sent by all BANCs.
From Figure 5(a), it is seen that QPRD consistently pro-vides throughput of 94% or more. In comparison, noRout-ing provides an average of 74% transmission rate, whereasDMQoS has a throughput ranging from 49% to 57%. Forlow offered data loads of 1 k, DMQoS has a throughput of57% that continues to decrease especially for high offereddata loads of 20 k, when the throughput is 49%. The lowthroughput in DMQoSmay be explained by the way it selectsthe next hop using the energy-aware geographic forwardingscheme. Because the best next hop does not guarantee thatit has the smallest latency connection to the destination, thepacket may timeout when it is sent using the “best” next hop.Moreover, the energy-aware geographic forwarding schemeused in DMQoS prefers the nearest next hop candidate interms of hop count and ignores next hop nodes having alower delay. As a result, the network traffic is increased andthe packets are dropped due to timeout before reaching thedestination. QPRD resolves these issues by using the end-to-end path delay.
B2is the closest node to the destination nodes (i.e.,
NSC or MDCs) as shown in Figure 4. In DMQoS [13], B2is
responsible for forwarding the data packets from other nodesto NSC or MDCs. This results in more energy consumptionfor B2and increased traffic congestion experienced by B
2.
EPR resolves these problems by choosing the most appro-priate next hop. In the proposed QPRD scheme, the BANcoordinator does not send data to another BAN coordinatorunless it is absolutely necessary. Figure 5(b) shows the num-ber of packets forwarded by the intermediate nodes. It is seenfrom Figure 5(b) that number of data packets forwarded byintermediate nodes before reaching the destinations inQPRDare on average 0.5 times and 3 times lower than DMQoS andnoRouting, respectively.
The lower number of forwarded packets by intermediatenodes helps to reduce the overall network traffic. Figure 5(c)shows the total network traffic generated by QPRD, DMQoS,and noRouting as a function of the offered traffic load. Fromthis Figure, it is seen that QPRD generates about an average of26% and 99% less traffic in the network compared to DMQoSand noRouting, respectively. The path calculation in QPRDconsiders the delay of all the nodes and uses the best pathdelay information to select the next hop to send the data fromsource to destination.
In contrast to the method used in DMQoS which decideson the immediate next hop based merely on next hop delayinstead of overall path delay, each upstream hop in DMQoSsends the packet to its next hop and resultant path in DMQoSmay not be the most optimal.
From Figure 5(d) it is observed that QPRD and noRout-ing have no packets that were timed out for all offered

Mobile Information Systems 11
MDC1 B1
NSC and MDC4
MDC2
MDC3
B2
B3 B4
(2, 5) (5, 5)
(0, 3)
(2, 1) (5, 1)
(6, 3) (9, 3)(3, 3)
Figure 6: Node deployment for scenario 2.
traffic loads (number of data packets sent by source noderange from 0 k to 20 k). QPRD has better performance interms of reduced overall network traffic and fewer numbersof dropped packets due to timeout, because the clear end-to-end path delay information helps the packet to reachthe destination within the requested delay requirement.Moreover, the path calculation in QPRD considers the delayof all the nodes in the network and chooses only those pathswhich can guarantee delivering the packet to the destinationbefore it times out.
Figure 5(e) shows that there is no packet dropped due totheMAC buffer overflow in QPRD protocol.This is due to noviolation of themodel constraints as explained in Sections 4.1and 4.2. The source node chooses the path which providesthe maximum throughput and minimum end-to-end pathdelay as described in [16, 18]. Only few packets are droppedin DMQoS, whereas 7.5 k packets are dropped in noRouting.
It is seen from Figure 5(f) that the end-to-end path delaymechanism used in QPRD does not affect the overall energyconsumption when compared with DMQoS. QPRD andDMQoS consume the same 18 Joules to 275 Joules of energywhen 1 k to 20 k packets are sent by source nodes. On theother hand, the energy consumption of noRouting protocolis 2.6 Joules to 47.7 Joules when 1 k to 20 k packets are sent bysource nodes. The data packets in noRouting are randomlyforwarded to three neighbor nodes without considering thedelay requirements. The additional computations for delayin QPRD consume on average 6 times more energy thannoRouting. However, it must be noted that noRouting resultsin on average a 99% higher overall network traffic. Thismay be attributed to the 3 times more packets forwarded byintermediate nodes in noRouting resulting in a 20% lowerthroughput as compared to QPRD.
In summary, QPRDoutperformsDMQoS and noRoutingwhen the source node is static.
5.2. Scenario 2: Mobile Source Node. In the second scenario,the source node B
4is moving at the speed of 1 meter per
second vertically as shown in Figure 6. It is assumed that thespeed of a fast walking patient is 1 meter per second.
Once again, it is observed that QPRD provides betterresults than DMQoS and noRouting in case of mobile sourcenode scenario. Figure 7(a) shows that the throughput is in
excess of 80% in QPRD for offered data packet rates less than8 k. The throughput reduces slightly at higher offered datapacket rates of 8 k and more and reduces to 71% when totaloffered packets sent by the source are 20 k. In contrast withDMQoS, it is observed that when the offered data packet loadis increased, DMQoS suffers from a much lower successfuldata transmission rate that reduces from 50% to 32% withresultant low throughput. Due to node mobility, the sourcenode moves away from its neighbor nodes resulting in aconnection loss which results in more packets being lost.QPRD handles this situation much more gracefully thanDMQoS. In QPRD, the mobile nodes resume the connectionmore rapidly once the nodes come back into the range ofneighbor node.The overall lower throughput in this scenariois due to the packet lost when themobile node is out of range.Equation (4d) in Section 3.1 also supports this behavior.According to (4d), the packet delivery is successful only if asource node transmits data to an in-range destination node.The packets are dropped when the movable nodes go out ofrange.The noRouting provides the lower throughput with anaverage of 64%.
Figure 7(b) shows that the number of packets forwardedby the intermediate nodes in QPRD is on average 0.75times and 9 times lower when compared to the number ofpackets forwarded by intermediate nodes in DMQoS andnoRouting protocols, respectively. The routing mechanismused in the QPRD protocol helps to send the data directlyto the destination without transferring the packets to theintermediate nodes in case the destination is in range. It canbe seen in Section 3.3 that use of intermediate node resultsin larger delay and in Section 3.2 that the backoff of othernoncapturing nodes also contributes to exacerbating theproblem. The performance of noRouting for this parameteris worst as it forwards up to 26 k packets which increases theoverall network traffic.
It is observed from Figure 7(c) that the overall networktraffic in QPRD is about 25% and 50% less than DMQoSand noRouting protocols, respectively, for all offered networkdata loads considered. This is due to the end-to-end pathcalculation mechanism used in QPRD. The delay of all thenodes is considered andQPRDalgorithm selects the best nexthop, on the basis of end-to-end path delay information, tosend the data from source to destination.
FromFigure 7(d), it is seen thatQPRDhas no packets thatwere timed out for data packet transmissions at 8 k or less.The selection of minimum end-to-end path delay, given in[18], helpsQPRD to send the data through a pathwhere lowerpackets time out occurs. For high data packets (above 8 k), thesource node moves out of the neighbors’ radio range whichcauses more packets to time out. On the other hand, DMQoShas more timed out packets than QPRD. Initially for lowoffered data packet rates below 4 k, about 40% of data packetswere timed out, and for higher offered data packets (above4 k) the 40%of data packet time outs increase to 50% (approx-imately). This is because the packets travel through differentnodes by using hop-by-hop delay calculation as discussed indetail in scenario 1. Equation (9) in Section 4.2 shows thatthe delay on each node is the summation of four differentdelays (i.e., transmission (DLtrans), MAC and network queues

12 Mobile Information Systems
0
20
40
60
80
100
120
Succ
essfu
l tra
nsm
issio
n ra
te (%
)
Number of packets sent by source nodes (k)1 2 3 4 8 12 16 20
QPRDDMQoS
noRouting
(a) Throughput
0
5
10
15
20
25
30
Number of packets sent by source nodes (k)1 2 3 4 8 12 16 20
Forw
arde
d pa
cket
s (k
pack
ets)
QPRDDMQoS
noRouting
(b) Packets forwarded by intermediate nodes
05
101520253035404550
Traffi
c loa
d (k
pac
kets)
Number of packets sent by source nodes (k)1 2 3 4 8 12 16 20
QPRDDMQoS
noRouting
(c) Overall network traffic
0
2
4
6
8
10
12N
umbe
r of p
acke
ts tim
e out
s (k)
Number of packets sent by source nodes (k)1 2 3 4 8 12 16 20
QPRDDMQoS
noRouting
(d) Packets timeout
0123456789
10
Buffe
r ove
rflow
(k p
acke
ts)
Number of packets sent by source nodes (k)1 2 3 4 8 12 16 20
QPRDDMQoS
noRouting
(e) Packets dropped due to MAC buffer overflow
0
50
100
150
200
250
300
Ener
gy co
nsum
ptio
n (J
)
Number of packets sent by source nodes (k)1 2 3 4 8 12 16 20
QPRDDMQoS
noRouting
(f) Overall energy consumption
Figure 7: Performance comparison for different parameters when source node is mobile.

Mobile Information Systems 13
3m BAN19(5, 15)
MDC19(4, 14)
BAN20(8, 15)
MDC20(7, 14)
BAN21(11, 15)
MDC21(10, 14)
BAN22(14, 15)
MDC22(13, 14)
BAN23(17, 15)
MDC23(16, 14)
BAN24(20, 15)
MDC24(19, 14)
3m
BAN18(3, 12)
MDC18(4, 11)
BAN13(8, 10)
MDC13(7, 11) BAN14
(11, 10)
MDC14(10, 11) BAN15
(14, 10)
MDC15(13, 11) BAN16
(17, 10)
MDC16(16, 11) BAN17
(20, 10)
MDC17(19, 11)
3m BAN8(8, 7)
MDC8(7, 8) BAN9
(11, 7)
MDC9(10, 8) BAN10
(14, 7)
MDC10(13, 8) BAN11
(17, 7)
MDC11(16, 8) BAN12
(20, 7)
MDC12(19, 8)
(4, 7)
NSC
3m
BAN1(2, 0)
MDC1(3, 3) BAN2
(5, 0)
MDC2(4, 3) BAN3
(8, 0)
MDC3(7, 3) BAN4
(11, 0)
MDC4(10, 3) BAN5
(14, 0)
MDC5(13, 3) BAN6
(17, 0)
MDC6(16, 3) BAN7
(20, 0)
MDC7(19, 3)
2m
21m
2m
2m
2m
3m
3m
3m
16m
2m
3m
Figure 8: Scenario 3. Node deployment for 24 patient beds in hospital environment.
(DLqueue), channel (DLchannel), and processing (DLproc). Thecalculations done by DMQoS on each node increase theprocessing delay which causes the increase of overall nodedelay. The higher node delay results in packet time out. Thesource node mobility makes the packet time out worse thanscenario 1 of Figure 5(d).
Figure 7(e) shows that there are no packet drops dueto MAC buffer overflow in QPRD and DMQoS protocols,whereas 9 k packets are dropped in noRouting. The perfor-mance of DMQoS is similar to QPRD in terms of MACbuffer overflow; however, DMQoS has on average 39% lowerthroughput and an average of 25% higher overall networktraffic.
From Figure 7(f), it is observed that the overall energyconsumptions of QPRD and DMQoS are 18.9 Joules to275.7 Joules when 1 k to 20 k packets are sent by sourcenodes. The noRouting consumes 2.6 Joules to 47 Jouleswhen 1 k to 20 k packets are sent by source nodes. Thecomputations for delay in QPRD are almost similar to theDMQoS but QPRD provides on average 25% lower overallnetwork traffic, 73% fewer packets forwarded by interme-diate nodes, and, more importantly, a 40% higher success-ful data transmission rate (throughput) as compared toDMQoS.
In summary, the overall performance of QPRD is betterthanDMQoS and noRoutingwhen the source node ismobile.
6. Scalability Test: Real Hospital Environmentwith 24 Beds (49 Nodes)
A real 24-patient-bed hospital is considered for the scalabilitytest of QPRD routing protocol, as shown in Figure 8. Theapproximate area covered is 16m by 21m which is similarto the Hematology-Oncology Unit of the Children Hospitalnamed IWK Health Centre Halifax, Canada. The distancebetween two beds is 3 meters which is in accordance with therecommended transmission range for BAN communicationin hospital environment. The total nodes used in the deploy-ment area are 49 (24 BANs, 24MDCs, and 1 NSC). Each BANtransmits the data to its peer MDC. All the BANs and MDCsare sending or receiving Hello protocols to/from other nodesand the NSC.
BothMDCs and BANs are movable. Generally, BANs canmove freely anywhere and the movement of a MDC is onlywithin the room where it is placed. It is assumed that theMDC of one room has a connection with the MDC of thenext room.

14 Mobile Information Systems
0
20
40
60
80
100
120Su
cces
sful t
rans
miss
ion
rate
(%)
Packets sent by source nodes (k)
3.5
9.5
15.5
21.5
27.5
33.5
39.5
45.5
51.5
57.5
QPRDDMQoS
noRouting
(a) Throughput versus offered load
0
20
40
60
80
100
120
140
160
180
Net
wor
k tr
affic (
k pa
cket
s)
QPRDDMQoS
noRoutingPackets sent by source nodes (k)
3.5
9.5
15.5
21.5
27.5
33.5
39.5
45.5
51.5
57.5
(b) Overall network traffic
0
5
10
15
20
25
Buffe
r ove
rflow
(pac
kets
(k))
QPRDDMQoS
noRoutingPackets sent by source nodes (k)
3.5
9.5
15.5
21.5
27.5
33.5
39.5
45.5
51.5
57.5
(c) Packets dropped due to MAC buffer overflow
0
5
10
15
20
25
30
Pack
ets t
ime o
ut (k
)
QPRDDMQoS
noRoutingPackets sent by source nodes (k)
3.5
9.5
15.5
21.5
27.5
33.5
39.5
45.5
51.5
57.5
(d) Packets timeout
Figure 9: Performance comparison for different parameters of scenario 3.
The simulation results show that QPRD performs betterthan DMQoS and noRouting even when the number ofnodes is increased to 49. From Figure 9(a) it is seen that thethroughput provided by QPRD is in excess of 91%, whereasthe throughput of noRouting and DMQoS protocols is onaverage 74% and 52%, respectively. From Figure 9(b), it isobserved that the overall network traffic of QPRD is 50% and25% less than noRouting andDMQoS protocols, respectively.Figure 9(c) shows that the packet drops due to MAC bufferoverflow in QPRD and DMQoS protocols are negligible,whereas 9 k packets are dropped in noRouting. Figure 9(d)shows that there are no packets timeouts due to not fulfillingthe delay requirements in QPRD and noRouting. On theother hand 25 k packets are timed out in DMQoS. From theseresults it is shown that QPRD is equally effective when thedeployment area is larger, and number of nodes has beenincreased to simulate a real hospital scenario with 24 patientbeds.
7. Conclusion
The paper models the wireless BAN as a directed graph andderives conditions for throughput maximization and end-to-end delay minimization. It is shown that efficient energyutilization is critical to the proper design of the routingand MAC layer protocols. Similarly, delay is minimized byformulating the BAN end-to-end path delay as a linear pro-gramming problem with multiple constraints to be satisfiedsimultaneously.
Based on the mathematical analysis, a novel modularQoS-aware routing protocol for hospital BAN communi-cation is proposed in this paper. The architecture of thenew protocol consists of seven modules: the MAC receiver,the delay module (DM), the packet classifier (PC), theHello protocol module (HPM), the routing services module(RSM), the QoS-aware queuing module (QQM), and theMAC transmitter. The proposed routing protocol provides

Mobile Information Systems 15
a mechanism for the end-to-end path delay calculation ofall possible paths from a source to destination and thendecides the best possible path by considering the path delayrequirements of the delay-sensitive packets.
OMNeT++ based simulator Castalia 3.2 is used to testthe performance of the proposed protocol (QPRD) andcompare it with DMQoS and noRouting. The simulationsare performed for both the movable source and stationaryscenarios. A scalability test is done with larger deploymentarea and by using higher number of nodes. The results showthat the QPRD offers over 94% successful data transmissionrates for delay-sensitive packets in a stationary patient sce-nario. QPRD provides about 35% better results in terms ofsuccessful transmission rate than DMQoS in the movablepatient scenario. The simulation results show that the QPRDimproves the reliability of Body Area Networks by 40% onaverage for each scenario by decreasing the number of packettime outs with zero and averaging 729 packets for the staticandmobile patient scenarios, respectively. In addition,QPRDresults in an average of 25% lower overall network trafficfor each mobile and static patient scenarios as comparedto similar protocols. The scalability test results prove thatQPRD outperforms DMQoS and noRouting even when ahigher number of nodes are employed in the BAN. QPRDprovides on average 93% throughput without any packetbeing timed out and any packet being dropped due to MACbuffer overflow.
Notations for the Proposed Algorithm
Node 𝑖: Source nodeNode 𝑗: Neighbor node of source nodeNode Dst: Destination node (i.e., NSC, MDC,
BAN)IDDst: Destination ID𝐿Dst: Destination locationID𝑗: Neighbor node 𝑗 ID
𝐿𝑗: Neighbor node 𝑗 location
𝐷(𝑗,Dst): Distance between neighbor node 𝑗 and
destination Dst𝐸𝑗: Residual energy of node 𝑗
𝑇𝑗: Device type of node 𝑗
𝐷(𝑖,𝑗)
: Distance between node 𝑖 to neighbornode 𝑗
NH(𝑖,Dst): Next hop between node 𝑖 and
destination DstNH𝐸: Energy-aware next hop
NH𝐷: Next hop for delay-sensitive packets
DLpath(𝑖,Dst): Path delay from node 𝑖 to destinationDst
DLnode(𝑖): Time delay within the node 𝑖DLreq: Required path delay for delay-sensitive
packets.
Conflict of Interests
The authors declare that there is no conflict of interestsregarding the publication of this paper.
References
[1] B. Zhen,M. Patel, S. Lee, E. T.Won, andA. Astrin, “15-08-0644-09-0006-tg6-technical-requirements,” IEEE Project: IEEEP802.15 Working Group for Wireless Personal Area Networks(WPANs), 2011, https://mentor.ieee.org/802.15/dcn/11/15-11-0307-00-0006-tg6-closing-report-march-2011.ppt.
[2] IEEE, “IEEE 802.15 WPAN task group 6 (TG6) body area net-works,” IEEE 802.15, 2007, http://ieee802.org/15/pub/TG6.html.
[3] D. Curtis, E. Shih, J. Waterman et al., “Physiological signalmonitoring in the waiting areas of an emergency room,” inProceedings of the ICST 3rd International Conference on BodyArea Networks (BodyNets ’08), Tempe, Ariz, USA, 2008.
[4] S. Jiang, Y. Cao, S. Iyengar et al., “CareNet: an integratedwireless sensor networking environment for remote healthcare,”in Proceedings of the 3rd International ICST Conference on BodyArea Networks (BodyNets ’08), Tempe, Ariz, USA, March 2008.
[5] T. Gao, T. Massey, L. Selavo et al., “The advanced health anddisaster aid network: a light-weight wireless medical system fortriage,” IEEE Transactions on Biomedical Circuits and Systems,vol. 1, no. 3, pp. 203–216, 2007.
[6] A. Wood, G. Virone, T. Doan et al., “ALARM-NET: wirelesssensor networks for assisted-living and residential monitoring,”Tech. Rep. CS-2006-11, Department of Computer Science,University of Virginia, Charlottesville, Va, USA, 2006.
[7] Z.Khan, S. Sivakumar,W. Phillips, andN.Aslam, “Anewpatientmonitoring framework and Energy-aware Peering Routing Pro-tocol (EPR) for Body Area Network communication,” Journalof Ambient Intelligence and Humanized Computing, vol. 5, no. 3,pp. 409–423, 2014.
[8] Z. Khan, S. Sivakumar, W. Phillips, and B. Robertson, “A QoS-aware routing protocol for reliability sensitive data in hospitalbody area networks,” Procedia Computer Science, vol. 19, pp. 171–179, 2013.
[9] Z. Khan, S. Sivakumar, W. Phillips, and B. Robertson, “QPRR:QoS-aware peering routing protocol for reliability sensitive datain body area network communication,” The Computer Journal,2014.
[10] Z. Khan, S. Sivakumar, W. Phillips, and B. Robertson, “QPRD:QoS-aware peering routing protocol for delay sensitive datain hospital body area network communication,” in Proceedingsof the 7th International Conference on Broadband, WirelessComputing, Communication and Applications (IEEE BWCCA’12), pp. 178–185, University of Victoria, Victoria, Canada,November 2012.
[11] X. Huang and Y. Fang, “Multiconstrained QoS multipathrouting in wireless sensor networks,”Wireless Networks, vol. 14,no. 4, pp. 465–478, 2008.
[12] S. Agarwal, Divya, and G. N. Pandey, “SVM based contextawareness using body area sensor network for pervasive health-care monitoring,” in Proceedings of the 1st International Con-ference on Intelligent Interactive Technologies and Multimedia(IITM ’10), pp. 271–278, Allahabad, India, December 2010.
[13] A. Razzaque, C. S. Hong, and S. Lee, “Data-centric multiob-jective QoS-aware routing protocol for body sensor networks,”Sensors, vol. 11, no. 1, pp. 917–937, 2011.
[14] E. Felemban, C.-G. Lee, and E. Ekici, “MMSPEED: multipathmulti-SPEED protocol for QoS guarantee of reliability andtimeliness in wireless sensor networks,” IEEE Transactions onMobile Computing, vol. 5, no. 6, pp. 738–754, 2006.
[15] M. Chen, T. Kwon, S. Mao, Y. Yuan, and V. C. M. Leung,“Reliable and energy-efficient routing protocol in densewireless

16 Mobile Information Systems
sensor networks,” International Journal of Sensor Networks, vol.4, no. 1-2, pp. 104–117, 2008.
[16] M. Razzaque, M. Alam, M. Rashid, and C. Hong, “Multi-constrainedQoS geographic routing for heterogeneous traffic insensor networks,” inProceedings of the 5th IEEEConsumerCom-munications and Networking Conference (CCNC ’08), KyungHee University, Las Vegas, Nev, USA, January 2008.
[17] J. Elias and A. Mehaoua, “Energy-aware topology design forwireless body area networks,” inProceedings of the IEEE Interna-tional Conference on Communications (ICC ’12), pp. 3409–3410,Ottawa, Canada, June 2012.
[18] N. Ababneh, N. Timmons, J. Morrison, and D. Tracey, “Energy-balanced rate assignment and routing protocol for body areanetworks,” in Proceedings of the 26th IEEE International Con-ference on Advanced Information Networking and ApplicationsWorkshops (WAINA ’12), pp. 466–467, Fukuoka, Japan, March2012.
[19] NICTA, “Castalia,” National ICT Australia, 2011, http://castalia.npc.nicta.com.au/.
[20] A. Boulis, “Castalia, wireless sensor network simulator,NICTA,”2011, https://forge.nicta.com.au/docman/view.php/301/592/Castalia+-+User+Manual.pdf.

Submit your manuscripts athttp://www.hindawi.com
Computer Games Technology
International Journal of
Hindawi Publishing Corporationhttp://www.hindawi.com Volume 2014
Hindawi Publishing Corporationhttp://www.hindawi.com Volume 2014
Distributed Sensor Networks
International Journal of
Advances in
FuzzySystems
Hindawi Publishing Corporationhttp://www.hindawi.com
Volume 2014
International Journal of
ReconfigurableComputing
Hindawi Publishing Corporation http://www.hindawi.com Volume 2014
Hindawi Publishing Corporationhttp://www.hindawi.com Volume 2014
Applied Computational Intelligence and Soft Computing
Advances in
Artificial Intelligence
Hindawi Publishing Corporationhttp://www.hindawi.com Volume 2014
Advances inSoftware EngineeringHindawi Publishing Corporationhttp://www.hindawi.com Volume 2014
Hindawi Publishing Corporationhttp://www.hindawi.com Volume 2014
Electrical and Computer Engineering
Journal of
Journal of
Computer Networks and Communications
Hindawi Publishing Corporationhttp://www.hindawi.com Volume 2014
Hindawi Publishing Corporation
http://www.hindawi.com Volume 2014
Advances in
Multimedia
International Journal of
Biomedical Imaging
Hindawi Publishing Corporationhttp://www.hindawi.com Volume 2014
ArtificialNeural Systems
Advances in
Hindawi Publishing Corporationhttp://www.hindawi.com Volume 2014
RoboticsJournal of
Hindawi Publishing Corporationhttp://www.hindawi.com Volume 2014
Hindawi Publishing Corporationhttp://www.hindawi.com Volume 2014
Computational Intelligence and Neuroscience
Industrial EngineeringJournal of
Hindawi Publishing Corporationhttp://www.hindawi.com Volume 2014
Modelling & Simulation in EngineeringHindawi Publishing Corporation http://www.hindawi.com Volume 2014
The Scientific World JournalHindawi Publishing Corporation http://www.hindawi.com Volume 2014
Hindawi Publishing Corporationhttp://www.hindawi.com Volume 2014
Human-ComputerInteraction
Advances in
Computer EngineeringAdvances in
Hindawi Publishing Corporationhttp://www.hindawi.com Volume 2014