research article rolling bearing fault diagnosis...
TRANSCRIPT

Research ArticleRolling Bearing Fault Diagnosis Based on CEEMD andTime Series Modeling
Liye Zhao12 Wei Yu12 and Ruqiang Yan1
1 School of Instrument Science and Engineering Southeast University Nanjing 210096 China2 Key Laboratory of Micro-Inertial Instrument and Advanced Navigation Technology Ministry of Education Nanjing 210096 China
Correspondence should be addressed to Ruqiang Yan ruqiangseueducn
Received 2 May 2014 Accepted 19 June 2014 Published 7 July 2014
Academic Editor Xuefeng Chen
Copyright copy 2014 Liye Zhao et al This is an open access article distributed under the Creative Commons Attribution Licensewhich permits unrestricted use distribution and reproduction in any medium provided the original work is properly cited
Accurately identifying faults in rolling bearing systems by analyzing vibration signals which are often nonstationary is challengingTo address this issue a new approach based on complementary ensemble empirical mode decomposition (CEEMD) and timeseries modeling is proposed in this paper This approach seeks to identify faults appearing in a rolling bearing system using properautoregressive (AR) model established from the nonstationary vibration signal First vibration signals measured from a rollingbearing test system with different defect conditions are decomposed into a set of intrinsic mode functions (IMFs) by means ofthe CEEMD method Second vibration signals are filtered with calculated filtering parameters Third the IMF which is closelycorrelated to the filtered signal is selected according to the correlation coefficient between the filtered signal and each IMF and thenthe ARmodel of the selected IMF is established Subsequently the ARmodel parameters are considered as the input feature vectorsand the hidden Markov model (HMM) is used to identify the fault pattern of a rolling bearing Experimental study performed ona bearing test system has shown that the presented approach can accurately identify faults in rolling bearings
1 Introduction
Rolling element bearing failure is one of the foremost causesof failures in rotating machinery and such failure mayresult in costly production loss and catastrophic accidentsEarly detection and diagnosis of bearing faults while themachine is still in operation can help to avoid abnormalevent progression and to reduce productivity loss [1] Sincestructural defects can cause changes of the bearing dynamiccharacteristics as manifested in vibrations vibration-basedanalysis has long been established as a commonly usedtechnique for diagnosing bearing faults [2] However somenonlinear factors such as clearance friction and stiffnessaffect complexity of the vibration signals thus it is difficultto make an accurate evaluation on the working condition ofrolling bearings only through analysis in time or frequencydomain as it does traditionally [3]
In order to overcome limitations of the traditional tech-niques autoregressive (AR) model has been successfullyapplied to extracting features from vibration signals for fault
diagnosis in recent years [4ndash6] This is because AR modelis a time series analysis method whose parameters compriseimportant information of the system condition and an accu-rate AR model can reflect the characteristics of a dynamicsystem [7] For example AR model was combined with afuzzy classifier for fault diagnosis in vehicle transmissiongear [8] Three distinct techniques of autoregressive mod-eling were compared for their performance and reliabilityunder conditions of various bearings signal lengths [9] Adiagnosis method based on the AR model and continuousHMM has also been used to monitor and diagnose therolling bearing working conditions [10] However when theAR model is applied directly to the nonstationary bearingvibration signals the analysis results are imperfect since theestimation method of the autoregression parameters of theAR model is no longer applicable Because the vibrationsignal is nonstationary whereas the AR model is suitablefor stationary signal processing it is therefore necessaryto preprocess the vibration signals before the AR model isgenerated
Hindawi Publishing CorporationMathematical Problems in EngineeringVolume 2014 Article ID 101867 13 pageshttpdxdoiorg1011552014101867
2 Mathematical Problems in Engineering
Empirical mode decomposition (EMD) is an adaptivetime-frequency signal processing method [11] With EMD asignal is decomposed into a series of intrinsicmode functions(IMFs) according to its own characteristics [12] For examplea new fault feature extraction approach based on EMDmethod and AR model was used to process vibration signalsof roller bearings [3] However when the EMD method isapplied to the nonstationary signals containing intermittentsignal components the original signal cannot be decomposedaccurately because of the problem of mode mixing [13] Toalleviate mode mixing Wu and Huang developed ensembleempiricalmode decomposition (EEMD) to improve EMDByadding noise to the original signal and calculating the meansof IMFs repeatedly EEMD is more accurate and effectivefor signal decomposition [13] Although the EEMD methodhas effectively resolved the mode-mixing problem it is timeconsuming for implementing the large enough ensemblemean That is to say the algorithm efficiency will be greatlyreduced Aiming at solving this problem the complementaryensemble EMD (CEEMD) method is proposed [14] In thisapproach the residue of added white noises can be extractedfrom the mixtures of data and white noises via pairs ofcomplementary ensemble IMFs with positive and negativeadded white noises The CEEMD method has the sameperformance as the EEMD but the computational efficiencyis greatly improved
In this paper we combine the advantages of CEEMDand time series model and propose a new method based onCEEMD and AR model for rolling bearing fault diagnosisThe CEEMD is used as the pretreatment to filter the signaland extract the IMF which is closely correlated to thefiltered signal and then the AR model of the selected IMFis established The AR model parameters are used as thefeature vectors to a classifier where the hiddenMarkovmodel(HMM) is used to identify the fault pattern of a rollingbearing The rest of this paper is organized as follows InSection 2 the review of the fault diagnosis method based onAR model is presented and the proposed method for rollingbearing fault diagnosis is discussed The evaluations andexperiments are presented in Section 3 Finally concludingremarks are drawn in Section 4
2 Theoretical Framework
21 Time Series Modeling Autoregressive moving average(ARMA)model is the representative time seriesmodel whichcan be expressed in linear difference equation form as
119909119905+ 1205931119909119905minus1
+ sdot sdot sdot + 120593119899119909119905minus119899
= 119886119905+ 1205791119886119905minus1
+ sdot sdot sdot + 120579119898
119886119905minus119898
(1)
where 119899 and 119898 are the parameters of the ARMA (119899 119898)model 119909
119905is zero mean stationary random sequence 119886
119905is
white noise sequence and 120593119894and 120579
119895are model parameters
to be estimated The parameters of 120593119894and 120579
119895are estimated
by the time sequence of 119909119905(119905 = 1 2 3 ) which is called
the time series modeling If 120593119894
= 0 the ARMA (119899 119898) modelwill degrade to 119898 order MA(119898) model and if 120579
119894= 0 the
ARMA (119899 119898) model will degrade as 119899 order AR (119899) model in(1) The AR model is stable and its structure is simpler than
ARMA model Therefore the AR model will be establishedfor characterizing the rolling bearing vibration signal if theprecision of the model is enough for expressing the systemwhich is expressed as
119909119905
= 1205931119909119905minus1
+ sdot sdot sdot + 120593119899119909119905minus119899
+ 119886119905 (2)
where 119905 = 1 2 119873 119873 is the length of the time series 119909119905 119899
is the order number and 119886119905
sim NID(0 1205902
119886)The 120590
2
119886is expressed
as
1205902
120572=
1
119873 minus 119899
119899
119899
sum
119905=119899+1
(119909119905minus
119899
sum
120580=1
120593120580119909119905minus1
)
2
(3)
It is critical to determine the order number of the ARmodel because the accuracy of the order not only affects theaccuracy of identification of the system but also influencesthe stability of the system In order to estimate the order oftheARmodel correctly FPE criterion BIC criterion andAICcriterion are usually used [15] and they are expressed as
FPE criterion
FPE (119899) =
119873 + 119899
119873 minus 119899
1205902
119886 (4)
BIC criterion
AIC (119899) = 119873 ln1205902
119886+ 2119899 (5)
AIC criterion
BIC (119899) = 119873 ln1205902
119886+ 119899 ln119873 (6)
After the model order is determined the nonlinear leastsquares method can be used to estimate model parametersand then the AR model with specific parameters is estab-lished
22 Complementary Ensemble Empirical Mode Decomposi-tion Complementary ensemble empirical mode decomposi-tion (CEEMD) is an improved algorithm based on empiricalmode decomposition (EMD) Through EMD process anycomplex time series can be decomposed into finite numbersof intrinsic mode functions (IMFs) and each IMF reflectsthe dynamic characteristic of the original signal The IMFcomponent must satisfy two conditions (a) the number ofpoles and zeros is either equal to each other or differs at mostby one (b) the upper and lower envelopes must be locallysymmetric about the timeline The basic principle of EMDmethod is to decompose the original signal 119909(119905) into the formas shown in (7) by continuously eliminating the mean of theupper and lower envelope connected with the minimum andmaximum of the signal [16] Consider
119909119905
=
119899
sum
119894=1
imf119894(119905)
+ 119903119899(119905)
(7)
where 119909119905is the vibration signal imf
119894(119905)is the IMF component
including different frequency bands ranging fromhigh to low
Mathematical Problems in Engineering 3
0 0002 0004 0006 0008 001
01
Signals (V)
0 0002 0004 0006 0008 001
02
0 0002 0004 0006 0008 0010
05
0 0002 0004 0006 0008 001
05
Time (s)
s(t)
s1(t)
s2(t)
s3(t)
minus1
minus2
minus5
Figure 1 Signal waveforms
and 119903119899(119905)
is the residue of the decomposition process which isthe mean trend of 119909
119905
The EMD method is a kind of adaptive local analysismethod with each IMF highlighting the local features ofthe data However EMD decomposition results often sufferfrom mode mixing which is defined as either a single IMFconsisting of widely disparate scales or a signal residing indifferent IMF components [17] To make it clear a simulatedsignal 119904(119905) consists of a Gaussian-type impulse interference1199041(119905) and a cosine component with 500Hz frequency 119904
2(119905)
and a trend term 1199043(119905) is used as an example The equation of
the simulated signal is expressed as
119904 (119905) = sin (2120587120572119905) 119890minus((119905minus1199050)
2120590)
+ cos (2120587120573119905) + 50119905 (8)
where 120572 = 3000 120573 = 500 and 120590 = 106
Thewaveformof the simulated signal is shown in Figure 1and the corresponding EMD results for the signal 119904(119905) areshown in Figure 2 where the mode mixing happens
To overcome the problem of mode mixing the ensembleempirical mode decomposition (EEMD) was proposed [18]where Gaussian white noises with finite amplitude are addedto the original signal during the entire decomposition pro-cess Due to the uniform distribution statistical characteris-tics of the white noise the signal with white noise becomescontinuous in different time scales and no missing scales arepresent As a result mode mixing is effectively eliminated bythe EEMD process [18] The EEMD decomposition result ofsignal 119904(119905) is shown in Figure 3 where the added white noiseamplitude is 025 times the original signal standard deviationand the number of decompositions is 200 times
It should be noted that during the EEMD process eachindividual trial may produce noisy results but the effectof the added noise can be suppressed by large numberof ensemble mean computations This would be too timeconsuming to implement An improved algorithm namedcomplementary ensemble mode decomposition (CEEMD)
0 0002 0004 0006 0008 001
0
1
IMF1
Signals (V)
0 0002 0004 0006 0008 001
0
5
IMF2
0 0002 0004 0006 0008 001
0
5
IMF3
0 0002 0004 0006 0008 001
0
1
IMF4
Time (s)
minus1
minus1
minus5
minus5
Figure 2 The decomposition result by EMD
0 0002 0004 0006 0008 001
0
1
IMF1
Signals (V)
0 0002 0004 0006 0008 001
0
02
IMF2
0 0002 0004 0006 0008 001
0
01
IMF3
0 0002 0004 0006 0008 001
0
2
IMF4
Time (s)
minus1
minus02
minus01
minus2
Figure 3 The decomposition result by EEMD
is suggested to improve the computation efficiency In thisalgorithm the residue of the added white noises can beextracted from themixtures of data and white noises via pairsof complementary ensemble IMFs with positive and negativeadded white noises Although this new approach yields IMFwith a similar RMSnoise to EEMD it eliminates residue noisein the IMFs and overcomes the problem ofmodemixing withmuch more efficiency [14] The procedure on implementingCEEMD is shown below
(a) 1199091and 1199092are constructed by adding a pair of opposite
phase Gaussian white noises 119909119899with the same ampli-
tude Then 1199091
= 119909 + 119909119899and 119909
2= 119909 minus 119909
119899
4 Mathematical Problems in Engineering
(b) 1199091and 119909
2are decomposed by EMD only a few times
and IMF1199091
and IMF1199092
are ensemble means of thecorresponding IMF generated from each trial
(c) the average of corresponding component in IMF1199091
and IMF1199092
is calculated as the CEEMD decomposi-tion results that is
IMF =
(IMF1199091
+ IMF1199092
)
2
(9)
The flow chart of CEEMD is shown in Figure 4 where 119899 is thedecomposition trials
Figure 5 is the decomposition result by CEEMD for thesignal 119904(119905) As compared to the result shown in Figure 3the decomposition accuracies of EEMD and CEEMD areconsistent while EEMD takes 162 s and CEEMD only needs013 s
23 Fault Diagnosis Based on CEEMD and Time Series ModelBased on CEEMD and time series model a hybrid faultdiagnosis approach can be designed The hybrid approachcombines the advantages of CEEMD method in the non-stationary signal decomposition with the ability of timeseries modeling in feature extraction The flow chart of thedeveloped approach is shown in Figure 6
The main steps are as follows
Step 1 The rolling bearing vibration signal is sampled andthen decomposed by CEEMD with the process shown inFigure 4
Step 2 The product of energy density and average periodof the IMFs which is a constant value according to [19] iscalculated using (10) and parameter 119877119875
119895is calculated using
(11) Then the signal is filtered by comparing the parameter119877119875119895and the given threshold value that is to say when 119877119875
119895⩾
1 the previous 119895 minus 1 IMFs with the trend term need to beremoved as noise and to rebuild the residual IMFs as filteredsignal [19 20]
119875119895
= 119864119895
times 119879119895 (10)
119877119875119895
=
10038161003816100381610038161003816100381610038161003816100381610038161003816
119875119895
minus ((1 (119895 minus 1)) sum119895minus1
119894=1119875119895)
(1 (119895 minus 1)) sum119895minus1
119894=1119875119895
10038161003816100381610038161003816100381610038161003816100381610038161003816
(119895 ge 2) (11)
where 119864119895
= (1119873) sum119873
119894=1[119860119895(119894)]2 is the energy density of the
119895th IMF 119879119895
= 2119873119874119895is the average period of the 119895th IMF 119873
is the length of each IMF 119860119895is the amplitude of the 119895th IMF
and 119874119895is the total number of extreme points of 119895th IMF
Step 3 Equation (12) is used to calculate the correlationcoefficient between the filtered signal and each IMF and theIMFwhich is closely correlated to the filtered signal is selectedfor AR modeling [21]
120588119909119910
=
sum119873
119896=1119909 (119896) 119910 (119896)
[sum119873
119896=1119909(119896)2
sum119873
119896=1119910(119896)2]
12 (12)
Input signal
Add two reverse white noises
final IMFs of CEEMD
Calculate IMFs with EMD
Calculate the means of above two IMFs
No
Yes
M = n
Calculate (IMF1+ IMF2)2 as the
Figure 4 Decomposition flow chart of CEEMD
0 0002 0004 0006 0008 001
0
1
IMF1
Signals (V)
0 0002 0004 0006 0008 001
0
05
IMF2
0 0002 0004 0006 0008 001
0
02
IMF3
0 0002 0004 0006 0008 001
0
2
IMF4
Time (s)
minus1
minus05
minus02
minus2
Figure 5 The decomposition result by CEEMD
Step 4 The least square method is used to estimate theparameters vectors of theARmodel established in Step 3 andthe parameters vectors are considered as the model featurevector
Step 5 After scalar quantization by index calculation formulaof Lloyds algorithm in (13) [22] the feature vector is used totrain the HMM of each bearing working condition
indx (119909) =
1 119909 le partition (119894)
119894 + 1 partition (119894) lt 119909 le partition (119894 + 1)
119873 partition (119873 minus 1) lt 119909
(13)
Mathematical Problems in Engineering 5
HMM1
HMM training
HMM2 Comparisonprobability
Classification result
Vectorsquantization
Vibration signals
Signal decomposed by CEEMD
Calculate correlation coefficient
Feature vectors
IMF selected for modeling
Model parameter estimation
Feature vectors extracted
Signal filtered
Calculate parameter RP
Feature vectors extraction Fault diagnosis classification
Sample feature vectors
HMMn
Figure 6 The flow chart of the proposed method
where 119873 is the length of the codebook vector partition (119894)is the partition vector with the length of 119873 minus 1 and 119909 is thefeature vector for scalar quantization
Step 6 A test vibration signal can then be acquired fordiagnosis and themodel feature vector is first extractedAfterscalar quantization the feature vector is put into the well-trained HMMs and the corresponding HMM which has themaximum probability is regarded as the classification result[23]
3 Evaluation of the Method Based onCEEMD and AR Model
31 Evaluation Using Simulated Signals To demonstrate thevalidity of the method proposed in this study three signals1199091(119905) 1199092(119905) and 119909
3(119905) are simulated as shown in Figure 7The
signal 1199091(119905) consists of a Gaussian-type impulse interference
a cosine component with 10Hz frequency a trend term andwhite noise The signal 119909
2(119905) consists of a Gaussian-type
impulse interference a square wave with 65 duty ratio atrend term and white noise The signal 119909
3(119905) consists of a
Gaussian-type impulse interference a sawtooth wave with15Hz frequency a trend term and white noise
Figure 8 shows the results of the CEEMD of signals 1199091(119905)
1199092(119905) and 119909
3(119905) Correlation coefficients between filtered
signal and each IMF are illustrated in Table 1
0 02 04 06 08 1
0 02 04 06 08 1
0 02 04 06 08 1
0
4Signals (V)
0
4
0
4
Time (s)
x1(t)
x2(t)
x3(t)
minus4
minus4
minus4
Figure 7 Signal waveforms of 1199091(119905) 1199092(119905) and 119909
3(119905)
It can be seen in Table 1 that the IMF which is closelycorrelated to the filtered signal is IMF5 for both signal1199091(119905) and signal 119909
3(119905) and IMF6 for signal 119909
2(119905) They are
used to construct the AR models and the correspondingfeature vectors are estimated as shown in Table 2 After scalarquantization the feature vectors are used to train the HMMfor signal classification
6 Mathematical Problems in Engineering
02
IMF1
Signals (V)
01
IMF2
005
IMF3
01
IMF4
02
IMF5
002
IMF6
001
IMF7
00204
Res
Time (s)
0 02 04 06 08 1
0 02 04 06 08 1
0 02 04 06 08 1
0 02 04 06 08 1
0 02 04 06 08 1
0 02 04 06 08 1
0 02 04 06 08 1
0 02 04 06 08 1
minus2
minus1
minus05
minus1
minus2
minus01
minus02
(a) 1199091(119905)
0 02 04 06 08 1
0 02 04 06 08 1
0 02 04 06 08 1
0 02 04 06 08 1
0 02 04 06 08 1
0 02 04 06 08 1
0 02 04 06 08 1
0 02 04 06 08 1
02
IMF1
Signals (V)
01
IMF2
01
IMF3
01
IMF4
01
IMF5
05
IMF6
01
IMF7
005
1
Res
Time (s)
minus2
minus1
minus1
minus1
minus1
minus5
minus1
(b) 1199092(119905)
0 02 04 06 08 1
0 02 04 06 08 1
0 02 04 06 08 1
0 02 04 06 08 1
0 02 04 06 08 1
0 02 04 06 08 1
0 02 04 06 08 1
0 02 04 06 08 1
02
IMF1
Signals (V)
01
IMF2
01
IMF3
01
IMF4
01
IMF5
002
IMF6
001
IMF7
002
Res
Time (s)
minus2
minus1
minus1
minus1
minus1
minus02
minus01
minus02
(c) 1199093(119905)
Figure 8 The decomposition results by CEEMD
Mathematical Problems in Engineering 7
Table 1 Correlation coefficients between filtered signal and each IMF
Signal Correlation coefficientIMF1 IMF2 IMF3 IMF4 IMF5 IMF6 IMF7 IMF8
1199091(119905) minus00031 minus00009 00371 04096 09668 02428 01273 minus00448
1199092(119905) 00051 00004 00435 02111 04695 08887 07214 minus00201
1199093(119905) minus00234 minus00154 00286 05900 08953 01649 01887 minus00210
Table 2 Model parameter estimation results
Signal Model parameter1205931
1205932
1205933
1205934
1205935
1205936
1199091(119905) 47183 minus91103 92034 minus51408 15207 minus01914
1199092(119905) 48894 minus98269 103945 minus61194 19153 minus02531
1199093(119905) 48718 minus99955 111616 minus72529 26430 minus04282
Table 3 Signal classification results
Signal type Test sample Classification results Classification rate [] Overall classificationrate []
1199091(119905) 119909
2(119905) 119909
3(119905)
1199091(119905) 20 19 1 0 95
9671199092(119905) 20 0 19 1 95
1199093(119905) 20 0 0 20 100
A total of 90 feature vectors were collected from threegroups of signals using the proposed approach One-third ofthe feature vectors in each condition were used for trainingthe classifier and others were used for testing The results ofthe signal classification are listed in Table 3
Results in Table 3 indicate that the presented methodbased on CEEMD and time series modeling can effectivelyidentify different signals and the overall classification rate is967 For the purpose of comparison the signal classifica-tion rates use themethod based on time seriesmodeling onlyand the method based on EMD and time series modelingis also calculated 883 and 933 classification rates areobtained respectively It is obvious that efficiency of the signalclassification method proposed in this paper is improved to acertain extent
32 Evaluation Using Experimental Data In order to illus-trate the practicability and effectiveness of the proposedmethod a bearing fault data set from the electrical engi-neering laboratory of Case Western Reserve University isanalyzed [24] The data set is acquired from the test standshown in Figure 9 where it consists of a 2 hp motor atorque transducer a dynamometer and control electronicsThe test bearings support the motor shaft which is the deepgroove ball bearings with the type of 6205-2RS JEMSKFVibration data was collected at 12000 samples per secondusing accelerometers which are attached to the housing withmagnetic bases The motor load level was controlled by thefan in the right side of Figure 9
2 hp motor Torque
transducerDynamometer
Figure 9 Bearing test stand
Figure 10 illustrates representative waveforms of the sam-ple vibration signals measured from the test bearings underfour initial conditions (a) signal from a healthy bearing (b)signal from a bearing with inner ring defect (c) signal froma bearing with rolling element defect and (d) signal from abearing with outer ring defect These signals were measuredunder 0 hpmotor load with themotor speed of 1797 rpmThedecomposed IMFs of these signals are shown in Figure 11
Correlation coefficients calculated between the filteredsignal and each IMF are shown in Table 4
The IMF which is closely correlated to the filtered signalis IMF2 for signal (a) and IMF1 for signals (b) (c) and (d)respectivelyThese IMFs are used for ARmodel constructionThe model order estimation curves of the four conditionsbased on the principle of FPE criterion are shown in Figure 12We can see that when the model order is 6 each modelrsquos
8 Mathematical Problems in Engineering
0 005 01 015 02 025
0
05
minus05
Signals (V)
(a)
0 005 01 015 02 025
0
2
minus2
(b)
0 005 01 015 02 025
0
1
minus1
(c)
0 005 01 015 02 025
0
5
Time (s)
minus5
(d)
Figure 10 Vibration signal waveforms of different conditions
Table 4 Correlation coefficients between filtered signals and each IMF
Signal Correlation coefficientIMF1 IMF2 IMF3 IMF4 IMF5 IMF6 IMF7 IMF8
(a) 04135 07538 04381 04880 04356 01792 00971 minus00056(b) 08794 04275 02583 01337 00421 00285 minus00009 minus00074(c) 09509 02180 02325 01337 00821 00350 minus00017 00009(d) 09878 01267 00636 00509 00136 00060 minus00008 minus00068
Table 5 Model parameter estimation results
Signal Model parameter1205931 1205932 1205933 1205934 1205935 1205936
(a) 31280 minus47797 42245 minus21489 04241 00356(b) 02084 minus13585 05142 minus06356 03471 minus00422(c) 01335 minus16472 03941 minus08473 02142 minus01011(d) minus01172 minus12159 01178 minus01283 01467 02533
residual tends to be stable Therefore the model order isselected as 6 and the results of parameters estimation arelisted in Table 5
The parameters in Table 5 were quantified by Lloydsalgorithm in (12) as feature vectors for training the HMMs ofdifferent conditions The results of quantization are revealedin Figure 13
A total of 160 feature vectors were collected from thefour conditions half of the feature vectors were used fortraining the classifier and others for signal classification andthe classification results are listed in Table 6 Out of 80 testfeature vectors just two cases were not correctly classifiedand the overall classification rate is 975
For comparison Tables 7 and 8 list classification resultsbased on time series modeling usingmeasured signal directlyand based on EMD and time series model method From
the comparison results the proposed method is efficient forrolling bearing fault diagnosis and the overall classificationrate of the proposedmethod is higher to a certain extent thanthe other two methods mentioned above
4 Conclusions
Aiming at diagnosing rolling bearing faults a hybrid ap-proach based on CEEMD and time series modeling is pro-posed in this paperThe CEEMDmethod can decompose thenonstationary signal into a series of IMFs with low compu-tation AR model is an effective approach to extract thefault feature of the vibration signals and the fault patterncan be identified directly by the extracted fault featureswithout establishing the mathematical model and studying
Mathematical Problems in Engineering 9
0 005 01 015 02 025
0 005 01 015 02 025
0 005 01 015 02 025
0 005 01 015 02 025
0 005 01 015 02 025
0 005 01 015 02 025
0 005 01 015 02 025
0 005 01 015 02 025
002
IMF1
Signals (V)
002
IMF2
0005
IMF3
001
IMF4
001
IMF5
0005
IMF6
0002
IMF7
0002004
Res
Time (s)
minus02
minus02
minus005
minus01
minus01
minus005
minus002
(a) No defect
0 005 01 015 02 025
0 005 01 015 02 025
0 005 01 015 02 025
0 005 01 015 02 025
0 005 01 015 02 025
0 005 01 015 02 025
0 005 01 015 02 025
0 005 01 015 02 025
02
IMF1
Signals (V)
01
IMF2
002
IMF3
002
IMF4
0005
IMF5
0002
IMF6
0001
IMF7
0002004
Res
Time (s)
minus1
minus2
minus02
minus02
minus005
minus002
minus001
(b) Inner ring defect
005
IMF1
Signals (V)
001
IMF2
001
IMF3
0005
IMF4
0005
IMF5
0001
IMF6
05
IMF7
0002004
Res
Time (s)
0 005 01 015 02 025
0 005 01 015 02 025
0 005 01 015 02 025
0 005 01 015 02 025
0 005 01 015 02 025
0 005 01 015 02 025
0 005 01 015 02 025
0 005 01 015 02 025
minus05
minus01
minus01
minus005
minus005
minus001
minus5
times10minus3
(c) Rolling element defect
05
IMF1
Signals (V)
005
IMF2
002
IMF3
002
IMF4
0005
IMF5
0005
IMF6
0005
IMF7
002004006
Res
Time (s)
0 005 01 015 02 025
0 005 01 015 02 025
0 005 01 015 02 025
0 005 01 015 02 025
0 005 01 015 02 025
0 005 01 015 02 025
0 005 01 015 02 025
0 005 01 015 02 025
minus5
minus05
minus02
minus02
minus005
minus005
minus005
(d) Outer ring defect
Figure 11 The decomposition results by CEEMD under different conditions
10 Mathematical Problems in Engineering
0 5 10 15 20 25 300
1
2
3
4
5
6
Model order
Mod
el re
sidua
l
DeltaFPE
times10minus4
(a) No defect
0 5 10 15 20 25 300
001
002
003
004
005
006
007
Model order
Mod
el re
sidua
l
DeltaFPE
(b) Inner ring defect
0 5 10 15 20 25 300
0005
001
0015
002
Model order
Mod
el re
sidua
l
DeltaFPE
(c) Rolling element defect
0 5 10 15 20 25 300
01
02
03
04
05
Model order
Mod
el re
sidua
l
DeltaFPE
(d) Outer ring defect
Figure 12 The model order estimation curves
Table 6 Fault diagnosis using CEEMD and time series model
Fault type Test sample Classification results Classification rate [] Overall classificationrate []
Nodefect
Innerringdefect
Rollingelementdefect
Outerringdefect
No defect 20 20 0 0 0 100
975Inner ringdefect 20 0 19 1 0 95
Rolling elementdefect 20 0 1 19 0 95
Outer ringdefect 20 0 0 0 20 100
Mathematical Problems in Engineering 11
1 2 3 4 5 6
0
5
Am
plitu
de
1 2 3 4 5 60
10
20
Am
plitu
de
Parameter
minus5
(a) No defect
1 2 3 4 5 6
0
1
Am
plitu
de
1 2 3 4 5 60
10
20
Am
plitu
de
Parameter
minus1
(b) Inner ring defect
1 2 3 4 5 6
0
Am
plitu
de
1 2 3 4 5 60
10
20
Am
plitu
de
Parameter
minus1
minus2
(c) Rolling element defect
1 2 3 4 5 6
0
05A
mpl
itude
1 2 3 4 5 60
10
20
Am
plitu
de
Parameter
minus05
minus1
minus15
(d) Outer ring defect
Figure 13 The results of quantization
Table 7 Fault diagnosis using time series model only
Fault type Test sample Classification results Classification rate [] Overall classificationrate []
Nodefect
Innerringdefect
Rollingelementdefect
Outerringdefect
No defect 20 19 1 0 0 95
900Inner ringdefect 20 1 17 2 0 85
Rolling elementdefect 20 0 2 17 1 85
Outer ringdefect 20 0 0 1 19 95
12 Mathematical Problems in Engineering
Table 8 Fault diagnosis using EMD and time series model
Fault type Test sample Classification results Classification rate [] Overall classificationrate []
Nodefect
Innerringdefect
Rollingelementdefect
Outerringdefect
No defect 20 19 1 0 0 95
9375Inner ringdefect 20 0 18 2 0 90
Rolling elementdefect 20 0 1 19 0 95
Outer ringdefect 20 0 0 1 19 95
the fault mechanism of the system In this paper the CEEMDmethod is used as a pretreatment which can increase theaccuracy of the AR model for the measured signal andthe AR model of the IMF which is closely correlated tothe filtered signal is established to extract the fault featureparameters Comparing to the EMD-AR approach and thedirect modeling approach where raw signals are directlyused as input for AR modeling a higher classification ratewas shown to be achieved by using the new approach (eg967 for simulated signals and 975 for experimental data)Meanwhile we anticipate that the proposed method can alsobe used for incipient fault diagnosis in rolling bearing wherefurther experiments are needed to verify the accuracy Sincethe approach presented in this study is generic in nature itcan be readily adapted to a broad range of applications formachine fault diagnosis
Conflict of Interests
The authors declare that there is no conflict of interestsregarding the publication of this paper
Acknowledgments
This work has been supported in part by the National NaturalScience Foundation of China (no 61101163 and no 51175080)and the Nature Science Foundation of Jiangsu Province ofChina (no BK2012739)
References
[1] B Li P L Zhang ZWang SMi andD Liu ldquoAweightedmulti-scale morphological gradient filter for rolling element bearingfault detectionrdquo ISA Transactions vol 50 no 4 pp 599ndash6082011
[2] R Yan and R X Gao ldquoWavelet domain principal feature anal-ysis for spindle health diagnosisrdquo Structural Health Monitoringvol 10 no 6 pp 631ndash642 2011
[3] C Junsheng Y Dejie and Y Yu ldquoA fault diagnosis approachfor roller bearings based on EMD method and AR modelrdquoMechanical Systems and Signal Processing vol 20 no 2 pp 350ndash362 2006
[4] J L Wang and G Wang ldquoGear box fault diagnosis based onsystemmodelrdquoMechanical EngineeringampAutomation no 1 pp118ndash119 2012
[5] D J Yu M F Chen J S Cheng and Y Y Yang ldquoFault diagnosisapproach for rotor systems based on AR model and supportvector machinerdquo System Engineering Theory amp Practice vol 27no 5 pp 152ndash157 2007
[6] X J Zeng and Y J Huang ldquoFault diagnosis based on ARmodel and support vector machinerdquo Mechanical Science andTechnology for Aerospace Engineering vol 29 no 7 pp 972ndash9752010
[7] H Ding Y Wu and S Z Yang Fault Diagnosis by TimeSeries Analysis Applied Time Series Analysis World ScientificPublishing Singapore 1989
[8] Z M Yang and A D Yin ldquoFault recognition of vehicle trans-mission gear based on time series analysis and fuzzy clusterrdquoTransactions of the Chinese Society for Agricultural Machineryvol 35 no 2 pp 129ndash133 2004
[9] D C Baillie and J Mathew ldquoA comparison of autoregressivemodeling techniques for fault diagnosis of rolling elementbearingsrdquoMechanical Systems and Signal Processing vol 10 no1 pp 1ndash17 1996
[10] X M Liu J Qiu and G J Liu ldquoA diagnosis model based onAR-continuous HMM and its applicationrdquo Mechanical Scienceand Technology vol 24 no 3 pp 350ndash352 2005
[11] N E Huang Z Shen S R Long et al ldquoThe empirical modedecomposition and the Hilbert spectrum for nonlinear andnon-stationary time series analysisrdquo Proceedings of the RoyalSociety of A Mathematical Physical amp Engineering Sciences vol454 no 1971 pp 903ndash995 1998
[12] N E Huang Z Shen and S R Long ldquoA new view of nonlinearwater waves the Hilbert spectrumrdquo Annual Review of FluidMechanics vol 31 no 1 pp 417ndash457 1999
[13] Z H Wu and N E Huang ldquoEnsemble empirical mode decom-position a noise-assisted data analysis methodrdquo Advances inAdaptive Data Analysis vol 1 no 1 pp 1ndash41 2009
[14] J Yeh J Shieh and N E Huang ldquoComplementary ensembleempirical mode decomposition a novel noise enhanced dataanalysis methodrdquo Advances in Adaptive Data Analysis vol 2no 2 pp 135ndash156 2010
[15] C Liu X Zhou S Yang W Liang and Q Miao ldquoCoolingfan bearing diagnosis based on ARamp MEDrdquo in Proceedingsof the International Conference on Quality Reliability RiskMaintenance and Safety Engineering (ICQR2MSE rsquo12) pp 622ndash626 Chengdu China June 2012
Mathematical Problems in Engineering 13
[16] W C Chen and F Liu ldquoHybrid process data denoising methodbased on EEMDrdquo Application Research of Computer vol 29 no4 pp 1368ndash1370 2012
[17] J M Lu and F L Meng ldquoRolling bearing fault diagnosis withhilbert spectrum based on EEMDrdquo in Proceedings of the 4thInternational Conference on Signal Processing Systems pp 118ndash122 Kuala Lumpur Malaysia December 2012
[18] J Zhang R Q Yan R X Gao and Z Feng ldquoPerformanceenhancement of ensemble empirical mode decompositionrdquoMechanical Systems and Signal Processing vol 24 no 7 pp2104ndash2123 2010
[19] Z H Wu and N E Huang ldquoA study of the characteristics ofwhite noise using the empirical mode decomposition methodrdquoProceedings of the Royal Society A Mathematical Physical andEngineering Sciences vol 460 no 2046 pp 1597ndash1611 2004
[20] R X Chen B P Tang and J H Ma ldquoAdaptive de-noisingmethod based on ensemble empirical mode decomposition forvibration signalrdquo Journal of Vibration and Shock vol 31 no 15pp 82ndash86 2012
[21] N Rong H Song R Liu X J Peng and K Xu ldquoTrackingcoherence for inter-area oscillation using masking signal EMDand correlation analysisrdquo in Proceedings of the 11th IEEE Inter-national Conference on Electronic Measurement amp Instrumentspp 58ndash63 Harbin China August 2013
[22] L LWinger ldquoLinearly constrained generalized Lloyd algorithmfor reduced codebook vector quantizationrdquo IEEE Transactionson Signal Processing vol 49 no 7 pp 1501ndash1509 2001
[23] P Baruah and R B Chinnam ldquoHMMs for diagnostics andprognostics in machining processesrdquo International Journal ofProduction Research vol 43 no 6 pp 1275ndash1293 2005
[24] httpcsegroupscaseedubearingdatacenter
Submit your manuscripts athttpwwwhindawicom
Hindawi Publishing Corporationhttpwwwhindawicom Volume 2014
MathematicsJournal of
Hindawi Publishing Corporationhttpwwwhindawicom Volume 2014
Mathematical Problems in Engineering
Hindawi Publishing Corporationhttpwwwhindawicom
Differential EquationsInternational Journal of
Volume 2014
Applied MathematicsJournal of
Hindawi Publishing Corporationhttpwwwhindawicom Volume 2014
Probability and StatisticsHindawi Publishing Corporationhttpwwwhindawicom Volume 2014
Journal of
Hindawi Publishing Corporationhttpwwwhindawicom Volume 2014
Mathematical PhysicsAdvances in
Complex AnalysisJournal of
Hindawi Publishing Corporationhttpwwwhindawicom Volume 2014
OptimizationJournal of
Hindawi Publishing Corporationhttpwwwhindawicom Volume 2014
CombinatoricsHindawi Publishing Corporationhttpwwwhindawicom Volume 2014
International Journal of
Hindawi Publishing Corporationhttpwwwhindawicom Volume 2014
Operations ResearchAdvances in
Journal of
Hindawi Publishing Corporationhttpwwwhindawicom Volume 2014
Function Spaces
Abstract and Applied AnalysisHindawi Publishing Corporationhttpwwwhindawicom Volume 2014
International Journal of Mathematics and Mathematical Sciences
Hindawi Publishing Corporationhttpwwwhindawicom Volume 2014
The Scientific World JournalHindawi Publishing Corporation httpwwwhindawicom Volume 2014
Hindawi Publishing Corporationhttpwwwhindawicom Volume 2014
Algebra
Discrete Dynamics in Nature and Society
Hindawi Publishing Corporationhttpwwwhindawicom Volume 2014
Hindawi Publishing Corporationhttpwwwhindawicom Volume 2014
Decision SciencesAdvances in
Discrete MathematicsJournal of
Hindawi Publishing Corporationhttpwwwhindawicom
Volume 2014 Hindawi Publishing Corporationhttpwwwhindawicom Volume 2014
Stochastic AnalysisInternational Journal of
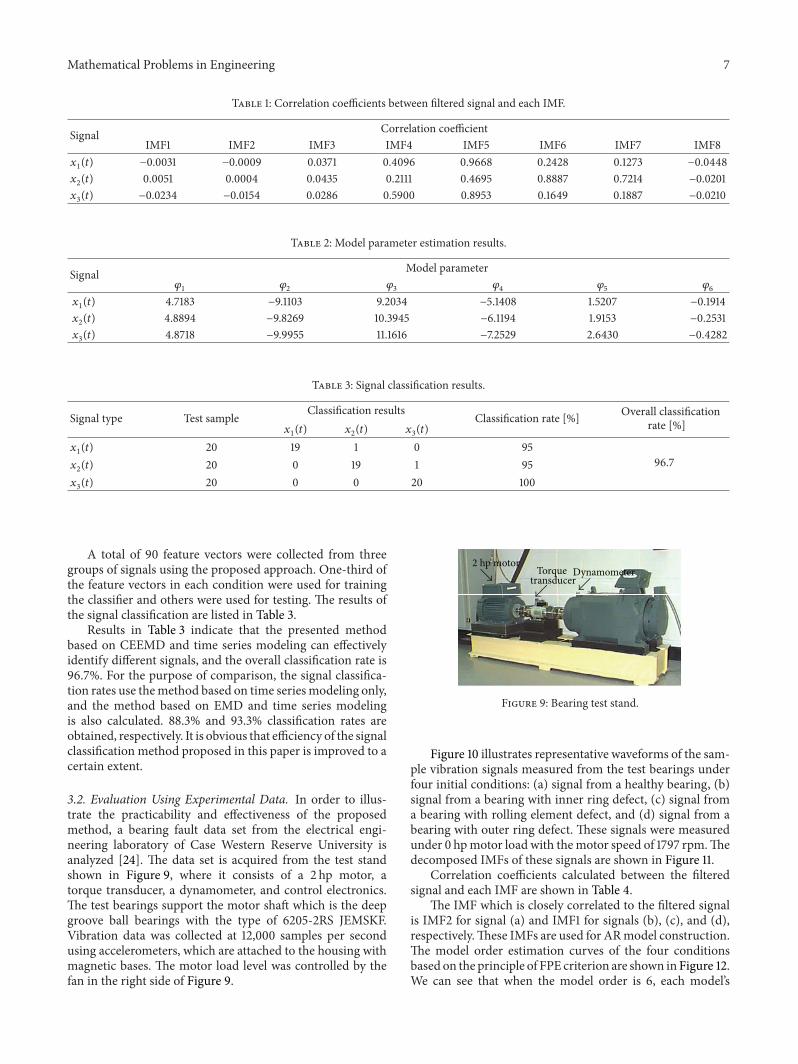