research article simultaneous quantification of...
TRANSCRIPT

Research ArticleSimultaneous Quantification of Dexpanthenol and Resorcinolfrom Hair Care Formulation Using Liquid Chromatography:Method Development and Validation
Amit Kumar De, Partha Pratim Chowdhury, and Shyamaprasad Chattapadhyay
R&D Division, Dey’s Medical Stores (Mfg.) Ltd., 62 Bondel Road, Kolkata, West Bengal 700019, India
Correspondence should be addressed to Amit Kumar De; [email protected]
Received 29 June 2015; Accepted 31 January 2016
Academic Editor: Christoph Gabler
Copyright © 2016 Amit Kumar De et al.This is an open access article distributed under theCreativeCommonsAttribution License,which permits unrestricted use, distribution, and reproduction in any medium, provided the original work is properly cited.
The current study presents the simultaneous quantification of dexpanthenol and resorcinol from marketed hair care formulation.Dexpanthenol is often present as an active ingredient in personal care products for its beautifying and invigorating properties andrestorative and smoothing properties. On the other hand resorcinol is mainly prescribed for the treatment of seborrheic dermatitisof scalp. The toxic side effects of resorcinol limit its use in dermatological preparations. Therefore an accurate quantificationtechnique for the simultaneous estimation of these two components can be helpful for the formulation industries for the accurateanalysis of their product quality. In the current study a high performance liquid chromatographic technique has been developedusing a C18 column and a mobile phase consisting of phosphate buffer of pH = 2.8 following a gradient elution. The mobile phaseflow rate was 0.6mL perminute and the detectionwavelength was 210 nm for dexpanthenol and 280 nm for resorcinol.The linearitystudy was carried out using five solutions having concentrations ranging between 10.34𝜇g⋅mL−1 and 82.69 𝜇g⋅mL−1 (𝑟2 = 0.999) forresorcinol and 10.44 𝜇g⋅mL−1 and 83.50 𝜇g⋅mL−1 (𝑟2 = 0.998) for dexpanthenol. The method has been validated as per ICH Q2(R1)guidelines. The ease of single step sample preparation, accuracy, and precision (intraday and interday) study presents the methodsuitable for the simultaneous quantification of dexpanthenol and resorcinol from any personal care product and dermatologicalpreparations containing these two ingredients.
1. Introduction
Dexpanthenol (DP) [D-panthenol or Provitamin B5] isthe alcoholic analogue of D-pantothenic acid. Chemi-cally it is 2,4-dihydroxy-N-(3-hydroxypropyl)-3,3-dimethyl-1-butanamide commonly present as an active ingredient ina number of Vitamin B-complex supplements and cosmetics(creams, ointments, lotions, etc.) for its beautifying and invig-orating properties and restorative and smoothing properties[1–4]. DP is absorbed through the skin and gets convertedinto its active form, pantothenic acid (Vitamin B5), theprecursor for the biosynthesis of coenzyme A. The acid formplays an important role in Krebs Cycle [4]. Pantothenic acidis also considered as “antistress vitamins” as its deficiencymay result in different types of diseases like irritation of skin,dermatitis, depigmentation of the hair, and stunned growth[3, 5, 6]. In dermatological preparations it is usually given
in strengths of 2 to 5%. Due to its restorative, smoothingproperties and antidermatitis and depigmentation propertiesit is often used in hair care products [7] and some vitaminformulations.
The next candidate under our study is resorcinol (RC)or benzene-1,3-diol. It has got a number of pharmaceuticalapplications like treatment of acaine, seborrheic dermatitis,eczema, psoriasis, and other skin disorders. It is also usedin hair coloring agents. However, this molecule has got anumber of side effects on long term use or in large dosage[8, 9]. Research shows that a long term use of RC leadsto reversible effects on human thyroid gland resulting inhypothyroidism [10, 11]. Therefore an exact method forthe quantification of RC from formulations prescribed formedicinal and cosmetic use is essential.
Several cosmetic and pharmaceutical preparations con-tain both RC and DP either in form of excipients or as active
Hindawi Publishing CorporationScientificaVolume 2016, Article ID 1537952, 8 pageshttp://dx.doi.org/10.1155/2016/1537952
2 Scientifica
components and very few methods have been reported fortheir quantification from such formulations. Again most ofthe reported techniques present methods for either RC orDP. Most of the methods described for the quantificationof RC are spectrophotometric techniques [12, 13] and veryfew reported chromatographic techniques [14–17]. In anotherstudy conducted in our laboratory we developed a techniquefor the quantification of RC only from a marketed hair careproduct using an isocratic elution technique using liquidchromatography [18]. This method is however not suitablefor the quantification of DP from such formulation whichinspired us for the development of this newer technique.For DP only a single validated supercritical fluid chro-matographic method has been reported [19]. The methoddescribes the quantification of the active D-form in a racemicmixture of D and L forms of panthenol from cosmetic for-mulation using a mass spectroscopic detector. In the currentstudy a simple, rapid, precise, and validated technique for thesimultaneous quantification of both DP and RC from a mar-keted hair care product, in presence of a complexmatrix com-prising glycerin, ethanol, biotin, keratin hydrolysate, hyalkylHBU, nicotinic acid, and polyvinylpyrrolidone, is presented.
2. Material and Methods
Dexpanthenol (DP) standard (purity 99.65%) and resorcinol(RC) standard (purity 99.98%) were purchased from SigmaAldrich India Ltd. Hair care formulation containing DP andRCwith batch numberHV1124,manufacturing date February2015, and expiry date July 2017 was used as a representativemarketed formulation for study. Solvents of chromatographygrade were purchased from Spectrochem India Limited.A C18 column 100mm in length and 4.0mm in internaldiameter was purchased from Waters Limited (Waters MA,USA). All reagents used in analysis were purchased fromMerck India Limited.
2.1. Equipment and Chromatographic Conditions. A WatersAlliance SeparationModule (Waters, USA) quaternary gradi-ent system andWaters 2489 dual lambda absorbance detectorwere used for the quantification purpose. The analysis wascarried out using Empower 3 software (Waters, USA). Areverse phase Waters C18 column (Waters, USA) of 100mmlength, 4.0mm internal diameter, 5 𝜇m particle size, and agradient elution flow rate of 0.6mL/minwas used for analysis.The mobile phase was a combination of filtered and degassed5.4mM phosphate buffer (pH = 2.8) and acetonitrile (ACN)in proportions as presented in Table 1.
The analysis was carried out at ambient temperature andthe injection volume was 20𝜇L. The detection wavelengthwas 210 nm for DP and 280 nm for RC. Prior to chro-matographic separation both the standard and the samplesolutions were filtered through 0.2 𝜇m membrane filter (PallLife science, India).
2.2. Preparation of Standard Solutions and Sample Solutions
2.2.1. Standard Solution. The RC and DP stock solutionswere prepared by dissolving 51.68mg of RC (solution A)
Table 1: Gradient elution composition.
Time(mins)
Flowrate
Solvent A(buffer pH = 2.8)
Solvent B(ACN)
0 0.6 90 108 0.6 90 1018 0.6 10 9019 0.6 90 1028 0.6 90 10
and 52.19mg of DP (solution B) in 100mL of diluents (90%buffer and 10% acetonitrile) in two separate clean and dryvolumetric flasks using ultrasound. Solution A was dilutedto the range 10.34 𝜇g⋅mL−1 to 82.69 𝜇g⋅mL−1 and solutionB 10.44 𝜇g⋅mL−1 to 83.50 𝜇g⋅mL−1 using the diluents foranalysis (Table 1). Peak area versus concentration curve wasprepared (Figure 1(a) for RC and Figure 1(b) for DP) andwas used for the determination of linearity of the methodand the same was used for the quantification purpose. Theresults were presented in Table 2(a and b) for RC andDP, respectively. The curve fitting purpose was carried outfollowing the least square method.
2.2.2. Sample Solution. Preparation of sample solutionwas critical when a number of interfering substanceswere present within the matrix like glycerin, ethanol,biotin, keratin hydrolysate, hyalkyl HBU, nicotinic acid, andpolyvinylpyrrolidone. However in our study, the methodhas been optimized following a simple single step samplepreparation technique which was very much suitable for theregular analysis. 2mL of the formulation was pipetted outaccurately and transferred into a clean and dry volumetricflask and diluted to 25mL with mobile phase. This solutionwas injected into the chromatographic system after filteringthrough 0.2 𝜇mmembrane filter.
2.2.3. Method Validation. The high performance liquid chro-matography technique for the simultaneous quantification ofRC and DP was carried out following external calibrationmethod [20, 21]. The analytical method was validated on thebasis of accuracy, precision, linearity, range, and robustnessof the method. The reliability and accuracy of the proposedmethodwere determined on the basis of recovery studies.Thesample solution was spiked with standard stock solution atthree different levels (80%, 110%, and 120% of assay value foreach of RC and DP labeled as RA, RB, and RC and DA, DB,and DC, resp.) [21]. Precession of the method was studied onthe basis of precession of six replicate injections of the stan-dard solution.The linearity was established through prepara-tion of standard linearity curve in the concentration range of10.34 𝜇g⋅mL−1 to 82.69 𝜇g⋅mL−1 for RC and 10.44 𝜇g⋅mL−1 to83.50 𝜇g⋅mL−1 for DP (Figure 2). The same curves were usedfor quantification purpose.The intraday precision was calcu-lated using six injections at the higher concentration range(41.34 𝜇g⋅mL−1 for RC and 41.75 𝜇g⋅mL−1 forDP) on the sameday and on different days to obtain the interday precision.

Scientifica 3
Table 2: HPLC linearity.
(a) Resorcinol (b) DexpanthenolConcentration 𝜇g⋅mL−1 Average peak area % RSD Concentration 𝜇g⋅mL−1 Average peak area % RSD10.34 1693514 0.51 10.44 184197 0.9520.67 3457115 0.11 20.88 381674 0.1241.34 6854185 0.30 41.75 741349 0.2162.02 10309345 0.42 62.63 1092022 0.3882.69 14108460 0.56 83.50 1512696 0.44
OHHO
(a)
HO
NH
OH
O
HOH
H3CCH3
(b)
Figure 1: Chemical structure of resorcinol (a) and dexpanthenol (b).
0
2000000
4000000
6000000
8000000
10000000
12000000
14000000
16000000
0 20 40 60 80 100
Peak
area
Concentration (𝜇g/mL)
y = 17040x − 113248
R2 = 0.9995
(a)
0
200000
400000
600000
800000
1000000
1200000
1400000
1600000
0 20 40 60 80 100
Peak
area
Concentration (𝜇g/mL)
y = 17924x − 3383.9
R2 = 0.9989
(b)
Figure 2: Concentration versus peak area curve for RC (a) and DP (b) analysis.
The peak purity study was used to determine specificity of themethod. A photodiode array (PDA) detector was used for thepurpose in place of UV-detector mentioned earlier, keepingthe other chromatographic conditions unaltered.The limit ofquantitation (LOQ) and the limit of detection (LOD) weredetermined following the technique described elsewhere [21].Ruggedness of the method was determined by carrying outexperiment on instruments of different make. Slight changesin the chromatographic conditions like composition (±5%)and pH (±0.1%) of mobile phase were made in order to studythe robustness of the method.
The result obtained from each stage was subjected tostatistical analysis based on Sigma plot software (Version 8.02SPSS Inc., USA) and MS Excel 2007. The data were recordedin replicates and presented as mean ± standard deviation ofthe replicate measurements.
3. Results and Discussions
The average runtime for analysis was 28 minutes and theaverage retention time for RC was 7.20 ± 0.10 minutes andfor DP was 3.198 ± 0.20 minutes and for RC and DP was
4 Scientifica
2.602.402.202.001.801.601.401.201.000.800.600.400.200.00
0.00
2.00
4.00
6.00
8.00
10.00
12.00
14.00
16.00
18.00
20.00
22.00
24.00
26.00
28.00
(min)
(AU
)
Reso
rcin
ol, 7
.203
(a)
2.50
2.00
1.50
1.00
0.50
0.00
0.00
2.00
4.00
6.00
8.00
10.00
12.00
14.00
16.00
18.00
20.00
22.00
24.00
26.00
28.00
(min)
(AU
)
Reso
rcin
ol, 7
.190
(b)
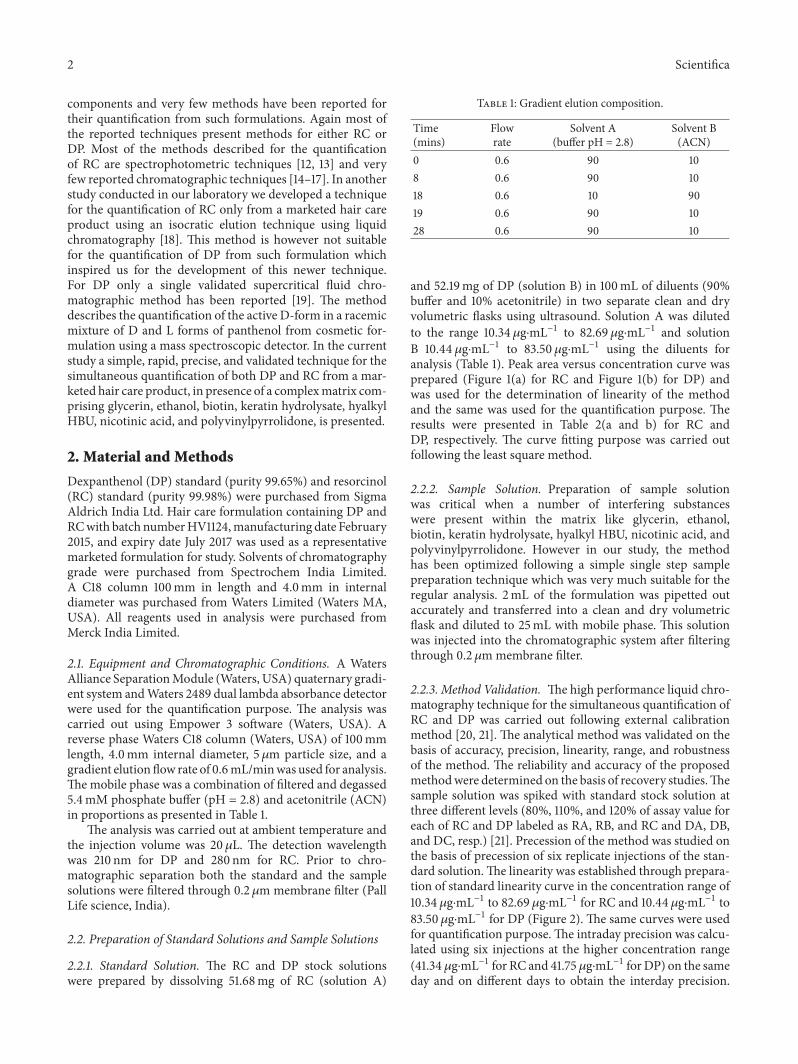
Figure 3: Representative chromatograms for resorcinol standard (a) and sample (b).
2.602.402.202.001.801.601.401.201.000.800.600.400.200.00
0.00
2.00
4.00
6.00
8.00
10.00
12.00
14.00
16.00
18.00
20.00
22.00
24.00
26.00
28.00
(min)
(AU
)
D-P
anth
enol
, 3.1
90
(a)
D-P
anth
enol
, 3.1
99
2.50
2.00
1.50
1.00
0.50
0.00
0.00
2.00
4.00
6.00
8.00
10.00
12.00
14.00
16.00
18.00
20.00
22.00
24.00
26.00
28.00
(min)
(AU
)
(b)
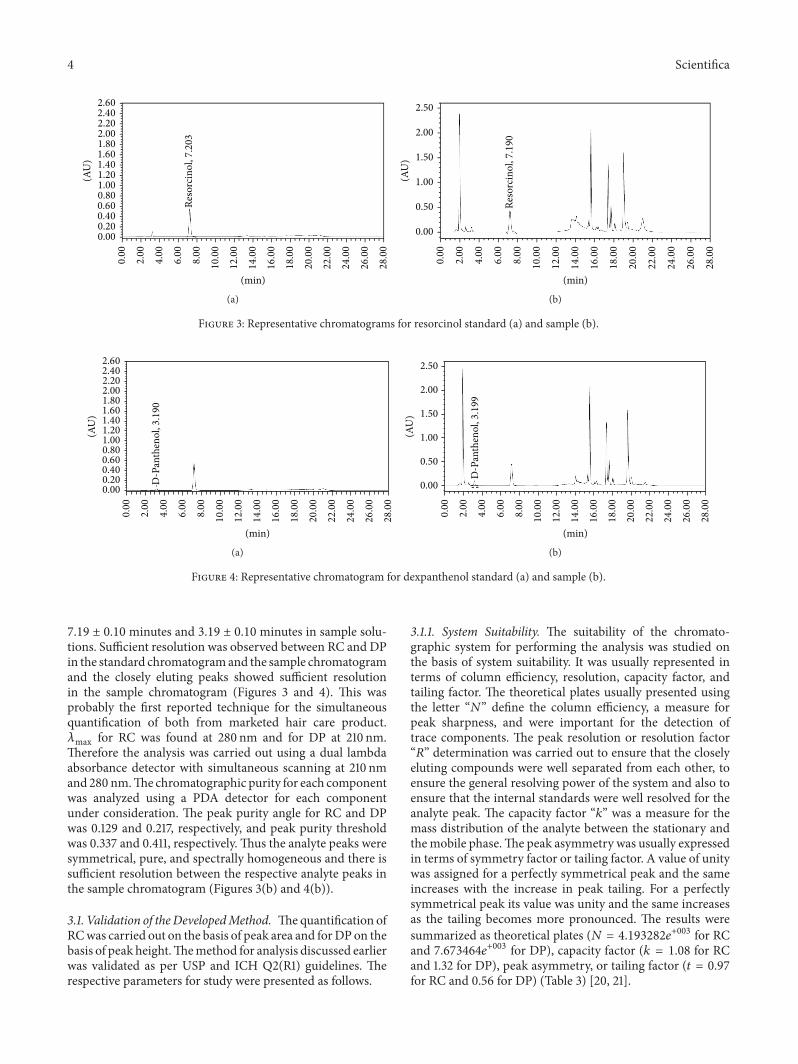
Figure 4: Representative chromatogram for dexpanthenol standard (a) and sample (b).
7.19 ± 0.10 minutes and 3.19 ± 0.10 minutes in sample solu-tions. Sufficient resolution was observed between RC and DPin the standard chromatogramand the sample chromatogramand the closely eluting peaks showed sufficient resolutionin the sample chromatogram (Figures 3 and 4). This wasprobably the first reported technique for the simultaneousquantification of both from marketed hair care product.𝜆max for RC was found at 280 nm and for DP at 210 nm.Therefore the analysis was carried out using a dual lambdaabsorbance detector with simultaneous scanning at 210 nmand 280 nm.Thechromatographic purity for each componentwas analyzed using a PDA detector for each componentunder consideration. The peak purity angle for RC and DPwas 0.129 and 0.217, respectively, and peak purity thresholdwas 0.337 and 0.411, respectively. Thus the analyte peaks weresymmetrical, pure, and spectrally homogeneous and there issufficient resolution between the respective analyte peaks inthe sample chromatogram (Figures 3(b) and 4(b)).
3.1. Validation of theDevelopedMethod. Thequantification ofRCwas carried out on the basis of peak area and forDP on thebasis of peak height.Themethod for analysis discussed earlierwas validated as per USP and ICH Q2(R1) guidelines. Therespective parameters for study were presented as follows.
3.1.1. System Suitability. The suitability of the chromato-graphic system for performing the analysis was studied onthe basis of system suitability. It was usually represented interms of column efficiency, resolution, capacity factor, andtailing factor. The theoretical plates usually presented usingthe letter “𝑁” define the column efficiency, a measure forpeak sharpness, and were important for the detection oftrace components. The peak resolution or resolution factor“𝑅” determination was carried out to ensure that the closelyeluting compounds were well separated from each other, toensure the general resolving power of the system and also toensure that the internal standards were well resolved for theanalyte peak. The capacity factor “𝑘” was a measure for themass distribution of the analyte between the stationary andthemobile phase.The peak asymmetry was usually expressedin terms of symmetry factor or tailing factor. A value of unitywas assigned for a perfectly symmetrical peak and the sameincreases with the increase in peak tailing. For a perfectlysymmetrical peak its value was unity and the same increasesas the tailing becomes more pronounced. The results weresummarized as theoretical plates (𝑁 = 4.193282𝑒+003 for RCand 7.673464𝑒+003 for DP), capacity factor (𝑘 = 1.08 for RCand 1.32 for DP), peak asymmetry, or tailing factor (𝑡 = 0.97for RC and 0.56 for DP) (Table 3) [20, 21].

Scientifica 5
Table 3: System suitability and method validation data for the simultaneous quantification of DP and RC.
Parameters Resorcinol Dexpanthenol
System suitabilityRetention time (min) 7.19 3.19
Capacity factor 1.08 1.32
Peak resolution 15.41∗ —
Tailing factor 0.97 0.56
Theoretical plates (𝑁) 4.193282𝑒+003
7.673464𝑒+003
SensitivityLOD (𝜇g⋅mL−1) 2.19 0.62
LOQ (𝜇g⋅mL−1) 6.64 1.89
PrecisionIntradayMean content (mg/100mL) (𝑛 = 5) ±% RSD 50.41 ± 0.19 49.77 ± 0.20
InterdayMean content (mg/100mL)(day 1/day 2/day 3) (𝑛 = 3)
50.40/50.38/50.39 49.76/49.78/49.65
(% RSD) (day 1/day 2/day 3) (𝑛 = 3) 0.20/0.19/0.21 0.11/0.19/0.15
SpecificityPeak purity angle 0.129 0.217
Peak purity threshold 0.337 0.411∗With respect to DP.
3.1.2. Linearity and Range. In order to study the linearityof the method, standard solutions in concentration range of3.08 𝜇g⋅mL−1 to 24.67𝜇g⋅mL−1 for RC and 10.44 𝜇g⋅mL−1 to83.50 𝜇g⋅mL−1 for DP were used. The result obtained fromthe analysis was used to prepare the linearity curve. Thecurve thus obtained was found to be linear with regressionfactor 𝑟2 = 0.999 and equation 𝑦 = 17040𝑥 − 11324 forRC and 𝑟2 = 0.998 and equation 𝑦 = 17924𝑥 − 3383 forDP (Figure 2). The limit of detection (LOD) and limit ofquantitation (LOQ) determined using the linearity curve [21]were 2.19 𝜇g⋅mL−1 and 6.64 𝜇g⋅mL−1 for RC, 0.62 𝜇g⋅mL−1and 1.89 𝜇g⋅mL−1 for DP, respectively (Table 3). The resultsexplained the sensitivity of the technique within the range ofanalysis under consideration [22].
3.1.3. Accuracy. The accuracy was a measure of closeness oftest results obtained by that procedure in comparison withthe true value. It is necessary to establish the accuracy ofthe procedure in concentration range under consideration. Inthis study the accuracy was analyzed on the basis of recoverystudy. Three different solutions at concentration ranges 80%,110%, and 120% of the calculated assay concentration wereprepared for DP and RC, respectively. The solutions wereprepared by adding a known volume of the standard solutions(solutions A and B) to the respective sample solutions. Theresults presented a mean recovery of 100.28% with % RSD0.82 for RC and 100.02% and 0.48, respectively, for DP(Table 4). Therefore an appreciable accuracy was establishedover the range of study [21, 22].
3.1.4. Precession. In our study precession was establishedon the basis of the standard deviation or relative standarddeviation of a series of measurements like repeatability andintermediate precession of the developed technique. Forrepeatability study six sample solutions at 100% of test con-centration were separately prepared and analyzed using theanalytical procedure under study. The same sample solutionwas injected in triplicate for three consecutive days and theresult thus obtained was used to determine the intermediateprecession.The intraday precession presented a % RSD valueof 0.19 and that for interday varied from 0.19% to 0.21% onlyfor RC and 0.20 and 0.11 to 0.19 for DP making the analyticalprocedure precise under the range of study (Table 2).
3.1.5. Specificity. The unequivocal assessment of the analyteunder consideration from a mixture of components likeimpurities, degradation products, and matrix componentswas termed as specificity [21]. In this study specificity of bothDP and RC was determined on the basis of chromatographicpeak purity study of sample solutions. A peak was consideredspectrally homogeneous, that is, free from coelution, onlywhen the peak purity angle was less than threshold. Thestudy presented the peak purity angle for RC and DP 0.129and 0.217, respectively, and peak purity threshold 0.337 and0.411, respectively (Table 3). Therefore it was concluded thatthe respective peaks were spectrally homogeneous, free fromany coeluting impurities, and specific for the simultaneousanalysis of both RC and DP.

6 Scientifica
Table4:Re
sults
ofaccuracy
study.
Solutio
n%of
nominal
valuefor
RCCon
centratio
nof
final
solutio
nin𝜇g⋅mL−1
Recovery
%
Observed
concentrationof
finalsolutio
n(𝜇g⋅mL−1
)∗
Averagea
ssay
value∗
(mg⋅100m
L−1
)
Observed
recovery
%
Accuracy
%%RS
D
100
40.00
—40
.3350.42
——
0.20
RA80
32.00
80.00
32.27
40.35
80.03
100.03
RB110
44.03
110.07
44.93
56.17
111.4
0101.2
10.82
RC120
48.12
120.30
48.33
60.42
119.83
99.61
Solutio
n%of
nominal
valuefor
DP
Con
centratio
nof
final
solutio
nin𝜇g⋅mL−1
Recovery
%
Observed
concentrationof
finalsolutio
n(𝜇g⋅mL−1
)∗
Averagea
ssay
value∗
(mg⋅100m
L−1
)
Observed
recovery
%
Accuracy
%%RS
D
100
40.00
—39.82
49.77
——
0.02
DA
8032.00
80.00
31.88
39.84
79.91
99.89
DB
110
44.12
110.30
44.05
55.09
110.69
100.35
0.48
DC
120
47.99
119.97
47.69
59.61
119.77
99.83
Note:∗
averagefrom
threer
eplicateinjectio
nsfro
msamplep
reparatio
ns.
Ther
ecoverystu
dyiscarriedou
toverthree-con
centratio
nrange.

Scientifica 7
Table 5: Robustness study∗∗.
Assay (mg/100mL) Analysts Instruments Storage condition1 2 3 I II III 20∘C 30∘C 45∘C
RC 50.42 50.41 50.40 50.44 50.41 50.42 50.42 50.42 50.40 50.40DP 49.77 49.77 49.78 49.76 49.79 49.78 49.77 49.77 49.76 49.77∗∗Three replicates each.
3.1.6. Robustness. The robustness was usually defined as thecapacity of an analytical procedure to remain unaffected onintroduction of small but deliberate variations of procedu-ral parameters listed in the procedure documentation andpresent an indication of its stability during regular analysis.The robustness of the currentmethodwas studied on the basisof variations in analyst, instruments, and solution stabilityand on different storage conditions. The results were foundwithin tolerance limits [20, 22] (Table 5).
The current method was found to be robust for thesimultaneous quantification of RC and DP (Table 5) at con-centrations as low as 6.64 𝜇g⋅mL−1 for RC and 1.89 𝜇g⋅mL−1for DP (Table 2).
4. Conclusion
The reverse phase high performance liquid chromatographictechnique developed in the current study was simple in termsof sample preparation and analysis, sensitive and selectivefor the quantification of both resorcinol and dexpanthenolsimultaneously, and precise and accurate for their simulta-neous quantification from a complex matrix. The methodhas been validated in terms of accuracy, precession, linearity,and sensitivity as per ICH Q2(R1) guidelines. The respectiveretention time for DP and RC was 3.19 minutes and 7.2minutes. The peaks were well resolved from each other andother closely eluting peaks. Thus the current method issuitable for routine analysis, stability testing, and simultane-ous quantification of RC and DP from various formulationsavailable in the market.
Conflict of Interests
The authors declare that there is no conflict of interestsregarding the publication of this paper.
Acknowledgments
The authors acknowledge all members of R&D section fortheir kind cooperation and support. The authors also thankthe management and board members for their invaluablesupport and encouragement.
References
[1] E. Proksch and H. P. Nissen, “Dexpanthenol enhances skinbarrier repair and reduces inflammation after sodium laurylsulphate-induced irritation,” Journal of Dermatological Treat-ment, vol. 13, no. 4, pp. 173–178, 2002.
[2] B. V. Ulger, M. Kapan, O. Uslukaya et al., “Comparing theeffects of nebivolol and dexpanthenol on wound healing: anexperimental study,” International Wound Journal, 2014.
[3] R. Heise, C. Skazik, Y. Marquardt et al., “Dexpanthenol mod-ulates gene expression in skin wound healing in vivo,” SkinPharmacology and Physiology, vol. 25, no. 5, pp. 241–248, 2012.
[4] F. Ebner, A. Heller, F. Rippke, and I. Tausch, “Topical use ofdexpanthenol in skin disorders,” American Journal of ClinicalDermatology, vol. 3, no. 6, pp. 427–433, 2002.
[5] A. Karadag, R. Ozdemir, A. Kurt et al., “Protective effectsof dexpanthenol in an experimental model of necrotizingenterocolitis,” Journal of Pediatric Surgery, vol. 50, no. 7, 2015.
[6] M. Castello and M. Milani, “Efficacy of topical hydrating andemollient lotion containing 10%urea ISDIN5 plus dexpanthenol(Ureadin Rx 10) in the treatment of skin xerosis and pruritusin hemodialyzed patients: an open prospective pilot trial,”Giornale Italiano di Dermatologia e Venereologia, vol. 146, no.5, pp. 321–325, 2011.
[7] M. G. Davis, J. H. Thomas, S. Van De Velde et al., “A novelcosmetic approach to treat thinning hair,” British Journal ofDermatology, vol. 165, no. 3, pp. 24–30, 2011.
[8] C. Goebel, T. L. Diepgen, M. Krasteva et al., “Quantitative riskassessment for skin sensitisation: consideration of a simplifiedapproach for hair dye ingredients,” Regulatory Toxicology andPharmacology, vol. 64, no. 3, pp. 459–465, 2012.
[9] C. Burnett, B. Lanman, R. Giovacchini, G. Wolcott, R. Scala,andM. Keplinger, “Long-term toxicity studies on oxidation hairdyes,” Food and Cosmetics Toxicology, vol. 13, no. 3, pp. 353–357,1975.
[10] B. S. Lynch, E. S. Delzell, and D. H. Bechtel, “Toxicology reviewand risk assessment of resorcinol: thyroid effects,” RegulatoryToxicology and Pharmacology, vol. 36, no. 2, pp. 198–210, 2002.
[11] F. Welsch, “Routes and modes of administration of resorcinoland their relationship to potential manifestations of thyroidgland toxicity in animals and man,” International Journal ofToxicology, vol. 27, no. 1, pp. 59–63, 2008.
[12] R. Cinier and J. Guilment, “Quantitative analysis of resorcinolin aqueous solution by near-infrared spectroscopy,” VibrationalSpectroscopy, vol. 11, no. 1, pp. 51–59, 1996.
[13] I. A. Guseınov, “Spectrophotometric determination of resorcinand hydroquinone in air,”Gigiena i Sanitariia, vol. 33, no. 11, pp.46–48, 1968.
[14] V. D. Gupta, “Quantitative determinations of phenol and resor-cinol in pharmaceutical dosage forms by high pressure liquidchromatography,” Journal of Pharmaceutical Sciences, vol. 65,no. 11, pp. 1706–1707, 1976.
[15] P. P. Karkhanis, D. O. Edlund, and J. R. Anfinsen, “QuantitativeGLC determination of resorcinol monoacetate in dermatologi-cal products,” Journal of Pharmaceutical Sciences, vol. 62, no. 5,pp. 804–806, 1973.
[16] L.-H.Wang and Y.-P. Kuo, “Simultaneous quantitative determi-nation of resorcinol and 1-naphthol in haircolor products by

8 Scientifica
high-performance liquid chromatography,” Chromatographia,vol. 49, no. 3-4, pp. 208–211, 1999.
[17] W. Jin, W.-Y. Wang, Y.-L. Zhang, Y.-J. Yang, Q.-C. Chu, andJ.-N. Ye, “Determination of phenolic whitening agents in cos-metics bymicellar electrokinetic capillary chromatographywithamperometric detection,” Chinese Chemical Letters, vol. 24, no.7, pp. 636–638, 2013.
[18] A. K. De, P. P. Chowdhury, and S. P. Chattapadhyay, “Quantita-tive analysis of resorcinol frommarketed hair tonic using liquidchromatographic technique,” International Scholarly ResearchNotices, vol. 2014, Article ID 632591, 5 pages, 2014.
[19] S. Khater and C. West, “Development and validation of asupercritical fluid chromatographymethod for the direct deter-mination of enantiomeric purity of provitamin B5 in cosmeticformulations with mass spectrometric detection,” Journal ofPharmaceutical and Biomedical Analysis, vol. 102, pp. 321–325,2015.
[20] The United States Pharmacopeia, U.S. Pharmacopeial Conven-tion, vol. 1, The United States Pharmacopeia, Rockville, Md,USA, 38th edition, 2008.
[21] ICH (Q2-R1), “Note for guidance on validation of analyticalmethods: definitions and terminology,” in Proceedings of theInternational Conference on Harmonisation, pp. 9–13, 1994.
[22] S. Ahuja and S. Scypinski,HandBook ofModern PharmaceuticalAnalysis, Academic Press, New York, NY, USA, 2005.

Submit your manuscripts athttp://www.hindawi.com
Hindawi Publishing Corporationhttp://www.hindawi.com Volume 2014
Anatomy Research International
PeptidesInternational Journal of
Hindawi Publishing Corporationhttp://www.hindawi.com Volume 2014
Hindawi Publishing Corporation http://www.hindawi.com
International Journal of
Volume 2014
Zoology
Hindawi Publishing Corporationhttp://www.hindawi.com Volume 2014
Molecular Biology International
GenomicsInternational Journal of
Hindawi Publishing Corporationhttp://www.hindawi.com Volume 2014
The Scientific World JournalHindawi Publishing Corporation http://www.hindawi.com Volume 2014
Hindawi Publishing Corporationhttp://www.hindawi.com Volume 2014
BioinformaticsAdvances in
Marine BiologyJournal of
Hindawi Publishing Corporationhttp://www.hindawi.com Volume 2014
Hindawi Publishing Corporationhttp://www.hindawi.com Volume 2014
Signal TransductionJournal of
Hindawi Publishing Corporationhttp://www.hindawi.com Volume 2014
BioMed Research International
Evolutionary BiologyInternational Journal of
Hindawi Publishing Corporationhttp://www.hindawi.com Volume 2014
Hindawi Publishing Corporationhttp://www.hindawi.com Volume 2014
Biochemistry Research International
ArchaeaHindawi Publishing Corporationhttp://www.hindawi.com Volume 2014
Hindawi Publishing Corporationhttp://www.hindawi.com Volume 2014
Genetics Research International
Hindawi Publishing Corporationhttp://www.hindawi.com Volume 2014
Advances in
Virolog y
Hindawi Publishing Corporationhttp://www.hindawi.com
Nucleic AcidsJournal of
Volume 2014
Stem CellsInternational
Hindawi Publishing Corporationhttp://www.hindawi.com Volume 2014
Hindawi Publishing Corporationhttp://www.hindawi.com Volume 2014
Enzyme Research
Hindawi Publishing Corporationhttp://www.hindawi.com Volume 2014
International Journal of
Microbiology