research article synoptic-scale precursors to tropical...
TRANSCRIPT

Research ArticleSynoptic-Scale Precursors to Tropical Cyclone RapidIntensification in the Atlantic Basin
Alexandria Grimes and Andrew E. Mercer
Mississippi State University, Mississippi State, MS 39762-5448, USA
Correspondence should be addressed to Andrew E. Mercer; [email protected]
Received 16 November 2014; Revised 16 April 2015; Accepted 23 April 2015
Academic Editor: Luis Gimeno
Copyright © 2015 A. Grimes and A. E. Mercer. This is an open access article distributed under the Creative Commons AttributionLicense, which permits unrestricted use, distribution, and reproduction in any medium, provided the original work is properlycited.
Forecasting rapid intensification (hereafter referred to as RI) of tropical cyclones in the Atlantic Basin is still a challenge due to alimited understanding of the meteorological processes that are necessary for predicting RI. To address this challenge, this studyconsidered large-scale processes as RI indicators within tropical cyclone environments. The large-scale processes were identifiedby formulating composite map types of RI and non-RI storms using NASA MERRA data from 1979 to 2009. The composite fieldswere formulated by a blended RPCA and cluster analysis approach, yielding multiple map types of RI’s and non-RI’s. Additionally,statistical differences in the large-scale processes were identified by formulating permutation tests, based on the composite output,revealing variables that were statistically significantly distinct between RI and non-RI storms.These variables were used as input intwo prediction schemes: logistic regression and support vector machine classification. Ultimately, the approach identified midlevelvorticity, pressure vertical velocity, 200–850 hPa vertical shear, low-level potential temperature, and specific humidity as the mostsignificant in diagnosing RI, yielding modest skill in identifying RI storms.
1. Introduction
Based on the National Hurricane Center (NHC) and Sta-tistical Hurricane Intensity Prediction Scheme (SHIPS) da-tabases, 31% of all tropical cyclones, 60% of all hurricanes,83% of all major hurricanes, and all categories 4 and 5hurricanes undergo rapid intensification (hereafter referredto as RI) [1–3]. This includes such famous systems as Hur-ricanes Camille (1969), Andrew (1992), Opal (1995), Mitch(1998), Charley (2004), Katrina (2005), and Wilma (2005).While not all rapidly intensifying hurricanes have madelandfall, the threat against lives and property is apparent.Forecasting tropical-cyclone track has improved over the lasttwo decades, but forecasting RI still remains a challenge[2, 4, 5].The forecasts of RI are limited by two key issues. First,researchers lack a clear definition for RI. The NHC definesRI as a sustained wind-speed increase of 30 kts over a 24-hour period; however, thresholds of 25, 35, and 40 kt overa 24-hour period are also used for developing RI forecastmodels and aids [1, 3–5]. Alternatively, other studies, andthe National Weather Service, define RI as a decrease in
the minimum sea-level pressure of 42 hPa over a 24-hourperiod [6, 7]. These definitions are related, since changes inthe mass field (demonstrated by pressure changes) will resultin changes to the wind field.This relationship is characterizedby the eyewall containing the fastest winds and the eyecontains the lowest central pressure. Second, there is thelimited understanding of which meteorological covariatesare the best at predicting RI. Statistical techniques, such asmultiple regression analyses [8], have been used to try todistinguish the best method to forecast RI, based on localizedenvironmental influences and dynamic and thermodynamicparameters. However, while research in forecasting RI hasbecome a top priority for the NHC [4], limited improvementhas been made over the past two decades.
Further examination of long-term trends in RI forecastsfor active tropical-cyclone basins has revealed little recentimprovements in the last two decades. Elsberry et al. [2]documented intensity guidance errors for Atlantic tropi-cal cyclones during the 2003-2004 seasons. The systemswere evaluated during three intensity phases: formation,early intensification/reintensification, and decay, with 12 RI
Hindawi Publishing CorporationAdvances in MeteorologyVolume 2015, Article ID 814043, 16 pageshttp://dx.doi.org/10.1155/2015/814043

2 Advances in Meteorology
episodes identified for the 2003-2004 season [2]. For theintensification phase, forecasts by the 5-day statistical hurri-cane intensity forecast (SHF5), Statistical Hurricane IntensityPrediction Scheme (SHIPS), and decay SHIPS (DSHIPS) didnot predict RI cases 48 hours in advance, where the SHF5 had0 hits and 12 misses and the SHIPS and DSHIPS both had1 hit and 11 misses each [2]. For the dynamical models, theGeophysical Fluid Dynamics Interpolated model (GFDI) didpredict some RI events including 1 hit, 1 forecast that was tooearly, and 2 late forecasts, (which were outside the ±12-hourinterval) resulting in 8 misses, while the Geophysical FluidDynamics Model-Navy Interpolated (GFNI) had 2 hits, 1 lateforecast 24 hours after the episode, and 9 misses [2]. All ofthese models were also under-forecasting the peak intensityobserved [2].
In order to better understand RI processes, Kaplan andDeMaria [9] first developed a simple five-predictor RI index(RII), for the Atlantic Basin, based on the SHIPS and lineardiscriminant analysis techniques. The SHIPS-RII has sincebeen modified and now implements 12-, 24-, 36-, and 48-hour lead times, using 25, 30, 35, and 40 kt thresholds. Pre-dictors include, but are not limited to, vertical shear, lower-tropospheric relative humidity, maximum potential intensity,total precipitable water, the second principal componentfromGOES-IR imagery, and boundary-layer predictors [3, 4,10]. Rozoff and Kossin [5], however, suggested that modelsshould try to capture when a storm begins to get sufficientinner-core organization, resulting in two new RI predictionmodels: a logistic regression model and an empirical proba-bility model based on Bayesian principles. When evaluated,the models had forecast skill similar to the SHIPS-RII model[5]. Further evaluation showed that when all three modelswere combined into a 3-member ensemble, forecast skillwas superior to examining each model individually [4, 5].Therefore, in an effort to improve the SHIPS-RII, newconsensus-based versions of the RII were implemented toemploy the SHIPS-discriminant RII, Bayesianmodel, and thelogistic regression model [4, 5].
There are numerous statistical forecast aids that have alsobeen used for improving prediction of RI that are derivedusing models such as the SHF5, DSHIPS, and GFDI [11].Sampson et al. [11] introduced a new deterministic RI aidbased on the RI index probability thresholds (RAPID) and afive-member consensus aid (IVCN) consisting of the follow-ingmodels: GFDI,DSHIPS, LogisticGrowthEquationModel(LGEM),HurricaneWeather Research and Forecast (HWRF)Interpolatedmodel (HWFI), andGFNI.The research showedthat although the sample size was limited, RAPID did outper-form other consensus aids and determined a 40% probabilitythreshold for RI that resulted in a 4% reduction in meanforecast errors when IVCN and RAPID were combined [11].A new version of RAPID that developed as a result (utilizedin SHIPS) used RI guidance and the consensus members ofIVRI (DSHIPS, LGEM,Geophysical FluidDynamics Labora-tory Model Interpolated (GHMI), and HWFI) [4]. Inclusionof this new RAPID aid in the consensus model reducedmeanforecast errors by approximately 5%, simultaneously reducingthe biases by several knots [4].
Most recently, the skill of the SHIPS-RII is still inad-equate. Brier skill scores relative to climatology are near20% when the consensus model developed by Rozoff andKossin is implemented for a threshold of 25 kt/24-hour leadtime [4, 5]. The skill for the logistic regression model alone(using this same threshold) was near 18% and the skillfor both the Bayesian and SHIPS models was below 15%[4]. When microwave imagery was added to the logisticregression model developed by Rozoff and Kossin, therewere slight improvements to forecasting RI when used withthe developmental dataset. However, upon evaluation of themicrowave imagery based model, the Brier skill scores usingreal-time Global Forecast System (GFS) forecast fields from2004–2013 showed skill for the Atlantic below 20% [4].
Previous literature has suggested the need for moreadvanced statistics, including those which utilize learningmethods [9, 12, 13].This study sought to address these currentRI forecast issues by utilizing spatial statistical techniquesand learningmethods (in particular, support vectormachines[14]) to improve the skill of a RI discrimination system. Theprimary research goals were the identification of relevantsynoptic-scale controls in RI and non-RI tropical cyclonesand the improvement of the discrimination between thesetwo classes of cyclones, in particular an improvement inidentifying the onset of RI.
2. Data and Methods
2.1. Data. Large-scale composites require fully three-di-mensional, gridded datasets of base-state meteorologi-cal fields. For this project, the NHC’s North AtlanticHurricane Database (HURDAT) [15] and NASA ModernEra-Retrospective Analysis for Research and Applications(MERRA) [16] data were obtained for all tropical andsubtropical cyclones, regardless of landfall, from 1979 to2009. MERRA surface data are provided on a 1/2∘ × 2/3∘(latitude/longitude) global grid and the pressure-level dataare provided on a 1.25∘×1.25∘ (latitude/longitude) global grid,which also includes 25 vertical pressure levels up to 100 hPa.For this study, all three-dimensional base-state meteorologi-cal variables (temperature, 𝑢 and Vwind components, specifichumidity, geopotential height, and pressure vertical velocity)as well as mean sea-level pressure (MSLP), surface pressure,skin temperature (a proxy for sea surface temperature), 10-mand 2-m 𝑢 and V wind components, 2-m temperature, 2-mspecific humidity, and tropopause pressure were collected.
Since a primary goal was diagnosis of RI using the large-scale cyclone structure, storm centric domains of MERRAdata for each cyclone were obtained. The center of thestudy domain for each storm used the MERRA grid pointnearest to the NHC-defined storm center 24 hours prior togreatest intensification (hence the data were storm centric),with variables extracted on a 15 × 11 latitude/longitudegrid centered on this domain. Since inconsistencies in thedefinition of RI existed within the literature, an independentdefinition of RI was developed. The definition used a 95%bias-corrected and accelerated (BCa) bootstrap confidenceinterval analysis [17, 18] of 24-hour pressure change withinall storms (Figure 1). The BCa method has been shown to

Advances in Meteorology 3
Frequency of 24-hour tropical-cyclone pressure change
24-hour pressure change (hPa)
Freq
uenc
y
0 50 1000
500
1000
1500
2000
2500
3000
−50
Figure 1: 24-hour pressure changes for the full Atlantic Basinhurricane database. Note that all pressure changes for all stormswere resampled 10000 times to yield bias corrected and acceleratedconfidence intervals (shaded). Negative values imply 24-hour pres-sure decreases (in red) and positive values are 24-hour pressure rises(blue). The red shaded region was used to select the definition of RIin this study (25 hPa of pressure decrease in 24 hours).
be second-order accurate, meaning it will converge on thepopulation confidence intervals twice as quickly as traditionalconfidence interval methods [19]. The resulting analysis ledto the RI definition of a decrease in pressure of 25 hPa in 24hours.
After the data were split into RI and non-RI groups,MERRA data were collected 24 hours prior to the largest 24-hour pressure decrease in both the RI and non-RI groups.In the instance that there was a tie for the greatest pressurechange, the first was chosen, so that the approach only dealtwith the first instance of RI in any storm that underwent RImultiple times. For example, if the largest pressure decreaseoccurred on June 24, 1987, at 12Z, data were collected forJune 23, 1987, at 12Z. This approach yielded 76 RI eventsand 265 non-RI events, with the distribution of maximumintensification identified for each storm type (RI and non-RI,Figure 2).
2.2.Methods. Thismethodologywas divided into twophases.First, synoptic-scale variables that yielded the largest statisti-cally significant differences between RI and non-RI tropicalcyclones were identified through spatial analysis. The secondphase involved the implementation of a logistic regressionand a support vector machine (hereafter SVM) classificationalgorithm to diagnose the onset of RI at a 24-hour lead time.
2.2.1. Spatial Analysis. Since the MERRA surface and upper-level data were on different grids, and the spatial analysismethods utilized herein required consistency among grid-points, a Barnes objective analysis (similar to an inversedistance weighted scheme) was utilized to upscale the surfacedata to the 1.25∘ × 1.25∘ grid of the upper-level data [35].Interpolation errors associated with the objective analysiswere approximately 1% of the magnitude of each variable.
Table 1: Variance explained for each RPC for the RI and non-RIdatasets.
RI loadingsRPC Variance explained1 0.142 0.123 0.0644 0.048
Non-RI loadingsRPC Variance explained1 0.162 0.0853 0.063
Once proper domain structure was established, a rotatedprincipal component analysis (RPCA) [36] and hierarchicalcluster analysis were utilized to construct composite fieldsof the environments associated with each tropical cyclonetype (RI or non-RI). RPCA is a linear analysis techniquethat reduces the dimensionality by transforming the originaldataset into a new dataset of linear combinations in order ofdecreasing variability explained. The rotated principal com-ponents (RPCs) are uncorrelated and effectively represent aredistribution of variancewithin the full dataset to the leadingmodes of variability. However, depending on the problembeing considered, a different underlying correlation structurecan be utilized. In this study, the spatial behavior of multiplecases that do not maintain a consistent time-series structurewas of interest, so a 𝑇-mode RPCA [36] was employed.
The RPCA methodology included the following:
(i) transformation of the original data to standardanomalies, since the variables have considerable vari-ability among each other and among vertical levels(e.g., comparing 300 hPa geopotential height against700 hPa specific humidity): this scaling was done byvariable and by vertical level;
(ii) a formulation of the correlation matrix, correlatingthe individual cases (𝑇-mode) instead of the grid-points (𝑆-mode) [36];
(iii) an eigenanalysis of the correlation matrix, whichincluded reducing the dimensions of the eigenvectormatrix: this reduction was done using the congruencetest [37]; after data reduction, 4 RPCs remained forRI storms and 3 RPCs for non-RI storms (Table 1provides the variance explained of each RPC for eachintensification type);
(iv) calculation of the RPC loadings and scores: RPCloadings (formulated using varimax rotation [36])represented the relative contribution of each case to agiven RPC score, and as such, they provide a relativematch of the RPC patterns to the original cases andcan be used to cluster events (see [37] for details).
Since the resulting RPC loadings provide a relative matchof each case to the given RPC score field, a hierarchical

4 Advances in Meteorology
TS 1 2 3 4 5
RI by Saffir-Simpson category
Saffir-Simpson scale
Num
ber o
f sto
rms
0
50
100
150
200
(a)
TS 1 2 3Saffir-Simpson scale
Num
ber o
f sto
rms
0
50
100
150
200 Non-RI by Saffir-Simpson category
(b)
Figure 2:Distribution of themaximum intensity for bothRI (a) and non-RI (b) datasets. As observed throughout the climatology, no category4 or 5 non-RI storms have occurred.
22222222222222222222222222221111111111111111111111111114444443
33333333333333
0
2
4
6
8
Hei
ght
Figure 3: Dendrogram for the loadings produced using Ward’smethod for RI. Numbers represent which cluster a case was assignedand the arrows are drawn to point out clear clustering patterns thatemerged for the dataset, resulting in 4 RI clusters.
clustering of the RPC loadings can be used to group eventsbased on their dominant physical structures. Hierarchicalcluster analysis has a primary goal of minimizing the intr-acluster event distances while maximizing the interclustergroup Euclidean distances. Clustering is completed throughvarious hierarchical linkage methods. In this study, severallinkagemethodswere tested, but the linkage that provided themost robust results was Ward’s minimum variance method[38]. The resulting dendrograms (see the RI dendrogram inFigure 3) revealed 4 RI clusters and 8 non-RI clusters (Table 2provides amount of events per cluster). Once each event’smembership in the cluster structure was established, eventswithin the same cluster were averaged together, yieldingcompositemaps of different types of RI and non-RI scenarios.This process was done for both the RI and non-RI datasets,yielding fully three-dimensional atmospheric composites ofthe synoptic-scale structure for each type of intensificationscenario. These fields were subjectively analyzed for evident
Table 2: Events per cluster using Ward’s minimum variancemethod. RI’s resulted in 4 clusters, while non-RI’s resulted in 8.
Cluster RI Non-RI1 27 392 28 253 15 334 6 355 — 246 — 297 — 438 — 37
differences between the environments associated with eachtype of intensification.
To test the significance of the differences identified in thecluster analysis, a permutation test [38] was performed on therawMERRAvariables to determine the 95% level of statisticalsignificance of the observed differences (𝛼 = 0.05). Statisti-cally, variables that exhibit the largest statistically significantdifferences between RI and non-RI events should be the bestdiscriminators of intensification type. This approach yieldeda series of “best” predictors that were considered as input intothe SVM in phase 2 of the methodology.
2.2.2. Statistical Modeling. For phase 2 of the methodology, aSVM classification model that utilized the “best” predictorsfrom phase one was formulated on the original MERRAdata fields to predict RI 24 hours prior to occurrence. SVMsare learning systems that project nonlinear datasets into ahigher-dimensionalmathematical hyperspace that representsthe data linearly [14]. This mapping is accomplished throughthe use of a kernel map function 𝜑, so that the dot productof these map functions yields a similarity matrix known as akernel matrix K = ⟨𝜑(𝑥), 𝜑(𝑦)⟩. Such a representation allowsfor the formulation of a separating hyperplane between

Advances in Meteorology 5
the two data classes (RI’s and non-RI’s). Another primarygoal of the SVM is to maximize the distance between thetwo separating hyperplanes (the margin of separation) viaa quadratic programming optimization approach. Each timethe SVM is trained with new data, the margins and optimiza-tion routines are modified, so that the system learns fromnew information. Additionally, the quadratic programmingoptimization routine can be modified by penalizing pointsfar from the margin of separation in the formulation of thedecision hyperplane, known as the cost function penalty.Such a high-cost optimization example would only utilizepoints lying on the decision hyperplane, which are known assupport vectors. Through modification of the kernel matrixfunction K and the cost function, it is possible to obtain atheoretically infinite number of SVM configurations, and assuch a cross-validation routine was implemented to identifythe bestK and cost combination. To diagnose the added valueof utilizing a SVM approach, a traditional logistic regression[38] was included in the analysis. Limited by the number ofcases, and to reduce covariability and minimize overfitting,a second RPCA was performed [39, 40] on the 14 “best”predictors as determined by the results of composite and per-mutation test analysis, as well as previous literature: potentialtemperature at 1000, 925, 850, and 700 hPa, pressure verticalvelocity at 850, 700, 500, and 200 hPa, vertical shear (200–850 hPa), specific humidity at 1000, 925, 850, and 700 hPa,and vorticity at 500 hPa. The resulting RPC scores for allRI and non-RI events were used as predictors in the SVM,which in turn provided a binary RI/non-RI response. TheRPCA of the combined RI and non-RI event matrix yielded7 RPCs (using a traditional scree test, also known as Kaiser’srule, for dimension reduction [38] (Figure 4)).The scree plot,while subjective, revealed a leveling off at the seventh RPCsuggesting that additional RPCs would not further explainthe variability in the dataset. Additionally, the RPC scoresare by definition uncorrelated when using a varimax rotationapproach, so that any issues with multicollinearity within the14 “best” predictors are eliminated by using this approach.
To establish measures of uncertainty in the statisticalmodeling results and allow for independent testing [38,41] and thereby reduce the risk of overfitting, a bootstrapcross-validation method (as outlined in [38]) was used forboth the logistic regression and SVM equations. For thisresearch, the training (85% of the data) and testing (15%of the data) sets were determined via pairwise (i.e., thesame random training and independent testing samples wereformulated for the logistic regression and all SVM experi-ments) bootstrap resampling with 1000 iterations, providinga performance distribution of the derived contingency statis-tics [38]. Confidence intervals formulated on these pairwiseresampled distributions were used to select the best SVMconfigurations of those tested. To determine the best SVMconfiguration, a series of experiments was needed, usingdifferent kernel and cost functions. Both polynomial andradial basis functions were tested; however, the polynomialkernel never predicted any RI events. As such, a radialbasis kernel function (hereafter RBF) was used primarily todetermine which provided the largest discrimination ability[39]. Several gamma values (0.1, 0.05, and 0.01) and cost
2 4 6 8 10 12 14
50
100
150
200
250
300
Eigenvalue number
Eige
nval
ue
Figure 4: Scree plot from secondRPCA scree test using the 14 “best”predictors. Seven RPCs were kept since the plot begins to level out.
functions (1 to 1000 on a log10
scale) were tested to identifythe best SVM performance. As the goal was to establishwhich SVM or logistic regression worked best at classifyingRI and non-RI events 24 hours prior to onset, the bootstrapcross-validation method described previously allowed forperformance evaluation on each given model [42]. Theoutput of both the logistic regression and the optimal SVMconfiguration was evaluated using traditional contingencystatistics [38], including probability of detection (POD), falsealarm ratio (FAR), and bias (where a bias of less than 1 meansthe model underforecasts RI events and a bias greater than1 means the model overforecasts RI events). Additionally,formal model skill was diagnosed using the Heidke skillscore (HSS), which is a measure of skill relative to baselineclimatology. Values of 1 for HSS suggest a perfect forecast,while values of 0 show that the model performs as good asclimatology. Negative HSS values suggest that climatology isbetter than the model, which is undesirable.
3. Analysis
3.1. RI and Non-RI Composites. Utilizing support from previ-ous literature, a starting set of important diagnostic variables(Table 3) was developed for conducting subjective analysisof the composites from phase 1. These selected variables,for each cluster and for each intensification type, yieldednumerous (over 200) possible maps for discussion. For thesake of brevity, images from cluster 3 for both RI and non-RIcomposites are provided, as this cluster represented distinctRI and strong non-RI cases. The remaining cluster results aresummarized in the text below.
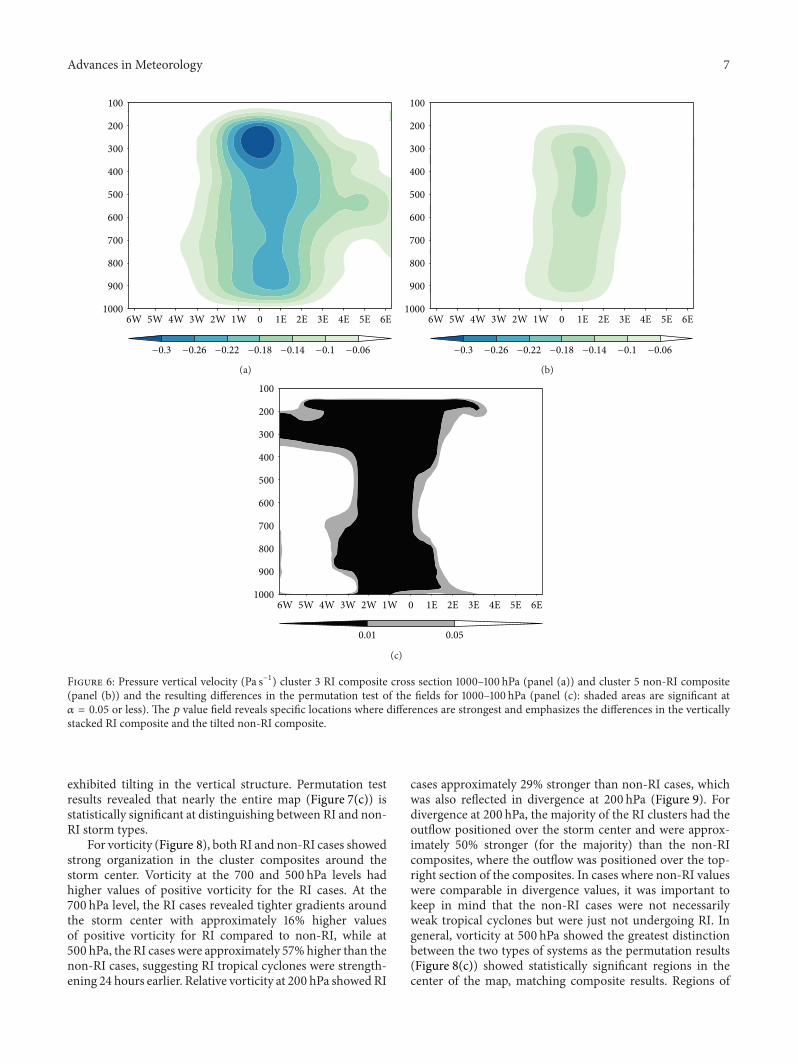
For pressure vertical velocity, the most notable featureswere at the 700, 500, and 200 hPa levels. At 500 and 200 hPa(Figure 5), the RI composites showed tighter gradients inthe midlevels, while at 700 hPa, non-RI composites showedsigns of shifting from storm center towards the right. Thiswas more evident in cross sections (Figure 6). Values ofupward vertical velocity (UVV) were comparable in themajority of the levels, where at 1000, 700, and 500 hPa,

6 Advances in Meteorology
26N
24N
22N
20N
18N
16N
14N
12N
10N
6W 4W 2W 0 2E 4E 6E
−0.06
−0.1
−0.14
−0.18
−0.22
−0.26
−0.3
(a)
26N
24N
22N
20N
18N
16N
14N
12N
10N
6W 4W 2W 0 2E 4E 6E
−0.06
−0.1
−0.14
−0.18
−0.22
−0.26
−0.3
(b)
26N
24N
22N
20N
18N
16N
14N
12N
10N
6W 4W 2W 0 2E 4E 6E
−0.06
−0.1
−0.14
−0.18
−0.22
−0.26
−0.3
(c)
26N
24N
22N
20N
18N
16N
14N
12N
10N
6W 4W 2W 0 2E 4E 6E
−0.06
−0.1
−0.14
−0.18
−0.22
−0.26
−0.3
(d)
26N
24N
22N
20N
18N
16N
14N
12N
10N
6W 4W 2W 0 2E 4E 6E
0.05
0.01
(e)
26N
24N
22N
20N
18N
16N
14N
12N
10N
6W 4W 2W 0 2E 4E 6E
0.05
0.01
(f)
Figure 5: Pressure vertical velocity (Pa s−1) cluster 3 500 hPa RI (panel (a)), non-RI (panel (b)), 200 hPa RI (panel (c)), non-RI (panel (d)),and the resulting differences in the permutation test of the fields for 500 hPa (panel (e): shaded areas are significant at 𝛼 = 0.05 or less) and200 hPa (panel (f)). Composites reveal there is UVV in storm center for RI tropical cyclones, whereas the non-RI cases are showing shiftingtowards the right of storm center. The 𝑝 value fields reveal areas of statistical significance are shifted left of the storm center, matching upclosely with the area of statically significant divergence.
Table 3: Variables chosen for composite analysis.
Variable Level(s) References(hPa)
MSLP 1000 [8, 9, 20–23]Temperature includingskin temperature 1000–200 [9, 20, 21, 24–29]
Potential temperature 1000–200 [20, 30, 31]Pressure vertical velocity 1000–200 [20–22, 27–29, 32]𝑢 and V winds 1000–200 [3, 8, 9, 30, 31]Vertical shear 200–850 [3, 4, 9, 25–27, 32, 33]Specific humidity 1000–200 [8, 9, 20, 23, 27, 29, 31]Vorticity 700–200 [8, 21, 26–29]Divergence 200 [3, 8, 20, 22, 27–29, 32, 34]
the percent differences between RI and non-RI storms wereminimal (less than 10%). The greatest differences in UVV
were present at 200 hPa, where RI cases were approximately80% stronger than non-RI cases. The cross sections revealedmaxima in pressure vertical velocity remained verticallystacked for RI systems (Figure 6). Additionally, UVV valueswere weaker for the majority of non-RI clusters and allof the structures had a vertical tilt in the revealed UVVcore. This would result in inhibition of the moisture sourcethrough the inflow region for the non-RI tropical cyclones.Statistical significance, revealed through the permutationtests, was shown for pressure vertical velocity in the centerof the storm. This was expected given the cluster compositesrevealing that the non-RI cases had vertically tilted structures,compared to the vertically stacked RI cases, while exhibitingstronger UVV (Figure 6(c)). Analysis of vertical shear from200 to 850 hPa (Figure 7) revealed that little shear is presentaround the storm centers for RI clusters, while for the non-RI composites, there are indications of shear affecting thestorm center for a majority of the clusters. This is expectedsince pressure vertical velocity revealed that non-RI cases
Advances in Meteorology 7
100
200
300
400
500
600
700
800
900
1000
6W 5W 4W 3W 2W 1W 0 1E 2E 3E 4E 5E 6E
−0.06−0.1−0.14−0.18−0.22−0.26−0.3
(a)
100
200
300
400
500
600
700
800
900
1000
6W 5W 4W 3W 2W 1W 0 1E 2E 3E 4E 5E 6E
−0.06−0.1−0.14−0.18−0.22−0.26−0.3
(b)
100
200
300
400
500
600
700
800
900
1000
6W 5W 4W 3W 2W 1W 0 1E 2E 3E 4E 5E 6E
0.050.01
(c)
Figure 6: Pressure vertical velocity (Pa s−1) cluster 3 RI composite cross section 1000–100 hPa (panel (a)) and cluster 5 non-RI composite(panel (b)) and the resulting differences in the permutation test of the fields for 1000–100 hPa (panel (c): shaded areas are significant at𝛼 = 0.05 or less). The 𝑝 value field reveals specific locations where differences are strongest and emphasizes the differences in the verticallystacked RI composite and the tilted non-RI composite.
exhibited tilting in the vertical structure. Permutation testresults revealed that nearly the entire map (Figure 7(c)) isstatistically significant at distinguishing between RI and non-RI storm types.
For vorticity (Figure 8), both RI and non-RI cases showedstrong organization in the cluster composites around thestorm center. Vorticity at the 700 and 500 hPa levels hadhigher values of positive vorticity for the RI cases. At the700 hPa level, the RI cases revealed tighter gradients aroundthe storm center with approximately 16% higher valuesof positive vorticity for RI compared to non-RI, while at500 hPa, the RI cases were approximately 57%higher than thenon-RI cases, suggesting RI tropical cyclones were strength-ening 24 hours earlier. Relative vorticity at 200 hPa showedRI
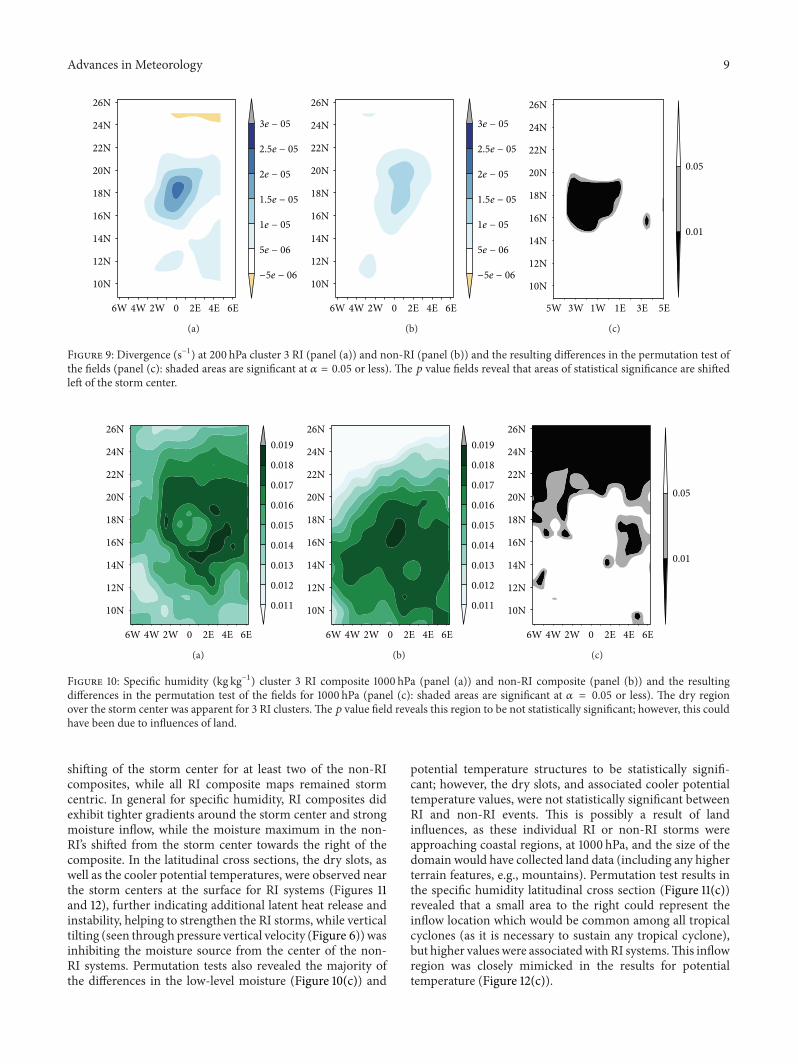
cases approximately 29% stronger than non-RI cases, whichwas also reflected in divergence at 200 hPa (Figure 9). Fordivergence at 200 hPa, the majority of the RI clusters had theoutflow positioned over the storm center and were approx-imately 50% stronger (for the majority) than the non-RIcomposites, where the outflow was positioned over the top-right section of the composites. In cases where non-RI valueswere comparable in divergence values, it was important tokeep in mind that the non-RI cases were not necessarilyweak tropical cyclones but were just not undergoing RI. Ingeneral, vorticity at 500 hPa showed the greatest distinctionbetween the two types of systems as the permutation results(Figure 8(c)) showed statistically significant regions in thecenter of the map, matching composite results. Regions of

8 Advances in Meteorology
26N
24N
22N
20N
18N
16N
14N
12N
10N
6W 4W 2W 0 2E 4E 6E
14
10
6
2
−2
−6
−10
(a)
26N
24N
22N
20N
18N
16N
14N
12N
10N
6W 4W 2W 0 2E 4E 6E
14
10
6
2
−2
−6
−10
(b)
5W 3W 1W 1E 3E 5E
0.05
0.01
26N
24N
22N
20N
18N
16N
14N
12N
10N
(c)
Figure 7: Vertical shear 200–850 (m s−1) cluster 3 RI composite (panel (a)) and non-RI composite (panel (b)) and the resulting differencesin the permutation test of the fields (panel (c): shaded areas are significant at 𝛼 = 0.05 or less). Shear present for non-RI composites and the𝑝 value field revealed this is statistically significant in distinguishing between RI and non-RI cases.
26N
24N
22N
20N
18N
16N
14N
12N
10N
6W 4W 2W 0 2E 4E 6E
9e − 05
7e − 05
5e − 05
3e − 05
1e − 05
−1e − 05
−3e − 05
(a)
26N
24N
22N
20N
18N
16N
14N
12N
10N
6W 4W 2W 0 2E 4E 6E
9e − 05
7e − 05
5e − 05
3e − 05
1e − 05
−1e − 05
−3e − 05
(b)
5W 3W 1W 1E 3E 5E
0.05
0.01
26N
24N
22N
20N
18N
16N
14N
12N
10N
(c)
Figure 8: Vorticity at 500 hPa (s−1) cluster 3 RI composite (panel (a)) and non-RI composite (panel (b)) and the resulting differences in thepermutation test of the fields (panel (c): shaded areas are significant at 𝛼 = 0.05 or less). Higher values of vorticity over storm center for RIsystems with the 𝑝 value field revealing where differences are strongest and statistically significant over this region.
statistical significance at 200 hPa also appeared over thecenter for relative vorticity, matching results found throughcomposite analysis, suggesting stronger values associatedwith RI events; however, divergence at this same level showeda shift in the area of statistical significance to the left ofthe storm center. While this could be a sign that divergenceis increasing 24 hours before RI, the shift could also berepresentative of the tilting of the vertical structure seenthrough pressure vertical velocity and vertical shear for thenon-RI cases (Figures 6 and 7).
Examining specific humidity at 1000 hPa (Figure 10)revealed a dry slot in the center of 3 of the 4 RI clusters,while only cluster 6 had the dry slot for the non-RI clusters.This was similar to the results for potential temperature at1000 hPa, where cooler centers for the same 3 of the 4 RIclusters were observed, with only cluster 6 for the non-RI
showing this feature. The RI storms were found to haveapproximately 18% more moisture at 1000 hPa than the non-RI storms, whereas maximum values for potential temper-ature were approximately the same for both RI and non-RIcases. The cooler center for the RI events, combined withthe increased moisture, suggests increased values of latentheat release and enhanced static instability, both aiding instrengthening of the storm. At 700 hPa, both the RI and non-RI clusters had about the same moisture content, as wellas potential temperature values being similar, and showedorganization around the storm center, where the highestvalues are over the storm center, and a steady inflow ofmoisture was present. At 500 hPa, the biggest differencein the moisture content was noticed, where RI cases hadapproximately 29% more moisture than non-RI cases andpotential temperature at this level was revealing notable
Advances in Meteorology 9
26N
24N
22N
20N
18N
16N
14N
12N
10N
6W 4W 2W 0 2E 4E 6E
3e − 05
2.5e − 05
2e − 05
1.5e − 05
1e − 05
5e − 06
−5e − 06
(a)
26N
24N
22N
20N
18N
16N
14N
12N
10N
6W 4W 2W 0 2E 4E 6E
3e − 05
2.5e − 05
2e − 05
1.5e − 05
1e − 05
5e − 06
−5e − 06
(b)
5W 3W 1W 1E 3E 5E
0.05
0.01
26N
24N
22N
20N
18N
16N
14N
12N
10N
(c)
Figure 9: Divergence (s−1) at 200 hPa cluster 3 RI (panel (a)) and non-RI (panel (b)) and the resulting differences in the permutation test ofthe fields (panel (c): shaded areas are significant at 𝛼 = 0.05 or less). The 𝑝 value fields reveal that areas of statistical significance are shiftedleft of the storm center.
26N
24N
22N
20N
18N
16N
14N
12N
10N
6W 4W 2W 0 2E 4E 6E
0.019
0.018
0.017
0.016
0.015
0.014
0.013
0.012
0.011
(a)
26N
24N
22N
20N
18N
16N
14N
12N
10N
6W 4W 2W 0 2E 4E 6E
0.019
0.018
0.017
0.016
0.015
0.014
0.013
0.012
0.011
(b)
26N
24N
22N
20N
18N
16N
14N
12N
10N
6W 4W 2W 0 2E 4E 6E
0.05
0.01
(c)
Figure 10: Specific humidity (kg kg−1) cluster 3 RI composite 1000 hPa (panel (a)) and non-RI composite (panel (b)) and the resultingdifferences in the permutation test of the fields for 1000 hPa (panel (c): shaded areas are significant at 𝛼 = 0.05 or less). The dry regionover the storm center was apparent for 3 RI clusters. The 𝑝 value field reveals this region to be not statistically significant; however, this couldhave been due to influences of land.
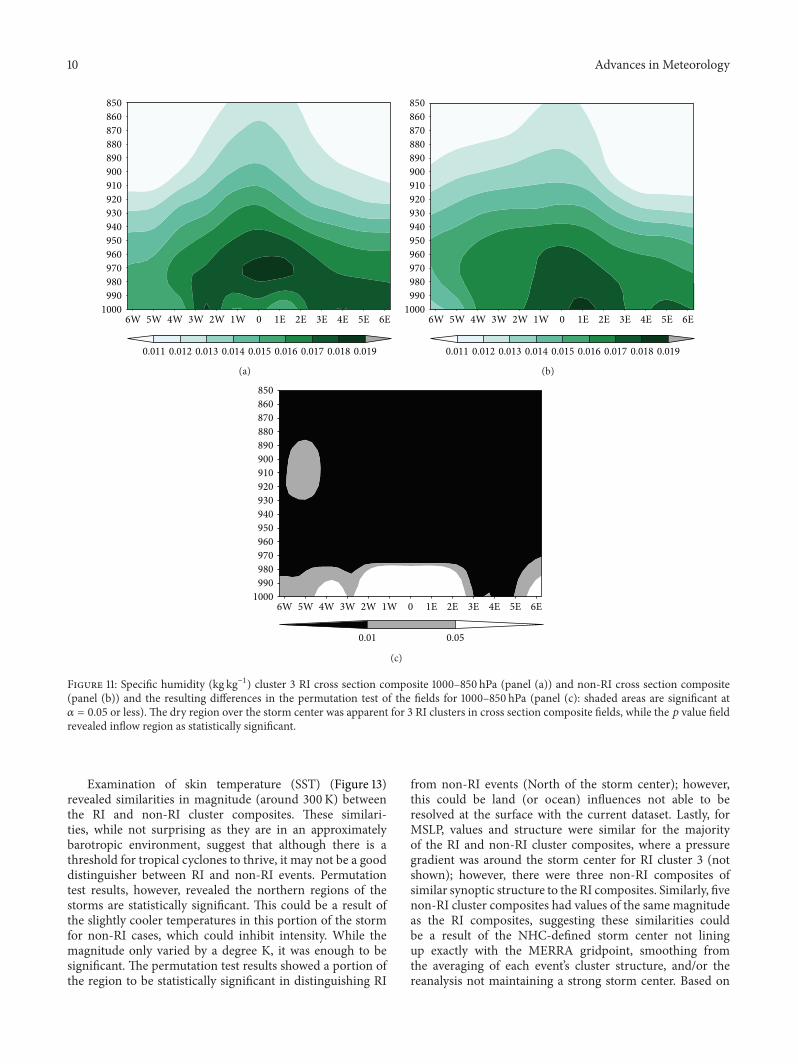
shifting of the storm center for at least two of the non-RIcomposites, while all RI composite maps remained stormcentric. In general for specific humidity, RI composites didexhibit tighter gradients around the storm center and strongmoisture inflow, while the moisture maximum in the non-RI’s shifted from the storm center towards the right of thecomposite. In the latitudinal cross sections, the dry slots, aswell as the cooler potential temperatures, were observed nearthe storm centers at the surface for RI systems (Figures 11and 12), further indicating additional latent heat release andinstability, helping to strengthen the RI storms, while verticaltilting (seen through pressure vertical velocity (Figure 6)) wasinhibiting the moisture source from the center of the non-RI systems. Permutation tests also revealed the majority ofthe differences in the low-level moisture (Figure 10(c)) and
potential temperature structures to be statistically signifi-cant; however, the dry slots, and associated cooler potentialtemperature values, were not statistically significant betweenRI and non-RI events. This is possibly a result of landinfluences, as these individual RI or non-RI storms wereapproaching coastal regions, at 1000 hPa, and the size of thedomain would have collected land data (including any higherterrain features, e.g., mountains). Permutation test results inthe specific humidity latitudinal cross section (Figure 11(c))revealed that a small area to the right could represent theinflow location which would be common among all tropicalcyclones (as it is necessary to sustain any tropical cyclone),but higher valueswere associatedwith RI systems.This inflowregion was closely mimicked in the results for potentialtemperature (Figure 12(c)).
10 Advances in Meteorology
6W 5W 4W 3W 2W 1W 0 1E 2E 3E 4E 5E 6E
850
860
870
880
890
900
910
920
930
940
950
960
970
980
990
1000
0.011 0.012 0.013 0.014 0.015 0.016 0.017 0.018 0.019
(a)
6W 5W 4W 3W 2W 1W 0 1E 2E 3E 4E 5E 6E
850
860
870
880
890
900
910
920
930
940
950
960
970
980
990
1000
0.011 0.012 0.013 0.014 0.015 0.016 0.017 0.018 0.019
(b)
6W 5W 4W 3W 2W 1W 0 1E 2E 3E 4E 5E 6E
850
860
870
880
890
900
910
920
930
940
950
960
970
980
990
1000
0.050.01
(c)
Figure 11: Specific humidity (kg kg−1) cluster 3 RI cross section composite 1000–850 hPa (panel (a)) and non-RI cross section composite(panel (b)) and the resulting differences in the permutation test of the fields for 1000–850 hPa (panel (c): shaded areas are significant at𝛼 = 0.05 or less). The dry region over the storm center was apparent for 3 RI clusters in cross section composite fields, while the 𝑝 value fieldrevealed inflow region as statistically significant.
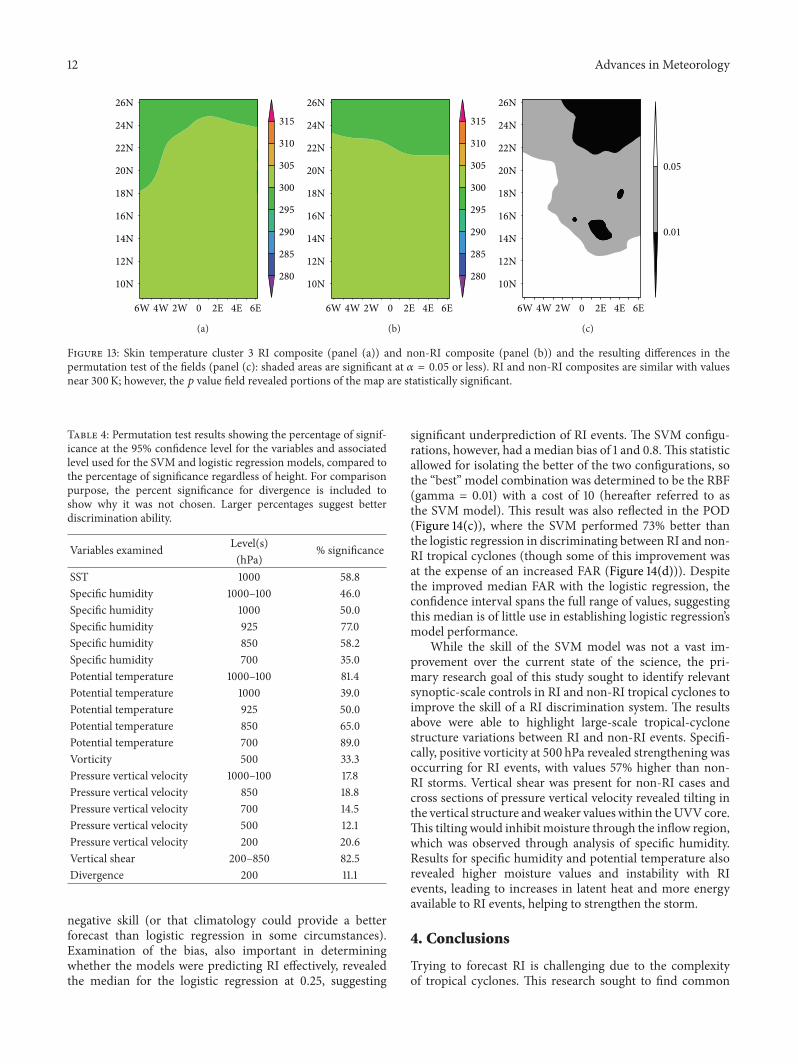
Examination of skin temperature (SST) (Figure 13)revealed similarities in magnitude (around 300K) betweenthe RI and non-RI cluster composites. These similari-ties, while not surprising as they are in an approximatelybarotropic environment, suggest that although there is athreshold for tropical cyclones to thrive, it may not be a gooddistinguisher between RI and non-RI events. Permutationtest results, however, revealed the northern regions of thestorms are statistically significant. This could be a result ofthe slightly cooler temperatures in this portion of the stormfor non-RI cases, which could inhibit intensity. While themagnitude only varied by a degree K, it was enough to besignificant. The permutation test results showed a portion ofthe region to be statistically significant in distinguishing RI
from non-RI events (North of the storm center); however,this could be land (or ocean) influences not able to beresolved at the surface with the current dataset. Lastly, forMSLP, values and structure were similar for the majorityof the RI and non-RI cluster composites, where a pressuregradient was around the storm center for RI cluster 3 (notshown); however, there were three non-RI composites ofsimilar synoptic structure to the RI composites. Similarly, fivenon-RI cluster composites had values of the same magnitudeas the RI composites, suggesting these similarities couldbe a result of the NHC-defined storm center not liningup exactly with the MERRA gridpoint, smoothing fromthe averaging of each event’s cluster structure, and/or thereanalysis not maintaining a strong storm center. Based on

Advances in Meteorology 11
6W 5W 4W 3W 2W 1W 0 1E 2E 3E 4E 5E 6E
850
860
870
880
890
900
910
920
930
940
950
960
970
980
990
1000
296 297 298 299 300 301 302 303
(a)
6W 5W 4W 3W 2W 1W 0 1E 2E 3E 4E 5E 6E
850
860
870
880
890
900
910
920
930
940
950
960
970
980
990
1000
296 297 298 299 300 301 302 303
(b)
6W 5W 4W 3W 2W 1W 0 1E 2E 3E 4E 5E 6E
850
860
870
880
890
900
910
920
930
940
950
960
970
980
990
1000
0.050.01
(c)
Figure 12: Potential temperature (K) cluster 3 RI cross section composite 1000–850 hPa (panel (a)) and non-RI cross section composite (panel(b)) and the resulting differences in the permutation test of the fields for 1000–850 hPa (panel (c): shaded areas are significant at 𝛼 = 0.05 orless). The lower values over the storm center were apparent for 3 RI clusters in cross section composite fields, while the 𝑝 value field revealedthe inflow region as statistically significant (aligning with the specific humidity field).
these results, permutation tests were not done for this varia-ble.
Upon analysis of the results of the composites and per-mutation tests, and considering previous literature, variablesused as predictors in the SVM algorithm and logistic regres-sion model were revealed. The variables believed to have hadthe best discrimination ability were vertical shear, potentialtemperature at 1000, 925, 850, and 700 hPa, pressure verticalvelocity at 850, 700, 500, and 200 hPa, specific humidityat 1000, 925, 850, and 700 hPa, and vorticity at 500 hPa.Table 4 shows the percent significance for each, compared tothe percent significance (where applicable) for each variableregardless of height.
3.2. Support Vector Machines. The results of phase 2 SVMcross-validation experiments identified a kernel-cost combi-nation that yielded the greatest overall discrimination ability.The confidence intervals on the HSS and bias statisticssuggested that the RBF using gamma value 0.01 and costsof 10 and 100 yielded the best discrimination capability(Figure 14). In particular, median HSS values for these SVMconfigurations were roughly 29% higher (0.3) against thelogistic regression (0.22). Further analysis of the lower HSSconfidence limits revealed that while the two best SVM con-figurations never produced negative skill (HSS), the logisticregression lower HSS confidence interval fell below zero(−0.03), suggesting that this configuration could produce
12 Advances in Meteorology
26N
24N
22N
20N
18N
16N
14N
12N
10N
6W 4W 2W 0 2E 4E 6E
315
310
305
300
295
290
285
280
(a)
26N
24N
22N
20N
18N
16N
14N
12N
10N
6W 4W 2W 0 2E 4E 6E
315
310
305
300
295
290
285
280
(b)
26N
24N
22N
20N
18N
16N
14N
12N
10N
6W 4W 2W 0 2E 4E 6E
0.05
0.01
(c)
Figure 13: Skin temperature cluster 3 RI composite (panel (a)) and non-RI composite (panel (b)) and the resulting differences in thepermutation test of the fields (panel (c): shaded areas are significant at 𝛼 = 0.05 or less). RI and non-RI composites are similar with valuesnear 300K; however, the 𝑝 value field revealed portions of the map are statistically significant.
Table 4: Permutation test results showing the percentage of signif-icance at the 95% confidence level for the variables and associatedlevel used for the SVM and logistic regression models, compared tothe percentage of significance regardless of height. For comparisonpurpose, the percent significance for divergence is included toshow why it was not chosen. Larger percentages suggest betterdiscrimination ability.
Variables examined Level(s) % significance(hPa)
SST 1000 58.8Specific humidity 1000–100 46.0Specific humidity 1000 50.0Specific humidity 925 77.0Specific humidity 850 58.2Specific humidity 700 35.0Potential temperature 1000–100 81.4Potential temperature 1000 39.0Potential temperature 925 50.0Potential temperature 850 65.0Potential temperature 700 89.0Vorticity 500 33.3Pressure vertical velocity 1000–100 17.8Pressure vertical velocity 850 18.8Pressure vertical velocity 700 14.5Pressure vertical velocity 500 12.1Pressure vertical velocity 200 20.6Vertical shear 200–850 82.5Divergence 200 11.1
negative skill (or that climatology could provide a betterforecast than logistic regression in some circumstances).Examination of the bias, also important in determiningwhether the models were predicting RI effectively, revealedthe median for the logistic regression at 0.25, suggesting
significant underprediction of RI events. The SVM configu-rations, however, had a median bias of 1 and 0.8.This statisticallowed for isolating the better of the two configurations, sothe “best” model combination was determined to be the RBF(gamma = 0.01) with a cost of 10 (hereafter referred to asthe SVM model). This result was also reflected in the POD(Figure 14(c)), where the SVM performed 73% better thanthe logistic regression in discriminating between RI and non-RI tropical cyclones (though some of this improvement wasat the expense of an increased FAR (Figure 14(d))). Despitethe improved median FAR with the logistic regression, theconfidence interval spans the full range of values, suggestingthis median is of little use in establishing logistic regression’smodel performance.
While the skill of the SVM model was not a vast im-provement over the current state of the science, the pri-mary research goal of this study sought to identify relevantsynoptic-scale controls in RI and non-RI tropical cyclones toimprove the skill of a RI discrimination system. The resultsabove were able to highlight large-scale tropical-cyclonestructure variations between RI and non-RI events. Specifi-cally, positive vorticity at 500 hPa revealed strengthening wasoccurring for RI events, with values 57% higher than non-RI storms. Vertical shear was present for non-RI cases andcross sections of pressure vertical velocity revealed tilting inthe vertical structure andweaker values within theUVV core.This tilting would inhibit moisture through the inflow region,which was observed through analysis of specific humidity.Results for specific humidity and potential temperature alsorevealed higher moisture values and instability with RIevents, leading to increases in latent heat and more energyavailable to RI events, helping to strengthen the storm.
4. Conclusions
Trying to forecast RI is challenging due to the complexityof tropical cyclones. This research sought to find common

Advances in Meteorology 13H
eidk
e ski
ll sc
ore
Logistic RBF 10 RBF 100
0.0
0.2
0.4
0.6
−0.2
(a)
Bias
Logistic RBF 10 RBF 100
0.0
0.5
1.0
1.5
2.0
(b)
Prob
abili
ty o
f det
ectio
n
Logistic RBF 10 RBF 100
0.0
0.2
0.4
0.6
0.8
1.0
(c)
False
alar
m ra
tio
Logistic RBF 10 RBF 100
0.0
0.2
0.4
0.6
0.8
1.0
(d)
Figure 14: Contingency statistic results for logistic regression and the top two performing SVM configurations. Panel (a) represents the HSS,panel (b) represents bias, panel (c) represents the POD, and panel (d) represents the FAR.
synoptic patterns that distinguish RI and non-RI eventsthrough spatial analysis and improve the diagnosis of theonset of RI using a SVM and logistic regression approach.While analyzing the composites, a few variables at differentpressure levels began to stand out. At the surface for a RIstorm, dry air over the storm center and lower values ofpotential temperature were a common feature.This result wasin contrast to previous research suggesting that small valuesof the innercore dry air predictor, having less dry air mixingdown to the surface, are favored by RI systems [9, 10].
Potential temperature values were comparable betweenthe RI and non-RI cases. However, at the surface, RI caseshad cooler values over the storm center compared to thenon-RI cases, indicating more static instability for the RIcases and thus more energy available. At the midlevels forthe RI cases, the composites for positive vorticity showedhigher values with tighter gradients over the storm center,
indicating a faster spin. The midlevels also revealed thatmaximum values of specific humidity shifted towards theright of the storm center for the non-RI cases, while RIcases remained storm centric. For divergence at the upperlevels, composites showed some of the RI cases to havestronger outflows than the non-RI. However, there were someinstances in which the non-RI cases also exhibited strongoutflows. Further examination of non-RI cases revealed ashift of divergence to the right of the storm center, while theRI cases remained storm centric. Vertical shear was presentfor a majority of the non-RI cases, and when looking atpressure vertical velocity, the shifting that was observed in themidlevels became apparent. All RI cases remained verticallystacked, while the majority of the non-RI cases were tilted.This is believed to be inhibiting the inflow of moisture andthe heat source which is needed to keep the storm going.RI cases, being vertically stacked, allow for the systems

14 Advances in Meteorology
to have full access to moisture, heat, and, thus, potentialenergy.
Permutation tests were also done on SST, specific humid-ity, potential temperature, vertical shear, pressure verticalvelocity, vorticity at 200 and 500 hPa, and divergence at200 hPa. The test provided the statistical significance to aidin identifying variables used in the statistical modeling ofRI and non-RI storms. The permutation test revealed thatpotential temperature and specific humidity were statisticallysignificant in the storm centers from 700 to 200 hPa. Atthe surface, however, the dry slots for specific humidity, aswell as the smaller values of potential temperature, were notstatistically significantwhen viewed in a cross section over thestorm center. Instead, the region just to the right of the stormcenter showed statistical significance for both variables. Thiswas not surprising as RI cases are receiving more moistureand heat through the inflow of the tropical cyclone. Vorticityshowed greater regions of statistical significance in the stormcenter at 500 hPa than in the upper levels at 200 hPa.This wasexpected since vorticity values were higher for RI cases overnon-RI cases. In general, differences between RI and non-RIcases would be most reflected in the midlevels, as vorticityis directly related to the radius of maximum winds, whichincreases with height for all tropical cyclones [27]. Whenlooking at the cross section for pressure vertical velocity, thepermutation test confirmed vertical stacking was statisticallysignificant in distinguishing the two types of cases. That is,over the storm centers, the RI’s and non-RI’s were not exhibit-ing the same UVVmagnitude. This makes sense consideringthat cluster composites revealed vertical shear present fornon-RI cases and permutation test results confirming thatit was statistically significant in distinguishing between RIand non-RI storm types. For divergence at 200 hPa, theareas of statistical significance were to the left of the stormcenter. This region is where it is thought that the outflow isbeginning to strengthen for the RI tropical cyclones but hasnot fully reached the maximum potential yet due to eyewallreplacement processes [27]. Lastly, SST composite analysisshowed similar values between RI and non-RI events, withcooler SSTs in the northern portions for non-RI cases. Thiscould inhibit intensity growth. The permutation test resultsshowed areas to be statistically significant in distinguishingRI from non-RI events (North of the storm center). However,this could have been a result of land influences or possiblythe ocean status under a tropical cyclone heavily distorted byheavy precipitation [27].
Ultimately, potential temperature and specific humidityat the surface, vorticity at the midlevels, vertical shear, andpressure vertical velocity were used as prediction variablesin two prediction algorithms (logistic regression and SVMclassification).
Based on the results of the cluster analysis and permu-tation test results, there is a distinct difference synopticallybetween RI and non-RI tropical cyclones. While the resultsof the classification models were not fully resolving thesedifferences, the SVM model was able to outperform thelogistic regression model, yielding a 29% improvement inskill. The SVM model also has the added advantage of beinga learning method and improving with additional training.
More research is needed in this area to further improveforecasting of RI. For this study alone, the different variablesat different levels could still be utilized as predictors withinthe SVM model. For example, divergence at 200 hPa wasstronger in some cases and showed statistical significance(Table 4) between RI and non-RI events but was not usedin the model. Other shortcomings of this study are theuse of all tropical-cyclone data regardless of landfall. Futurework should consider not only how this may influence thepermutation test results at the surface, but also whether theremainder of the environment was affected. Other types ofvariables also should be examined. While this study specif-ically focused on synoptic-scale variables, tropical cyclonesare complex in that they are driven by both dynamic andthermodynamic processes but are also influenced by thesurrounding environment. Analyses of other processes wouldbe something to consider in future work. Finally, this workwas done in a diagnostic mode and would need to bereformulated for forecast applications.
While there were shortcomings in this research, overallthe SVM model’s skill, using synoptic-scale variables aspredictors, did outperform a logistic regression model. UsingSVM, or any artificial intelligence technique, would onlyimprove with more data input into the system. Therefore,these techniques are thought to be an improvement overthe currently implemented regression models and futureresearch should continue to focus on their improvement forforecasting. The next step would be to try to reformulatethe composite fields of relevant diagnostic variables for RIprocesses from numerical model guidance output at varyinglead times.This would again allow for identification of whichvariables are important for the prediction of RI. Additionally,focusing on regions where permutation tests were significant(i.e., retaining only significant gridpoints from the compositeanalysis as predictors) may improve the forecast skill further.Implementing other artificial intelligence techniques, such asrandom forests and neural networks, to improve AI-basedmodeling for RI would also be a logical next step. The resultsof such work could be the solution for prediction of RI inthe Atlantic Basin and help to solve the daunting problem offorecasting these potentially devastating systems.
Conflict of Interests
The authors declare that there is no conflict of interestsregarding the publication of this paper.
Acknowledgments
The authors would like to thank Dr. Jamie Dyer for his inputin tropical meteorology and Dr. P. Grady Dixon for his inputin meteorological processes as a whole.This material is basedupon work supported by the National Science FoundationunderGrant no. DGE-0947419 atMississippi StateUniversity.Any opinions, findings, and conclusions or recommendationsexpressed in this material are those of the authors and donot necessarily reflect the views of the National ScienceFoundation.
Advances in Meteorology 15
References
[1] K. Park, X. Zou, and G. Li, “A numerical study on rapid intensi-fication of Hurricane Charley (2004) near landfall,” Frontiers ofEarth Science in China, vol. 3, no. 4, pp. 457–470, 2009.
[2] R. L. Elsberry, T. D. B. Lambert, and M. A. Boothe, “Accuracyof Atlantic and Eastern North Pacific tropical cyclone intensityforecast guidance,” Weather and Forecasting, vol. 22, no. 4, pp.747–762, 2007.
[3] J. Kaplan, M. DeMaria, and J. A. Knaff, “A revised tropicalcyclone rapid intensification index for the Atlantic and easternNorth Pacific basins,”Weather and Forecasting, vol. 25, no. 1, pp.220–241, 2010.
[4] J. Kaplan,M. Kaplan, C. R. Sampson, J. Kossin, C. S. Velden, andM. DeMaria, “Improvements to the SHIPS rapid intensificationindex,” JHT Final Report, 2013, http://www.nhc.noaa.gov/jht/11-13reports/Final Kaplan JHT13.pdf.
[5] C.M.Rozoff and J. P. Kossin, “NewProbabilistic forecastmodelsfor the prediction of tropical cyclone rapid intensification,”Weather and Forecasting, vol. 26, no. 5, pp. 677–689, 2011.
[6] C. R. Holliday and A. H. Thompson, “Climatological char-acteristics of rapidly intensifying typhoons,” Monthly WeatherReview, vol. 107, no. 8, pp. 1022–1034, 1979.
[7] H. Chen and D.-L. Zhang, “On the rapid intensification ofHurricane Wilma (2005). Part II. Convective bursts and theupper-level warm core,” Journal of the Atmospheric Sciences, vol.70, no. 1, pp. 146–162, 2013.
[8] M. DeMaria, M. Mainelli, L. K. Shay, J. A. Knaff, and J. Kaplan,“Further improvements to the Statistical Hurricane IntensityPrediction Scheme (SHIPS),” Weather and Forecasting, vol. 20,no. 4, pp. 531–543, 2005.
[9] J. Kaplan and M. DeMaria, “Large-scale characteristics ofrapidly intensifying tropical cyclones in the North Atlanticbasin,” Weather and Forecasting, vol. 18, no. 6, pp. 1093–1108,2003.
[10] J. Kaplan,M.DeMaria, J. Cione et al., “Improvement in the rapidintensity index by incorporation of inner core information,”JHT Final Report, 2011, http://www.nhc.noaa.gov/jht/09-11re-ports/final Kaplan JHT11.pdf.
[11] C. R. Sampson, J. Kaplan, J. A. Knaff, M. DeMaria, and C. A.Sisko, “A deterministic rapid intensification aid,” Weather andForecasting, vol. 26, no. 4, pp. 579–585, 2011.
[12] M. DeMaria and J. Kaplan, “An updated Statistical HurricaneIntensity Prediction Scheme (SHIPS) for the Atlantic andeastern North Pacific basins,” Weather and Forecasting, vol. 14,no. 3, pp. 326–337, 1999.
[13] S. Gao and L. S. Chiu, “Surface latent heat flux and rainfallassociated with rapidly intensifying tropical cyclones over thewestern North Pacific,” International Journal of Remote Sensing,vol. 31, no. 17, pp. 4699–4710, 2010.
[14] N. Cristianini and J. Shawe-Taylor, An Introduction to SupportVector Machines and Other Kernel-Based Learning Methods,Cambridge University Press, Cambridge, UK, 2000.
[15] B. R. Jarvinen, C. J. Neuman, and M. A. S. Davis, “A tropicalcyclone data tape for the North Atlantic Basin, 1886–1983:contents, limitations, and uses,” NOAA Technical MemorandaNWS NHC 22, 1988.
[16] M.M. Rienecker,M. J. Suarez, R. Gelaro et al., “MERRA:NASA’smodern-era retrospective analysis for research and applica-tions,” Journal of Climate, vol. 24, no. 14, pp. 3624–3648, 2011.
[17] P. G. Dixon, A. E. Mercer, J. Choi, and J. S. Allen, “Tornado riskanalysis: is Dixie Alley an extension of Tornado Alley?” Bulletin
of the American Meteorological Society, vol. 92, no. 4, pp. 433–441, 2011.
[18] A. E. Mercer and J. Dyer, “Identification of synoptic-scalehurricane intensification factors using advanced statistics,” inProceedings of the Northern Gulf Institute Annual Conference,Mobile, Ala, USA, 2011.
[19] B. Efron, “Better bootstrap confidence intervals,” Journal of theAmerican Statistical Association, vol. 82, no. 397, pp. 171–200,1987.
[20] M. Sitkowski and G. M. Barnes, “Low-level thermodynamic,kinematic, and reflectivity fields of hurricane Guillermo (1997)during rapid intensification,”Monthly Weather Review, vol. 137,no. 2, pp. 645–663, 2009.
[21] J. L. Vigh and W. H. Schubert, “Rapid development of thetropical cyclonewarm core,” Journal of the Atmospheric Sciences,vol. 66, no. 11, pp. 3335–3350, 2009.
[22] E. D. Rappin, M. C. Morgan, and G. J. Tripoli, “The impactof outflow environment on tropical cyclone intensification andstructure,” Journal of the Atmospheric Sciences, vol. 68, no. 2, pp.177–194, 2011.
[23] S. Shu, J. Ming, and P. Chi, “Large-scale characteristics andprobability of rapidly intensifying tropical cyclones in thewestern North Pacific Basin,” Weather and Forecasting, vol. 27,no. 2, pp. 411–423, 2012.
[24] J. L. Evans, “Sensitivity of tropical cyclone intensity to seasurface temperature,” Journal of Climate, vol. 6, no. 6, pp. 1133–1140, 1993.
[25] M. Demaria and J. Kaplan, “Sea surface temperature and themaximum intensity of Atlantic tropical cyclones,” Journal ofClimate, vol. 7, no. 9, pp. 1324–1334, 1994.
[26] M. DeMaria, “The effect of vertical shear on tropical cycloneintensity change,” Journal of the Atmospheric Sciences, vol. 53,no. 14, pp. 2076–2087, 1996.
[27] Y. Wang and C. C. Wu, “Current understanding of tropicalcyclone structure and intensity changes—a review,”Meteorologyand Atmospheric Physics, vol. 87, no. 4, pp. 257–278, 2004.
[28] R. Rogers, “Convective-scale structure and evolution during ahigh-resolution simulation of tropical cyclone rapid intensifi-cation,” Journal of the Atmospheric Sciences, vol. 67, no. 1, pp.44–70, 2010.
[29] A. Simon, T. N. Krishnamurti, R. Ross, and A. Martin, “Rela-tionship of rapid intensification of tropical cyclones to dynami-cal/thermodynamical parameters,”Marine Geodesy, vol. 33, no.4, pp. 378–393, 2010.
[30] A. E. Mercer and J. L. Dyer, “Physical assessment of hurricanerapid intensification using kernel principal component analy-sis,” NWA Newsletter, vol. 12, 2 pages, 2012.
[31] R. K. Smith and M. T. Montgomery, “How important is theisothermal expansion effect in elevating equivalent potentialtemperature in the hurricane inner core?” Quarterly Journal ofthe Royal Meteorological Society, vol. 139, no. 670, pp. 70–74,2013.
[32] R. T. Merrill, “Environmental influences on hurricane intensi-fication,” Journal of the Atmospheric Sciences, vol. 45, no. 11, pp.1678–1687, 1988.
[33] M. Demaria and J. Kaplan, “A statistical hurricane intensityprediction scheme (SHIPS) for the Atlantic Basin,” Weather &Forecasting, vol. 9, no. 2, pp. 209–220, 1994.
[34] J. Molinari and D. Vollaro, “External influences on hurricaneintensity. Part II. Vertical structure and response of the hur-ricane vortex,” Journal of the Atmospheric Sciences, vol. 52, pp.3593–3606, 1990.

16 Advances in Meteorology
[35] S. L. Barnes, “A technique for maximizing details in numericalweathermap analysis,” Journal of AppliedMeteorology, vol. 3, no.4, pp. 396–409, 1964.
[36] M. B. Richman, “Rotation of principal components,” Journal ofClimatology, vol. 6, no. 3, pp. 293–335, 1986.
[37] A. E. Mercer, C. M. Shafer, C. A. Doswell, L. M. Leslie, and M.B. Richman, “Synoptic composites of tornadic and nontornadicoutbreaks,” Monthly Weather Review, vol. 140, no. 8, pp. 2590–2608, 2012.
[38] D. S. Wilks, Statistical Methods in the Atmospheric Sciences,Academic Press, New York, NY, USA, 2011.
[39] A. E. Mercer, C. M. Shafer, C. A. Doswell III, L. M. Leslie, andM. B. Richman, “Objective classification of tornadic and non-tornadic severe weather outbreaks,” Monthly Weather Review,vol. 137, no. 12, pp. 4355–4368, 2009.
[40] C. M. Shafer, A. E. Mercer, L. M. Leslie, M. B. Richman, andC. A. Doswell III, “Evaluation of WRF model simulations oftornadic andnontornadic outbreaks occurring in the spring andfall,” Monthly Weather Review, vol. 138, no. 11, pp. 4098–4119,2010.
[41] B. Efron and R. J. Tibshirani, An Introduction to the Bootstrap,vol. 57, Chapman and Hall/CRC, 1993.
[42] S. T. Buckland, K. P. Burnham, and N. H. Augustin, “Model se-lection: an integral part of inference,” Biometrics, vol. 53, no. 2,pp. 603–618, 1997.

Submit your manuscripts athttp://www.hindawi.com
Hindawi Publishing Corporationhttp://www.hindawi.com Volume 2014
ClimatologyJournal of
EcologyInternational Journal of
Hindawi Publishing Corporationhttp://www.hindawi.com Volume 2014
EarthquakesJournal of
Hindawi Publishing Corporationhttp://www.hindawi.com Volume 2014
Hindawi Publishing Corporationhttp://www.hindawi.com
Applied &EnvironmentalSoil Science
Volume 2014
Mining
Hindawi Publishing Corporationhttp://www.hindawi.com Volume 2014
Journal of
Hindawi Publishing Corporation http://www.hindawi.com Volume 2014
International Journal of
Geophysics
OceanographyInternational Journal of
Hindawi Publishing Corporationhttp://www.hindawi.com Volume 2014
Journal of Computational Environmental SciencesHindawi Publishing Corporationhttp://www.hindawi.com Volume 2014
Journal ofPetroleum Engineering
Hindawi Publishing Corporationhttp://www.hindawi.com Volume 2014
GeochemistryHindawi Publishing Corporationhttp://www.hindawi.com Volume 2014
Journal of
Atmospheric SciencesInternational Journal of
Hindawi Publishing Corporationhttp://www.hindawi.com Volume 2014
OceanographyHindawi Publishing Corporationhttp://www.hindawi.com Volume 2014
Advances in
Hindawi Publishing Corporationhttp://www.hindawi.com Volume 2014
MineralogyInternational Journal of
Hindawi Publishing Corporationhttp://www.hindawi.com Volume 2014
MeteorologyAdvances in
The Scientific World JournalHindawi Publishing Corporation http://www.hindawi.com Volume 2014
Paleontology JournalHindawi Publishing Corporationhttp://www.hindawi.com Volume 2014
ScientificaHindawi Publishing Corporationhttp://www.hindawi.com Volume 2014
Hindawi Publishing Corporationhttp://www.hindawi.com Volume 2014
Geological ResearchJournal of
Hindawi Publishing Corporationhttp://www.hindawi.com Volume 2014
Geology Advances in