research article tree species diversity, richness,...
TRANSCRIPT

Research ArticleTree Species Diversity Richness and Similarity in Intact andDegraded Forest in the Tropical Rainforest of the CongoBasin Case of the Forest of Likouala in the Republic of Congo
Suspense Averti Ifo1 Jean-Marie Moutsambote2 Feacutelix Koubouana2 Joseph Yoka3
Saint Feacutedriche Ndzai2 Leslie Nucia Orcellie Bouetou-Kadilamio3 Helischa Mampouya2
Charlotte Jourdain4 Yannick Bocko3 Alima Brigitte Mantota2 Mackline Mbemba2
Dulsaint Mouanga-Sokath2 Roland Odende2 Lenguiya Romarick Mondzali2
Yeto Emmanuel Mampouya Wenina2 Brice Cheacuterubins Ouissika2 and Loumeto Jean Joel3
1ENS Departement de Sciences et Vie de la terre Universite Marien Ngouabi BP 69 Brazzaville Congo2ENSAF Laboratoire drsquoEcologie Appliquee Universite Marien Ngouabi BP 69 Brazzaville Congo3Faculte des Sciences Departement de Biologie et Physiologie Vegetales Universite Marien Ngouabi Brazzaville Congo4Via Costantino Beltrami 2 00154 Roma Italy
Correspondence should be addressed to Suspense Averti Ifo ifosuspensehotmailfr
Received 11 December 2015 Revised 24 April 2016 Accepted 30 May 2016
Academic Editor Timothy Martin
Copyright copy 2016 Suspense Averti Ifo et al This is an open access article distributed under the Creative Commons AttributionLicense which permits unrestricted use distribution and reproduction in any medium provided the original work is properlycited
Trees species diversity richness and similarity were studied in fifteen plots of the tropical rainforests in the northeast of the Republicof Congo based on trees inventories conducted on fifteen 025 ha plots installed along different types of forests developed on terrafirma seasonally flooded and on flooded terra In all of the plots installed all trees with diameter at breast height DBHge 5 cm weremeasured The Shannon diversity index species richness equitability and species dominance were computed to see the variationin tree community among plots but also between primary forest and secondary forest A total of 1611 trees representing 114 speciesand 35 families were recorded from a total area of 375 ha Euphorbiaceae was the dominant family in the forest with 12 speciesfollowed by Fabaceae-Mimosoideae (10 species) and Phyllanthaceae (6 species) and Guttiferae (6 species) The biodiversity did notvary greatly from plot to plot on the whole of the study area (375 ha) The low value of Shannon index was obtained in plot 11(1198671015840 = 075) whereas the highest value was obtained in plot 12 (1198671015840 = 446) The values of this index vary from 023 to 095 in plotsP11 and P15 respectively Results obtained revealed high biodiversity of trees of the forest of Impfondo-Dongou The informationon tree species structure and function can provide baseline information for conservation of the biodiversity of the tropical forestin this area
1 Introduction
Tropical forests are the subject of several studies to betterunderstand the role they could play in sustainable develop-ment climate change and floristic biodiversity [1 2] Tropicalforests provide many goods and ecosystem services suchas prevention of soil erosion and preservation of habitatsfor plants and animals [3] Globally 52 of the total forestsare in tropical regions and they are known to be the most
important areas in terms of biodiversity [2 4] This diversityis an indicator that allows appreciating links between therichness and the abundance of individualsrsquo trees it reflectsthe degree of heterogeneity or stability of vegetation [5] Inthe Republic of Congo (RoC) according to the definition ofthe forest forests cover 69 of the territory [6] Sustainablemanagement of these forests requires a good knowledgeof all the natural forest resource this knowledge could bereliable only through studies of the forest environment
Hindawi Publishing CorporationInternational Journal of Forestry ResearchVolume 2016 Article ID 7593681 12 pageshttpdxdoiorg10115520167593681
2 International Journal of Forestry Research
Vegetationrsquos studies led to either conducting a physiognomicresearch of the architectural type or identifying a numberof representative reporting vegetation parameters allowingdefining simply in order to compare it to other vegetation(Lescure 1985) For the present study the second approachwas used that of the floristic and structural parameters
Many tropical forests are under great anthropogenicpressure and require management interventions to maintainthe overall biodiversity productivity and sustainability [7]Understanding tree composition and structure of forest is avital instrument in assessing the sustainability of the forestspecies conservation and management of forest ecosystems[8] Long-term biodiversity conservation depends basicallyon the knowledge of the structure species richness and theecological characteristics of vegetation
Some studies on the knowledge of the plant resourcewere conducted in Republic of Congo ([9ndash14] for the massifof Mayombe [15]) but these studies remained generallypiecemeal and predominantly localized inner protected areasand logging forest concessions These studies were related tothe ethnobotanical aspects and general knowledge of the floraof the Republic of Congo And most of these studies weredone essentially in the south of Republic of Congo and justone in the centre-west of our country This work will providemore information on the tropical forest of Likouala RoCThe aims of this research paper are to identify and quantifytree forest species of the tropical rainforest of Likouaka andspecific objectives are (i) a floristic analysis of the forest ofthe axis Impfondo-Dongou Likouala (ii) analysis of floristicheterogeneity between interforest plots
The study area is located within the Likouala departmentwhich is of the most important forest regions in Republic ofCongo
2 Material and Methods
21 Study Area The study was carried out within the tropicalrainforest of the North of Congo Brazzaville in the depart-ment of Likouala (Figure 1) The zone of study covers atotal surface of 155274 ha It lies between 1∘271015840528510158401015840 and2∘61015840557610158401015840 of northern latitude and between 17∘521015840350410158401015840 and18∘041015840326510158401015840 of longitude
The climate of the study area is of equatorial type Meanrainfall is of 1760mmyminus1 with a dry season from Decemberto January and a long wet season from March to November(Figure 2) In the Dongou district the soil cover is of tertiaryclay sandy formation and a quaternary alluvial formationto the east The soils derived from there are impoverishedferrilitic brown-red clay-sand soils on the Western plateauferralitichydromorphic alluvial soils on alluvial terraces andwaterlogged peat soils in flooded areas This area has oneof the very low densities of human population (093 kmminus2)of the Republic of Congo The forest of Likouala contains ahigh diversity of trees and plants [16] In the Dongou districtthe forests of the study area are rainforest The principalvegetation types are partially deciduous dense rainforestsof Ulmaceae and Sterculiaceae swampy flooded forest ofUapaca heudelotii and forest of Guibourtia demeusei [17]Tree canopy closure of the forest varies from 93 to 100
Table 1 Distribution of number of plots inside each type of forest
Type offorest Plots Number of trees Density (nha) G (m2ha)
DF1P1 67 268 675P2 73 312 911P3 212 848 3424P11 217 868 2673
PF2
P5 115 460 2306P6 103 412 2588P7 64 256 3637P8 70 280 3080P9 36 144 1601P10 115 460 2920P4 133 532 3638P12 132 528 2951P13 162 648 3554P14 121 484 2160
AF3 P15 51 204 36521 degraded forest 2 primary forest 3 agroforestry
while the tree height varies from 30m to above 45m (owndata)
22 Data Collection The tree sampling for the data collectionwas performed in 15 plots of 50m times 50m each placedin different forest strata of the study area primary forestsecondary forest and a mosaic of primary and secondaryforest (Figure 3) Table 1 indicates the distribution of plotson the extent of the zone of study The plot of intact forestsand degraded forests inventoried was selected after imageprocessing Landsat (OLI 8) of the study area CoordinatesGPS of the zones chosen on the satellite images were recordedin a GPS and on the ground we used the function Gototo go towards the points selected for the installation of theplot of inventories The ground data allowed validating theclassification of different type of forest in primary forest andsecondary or degraded forest but also of the forest agro plotFour plots fell into the zone from forest degraded ten plots fellin the primary forest and 1 plot fell into an agro drill forest
GPS points of all plots were recorded and inside each plotall living trees with diameter at breast height (DBH) ge 5 cmwere recorded by species using latest botanical classificationAll tree species were assigned to families and relative diversity(number of species in a family) was obtained for tree speciesdiversity classification
23 Measuring Biodiversity We apply the Shannon diversityindex (1198671015840) as a measure of species abundance and richness toquantify diversity of the woody speciesThis index takes bothspecies abundance and species richness into account
1198671015840= minus
119904
sum
119894=1
119901119894ln119901119894 (1)
International Journal of Forestry Research 3
VillagesDistrictChef lieu de deacutepartementZone drsquoeacutetudePlan drsquoeauReacuteseau routier
0 5 10 15
(km)
2∘09984000998400998400N
1∘50
9984000998400998400N
1∘40
9984000998400998400N
1∘30
9984000998400998400N
2∘09984000998400998400N
1∘50
9984000998400998400N
1∘40
9984000998400998400N
1∘30
9984000998400998400N
18∘09984000998400998400E 18
∘10
9984000998400998400E
18∘09984000998400998400E 18
∘10
9984000998400998400E
0 50 100 150 200 250(km) Deacutepartment de la Likouala
Autres deacutepartments
N
Zone drsquoeacutetude
Figure 1 Localization of the department of Likouala Congo Brazzaville
where 119904 equals the number of species and 119901119894equals the ratio
of individuals of species 119894 divided by all individuals 119873 of allspeciesThe Shannon diversity index ranges typically from 15to 35 and rarely reaches 45 [18]
The variance of1198671015840 is calculated by
var1198671015840 =sum119901119894(ln119901119894)2
minus (sum119901119894ln119901119894)2
119873+119904 minus 1
21198732
(2)
4 International Journal of Forestry Research
020406080100120140160180200220
0102030405060708090
100
Janu
ary
Febr
uary
Mar
ch
April
May
June July
Augu
st
Sept
embe
r
Oct
ober
Nov
embe
r
Dec
embe
r
Rainfall (mm)
Rain
fall
(mm
)
Tem
pera
ture
(∘C)
Temperature (∘C)
Figure 2 Ombrothermic diagram of Likouala (data from 1932 to2015) ANAC Congo
Villages
RoutesLimite de la zone
PlantationSavaneHabitatBande sable
PK13
Nkoko
DjembaMozaka
BokataBobala
Kanana
Dongou
Motaba
Moyitou
Ngounda
Kombola
Bonzale
Impfondo
Moungouma
Bondomaka
8200
0082
0000
8250
0082
5000
8300
0083
0000
8350
0083
5000
8400
0084
0000
8450
0084
5000
8500
0085
0000
8550
0085
5000
8600
0086
0000
8650
0086
5000
170000 170000
180000 180000
190000 190000
200000 200000
210000 210000
220000 220000
230000 230000N
0 6 12(km)
1260 633
Occupation du sol
District
Plan drsquoeau
Cultures et jachegraveres
Forecirct primaireForecirct deacutegradeacutee
Figure 3 Cartography of land use change inside studyrsquos area
and a 119905-statistic to test the significant differences between twoplots or samples as
119905 =1198671015840
1minus 1198671015840
2
radicvar11986710158401+ var1198671015840
2
(3)
where1198671015840 is the Shannon diversity index of sample 119895Degrees of freedom for this test are equal to
df =(var1198671015840
1+ var1198671015840
2)2
(var11986710158401)2
1198731+ (var1198671015840
2)2
1198732
(4)
where1198731and119873
2are the number of individuals in samples 1
and 2 respectively [19]We have also considered the Simpsonindex (119863) a measure of species dominance and the Shannondiversity index (119864) a measure of evenness of spread
The Simpson index is defined as
119863 =
119904
sum
119894=1
(119899119894(119899119894minus 1)
119873 (119873 minus 1)) (5)
where 119899119894is the number of individuals in the 119894th species and
119873 equals the total number of individuals As biodiversityincreases the Simpson index decreases Therefore to get aclear picture of species dominance we used1198631015840 = 1 minus 119863
The Shannon-Wiener index is defined as
119864 =1198671015840
119867max=minussum119904
119894=1119901119894ln119901119894
ln 119904 (6)
1198671015840
max is the natural logarithmof the total number of species Avalue for evenness approaching zero reflects large differencesin abundance of species whereas an evenness of one meansall species are equally abundant
Margalef rsquo Index (119889) = (119878 minus 1)ln (119873) (7)
where 119878 is the total number of species ldquo119873rdquo is the number ofindividuals and ldquolnrdquo is the natural logarithm
24 Similarity The Jaccard index was used to calculatesimilarities of species between the forest types in differentforest fragments These coefficients are used to measure theassociation between samples The similarity of two samples(floristic sample) is based on the presence or absence ofcertain species in the two samples [20] To study the similarityof our different floristic samples we used two binary factorsexcluding the double zeros that is the coefficient of Sorensen(119870) and the coefficient of Jaccard (119878)The Sorensen coefficientprovides a twice higher weight to double presence we canconsider the presence of amore informative than this absence[20]
119878 () = (119886 times 100)(119886 + 119887 + 119888)
119870 () = (2119886 times 100)(2119886 + 119887 + 119888)
(8)
International Journal of Forestry Research 5
Table 2 Floristic lists and their frequencies of the study area
Family Scientific name Number of species Number of treesAchariaceae Caloncoba welwitschii (Oliv) Gilg 1 9
Anacardiaceae Pseudospondias microcarpa (A Rich) Engl 2 14Trichoscypha acuminata Engl
Annonaceae Anonidium mannii (Oliv) Engl amp Diels 2 19Monodora angolensisWelw
Apocynaceae Alstonia boonei DeWild 1 1Aptandraceae Ongokea gore (Hua) Pierre 1 1Bignoniaceae Markhamia tomentosa (Benth) K 1 1Burseraceae Dacryodes pubescens (Verm) Lam 1 3Cannabaceae Celtis adolfi-friderici Engl 1 12
Chrysobalanaceae
Parinari congensis F Didr
4 32Parinari congolana T Durand et H DurandParinari excelsa SabineMaranthes glabra (Oliv)
Combretaceae Terminalia superba Engl et Diels 1 3
Ebenaceae Diospyros crassifloraHiern 2 47Diospyros ituriensis (Gurke) R Let et F White
Euphorbiaceae
Cleistanthus itsogohensis Pellegr
12 239
Croton haumanianus J LeonardDichostemma glaucescens Pierre
Grossera macrantha PaxMacaranga barteriMull-Arg
Macaranga monandraMull-ArgMacaranga schweinfurthii PaxMacaranga spinosaMull-Arg
Plagiostyles africana (Mull-Arg) PrainRicinodendron heudelotii (Baill) Pierre ex Pax
Sapium ellipticum (Hochst) PaxTetrorchidium didymostemom (Baill) Pax amp K Hoffm
Fabaceae-Caesalpinioideae
Copaifera salikoundaHeckel
5 116Daniellia pynaertii DeWildDialum pachyphyllum Harms
Guibourtia demeusei (Harms) LeonSwartzia Bobgunnia fistuloides (Harms) GH Kirkpr
Fabaceae-Faboideae
Angylocalyx pynaertii DeWild
4 123Baphia dewevrei DeWildMillettia sanaganaHarmsPterocarpus soyauxii Taub
Fabaceae-Mimosoideae
Albizia ferruginea (Guill amp Perr) Benth
10 58
Albizia laurentii DeWildCathormion rhombifolium (Benth) Hutch amp Dandy (syn Albizia
rhombifolia Benth)Albizia zygia (DC) J F Macbr
Newtonia devredii G C C Gilbert
6 International Journal of Forestry Research
Table 2 Continued
Family Scientific name Number of species Number of trees
Parkia filicoideaWelw ex OlivParkia bicolor A Chev
Pentaclethra macrophylla BenthPiptadeniastrum africanum (Hook F) Bren
Tetrapleura tetraptera (Schum ampThonn) Taub
Guttifereae
Allanblackia floribunda Oliv
6 55
Garcinia punctata OlivGarcinia ovalifolia OlivMammea africana SabineSymphonia globulifera L fGarcinia smeathmannii Oliv
IrvingiaceaeIrvingia excelsa
3 16Irvingia grandifolia (Engl) EnglKlainedoxa gabonensis Pierre ex Engl
Lamiaceae-Viticoideae Vitex pachyphylla Bak 1 8Lauraceae Persea americana L 1 1
Lecythidaceae Petersianthus macrocarpus (P Beauv) Liben 2 63Brazzeia congensis Baill
Malvaceae-Sterculioideae Cola nitida (Vent) Schott amp Endl 1 2Malvaceae-Tilioideae Duboscia macrocarpa Brocq 1 8
Meliaceae
Carapa procera var palustre DC
5 46Carapa procera var procera DC
Entandrophragma cylindricum (Sprague) SpragueTrichilia monadelpha (Thonn) J J De Wild
Trichilia tessmannii Harms
Moraceae
Antiaris toxicaria var welwitschii Lesch
5 17Ficus exasperata Vahl
Ficus vogeliana (Miq) MiqMilicia excelsa (Welw) C C BergTrilepisium madagascariense DC
MyristicaceaeCoelocaryon preussiiWarb
3 226Pycnanthus angolensis (Welv) ExellStaudtia kamerounensisWarb var gabonensis Fouilloy
Ochnaceae Lophira alata Banks ex Gaertn 2 14Rhabdophyllum welwitschii Van Tiegh
OlacaceaeHeisteria parvifolia Smith
3 52Strombosia grandifolia Hoof FStrombosia pustulata Oliv
Pandaceae Panda oleosa Pierre 1 6Passifloraceae Barteria fistulosaMast 1 1
Putranjivaceae Drypetes pellegrini Leandri 2 7Drypetes leonensis (Pax) Pax et K Hoffm
International Journal of Forestry Research 7
Table 2 Continued
Family Scientific name Number of species Number of trees
Phyllanthaceae
Cleistanthus mildbraedii Jabl
6 37
Hymenocardia ripicola J LeonardHymenocardia ulmoides Oliv
Maesobotrya dusenii (Pax) HutchUapaca guineensisMull-Arg
Uapaca heudelotii Baill
Rubiaceae
Aidia micrantha (K Schum) F White
5 44
Colleactina papalis N HalleMassularia acuminata (G Don) Bullock ex Hoyle
Morelia senegalensis A RichMorinda pynaertii Benth
Oxyanthus schumannianus DeWild et Th DurPsydrax subcordata DC
Psydrax arnoldiana (De Wild)Rutaceae Zanthoxylum heitzii (Aubrev amp Pellegr) P G Waterman 1 1
Sapindaceae
Blighia welwitschii (Hiern) Radlk
4 55Eriocoelum microspermum RadlkLecaniodiscus cupanioides Planch ex Benth
Pancovia pedicellaris Radlk amp Gilg
Sapotaceae
Chrysophyllum beguei Aubrev
4 18Synsepalum brevipes (Baker) TD Penn
Tridesmostemom omphalocarpoides EnglManilkara sp
Manilkara fouilloyana Aubr et PellegrThomandersiaceae Thomandersia hensii DeWild 1 21
Urticaceae Musanga cecropioides R Br 2 235Myrianthus arboreus P Beauv
Total 114 1611
with 119886 = number of common presences for both floristicsamples 119887=number of presences in the first floristic sample 119888= number of presences in the second floristic sample and 119889 =number of species absent in both floristic samples
According to L Legendre and P Legendre [20] theSorensen coefficient is fully compared with the Jaccard coeffi-cient that is if the similarity of a pair of objects computed bythe Jaccard coefficient is higher than the similarity of anotherpair of objects it will also be higher if we use the coefficientof Sorensen for the calculation of similarity
3 Results
31 Floristic Composition and Species Richness A total of1611 trees representing 114 species and 35 families wereidentified from the total area (375 ha) Euphorbiaceae wasthe dominant family in the forest with 12 species followedby Fabaceae Mimosoideae with 10 species In terms of thenumber of trees individuals per family Euphorbiaceae was
the dominant in the whole forest with 239 trees followed byUrticaceae with 235 trees (Table 2)
In terms of characterization of forest type this inventoryallowed distinguishing several forest types like Lophira alataUapaca heudelotii Guibourtia demeusei and Celtis adolfi-friderici Inventories have revealed the existence of threevertical strata whose upper stratum is dominated by speciesreferred to above
The biodiversity did not vary greatly from plot to plot onthe whole of the study area (375 ha) A low Shannon diversityindex value was obtained in plot 11 (1198671015840 = 075) whereas thehighest value was obtained in plot 12 (1198671015840 = 446) A statisticalanalysis made by launched ANOVA revealed that plot 11 wassignificantly different to the other plots (120572 = 005) A greatdifference was also noted in biodiversity between secondaryplots and primary plots (Table 3) The evenness index wascalculated The values varied from 023 in plot P11 to 095 inplot P15
The evenness index 119864 was calculated for each plot Thevalue of equitability varied from 0 to 1 It is equal to 1 when all
8 International Journal of Forestry Research
Table 3 Biodiversity values by biodiversities index and static parameters
Plots Type of forest Totalindividual S
Shannondiversityindex (119867)
Fisherrsquos 120572 Simpson indexEvennessindex =1198671015840
max
Variances(119867) Ecartype
P1 Degraded forest 67 26 433 1576 005 306 028 053P2 Degraded forest 79 22 354 1399 014 264 018 043P3 Degraded forest 212 38 413 2323 008 262 009 03P4 Primary forest 132 26 357 1492 014 252 011 034P5 Primary forest 111 24 397 113 008 288 015 039P6 Primary forest 102 29 414 1739 007 283 018 042P7 Primary forest 52 15 336 839 011 286 023 048P8 Primary forest 61 9 246 381 022 258 011 033P9 Primary forest 34 12 293 813 016 272 028 053P10 Primary forest 106 27 394 1632 009 276 016 04P11 Degraded forest 217 10 075 585 005 075 004 02P12 Primary forest 126 33 447 1776 005 294 016 041P13 Primary forest 153 31 389 1903 01 261 011 033P14 Primary forest 109 31 438 1654 006 293 018 043P15 Agroforestry 47 20 412 1137 004 317 036 06
0
02
04
06
08
1
12
0
1
2
3
4
5
6
P1 P2 P3 P4 P5 P6 P7 P8 P9 P10
P11
P12
P13
P14
P15
Even
ness
inde
x
Shan
non
inde
x
Plots
Evenness indexShannonrsquos index (H)
Figure 4 Shannon diversity index and evenness index trends in allthe study areas
the species have same abundance and tend towards 0 whenthe near total of flora is concentrated on only one speciesThe values of this index varied from 023 to 095 in plots P11and P15 respectively (Figure 4) The value of plot 11 confirmswell conducted survey in the plot which is dominated by onespecies Musanga cecropioides The 119864 value obtained in plotP11 is the one with a value inferior to 05 out of the entireresults Two plots have value of 119864 superior to 09 (plots P1and P15) Twelve plots have a value of 119864 varying between 07and 089
32 Biodiversities Indexes and Other Parameters Other anal-yses of the biodiversity made by applying the other indicessuch as the index of Fisher120572 revealed interesting informationWhereas with the Shannon diversity index it is in plot 11that we noted the weakest biodiversity the application of theindex Fisher 120572 (Table 3) showed that the low value of the
17182317
28482933
3762
4433
05
101520253035404550
AF-FP AF-FS FS-FP
Jaccard index ()Sorensen index ()
Figure 5 Similarity index between two types of forest AF =agroforestry FP = primary forest and FS = secondary forest
biodiversity was obtained in plot 08 which is a primary forestplot whereas the strongest value of 119865 is observed in P3 plotwhich is a mosaic of secondary and primary forest Plot 11(monodominant plot ofMusanga cecropioides) does not havethe low value of the biodiversity like Shannon diversity indexrevealed
The species richness of 114 species was observed in 375 haof the Likouala Forest Department Musanga cecropioideswas the most dominant with 222 trees censured followed byStaudtia kamerounensis var gabonensis with 117 trees
33 Similarity Sorensen (119870) and Jaccard (119878) Index Speciessimilarities between the forest types were studied betweenprimary forest and secondary forest (FS-FP) primary forestand agroforestry land (AF-FP) and agroforestry land andsecondary forest (plot 15) We have noted that the lowestJaccard index value was obtained between AF-FP (Figure 5)(1718) The highest value was noted between FS-FP
International Journal of Forestry Research 9
Table 4 The characteristics of ecological factors in some forests of Republic of Congo
Name of forest Rainfall (mm) Authors Length of dry seasonForest of Impfondo-Dongou 1800ndash2000 Our study 2Forest of Mayombe 1600 Koubouana et al [21] 4Forest of centre-west of Congo 21326 Our own data 2Forests of the littoral 1500 Kimpouni [22] 4
The indices of diversity enabled us to conclude that thestudied zones are rich in cash Are various studied forestssimilar from the floristic composition point of view
The values of coefficient of similarity vary from 1718 to2848 for the index of Jaccard and 2933 to 4433 for theindex of Sorensen
4 Discussion
The analysis of the tree flora of the study area showed that thefamilies of Euphorbiaceae (1053) are the most representedfollowed by the Fabaceae-Mimosoideae (877) Rubiaceae(789) and the Guttiferae (614) Indeed the presence ofthe Euphorbiaceae and Rubiaceae generally represented byspecies of wood is a character common to all tropical rain-forests as noted by Reynal-Roques [29] However the abun-dance of the Fabaceae-Mimosoideae and Guttiferae is proofof the old age or maturity of the inventoried forest [11] Fromthe point of view of physiognomy of forest areas studied theresults show that these are the Euphorbiaceae (1484) whichare abundant in terms of number of trees from beneath woodand stratum average followed by the Urticaceae (1459) theMyristicaceae (1403) of the Fabaceae-Faboideae (764)and Fabaceae-Mimosoideae (720) The abundance of theUrticaceae is explained by the presence of quasi-monospecificstands to Musanga cecropioides in degraded forests How-ever the abundance of the Myristicaceae and Fabaceae isa specific character of the forests studied axis Impfondo-Dongou Indeed the results obtained in our study are totallydifferent from those obtained by Kimpouni [22] in Congolesecoastal forests Koubouana et al [30] in the forest of WesternCentre at Mbomo and Kelle Indeed the work of Kimpouni[22] performed in the littoral showed an abundance ofthe Fabaceae-Caesalpinioideae followed by the Rubiaceaeand Euphorbiaceae Those of Koubouana et al (in press)in the centre-west of the Congo showed an abundanceof the Fabaceae-Caesalpinioideae (1805) followed by theMeliaceae (752) Fabaceae-Mimosoideae (602) Euphor-biaceae (526) Annonaceae (451) and the Myristicaceae(376) In the study conducted at the Mayombe in theSouth of Congo by Koubouana et al [21] the results obtainedshow an abundance of family Burseraceae (1917) followedby the Fabaceae-Caesalpinioideae (1609) Myristicaceae(1318) Annonaceae (949) Euphorbiaceae (832) andFabaceae-Mimosoideae (732)This variation of the floristiccomposition of the different forests studied is explained by thediversity of geological substrate and the diversity of climate(Table 4) Table 5 showed the characteristics of ecologicalfactors in the forests studied
It is important to note that Brazzaville is in the south ofthe Republic of Congo and Mbomo-Kellersquos locality is in thenorthwest of Republic of Congo In comparison with thesetwo localities our study area is in the extreme northeast Eachof the study areas has a local climatic condition (Table 4)
Table 3 shows the values for the assessment of thebiodiversity of trees surveyed in 15 parcels that were thesubject of this study on floristic biodiversity on ge10 cm DBHtrees In this study we wanted to focus our attention on thebiodiversity indices to assess the level of biodiversity acrossthe study area but also the microvariations that would existbetween the plots of the study area Moreover in the scopeof this study we tested the role that vegetation indexes mightplay in the evaluation of forest degradation between primaryand secondary forests
Considering the Shannon diversity index our studyshowed that plot 15 has a lower Shannon index of 1 whiletwo plots have clues to Shannon between 2 and 3 The restof the plots with higher values have 3 High species richnessis a hallmark of many tropical forests (Gentry et al 2010)
Our study revealed the existence of variability of biodi-versity in the study area According to Orth and Colette [31]the Shannon diversity index has strong values for species withrecoveries of same importance and it takes low values whensome species have strong recoveries
Low biological diversity noted in plot 11 (1198671015840 = 075)could be explained by the fact that it is dominated by asingle speciesMusanga cecropioides This species contributesnearly 90 of the total number of trees in the plot In twoplots with the highest values the plots contain more than30 species of trees with at least two species of codominanttrees but with lower contributions In parcel 12 (1198671015840 =447)Angylocalyx pynaertiiDeWild andPlagiostyles africanaspecies each have a 13 contribution In these same plots theother two species following in terms of specific contributionare Grossera macrantha and Strombosia grandifolia withrespectively 7 and 6 of a total of 126 species inventoriedin this plot As shown in Table 1 the application of the otherindices of biodiversity gives a different result The Piouloubiodiversity index (1198671015840max) indicates that plot 15 (119867
1015840
max = 317)has the highest biodiversity followed by plot 1 (1198671015840max = 306)and plot 12 (1198671015840max = 294) Several causes could explainvariations in the degree of biodiversity between the plots ofthe study area soil type rainfall trends anthropogenic actionland use change and so forth
The Shannon diversity index values obtained in thisstudy are lower than those obtained in other studies bothin the Republic of Congo and in other tropical forests inthe Congo basin compared to other tropical countries For
10 International Journal of Forestry Research
Table5Th
echaracteristicso
fecologicalfactorsin
someforestsof
Repu
blicof
Con
go
Type
ofvegetatio
nMinim
umtre
eDBH
Stud
yarea
(ha)
Cou
ntrie
sRa
infall
mean
(mmyear)
Shanno
n-Wienerind
ex(bit)
Num
bero
ffamilies
Num
bero
fgenera
Num
bero
ftre
es
Num
ber
ofspecies
Authors
DBHle10cm
151200ndash150019plusmn05
47120
153
Kimpo
unietal[23]
Forest
DBHge20
cm35
Southw
esto
fthe
Repu
blicof
Con
go1600
375
415076
Koub
ouanae
tal[21]
Shrubsavann
ah40
0Plateaux
Teke
Repu
blicof
Con
go1600ndash2100
216
1516
3075
25Mam
pouyaW
enina[
24]
Fabaceae-
Caesalpinioideae
DBHge20
cm885
Northwesto
fRe
publicof
Con
go1900
53
31107
11012
133
Koub
ouanae
tal(in
press)
Forest
DBHge10cm
Plateaudes
CataractesR
epub
licof
Con
go
1400ndash
1600
mm
42116
153
Kimpo
uni[22]
Forest
(mon
odom
inant
Aucoum
eaklainean
a)DBHge10cm
Youb
i1200
1186
71Kimpo
unietal[25]
Mosaics
ofnatural
forestandgrassla
nd(D
BH)ge
10cm
072
Ugand
aYo
ubiRe
publicof
Con
go(sou
thwest)
1397ndash
1500
mm
402
2693
Nangend
oetal[26]
DBHge15cm
11300
355347
348and
332
4073
1789
92Prem
avanietal[27]
Forest
DBHge10cm
196
2500ndash300
03795
808
72Aigbe
andOmok
hua[
28]
International Journal of Forestry Research 11
instance in the forest of centre-west of Republic of Congo inMbomo-Kelle (Republic of Congo) Shannon diversity indexvaries from 591 to 595 in bloc 4 and bloc 9 respectively(Koubouana et al in press) In the southwest of the Republicof Congo studies were conducted by Kimpouni et al [23]and Koubouana et al [21] and revealed different 1198671015840 valuesKimpouni et al [23] in a degraded forest in Brazzavilleobtained for woody species a Shannon diversity index of 19bits But in the tropical forest of southwest of the Republic ofCongo Koubouana et al (in press) noted an old secondaryforest that the Shannon diversity index was about 308
Regarding heterogeneity many authors think that thestructural heterogeneity of the forests and their high speciesrichness are often interpreted in terms of forest dynamicsand relationship with the resulting phenomena of succession[5 32] In this work we have mainly focused on the study ofthe biodiversity of trees to make a comparison between thedegraded forest areas and nondegraded forest areas
Several factors could explain the variations of biodiversityin our study the topography of the area [33 34] or edaphicfactors [35 36] to explain the issue of floral heterogeneityof tropical forests In our study area three forest types wereidentified flooded forests solid ground forest and partiallyflooded forest In the context of this work we have studiedthe differences that exist between forest types through theJaccard and of Sorensen similarity indexes Moreover (119870)and Jaccard (119878) index give a very good idea of the presence orabsence of species in the different transects of the inventoryThe range of this coefficient is between 0 and 1 Interpretationof the CSJ values is as follows 1 both survey sites haveonly common species 0 both survey sites have only singularspecies 12 the two survey sites have as many commonspecies as the sum of singular species at each survey site [012] the similarity in terms of species diversity between bothsurvey sites is rather low [120] the similarity in terms ofspecies diversity between both survey sites is rather high
In our case it ranges from 1718 to 2348 taking intoaccount the three combinations (AF-FP AF-FS and FS-FP) This means the similarity in terms of species diversitybetween both survey sites is rather low The results showedthat there is a high tree biodiversity in our study area
The values of similarity index are lower than 50 whichenables us to conclude that there is obviously a differencein point of floristic composition between the primary forestsand the secondary forests thus confirming the floristic datathat we presented above
41 Evaluation of Forest Degradation through the BiodiversityIndexes Degradation is considered to be a temporal processThere is however a consensual definition that is acceptedby the various stakeholders which is as follows forestdegradation is the reduction of the capacity of the forest toprovide goods and services In the context of REDD+ forestdegradation can be defined as the partial loss of biomassdue to logging or other causes of removal of wood frombiomass [37] A degraded forest is a secondary forest that haslost as a result of human activities the structure functioncomposition or productivity of species normally associatedwith a natural forest Thus a degraded forest offers a supply
of goods and services and has only limited biodiversity Bio-logical diversity in a degraded forest includes many nontreecomponents which can dominate the understory vegetationcover (CBD (2005 2001)
To assess the level of forest degradation a maximumbiodiversity index has been applied and presents differentvalues between the secondary and primary forest Theseforests are characterized by a very high biodiversity especiallyin the case of secondary forests of Macaranga spinosa orMacaranga barteri In the case of plots P1 and P2 the objectiveof this study is to identify settings that allow assessing forestdegradation
5 Conclusion
The study of the biodiversity of the Likouala forests and theImpfondo-Dongou axis revealed a high floral biodiversityof trees considering a diameter of 5 cm at DBH 130mTree biodiversity is very important in primary forests Insecondary forests the biodiversity varies in line with thesecondary forest type secondary forest ofMacaranga spinosaor secondary forest of Musanga cecropioides Moreover bio-diversity varies according to the nature of the substrate foreston dry land forest in partially flooded areas and floodedforest
Competing Interests
The authors declare that there is no conflict of interestsregarding the publication of this paper
Acknowledgments
The authors are thankful to GEOFORAFRI for funding theproject The authors thank Benoit Mertens for kind supportduring the project
References
[1] S L Lewis G Lopez-Gonzalez B Sonke et al ldquoIncreasingcarbon storage in intact African tropical forestsrdquo Nature vol457 no 7232 pp 1003ndash1006 2009
[2] M N K Djuikouo J-L Doucet C K Nguembou S L Lewisand B Sonke ldquoDiversity and aboveground biomass in threetropical forest types in the Dja Biosphere Reserve CameroonrdquoAfrican Journal of Ecology vol 48 no 4 pp 1053ndash1063 2010
[3] M Anbarashan andN Parthasarathy ldquoTree diversity of tropicaldry evergreen forests dominated by single or mixed species onthe Coromandel coast of Indiardquo Tropical Ecology vol 54 no 2pp 179ndash190 2013
[4] L R Holdridge ldquoLife Zone Ecology Tropical Science CenterSan Jose Costa Ricardquo 1967
[5] V Trichon ldquoHeterogeneite spatiale drsquoune foret tropicale humidede Sumatra effet de la topographie sur la structure floristiquerdquoAnnales des Sciences Forestieres INRAEDP Sciences vol 54 no5 pp 431ndash446 1997
[6] CNIAF ldquoCarte de Changement de Couverture Forestiere enRepublique du Congo pour la Periode 2010ndash2012rdquo 2015
12 International Journal of Forestry Research
[7] A Kumar B G Marcot and A Saxena ldquoTree species diversityand distribution patterns in tropical forests of Garo HillsrdquoCurrent Science vol 91 no 10 pp 1370ndash1381 2006
[8] D S Kacholi ldquoAnalysis of structure and diversity of theKilengwe Forest in the Morogoro Region Tanzaniardquo Interna-tional Journal of Biodiversity vol 2014 Article ID 516840 8pages 2014
[9] J-M Moutsambote Dynamique de reconstitution de la foretYombe (Dimonika RP du Congo) [PhD thesis] These de 3ecycle University of Bordeaux Bordeaux France 1985
[10] G Cusset La Flore et la Vegetation du Mayombe CongolaisEtat des Connaissances Universite Pierre et Marie Curie ParisFrance 1987
[11] G Cusset ldquoLa flore et la vegetation duMayombe congolais etatdes connaissancesrdquo in Revue des Connaissances sur le MayombeJ Senechal et al Ed pp 103ndash136 Unesco Paris France 1989
[12] E J Adjanohoun A M R Ahyi L AkeAsi et al Contributionaux Etudes Ethnobotaniques et Floristiques en Republique Popu-laire du Congo Medecine Traditionnelle et Pharmacopee ACCTParis France 1988
[13] V Kimpouni and F Koubouana ldquoEtude ethnobotanique surles plantes medicinales et alimentaires dans et autour dela reserve de Conkouatirdquo Rapport Final PROGECAPGEF-Congo UICN 1997
[14] F Dowsett-Lemaire ldquoThe vegetation of the Kouilou basin inCongordquo in Flore et Faune du Bassin du Kouilou (Congo) et LeurExploitation R J Dowsett and F Dowsett-Lemaire Eds vol 4pp 17ndash51 Tauraco Research Report 1991
[15] F Koubouana and J M Moutsambote Etude Preliminaire dela Vegetation de lrsquoUFA Letili et Bambama Rapport DrsquoetudeBrazzaville Congo 2006
[16] J-M Moutsambote Etude ecologique phytogeographique etphytosociologique du Congo septentrional (Plateaux CuvettesLikouala et Sangha) [These de Doctorat drsquoEtat] Faculte desSciences Universite Marien Ngouabi Brazzaville Republiquedu Congo 2012
[17] IUCN ldquoLa conservation des ecosystemes forestiers du CongoBase sur le travail de Philippe Hecketsweiller IUCN GlandSuisse et Cambridge Royume uni 187 illustrerdquo 1989
[18] W L Gaines J R Harrod and J F Lehmkuhl ldquoMonitoring bio-diversity quantification and interpretationrdquo General TechnicalReport PNW-GTR-443 USDA Forest Service Pacific North-West Research Station 1999
[19] A E Magurran Ecological Diversity and Its MeasurementCroomHelm London UK 1988
[20] L Legendre and P Legendre Ecologie Numerique Tome 1Traitement Multiple des Donnees Ecologiques Masson ParisFrance 2nd edition 1984
[21] F Koubouana S A Ifo J-M Moutsambote et al ldquoStructureand flora tree biodiversity in congo basin case of a secondarytropical forest in southwest of congo-brazzavillerdquo Research inPlant Sciences vol 3 no 3 pp 49ndash60 2015
[22] V Kimpouni ldquoContribution to the inventory and analysisof the ligneous flora of the plates of the Cataracts (Congo-Brazzaville)rdquo Acta Botanica Gallica vol 156 no 2 pp 233ndash2442009
[23] V Kimpouni A Apani and M Motom ldquoAnalyse phytoecol-ogique de la flore ligneuse de la Haute Sangha (Republique duCongo)rdquo Adansonia Serie 3 vol 35 no 1 pp 107ndash134 2013
[24] Y E Mampouya Wenina Biodiversite et variabilite de la densitedu bois des arbustes de savane dans les environs du village Mah
(Plateaux TEKE Republique du Congo) [MS thesis] UniversiteMarien Ngouabi 2015
[25] V Kimpouni J Loumeto and J Mizingou ldquoWoody flora anddynamic of Aucoumea klaineana forest in the Congolese lit-toralrdquo International Journal of Biological and Chemical Sciencesvol 8 no 4 pp 1393ndash1410 2014
[26] G Nangendo A Stein M Gelens A de Gier and R AlbrichtldquoQuantifying differences in biodiversity between a tropicalforest area and a grassland area subject to traditional burningrdquoForest Ecology and Management vol 164 no 1ndash3 pp 109ndash1202002
[27] D Premavani M T Naidu and M Venkaiah ldquoTree speciesdiversity and population structure in the Tropical Forests ofNorth Central Eastern Ghats Indiardquo Notulae Scientia Biologi-cae vol 6 no 4 pp 448ndash453 2014
[28] H I Aigbe and G E Omokhua ldquoTree species compositionand diversity in Oban Forest reserve Nigeriardquo Journal ofAgricultural Studies vol 3 no 1 pp 10ndash24 2015
[29] Reynal-Roques La Botanique Redecouverte Reynal-RoquesBerlin Germany 1994
[30] F Koubouana S A Ifo J-M Moutsambote and R Mondzali-Lenguiya ldquoFloristic diversity of forests of the Northwest Repub-lic of the Congordquo Open Journal of Forestry In press
[31] D Orth andM G Colette ldquoEspeces dominantes et biodiversiterelation avec les conditions edaphiques et les pratiques agricolespour les prairies des marais du cotentinrdquo Ecologie vol 27 no 3pp 171ndash189 1996
[32] A Aubreville ldquoLa foret coloniale les forets de lrsquoafrique occiden-tale francaiserdquo AnnalesmdashAcademie des Sciences Coloniales vol9 pp 1ndash245 1938
[33] F Kahn Architecture comparee de forets tropicales humides etdynamique de la rhizosphere [PhD thesis] USTL MontpellierFrance 1983
[34] K Basnet ldquoEffect of topography on the pattern of trees intabonuco (Dacryodes excelsa) dominated rain forest of PuertoRicordquo Biotropica vol 24 no 1 pp 31ndash42 1992
[35] J-P Lescure and R Boulet ldquoRelationships between soil andvegetation in a tropical rain forest in FrenchGuianardquoBiotropicavol 17 no 2 pp 155ndash164 1985
[36] J S Gartlan D M Newbery D W Thomas and P G Water-man ldquoThe influence of topography and soil phosphorus on thevegetation of Korup Forest Reserve Camerounrdquo Vegetatio vol65 no 3 pp 131ndash148 1986
[37] M Kanninen D Murdiyarso F Seymour A Angelsen SWunder and L German Do Trees Grow on Money TheImplications of Deforestation Research for Policies to PromoteREDD Forest Perspectives no 4 CIFOR Bogor Indonesia2007
Submit your manuscripts athttpwwwhindawicom
Forestry ResearchInternational Journal of
Hindawi Publishing Corporationhttpwwwhindawicom Volume 2014
Environmental and Public Health
Journal of
Hindawi Publishing Corporationhttpwwwhindawicom Volume 2014
Hindawi Publishing Corporationhttpwwwhindawicom Volume 2014
EcosystemsJournal of
Hindawi Publishing Corporationhttpwwwhindawicom Volume 2014
MeteorologyAdvances in
EcologyInternational Journal of
Hindawi Publishing Corporationhttpwwwhindawicom Volume 2014
Marine BiologyJournal of
Hindawi Publishing Corporationhttpwwwhindawicom Volume 2014
Hindawi Publishing Corporationhttpwwwhindawicom
Applied ampEnvironmentalSoil Science
Volume 2014
Advances in
Hindawi Publishing Corporationhttpwwwhindawicom Volume 2014
Environmental Chemistry
Atmospheric SciencesInternational Journal of
Hindawi Publishing Corporationhttpwwwhindawicom Volume 2014
Hindawi Publishing Corporationhttpwwwhindawicom Volume 2014
Waste ManagementJournal of
Hindawi Publishing Corporation httpwwwhindawicom Volume 2014
International Journal of
Geophysics
Hindawi Publishing Corporationhttpwwwhindawicom Volume 2014
Geological ResearchJournal of
EarthquakesJournal of
Hindawi Publishing Corporationhttpwwwhindawicom Volume 2014
BiodiversityInternational Journal of
Hindawi Publishing Corporationhttpwwwhindawicom Volume 2014
ScientificaHindawi Publishing Corporationhttpwwwhindawicom Volume 2014
OceanographyInternational Journal of
Hindawi Publishing Corporationhttpwwwhindawicom Volume 2014
The Scientific World JournalHindawi Publishing Corporation httpwwwhindawicom Volume 2014
Journal of Computational Environmental SciencesHindawi Publishing Corporationhttpwwwhindawicom Volume 2014
Hindawi Publishing Corporationhttpwwwhindawicom Volume 2014
ClimatologyJournal of
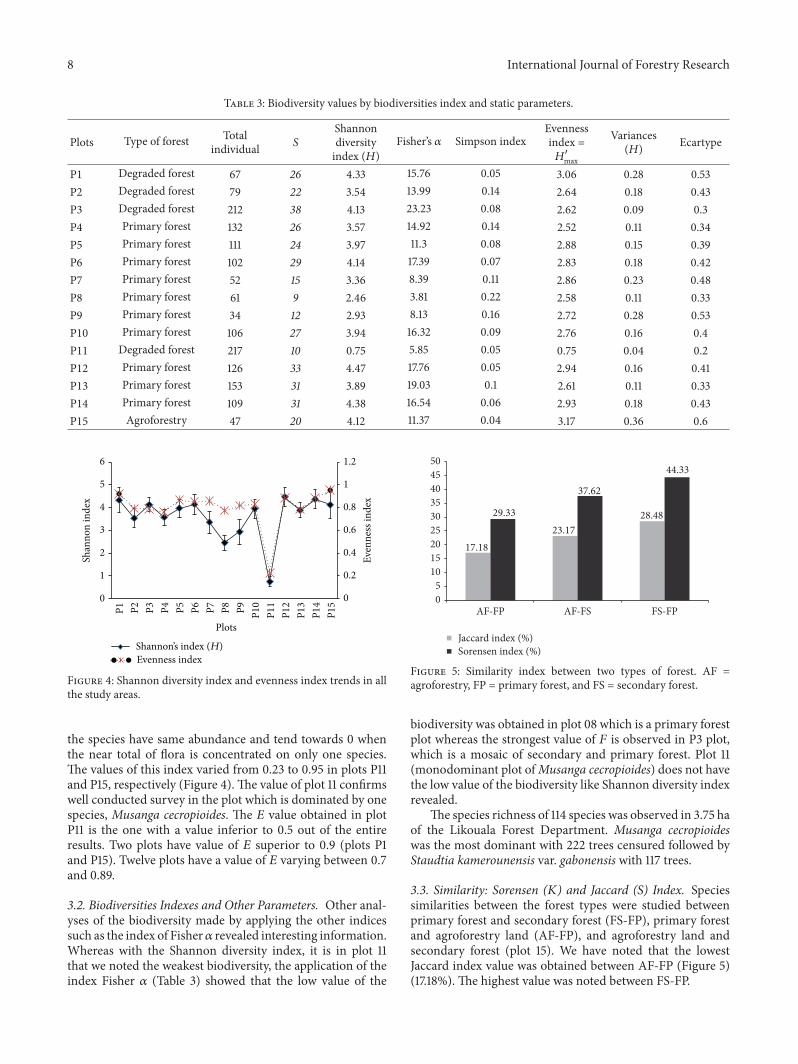
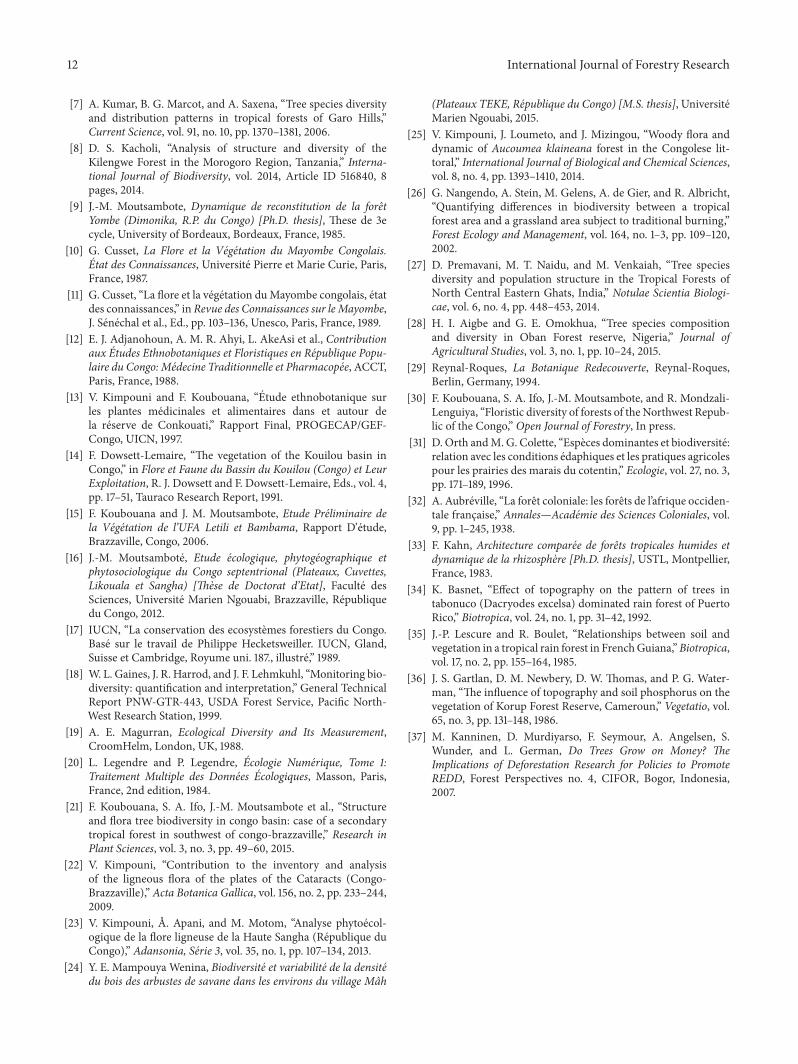