research article validation of an lc-ms/ms method for...
TRANSCRIPT
Research ArticleValidation of an LC-MS/MS Method for UrinaryLactulose and Mannitol Quantification: Results inPatients with Irritable Bowel Syndrome
Jacopo Gervasoni,1 Arcangelo Schiattarella,1 Valentina Giorgio,2
Aniello Primiano,1 Consuelo Russo,2 Valentina Tesori,3 Franco Scaldaferri,3
Andrea Urbani,1 Cecilia Zuppi,1 and Silvia Persichilli1
1UOC Laboratorio Analisi I, Fondazione Policlinico Universitario A. Gemelli, Rome, Italy2Pediatria, Fondazione Policlinico Universitario A. Gemelli, Rome, Italy3UOC di Medicina Interna Gastroenterologia e Malattie del Fegato, Fondazione Policlinico Universitario A. Gemelli, Rome, Italy
Correspondence should be addressed to Silvia Persichilli; [email protected]
Received 2 August 2016; Revised 1 November 2016; Accepted 7 November 2016
Academic Editor: Mariann Harangi
Copyright © 2016 Jacopo Gervasoni et al. This is an open access article distributed under the Creative Commons AttributionLicense, which permits unrestricted use, distribution, and reproduction in any medium, provided the original work is properlycited.
Aim. Lactulose/mannitol ratio is used to assess intestinal barrier function. Aim of this work was to develop a robust and rapidmethod for the analysis of lactulose and mannitol in urine by liquid chromatography coupled to tandem mass spectrometry.Lactulose/mannitol ratio has been measured in pediatric patients suffering from irritable bowel syndrome. Methods. Calibrationcurves and raffinose, used as internal standard, were prepared in water : acetonitrile 20 : 80. Fifty 𝜇L of urine sample was addedto 450 𝜇L of internal standard solution. The chromatographic separation was performed using a Luna NH
2column operating at
a flow rate of 200 𝜇L/min and eluted with a linear gradient from 20% to 80% water in acetonitrile. Total run time is 9 minutes.The mass spectrometry operates in electrospray negative mode. Method was fully validated according to European MedicineAgency guidelines. Results and Conclusions. Linearity ranged from 10 to 1000mg/L for mannitol and 2.5 to 1000mg/L for lactulose.Imprecision in intra- and interassay was lower than 15% for both analytes. Accuracy was higher than 85%. Lactulose/mannitol ratioin pediatric patients is significantly higher than that measured in controls. The presented method, rapid and sensitive, is suitable ina clinical laboratory.
1. Introduction
The gut microbiota play an important role in metabolicand immunological functions, and the impairment of itscomposition might alter homeostasis and lead to the devel-opment of microbiota-related diseases [1]. Irritable bowelsyndrome (IBS) is a functional gastrointestinal disorder witha prevalence ranging between 10 and 30 percent [2, 3]. Theprincipal symptoms are chronic abdominal pain associatedwith diarrhea and constipation.
Although this disorder is not associated with mortal-ity, targeted treatment and therapy is desirable, especiallybecause the causes of IBS are still partlymisunderstood.There
is evidence that patients with IBS have altered intestinal per-meability [4, 5]; thus the evaluation of intestinal permeabilitytogether with Rome criteria and fecal calprotectin may helpthe discrimination between organic disease and IBS [6].
Different methods for measuring intestinal permeabilityare proposed.
Ussing chamber techniques, even if highly sensitive, aretoo invasive to be used routinely since they require variousbiopsies of the intestine at different levels [7].
The intestinal permeability (IP) test is an inexpensiveand accurate method for evaluating the integrity of thegastrointestinal mucosa without using invasivemethods suchas endoscopy or radiology [7, 8].
Hindawi Publishing CorporationDisease MarkersVolume 2016, Article ID 5340386, 6 pageshttp://dx.doi.org/10.1155/2016/5340386

2 Disease Markers
The use of 51Cr EDTA not always guarantees reliableresults since the use of a singlemolecule can detect alterationsnot related to the permeability alteration [8].
A useful and noninvasive marker for the evaluationof intestinal permeability may be sought in the urinaryexcretion of nonmetabolized sugar [9].
The evaluation of intestinal permeability based on thequantified absorption of two sugars of different sizes givesmore information and higher sensitivity than using a singlesugar [10]. In physiological condition the rate of absorption isabout 10% formannitol and less than 1% for lactulose.The lossofmucosal integrity shouldmainly cause increase of lactuloseabsorption with a consequent increase of lactulose-mannitolratio (L/M ratio) in the urine sample [11].
Different laboratory procedures have been proposed forquantification of mannitol and lactulose in urine, such asspectrophotometric [12] and enzymatic [13–15]methods, gas-chromatography [16], and high performance liquid chro-matography (HPLC) [17–19].
The aim of this paper was to develop and to validate asensitive and specific liquid chromatography-tandem massspectrometry (LC-MS/MS)method tomeasuremannitol andlactulose levels in urine suitable to the clinical chemistryroutine. Furthermore, the method was applied for the quan-tification of L/M in pediatric patients suffering from IBScompared to control subjects.
2. Materials and Method
2.1. Chemicals and Reagents. Water and acetonitrile (LC-MSgrade) were purchased fromMerck (Merk KGaA, Darmstadt,Germany). Formic acid (98% LC-MS grade) was purchasedfrom Baker (Mallinckrodt Baker Italia, Milano, Italia).
Lactulose, mannitol, and chlorhexidine were purchasedfrom BioChemica (AppliChem Inc., MO, USA).
Stock solutions of mannitol (4 g/L), lactulose (4 g/L),and raffinose (1 g/L) were prepared in water and storedat 80∘C.
Working solutions were prepared in water/acetonitrile(20/80, volume/volume) at concentrations of 1600mg/L formannitol and 800mg/L for lactulose. Serial dilutions fromworking solutions were used to prepare six-point calibrationcurves for both mannitol and lactulose (0-50-100-200-400-800mg/L; 0-25-50-100-200-400mg/L, resp.) and kept at−20∘C until use. Raffinose was used as internal standard (IS)at 25mg/L in 80% acetonitrile.
2.2. Subject. 15 patients (5–16 years, 8 males and 7 females)with a diagnosis of IBS were recruited. The diagnosis of IBSwas performed using Rome III criteria [20]. Assessment ofsymptoms severity was performed using Visuoanalogic Scale(VAS) score. We found 8 children with IBS-D (53%), 2 withIBS-C (13%), and 5 with IBS-U (33%).
As a control group 10, apparently healthy, subjects (5–16years, 4 males and 6 females) were recruited.
Patients with history of diabetes, thyroid disease, previousabdominal surgery, connective tissue diseases, and breathtests to lactose-positive or suffering from gastrointestinaldiseases other than the IBS were excluded.
The study was approved by the institutional EthicsCommittee, and an informed written consent was obtainedfrom each subject in accordance with the principles of theDeclaration of Helsinki.
2.3. Sample Collection and Treatment. Subjects were askedto follow a lactulose- and mannitol-free diet 24 h before theanalysis in order to reduce mannitol concentration in thebasal urine sample. Urine basal sample was collected afteran overnight fasting; then, the patients drank a solutioncontaining 5 gr of lactulose and 1 gr of mannitol in 120mL ofdeionized water. Urine samples were collected for the next6 h. In the collecting tube, according to the literature data,1mL of chlorhexidine (1mg/mL) was added as antimicrobialagent. Total urine volume was measured, and several 1.0mLaliquots were stored at −20∘C until analysis.
Urine samples were allowed to thaw at room temperature,then stirred for 1min using a vortex mixer, and then werecentrifuged at 5,000𝑔 for 4min to remove the sedimentaccording to the laboratory procedure.
To 50 𝜇L of urine samples, controls and standards wereadded 450 𝜇L of IS solution and, after being mixed, a 200𝜇Laliquot was transferred into a glass vial for the injection toHPLC-MS/MS.
2.4. Instrumentation. The LC-MS/MS system consisted ofHPLC and autosampler Accela (Thermo Fisher, Palo Alto,CA, USA) and a triple quadrupole mass spectrometer TSQQuantum Access (Thermo Fisher, Palo Alto, CA, USA)equipped with an electrospray ion source.
2.5. Chromatographic Conditions. The HPLC separation wasperformed using a 150× 2mm, Luna 5𝜇mNH
2100 A column
(Phenomenex, USA) operating at a flow rate of 300𝜇L/min,and eluted with a 4min linear gradient from 70 to 30%acetonitrile in water. The oven temperature was set at 40∘C.The injection volume was 10 𝜇L, and the total analysis timewas 9min.
2.6. Mass Spectrometer Conditions. The ESI source operatesin negative mode. The capillary voltage was set to 3400Vat a temperature of 310∘C. The source of the gas was set asfollows: sheath gas pressure, 40 (arbitrary units); auxiliarygas pressure, 5 (arbitrary units); ion sweep gas pressure, 0(arbitrary units). Argon was used as the collision gas at apressure of 1.5mTorr.
Each selected reaction monitoring (SRM) transition wascollected at resolution of 0.7 amu full width half maximum(FWHM) in the first quadrupole, with a scan time of0.1 s. The tube lens and collision settings were establishedindividually for each compound for SRM detection. Theconditions (Table 1) for the detection of lactulose, mannitol,and raffinose were obtained by direct infusion of a standardsolution (10 𝜇g/mL) in line with the HPLC at initial mobilephase conditions.
2.7. Method Validation. To validate the method the follow-ing parameters were assessed: linearity, LOQ, imprecision,accuracy, recovery, and matrix effect. Linearity and limit
Disease Markers 3
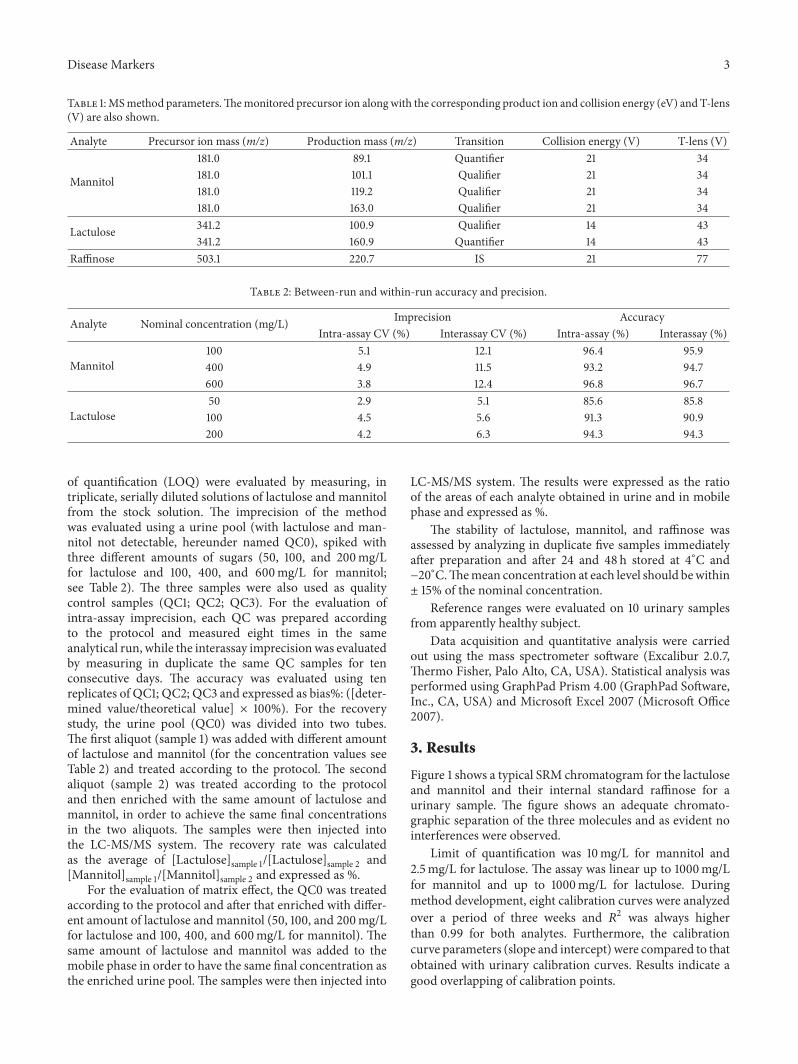
Table 1:MSmethod parameters.Themonitored precursor ion alongwith the corresponding product ion and collision energy (eV) and T-lens(V) are also shown.
Analyte Precursor ion mass (m/z) Production mass (m/z) Transition Collision energy (V) T-lens (V)
Mannitol
181.0 89.1 Quantifier 21 34181.0 101.1 Qualifier 21 34181.0 119.2 Qualifier 21 34181.0 163.0 Qualifier 21 34
Lactulose 341.2 100.9 Qualifier 14 43341.2 160.9 Quantifier 14 43
Raffinose 503.1 220.7 IS 21 77
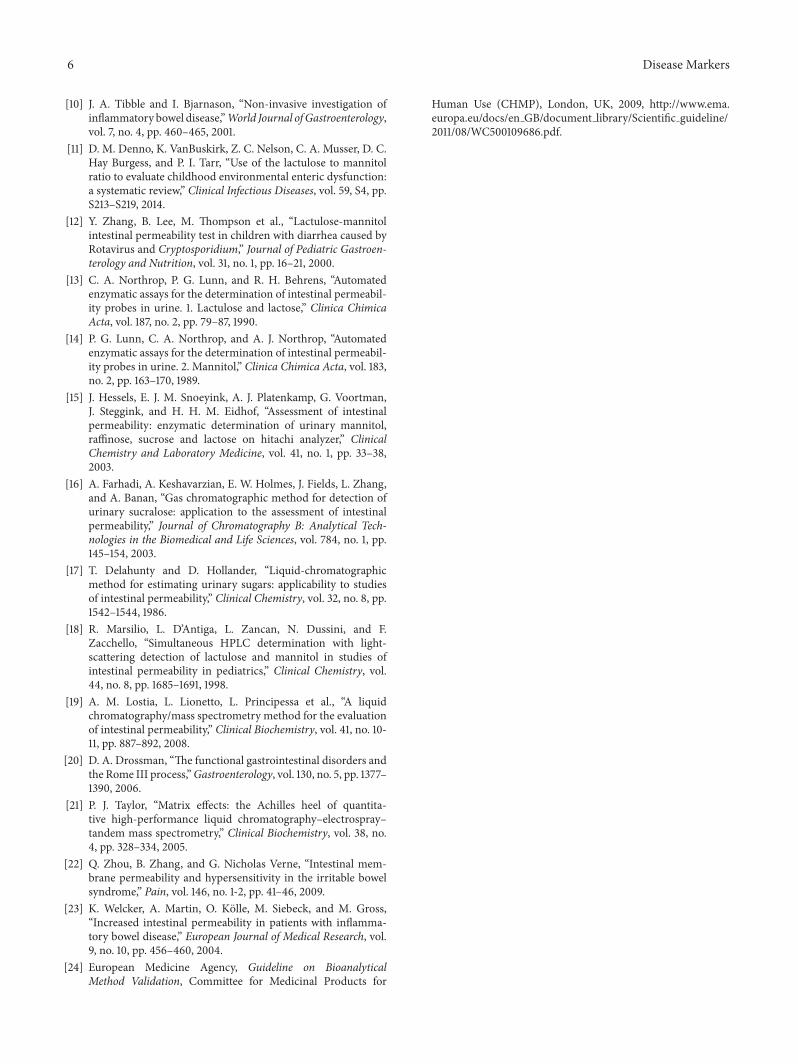
Table 2: Between-run and within-run accuracy and precision.
Analyte Nominal concentration (mg/L) Imprecision AccuracyIntra-assay CV (%) Interassay CV (%) Intra-assay (%) Interassay (%)
Mannitol100 5.1 12.1 96.4 95.9400 4.9 11.5 93.2 94.7600 3.8 12.4 96.8 96.7
Lactulose50 2.9 5.1 85.6 85.8100 4.5 5.6 91.3 90.9200 4.2 6.3 94.3 94.3
of quantification (LOQ) were evaluated by measuring, intriplicate, serially diluted solutions of lactulose and mannitolfrom the stock solution. The imprecision of the methodwas evaluated using a urine pool (with lactulose and man-nitol not detectable, hereunder named QC0), spiked withthree different amounts of sugars (50, 100, and 200mg/Lfor lactulose and 100, 400, and 600mg/L for mannitol;see Table 2). The three samples were also used as qualitycontrol samples (QC1; QC2; QC3). For the evaluation ofintra-assay imprecision, each QC was prepared accordingto the protocol and measured eight times in the sameanalytical run, while the interassay imprecisionwas evaluatedby measuring in duplicate the same QC samples for tenconsecutive days. The accuracy was evaluated using tenreplicates of QC1; QC2; QC3 and expressed as bias%: ([deter-mined value/theoretical value] × 100%). For the recoverystudy, the urine pool (QC0) was divided into two tubes.The first aliquot (sample 1) was added with different amountof lactulose and mannitol (for the concentration values seeTable 2) and treated according to the protocol. The secondaliquot (sample 2) was treated according to the protocoland then enriched with the same amount of lactulose andmannitol, in order to achieve the same final concentrationsin the two aliquots. The samples were then injected intothe LC-MS/MS system. The recovery rate was calculatedas the average of [Lactulose]sample 1/[Lactulose]sample 2 and[Mannitol]sample 1/[Mannitol]sample 2 and expressed as %.
For the evaluation of matrix effect, the QC0 was treatedaccording to the protocol and after that enriched with differ-ent amount of lactulose and mannitol (50, 100, and 200mg/Lfor lactulose and 100, 400, and 600mg/L for mannitol). Thesame amount of lactulose and mannitol was added to themobile phase in order to have the same final concentration asthe enriched urine pool. The samples were then injected into
LC-MS/MS system. The results were expressed as the ratioof the areas of each analyte obtained in urine and in mobilephase and expressed as %.
The stability of lactulose, mannitol, and raffinose wasassessed by analyzing in duplicate five samples immediatelyafter preparation and after 24 and 48 h stored at 4∘C and−20∘C.Themean concentration at each level should bewithin± 15% of the nominal concentration.
Reference ranges were evaluated on 10 urinary samplesfrom apparently healthy subject.
Data acquisition and quantitative analysis were carriedout using the mass spectrometer software (Excalibur 2.0.7,Thermo Fisher, Palo Alto, CA, USA). Statistical analysis wasperformed using GraphPad Prism 4.00 (GraphPad Software,Inc., CA, USA) and Microsoft Excel 2007 (Microsoft Office2007).
3. Results
Figure 1 shows a typical SRM chromatogram for the lactuloseand mannitol and their internal standard raffinose for aurinary sample. The figure shows an adequate chromato-graphic separation of the three molecules and as evident nointerferences were observed.
Limit of quantification was 10mg/L for mannitol and2.5mg/L for lactulose. The assay was linear up to 1000mg/Lfor mannitol and up to 1000mg/L for lactulose. Duringmethod development, eight calibration curves were analyzedover a period of three weeks and 𝑅2 was always higherthan 0.99 for both analytes. Furthermore, the calibrationcurve parameters (slope and intercept) were compared to thatobtained with urinary calibration curves. Results indicate agood overlapping of calibration points.

4 Disease Markers
100
80
60
40
20
0
0 1 2 3 4 5 6 7 8 9 10 11 12 13 14 15
abun
danc
eRe
lativ
e
Mannitol
Time (min)
RT: 5.76AA: 4250007
RT: 3.97AA: 387509
RT: 6.47AA: 8536
RT: 7.60AA: 671820
(a)
Lactulose100
80
60
40
20
0
0 1 2 3 4 5 6 7 8 9 10 11 12 13 14 15
abun
danc
eRe
lativ
e
Time (min)
RT: 6.24AA: 293196
RT: 3.98AA: 1303
RT: 5.43AA: 14199
RT: 6.96AA: 2842
(b)
100
80
60
40
20
0
0 1 2 3 4 5 6 7 8 9 10 11 12 13 14 15
abun
danc
eRe
lativ
e
Time (min)
RaffinoseRT: 6.76
AA: 1023082
RT: 7.44AA: 5364
(c)
Figure 1: Typical SRM chromatogram for mannitol, lactulose, and IS raffinose in a urine sample.
0.300
0.200
0.100
0.000
Controls IBSGroups
L/M
ratio
Figure 2: L/M ratio in controls and IBS patients (𝑝 < 0.05).
Precision and accuracy results are summarized in Table 2.The within-run precision and accuracy ranged from 2.9to 5.1% and 85.6 to 96.8%, respectively. The between-runprecision and accuracy ranged from 5.1 to 12.4% and 85.8 to96.7%, respectively.
Recovery ranged from 93.5 to 118.6% for the two sugars.The mean peak areas of lactulose and mannitol in
mobile phase and in urine are not significantly different. Infact, the signal intensities of lactulose and mannitol whenurinary matrix (containing chlorhexidine) was injected arecompletely comparable with that of the same experimentwhen mobile phase was injected. Matrix effect for bothlactulose and mannitol was lower than 20%. Moreover thisindicates that chlorhexidine, even if present in differentconcentration in the various urinary samples (because of thedifferent volumes collected), did not interfere inmannitol andlactulose signals.
Table 3: L/M ratio of each urinary sample of controls and patients.
Controls L/M ratio IBS L/M ratio1 0.010 1 0.3072 0.010 2 0.0543 0.009 3 0.1154 0.029 4 0.0185 0.014 5 0.0836 0.019 6 0.0297 0.008 7 0.1878 0.016 8 0.0419 0.009 9 0.02210 0.011 10 0.047
11 0.06812 0.09313 0.14114 0.08015 0.0161
Mean basal lactulose and mannitol concentrations were,respectively, 4.5 ± 1.3mg/L and 35 ± 20mg/L withoutsignificant differences between patients and controls.
The average of the L/M ratio of the control subjects was0.014 with a standard deviation of 0.007. The cut-off value(M + 2SD) was 0.03 and is completely comparable to datareported in the literature.
In Table 3 L/M ratios of each control and of each patientwere reported.
The average of the L/M ratio in patients with IBS was0.096 with a standard deviation of 0.078. The statisticalanalysis of the differences between the L/M ratio of controlsversus patientswith IBSwas statistically significant (𝑝 < 0.05)(Figure 2). Children with IBS-D had an increased intestinalpermeability compared to the other IBS subgroups: IBS-D1.19 ± 1.01 versus IBS-C and IBS-U 0.48 ± 0.40.

Disease Markers 5
No gastrointestinal adverse event (vomiting, diarrhea, ornausea) was observed in any child.
4. Discussion
Defect of barrier function that lead to damage of the epitheliallayer structure may contribute to intestinal diseases. IBS inparticular is very common disease with a not clear patho-physiology. Intestinal permeability seems to play a major rolein the onset and severity of related symptoms but few studieshave clarified the mechanisms [21, 22].
The intestinal permeability tests represent a valid, eco-nomical, and simple tool for assessing the integrity of theintestinal barrier function and for the identification of alter-ations of the intestinal mucosa. Lactulose and mannitol ratio(L/M ratio) is a rapid and simple test of intestinal permeabilityfor the assessment of intestinal barrier integrity, frequentlyused in clinical practice [18, 23]. Several chromatographicmethods have been described for the analysis of lactuloseand mannitol using different detection systems [16–19]. TheHPLC coupled to mass spectrometry is the ideal solution forits high selectivity, sensitivity, and productivity.
One of the biggest problems in the mass spectrometryanalysis is to minimize the matrix effect. Possible strategiesto be adopted are as follows: a sample purification or a moreefficient chromatographic separation [21].
In the case of urinary samples, thanks to the minimalprotein concentration, it is possible to perform only a sampledilution before the injection but this procedure reduces theinterference due to the matrix components only in part.
The chromatographic separation with an amine columnallows adequately retaining the analytes separating themfrom thematrix components eluting near the void timewhichare mainly responsible for the matrix effect.
The amine column does not guarantee the performancesof the more used C18 columns; in fact the average lifeobserved for this application is about 400 injections, after thatthe CQ, repeated at each session, showed a loss of resolutionfor the chromatographic peak.
The choice of using a relatively long chromatographic runallows simplifying the procedure of preparation to a mini-mum and optimizing the work of the laboratory technician.It is possible in this way to prepare a large number of samplesin a relatively short time and then perform the analysisLC-MS/MS during the night. The ESI source in negativeionization and the triple quadrupole analyzer in SRM modeensure high specificity further reducing possible interferenceof other substances and also consequently increasing thesensitivity. The validation study of the method in additionto the preliminary data on real samples of urine has shownthat the method fully meets the criteria required by theguidelines of the European Medicines Agency [24]. Thedescribed method allows accurately determining the urinaryconcentration of lactulose and mannitol. In the present studythe reference intervals were evaluated on a group of pediatricsubjects in order to compare them with a group of pediatricpatients with IBS. The results of L/M ratio are significantlyelevated in patients with IBS. The comparison betweenthe two groups highlights the presence of an alteration of
intestinal permeability in patients with IBS. In fact, the ratioof the fractions excreted lactulose of mannitol (L/M ratio)observed in urine samples of patients with IBS was signif-icantly higher than the ratio in healthy subjects. Moreover,IBS-D children had higher degree of severity of abdominalpain (as measured by VAS score, data not shown) com-pared to the other subgroups suggesting higher intestinalpermeability in this subgroup. As a matter of fact intestinalpermeability test alone is not diagnostic of IBS and at themoment is not routinely performed, remaining confined tothe research setting.
Moreover, this method allows an easy evaluation ofintestinal permeability in pediatric subjects to whom it is notpossible using 51Cr-EDTA test.
As future perspective, wewould like to confirm the resultsof this study on a larger number of individuals to betterdefine the cut-off values related to the various pathologies.Moreover, it would be useful to divide the study subjects intwo groups (preadolescents and adolescents) to better defineif the different developmental stage of the intestinal barriermay potentially affect lactulose or mannitol measurements.It is even more interesting to clarify if both aging and gutmicrobiota may influence intestinal permeability.
Competing Interests
The authors declare that they have no competing interests.
References
[1] J. Marchesi and F. Shanahan, “The normal intestinal micro-biota,” Current Opinion in Infectious Diseases, vol. 20, no. 5, pp.508–513, 2007.
[2] R. M. Lovell and A. C. Ford, “Global prevalence of and riskfactors for irritable bowel syndrome: a meta-analysis,” ClinicalGastroenterology andHepatology, vol. 10, no. 7, pp. 712–721, 2012.
[3] C. Canavan, J.West, and T. Card, “The epidemiology of irritablebowel syndrome,” Clinical Epidemiology, vol. 6, pp. 71–80, 2014.
[4] M. Camilleri and H. Gorman, “Intestinal permeability andirritable bowel syndrome,” Neurogastroenterology and Motility,vol. 19, no. 7, pp. 545–552, 2007.
[5] R. J. Shulman, M. N. Eakin, D. I. Czyzewski, M. Jarrett M,and C. N. Ou, “Increased gastrointestinal permeability and gutinflammation in children with functional abdominal pain andirritable bowel syndrome,” Journal of Pediatrics, vol. 153, no. 5,pp. 646–650, 2008.
[6] J. A. Tibble, G. Sigthorsson, R. Foster, I. Forgacs, and I.Bjarnason, “Use of surrogate markers of inflammation andRome criteria to distinguish organic from nonorganic intestinaldisease,” Gastroenterology, vol. 123, no. 2, pp. 450–460, 2002.
[7] Z. Sun, X. Wang, and R. Andersson, “Role of intestinal per-meability in monitoring mucosal barrier function. History,methodology, and significance of pathophysiology,” DigestiveSurgery, vol. 15, no. 5, pp. 386–397, 1998.
[8] M.Camilleri, A.Nadeau, J. Lamsamet al., “Understandingmea-surements of intestinal permeability in healthy humans withurine lactulose and mannitol excretion,” Neurogastroenterologyand Motility, vol. 22, no. 1, pp. e15–e26, 2010.
[9] I. Bjarnason, A. MacPherson, and D. Hollander, “Intestinalpermeability: an overview,” Gastroenterology, vol. 108, no. 5, pp.1566–1581, 1995.
6 Disease Markers
[10] J. A. Tibble and I. Bjarnason, “Non-invasive investigation ofinflammatory bowel disease,”World Journal ofGastroenterology,vol. 7, no. 4, pp. 460–465, 2001.
[11] D. M. Denno, K. VanBuskirk, Z. C. Nelson, C. A. Musser, D. C.Hay Burgess, and P. I. Tarr, “Use of the lactulose to mannitolratio to evaluate childhood environmental enteric dysfunction:a systematic review,” Clinical Infectious Diseases, vol. 59, S4, pp.S213–S219, 2014.
[12] Y. Zhang, B. Lee, M. Thompson et al., “Lactulose-mannitolintestinal permeability test in children with diarrhea caused byRotavirus and Cryptosporidium,” Journal of Pediatric Gastroen-terology and Nutrition, vol. 31, no. 1, pp. 16–21, 2000.
[13] C. A. Northrop, P. G. Lunn, and R. H. Behrens, “Automatedenzymatic assays for the determination of intestinal permeabil-ity probes in urine. 1. Lactulose and lactose,” Clinica ChimicaActa, vol. 187, no. 2, pp. 79–87, 1990.
[14] P. G. Lunn, C. A. Northrop, and A. J. Northrop, “Automatedenzymatic assays for the determination of intestinal permeabil-ity probes in urine. 2. Mannitol,” Clinica Chimica Acta, vol. 183,no. 2, pp. 163–170, 1989.
[15] J. Hessels, E. J. M. Snoeyink, A. J. Platenkamp, G. Voortman,J. Steggink, and H. H. M. Eidhof, “Assessment of intestinalpermeability: enzymatic determination of urinary mannitol,raffinose, sucrose and lactose on hitachi analyzer,” ClinicalChemistry and Laboratory Medicine, vol. 41, no. 1, pp. 33–38,2003.
[16] A. Farhadi, A. Keshavarzian, E. W. Holmes, J. Fields, L. Zhang,and A. Banan, “Gas chromatographic method for detection ofurinary sucralose: application to the assessment of intestinalpermeability,” Journal of Chromatography B: Analytical Tech-nologies in the Biomedical and Life Sciences, vol. 784, no. 1, pp.145–154, 2003.
[17] T. Delahunty and D. Hollander, “Liquid-chromatographicmethod for estimating urinary sugars: applicability to studiesof intestinal permeability,” Clinical Chemistry, vol. 32, no. 8, pp.1542–1544, 1986.
[18] R. Marsilio, L. D’Antiga, L. Zancan, N. Dussini, and F.Zacchello, “Simultaneous HPLC determination with light-scattering detection of lactulose and mannitol in studies ofintestinal permeability in pediatrics,” Clinical Chemistry, vol.44, no. 8, pp. 1685–1691, 1998.
[19] A. M. Lostia, L. Lionetto, L. Principessa et al., “A liquidchromatography/mass spectrometry method for the evaluationof intestinal permeability,” Clinical Biochemistry, vol. 41, no. 10-11, pp. 887–892, 2008.
[20] D. A. Drossman, “The functional gastrointestinal disorders andthe Rome III process,”Gastroenterology, vol. 130, no. 5, pp. 1377–1390, 2006.
[21] P. J. Taylor, “Matrix effects: the Achilles heel of quantita-tive high-performance liquid chromatography–electrospray–tandem mass spectrometry,” Clinical Biochemistry, vol. 38, no.4, pp. 328–334, 2005.
[22] Q. Zhou, B. Zhang, and G. Nicholas Verne, “Intestinal mem-brane permeability and hypersensitivity in the irritable bowelsyndrome,” Pain, vol. 146, no. 1-2, pp. 41–46, 2009.
[23] K. Welcker, A. Martin, O. Kolle, M. Siebeck, and M. Gross,“Increased intestinal permeability in patients with inflamma-tory bowel disease,” European Journal of Medical Research, vol.9, no. 10, pp. 456–460, 2004.
[24] European Medicine Agency, Guideline on BioanalyticalMethod Validation, Committee for Medicinal Products for
Human Use (CHMP), London, UK, 2009, http://www.ema.europa.eu/docs/en GB/document library/Scientific guideline/2011/08/WC500109686.pdf.

Submit your manuscripts athttp://www.hindawi.com
Stem CellsInternational
Hindawi Publishing Corporationhttp://www.hindawi.com Volume 2014
Hindawi Publishing Corporationhttp://www.hindawi.com Volume 2014
MEDIATORSINFLAMMATION
of
Hindawi Publishing Corporationhttp://www.hindawi.com Volume 2014
Behavioural Neurology
EndocrinologyInternational Journal of
Hindawi Publishing Corporationhttp://www.hindawi.com Volume 2014
Hindawi Publishing Corporationhttp://www.hindawi.com Volume 2014
Disease Markers
Hindawi Publishing Corporationhttp://www.hindawi.com Volume 2014
BioMed Research International
OncologyJournal of
Hindawi Publishing Corporationhttp://www.hindawi.com Volume 2014
Hindawi Publishing Corporationhttp://www.hindawi.com Volume 2014
Oxidative Medicine and Cellular Longevity
Hindawi Publishing Corporationhttp://www.hindawi.com Volume 2014
PPAR Research
The Scientific World JournalHindawi Publishing Corporation http://www.hindawi.com Volume 2014
Immunology ResearchHindawi Publishing Corporationhttp://www.hindawi.com Volume 2014
Journal of
ObesityJournal of
Hindawi Publishing Corporationhttp://www.hindawi.com Volume 2014
Hindawi Publishing Corporationhttp://www.hindawi.com Volume 2014
Computational and Mathematical Methods in Medicine
OphthalmologyJournal of
Hindawi Publishing Corporationhttp://www.hindawi.com Volume 2014
Diabetes ResearchJournal of
Hindawi Publishing Corporationhttp://www.hindawi.com Volume 2014
Hindawi Publishing Corporationhttp://www.hindawi.com Volume 2014
Research and TreatmentAIDS
Hindawi Publishing Corporationhttp://www.hindawi.com Volume 2014
Gastroenterology Research and Practice
Hindawi Publishing Corporationhttp://www.hindawi.com Volume 2014
Parkinson’s Disease
Evidence-Based Complementary and Alternative Medicine
Volume 2014Hindawi Publishing Corporationhttp://www.hindawi.com