research experiences for math majors at arizona state
TRANSCRIPT

Research Experiences for Math Majors at Arizona StateUniversity
Eric Kostelich
SCHOOL OF MATHEMATICAL & STATISTICAL SCIENCES
July 13, 2012

Overall philosophy and rationale
Mathematical themes: Uncertainty, prediction,simulationApplications: Biology, weather/climate, imaging,networksGoals: Provide a model for 21st Century mathematicscurriculum and strengthen connections with otherdisciplinesProfessional concern: We must be able to givecompelling reasons to invest in mathematicsdepartments
SIAM 2012 E. Kostelich MATHEMATICAL & STATISTICAL SCIENCES 2 / 22

Fall 2005 CBMS report
Fall enrollment growth: +21% at 4-year colleges &universities since 1990 (total: 1.6 million students)Math enrollment growth: −2.3%All math/stat bachelors degrees: −2%Number of bachelor’s degrees awarded by doctoraldepartment was up by 41% over 2000 but those bymaster’s & 4-year schools declined by 19–27%Fraction of 4-year colleges offering AdvancedEngineering Mathematics once every 2 years: 7%Advanced Calculus: 57% Algebra: 52%
SIAM 2012 E. Kostelich MATHEMATICAL & STATISTICAL SCIENCES 3 / 22

The post-Sputnik problem
Undergraduates see few applications of mathematicsafter 1950
Metropolis algorithmFast Fourier transformSimplex algorithmPublic-key cryptographyKalman-Bucy filterViterbi algorithmShotgun genome sequencingetc.
Resulting #1 FAQ: What can I do with a math degree?Students should get in-depth exposure to at least one ofthese topics in their baccalaureate program
SIAM 2012 E. Kostelich MATHEMATICAL & STATISTICAL SCIENCES 4 / 22

My interests and philosophy
Professional goals: Create modern, high-impactprograms for mathematics undergraduates that canserve as national modelsCourses and programs to educate mathematicallyliterate scientists (not necessarily more mathematiciansper se)Interdisciplinary collaboration is essentialDouble majors are not worthwhileEncourage combined BS/MA programs for strongundergraduates
SIAM 2012 E. Kostelich MATHEMATICAL & STATISTICAL SCIENCES 5 / 22

Undergraduate programs at ASU
Current enrollment: 72,000 students on four campusesAbout 58,000 undergraduatesTotal mathematics enrollments: 16,000 students in fall,14,000 in spring∼ 40% precalculus & below; ∼ 30% business math;∼ 30% in engineering calculus & aboveApproximately 4,000 engineering majors, 550 mathmajorsTransfer students, on-and-off enrollment are the rule
SIAM 2012 E. Kostelich MATHEMATICAL & STATISTICAL SCIENCES 6 / 22

The Computational Mathematical Sciences B.S. degree
Goal: Create an interdisciplinary program that wouldappeal to good science and math studentsMust accommodate transfer students easilyEncourages summer internships and undergraduateresearch experienceTakes a broad view of “scientific computing”
SIAM 2012 E. Kostelich MATHEMATICAL & STATISTICAL SCIENCES 7 / 22

CMS core areas
Mathematics: 3 semester calculus sequence, ordinarydifferential equations, linear algebra (18 credits total)Science: 2 one-year sequences in life/physical sciences(16 credits)Computing: 2 semesters of introductory programmingand data structures plus Scientific Computing andIntroduction to Numerical Methods (12 credits)Advanced courses: At least 3 in math/stat and 1internship/research course (12 credits)Liberal studies: 5 courses in humanities/socialsciences, 2 “science and society” courses (21 credits)
SIAM 2012 E. Kostelich MATHEMATICAL & STATISTICAL SCIENCES 8 / 22

The Scientific Computing course
Audience: advanced undergraduate and beginninggraduate students in mathematics and physical sciencesEmphasis: Software development skills for scientificand high-performance computingTopics: Scripting (shell, Python, makefiles); Fortran95/2003, C99, C++; OpenMP; LAPACKPrerequisites: At least 2 semesters of programming,differential equations and/or linear algebraThe graduate version includes MPI, more on OpenMP,cache coherency, bandwidth issues, etc.
SIAM 2012 E. Kostelich MATHEMATICAL & STATISTICAL SCIENCES 9 / 22

The CSUMS program
Computational Science Training for Undergraduates inthe Mathematical SciencesFunded through Divisions of Mathematical Sciencesand Undergraduate Education at the National ScienceFoundationLong-term research experiences for cohorts of at leastsix undergraduatesFrom the solicitation: Projects must be genuineresearch experiences rather than rehearsals of researchmethods
SIAM 2012 E. Kostelich MATHEMATICAL & STATISTICAL SCIENCES 10 / 22

The CSUMS project at ASU
65 students in overlapping cohorts since Jan. 2008Basic requirements: Math major with 3.5+ GPA,differential equations, linear algebra, 1+ semester ofprogrammingYear 1: Weekly pizza seminarSummer 1: 8-week research projectsYear 2: Weekly pizza seminar, conference, paper,graduationOption: Continue to BS/MA programConference presentation, possibly an honors thesis orpaper
SIAM 2012 E. Kostelich MATHEMATICAL & STATISTICAL SCIENCES 11 / 22

The CSUMS project at ASU, 2
Sliding window of 12 faculty participants43 CSUMS students have graduated, 18 to PhDprograms, 6 masters, 5 BS/MA program, 3 to medicalschool, 1 to law school20 women, 8 minority, 18 first-generation collegestudents; ages 15–322 Goldwater Scholars, 1 NSF Graduate ResearchFellowship, 3 finalists, 10 local scholarships
SIAM 2012 E. Kostelich MATHEMATICAL & STATISTICAL SCIENCES 12 / 22

Modeling of glioblastomas (John Ingraham)
Swanson/Murray model: gt = ∇ · (D∇g)+αg(1−g)Use diffusion tensor imaging data to estimateanisotropyResults and Discussion 26
Figure 3.4: Qualitative study #2: Bilateral infiltration of both hemispheres alongthe corpus callosum.
biased GBM infiltration that could be valuable for further investigations of patient-specific
modeling.
3.4 Conclusion and Future Work
A model of biased glioblastoma GBM infiltration linking anatomical imaging atlases to
considerations of cell-microenvironment interactions was formulated and simulated for two
qualitative trial cases. The model assumes cell regulatory processes determinative of net
proliferation rates to be consistent in time but cell signaling and cell-matrix interaction
processes to be affected by the cellular microenvironment. Structural characteristics of
the organization of the microenvironment can be ascertained through diffusion tensor
imaging and an argument is made for why a determinant-normalizing tensor power
transformation can provide a reasonable estimation of the cellular migration anisotropy.
The migratory speed of cells is considered to be primarily dictated by dynamic availability
of adhesive ECM substrate.
SIAM 2012 E. Kostelich MATHEMATICAL & STATISTICAL SCIENCES 13 / 22

Chaotic saddles in Hurricane Katrina (Chris Wake,Angelica Deibel)
Weather Research and Forecast model on 128processorsInitialized with atmospheric analyses from Aug. 27–29,2005
Figure 5: The picture on the left is a 2 dimensional cross-section at the 12th vertical layer (3000 m altitude).It shows backward time attracting structures in red, and less attracting structures in yellow, and blue. Thepicture on the right also shows attracting structures in red, but in three dimensions.
Figure 6: Two dimensional cross sections at 12th vertical layer (3000 m altitude), showing most attractingstructures in red. The figure on the left is at 08/28/2005 8 UTC, and 08/28/2005 18 UTC on the right. Thecolored trajectories show the paths of idealized tracers. The black dot on each trajectory indicates the mostrecent position of the idealized particle, making the opposite end of the trajectory the origin of the tracer.
positions at that time in black.This data shows that the attracting structures shown in red have the expected e↵ect on the motion of the
tracers; they tend to move towards the red structures that are concentrated near the center of the hurricane.The figure on the left shows one hour of motion and it can be seen that each tracer’s immediate motionis around the core, as they begin to orbit. Over the next ten hours, each tracer follows the general curvearound the core that was gained in the first hour.
From the eleven hours of motion shown in the figure on the right, it becomes clear that we are onlyseeing a cross-section of the particle’s motion. The purple tracer’s motion is very short compared to pathsof the other four particles. This is partially because much of the purple particles’ motion is vertical, whichwe cannot see in these figures. But we can still see that it originally begins to orbit the hurricane movingsoutheast, but as the hurricane moves northwest the particle does not continue orbiting the hurricane core,
9
SIAM 2012 E. Kostelich MATHEMATICAL & STATISTICAL SCIENCES 14 / 22
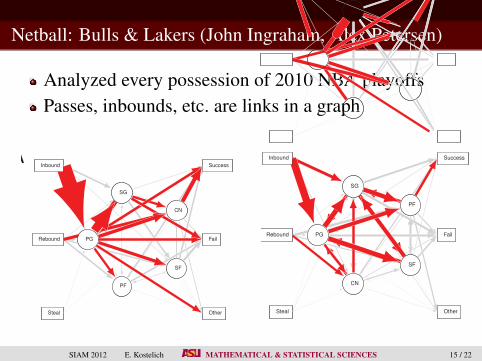
Netball: Bulls & Lakers (John Ingraham, Alex Petersen)
Analyzed every possession of 2010 NBA playoffsPasses, inbounds, etc. are links in a graph
A ,Inbound
,Rebound
,Steal
,PG
,SG
,CN
,SF
,PF
,Success
,Fail
,Other
,Inbound
,Rebound
,Steal
,PG
,SG
,CN
,SF
,PF
,Success
,Fail
,Other
B ,Inbound
,Rebound
,Steal
,SF
,PG
,PF
,CN
,SG
,Success
,Fail
,Other
,Inbound
,Rebound
,Steal
,SF
,PG
,PF
,CN
,SG
,Success
,Fail
,Other
C ,Inbound
,Rebound
,Steal
,PG
,PF
,SG
,SF
,CN
,Success
,Fail
,Other
,Inbound
,Rebound
,Steal
,PG
,PF
,SG
,SF
,CN
,Success
,Fail
,Other
D ,Inbound
,Rebound
,Steal
,PG
,SG
,PF
,SF
,CN
,Success
,Fail
,Other
,Inbound
,Rebound
,Steal
,PG
,SG
,PF
,SF
,CN
,Success
,Fail
,Other
Figure 3. Weighted graphs of ball transitions across two games for the (a) Bulls, (b)Cavaliers, (c) Celtics and (d) Lakers. Red edges represent transition probabilities summing
to the 60th percentile. Player nodes are sorted by decreasing degree clockwise from the left.
A ,Inbound
,Rebound
,Steal
,PF
,SG
,SF
,PG
,CN
,Success
,Fail
,Other
,Inbound
,Rebound
,Steal
,PF
,SG
,SF
,PG
,CN
,Success
,Fail
,Other
B ,Inbound
,Rebound
,Steal
,PG
,SF
,CN
,SG
,PF
,Success
,Fail
,Other
,Inbound
,Rebound
,Steal
,PG
,SF
,CN
,SG
,PF
,Success
,Fail
,Other
C ,Inbound
,Rebound
,Steal
,PF
,SG
,CN
,PG
,SF
,Success
,Fail
,Other
,Inbound
,Rebound
,Steal
,PF
,SG
,CN
,PG
,SF
,Success
,Fail
,Other
Figure 4. Weighted graphs of ball transitions with nodes sorted from lowest tohighest scoring success illustrate uphill-downhill flux. Data collected across two games forthe (a) Mavericks (highest uphill/downhill) , (b) Thunder (lowest uphill/downhill), and (c) Lakers.
13
A ,Inbound
,Rebound
,Steal
,PG
,SG
,CN
,SF
,PF
,Success
,Fail
,Other
,Inbound
,Rebound
,Steal
,PG
,SG
,CN
,SF
,PF
,Success
,Fail
,Other
B ,Inbound
,Rebound
,Steal
,SF
,PG
,PF
,CN
,SG
,Success
,Fail
,Other
,Inbound
,Rebound
,Steal
,SF
,PG
,PF
,CN
,SG
,Success
,Fail
,Other
C ,Inbound
,Rebound
,Steal
,PG
,PF
,SG
,SF
,CN
,Success
,Fail
,Other
,Inbound
,Rebound
,Steal
,PG
,PF
,SG
,SF
,CN
,Success
,Fail
,Other
D ,Inbound
,Rebound
,Steal
,PG
,SG
,PF
,SF
,CN
,Success
,Fail
,Other
,Inbound
,Rebound
,Steal
,PG
,SG
,PF
,SF
,CN
,Success
,Fail
,Other
Figure 3. Weighted graphs of ball transitions across two games for the (a) Bulls, (b)Cavaliers, (c) Celtics and (d) Lakers. Red edges represent transition probabilities summing
to the 60th percentile. Player nodes are sorted by decreasing degree clockwise from the left.
A ,Inbound
,Rebound
,Steal
,PF
,SG
,SF
,PG
,CN
,Success
,Fail
,Other
,Inbound
,Rebound
,Steal
,PF
,SG
,SF
,PG
,CN
,Success
,Fail
,Other
B ,Inbound
,Rebound
,Steal
,PG
,SF
,CN
,SG
,PF
,Success
,Fail
,Other
,Inbound
,Rebound
,Steal
,PG
,SF
,CN
,SG
,PF
,Success
,Fail
,Other
C ,Inbound
,Rebound
,Steal
,PF
,SG
,CN
,PG
,SF
,Success
,Fail
,Other
,Inbound
,Rebound
,Steal
,PF
,SG
,CN
,PG
,SF
,Success
,Fail
,Other
Figure 4. Weighted graphs of ball transitions with nodes sorted from lowest tohighest scoring success illustrate uphill-downhill flux. Data collected across two games forthe (a) Mavericks (highest uphill/downhill) , (b) Thunder (lowest uphill/downhill), and (c) Lakers.
13
SIAM 2012 E. Kostelich MATHEMATICAL & STATISTICAL SCIENCES 15 / 22

Others
Edge detection from noisy Fourier dataFinancial mathematics (Black-Scholes & variants)Rabies epizootics in Arizona and TexasLagrangian dynamics of radioactive particles fromFukushimaInverse problems in biofuelsAstrophysical jets
SIAM 2012 E. Kostelich MATHEMATICAL & STATISTICAL SCIENCES 16 / 22

The MCTP program—beginning July 16
Partnership with the Maricopa Community CollegeDistrict (141,000 students) and ASUMCCCD enrollments: 5,000 students in precalculus &engineering calculus (up 36% in the last 5 years)3-week, half-day summer enrichment programs atScottsdale Community College for 20 studentsSummer 1 program: Students with Calc I: time value ofmoney, Monte Carlo simulation, logistic growth,Lotka-Volterra models, WFF’n ProofSummer 2 program: Students with Calc II–III:symmetry & groups, numerical methods, statisticalanalysis of biological data
SIAM 2012 E. Kostelich MATHEMATICAL & STATISTICAL SCIENCES 17 / 22

MCTP at ASU
8-week summer research experienceRotating set of “project seminar” courses during theacademic year for 18–25 studentsMathematics and ClimateMathematics and CancerGraphs and NetworksMathematics and ImagingPrerequisites: calculus, linear algebra, differentialequationsExpose students to modern applications of mathematicsand provide rationale for the advanced courses
SIAM 2012 E. Kostelich MATHEMATICAL & STATISTICAL SCIENCES 18 / 22

Scaling up
Jennifer Widom: infolab.stanford.edu/∼widom
100,000 students signed up for her Introduction toDatabases course25,000 submitted assignments, 6,500 finished with astrong scoreSimilar effort by Sebastian Thrun for ArtificialIntelligenceAuto-generated multiple-choice tests & Web forumsfor the massesHand-graded assignments, programming project,written exams, etc. for Stanford students
SIAM 2012 E. Kostelich MATHEMATICAL & STATISTICAL SCIENCES 19 / 22

Why not adopt the Stanford model for CS&E?
Create a course for 100,000 K–12 teachers on appliedmath and computational scienceNSF could fund the creation of the initialinfrastructure, including semester-long buyouts forfaculty at 20–30 colleges & universities to prepareThe course could be team-taught or be a series ofvideos by one or two “star” professorsThe format could be adapted for many purposes
SIAM 2012 E. Kostelich MATHEMATICAL & STATISTICAL SCIENCES 20 / 22

The Stanford model, continued
Each college agrees to offer course credit and chargesits regular tuition to cover local expenses for tutoring,homework & exam grading, etc., for those who needcontining ed credits“Certificates of completion” could be offered foreveryone else who finishes the online portionThe “textbook” could be a Wiki and sold for 99 cents achapter (to cover expenses) through iTunes withembedded demos and programmed exercises on an iPad
SIAM 2012 E. Kostelich MATHEMATICAL & STATISTICAL SCIENCES 21 / 22

Acknowledgments
Thanks to:National Science FoundationASU College of Liberal Arts and SciencesSchool of Mathematical and Statistical Sciences, ASU
SIAM 2012 E. Kostelich MATHEMATICAL & STATISTICAL SCIENCES 22 / 22