research & forecast report fourth quarter 2016...
TRANSCRIPT

1Idaho Research & Forecast Market Report | Q4 2016 Year-End | Col l iers Internat ional
Research & Forecast ReportFourth Quarter 2016 | Year-EndCopyright © 2017 Colliers International Idaho

2Idaho Research & Forecast Market Report | Q4 2016 Year-End | Col l iers Internat ional
Submarkets
20
20
55
55
44
20
S P
leasa
nt V
alley
Rd
Eagle
Rd
36th
St
S Or
char
d St
Eagle
Rd
Chinden Blvd
W Victory Rd
Idaho St19th
St
Blac
k Cat
Rd
Can
Ada R
dCa
n Ad
a Rd
McD
erm
ott R
d
Ustick Rd
Victory Rd
King
s Rd
Roosevelt Ave
10th A
ve S
North
side
Blvd
22nd A
ve1st St S
11th Av
e
Garrity Blvd
Railroad St
Cirrus Dr
Midw
ay R
d
Homedale Rd
Midl
and
Blvd
Laster Ln
Mad
ison
Rd
11th
Ave
N
17th A
ve N9th St S
S In
diana
Ave
Deer Flat Rd Deer Flat Rd
Marble Front RdN
Kcid
RdLook
Rd
Farm
way
Rd
Ustick Rd
Farm
er R
d
S Federal Way
Capit
ol Blv
d
Broa
dway
Ave
Main St
Reserve St16
th St
3rd St
W Gowen Rd
Shaw Mountain Rd
Taft St
Chinden Blvd
Wag
ner R
d
Myrtle St
Myrtle St
8
9
10
11
12
13
19
1
2
3
4
5
14
16
17
18
Star
Rive
r Rd
7
State St6
15
Fort StFort St
McD
erm
ott R
d
Ada County Submarkets Canyon County Submarkets
1
2
3
4
Northwest
North End
Southwest
Airport
5
6
7
8
Central Bench
Downtown Boise
Downtown Peripheral
Garden City
9
10
11
12
Southeast
West Bench
Eagle
Meridian
13
14
15
16
Idaho Center
Northside
Downtown Nampa
South Nampa
17
18
19
Karcher
Middleton
Caldwell

3Idaho Research & Forecast Market Report | Q4 2016 Year-End | Col l iers Internat ional
BUSINESS DISTRICTS SEE RISING DEMAND & NEW CONSTRUCTION
OfficeValley wide we are still seeing high levels of positive absorption
Ada Canyon
Sout
h Na
mpa
7,5
95
Sout
hwes
t 12
,039
Nort
hsid
e Na
mpa
8,
545
Cald
wel
l 2
9,75
1
Idah
o Ce
nter
39
,474
Cent
ral B
ench
57
,682
Airport -5,170
Downtow
n Nampa -674
G.C./N. End/NW -44,301
Karc
her
14,3
86
Eagl
e 3
1,471
Wes
t Ben
ch
165,
629
Dow
ntow
n Bo
ise
319
,554
Mer
idia
n 3
6,90
2
Southeast -28,262
SUBMARKET ABSORPTIONYoY
VACANCY
ASKING RATE $
ABSORPTION
SUBMARKET ABSORPTIONCHANGE Q3-Q4
Airport (3,187)Central Bench (30,515)
Downtown 180,823 Eagle 21,665
Meridian (535)G.C. & N. End & N.W. (60,580)
Southeast Boise 2,760
Southwest Boise (12,346)West Bench 78,543
ADA CO. TOTAL 176,628
Downtown Nampa (12,952)Idaho Center 4,112
Karcher 29,442
Northside Nampa (158)
South Nampa -
Caldwell 4,819
CANYON CO. TOTAL 28,175
VALLEY TOTAL 204,803

4Idaho Research & Forecast Market Report | Q4 2016 Year-End | Col l iers Internat ional
VACANCY RATES
Q3 OFFICE TRENDS
» 364,000 square feet were added to the Downtown submarket total with the completion of the new Simplot Headquarters. They will occupy 351,000 square feet; the remaining 13,000 contributes to the increase in the submarket’s vacancy of over two percentage points. An additional 30,000 SF at Boise Plaza and 40,576 available SF at U.S. Bank Plaza also contributed to the increase in vacancy for Downtown.
» Vacancy in Southeast Boise will remain at a high percentage until the 68,000 square feet previously occupied by Simplot leases.
» The listing of Gem State Business Park and Lakeharbor caused a spike in vacancy and negative absorption for Northwest Boise.
» Class A office space is in steady demand, doing well in both Ada and Canyon Counties.
» With several sizable deals on the market, there is potential for larger vacancies to be quickly absorbed. There is some smaller spec construction in the outer submarkets but projects for the Downtown area are mostly build to suits.
» As larger projects in Downtown are finishing up, we hope to see an ease in labor costs for construction. This could change options for all realms of commercial real estate. New development may be seen in the coming year to accommodate growth across the Treasure Valley.
$1197
$1908
$1425
$2153
$1620
$1585
$1566
$1748$1327
$1840
$1269
$1153
$790
$1107
$1066
$1241
FULL SERVICEASKING RATES
Airport
Central Bench
Downtown
Eagle
Meridian
G.C. / N.End / NW
Southeast
Southwest
West Bench
Downtown Nampa
Idaho Center
Karcher
Northside Nampa
South Nampa
Caldwell
7.37%
14.21%
11.57%
9.04%
10.3%
16.66%
16.46%
12.67%
11.56%
3.32%
13.00%
5.03%
6.05%
5.92%
14.86%
Occupied Vacant
Airport
Central Bench
Downtown
Eagle
Meridian
G.C. / N.End / NW
Southeast
Southwest
West Bench
Downtown Nampa
Idaho Center
Karcher
Northside Nampa
South Nampa
Caldwell
7.37%
14.21%
11.57%
9.04%
10.3%
16.66%
16.46%
12.67%
11.56%
3.32%
13.00%
5.03%
6.05%
5.92%
14.86%
Occupied Vacant
Highlighting 20% out of 100%
5Idaho Research & Forecast Market Report | Q4 2016 Year-End | Col l iers Internat ional
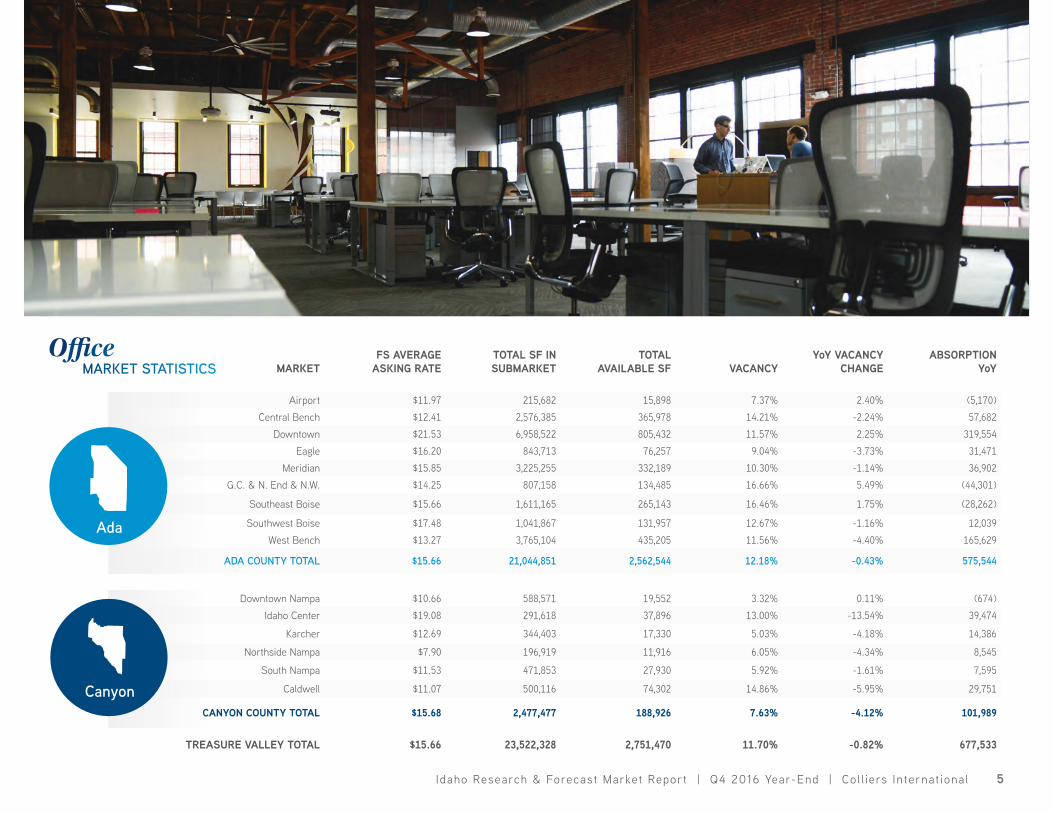
MARKETFS AVERAGE
ASKING RATETOTAL SF IN SUBMARKET
TOTAL AVAILABLE SF VACANCY
YoY VACANCY CHANGE
ABSORPTION YoY
Airport $11.97 215,682 15,898 7.37% 2.40% (5,170)Central Bench $12.41 2,576,385 365,978 14.21% -2.24% 57,682
Downtown $21.53 6,958,522 805,432 11.57% 2.25% 319,554 Eagle $16.20 843,713 76,257 9.04% -3.73% 31,471
Meridian $15.85 3,225,255 332,189 10.30% -1.14% 36,902 G.C. & N. End & N.W. $14.25 807,158 134,485 16.66% 5.49% (44,301)
Southeast Boise $15.66 1,611,165 265,143 16.46% 1.75% (28,262)
Southwest Boise $17.48 1,041,867 131,957 12.67% -1.16% 12,039 West Bench $13.27 3,765,104 435,205 11.56% -4.40% 165,629
ADA COUNTY TOTAL $15.66 21,044,851 2,562,544 12.18% -0.43% 575,544
Downtown Nampa $10.66 588,571 19,552 3.32% 0.11% (674)Idaho Center $19.08 291,618 37,896 13.00% -13.54% 39,474
Karcher $12.69 344,403 17,330 5.03% -4.18% 14,386
Northside Nampa $7.90 196,919 11,916 6.05% -4.34% 8,545
South Nampa $11.53 471,853 27,930 5.92% -1.61% 7,595
Caldwell $11.07 500,116 74,302 14.86% -5.95% 29,751
CANYON COUNTY TOTAL $15.68 2,477,477 188,926 7.63% -4.12% 101,989
TREASURE VALLEY TOTAL $15.66 23,522,328 2,751,470 11.70% -0.82% 677,533
Office MARKET STATISTICS
Ada
Canyon
6Idaho Research & Forecast Market Report | Q4 2016 Year-End | Col l iers Internat ional
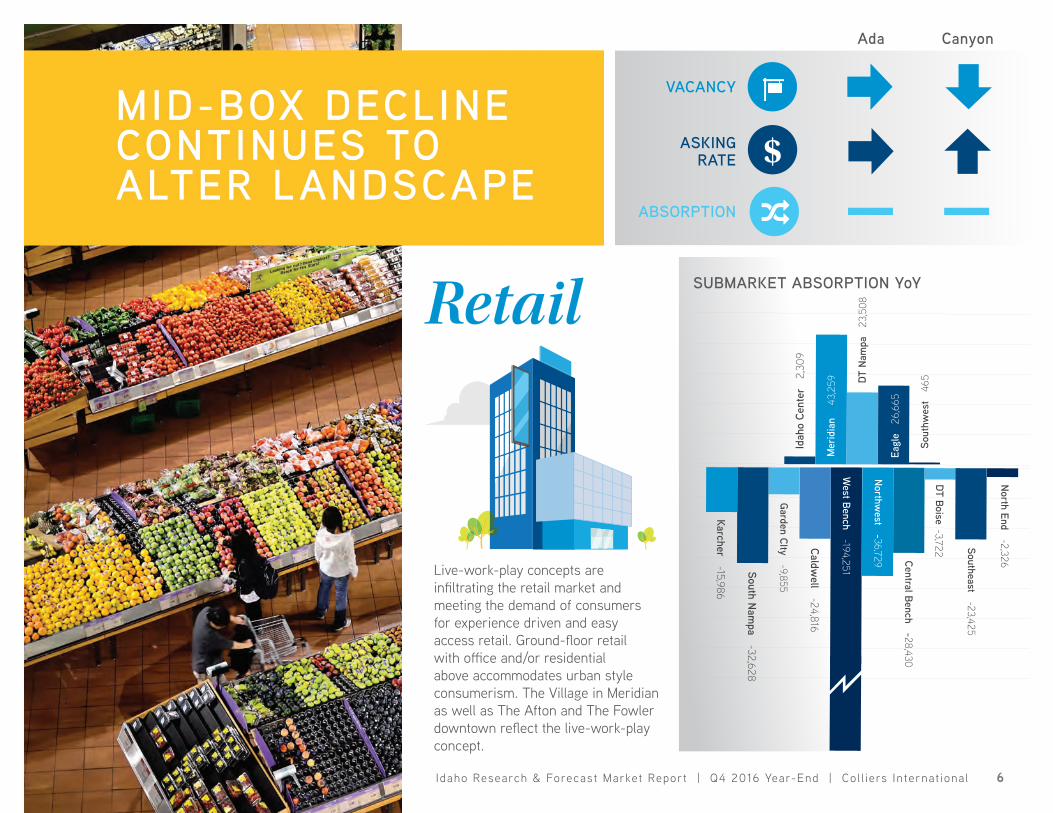
Retail
MID-BOX DECLINE CONTINUES TO ALTER LANDSCAPE
Idah
o Ce
nter
2,
309
Northwest -36,729 Central Bench -28,430
North End -2,326
Sout
hwes
t 4
65DT N
ampa
23
,508
Mer
idia
n
43,2
59
Southeast -23,425
West Bench -194,251
Eagl
e 2
6,66
5
Garden CIty -9,855
Karcher -15,986
South Nampa -32,628
Caldwell -24,816
DT Boise -3,722
SUBMARKET ABSORPTION YoY
Ada Canyon
VACANCY
ASKING RATE $
ABSORPTION
Live-work-play concepts are infiltrating the retail market and meeting the demand of consumers for experience driven and easy access retail. Ground-floor retail with office and/or residential above accommodates urban style consumerism. The Village in Meridian as well as The Afton and The Fowler downtown reflect the live-work-play concept.

7Idaho Research & Forecast Market Report | Q4 2016 Year-End | Col l iers Internat ional
TRENDS
» Online shopping continues to affect the retail sector of CRE, driving the decrease in mid-box and increase in experience driven retail. This theme is being termed “The Amazon Effect” and may demand more dynamic responses from retail users in the coming year. There may be potential for conversion opportunities of vacant mid-box locations.
» Class A retail space is still in demand and doing well valley-wide.
» There are active tenants in the Treasure Valley; the challenge is finding the right locations and affordable rates as inventory is decreasing. High costs impede new spec construction as an option for retail development. The rise in interest rates may have an adverse effect on retail in the coming year.
» New developments in the Downtown area, such as hotels, office buildings, residential projects, and the Boise Centre expansion, are keeping the retail demand high for DT and Periphery submarkets. Build to suit and other new developments are being proposed for outer submarkets, catching the demand spillover from the downtown core and bringing retail opportunities to newer residential areas.
» Eagle has a lot of development opportunities, build to suits, and pads available; only a certain number of these will be able to be built, else over building in that area may occur. High construction costs may temper development in this submarket.
$1358
$1448
$1204
$1324
$1829
$1551
$1527
$889
$1231
$1427
$1050
$1364
$1345
$1199
$1365
ASKING RATES
VACANCY RATES
Garden City
Downtown
Eagle
Meridian
Northwest
Southeast
Southwest
West Bench
Downtown Nampa
Idaho Center
Karcher
South Nampa
Caldwell
5.96%
6.28%
4.04%
8.35%
6.40%
9.93%
8.88%
5.39%
13.95%
0.73%
10.55%
4.77%
13.33%
9.66%
Occupied Vacant
Central Bench
North End
7.56%
Garden City
Downtown
Eagle
Meridian
Northwest
Southeast
Southwest
West Bench
Downtown Nampa
Idaho Center
Karcher
South Nampa
Caldwell
5.96%
6.28%
4.04%
8.35%
6.40%
9.93%
8.88%
5.39%
13.95%
0.73%
10.55%
4.77%
13.33%
9.66%
Occupied Vacant
Central Bench
North End
7.56%
Highlighting 15% out of 100%

8Idaho Research & Forecast Market Report | Q4 2016 Year-End | Col l iers Internat ional
MARKETNNN AVERAGE
ASKING RATETOTAL SF IN SUBMARKET
TOTAL AVAILABLE SF VACANCY
YoY VACANCY CHANGE
YoY ABSORPTION
Central Bench $13.24 1,477,031 111,694 7.56% 1.92% (28,430)
Downtown Boise $18.29 1,669,238 99,502 5.96% 0.46% (3,722)
Eagle $15.51 946,026 59,368 6.28% -2.17% 26,665
Meridian $15.27 3,584,685 144,987 4.04% -1.21% 43,259
Garden City $8.89 752,910 62,863 8.35% 1.31% (9,855)
Northwest Boise $12.31 800,804 79,495 9.93% 4.59% (36,729)
Northend $11.99 179,980 11,525 6.40% 1.43% (2,326)
Southeast Boise $13.65 1,243,070 110,419 8.88% 2.26% (23,425)
Southwest Boise $13.64 1,724,473 92,991 5.39% -0.03% 465
West Bench $14.27 2,990,700 417,213 13.95% 6.50% (194,251)
Ada County Total $13.65 15,368,917 1,190,057 7.74% 1.58% (228,349)
Downtown Nampa $14.48 823,928 6,028 0.73% -2.85% 23,508
Idaho Center $13.58 1,322,811 139,496 10.55% -0.17% 2,309
Karcher $13.45 2,662,981 126,915 4.77% 0.60% (15,986)
South Nampa $12.04 716,417 95,507 13.33% 4.55% (32,628)
Caldwell $10.50 972,450 93,984 9.66% 2.55% (24,816)
Canyon County Total $13.06 6,964,999 480,116 6.89% 0.94% (65,799)
TREASURE VALLEY $13.65 22,333,916 1,670,173 7.48% 1.39% (294,148)
RetailMARKET STATISTICS
Ada
Canyon
8Idaho Research & Forecast Market Report | Q4 2016 Year-End | Col l iers Internat ional

9Idaho Research & Forecast Market Report | Q4 2016 Year-End | Col l iers Internat ional
VACANCY SQUEEZED EVEN TIGHTER
VACANCY
ASKING RATE $
Ada Canyon
ABSORPTION
IndustrialVacancy continues to get lower with 671,241 SFof positive absorption in the last year. There was no significant change in vacancy from last quarter, but a significant increase in asking rate YoY.
Sout
heas
t 6
8,55
7
North
side
Nam
pa 5
6,21
1
Sout
hwes
t 8
6,27
4
Sout
h Na
mpa
51
,356
Caldwell -39,524
Airp
ort
37,9
00
Idah
o Ce
nter
18
,142
Downtow
n Boise -2,900
Mer
idia
n 2
27,7
53
Cent
ral B
ench
19
5
Downtow
n Nampa -67,377
G.C./N. End/NW -32,812
Karcher -1,200
Eagl
e 5
70
Wes
t Ben
ch
268,
096
SUBMARKET ABSORPTION YoY
2.33%
2.39%
2.35%TOTAL VACANCY
10Idaho Research & Forecast Market Report | Q4 2016 Year-End | Col l iers Internat ional
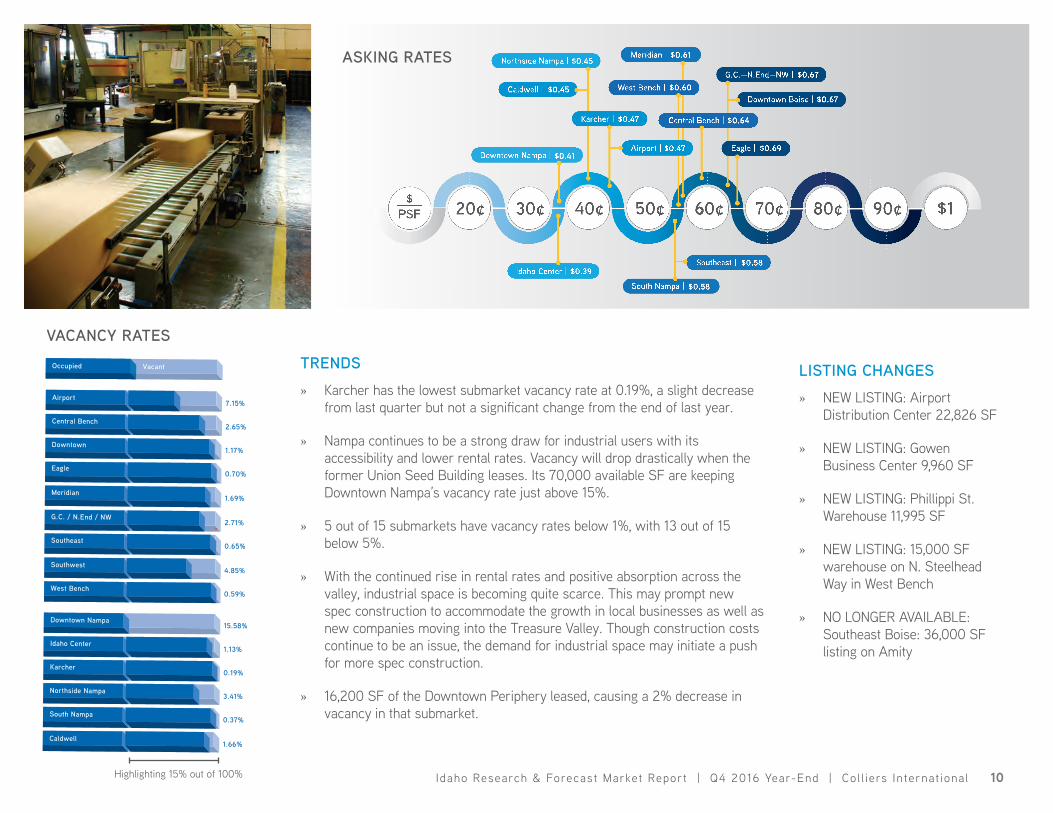
VACANCY RATES
TRENDS » Karcher has the lowest submarket vacancy rate at 0.19%, a slight decrease
from last quarter but not a significant change from the end of last year.
» Nampa continues to be a strong draw for industrial users with its accessibility and lower rental rates. Vacancy will drop drastically when the former Union Seed Building leases. Its 70,000 available SF are keeping Downtown Nampa’s vacancy rate just above 15%.
» 5 out of 15 submarkets have vacancy rates below 1%, with 13 out of 15 below 5%.
» With the continued rise in rental rates and positive absorption across the valley, industrial space is becoming quite scarce. This may prompt new spec construction to accommodate the growth in local businesses as well as new companies moving into the Treasure Valley. Though construction costs continue to be an issue, the demand for industrial space may initiate a push for more spec construction.
» 16,200 SF of the Downtown Periphery leased, causing a 2% decrease in vacancy in that submarket.
$0.67
$0.58South Nampa |
$0.67
$0.58
$0.45
$0.61$0.45
$0.69
$0.47
$0.39
$0.41
$0.60
$0.64
$0.47
ASKING RATES
Airport
Central Bench
Downtown
Eagle
Meridian
G.C. / N.End / NW
Southeast
Southwest
West Bench
Downtown Nampa
Idaho Center
Karcher
Northside Nampa
South Nampa
Caldwell
7.15%
2.65%
1.17%
0.70%
1.69%
2.71%
0.65%
4.85%
0.59%
15.58%
1.13%
0.19%
3.41%
0.37%
1.66%
Occupied Vacant
Airport
Central Bench
Downtown
Eagle
Meridian
G.C. / N.End / NW
Southeast
Southwest
West Bench
Downtown Nampa
Idaho Center
Karcher
Northside Nampa
South Nampa
Caldwell
7.15%
2.65%
1.17%
0.70%
1.69%
2.71%
0.65%
4.85%
0.59%
15.58%
1.13%
0.19%
3.41%
0.37%
1.66%
Occupied Vacant
Highlighting 15% out of 100%
LISTING CHANGES » NEW LISTING: Airport
Distribution Center 22,826 SF
» NEW LISTING: Gowen Business Center 9,960 SF
» NEW LISTING: Phillippi St. Warehouse 11,995 SF
» NEW LISTING: 15,000 SF warehouse on N. Steelhead Way in West Bench
» NO LONGER AVAILABLE: Southeast Boise: 36,000 SF listing on Amity

11Idaho Research & Forecast Market Report | Q4 2016 Year-End | Col l iers Internat ional
SUBMARKETS TOTAL SFAVAILABLE
SQUARE FEET Q4 VACANCYVACANCY
CHANGE YoYABSORPTION
YoYAVG. NNN
ASKING RATECHANGE IN AVG.
ASKING RATE YoY
Airport 4,302,092 307,390 7.15% -0.88% 37,900 $0.47 $0.03
Central Bench 2,645,085 70,202 2.65% -0.01% 195 $0.64 $0.08
Downtown Boise 1,000,748 11,733 1.17% 0.38% (2,900) $0.67 $0.17
Eagle 351,896 2,450 0.70% -0.16% 570 $0.69 $(0.15)
Meridian 4,102,439 69,298 1.69% -5.55% 227,753 $0.61 -
G.C. / N.End / NW 2,191,634 59,365 2.71% 1.50% (32,812) $0.67 $0.15
Southeast 5,904,914 38,320 0.65% -1.16% 68,557 $0.58 $0.15
Southwest 1,941,561 94,107 4.85% -4.44% 86,274 $0.63 $0.05
West Bench 7,459,815 43,648 0.59% -3.59% 268,096 $0.60 $0.11
ADA COUNTY TOTAL 29,900,184 696,513 2.33% -2.19% 653,633 $0.58 $0.03
Downtown Nampa 470,293 73,277 15.58% 14.33% (67,377) $0.41 $0.16
Idaho Center 2,040,907 23,040 1.13% -0.89% 18,142 $0.39 $(0.09)
Karcher 2,051,079 3,976 0.19% 0.06% (1,200) $0.47 $0.02
Northside Nampa 6,051,775 206,500 3.41% -0.93% 56,211 $0.45 -
South Nampa 817,751 3,000 0.37% -6.28% 51,356 $0.58 $0.07
Caldwell 4,951,252 82,184 1.66% 0.80% (39,524) $0.45 $(0.03)
CANYON COUNTY TOTAL 16,383,057 391,977 2.39% -0.11% 17,608 $0.55 $0.11
TREASURE VALLEY 46,283,241 1,088,490 2.35% -1.45% 671,241 $0.58 $0.07
IndustrialMARKET STATISTICS
Ada
Canyon

12Idaho Research & Forecast Market Report | Q4 2016 Year-End | Col l iers Internat ional
George Iliff, Managing Owner
INVESTMENT BROKERAGE SERVICESClay Anderson, MBA, CPALew GoldmanLew Manglos, MBA, CCIM, SIOR
OFFICE BROKERAGE SERVICESJamie AndersonScott FeighnerScott Raeber, MBA, CCIMSteve Winger
RETAIL BROKERAGE SERVICESBrook BlakesleeDavid CadwellMike ChristensenMallisa Jackson
INDUSTRIAL BROKERAGE SERVICESSteve FosterDevin Ogden, CCIMJake Tucker
LAND BROKERAGE SERVICESJimmy RoumanisJohn Starr
CANYON COUNTY BROKERAGE SERVICESLincoln HagoodBryant JonesMike Peña
PROPERTY MANAGEMENTLisa CochranPatty GordonKelly SchneblyJustin Vogel
MARKET CONTACT:
Melanie NielsenDirector of Marketing & PR | Boise+1 208 472 [email protected]
Aubrielle HollyResearch Coordinator | Boise+1 208 472 [email protected]
Copyright © 2016 Colliers International. The information contained herein has been obtained from sources deemed reliable. While every reasonable effort has been made to ensure its accuracy, we cannot guarantee it. No responsibility is assumed for any inaccuracies. Readers are encouraged to consult their professional advisors prior to acting on any of the material contained in this report.
Revenue
$2.5B(US$)
Managing
2.0BComprised of
16,000
Lease/ sale transactions
80,000Transaction value
$112B(US$)
Established in
66countries
*Includes a�liates
professionals (square feet)
Colliers International | Idaho 755 W. Front Street, Suite 300 Boise, Idaho | +1 208 345 9000
Graphics by Sara Smart