research in the usepa - water resources center in the usepa janet keough, ph.d. associate director...
TRANSCRIPT

Research In the USEPA
Janet Keough, Ph.D. Associate Director for Science
U.S. EPA/Office of Research and Development, National Health and Environmental Effects Research Laboratory
Mid-Continent Ecology Division- Duluth
US Environmental Protection AgencyOffice of Research and Development

National Environmental Policy Act of 1969 (NEPA); 42 U.S.C. 4321-4347
Chemical Safety Information, Site Security and Fuels Regulatory Relief Act Public Clean Air Act (CAA); 42 U.S.C. s/s 7401 et seq. (1970)
Clean Water Act (CWA); 33 U.S.C. ss/1251 et seq. (1977)
Comprehensive Environmental Response, Compensation, and Liability Act (CERCLA or Superfund) 42 U.S.C. s/s 9601 et seq. (1980)
Emergency Planning & Community Right-To-Know Act (EPCRA); 42 U.S.C.
Endangered Species Act (ESA); 7 U.S.C. 136;16 U.S.C. 460 et seq. (1973)
Federal Insecticide, Fungicide and Rodenticide Act (FIFRA); 7 U.S.C. s/s 135 et seq. (1972)
Federal Food, Drug, and Cosmetic Act (FFDCA) 21 U.S.C. 301 et seq.
Food Quality Protection Act (FQPA) Public Law 104-170, Aug. 3, 1996
Freedom of Information Act (FOIA); U.S.C. s/s 552 (1966)
Occupational Safety and Health Act (OSHA); 29 U.S.C. 651 et seq. (1970)
Oil Pollution Act of 1990 (OPA); 33 U.S.C. 2702 to 2761
Pollution Prevention Act (PPA); 42 U.S.C. 13101 and 13102, s/s et seq. (1990)
Resource Conservation and Recovery Act (RCRA); 42 U.S.C. s/s 321 et seq. (1976)
Safe Drinking Water Act (SDWA); 42 U.S.C. s/s 300f et seq. (1974)
Superfund Amendments and Reauthorization Act (SARA); 42 U.S.C.9601 et seq. (1986)
Toxic Substances Control Act (TSCA); 15 U.S.C. s/s 2601 et seq. (1976)
National Laws with EPA Oversight

Today’s issues are broad in scope, deep in complexity and widespread
in their impacts.

Nick D. Kim
http://lab-initio.com/index.html

21st Century Environmental Challenges
• On climate change: Unless we act dramatically and quickly, science tells us our climate and our way of life are literally in jeopardy. – John Kerry, Secretary of State
• Nitrogen and phosphorus are leading causes of water pollution across the nation, threatening surface water quality and drinking water supplies. – US EPA
• Only a few hundred of the many thousands of chemicals in use in the US have been tested for safety.
– US EPA
• America’s critical infrastructure for drinking water and waste water systems received a grade of D, and may soon fail to meet society’s needs.
– Am Soc Civil Engineers
5

“Science is and has always been the backbone of the
EPA’s decision-making.”
Gina McCarthy - EPA AdministratorNovember, 2013

Science to Support EPA’s Mission
Program Offices(Air, Water, Waste, Chemicals)
Office of Research and Development
National Decisions
Scientific Foundation
Regional OfficesPrimary Interface
with States
Implementation
EPA Mission:Protect Human Health and the
Environment
• Policies• Regulations
• Congressional mandates
7

Provide science and technology to support EPA’s mission of protecting human health and the environment.
Mission for Research & Development
Bristol Bay, Alaska
GulfOil
Spill
8
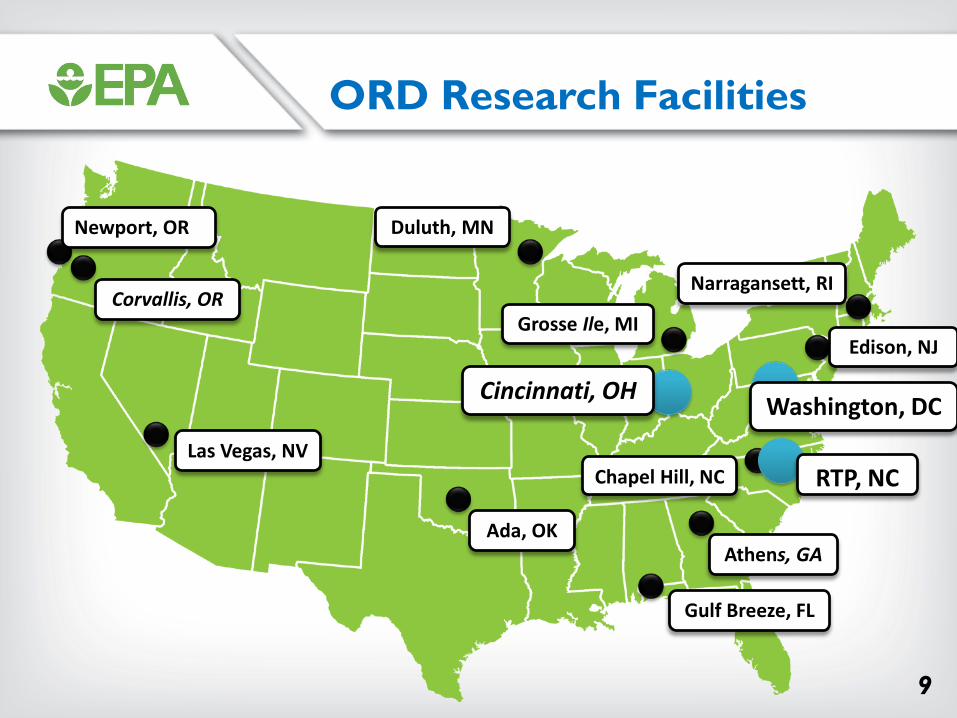
ORD Research Facilities
Newport, OR
Las Vegas, NV
Duluth, MN
Ada, OK
Gulf Breeze, FL
Athens, GA
Chapel Hill, NC
Grosse Ile, MI
Narragansett, RI
Washington, DCCincinnati, OH
RTP, NC
Corvallis, OR
Edison, NJ
9

Air, Climate & Energy
Safe & SustainableWater Resources
Sustainable & Healthy Communities
Chemical Safety for Sustainability
Human Health Risk Assessment
Homeland Security
ORD Research Programs
10

Mid-Continent Ecology Division
Duluth, MN
Grosse Ile, MI

USEPA Mid-Continent Ecology DivisionResearch to Answer Agency Programs
High Priority Agency Problems
Ecosystem Resil ience &
Sustainability
PredictiveEcotoxicology

Drivers of Research for EPA’s Mid-Continent Ecology Division
National Drivers:FIFRA Pesticides Risk Assessments
FQPA Pesticides and Personal Use Chemicals RACWA Chemicals in Water, Integrity of Waters of the US
TSCA Chemicals in Industry RA
Regional Drivers:Great Lakes Water Quality Agreement
Great Lakes Restoration InitiativeRegional WQ Criteria
Regional Water Quality MonitoringState Environmental Issues

Addressing EPA’s National Research Priorities Within the Great Lakes Region

USEPA Mid-Continent Ecology DivisionResearch to Answer Agency Programs
High Priority Agency Problems
Ecosystem Resilience &
Sustainability
PredictiveEcotoxicology

Predicting Chemical Toxicitywith Limited Data
Identify “normal” biological pathways whose perturbation results in adverse responses to chemicals
Determine chemical characteristics that enable them to perturb these pathways
Develop mechanism-based approaches to measure these characteristics In silico (computational) methods (e.g., QSAR) In vitro (e.g., HTP) toxicity pathway assays Short-term in vivo tests with pathway-specific endpoints (including
suites of genomic measures)
Translate these mechanistic data into transparent depictions of potential risk/hazard

A Paradigm Shift in Risk Assessment

Molecularinitiating event
Key events or predictiverelationships spanning
levels of biological organization
Adverse outcomerelevant to
risk assessment
QSAR, read acrossIn vitro, HTS
Biomarkers‘Omics’
Predictive Toxicology

Toxicant Macro-MolecularInteractions
Cellular Responses
OrganResponses
IndividualResponses
PopulationResponses
Adverse Outcome Pathway
AOPs Provide an Organization and Communication Framework
Molecularinitiating event
Key events or predictiverelationships spanning
levels of biological organization
Adverse outcomerelevant to
risk assessment
19

ChemicalPropertyProfile
Receptor/Ligand
InteractionDNA Binding
Protein Oxidation
Gene Activation
Protein Production
Altered SignalingProtein
Depletion
Altered PhysiologyDisrupted
HomeostasisAltered Tissue Developmentor Function
LethalityImpaired
DevelopmentImpaired
ReproductionCancer
ToxicantMacro-Molecular
InteractionsCellular
ResponsesOrgan
ResponsesIndividual
Responses
Structure
Recruitment
Extinction
PopulationResponses
Adverse Outcome Pathway
AOPs Provide an Organization and Communication Framework
Molecularinitiating event
Key events or predictiverelationships spanning
levels of biological organization
Adverse outcomerelevant to
risk assessment
20

ChemicalPropertyProfile
Receptor/LigandInteraction
DNA BindingProtein Oxidation
Gene ActivationProtein ProductionAltered SignalingProtein Depletion
Altered PhysiologyDisrupted
HomeostasisAltered Tissue Developmentor Function
LethalityImpaired
DevelopmentImpaired
ReproductionCancer
Toxicant Macro-MolecularInteractions
Cellular Responses
OrganResponses
IndividualResponses
Structure
Recruitment
Extinction
PopulationResponses
Adverse Outcome Pathway
CN
NN
Aromatase inhibition
8
0
2
4
6
E2
(ng/
ml)
*
*
0
10
20
Vtg
(mg/
ml)
*
* *Control 2 10 50
Fadrozole (µg/l)
8
0
2
4
6
E2
(ng/
ml)
*
*
0
10
20
Vtg
(mg/
ml)
*
* *Control 2 10 50
Fadrozole (µg/l)
-20 -18 -16-14-12 -10 -8 -6 -4 -2 0 2 4 6 8 10 12 14 16 18 20Exposure (d)
0
2
4
6
8
10
(Tho
usan
ds)
Cum
ulat
ive
Num
ber o
f Egg
s
Control21050
Fadrozole (ug/L)
***
-20 -18 -16-14-12 -10 -8 -6 -4 -2 0 2 4 6 8 10 12 14 16 18 20Exposure (d)
0
2
4
6
8
10
(Tho
usan
ds)
Cum
ulat
ive
Num
ber o
f Egg
s
Control21050
Fadrozole (ug/L)
***
Reduced E2, Vtg synthesis
Impaired vitellogenesis Reduced fecundity
AOPs Provide an Organization and Communication Framework
Molecularinitiating event
Key events or predictiverelationships spanning
levels of biological organization
Adverse outcomerelevant to
risk assessment
21
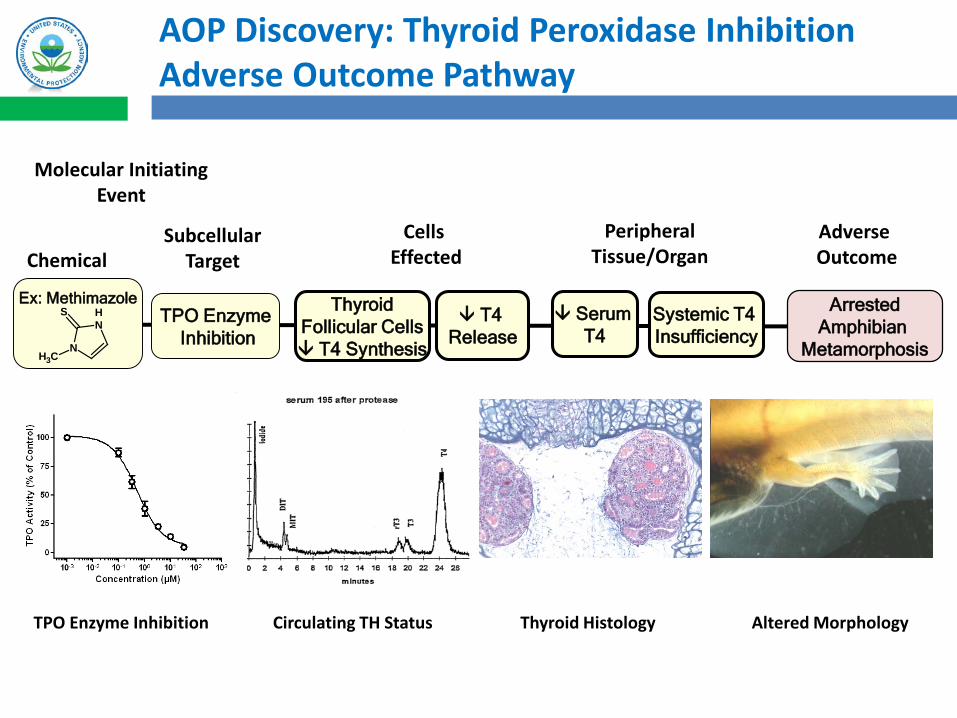
ChemicalSubcellular
TargetCells
EffectedAdverse Outcome
PeripheralTissue/Organ
Ex: MethimazoleTPO Enzyme
Inhibition
ThyroidFollicular Cells T4 Synthesis
Serum T4
Systemic T4 Insufficiency
ArrestedAmphibian
Metamorphosis
SNH
NCH3
T4 Release
Molecular InitiatingEvent
Circulating TH Status Altered MorphologyTPO Enzyme Inhibition Thyroid Histology
AOP Discovery: Thyroid Peroxidase Inhibition Adverse Outcome Pathway

USING CROWD-SOURCINGAND WIKI TECHNOLOGY TOGATHER AOP RESEARCHRESULTS AND KNOWLEDGEFOR A BROAD SPECTROM OFADVERSE PATHWAYS
AOP-KBHub
Shared chemical, biological and toxicological ontologies
Third party Applicationsand plugins
AOP Xplorer
Visualize attribute networks to discover
& explore AOPs in a broader
context
Effectopedia
Detailed development of structured & computational
AOPs
AOP Wiki
Collaborative development of AOP
descriptions & evidence
Intermediate Effects DB
Chemical-related AOP components in a regulatory
context
AOP Knowledgebase (AOP-KB)
The AOP-KB project is an OECD initiative, which is executed as a close collaboration between the European Commission's
Joint Research Centre (JRC), the US Environmental Protection Agency (EPA), and the US Army Engineer Research
& Development Center (ERDC).

Data needed for development
ScreeningRead Across
Environmental Surveillance
Prioritization, Integrated Approaches to Testing and
Assessment
Quantitative Risk AssessmentsExposure Reconstruction
Domains of Applicability
Cost and time required for development
Uncertainties for Prediction/extrapolation
•New chemicals (PMN)•Pesticide inerts•Replacements•Green chemistry
•TSCA
•Pesticides•HPV•WQ Standards
•FIFRA•CWA
•Current use•High economic value•Cost benefit•Criminal enforcement actions
•Social-economic-environmental
Examples
Balancing Breadth and Depth of AOPs

Pathway-Based Approaches to Effects-Based Monitoring in the Great Lakes
Chemical monitoring strategies are effective only for chemicals whose hazards are well understood and for which sensitive analytical methods are available.
Which chemicals in the environment should concern us?
Biological effects monitoring can be a powerful complement to chemical monitoring:
• To detect exposure to chemicals for which analytical methods are unavailable or impractical.
• To provide insight into the potential biological consequences of those exposures.
NEED: Develop practical effects-based approaches for monitoring chemicals of emerging concern (e.g., with currently unknown hazard or exposure potentials) in the Great Lakes.

Pathway-Based Approaches to Effects-Based Monitoring in the Great Lakes
APPROACH:
• Caged fish studies conducted at 32 locations spread across 5 Great Lakes AOCs
• Complementary in vitro bioassay analyses (EPA), analytical chemistry (FWS), and feral fish histology/biomarkers (USGS).
•St. Louis River/ Duluth Harbor
•Lower Green Bay/ Fox River
•Milwaukee Estuary •Detroit River
•Maumee River

Sequence Alignment to Predict Across Species Susceptibility(SeqAPASS)

Predict Relative Intrinsic Susceptibility
• Intrinsic susceptibility: the vulnerability of an organism to chemical insult due to its inherent biological composition– Receptor/enzyme (protein) available for the chemical to act upon
• Relative: based on comparisons to a query protein– Molecular target conservation is one component of multiple determinants
of species susceptibility

Strategic Automated Approach for Assessing Protein Similarity among Taxa
Level 1
Level 2
Level 3
Developed with both researchers and risk assessors in mind

Level 1 SeqAPASS Results
More likely to be susceptible Less likely
to be susceptible
Acetylcholinesterase Inhibition

USEPA Mid-Continent Ecology DivisionResearch to Answer Agency Programs
High Priority Agency Problems
Ecosystem Resilience &
Sustainability
PredictiveEcotox icology

Prospectus for the Near FutureGreat Lakes Water Quality Agreement : Coupling Land with Watersheds and Nearshore Zones

What sustains the integrity of land-water systems across the coastal mosaic?
• An array of aquatic habitats that are linked to and influenced by watersheds and offshore zones
• Complex hydrology & connectivity• Understanding linkages is essential for effective monitoring, assessment, and
management
Watershed
Offshore
The coastal mosaic:

SensorsCTD
Fluorometer(calibrated to Chl a)
TransmissometerLaser Optical Plankton Counter
(Zooplankton >150 µm)NO3
Along-shoreline towing survey strategy
Evolved to be along constant depth contour
High-resolution data along 500 to 1000 km of shoreline
Courtesy of Kelly and Yurista

y = 0.35x + 0.46R² = 0.37, n= 51
y = 0.45x + 0.69R² = 0.57, n= 62
0.0
0.5
1.0
1.5
2.0
2.5
0 0.5 1 1.5 2 2.5
Tow
-bas
edin
tegr
ated
wat
er co
lum
n av
erag
esfo
r bot
tom
dep
th a
nd sa
me
segm
ents
hed
(Ln(
Chla
), µg
/L)
August
September
Spatially Balanced Probability Survey- 45 stations in each lake
- 0-30 m depth and <5 km from shore
AGRICULTURE METRIC)
National Coastal Condition AssessmentA comprehensive, efficient, and powerful style of point sampling
EPA-OW included US Great Lakes
GLEI projectDanz et al. 2005, 2007


Kelly, Bartsch, Vinson, Yurista, Yule et al. In prep)
Statistical Confidence ModelingNomograph for Whole Lake Estimates as a Function of Effort
(ordered subsets of sample size n, using 2011 design results)

Integrated Coastal Observing Systems for Large Lakes
High-resolution tow “census”
along 20-m depth contour
Probabilistic surveyNational Coastal
Condition Assessment
Basin-wide watershed stressor
characterization

Nokomis 3-5 September 2014
Nokomis 12-17 September 2014
Initial testing of EPA’s AUV (Slocum glider)
in Lake Superior
Development of tools for monitoring the Great Lakes: Autonomous Underwater Vehicles (AUVs)
Cooperative effort of GLNPO, MED and
UMN-Duluth (Drs. Jay Austin and Laura
Fiorentino post doc)
Nokomis 25 Sep – 6 Oct(out and back)

Ecosystem Forecasting Models toPredict Response to Pollution Management

The Heartland Feeds the Gulf of Mexico
41

EPACOM
dissolved oxygen
sediment
zooplankton
carbon cycle
phytoplankton
CMAQ loads
dissolved and detrital carbon
phosphorus
nitrogen
silicon
nutrient cycle
• 20 state variables• nitrogen
– NO3, NH4
– DON, LON, RON
• phosphorus– SRP, DOP, LOP,
ROP
• silicon – SA, SU
• carbon– DOC, LOC, ROC
• 2 phytoplankton• 1 zooplankton
Gulf of Mexico Dissolved Oxygen Model

Office of Research and Development
Model Predicted (map) versus Observed (squares) Dissolved Oxygen in the Gulf of Mexico

Three Overlapping Phases in the History of the EPA
1) Command and Control
2) Risk assessment / Risk management
3) Sustainability

Sustainability
“… to create and maintain conditions, under which humans and nature can exist in productive harmony, that permit fulfilling the social, economic, and other requirements of present and future generations.”
- NEPA 1969, NAS 2011
45


Environment
EconomySocial Systems
Area of Concern (AOC) RemediationPromotes Sustainability
Fishing Related EconomyLand and Property ValuesWaterfront AmenitiesEco-TourismBoating
Drinking Water Quality Contaminant Remediation
Brownfield redevelopment
Wastewater Treatment
Science Education
Environmental Justice
Tribal culture (wild rice,Fish consumption)
Water Contact Sports
47

Partnerships– EPA ORD, Region 5 , Great Lakes National Program
Office, Brownfields Redevelopment Program, Great Lakes Legacy Program, Great Lakes Restoration Initiative, Superfund
– NOAA Sea Grant and National Estuarine Reserve Research Program
– Center for Disease Control Agency for Toxic Substances and Disease Registry
– State Natural Resources management agencies– Community and non-profit organizations for the
restoration and redevelopment of Great Lakes AOCs
The benefits of contaminated sediment remediation, habitat restoration, and water quality protection to Great Lakes coastal
communities

Ecosystems (nature)
Biophysical structuree.g., habitat
Functione.g., nutrient cycling
Human wellbeing
Socio-cultural benefitse.g., food, recreation
Economic valuee.g., green GDP
Ecosystem services link nature to human wellbeing
Ecosystem services
e.g., fish populations,clean water, clean air

Natural walleyepopulations
Recreational fishingSpawning habitat
in Upper St. Louis River
Ecosystem structure Ecosystem service Human Benefit
Case Study: Remediation-to-Restoration-toRevitalization of the St Louis River Area of Concern

Based on Sierszen et al. (2012). A Review of selected ecosystem services provided by coastal wetlands of the Laurentian Great Lakes. Aquatic Ecosystem Health and Management
Ecosystem Services of Great Lakes Coastal Wetlands
Ecosystem Service Indicator Societal
ImportanceSpatial
DistributionInformationAvailability
WildlifePopulation densities, habitat
quality, and harvest for select bird, amphibian and reptile species
High but variable
Widespread but variable by species
High but variable by
species
Fisheries Population densities & age structure, habitat quality for select
speciesVery High Widespread High
Water Quality Nutrient concentrations and cycling, sedimentation, DO regime Very High Widespread High
Plant crops Wild rice population extents and harvest
Low but culturally specific
Localized Limited
Climate Regulation
C sequestration – lacking indicators Unknown Unknown Lacking
Coastal Protections Wetland extend and distribution High Localized Limited
51

Mapping Ecosystem Services and Benefits Remediation – Restoration – Revitalization
All have spatial properties
Location, Location, Location!
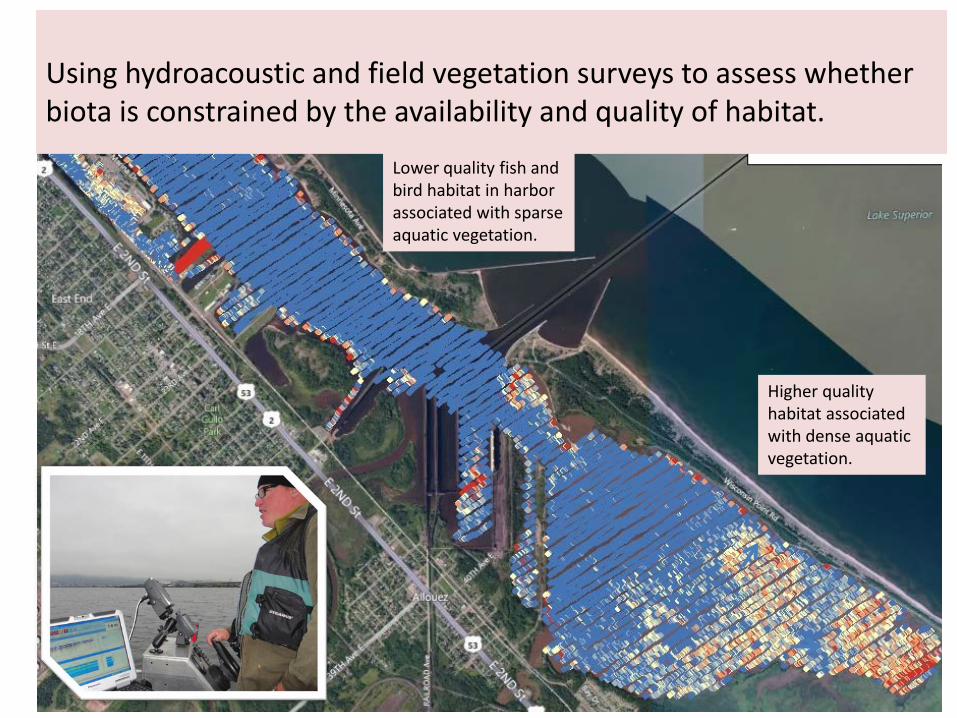
Using hydroacoustic and field vegetation surveys to assess whether biota is constrained by the availability and quality of habitat.
Higher quality habitat associated with dense aquatic vegetation.
Lower quality fish and bird habitat in harbor associated with sparse aquatic vegetation.

Using water P and N concentrations and sediment denitrification rates to estimate nutrient processing in an AOC.
nutri
ents
(ug
L-1)
0
50
100
150
200
250
300
DE
A (u
g N
day
-1)
0
20000
40000
60000
80000
River
TP NOx Base Denitrification
nutri
ents
(ug
L-1)
0
50
100
150
200
250
300
DE
A (u
g N
day
-1)
0
20000
40000
60000
80000
Bay
Base Denitrification
NOxTP
nutri
ents
(ug
L-1)
0
50
100
150
200
250
300
DE
A (u
g N
day
-1)
0
20000
40000
60000
80000
Harbor
TP NOx Base Denitrification
Offshore systems can contribute excess nitrate to coastal systems.

Using socioeconomic data to see whether property value relate to the proximity of contaminated sites.High value waterfront parcels (highlighted) can be found relatively close to Superfund and Brownfield sites ( ).

St Louis River EstuaryRestoration-to-Revitalization for Shore Fishing –
An Ecosystem Service Benefit

St Louis River EstuaryStacked Ecosystem Goods and Services (EGS)

Thanks!
http://lab-initio.com