research into practicenjbullying.org/documents/stepstorespectbrownetal2011.pdf · research into...
TRANSCRIPT
Research Into Practice
Outcomes From a School-Randomized Controlled Trialof Steps to Respect: A Bullying Prevention Program
Eric C. BrownUniversity of Washington
Sabina LowWichita State University
Brian H. SmithCommittee for Children
Seattle, WA
Kevin P. HaggertyUniversity of Washington
Abstract. This study reports the outcomes of a randomized controlled trial ofSteps to Respect: A Bullying Prevention Program conducted in 33 Californiaelementary schools. Schools were matched on school demographic characteristicsand assigned randomly to intervention or waitlisted control conditions. Outcomemeasures were obtained from (a) all school staff; (b) a randomly selected subsetof third-, fourth-, and fifth-grade teachers in each school; and (c) all students inclassrooms of selected teachers. Multilevel analyses indicated significant (p �
This research was supported by a grant from the Raynier Foundation. Portions of this study were presentedat the 18th Annual Meeting of the Society for Prevention Research, Denver, Colorado, June 4, 2010.
The authors gratefully acknowledge the community prevention coordinators, principals, teachers, students,and parents of students in participating California elementary schools. The authors thank Sherry Burke andthe staff of the Committee for Children; and Kate Fernandez, Koren Hanson, Amy Haslund, and the staffof the Survey Research Division at the Social Development Research Group, School of Social Work,University of Washington, for their hard work and support. The authors additionally thank Professor JamesMazza, College of Education, University of Washington, and the anonymous reviewers for helpful editsand comments on the manuscript.
Correspondence regarding this article should be addressed to Eric C. Brown, University of Washington,Social Development Research Group, 9725 3rd Avenue NE, Suite 401, Seattle, WA 98115; e-mail:[email protected]
Copyright 2011 by the National Association of School Psychologists, ISSN 0279-6015
School Psychology Review,2011, Volume 40, No. 3, pp. 423–443
423

.05) positive effects of the program on a range of outcomes (e.g., improvedstudent climate, lower levels of physical bullying perpetration, less school bul-lying-related problems). Results of this study support the program as an effica-cious intervention for the prevention of bullying in schools.
Bullying is recognized as one of themost significant public health concerns facingchildren in the United States today and may bethe most prevalent type of school violence(Porter, Batsche, Castillo, & Witte, 2006; Card& Hodges, 2008). It occurs along a contin-uum, with students assuming roles that includebully, victim, and bully-victim (Espelage &Horne, 2008). Bullying can result in negativepsychological, emotional, and behavioral out-comes (Cook, Williams, Guerra, Kim, &Sadek, 2010). Victims, bullies, and bully-vic-tims often report adverse psychological effectsand poor school adjustment as a result of theirinvolvement in bullying, which also mightlead to subsequent victimization or perpetra-tion (Nansel, Haynie, & Simons-Morton, 2003).For example, victims of bullying evidence moreloneliness and depression, greater school avoid-ance, more suicidal ideation, and less self-es-teem than their nonbullied peers (Hawker &Boulton, 2000; Kaltiala-Heino, Rimpela, Ran-tanen, & Laippala, 2001; Kochenderfer & Ladd,1996; Olweus, 1992; Rigby, 2001). Whereasvictims tend to report more internalizing behav-iors, bullies are more likely than their peers toexhibit externalizing behaviors, conduct prob-lems, and delinquency (Haynie et al., 2001;Nansel et al., 2001). Lastly, bullying, in itsmany forms, is a serious problem that canharm students’ school performance in the formof school avoidance, lower levels of academicachievement, and more conflictual relationswith teachers and students (Glew, Fan, Katon,Rivara, & Kernic, 2005; Nansel et al., 2003).
Taken together, the prevalence and so-cial-psychological costs of bullying warrantpublic health attention and efforts to alleviatethe suffering involved. Given the high preva-lence and strong relationship of bullying toadverse mental health outcomes, evidence-based school prevention programs are of greatimportance to school psychologists and other
mental health professionals working withschool-based youth.
Effectiveness of Bullying Interventions
Previous evaluations of school-basedbullying preventive interventions have foundmixed results, as reflected in four relativelyrecent research reviews. For example, Smith,Schneider, Smith, and Ananiadou (2004) syn-thesized evaluation studies of whole-schoolbullying prevention programs on bullying vic-timization and perpetration, and found thatacross most studies outcomes were negligibleor negative. Moreover, the studies did notreplicate the strong positive results found inthe original test of the Olweus (1993) programin Norway (Smith et al., 2004). Vreeman andCarroll’s (2007) review of bullying preventionevaluations (multidisciplinary or “whole-school” interventions, social skills groups,mentoring, and social worker support studies)found the majority of studies did not showpositive effects, but interventions focused onthe whole school were more effective thaninterventions delivered through classroom cur-ricula or social skills training alone.
Merrell, Gueldner, Ross, and Isava(2008) conducted a meta-analysis of 16 schoolbullying preventive interventions that usedquasi-experimental or experimental designsand found positive effects for roughly onethird of the outcomes measured across theselected studies. However, outcomes rangedfrom actual bullying victimization and perpe-tration to correlated risk and protective factors(e.g., depression, self-esteem). Notably, 1 ofthe 16 studies found positive effects on bully-ing perpetration and 6 studies found positiveeffects on bullying victimization (student self-report). Finally, a recent meta-analysis by Far-rington and Ttofi (2009) concluded that “over-all, school-based antibullying programs are ef-fective in reducing bullying and victimization”
School Psychology Review, 2011, Volume 40, No. 3
424

(p. 6). Their meta-analysis found bullying de-creased an average of 20% to 23% and vic-timization decreased an average of 17% to20% in experimental versus control schools.However, they also noted that the programsexamined were more effective in Europe andmostly did not use experimental designs, andcautioned against drawing any firm conclu-sions given the paucity of rigorously designedrandomized controlled trials.
One possible explanation for divergentfindings across these reviews is the method-ological flaws found in many previous evalu-ations of bullying prevention interventions. Arecent review by Ryan and Smith (2009) ex-amined the scientific rigor and quality of 31published bullying prevention evaluations.Deficiencies were found across all studies inthe specification of intervention components,evaluation design (e.g., statistical power, unitof randomization), statistical analysis (e.g.,multilevel vs. single level), program imple-mentation, choice and measurement of out-comes (e.g., bullying behaviors, attitudes, andschool climate), or selection of informants.Many studies were noted as failing to have anexplicit theory of change guiding the evalua-tion or not matching the theory of change tothe analytic strategy.
Steps to Respect: A Social-EcologicalApproach to Bullying Prevention
Steps to Respect: A Bullying PreventionProgram (STR) is a school-based preventionprogram that is aligned with the social-ecolog-ical model of bullying, which views youthbehavior as shaped by multiple factors withinnested contextual systems (Committee forChildren, 2001). The program targets multipleareas of the school environment through inter-vention components directed at the school,peer, and individual levels (Swearer, Espel-age, Vaillancourt, & Hymel, 2010). School-wide components are intended to foster a pos-itive school climate and positive normsthrough teacher and staff training focused onthe creation of effective disciplinary policies,improved monitoring of students, and instruc-tion on how to effectively intervene with stu-
dents involved in bullying situations. Class-room curricula target the upper three elemen-tary grades and are intended to promotesocially responsible norms and behavior andincrease social-emotional skills. Lessons helpstudents recognize bullying, increase empathyfor students that are bullied, build friendshipskills to increase protective social connec-tions, improve assertiveness and communica-tion skills to help students deter and reportbullying, and teach appropriate bystander re-sponses to bullying.
The underlying theory of the STR pro-gram is that peer attitudes, norms, and behav-iors play an important role in determining andmaintaining rates of bullying behavior. Be-cause bullying is a social process stronglyinfluenced by the reactions and behaviors ofpeers (Atlas & Pepler, 1998), the programseeks to change attitudes about the acceptabil-ity of bullying through clearly labeling bully-ing behavior as unfair and wrong, increasingempathy for students who are bullied, and edu-cating students about their responsibilities as by-standers to bullying. Figure 1 illustrates the so-cial-ecological nature of the program’s theoryof change, with intervention components at theindividual, peer, and school levels. As shown inthis figure, the program is designed to reducebullying in part through decreasing peer rein-forcement of bullying behavior through in-creased positive bystander behaviors such asignoring bullying, supporting students who arebullied, intervening to stop bullying incidents,and reporting bullying to school staff.
Previous evaluations of the STR pro-gram have demonstrated less acceptance ofbullying and greater bystander responsibilityand perceived adult responsiveness among in-tervention students than control students (Freyet al., 2005). Moreover, students participatingin STR showed less increase in observed phys-ical and relational forms of bullying than con-trol students (Frey et al., 2005; Low, Frey, &Brockman, 2010), but reduced relational ag-gression was limited to those with supportivefriends. The depth of the survey design for theFrey et al. (2005) study (e.g., recording ob-served playground behaviors using handheldcomputers) restricted the number of schools
Bullying Prevention Outcomes
425

Figu
re1.
Th
eore
tica
lfr
amew
ork
for
Step
sto
Res
pect
:A
Sch
ool
Bu
llyin
gP
reve
nti
onP
rogr
am.
School Psychology Review, 2011, Volume 40, No. 3
426
(N � 6) that could be included in the trial.Nonetheless, significant effects were found forboth observational and student self-reportmeasures. These findings indicated promisefor the efficacy of STR and prompted a call fora larger-scale school-randomized trial of theprogram.
Purpose
The purpose of the current study was toextend previous findings of STR program ef-ficacy on reducing school bullying perpetra-tion and victimization, and to assess the effi-cacy of the program to positively affect bothproximal and distal bullying-related risk fac-tors and outcomes, antibullying attitudes, so-cial skills, bystander behaviors, and improvedschool climate and school connectedness. Ourgoal was to rigorously test the efficacy of theprogram using a sufficiently large number ofschools and analysis of intervention effects atthe school level, instead of student or class-room level, thus avoiding some the designlimitations that have been noted in previousevaluations of school bullying prevention pro-grams. Moreover, we sought to assess the ef-ficacy of the program in light of the social-ecological nature of the program. Therefore,the following research questions guided thestudy and relied on data from multiple infor-mants (i.e., students, teachers, and all schoolstaff) to triangulate on program efficacy: (a)What are the effects of the STR program onthe social-ecological context of the school? (b)What are the effects of the STR program onteacher perceptions of student behavior? (c)What are the effects of the STR program onstudent perceptions of school climate, staff/teachers, and connectedness with their school?
Methods
Participants
Schools. To select schools for partici-pation, e-mails were sent to district contactswho met the following criteria: (a) had broadsocioeconomic and racial/ethnic diversity, (b)had an established liaison with the Committeefor Children, (c) expressed a strong need or
desire for school bullying prevention, and (d)were not currently using a school bullyingprevention program. To minimize expense, welimited schools to three geographic areas innorth-central California. Day schools, alterna-tive schools, and private and parochial schoolswere excluded from the eligible pool of ele-mentary schools. Based on this initial ef-fort, 45 out of 96 districts that expressed in-terest were selected for inclusion (i.e., 51 dis-tricts were not considered because they had arelatively small number of elementaryschools, had no administrative contact, orwere already using STR or another bullying-related program).
Research staff from Committee for Chil-dren visited the eligible elementary schools tointroduce the study, explain the requirements,and answer any questions from principals orschool staff. Principals from participatingschools signed a statement that indicated thatat least 80% of teachers in the schools agreedto participate in the program. Schools alsoagreed to receive program trainings for teach-ers and school staff, to implement the programas indicated in the trainings, and to be random-ized into either intervention condition (i.e.,beginning the program in the following schoolyear) or waitlisted control condition (i.e., wait-ing 1 year before implementing the program).All participating elementary schools were pro-vided with the STR program and trainings atno cost.
Based on power analyses using param-eter estimates from Frey et al. (2005), andJensen and Dietrich (2007), we targeted 34schools for the trial. The 34 schools werematched into pairs within each geographicarea using National Center for Education Sta-tistics (n.d.) data on the characteristics of theschool environment (e.g., total student enroll-ment, change in student enrollment from 2006to 2007, number of teachers) and characteris-tics of the student population (e.g., percentageeligible for the free or reduced-price lunchprogram, ethnic/racial percentages, and per-centage of students for whom English was nottheir primary language). Schools within eachmatched pair were assigned randomly to either
Bullying Prevention Outcomes
427
intervention or waitlisted control condition us-ing a random number table.
Between the periods from random as-signment to program implementation, twoschools withdrew from the study (one becauseof turnover in leadership, and one because ofbuilding remodeling). One school was imme-diately replaced by another school from theoriginal pool of eligible elementary schools,which was an adequate match on all criteria.However, a replacement was not found for thesecond school, leaving us with 33 schools forthe trial. Twenty-five percent of the schoolswere from rural areas, 10% were from smalltowns, 50% were from suburban areas, and15% were located in midsized cities. Schoolshad a mean of 40% of students receiving freeor reduced-price lunch (SD � 29%, range � 0to 99%). The mean number of students perschool was 479 (SD � 177, range � 77 to 749students) and the mean number of teachers perschool was 24.
School staff. School staff participantsincluded all paid and volunteer staff fromthe 33 participating schools, including admin-istrators, teachers, paraprofessionals, supportstaff, custodial and cafeteria personnel, busdrivers, and so on. At pretest, 1,307 individu-als completed a survey (77% of the total pop-ulation of school staff). At post-test, 1,296individuals (76%) completed a survey. Re-spondents represented school administrators(2.8%), teachers (58%), paraprofessionals(10%), cafeteria staff (3.3%), school counsel-ors/psychologists (1.4%), custodial staff(1.4%), bus drivers (0.7%), and other positions(7.7%). School staff participants were 90%female. Eighty-five percent of staff identifiedthemselves as “Spanish, Latino, or Hispanic.”Staff were 85% White, 2% African American,4% Asian, and 9% Other race/ethnicity.School staff averaged 46 years of age andworked at their schools a median of 3–5 years.
Teachers. From each of the 33 partici-pating schools, we randomly selected fourthird-, fourth-, or fifth-grade classrooms fordata collection. Because the STR program wasdesigned originally to be implemented to stu-
dents during the course of 3 consecutive years(although schools can implement the programfor only 2 years, in Grades 5 and 6, if desired),our preference was to select third- and fourth-grade classrooms to allow for the potential oflong-term follow-up; however, the limitednumber of third- and fourth-grade classroomsavailable to participate in the study required usto include fifth-grade classrooms in the study.Two schools had only three classrooms in thisgrade range and one school had only twoclassrooms in this grade range, leaving 128classrooms: n � 52 third grade, n � 62 fourthgrade, n � 11 fifth grade, n � 2 third- andfourth-grade split classrooms, and n � 1fourth- and fifth-grade split classroom.
Students. All students in each of theselected classrooms were included in the tar-get sample of 3,119 students for completion ofthe student survey. Students were given astudy information sheet to be taken home andgiven to their parents at the beginning of theschool year. Study information sheets in-formed parents about the study’s goals, bene-fits, and possible risks of their child’s partici-pation in the study. Twenty-two parents de-clined participation in the study. An additional173 students were determined to be ineligiblebecause of language barriers or developmentaldisabilities, and an additional 14 students de-clined to participate in the study at either pre-test or post-test administrations of the survey.Thus, the final analysis sample for pre–postoutcome analyses consisted of 2,940 students(94% of the target population of students).
Among students in the intervention con-dition, approximately half (49%) were male,52% were White, 7% were African American,6% were Asian American, 35% were of otheror mixed race. Forty-three percent of interven-tion students were identified as of Hispanicorigin and the mean age of students in theintervention condition was M � 8.9 years(SD � 0.84, range � 7 to 11). Among controlstudents, 52% were male, 53% were White,6% were African American, 6% were AsianAmerican, and 35% were of other or mixedrace. Forty-one percent of control studentswere identified as of Hispanic origin and the
School Psychology Review, 2011, Volume 40, No. 3
428

mean age of students in the control conditionwas M � 8.9 years (SD � 0.81, range �7–11). All students were given a small giftworth approximately $5 each for their partic-ipation in the study. Procedures for passiveconsent for student participation in the studyby students’ parents were reviewed and ap-proved by the University of Washington’s In-stitutional Review Board.
Measures
School Environment Survey. Pretestand post-test data were collected from schoolstaff during school staff training sessions (inintervention schools only) or during in-servicemeetings using the School Environment Sur-vey (SES). The SES is a brief (10-min), anon-ymous, paper-and-pencil survey, which wasadapted for the current study from the Colo-rado Trust’s 3-year statewide Bullying Pre-vention Initiative (Csuti, 2008a). The SES wasdesigned to parallel several of the measurescollected from the student surveys to providean alternative source of information on thesocial-ecological context of the school envi-ronment. The six SES outcome measures,number of items per scale, scale coefficientalphas (from the current sample), sampleitems, and anchors for response options arepresented in Table 1.
School staff were asked about their per-ceptions of their school’s climate regardingtrust, willingness to help, and cooperationamong students (Student Climate) and schoolstaff (Staff Climate); willingness for students(Student Bullying Intervention) and staff(Staff Bullying Intervention) to intervene inobserved bullying; perceptions of bullying-re-lated problems among students in their school(School Bullying-Related Problems); antibul-lying policies and strategies in their school(School Antibullying Policies and Strategies);and background demographic information(age, gender, race/ethnicity, how many yearsthey worked at the school, and their position atthe school). School staff members were in-structed to respond to survey items using thetime frame “since the beginning of the schoolyear.” Scaled scores for outcome measures
were created as the mean of all nonmissingitems on the scale and were considered miss-ing if more than 67% of items in that scalewere missing.
Teacher Assessment of Student Be-havior (TASB). The TASB was a brief on-line survey of students’ classroom behavior,scholastic aptitudes, and student demographicinformation developed by study investigatorsafter a review of related measures. Teacherscompleted a separate online questionnaire foreach student in their class. The five outcomesmeasured in the TASB, the number of itemsper scale, scale coefficient alphas (from thecurrent sample), sample items, and anchors forresponse options are shown in Table 2.
TASB measures were identified to as-sess STR program efficacy in school andclassroom competencies in interpersonal so-cial skills (Social Competency), academicskills (Academic Competency), academicachievement (Academic Achievement); andteacher-observed physical (Physical BullyingPerpetration) and nonphysical (NonphysicalBullying) acts of bullying. Teachers were in-structed on the TASB to respond to surveyitems using the time frame “since the begin-ning of the school year.” Scaled scores forTASB measures were created as the mean ofall nonmissing items on the scale and wereconsidered missing if more than 67% of itemsin that scale were missing.
Student survey. Similar to the SES,student data were collected using a revisedversion of the Colorado Trust’s Bullying Pre-vention Initiative Student Survey (Csuti,2008b). The 13 outcomes measured in theStudent Survey, the number of items per scale,sample items, scale coefficient alphas (fromthe current sample), and anchors for responseoptions are presented in Table 3.
In addition to student demographic in-formation (age, gender, and race/ethnicity),students were asked about their perceptions oftheir school’s climate regarding trust, willing-ness to help, and cooperation among fellowstudents (Student Climate) and school staff/teachers (Staff Climate); and about their con-
Bullying Prevention Outcomes
429

Tab
le1
Ch
arac
teri
stic
sof
Sch
ool
En
viro
nm
ent
Surv
eyO
utc
ome
Mea
sure
s
Out
com
eN
umbe
rof
Item
sC
oeffi
cien
t�
Sam
ple
Item
Res
pons
eO
ptio
nsR
ange
and
Anc
hors
Scho
olA
ntib
ully
ing
Polic
ies
and
Stra
tegi
es
8.9
3H
owm
uch
isyo
ursc
hool
doin
gto
dem
onst
rate
adm
inis
trat
orco
mm
itmen
tan
dle
ader
ship
toad
dres
sbu
llies
,bu
llied
,an
dby
stan
ders
?
1�
Not
atal
lto
4�
Alo
t
Stud
ent
Bul
lyin
gIn
terv
entio
n5
.92
Stud
ents
inth
issc
hool
wou
ldhe
lpou
tif
ast
uden
tis
mak
ing
fun
ofor
teas
ing
anot
her
stud
ent
who
isob
viou
sly
wea
ker.
1�
Nev
erto
7�
Eve
ryti
me
Staf
fB
ully
ing
Inte
rven
tion
5.9
5T
each
ers
and
staf
fin
this
scho
olw
ould
help
out
ifa
stud
ent
orgr
oup
ofst
uden
tsis
tryi
ngto
pick
afig
htw
itha
wea
ker
stud
ent.
1�
Nev
erto
7�
Eve
ryti
me
Stud
ent
Clim
ate
4.8
2St
uden
tsin
this
scho
olar
ew
illin
gto
help
othe
rst
uden
ts.
1�
Stro
ngly
disa
gree
to4
�St
rong
lyag
ree
Staf
fC
limat
e7
.91
Staf
fin
this
scho
olca
nbe
trus
ted.
1�
Stro
ngly
disa
gree
to4
�St
rong
lyag
ree
Scho
olB
ully
ing-
Rel
ated
Prob
lem
s7
.82
How
big
ofa
prob
lem
inyo
ursc
hool
isst
uden
tssp
read
ing
rum
ors
orlie
sab
out
stud
ents
they
are
mad
ator
don’
tlik
e?1
�N
ota
prob
lem
to4
�A
huge
prob
lem
School Psychology Review, 2011, Volume 40, No. 3
430

nectedness or bonding with their school(School Connectedness). Additional StudentSurvey measures asked students about theirperceptions of general student support and em-pathy (Student Support), their attitudes regard-ing normative beliefs against acts of bullyingperpetration (Attitudes Against Bullying) andbullying intervention (Attitudes Toward Bul-lying Intervention), student and teacher/staffwillingness to intervene in observed acts ofbullying (Student Bullying Intervention andTeacher/Staff Bullying Intervention, respec-tively), and whether teachers and staff weredoing the “right things” to prevent bullying(Teacher/Staff Bullying Prevention).
Other, more distal, outcomes assessedby the Student Survey included measures ofappropriate (as defined by the STR program)bullying bystander behaviors (Positive By-stander Behavior), perceptions of bullying as aproblem in their school (School Bullying-Re-lated Problems), and observed instances ofactual bullying perpetration (Bullying Perpe-tration) and victimization (Bullying Victim-ization) among students. Four scales—StudentAttitudes Against Bullying, Students AttitudesToward Bullying Intervention, Teacher/StaffBullying Prevention, and Bullying Perpetra-tion—exhibited a high degree of nonnormal-ity. Given the response options for thesescales, Student Attitudes Against Bullying andStudents Attitudes Toward Bullying Interven-tion were operationalized as count variables;that is, mean values for Student AttitudesAgainst Bullying indicated average number ofattitudes considered to be Little wrong, Verywrong, or Extremely wrong, and could rangefrom 0 to 7 for the 7-item scale. Mean valuesfor Student Attitudes Toward Bullying Inter-vention indicated average number of attitudesconsidered to be Little okay or Very okay, andcould range from 0 to 4 for the 4-item scale.Teacher/Staff Bullying Prevention was ana-lyzed as an ordered categorical outcome(Raudenbush & Bryk, 2002), and BullyingPerpetration was dichotomized into 0 � Neverand 1 � Sometimes to Always. Students wereinstructed to respond to survey items using thetime frame “since the beginning of the schoolyear.” Scaled scores for student survey out-
Tab
le2
Ch
arac
teri
stic
sof
Tea
cher
Ass
essm
ent
ofSt
ude
nt
Beh
avio
rO
utc
ome
Mea
sure
s
Out
com
eN
umbe
rof
Item
sC
oeffi
cien
t�
Sam
ple
Item
Res
pons
eO
ptio
nsR
ange
and
Anc
hors
Soci
alC
ompe
tenc
y5
.82
Get
sal
ong
with
clas
smat
es.
1�
Nev
erto
5�
Alw
ays
Aca
dem
icC
ompe
tenc
y4
.86
Nee
dshe
lpto
stay
onta
sk.
1�
Nev
erto
5�
Alw
ays
Aca
dem
icA
chie
vem
ent
3.9
5A
cade
mic
ally
,ho
ww
ould
you
rate
this
stud
ent
inte
rms
ofre
adin
g?1
�N
eeds
muc
him
prov
emen
tto
5�
Abo
veav
erag
ePh
ysic
alB
ully
ing
Perp
etra
tion
4.9
1Pu
shed
,sh
oved
,or
trip
ped
aw
eake
rst
uden
t.1
�N
ever
to5
�A
lway
sN
onph
ysic
alB
ully
ing
4.8
0Sp
read
rum
ors
abou
tan
othe
rst
uden
t.1
�N
ever
to5
�A
lway
s
Bullying Prevention Outcomes
431

Tab
le3
Ch
arac
teri
stic
sof
Stu
den
tSu
rvey
Ou
tcom
eM
easu
res
Out
com
eN
umbe
rof
Item
sC
oeffi
cien
t�
Sam
ple
Item
Res
pons
eO
ptio
nsR
ange
and
Anc
hors
Stud
ent
Supp
ort
6.7
8St
uden
tsm
yag
ear
eth
ere
for
me
whe
neve
rI
need
help
.1
�N
ottr
ueat
all
to4
�C
ompl
etel
ytr
ueA
ttitu
des
Aga
inst
Bul
lyin
g7
.87
How
wro
ngor
okay
isit
whe
nst
uden
tspu
sh,
shov
e,or
pick
fight
sw
ithw
eake
rst
uden
ts?
1�
Ext
rem
ely
wro
ngto
5�
Ver
yok
ayA
ttitu
des
Tow
ard
Bul
lyin
gIn
terv
entio
n4
.79
How
wro
ngor
okay
isit
whe
nst
uden
tsde
fend
othe
rsw
hoar
ebe
ing
shov
edar
ound
byst
rong
stud
ents
?1
�E
xtre
mel
yw
rong
to5
�V
ery
okay
Tea
cher
/Sta
ffB
ully
ing
Prev
entio
n1
naT
each
ers
and
staf
fat
my
scho
olar
edo
ing
the
righ
tth
ings
topr
even
tbu
llyin
g.1
�St
rong
lydi
sagr
eeto
4�
Stro
ngly
agre
eSt
uden
tB
ully
ing
Inte
rven
tion
4.7
6St
uden
tsin
your
scho
olw
ould
help
out
ifa
stud
ent
orgr
oup
ofst
uden
tspu
shed
,sh
oved
ortr
ied
topi
cka
fight
with
aw
eake
rst
uden
t.
1�
Nev
erto
4�
Alw
ays
Tea
cher
/Sta
ffB
ully
ing
Inte
rven
tion
4.8
5T
each
ers
and
staf
fin
your
scho
olw
ould
help
out
ifa
stud
ent
spre
adru
mor
sor
lies
abou
tan
othe
rst
uden
tbe
hind
thei
rba
ck.
1�
Nev
erto
4�
Alw
ays
Posi
tive
Bys
tand
erB
ehav
ior
5.6
9I
trie
dto
defe
ndst
uden
tsw
hoal
way
sge
tpu
shed
orsh
oved
arou
nd.
1�
Nev
erto
5�
Alo
t
Scho
olB
ully
ing-
Rel
ated
Prob
lem
s7
.87
How
big
ofa
prob
lem
inyo
ursc
hool
isst
uden
tspi
ckin
gfig
hts
with
othe
rst
uden
ts?
1�
No
prob
lem
atal
lto
4�
Ahu
gepr
oble
mB
ully
ing
Perp
etra
tion
7.8
7I
teas
edor
said
mea
nth
ings
toce
rtai
nst
uden
ts.
1�
Nev
erto
5�
Alw
ays
Bul
lyin
gV
ictim
izat
ion
4.7
5A
part
icul
arst
uden
tor
grou
pof
stud
ents
spre
adru
mor
sor
told
lies
abou
tm
e.1
�N
ever
to5
�A
lway
s
Stud
ent
Clim
ate
4.6
8St
uden
tsin
my
scho
olca
nbe
trus
ted.
1�
Stro
ngly
disa
gree
to4
�St
rong
lyag
ree
Scho
olC
onne
cted
ness
5.7
6T
his
isa
pret
tycl
ose-
knit
scho
olw
here
ever
yone
look
sou
tfo
rea
chot
her.
1�
Stro
ngly
disa
gree
to4
�St
rong
lyag
ree
Staf
fC
limat
e7
.82
Tea
cher
san
dst
aff
inm
ysc
hool
usua
llyge
tal
ong
with
stud
ents
.1
�St
rong
lydi
sagr
eeto
4�
Stro
ngly
agre
e
Not
e.na
�N
otap
plic
able
.
School Psychology Review, 2011, Volume 40, No. 3
432

comes were constructed as the mean of allnonmissing items. Scales missing more than67% of the items were set to missing.
Procedure
Teachers from each classroom activelyconsented to their participation in the study.Participating teachers in intervention and con-trol schools were reimbursed $5 per studentfor their time in completing the survey atpretest and post-test, with an additional bonusof $25 if all assessments were completedwithin 2 weeks of the initial announcement ofthe survey. Participating teachers in interven-tion schools were reimbursed an additional$75 if all 11 of the online Program Implemen-tation Logs were completed by the end of thestudy.
Schools in this study received the stan-dard, fully manualized, Steps to Respect pro-gram that is routinely offered to schools inregard to the classroom lessons, staff training,and support materials (see Web site for moredetails, http://www.cfchildren.org).
Staff training. Committee for Childrentrainers provided an on-site, one-day trainingfor all participating teachers and staff. Thistraining is typically offered to schools, as wellas provided in the program materials forschools that wish to train their own staff. Aspart of this training, all staff in the schoolreceived a 3-hr overview of program goals andkey features of program content (e.g., a defi-nition of bullying, a model for responding tobullying reports). Teachers, counselors, andadministrators received an additional 1.5-hrtraining in how to coach students involved inbullying. Third- through sixth-grade teachersalso received a 2-hr overview of classroommaterials and lesson-specific instructionalstrategies.
Classroom curriculum. Eleven semi-scripted skills lessons focusing on social-emo-tional skills for positive peer relations; emo-tion management; and recognizing, refusing,and reporting of bullying behavior were deliv-ered by teachers. Lesson topics included join-ing groups, distinguishing reporting from tat-
tling, and being a responsible bystander. In-structional strategies included directinstruction, large- and small-group discus-sions, skills practice, and games. Each of theweekly lessons, totaling about 1 hr, was taughtover 2–3 days. There were no make-up ses-sions for students that missed a lesson. Uponcompletion of skill lessons, teachers imple-mented a grade-appropriate literature unit,based on existing children’s books, which pro-vided further opportunities to explore bully-ing-related themes.
Parent engagement. A scripted infor-mational overview for parents was sent homewith students. Take-home letters for parents,provided throughout the classroom curricu-lum, outlined key concepts and skills and de-scribed activities to support their use at home.Administrators informed parents about theprogram and the school’s antibullying policyand procedures.
Implementation sequence. The STRprogram was implemented in several phasesduring the trial. First, in the fall of 2008,school bullying prevention teams met and col-laborated with program consultants to developthe infrastructure to implement and/or sustainschool prevention efforts (e.g., handling ofreports and coaching for students involved inbullying). Second, in November of 2008,school personnel were trained in the STR pro-gram. Finally, classroom lessons were imple-mented in third- through six-grade from De-cember 2008 through May 2009.
Implementation Fidelity
Teachers completed an online ProgramImplementation Log, which was to be com-pleted at the end of every week in which aclassroom lesson was supposed to be com-pleted. Teachers’ self-reported responses tothe third- through fifth-grade ratings of school-wide implementation using a 4-item scale(1 � Poor, 4 � Excellent) indicated that bythe end of the school year program policiesand procedures were well implemented(M � 3.25, SD � 0.44). Eighty-three percentof all teachers in intervention schools reported
Bullying Prevention Outcomes
433

teaching at least 80% of the lessons and 91%of teachers reported teaching at least 60% ofthe lessons. Teachers reported teaching 99.2%of all classroom skill lessons. Approximately75% of students were exposed to at least 95%of all lessons, and an additional 22% of stu-dents were exposed to between 75% and 94%of the lessons. Overall, program engagement,identified as the average response across allweekly reported lessons to the question, “Towhat extent were your students engaged bythis lesson? ” (1 � Not at all, 4 � A lot), washigh (M � 3.67, SD � 0.54). Across all les-sons, 18% of teachers reported omitting one ormore elements from a lesson. Despite this, ahigh percentage of teachers (92%) reportedcompleting all objectives.
Statistical Analyses
Analyses consisted of mixed-modelanalysis of covariance, implemented as a hi-erarchical linear model (Raudenbush & Bryk,2002) for continuous outcomes or as a hierar-chical generalized linear model (Raudenbush,Bryk, Cheong, & Congdon, 2004) for binary,count, and ordered categorical outcomes. Wemodeled outcome measures from the TASBand Student Survey as three-level models,with students nested in classrooms, and class-rooms nested within schools. The model con-trolled statistically for student baseline char-acteristics: age, gender, race/ethnicity (Blackvs. White, Other race vs. White, and Hispanicvs. Non-Hispanic), grade (Grade 3 vs. Grade 4and Grade 4 vs. Grade 5), and the pretestmeasure of the outcome. The number of stu-dents in the classroom was included as a con-trol variable at Level 2. Two dummy variablesrepresenting the three geographic areas wereincluded as control variables at Level 3. Anadditional dummy variable, coded 1 for inter-vention schools and 0 for waitlisted controlschools, was included at Level 3. The inter-vention effect was estimated as the mean dif-ference in adjusted school-level means (orproportions) between intervention and controlschools tested against the average variationamong the intervention-condition-specific ad-justed school-level means (or proportions), ex-
pressed as robust standard errors, with degreesof freedom equal to the number of schoolsminus the number of school-level covariatesand intervention effect, minus one (i.e., df �29). Models for nonnormal outcomes incorpo-rated the appropriate link function for the de-pendent variables (Raudenbush & Bryk,2002). The models included random effectsfor intercept parameters across classrooms andschools. Intraclass correlation coefficients(ICCs) indicated the proportion of total vari-ability in an outcome that could be attributedto each level.
Because the SES was an anonymoussurvey, it was not possible to link pretest andposttest surveys by individual staff persons.Thus, analysis of SES outcome data necessi-tated a two-level modeling strategy (see Li-vert, Rindskopf, Saxe, & Stirratt, 2001, for anexample), with school staff members (Level 1)nested within schools (Level 2). Level 1 con-trol variables included staff members’ gender,race/ethnicity, age, duration of employment atthe school, and whether they held an admin-istrative or nonacademic position (relative to ateaching position, which was the referencecategory). Level 2 control variables includeddummy variables for geographic area. In thismodel, an additional Level 1 covariate, Time,was included to denote whether the dependentoutcome variable was measured at pretest(coded 0) or post-test (coded 1). The interven-tion effect in this model was identified as theregression of the Level 1 slope for Time on theLevel 2 intervention status variable. In allmodels, effect sizes were calculated as thedifference in post-test adjusted means (i.e., theintervention effect), divided by the square rootof the sum variances across all respective lev-els (student, classroom, and school) of condi-tional hierarchical linear models (i.e., pooledtotal standard deviation). Using Cohen’s(1988) standards, effect sizes less than 0.3might be considered “small” effects, effectsizes around 0.5 might be considered “me-dium” effects, and effect sizes larger than 0.8might be considered “large” effects. For di-chotomous or categorical outcomes, effectsizes were calculated as adjusted odds ratios.All analyses were performed using the hierar-
School Psychology Review, 2011, Volume 40, No. 3
434

chical linear models for Windows softwareprogram, version 6.06 (Raudenbush et al.,2004).
Baseline equivalency. Results of con-ditional models examining equivalency inbaseline levels of outcome measures betweenintervention and control schools indicatedthat 1 of the 24 assessed outcomes across thethree surveys demonstrated significantly dif-ferent mean pretest levels. Students from in-tervention schools reported higher pretest lev-els of student bullying intervention than didstudents in control schools, t(29) � 2.51, p �.05.
Missing data. A statistical comparisonof participants that had missing scale dataversus those who did not have missing data onoutcome scales indicated that rates of missing-ness did not differ by participants’ gender,race/ethnic group, age, grade, or interventionstatus ( p � .05). However, rates of missingscale data were significantly different by geo-graphic area, with one area demonstratinglower rates of missing data than the other twogeographic areas, �2(1, N � 3,048) � 4.81,p � .05. Except for items that asked teachersand students about students’ use of electronicdevices to perpetrate bullying behaviors, over-all rates of missing data were low (less than10% across scales in any given survey). None-theless, missing data were accounted for usingmultiple imputation analyses (Graham, 2009)via NORM version 2.03 (Schafer, 1997). Topreserve the unique variance–covariancestructures of the data by intervention status,we conducted separate imputation analyses forexperimental and control schools. Forty im-puted data sets were created for each surveyby intervention status group. Imputed data setswere combined subsequently to include bothintervention and control groups for analysis ofoutcome measures.
Results
Social-Ecological Context of the School
Model-implied pretest and post-testmeans and standard deviations (by interven-
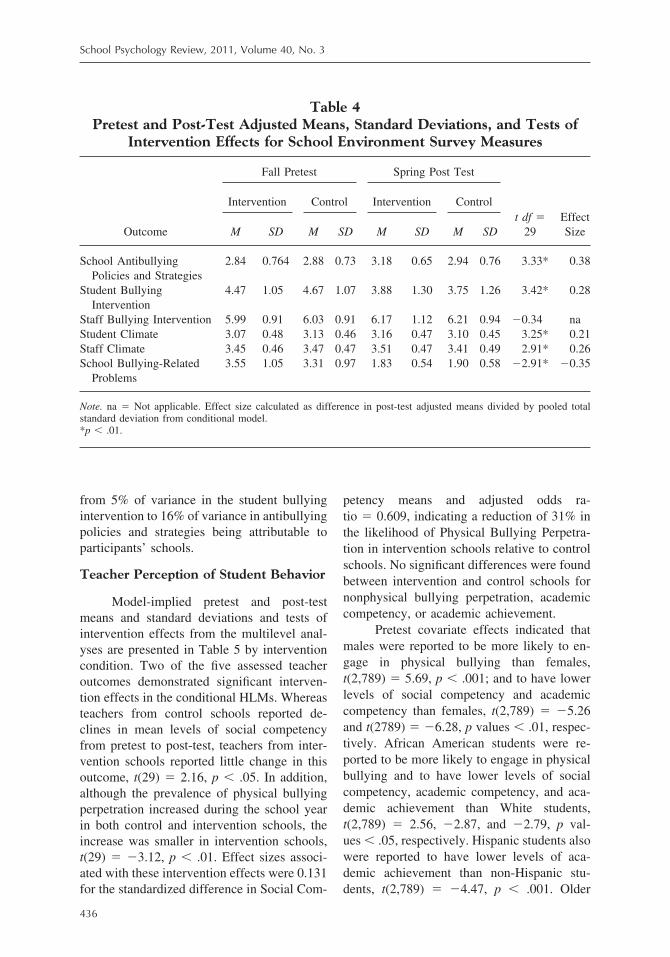
tion condition), and tests of intervention ef-fects for SES measures from the multilevelanalyses, are presented in Table 4. Significantintervention effects were present for five of thesix examined SES outcome measures, withresults indicating greater increases in schoolantibullying policies and strategies,t(29) � 3.33, p � .01; student climate,t(29) � 3.25, p � .01; and staff climate,t(29) � 2.91, p � .01; less decrease in studentbullying intervention, t(29) � 3.42, p � .01;and a larger decrease in school bullying-re-lated problems, t(29) � �2.91, p � .01, forintervention schools relative to controlschools. The average effect size across thesefive outcomes was 0.296 (range � 0.212 forstaff climate to 0.382 for antibullying policiesand strategies). No intervention effect wasfound for staff bullying intervention.
Among the pretest covariate effects,school staff who held administrative positionsin schools reported higher levels of studentclimate, student bullying intervention, andschool antibullying policies and strategies thandid teachers, t(2,588) � 2.00, 2.58, and 7.48,p values � .05, respectively. Teachers re-ported higher levels of school bullying-relatedproblems than did either administrative per-sonnel, t(2,588) � �3.67, p � .001, or schoolstaff from nonacademically related positions,t(2,588) � �2.20, p � .05. Teachers alsoreported higher levels of staff bullying inter-vention, t(2,588) � 2.06, p � .05, and lowerlevels of school antibullying policies and strat-egies than did nonacademic staff, t(2,588) ��5.15, p � .001, respectively. Older staffreported greater staff climate and school anti-bullying policies and strategies,t(2,588) � 2.49 and 4.17, p values � .05,respectively; and less school bullying-relatedproblems, t(2,588) � �4.98, p � .001, thanyounger staff. Staff members’ length of em-ployment was related positively to higher lev-els of student bullying intervention,t(2,588) � 2.19, p � .05; and negatively toschool antibullying policies and strategies,t(2,588) � �3.29, p � .01. Conditional ICCs(i.e., including staff and school characteristicsas covariates) corresponding to between-school variation averaged .096 and ranged
Bullying Prevention Outcomes
435
from 5% of variance in the student bullyingintervention to 16% of variance in antibullyingpolicies and strategies being attributable toparticipants’ schools.
Teacher Perception of Student Behavior
Model-implied pretest and post-testmeans and standard deviations and tests ofintervention effects from the multilevel anal-yses are presented in Table 5 by interventioncondition. Two of the five assessed teacheroutcomes demonstrated significant interven-tion effects in the conditional HLMs. Whereasteachers from control schools reported de-clines in mean levels of social competencyfrom pretest to post-test, teachers from inter-vention schools reported little change in thisoutcome, t(29) � 2.16, p � .05. In addition,although the prevalence of physical bullyingperpetration increased during the school yearin both control and intervention schools, theincrease was smaller in intervention schools,t(29) � �3.12, p � .01. Effect sizes associ-ated with these intervention effects were 0.131for the standardized difference in Social Com-
petency means and adjusted odds ra-tio � 0.609, indicating a reduction of 31% inthe likelihood of Physical Bullying Perpetra-tion in intervention schools relative to controlschools. No significant differences were foundbetween intervention and control schools fornonphysical bullying perpetration, academiccompetency, or academic achievement.
Pretest covariate effects indicated thatmales were reported to be more likely to en-gage in physical bullying than females,t(2,789) � 5.69, p � .001; and to have lowerlevels of social competency and academiccompetency than females, t(2,789) � �5.26and t(2789) � �6.28, p values � .01, respec-tively. African American students were re-ported to be more likely to engage in physicalbullying and to have lower levels of socialcompetency, academic competency, and aca-demic achievement than White students,t(2,789) � 2.56, �2.87, and �2.79, p val-ues � .05, respectively. Hispanic students alsowere reported to have lower levels of aca-demic achievement than non-Hispanic stu-dents, t(2,789) � �4.47, p � .001. Older
Table 4Pretest and Post-Test Adjusted Means, Standard Deviations, and Tests of
Intervention Effects for School Environment Survey Measures
Outcome
Fall Pretest Spring Post Test
t df �29
EffectSize
Intervention Control Intervention Control
M SD M SD M SD M SD
School AntibullyingPolicies and Strategies
2.84 0.764 2.88 0.73 3.18 0.65 2.94 0.76 3.33* 0.38
Student BullyingIntervention
4.47 1.05 4.67 1.07 3.88 1.30 3.75 1.26 3.42* 0.28
Staff Bullying Intervention 5.99 0.91 6.03 0.91 6.17 1.12 6.21 0.94 �0.34 naStudent Climate 3.07 0.48 3.13 0.46 3.16 0.47 3.10 0.45 3.25* 0.21Staff Climate 3.45 0.46 3.47 0.47 3.51 0.47 3.41 0.49 2.91* 0.26School Bullying-Related
Problems3.55 1.05 3.31 0.97 1.83 0.54 1.90 0.58 �2.91* �0.35
Note. na � Not applicable. Effect size calculated as difference in post-test adjusted means divided by pooled totalstandard deviation from conditional model.*p � .01.
School Psychology Review, 2011, Volume 40, No. 3
436
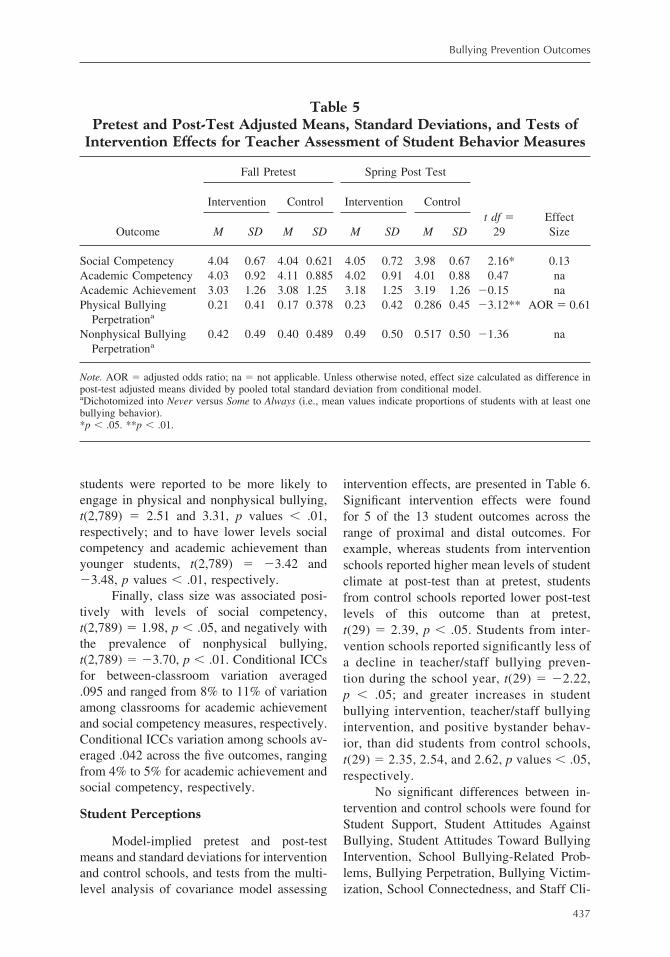
students were reported to be more likely toengage in physical and nonphysical bullying,t(2,789) � 2.51 and 3.31, p values � .01,respectively; and to have lower levels socialcompetency and academic achievement thanyounger students, t(2,789) � �3.42 and�3.48, p values � .01, respectively.
Finally, class size was associated posi-tively with levels of social competency,t(2,789) � 1.98, p � .05, and negatively withthe prevalence of nonphysical bullying,t(2,789) � �3.70, p � .01. Conditional ICCsfor between-classroom variation averaged.095 and ranged from 8% to 11% of variationamong classrooms for academic achievementand social competency measures, respectively.Conditional ICCs variation among schools av-eraged .042 across the five outcomes, rangingfrom 4% to 5% for academic achievement andsocial competency, respectively.
Student Perceptions
Model-implied pretest and post-testmeans and standard deviations for interventionand control schools, and tests from the multi-level analysis of covariance model assessing
intervention effects, are presented in Table 6.Significant intervention effects were foundfor 5 of the 13 student outcomes across therange of proximal and distal outcomes. Forexample, whereas students from interventionschools reported higher mean levels of studentclimate at post-test than at pretest, studentsfrom control schools reported lower post-testlevels of this outcome than at pretest,t(29) � 2.39, p � .05. Students from inter-vention schools reported significantly less ofa decline in teacher/staff bullying preven-tion during the school year, t(29) � �2.22,p � .05; and greater increases in studentbullying intervention, teacher/staff bullyingintervention, and positive bystander behav-ior, than did students from control schools,t(29) � 2.35, 2.54, and 2.62, p values � .05,respectively.
No significant differences between in-tervention and control schools were found forStudent Support, Student Attitudes AgainstBullying, Student Attitudes Toward BullyingIntervention, School Bullying-Related Prob-lems, Bullying Perpetration, Bullying Victim-ization, School Connectedness, and Staff Cli-
Table 5Pretest and Post-Test Adjusted Means, Standard Deviations, and Tests of
Intervention Effects for Teacher Assessment of Student Behavior Measures
Outcome
Fall Pretest Spring Post Test
t df �29
EffectSize
Intervention Control Intervention Control
M SD M SD M SD M SD
Social Competency 4.04 0.67 4.04 0.621 4.05 0.72 3.98 0.67 2.16* 0.13Academic Competency 4.03 0.92 4.11 0.885 4.02 0.91 4.01 0.88 0.47 naAcademic Achievement 3.03 1.26 3.08 1.25 3.18 1.25 3.19 1.26 �0.15 naPhysical Bullying
Perpetrationa0.21 0.41 0.17 0.378 0.23 0.42 0.286 0.45 �3.12** AOR � 0.61
Nonphysical BullyingPerpetrationa
0.42 0.49 0.40 0.489 0.49 0.50 0.517 0.50 �1.36 na
Note. AOR � adjusted odds ratio; na � not applicable. Unless otherwise noted, effect size calculated as difference inpost-test adjusted means divided by pooled total standard deviation from conditional model.aDichotomized into Never versus Some to Always (i.e., mean values indicate proportions of students with at least onebullying behavior).*p � .05. **p � .01.
Bullying Prevention Outcomes
437
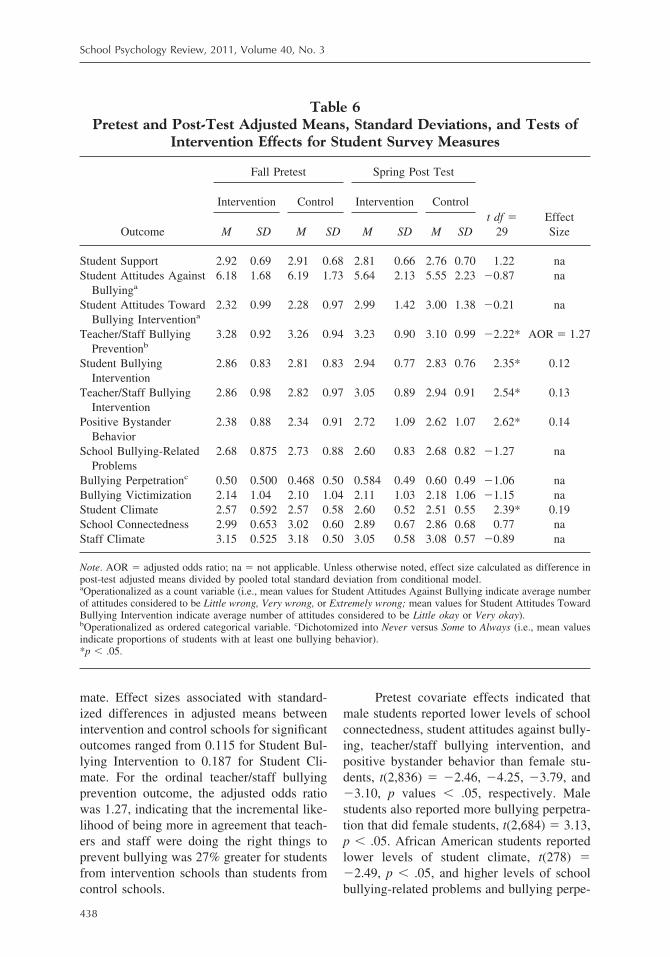
mate. Effect sizes associated with standard-ized differences in adjusted means betweenintervention and control schools for significantoutcomes ranged from 0.115 for Student Bul-lying Intervention to 0.187 for Student Cli-mate. For the ordinal teacher/staff bullyingprevention outcome, the adjusted odds ratiowas 1.27, indicating that the incremental like-lihood of being more in agreement that teach-ers and staff were doing the right things toprevent bullying was 27% greater for studentsfrom intervention schools than students fromcontrol schools.
Pretest covariate effects indicated thatmale students reported lower levels of schoolconnectedness, student attitudes against bully-ing, teacher/staff bullying intervention, andpositive bystander behavior than female stu-dents, t(2,836) � �2.46, �4.25, �3.79, and�3.10, p values � .05, respectively. Malestudents also reported more bullying perpetra-tion that did female students, t(2,684) � 3.13,p � .05. African American students reportedlower levels of student climate, t(278) ��2.49, p � .05, and higher levels of schoolbullying-related problems and bullying perpe-
Table 6Pretest and Post-Test Adjusted Means, Standard Deviations, and Tests of
Intervention Effects for Student Survey Measures
Outcome
Fall Pretest Spring Post Test
t df �29
EffectSize
Intervention Control Intervention Control
M SD M SD M SD M SD
Student Support 2.92 0.69 2.91 0.68 2.81 0.66 2.76 0.70 1.22 naStudent Attitudes Against
Bullyinga6.18 1.68 6.19 1.73 5.64 2.13 5.55 2.23 �0.87 na
Student Attitudes TowardBullying Interventiona
2.32 0.99 2.28 0.97 2.99 1.42 3.00 1.38 �0.21 na
Teacher/Staff BullyingPreventionb
3.28 0.92 3.26 0.94 3.23 0.90 3.10 0.99 �2.22* AOR � 1.27
Student BullyingIntervention
2.86 0.83 2.81 0.83 2.94 0.77 2.83 0.76 2.35* 0.12
Teacher/Staff BullyingIntervention
2.86 0.98 2.82 0.97 3.05 0.89 2.94 0.91 2.54* 0.13
Positive BystanderBehavior
2.38 0.88 2.34 0.91 2.72 1.09 2.62 1.07 2.62* 0.14
School Bullying-RelatedProblems
2.68 0.875 2.73 0.88 2.60 0.83 2.68 0.82 �1.27 na
Bullying Perpetrationc 0.50 0.500 0.468 0.50 0.584 0.49 0.60 0.49 �1.06 naBullying Victimization 2.14 1.04 2.10 1.04 2.11 1.03 2.18 1.06 �1.15 naStudent Climate 2.57 0.592 2.57 0.58 2.60 0.52 2.51 0.55 2.39* 0.19School Connectedness 2.99 0.653 3.02 0.60 2.89 0.67 2.86 0.68 0.77 naStaff Climate 3.15 0.525 3.18 0.50 3.05 0.58 3.08 0.57 �0.89 na
Note. AOR � adjusted odds ratio; na � not applicable. Unless otherwise noted, effect size calculated as difference inpost-test adjusted means divided by pooled total standard deviation from conditional model.aOperationalized as a count variable (i.e., mean values for Student Attitudes Against Bullying indicate average numberof attitudes considered to be Little wrong, Very wrong, or Extremely wrong; mean values for Student Attitudes TowardBullying Intervention indicate average number of attitudes considered to be Little okay or Very okay).bOperationalized as ordered categorical variable. cDichotomized into Never versus Some to Always (i.e., mean valuesindicate proportions of students with at least one bullying behavior).*p � .05.
School Psychology Review, 2011, Volume 40, No. 3
438

tration than White students, t(3,035) � 3.08and 2.61, p values � .01, respectively. Simi-larly, students from other (non-African Amer-ican) minority groups also reported higher lev-els of school bullying-related problems,t(2,201) � 3.70, p � .001, and lower levels ofschool connectedness and teacher/staff bully-ing prevention than White students, t(712) ��2.47 and �3.29, p values � .05, respec-tively. Hispanic students reported lower levelsof positive bystander behavior, teacher/staffbullying intervention, and bullying victimiza-tion than non-Hispanics, t(2,089) � �2.97,�2.29, and �1.96, p values � .05, respectively,and higher levels of bullying perpetration thannon-Hispanic students, t(1,468) � 2.35, p � .05.
Younger students reported higher levelsof student climate, staff climate, and schoolconnectedness than did older students,t(1,644) � �3.09, �2.20, and �1.98, p val-ues � .05, respectively. Older students re-ported higher levels of student attitudes to-ward bullying intervention, bullying victim-ization, and bullying perpetration that didyounger students, t(2,684) � 3.12, 2.93,and 3.12, p values � .05, respectively. Fi-nally, the number of students in the class-room was associated positively with students’perceptions of school bullying-related prob-lems and student attitudes against bullying,t(126) � 2.40 and 2.06, p values � .05, re-spectively. Conditional ICCs for variationamong classrooms averaged .022 and rangedfrom 1% for student bullying intervention to4% for teacher/staff climate. Conditional ICCsfor variation among schools averaged .019 andranged from 2% for teacher/staff bullying pre-vention to 2% for bullying-related problems.
Discussion
This article reports results of a school-randomized controlled trial of Steps to Re-spect: A Bullying Prevention Program. Ourstudy employed a rigorous experimental de-sign that randomized 33 elementary schools tointervention or waitlisted control conditionand used appropriate multilevel analyses thataccounted for student-, classroom-, andschool-level effects. The study design, statis-
tical analyses, and survey battery were consis-tent with recommendations in the field forassessing the effects of interventions that tar-get the whole-school environment (Bloom,Bos, & Lee, 1999; Raudenbush & Willms,1995), and for evaluating school bullying pre-vention programs, in particular (Ryan &Smith, 2009).
Baldry and Farrington (2007) recom-mended that school bullying prevention pro-grams be based on strong program theory.Thus, our evaluation was consistent with asocial-ecological approach to school bullyingprevention, which suggests that prevention ef-fectiveness is maximized when interventionoccurs at multiple levels, including individualstudents, their peers, and the larger schoolenvironment. Accordingly, we obtained infor-mation from multiple sources within eachschool (i.e., from students, teachers, andschool staff), across domains specified in thetheory, and subsequently analyzed our data toreflect the social-ecological nesting.
Results of this study demonstrated sig-nificant intervention effects for the preventionof school bullying on 50% of all outcomesexamined across the three sources of data.Moreover, intervention effects were found forboth proximal and distal outcomes. FollowingCohen’s (1988) guidelines for interpreting themagnitude of standardized between-group dif-ferences, most observed intervention effectsizes were relatively small (i.e., less than 0.3);however, effects of this magnitude are notunexpected given the short duration (i.e., 1year) of the study. Long-term follow-up ofstudents in a multiyear longitudinal study,with full dosage and exposure of students tothe intervention, might show larger effectsizes (see, for example Frey, Hirschstein, Ed-strom, & Snell, 2009). Moreover, increases innormative classroom aggression and relatedbullying behaviors have been noted during theschool year (Frey et al., 2005) and it is impor-tant to contextualize intervention effects inlight of this normative escalation. Nonethe-less, the small effect sizes reported in thisstudy may be seen as a limitation to the prac-tical significance of study findings.
Bullying Prevention Outcomes
439

Additional effects of model covariatesindicated differences in mean levels of bully-ing-related behaviors across gender, racial/ethnic, and age groups. Although not central toaims of the current study, these differences areinteresting and support existing literature onthe characteristics of students that are associ-ated with bullying. For example, higher ratesof bullying perpetration and bullying-relatedproblems among African American, Hispanic,and other minority students are consistent withGraham and Juvonen’s (2002) findings of mi-nority ethnic group differences on aggressivebehavior. Higher rates of bullying perpetrationfound for male students are consistent withEspelage et al. (2004), Nansel et al. (2001),and Seals and Young (2003). Future studies ofschool bullying prevention program effective-ness should take these differences into consid-eration and statistically control for them inoutcome analyses.
In addition to intervention and covariateeffects, our results include estimates of intra-class correlations of classroom and schoolvariability to help researchers plan futureschool-randomized trials of bullying preven-tion programs. Observed intraclass correlationcoefficients indicated that appreciable levelsof variation in staff and teacher reported out-comes exist at both classroom and school lev-els. This suggests that both the classroom andthe entire school building are viable, perhapseven necessary, environments for preventiveintervention.
Consistent with the STR program’s the-ory of change, we found significant interven-tion effects on outcome measures from multi-ple domains of the school environment, in-cluding school, peer, and individual studentdomains. For example, among proximal out-comes, effects on bullying prevention efficacyin the school domain were found in SchoolAntibullying Policies and Strategies (from theSES), and in Teacher/Staff Bullying Preven-tion and Teacher/Staff Bullying Interventionmeasures (Student Survey); effects amongpeers were found in Positive Bystander Be-haviors (Student Survey) and Student BullyingIntervention (SES and Student Surveys); andeffects among students were found in Social
Competency (TASB). Among distal out-comes, intervention efficacy in the school do-main was found in School Bullying-RelatedProblems and Staff Climate (SES measures);and in the student domain for Student Climate(SES and Student Surveys) and Physical Bul-lying Perpetration (TASB).
Inconsistencies among reporters existed,as well. For example, students in interventionschools perceived greater likelihood of staffintervention in bullying incidents; however,this effect was not found in the staff self-report(SES) data. This is not surprising, given thatschool staff tend to perceive themselves asbeing highly instrumental in bullying situa-tions (Charach, Pepler, & Ziegler, 1995), pos-sibly resulting in ceiling effects. Student per-ceptions of school climate were not signifi-cantly affected by program involvement,although school staff endorsed improvementsin staff and student climate, and reductions inbullying perpetration were found only withteacher report, and only with regard to physi-cal bullying. However, measures of bullyingperpetration contained different items betweenreporters and we did not discriminate betweenphysical (e.g., “I pushed, shoved, tripped, orpicked a fight with a student who I knew wasweaker than me”) and nonphysical bullying(e.g., “I spread rumors about some students”)with students as we did with teachers. It is notsurprising that significant differences were notfound between intervention and controlschools on nonphysical bullying, becauseteachers have more difficulty discriminatingbetween forms of bullying (Card, Stucky,Sawalani, & Little, 2008).
Results of this study stand in contrast tothe paucity of evidence for effective schoolbullying preventive interventions in the UnitedStates. As recent reviews and meta-analyseshave pointed out, the majority of efficaciousschool bullying prevention programs havebeen developed and tested in European coun-tries (Baldry & Farrington, 2007; Ferguson,San Miguel, Kilburn, & Sanchez, 2007; Mer-rell et al., 2008; Smith et al., 2004; Ttofi,Farrington, & Baldry, 2008). Large-scale testsof United States school bullying preventionprograms are few and have resulted in a weak
School Psychology Review, 2011, Volume 40, No. 3
440

evidence base. This study relied on an expli-cated theory of change, well-developed inter-vention curricula, and psychometrically soundoutcome measures to demonstrate the poten-tial for efficacious school bullying prevention.Moreover, this study serves as a replicationtrial of the STR program, which was originallyevaluated by Frey et al. (2005, 2009) in sixPacific Northwest elementary schools. In ad-dition to using a larger number of elementaryschools, the schools in this study were morediverse in terms of racial/ethnic makeup andgeography. Our results are supportive of Freyet al.’s previous research (e.g., both studiesfound some positive effects on bystander be-havior) and extend the generalizability of theprogram’s efficacy to a broader range ofschools.
Despite the emphasis we placed on de-signing and executing a rigorous school-ran-domized controlled trial, several limitations ofthis study should be mentioned. Unlike Frey etal. (2005), we did not use observational mea-sures of playground behaviors despite the factthat their study found intervention effects inseveral bullying-related behaviors with thismethod. The use of students’ self-report ofbullying and bullying-related behaviors hasbeen brought into question (Frey et al., 2009;Jenson & Dieterich, 2007). Although othersources of data (e.g., firsthand playground ob-servations and direct observation of teachersin classrooms) could provide a unique per-spective to program implementation and effec-tiveness, these are expensive and difficult toimplement in large-scale school-randomizedtrials. Our study also was limited by its rela-tively short duration. As the STR program isdesigned to be administered to elementary stu-dents across three consecutive grades, long-term follow-up of students would allow for abetter assessment of program sustainability. Inaddition, our assessment of program fidelity,as implemented in the classroom, was mea-sured using online checklist data reported byteachers. Although analyses of these data in-dicated fidelity to the classroom curricula, ob-servation of teachers administering the pro-gram in classrooms by trained observers couldhave provided an alternative assessment of
classroom program fidelity, independent fromteachers’ self-report. We note that effect sizespresented in this study are relatively small andthat the generalization of study findings alsomay be limited by selection of schools with atleast 80% agreement from teachers to partici-pate in the trial and the unique geographicaland demographic features of the school sam-ple recruitment area (i.e., northern-centralCalifornia).
Effect for School Psychologists
Given an increasing societal concern re-garding the prevalence and consequences ofbullying in schools, school psychologistsshould be knowledgeable about the issue. It isoften the school psychologist’s charge to findcomprehensive and effective programs to pre-vent student aggression and violence, and im-prove school climate and student learning. Re-sults of this study facilitate a proactive ap-proach to dealing with school bullying—anapproach that allows school psychologists,teachers, and other school staff to work to-gether in a coordinated fashion, across multi-ple levels of the school environment, to ad-dress school bullying. School psychologists,therefore, need to be aware of the evidence foreffective school-based bullying prevention toguide these efforts, especially in light of thelack of strong evidence in the United States forschool bullying prevention program effective-ness. Our findings support and extend previ-ous research demonstrating evidence for theefficacy of the STR school bullying preventionprogram. Although school bullying-related be-haviors by students are known to increaseduring the course of the school year, as wasseen in this study, successful prevention pro-gram implementation can reduce this escala-tion. More research is needed to assess thelong-term effects of the STR program, withfull (3-year) program implementation, on dis-tal mental health and academic student out-comes. Nonetheless, results from this studysuggest that schools can take proactive stepseven in the short run to address bullying inschools and provide school psychologists with
Bullying Prevention Outcomes
441

an important tool for combating schoolbullying.
References
Atlas, R. S., & Pepler, D. J. (1998). Observations ofbullying in the classroom. The Journal of EducationalResearch, 92, 86–99.
Baldry, A. C., & Farrington, D. P. (2007). Effectiveness ofprograms to prevent school bullying Victims & Offend-ers, 2, 183–204.
Bloom, H. S., Bos, J. M., & Lee, S.-W. (1999). Usingcluster random assignment to measure program im-pacts: Statistical implications for the evaluation ofeducation programs. Evaluation Review, 23, 445–489.
Card, N. A., & Hodges, E. V. E. (2008). Peer victimiza-tion among schoolchildren: Correlations, causes, con-sequences, and considerations in assessment and inter-vention. School Psychology Quarterly, 23, 451–461.
Card, N. A., Stucky, B. D., Sawalani, G. M., & Little,T. D. (2008). Direct and indirect aggression duringchildhood and adolescence: A meta-analytic review ofgender differences, Intercorrelations, and relations tomaladjustment. Child Development, 79, 1185–1229.
Charach, A., Pepler, D. J., & Ziegler, S. (1995). Bullyingat school: A Canadian perspective. Education Canada(Spring), 12–18.
Cohen, J. (1988). Statistical power analysis for the behav-ioral sciences (2nd ed.). Hillsdale, NJ: Lawrence Erl-baum.
Committee for Children. (2001). Steps to Respect: A Bul-lying Prevention Program. Seattle, WA: Author.
Cook, C. R., Williams, K. R., Guerra, N. G., Kim, T. E.,& Sadek, S. (2010). Predictors of bullying and victim-ization in childhood and adolescence: A meta-analyticinvestigation. School Psychology Quarterly, 25, 65–83.
Csuti, N. (2008a). The Colorado Trust Bullying Preven-tion Initiative Student Survey. Retrieved fromwww.thecoloradotrust.org/repository/initiatives/pdfs/BPI/Evaluations/BPI%20Student%20Survey.pdf
Csuti, N. (2008b). The Colorado Trust Bullying Preven-tion Initiative Staff Survey. Retrieved from http://www.thecoloradotrust.org/repository/initiatives/pdfs/BPI/Evaluations/BPI%20Staff%20Survey.pdf
Espelage, D. L., & Horne, A. M. (2008). School violenceand bullying prevention: From research-based expla-nations to empirically based solutions. In S. D. Brown& R. W. Lent (Eds.), Handbook of counseling psychol-ogy (4th ed., pp. 588–606). Hoboken, NJ: John Wiley& Sons.
Espelage, D. L., Mebane, S. E., Swearer, S. M., Espelage,D. L., & Swearer, S. M. (2004). Gender differences inbullying: Moving beyond mean level differences. InD. L. Espelage & S. M. Swearer (Eds.), Bullying inAmerican schools: A social-ecological perspective onprevention and intervention. (pp. 15–35). Mahwah, NJ:Lawrence Erlbaum.
Farrington, D. P., & Ttofi, M. M. (2009). Campbell Sys-tematic Reviews: School-based programs to reducebullying and victimization. Retrieved from http://www.campbellcollaboration.org/lib/download/718/
Ferguson, C. J., San Miguel, C., Kilburn, J. C., Jr., &Sanchez, P. (2007). The effectiveness of school-based
anti-bullying programs: A meta-analytic review. Crim-inal Justice Review, 32, 401–414.
Frey, K. S., Hirschstein, M. K., Edstrom, L. V., & Snell,J. L. (2009). Observed reductions in school bullying,nonbullying aggression, and destructive bystander be-havior: A longitudinal evaluation. Journal of Educa-tional Psychology, 101, 466–481.
Frey, K. S., Hirschstein, M. K., Snell, J. L., Edstrom,L.V.S., MacKenzie, E. P., & Broderick, C. J. (2005).Reducing playground bullying and supporting beliefs:An experimental trial of the Steps to Respect Program.Developmental Psychology, 41, 479–491.
Glew, G. M., Fan, M. Y., Katon, W., Rivara, F. P., &Kernic, M. A. (2005). Bullying, psychosocial adjust-ment, and academic performance in elementary school.Archives of Pediatrics & Adolescent Medicine,159(11), 1026–1031.
Graham, J. W. (2009). Missing data analysis: Making itwork in the real world. Annual Review of Psychology,60, 549–576.
Graham, S., & Jaconet, J. (2002). Ethnicity, peer harass-ment, and adjustment in middle school: An exploratorystudy. Journal of Early Adolescence, 22, 173–199.
Hawker, D. S. J., & Boulton, M. J. (2000). Twenty years’research on peer victimization and psychosocial mal-adjustment: A meta-analytic review of cross-sectionalstudies. Journal of Child Psychology and Psychiatry,41, 441–455.
Haynie, D. L., Nansel, T., Eifel, P., Crump, A., Saylor, K.,Yu, K., et al. (2001). Bullies, victims, and bully/vic-tims: Distinct groups of at-risk youth. The Journal ofEarly Adolescence, 21, 29–49.
Jenson, J. M., & Dieterich, W. A. (2007). Effects of askills-based prevention program on bullying and bullyvictimization among elementary school children. Pre-vention Science, 8, 285–296.
Kaltiala-Heino, R., Rimpela, M., Rantanen, P., & Laip-pala, P. (2001). Adolescent depression: The role ofdiscontinuities in life course and social support. Jour-nal of Affective Disorders, 64, 2–3.
Kochenderfer, B. J., & Ladd, G. W. (1996). Peer victim-ization: Cause or consequence of school maladjust-ment? Child Development, 67, 1305–1317.
Livert, D., Rindskopf, D., Saxe, L., & Stirratt, M. (2001).Using multilevel modeling in the evaluation of com-munity-based treatment programs. Multivariate Behav-ioral Research, 36, 155–183.
Low, S., Frey, K., & Brockman, C. (2010). Gossip on theplayground: Changes associated with universal inter-vention, retaliation beliefs, and supportive friends.School Psychology Review, 39, 536–551.
Merrell, K. W., Gueldner, B. A., Ross, S. W., & Isava,D. M. (2008). How effective are school bullying inter-vention programs? A meta-analysis of intervention re-search. School Psychology Quarterly, 23, 26–42.
Nansel, T. R., Haynie, D. L., & Simons-Morton, B. G.(2003). The association of bullying and victimizationwith middle school adjustment. In M. J. Elias & J. E.Zings (Eds.), Bullying, peer harassment, and victim-ization in the schools: The next generation of preven-tion (pp. 45–61). Philadelphia: The Haworth Press.
Nansel, T. R., Over peck, M., Pillar, R. S., Roan, W. J.,Simons-Morton, B. G., & Scheldt, P. (2001). Bullyingbehaviors among US youth: Prevalence and associa-tion with psychosocial adjustment. Journal of theAmerican Medical Association, 285, 2094–2100.
School Psychology Review, 2011, Volume 40, No. 3
442

National Center for Education Statistics. (n.d.) [Data file].Accessed June 18, 2008, from http://www.ed-data.k12.ca.us
Olweus, D. (1992). Bullying among schoolchildren: In-tervention and prevention. In R. V. Peters, R. McMa-hon, & V. L. Quinsey (Eds.), Aggression and violencethroughout the life span (pp. 100–125). ThousandOaks, CA: Sage.
Olweus, D. (1993). Bully/victim problems among school-children: Long-term consequences and an effectiveintervention program. In S. Hodgins (Ed.), Mental dis-order and crime (pp. 317–349). Thousand Oaks, CA:Sage.
Porter, L., Batsche, G., Castillo, J., & Witte, R. (2006,March). Problem-solving and response-to-interven-tion: School psychologists’ beliefs, practices, andtraining needs. Paper presented at the National Asso-ciation of School Psychologists Annual Convention,Anaheim: CA.
Raudenbush, S. W., & Bryk, A. S. (2002). Hierarchicallinear models: Applications and data analysis methods(2nd ed.). Newbury Park, CA: Sage.
Raudenbush, S. W., Bryk, A. S., Cheong, Y. F., & Con-gdon, R. T., Jr. (2004). HLM 6, hierarchical linear andnonlinear modeling. Lincolnwood, IL: Scientific Soft-ware International.
Raudenbush, S. W., & Willms, J. D. (1995). The estima-tion of school effects. Journal of Educational andBehavioral Statistics, 20, 307–335.
Rigby, K. (2001). Health consequences of bullying and itsprevention in schools. In J. Juvonen & S. Graham(Eds.), Peer harassment in school: The plight of the
vulnerable and victimized (pp. 310–331). New York:Guilford Press.
Ryan, W., & Smith, J. D. (2009). Antibullying programsin schools: How effective are evaluation practices?Prevention Science, 10, 248–259.
Schafer, J. L. (1997). NORM: Multiple imputation ofincomplete multivariate data under a normal model.Windows version 2.03. University Park, PA: TheMethodology Center at Penn State.
Seals, D., & Young, J. (2003). Bullying and victimization:Prevalence and relationship to gender, grade level,ethnicity, self-esteem, and depression. Adolescence,38, 735–747.
Smith, J. D., Schneider, B. H., Smith, P. K., & Ananiadou,K. (2004). The effectiveness of whole-school antibul-lying programs: A synthesis of evaluation research.School Psychology Review, 33, 547–560.
Swearer, S. M., Espelage, D. L., Vaillancourt, T., &Hymel, S. (2010). What can be done about schoolbullying? Linking research to educational practice. Ed-ucational Researcher, 39, 38–47.
Ttofi, M. M., Farrington, D. P., & Baldry, A. C. (2008).Effectiveness of programmes to reduce school bully-ing. Report prepared for the Swedish National Councilfor Crime Prevention. Stockholm.
Vreeman, R. C., & Carroll, A. E. (2007). A systematicreview of school-based interventions to prevent bully-ing. Archives of Pediatrics and Adolescent Medicine,161, 78–88.
Date Received: December 30, 2010Date Accepted: July 24, 2011Action Editor: Shannon Suldo �
Eric C. Brown is an assistant research professor with the Social Development ResearchGroup, School of Social Work, University of Washington. His current research includesapplying advanced methods and designs to investigate the efficacy of school- andcommunity-based preventive interventions. He is the principal investigator of the school-randomized controlled trial of Steps to Respect: A Bullying Prevention Program.
Sabina Low is an assistant professor of clinical psychology at Wichita State University.She was a co-investigator on a randomized controlled trial of Steps to Respect: A BullyingPrevention Program and is currently a principal investigator on a randomized controlledtrial of a middle school bullying prevention program. She has published and presented ontopics including adolescent psychopathology, bullying, and adolescent health riskbehaviors.
Brian H. Smith completed his doctoral studies at the Social Development ResearchGroup, School of Social Work, University of Washington, in 2004. Since that time he hasbeen a research scientist at the Committee for Children, where his work is focused on thedevelopment and evaluation of school-based prevention and youth developmentprograms.
Kevin P. Haggerty is the assistant director of the Social Development Research Group,School of Social Work, University of Washington. He specializes in the development andimplementation of prevention programs at community, school, and family levels. He is aninvestigator on the Raising Healthy Children project and the principal investigator of theFamily Connections study.
Bullying Prevention Outcomes
443

COPYRIGHT INFORMATION
Author:
Title:
Source:
ISSN:
Publisher:
Brown, Eric C.; Low, Sabina; Smith, Brian H.; Haggerty, Kevin P.
Outcomes From a School-Randomized Controlled Trial of Steps to Respect:A Bullying Prevention Program
Sch Psychol Rev 40 no3 S 2011 p. 423-443
0279-6015
National Association of School Psychologists
4340 East Hwy, Ste. 402, Bethesda, MD
The magazine publisher is the copyright holder of this article and it is reproducedwith permission. Further reproduction of this article in violation of the copyright isprohibited. To contact the publisher: http://www.nasponline.org/index2.html
This article may be used for research, teaching and private study purposes. Any substantial or systematic reproduction, re-distribution, re-selling, loan or sub- licensing, systematic supply or distribution in any form to anyone is expressly forbidden. The publisher does not give any warranty express or implied or make any representation that the contents will be complete or accurate or up to date. The accuracy of any instructions, formulae and drug doses should be independently verified with primary sources. The publisher shall not be liable for any loss, actions, claims, proceedings, demand or costs or damages whatsoever or howsoever caused arising directly or indirectly in connection with or arising out of the use of this material.