research on eastern european contries
TRANSCRIPT


• Albania• Armenia• Azerbaijan• Belarus• Bosnia and Herzegovina• Bulgaria• Croatia• Czech Republic
• Estonia• Georgia• Hungary• Latvia• Lithuania•Republic of Macedonia• Moldova
• Montenegro• Poland• Romania• Russian Federation• Serbia• Slovakia• Slovenia• Ukraine
Click here to insert text
2

Byelorussian SSR
Czechoslovakia
Federal Republic of Yugoslavia / Serbia and Montenegro
German Democratic Republic
Socialist Federal Republic of Yugoslavia
Union of Soviet Socialist Republics
Ukrainian SSR
Click here to insert text 3

Click here to insert text 4

Eastern Europe sourcing are particularlyrenowned for their mineral resources and trainedmanpower.
After globalization, all these countries havebecome active participants of market economyand engage in international trade.
There is regular exchange of factors ofproduction with these nations.
✔ Raw Material Sourcing.
✔ Man Power Sourcing
✔ Technology Sourcing
Click here to insert text 5

✔ Minerals are the chief material sourced from this
nation.
✔ This country is a rich source of coal, bauxite,
copper, lead and zinc.
✔ Romania is rich in iron ore.
✔ Ukraine is rich in magnesium, graphite coal.
Click here to insert text 6

31 2197
147
33
10781
296
30 27
202
4171
13 7
814
28583
138
59
337
0
100
200
300
400
500
600
700
800
900
GDP PPP
in billion
Click here to insert text 7

Click here to insert text 8
$11,400
$6,128
$10,568
$15,633
$8,590
$16,041
$18,314
$28,086
$23,213
$6,100
$20,455
$20,204
$23,978
$3,736
$11,800
$21,118
$13,395
$11,553
$25,525
$28,373
$7,422
$0
$5,000
$10,000
$15,000
$20,000
$25,000
$30,000
GDP PPP
Per capita
in USD
Click here to insert text 9
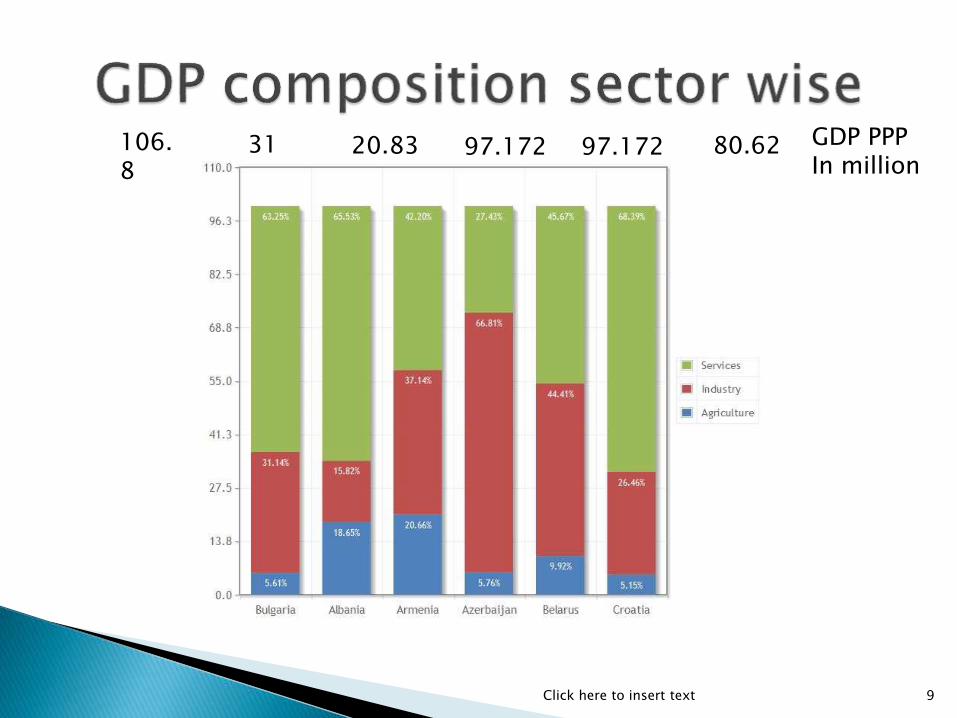
106.8
31 20.83 97.172 97.172 80.62 GDP PPPIn million

Click here to insert text 10
295.89129.944 27.3 202.356 41 7.3470.904GDP PPPIn million

Click here to insert text 11
285.131 83.174 138.277 58.509 337.36GDP PPPIn million

Capital - Sofia
Official languages – Bulgarian
Government - Unitary parliamentary republic
Population - 2011 census – 7.3 million
GDP (PPP) 2013 estimate
- Total - $106.8 billion
- Per capita - $16,041
GDP (nominal) 2013 estimate
- Total - $54.446 billion
- Per capita - $7,582
Currency - Lev (BGN) (1 Bulgarian Lev equals 0.68 US Dollar)
Click here to insert text 12
Currency fluctuation over last 3 years
GDP fluctuation over last 10 years Trade Balance fluctuation over last 3 years
Current account deficit -252.80

Extraction of metals and minerals, production of chemicals, machinery and vehiclecomponents, petroleum refining and steel.
Mining and its related industries employ a total of 120,000 people and generate about5% of the country's GDP.
Bulgaria is Europe's sixth-largest coal producer.
Local deposits of coal, iron, copper and lead are vital for the manufacturing and energysectors.
net exporter of agricultural and food products.
largest global producer of perfumery essential oils such as lavender and rose oil.
Of the services sector, tourism is the most significant contributor to economic growth.
emerged as a travelling destination with its inexpensive resorts and beaches outside thereach of the tourist industry.
Lonely Planet ranked it among its top 10 destinations for 2011.
Giants such as Boeing, BMW, General Motors, Siemens, and Nortel contract smallprogramming firms in Bulgaria.
Bulgaria’s relatively cheap and qualified labor force, along with its low taxes and officerents, provide great benefits for business investors.
Click here to insert text 13

Top 5 Products exported by Bulgaria
Refined Petroleum (13%), Refined Copper (7.2%), Packaged Medicaments(2.9%), Wheat (2.7%), and Raw Copper(2.5%)
Top 5 Products imported by Bulgaria
Crude Petroleum (15%), Copper Ore(8.1%), Refined Petroleum (4.4%), Packaged Medicaments (2.8%), and Semiconductor Devices (2.5%)
Top 5 Export destinations of Bulgaria
Italy (10%), Germany (9.8%), Turkey(9.8%), Romania (7.1%), and Greece(6.1%)
Top 5 Import origins of Bulgaria
Russia (15%), Germany (9.4%), China(6.5%), Italy (6.2%), and Romania (5.7%)
Click here to insert text 14

Capital and largest city – Bucharest
Official languages – Romanian
Government - Unitary semi-presidential republic
Population - 20 October 2011 census - 20.1 million
GDP (PPP) 2013 estimate
- Total - $285.131 billion
- Per capita - $13,395
GDP (nominal) 2013 estimate
- Total - $189.659 billion
- Per capita - $8,910
Currency - Romanian leu (RON) (1 Romanian Leu equals 0.30 US Dollar)
Click here to insert text 15
Currency fluctuation over last 3 years
GDP fluctuation over last 10 years Trade Balance fluctuation over last 3 years
Current account deficit -555.10

Romania's main exports are cars, software, clothing and textiles,
industrial machinery, electrical and electronic equipment, metallurgic
products, raw materials, military equipment, pharmaceuticals, fine
chemicals, and agricultural products (fruits, vegetables, and flowers).
Trade is mostly centered on the member states of the European Union,
with Germany and Italy being the country's single largest trading
partners.
The current account balance in 2012 is estimated to have held a deficit
of $6.474 billion and −4.52% of the GDP.
Click here to insert text 16

Top 5 Products exported by Romania
Cars (6.2%), Vehicle Parts (5.6%), Insulated Wire (5.4%), Refined Petroleum (4.1%), and Rubber Tires(2.5%)
Top 5 Products imported by Romania
Crude Petroleum (5.8%), Packaged Medicaments (3.7%), Vehicle Parts(3.2%), Refined Petroleum (2.9%), and Insulated Wire (2.0%)
Top 5 Export destinations of Romania
Germany (18%), Italy (11%), France(7.3%), Turkey (5.6%), and Hungary(4.2%)
Top 5 Import origins of Romania
Germany (17%), Italy (11%), Hungary(8.7%), France (5.6%), and Kazakhstan(4.3%)
Click here to insert text 17

Capital and largest city - Belgrade
Official languages - Serbian
Government - Parliamentary republic
Population - 2011 census - 7.1 million
GDP (PPP) 2014 estimate
- Total - $83.174 billion
- Per capita - $11,553 (excluding Kosovo)
GDP (nominal) 2014 estimate
- Total - $44.356 billion
- Per capita - $6,161 (excluding Kosovo)
Currency - Serbian dinar (RSD) (1 Serbian Dinar equals 0.011 US Dollar )
Click here to insert text 18
Currency fluctuation over last 3 years
GDP fluctuation over last 10 years Trade Balance fluctuation over last 3 years
Current account deficit -462.10

Since 2000, Serbia has attracted over $25 billion in foreign direct investment
(FDI).
Blue-chip corporations making investments in Serbia include: FIAT, Siemens,
Bosch, Philip Morris, Michelin, Coca-Cola, Carlsberg and others.
In the energy sector, Russian energy giants, Gazprom and Lukoil have made
large investments.
Serbia has an unfavorable trade balance: imports exceed exports by almost
30%. Serbia's exports, however, recorded a steady growth in last couple of
years reaching $14.6 billion in 2013.
The country has free trade agreements with the EFTA and CEFTA, a
preferential trade regime with the European Union, a Generalized System of
Preferences with the United States, and individual free trade agreements with
Russia, Belarus, Kazakhstan, and Turkey.
Click here to insert text 19

Top 5 Products exported by Serbia
Corn (5.3%), Insulated Wire (3.6%), Cars(3.4%), Rubber Tires (2.7%), and Frozen Fruits and Nuts (2.2%)
Top 5 Products imported by Serbia
Refined Petroleum (5.8%), Petroleum Gas(5.1%), Crude Petroleum (4.3%), Packaged Medicaments (3.4%), and Cars(2.5%)
Top 5 Export destinations of Serbia
Germany (11%), Italy (11%), Bosnia and Herzegovina (8.6%), Russia (7.8%), and Romania (6.4%)
Top 5 Import origins of Serbia
Germany (11%), Russia (9.5%), Italy(8.6%), China (6.5%), and Hungary (5.7%)
Click here to insert text 20

Capital and largest city - Kiev
Official languages - Ukrainian
Government - Unitary semi-presidential constitutional
republic
Population - 2014 estimate - 44.2 million
GDP (PPP) 2013 estimate
- Total - $337.360 billion
- Per capita - $7,422
GDP (nominal) 2013 estimate
- Total - $175.527 billion
- Per capita - $3,862
Currency - Ukrainian hryvnia (UAH)
Click here to insert text 21
Currency fluctuation over last 3 years
GDP fluctuation over last 10 years Trade Balance fluctuation over last 3 years
Current account deficit 43.90

Produces nearly all types of transportation vehicles and spacecraft,
Antonov airplanes and KrAZ trucks are exported to many countries.
The majority of Ukrainian exports are marketed to the European
Union and CIS.
The country imports most energy supplies, especially oil and natural
gas and to a large extent depends on Russia as its energy supplier.
While 25% of the natural gas in Ukraine comes from internal sources,
about 35% comes from Russia and the remaining 40% from Central
Asia through transit routes that Russia controls. At the same time,
85% of the Russian gas is delivered to Western Europe through
Ukraine.
Click here to insert text 22

Top 5 Products exported by Ukraine
Semi-Finished Iron (9.2%), Seed Oils(5.4%), Corn (5.3%), Hot-Rolled Iron(4.4%), and Iron Ore (4.4%)
Top 5 Products imported by Ukraine
Petroleum Gas (16%), Refined Petroleum(10%), Cars (3.6%), Packaged Medicaments (3.3%), and Coal Briquettes (2.6%)
Top 5 Export destinations of Ukraine
Russia (24%), Egypt (6.5%), Turkey(5.2%), Italy (3.8%), and Kazakhstan(3.5%)
Top 5 Import origins of Ukraine
Russia (31%), China (9.0%), Germany(8.2%), Belarus (6.4%), and Poland(5.0%)
Click here to insert text 23

Capital and largest city - Budapest
Official languages - Hungarian
Government - Parliamentary republic
Population - January 2014 estimate - 9.8 million
GDP (PPP) 2014 estimate
- Total - $202.356 billion
- Per capita - $20,455
GDP (nominal) 2014 estimate
- Total - $137.228 billion
- Per capita - $13,872
Currency - Forint (HUF)
Click here to insert text 24
Currency fluctuation over last 3 years
GDP fluctuation over last 10 years Trade Balance fluctuation over last 3 years
Current account deficit 190000.00

Top 5 Products exported by Hungary
Cars (4.7%), Broadcasting Equipment (4.6%), Video Displays(4.2%), Vehicle Parts (4.1%), and Spark-Ignition Engines (3.6%)
Top 5 Products imported by Hungary
Crude Petroleum (5.1%), Petroleum Gas (3.7%), Packaged Medicaments(3.3%), Vehicle Parts (3.1%), and Telephones (3.0%)
Top 5 Export destinations of Hungary
Germany (25%), Romania (6.5%), Austria (5.3%), Italy (4.8%), and France (4.7%)
Top 5 Import origins of HungaryGermany (23%), Russia (9.3%), China (6.2%), Austria (6.2%), and Slovakia (4.8%)
Click here to insert text 25

AFCEA Europe - The official association for communications, electronics, information systems and intelligence professionals in Europe.
Airbus - A culturally diverse company that develops, produces and supports world-leading airliners seating.
Dassault Aviation - A manufacturer and exporter of combat aircraft, which includes civil and military aircraft.
European Aeronautic Defence and Space - Specialized in commercial & military aircraft maintenance and modification.
Giat Industries - Manufactures artillery systems, main tank armament, medium calibre weapons, and more in France.
ITP Group - Involved in activities such as research, design, development, manufacturing and maintenance of engines.
Pilatus Aircraft Ltd - A Swiss manufacturer of single-engine turboprop aircraft that also develops, produces and sells aircraft and training
systems.
Rolls-Royce - Operates in four global markets: civil aerospace, defence aerospace, and marine and energy.
Snecma Group - A company that specializes in the manufacture of aircraft and rocket engines headquartered in Courcouronnes, France.
Turbomeca - Produces turbojet engines for aircraft and missiles, as well as turbines for land, industrial and marine applications.
Techspace Aero - Designs, develops and produces modules, equipment and test cells for aerospace engines.
Click here to insert text 26

S.C. Farmec Plast S.A. - Specialized in producing and decorating packages of high
quality from plastic mass for products in cosmetics. (Romania)
S.C. Hartplast S.A. - A manufacturer that produces the following: flower pots and flower
boxes and plastic products for the food industry. (Romania)
Dow Customer Information Group (Belgium)
Paccor Packaging Solution.
Petruzalek - A business organization dealing with packaging technologies. Offers a wide
range of packaging machines and packaging materials.
Greif - Specialists in industrial packaging products and services.
Capardoni & Co. - Specialists in the production of top quality closures for the cosmetic,
pharmaceutical and food industries.
Amcor Limited - As the world’s largest packaging company, Amcor offers exclusive and
innovative solutions that are at the forefront of the packaging industry.
Click here to insert text 27

Nolato AB - Manufacturers of bottles, jars, vials, and closures for the pharmaceutical, healthcare and personal
care industries.
NV Vandeweghe Flexo-Printing - Belgium based company specialized in flexible packaging.
Armando Álvarez Gorup - European packaging company based in Spain for polyethylene plastic
converter and specialized in industrial plastic packaging.
Deffrennes frères - Specialists in food packing; Foie gras, wine, porks, confectionery, cheeses,
dry fruits, Specialists in cosmetics packaging.
Alción Plásticos, S.L - Designs and produces a range of plastic containers for cosmetics, food,
chemicals, and more.
Coexpan Net - Specialists in the production of flexible, plastic packaging for foods.
Sonoco Europe is a proud member of the Sonoco Family, a global provider of consumer
packaging, industrial products, protective packaging and packaging supply chain services.
Silgan closures - Global supplier of caps and closures to the food and beverage industries
Click here to insert text 28

http://www.ezilon.com/business/aerospace_and_defense/manufacturing/index.shtml
http://www.ezilon.com/business/packaging/index.shtml
http://www.ey.com/GL/en/Industries/Automotive/The-Central-and-Eastern-European-
automotive-market---Country-profile--Bulgaria
http://www.econlib.org/library/Enc1/EasternEurope.html
http://www.ningbofocus.com/2014-central-eastern-european-countries-products-fair/
http://www.indexmundi.com/facts/visualizations/gdp-composition-by-sector/#country=bg
http://www.nationmaster.com/country-info/profiles/Ukraine/Economy
http://www.tradingeconomics.com/bulgaria/indicators
http://atlas.media.mit.edu/profile/country/ukr/
http://countries.bridgat.com/Top_Products_Exported_by_Romania.html
Click here to insert text 29
