research open access non-triggered quantification of
TRANSCRIPT
RESEARCH Open Access
Non-triggered quantification of central andperipheral pulse-wave velocityMichael C Langham, Cheng Li and Felix W Wehrli*
Abstract
Purpose: Stiffening of the arteries results in increased pulse-wave velocity (PWV), the propagation velocity of theblood. Elevated aortic PWV has been shown to correlate with aging and atherosclerotic alterations. We extended aprevious non-triggered projection-based cardiovascular MR method and demonstrate its feasibility by mapping thePWV of the aortic arch, thoraco-abdominal aorta and iliofemoral arteries in a cohort of healthy adults.
Materials and Methods: The proposed method “simultaneously” excites and collects a series of velocity-encodedprojections at two arterial segments to estimate the wave-front velocity, which inherently probes the high-frequency component of the dynamic vessel wall modulus in response to oscillatory pressure waves. The regionalPWVs were quantified in a small pilot study in healthy subjects (N = 10, age range 23 to 68 yrs) at 3T.
Results: The projection-based method successfully time-resolved regional PWVs for 8-10 cardiac cycles withoutgating and demonstrated the feasibility of monitoring beat-to-beat changes in PWV resulting from heart rateirregularities. For dul-slice excitation the aliasing was negligible and did not interfere with PWV quantification. Theaortic arch and thoracoabdominal aorta PWV were positively correlated with age (p < 0.05), consistent withprevious reports. On the other hand, the PWV of the iliofemoral arteries showed decreasing trend with age, whichhas been associated with the weakening of muscular arteries, a natural aging process.
Conclusion: The PWV map of the arterial tree from ascending aorta to femoral arteries may provide additionalinsight into pathophysiology of vascular aging and atherosclerosis.
BackgroundIn elastic arteries, e.g. aorta and carotid arteries, therepeated mechanical loading fragments and degradeselastin and is replaced by much stiffer collagen givingrise to decreased wall distensibility [1]. Aortic stiffnesscan be assessed via quantification of pulse-wave velocity(PWV), which is defined as the rate at which bloodmotion is transmitted. It is typically quantified by mea-suring the time delay of the systolic pressure wave atsome downstream location, using pressure transducers[2,3] or Doppler US [4] placed at the two locations(typically carotid and common femoral arteries). Themethod has significant limitations in that the actualpath length of the wave is not known. Further, arterialtortuosity increases with age and can vary from subjectto subject [5]. By contrast, cardiovascular magnetic reso-nance (CMR) allows an accurate measurement of the
path length and provides regional differences in aorticstiffness [6-9]. Cardiac-gated phase contrast CMR in thesagittal plane [8,10], “pencil beam” excitation [11,12] orsinusoidal tags of a column of blood [13] has been beused to evaluate the thoraco-abdominal aorta but imple-menting these methods for the peripheral arteries maynot be feasible due to increased tortuosity and smallerdiameter. On the other hand, cardiac-gated phase con-trast CMR in the axial plane [14] can be extended tothe peripheral arteries since the pressure pulse transittime will increase distally with respect to the cardiactrigger.Unlike a central artery, there is sparse PWV data on
viscoelastic peripheral arteries (e.g. brachial and femoralarteries) that have higher smooth muscle content. Incontrast to the aorta, data suggest (based on ultrasoundmethods) that the distensibility of muscular arteriesremains constant with age [15-19]. According to theMoens-Korteweg formula, PWV = 1/
√Dρ, the age-
related effect on the peripheral PWV will be absent,
* Correspondence: [email protected] of Radiology, University of Pennsylvania Medical Center, 3400Spruced Street, Philadelphia, (19104), USA
Langham et al. Journal of Cardiovascular Magnetic Resonance 2011, 13:81http://www.jcmr-online.com/content/13/1/81
© 2011 Langham et al; licensee BioMed Central Ltd. This is an Open Access article distributed under the terms of the CreativeCommons Attribution License (http://creativecommons.org/licenses/by/2.0), which permits unrestricted use, distribution, andreproduction in any medium, provided the original work is properly cited.

where D is the distensibility coefficient [18] and r is thedensity of blood. Quantification of distensibility requiresmeasurement of the change in the artery’s diameterbetween systole and diastole and is related to the fre-quency independent component of the vessel wall’sdynamic modulus [6,20]. On the other hand, the wave-front velocity approach, commonly known as the “foot-to-foot” method, inherently captures the high-frequencycomponent of the dynamic modulus associated with therapid increase in pressure during early systole. Thedynamic modulus of elastic and viscoelastic arteries hasdifferent response to oscillatory pressure waves createdby pulsatility. For elastic arteries (e.g. carotids and aorta)PWV quantification by both methods is expected to giveapproximately the same result since there is little or nolag between the changes in lumen diameter in responseto a pressure increase. Muscular arteries such as femoraland brachial arteries have much higher smooth musclecontent, which confers their viscoelastic properties. Thedynamic modulus at 10 Hz can be 3 to 4 times greaterthan at 1 Hz in young subjects (<20 yrs), whereas themodulus plateaus at 1 Hz in older (> 35 yrs-old) sub-jects [21]. Thus, the estimation of stiffness or PWVbased on distensibility estimation may not be optimumfor assessing structural remodeling of muscular arteriesassociated with aging or endothelial dysfunction.In this work we extend the previously developed pro-
jection-based approach [22] to estimate PWV along thethoraco-abdominal aorta and the iliofemoral arteries by“simultaneously” exciting and collecting velocity-encoded projections at two arterial segments. Themethod achieves high temporal resolution without gat-ing by sampling the center k-space line repeatedly toapproximate the velocity-time curve during the cardiaccycle from a measurement of the complex difference(CD) signal intensity. The goal of this work is todemonstrate the feasibility of the proposed method inhealthy subjects.
MethodNon-triggered quantification of PWV with velocity-encoded projectionsThe CD between velocity-encoded projections retainssignal from the moving spins only and represents aver-age signal across the lumen in the projection direction(perpendicular to the readout direction). In order toavoid interference from nearby vessels a suitable readoutdirection must be chosen. At the onset of systole (flowvelocity <<vmax) CD intensity is approximately propor-tional to velocity, thus the wave-front velocity methodcan be applied to the time-resolved CD curves to esti-mate the wave-front propagation time. For example, sin(�/2) and �/2 will differ by only 6% even at v = 0.5vmax
for an encoding velocity (VENC) ~1.33vmax.
For the aortic arch only one slice [22] is excited toobtain the CD signal at two arterial segments (proximalascending and distal descending aorta). For “straight”arterial segments (e.g. thoraco-abdominal and iliofe-moral arteries), the CD signal is acquired at two arterialsites quasi simultaneously following two successive exci-tations via two RF pulses of different carrier frequencyin the presence of slice-selective gradients (Figure 1).The polarity of the slice-selective gradient (also serves asa rephasing gradient for the 1st RF) of the 2nd RF isreversed to minimize TR and velocity encoding is imple-mented with bipolar gradients. The slice separation dis-tance ranges from approximately 250 mm (thoraco-abdominal) to 375 mm (iliofemoral), which correspondsto resonance offset of 213 to 320 kHz, respectively, atgradient amplitude of 20 mT/m. One microsecond RFtime-steps are used to avoid aliasing of the proximalslice into regions near the distal slice and vice versa, i.e.the first aliased plane will be over one meter away with20 mT/m gradient amplitude. Further, the receive chan-nels of the coils located intermediate between the slicesof interest are manually disabled to minimize cross-talk.Thus specific channels are “assigned” to a particularslice and the data are reconstructed independently.
SubjectsWritten informed consent was obtained prior to allexaminations following an institutional review board-approved protocol. Ten healthy subjects (N = 10, agerange 23 - 68 yrs, mean age 44 ± 14 yrs) without priorhistory of cardiovascular disease were recruited to evalu-ate the feasibility of quantifying PWV from aortic archto iliofemoral arteries.
RF
Gz
Gx
Figure 1 The pulse sequence for collecting temporally-resolvedCD of velocity-encoded projections. The pulse sequence forcollecting temporally-resolved CD of velocity-encoded projections attwo arterial segments. The bipolar gradients shown in blue aretoggled to encode velocity. The two successive RF pulses differ incarrier frequency so as to excite superior and inferior slice locations.
Langham et al. Journal of Cardiovascular Magnetic Resonance 2011, 13:81http://www.jcmr-online.com/content/13/1/81
Page 2 of 7
CMR ProtocolAortic archAll studies were performed at 3T system (Siemens TimTrio) using two body matrix and spine coils. The bodymatrix coil is a 6-element design with 2 clusters of 3elements, designed so that each cluster can be manuallyturned on or off. The elements within each cluster arearranged laterally across the chest or abdomen so thateach cluster is sensitive to different region along thehead-foot direction. An oblique sagittal image throughthe aorta is first acquired to prescribe and generate mul-tiple axial slices below the pulmonary trunk. Once a sui-table axial slice is selected an appropriate readoutdirection is chosen to avoid vessel interference in velo-city-encoded projections, as described in [22]. The ima-ging parameters for the quantification of PWV alongthe aortic arch are similar to the previous studies: FOV= 448 mm, voxel size = 2 ×10 mm2, TE/TR = 2.6/5.0ms, bandwidth = 893 Hz/pixel, flip angle = 15° andVENC = 175 cm/s (corresponding to 350 cm/s for com-plex difference). After collecting a reference image (forthe purpose of identifying vessels in CD images) 1024pairs of velocity-encoded projections are acquired infree-breathing mode, covering about 10-12 heart-beatsat a temporal resolution of 10 ms. The data acquisitiontime is under 12 s.Thoraco-abdominal aortaBody matrix coils are placed on the chest and abdomensuch that the proximal descending (Da) and abdominalaorta (Aba) proximal to the iliac bifurcation are approxi-mately centered about a cluster of each body coil. Axialscout images are acquired over the maximum FOVallowed (400 mm) with 20 mm gap to prescribe the twodesired slice locations typically separated by 200 to 300mm. Lastly, the midpoint (halfway between the two pre-scribed slices) is repositioned to the isocenter of thescanner. The imaging parameters are as follows: FOV =352 mm, voxel size = 1.38 × 10 mm2, TE/TR = 4.0/6.0ms, bandwidth = 781 Hz/pixel, flip angle = 15o andVENC = 125 cm/s. The increased TR (relative to theone used for the aortic arch) caused by lower VENCresults in a temporal resolution of 12 ms but compen-sated more than enough from the increase in the pathlength from about 120 mm to about 280 mm for thora-coabdominal aorta. Even though the temporal resolutionis reduced by 20% the path length is more than doubledon average thus leading to higher precision compared tomeasurements at the aortic arch.Iliofemoral arteriesSubsequently, the body matrix coil is repositioned fromthe chest to the thigh. The procedure follows the oneabove to prescribe the arterial segments of interest: dis-tal to the aortoiliac bifurcation and femoral artery, sepa-rated by approximately 350 to 400 mm are prescribed
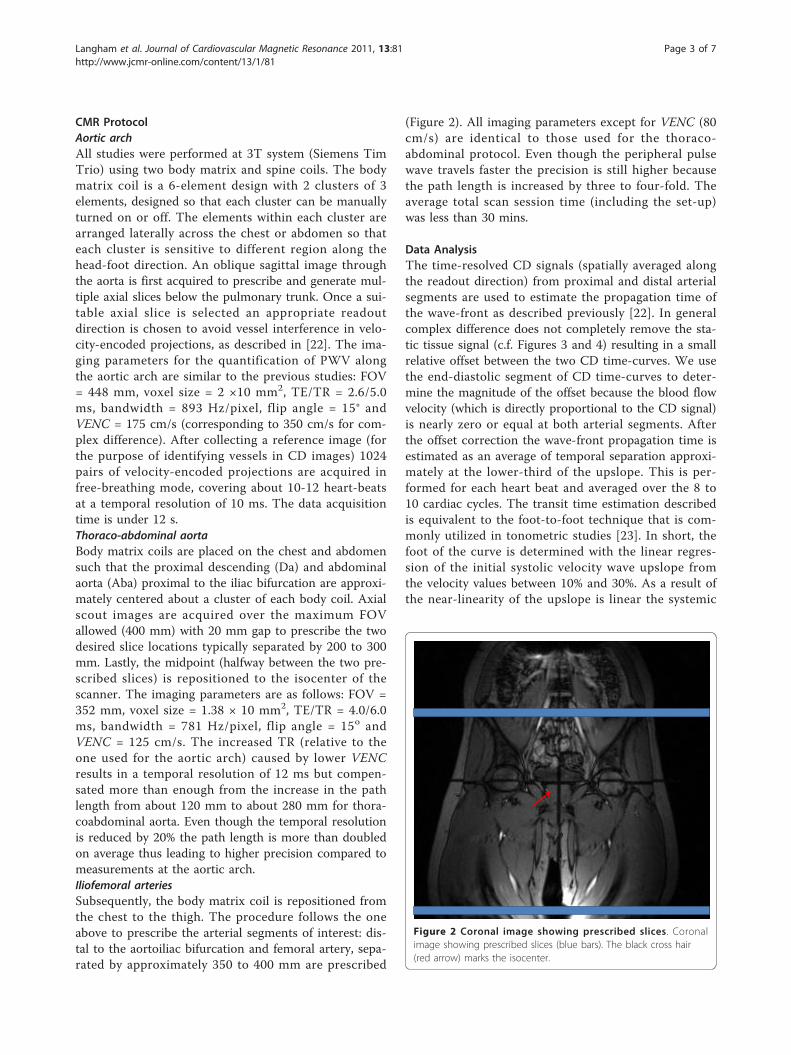
(Figure 2). All imaging parameters except for VENC (80cm/s) are identical to those used for the thoraco-abdominal protocol. Even though the peripheral pulsewave travels faster the precision is still higher becausethe path length is increased by three to four-fold. Theaverage total scan session time (including the set-up)was less than 30 mins.
Data AnalysisThe time-resolved CD signals (spatially averaged alongthe readout direction) from proximal and distal arterialsegments are used to estimate the propagation time ofthe wave-front as described previously [22]. In generalcomplex difference does not completely remove the sta-tic tissue signal (c.f. Figures 3 and 4) resulting in a smallrelative offset between the two CD time-curves. We usethe end-diastolic segment of CD time-curves to deter-mine the magnitude of the offset because the blood flowvelocity (which is directly proportional to the CD signal)is nearly zero or equal at both arterial segments. Afterthe offset correction the wave-front propagation time isestimated as an average of temporal separation approxi-mately at the lower-third of the upslope. This is per-formed for each heart beat and averaged over the 8 to10 cardiac cycles. The transit time estimation describedis equivalent to the foot-to-foot technique that is com-monly utilized in tonometric studies [23]. In short, thefoot of the curve is determined with the linear regres-sion of the initial systolic velocity wave upslope fromthe velocity values between 10% and 30%. As a result ofthe near-linearity of the upslope is linear the systemic
Figure 2 Coronal image showing prescribed slices. Coronalimage showing prescribed slices (blue bars). The black cross hair(red arrow) marks the isocenter.
Langham et al. Journal of Cardiovascular Magnetic Resonance 2011, 13:81http://www.jcmr-online.com/content/13/1/81
Page 3 of 7

error from this approach should be negligible after aver-aging over several cardiac cycles.The path length L of the wave-front is estimated from
the oblique sagittal (aortic arch) and axial scout images(thoraco-abdominal and iliofemoral arteries) acquiredpreviously for prescribing slices of interest. On the sagit-tal image a center-line of the aorta between the two aor-tic sites is manually drawn to estimate the path length.In the axial images, the coordinates of the artery’s cen-troid at each slice is recorded to compute the in-planedisplacements (Δx, Δy) of the vessel’s centroid, whereadjacent slices are separated by cm. Thus the path
length is given by L =∑N−1
i=1(√
�x2 + �y2 + �z2)i,
where N is the number of axial slices. The PWV is thencalculated asL/�t, where �t is the propagation timeaveraged over multiple heart beats.
ResultsRepresentative magnitude and complex-difference pro-jection images of the proximal Da and Aba are shown inFigure 3. There is no trace of aliasing of the proximalinto the distal slice and vice versa on either the magni-tude image, and on the CD images Da and Aba can beclearly identified. Similarly, Figure 4 shows magnitudeand CD images of proximal iliac and femoral arteries.
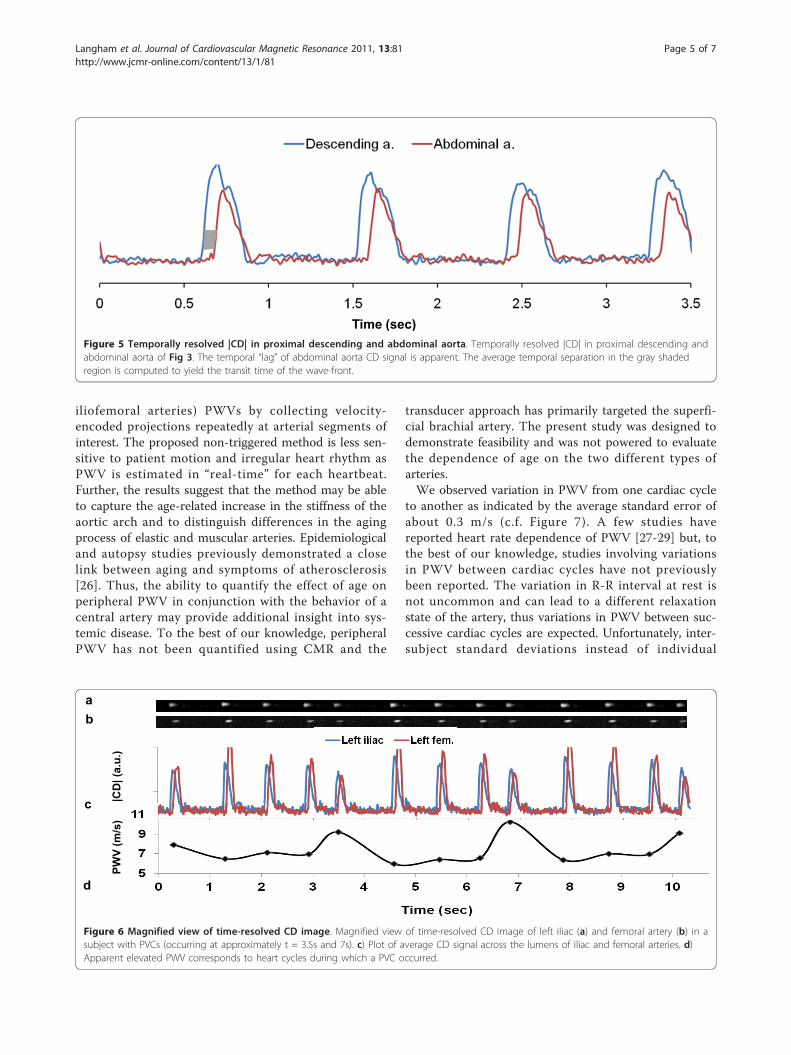
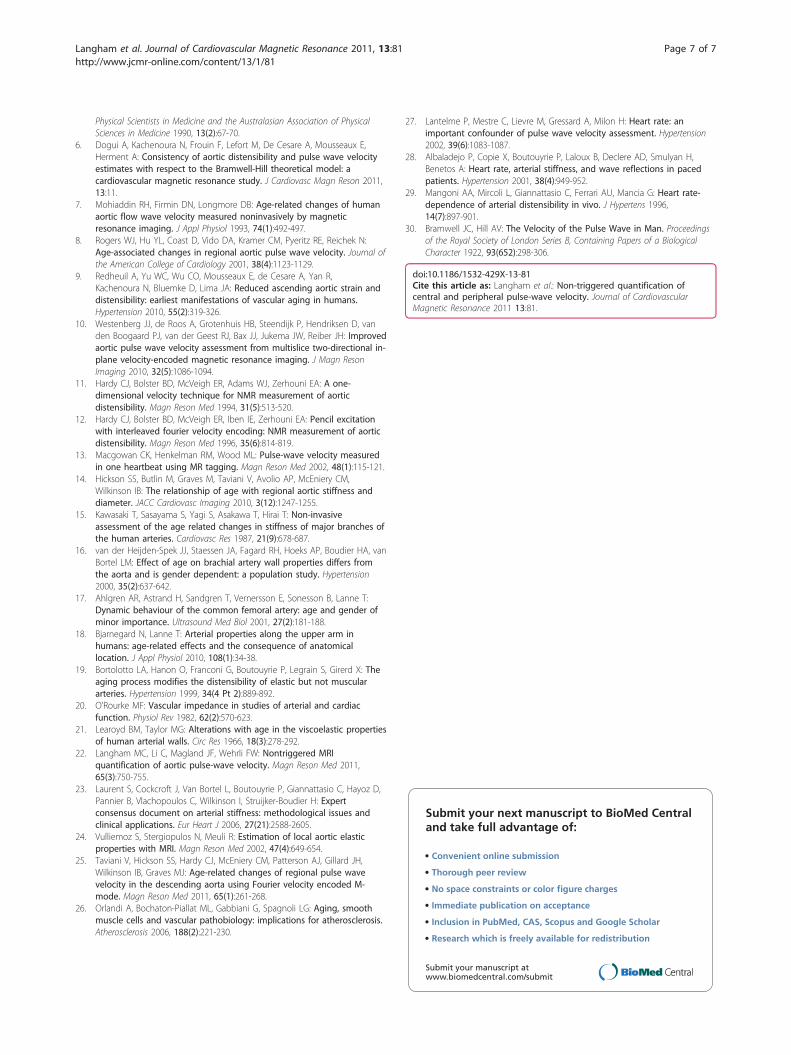
Plots of the temporally resolved CD signal of the data inFigure 3 are displayed in Figure 5. Figures 6a and 6b arethe time-resolved CD images of iliac and femoral arteries,respectively, from a young subject with premature ventri-cular contraction (PVC). The corresponding CD time-curves are shown in Figure 6c. The non-triggered projec-tion approach avoids gating errors arising from heart rateirregularities. PVCs result in elevated PWV (Figure 6d)presumably due to incomplete relaxation of the aorta.In the PWV versus age plots (Figure 7) the age-related
increase in the PWV was significant in the aortic arch(Figure 7a, p < 0.05) and thoracoabdominal aorta (Fig-ure 7b, p < 0.05) with values in good agreement withthose quantified previously [7,8,24,25]. The results forthe thoraco-abdominal PWV (Figure 7b) agree qualita-tively with previous studies [8,21], where the age-relatedeffect in PWV was found to be reduced compared tothe aortic arch. Lastly, the data suggest PWV in the ilio-femoral arteries to decrease with age (Figure 7c) asobserved by Learoyd et al [21], an effect ascribed to theweakening of the muscular arteries as a result of age-related loss of smooth-muscle content [26].
Discussion and ConclusionsThis work demonstrates the feasibility of quantifyingthree regional (aortic arch, thoraco-abdominal aorta and
a b
Time
Figure 3 Reference image and corresponding projection CD images. Reference image and corresponding projection CD images of Da (a)and Aba (b) at the level of pulmonary artery and approximately one cm above the bifurcation, respectively. Each column of pixels represent atime point and represents a CD signal from two projections; approximately 400 successive projections are shown. The readout direction isindicated by the red arrow and the time axis is from left to right as indicated by the blue arrow.
a b Figure 4 Reference image and corresponding CD projections. Reference image and corresponding CD projections of iliac arteries inferior tothe bifurcation (a) and at the level of the femoral arteries (b).
Langham et al. Journal of Cardiovascular Magnetic Resonance 2011, 13:81http://www.jcmr-online.com/content/13/1/81
Page 4 of 7
iliofemoral arteries) PWVs by collecting velocity-encoded projections repeatedly at arterial segments ofinterest. The proposed non-triggered method is less sen-sitive to patient motion and irregular heart rhythm asPWV is estimated in “real-time” for each heartbeat.Further, the results suggest that the method may be ableto capture the age-related increase in the stiffness of theaortic arch and to distinguish differences in the agingprocess of elastic and muscular arteries. Epidemiologicaland autopsy studies previously demonstrated a closelink between aging and symptoms of atherosclerosis[26]. Thus, the ability to quantify the effect of age onperipheral PWV in conjunction with the behavior of acentral artery may provide additional insight into sys-temic disease. To the best of our knowledge, peripheralPWV has not been quantified using CMR and the
transducer approach has primarily targeted the superfi-cial brachial artery. The present study was designed todemonstrate feasibility and was not powered to evaluatethe dependence of age on the two different types ofarteries.We observed variation in PWV from one cardiac cycle
to another as indicated by the average standard error ofabout 0.3 m/s (c.f. Figure 7). A few studies havereported heart rate dependence of PWV [27-29] but, tothe best of our knowledge, studies involving variationsin PWV between cardiac cycles have not previouslybeen reported. The variation in R-R interval at rest isnot uncommon and can lead to a different relaxationstate of the artery, thus variations in PWV between suc-cessive cardiac cycles are expected. Unfortunately, inter-subject standard deviations instead of individual
Time (sec) Figure 5 Temporally resolved |CD| in proximal descending and abdominal aorta. Temporally resolved |CD| in proximal descending andabdominal aorta of Fig 3. The temporal “lag” of abdominal aorta CD signal is apparent. The average temporal separation in the gray shadedregion is computed to yield the transit time of the wave-front.
ab
c
d
|CD
| (a.
u.)
PWV
(m/s
)
Figure 6 Magnified view of time-resolved CD image. Magnified view of time-resolved CD image of left iliac (a) and femoral artery (b) in asubject with PVCs (occurring at approximately t = 3.5s and 7s). c) Plot of average CD signal across the lumens of iliac and femoral arteries. d)Apparent elevated PWV corresponds to heart cycles during which a PVC occurred.
Langham et al. Journal of Cardiovascular Magnetic Resonance 2011, 13:81http://www.jcmr-online.com/content/13/1/81
Page 5 of 7

standard error are typically reported in the literatureeven though PWV estimated via tonometry, CMR orDoppler is derived from many cardiac cycles. The heartrate variation cannot fully explain the differences in thePWV between different cardiac cycles. However, weobserved that the standard error is smaller in the thora-coabdominal aorta and iliofemoral artery compared tothe aortic arch. This is not surprising since the separa-tion distance between the proximal and distal arterialsegments are much larger (250 to 350 mm in the thora-coabdominal aorta and iliofemoral artery segments com-pared to about 120 mm in aortic arch), resulting smallererror in transit time estimation. However, the overallerror is reduced by averaging the PWV over 8-10 car-diac cycles as demonstrated previously [22] in which theprojection method was compared directly against theestablished cine PC-CMR.The method is limited to slices where vessel interfer-
ence can be avoided with an appropriate choice ofreadout orientation. This limitation is exacerbatedwhen projections have to be acquired simultaneouslyat two slices thus requiring careful planning for pre-scribing the slices of interest. In the peripheral arteries,vessel overlap with the veins could be ignored consid-ering that the venous CD signal was at the level ofnoise (c.f. Figures 4a and 4b). We implemented twosuccessive RF pulses instead of modulating the sincpulse by a cosine function to reduce average and peakSAR. However, the two RF pulses were separated byless than one millisecond and thus the decrease in theCD signal due to relaxation and blood flow motion isnegligible.For elastic arteries such as the aorta, PWV can be
quantified with either the foot-to-foot approach or byestimating distensibility. In fact, recent study by Doguiet al [6] showed consistency between the aortic distensi-bility and PWV with respect to the Bramwell-Hill model[30]. However, the two methods are expected to dis-agree on muscular arteries (e.g. femoral artery) that are
better characterized as viscoelastic material where themodulus of the arterial wall has stronger dependencyon the oscillatory nature of the arterial pressure fluctua-tion. Since measurement of distensibility fails to capturethe age-related effect (possibly endothelial dysfunction,as well) we suggest the wave-front velocity basedmethod to be better suited for assessing pathophysiol-ogy of vascular aging and atherosclerosis of musculararteries. However, addressing these questions willrequire comparative studies in larger cohorts of healthysubjects and patients with subclinical atheroscleroticdisease.
AcknowledgementsThe work was supported by the grants NIH R21 HL088182, NIH RC1-HL099861 and R01 HL109545.
Authors’ contributionsML and CL conceived, designed and implemented the pulse sequence,collected and analyzed the data. FW participated in the design ofexperiment and study, and helped to draft the manuscript. All authors readand approved the final manuscript.
Competing interestsThe authors declare that they have no competing interests.
Received: 11 August 2011 Accepted: 21 December 2011Published: 21 December 2011
References1. O’Rourke MF, Nichols WW: Aortic diameter, aortic stiffness, and wave
reflection increase with age and isolated systolic hypertension.Hypertension 2005, 45(4):652-658.
2. Asmar R, Benetos A, Topouchian J, Laurent P, Pannier B, Brisac AM,Target R, Levy BI: Assessment of arterial distensibility by automatic pulsewave velocity measurement. Validation and clinical application studies.Hypertension 1995, 26(3):485-490.
3. Wilkinson IB, Fuchs SA, Jansen IM, Spratt JC, Murray GD, Cockcroft JR,Webb DJ: Reproducibility of pulse wave velocity and augmentationindex measured by pulse wave analysis. J Hypertens 1998, 16(12 Pt2):2079-2084.
4. Sutton-Tyrrell K, Mackey RH, Holubkov R, Vaitkevicius PV, Spurgeon HA,Lakatta EG: Measurement variation of aortic pulse wave velocity in theelderly. Am J Hypertens 2001, 14(5 Pt 1):463-468.
5. Wenn CM, Newman DL: Arterial tortuosity. Australasian physical &engineering sciences in medicine/supported by the Australasian College of
a b c
p<0.05 p<0.05
P>0.05
Figure 7 PWV vs. age of three arterial segments. PWV vs. age of three arterial segments spanning aortic arch to femoral arteries at mid-thigh. Error bars represent standard error of PWV averaged over multiple heartbeats.
Langham et al. Journal of Cardiovascular Magnetic Resonance 2011, 13:81http://www.jcmr-online.com/content/13/1/81
Page 6 of 7
Physical Scientists in Medicine and the Australasian Association of PhysicalSciences in Medicine 1990, 13(2):67-70.
6. Dogui A, Kachenoura N, Frouin F, Lefort M, De Cesare A, Mousseaux E,Herment A: Consistency of aortic distensibility and pulse wave velocityestimates with respect to the Bramwell-Hill theoretical model: acardiovascular magnetic resonance study. J Cardiovasc Magn Reson 2011,13:11.
7. Mohiaddin RH, Firmin DN, Longmore DB: Age-related changes of humanaortic flow wave velocity measured noninvasively by magneticresonance imaging. J Appl Physiol 1993, 74(1):492-497.
8. Rogers WJ, Hu YL, Coast D, Vido DA, Kramer CM, Pyeritz RE, Reichek N:Age-associated changes in regional aortic pulse wave velocity. Journal ofthe American College of Cardiology 2001, 38(4):1123-1129.
9. Redheuil A, Yu WC, Wu CO, Mousseaux E, de Cesare A, Yan R,Kachenoura N, Bluemke D, Lima JA: Reduced ascending aortic strain anddistensibility: earliest manifestations of vascular aging in humans.Hypertension 2010, 55(2):319-326.
10. Westenberg JJ, de Roos A, Grotenhuis HB, Steendijk P, Hendriksen D, vanden Boogaard PJ, van der Geest RJ, Bax JJ, Jukema JW, Reiber JH: Improvedaortic pulse wave velocity assessment from multislice two-directional in-plane velocity-encoded magnetic resonance imaging. J Magn ResonImaging 2010, 32(5):1086-1094.
11. Hardy CJ, Bolster BD, McVeigh ER, Adams WJ, Zerhouni EA: A one-dimensional velocity technique for NMR measurement of aorticdistensibility. Magn Reson Med 1994, 31(5):513-520.
12. Hardy CJ, Bolster BD, McVeigh ER, Iben IE, Zerhouni EA: Pencil excitationwith interleaved fourier velocity encoding: NMR measurement of aorticdistensibility. Magn Reson Med 1996, 35(6):814-819.
13. Macgowan CK, Henkelman RM, Wood ML: Pulse-wave velocity measuredin one heartbeat using MR tagging. Magn Reson Med 2002, 48(1):115-121.
14. Hickson SS, Butlin M, Graves M, Taviani V, Avolio AP, McEniery CM,Wilkinson IB: The relationship of age with regional aortic stiffness anddiameter. JACC Cardiovasc Imaging 2010, 3(12):1247-1255.
15. Kawasaki T, Sasayama S, Yagi S, Asakawa T, Hirai T: Non-invasiveassessment of the age related changes in stiffness of major branches ofthe human arteries. Cardiovasc Res 1987, 21(9):678-687.
16. van der Heijden-Spek JJ, Staessen JA, Fagard RH, Hoeks AP, Boudier HA, vanBortel LM: Effect of age on brachial artery wall properties differs fromthe aorta and is gender dependent: a population study. Hypertension2000, 35(2):637-642.
17. Ahlgren AR, Astrand H, Sandgren T, Vernersson E, Sonesson B, Lanne T:Dynamic behaviour of the common femoral artery: age and gender ofminor importance. Ultrasound Med Biol 2001, 27(2):181-188.
18. Bjarnegard N, Lanne T: Arterial properties along the upper arm inhumans: age-related effects and the consequence of anatomicallocation. J Appl Physiol 2010, 108(1):34-38.
19. Bortolotto LA, Hanon O, Franconi G, Boutouyrie P, Legrain S, Girerd X: Theaging process modifies the distensibility of elastic but not musculararteries. Hypertension 1999, 34(4 Pt 2):889-892.
20. O’Rourke MF: Vascular impedance in studies of arterial and cardiacfunction. Physiol Rev 1982, 62(2):570-623.
21. Learoyd BM, Taylor MG: Alterations with age in the viscoelastic propertiesof human arterial walls. Circ Res 1966, 18(3):278-292.
22. Langham MC, Li C, Magland JF, Wehrli FW: Nontriggered MRIquantification of aortic pulse-wave velocity. Magn Reson Med 2011,65(3):750-755.
23. Laurent S, Cockcroft J, Van Bortel L, Boutouyrie P, Giannattasio C, Hayoz D,Pannier B, Vlachopoulos C, Wilkinson I, Struijker-Boudier H: Expertconsensus document on arterial stiffness: methodological issues andclinical applications. Eur Heart J 2006, 27(21):2588-2605.
24. Vulliemoz S, Stergiopulos N, Meuli R: Estimation of local aortic elasticproperties with MRI. Magn Reson Med 2002, 47(4):649-654.
25. Taviani V, Hickson SS, Hardy CJ, McEniery CM, Patterson AJ, Gillard JH,Wilkinson IB, Graves MJ: Age-related changes of regional pulse wavevelocity in the descending aorta using Fourier velocity encoded M-mode. Magn Reson Med 2011, 65(1):261-268.
26. Orlandi A, Bochaton-Piallat ML, Gabbiani G, Spagnoli LG: Aging, smoothmuscle cells and vascular pathobiology: implications for atherosclerosis.Atherosclerosis 2006, 188(2):221-230.
27. Lantelme P, Mestre C, Lievre M, Gressard A, Milon H: Heart rate: animportant confounder of pulse wave velocity assessment. Hypertension2002, 39(6):1083-1087.
28. Albaladejo P, Copie X, Boutouyrie P, Laloux B, Declere AD, Smulyan H,Benetos A: Heart rate, arterial stiffness, and wave reflections in pacedpatients. Hypertension 2001, 38(4):949-952.
29. Mangoni AA, Mircoli L, Giannattasio C, Ferrari AU, Mancia G: Heart rate-dependence of arterial distensibility in vivo. J Hypertens 1996,14(7):897-901.
30. Bramwell JC, Hill AV: The Velocity of the Pulse Wave in Man. Proceedingsof the Royal Society of London Series B, Containing Papers of a BiologicalCharacter 1922, 93(652):298-306.
doi:10.1186/1532-429X-13-81Cite this article as: Langham et al.: Non-triggered quantification ofcentral and peripheral pulse-wave velocity. Journal of CardiovascularMagnetic Resonance 2011 13:81.
Submit your next manuscript to BioMed Centraland take full advantage of:
• Convenient online submission
• Thorough peer review
• No space constraints or color figure charges
• Immediate publication on acceptance
• Inclusion in PubMed, CAS, Scopus and Google Scholar
• Research which is freely available for redistribution
Submit your manuscript at www.biomedcentral.com/submit
Langham et al. Journal of Cardiovascular Magnetic Resonance 2011, 13:81http://www.jcmr-online.com/content/13/1/81
Page 7 of 7