research open access primary cultures derived from … · primary cultures derived from bovine...
TRANSCRIPT
JScholar Publishers
Primary Cultures Derived From Bovine Papillomavirus-Infected Lesions As Model To Study Metabolic DeregulationRodrigo Pinheiro Araldi1,2, Paulo Luiz de Sá Júnior1, Roberta Fiusa Magnelli1,2, Diego Grando Módolo1, Jacqueline Mazzuchelli de Souza1, Diva Denelle Spadacci-Morena3, Rodrigo Franco de Carvalho1, Willy Beçak1, Rita de Cassia Stocco1,*
1Genetics Laboratory, Butantan Institute, Vital Brazil Avenue 1500, São Paulo-SP, Brazil2Biotechnology Interunit Post-graduation Program IPT/Butantã/USP, University of São Paulo, Lineu Prestes 2415, São Paulo-SP, Brazil3Physiopathology Laboratory, Butantan Institute, Vital Brazil 1500, São Paulo-SP, Brazil
Research Open Access
*Corresponding author: Rita de Cassia Stocco, Genetics Laboratory (Viral Oncogenesis), Butantan Institute, Vital Brazil St. 1500, São Paulo-SP, Brazil, Phone/Fax: 55 (11) 2627-9701; E-mail: [email protected]
©2016 The Authors. Published by the JScholar under the terms of the Creative Commons Attribution License http://creativecommons.org/licenses/by/3.0/, which permits unrestricted use, provided the original author and source are credited.
J Cancer Res Therap Oncol 2016 | Vol 4: 103
Journal of Cancer Research and Therapeutic Oncology
Received Date: November 10, 2016; Accepted Date: November 23, 2016; Published Date: November 25, 2016
Citation: Rodrigo Pinheiro Araldi, et al. (2016) Primary Cultures Derived From Bovine Papillomavirus-Infected Lesions As Model To Study Metabolic Deregulation. J Cancer Res Therap Oncol 4: 1-18
Abstract
Bovine papillomavirus (BPV) is the etiological agent of bovine papillomatosis, disease characterized by the presence of mul-tiple papillomas that can regress or to progress to malignances. Due to the pathological similarities with the human papil-lomavirus (HPV), BPV is considered a prototype to study the papillomavirus-associated oncogenic process. Although it is clear that both BPV and HPV can interact with host chromatin, the interaction of these viruses with cell metabolism remains understudied due to the little attention given to primary cultures derived from papillomavirus-infected lesions. Thus, this study analyzed the energy metabolism, including the mitochondrial membrane potential (ΔΨm) and Reactive Oxygen Spe-cies (ROS) of cells derived from cutaneous papilloma, fibropapilloma and Esophageal Carcinoma (EC) as model to evaluate the cell metabolism. These cells were cultivated until sixth passage and subjected to BPV DNA sequences identification by PCR using specific primers to BPV-1, 2 and 4. PCR results showed the presence and maintenance of at least one BPV type along the six passages analyzed. Cells derived from normal skin, without BPV DNA sequences were used as control. Results of energy metabolism showed the loss of ΔΨm in fibropapilloma and EC cells, suggesting a metabolic switch compatible to the activation of aerobic glycolysis. Cutaneous papilloma and normal skin cells showed the maintenance of ΔΨm. Paradoxi-cally, cutaneous papilloma and fibropapilloma presented high levels of ROS production, while the EC cells reduced the ROS levels, reinforcing the activation of glycolytic metabolism. Our results suggest that the metabolic switch is mediated by BPV E6 oncoprotein, since the addition of this oncoprotein in normal cells promoted the oxidative stress. The oxidative stress showed able to activate the STAT3 nuclear factor in papilloma and fibropapilloma cells, contributing to metabolic deregula-tion. These data suggest that primary cultures are useful model to study the interaction between BPV and cell metabolism.
Keywords: BPV; Mitochondrial membrane potential; Reactive oxygen species; Fibropapilloma; Esophageal carcinoma
Abreviations: BPV: bovine papillomavirus, HPV: human papillomavirus, SOD: superoxide dismutase, GpX: glutathione peroxidase, ΔΨm: mitochondrial membrane potential, ROS: reactive oxygen species, OXPHOS: oxidative phosphorylation, DCFH-DA: Dichloro-dihydro-fluorescein diacetate; HCV: hepatitis C virus, EBV: Epstein-Barr virus, DENV: dengue virus
2
JScholar Publishers J Cancer Res Therap Oncol 2016 | Vol 4: 103
Introduction
Although recognized as a multifactorial disease, it is estimat-ed that 23% of all human cancers are associated to infectious agents [1-3]. Among these, the human papillomavirus (HPV) is responsible to about 30% of all incident infectious agent-associated cancer cases [1,2]. These data demonstrate that viral oncogenesis studies are mandatory in attempt to reduce the mortality rate by HPV-associated cancer [4]. In this scene, the bovine papillomavirus (BPV) emerges as an useful model to study the papillomavirus-associated oncogenic process, since both HPV and BPV share morphological, pathological and pathogenic characteristics [5-7]. For these reasons, BPV is considered a prototype to study the molecular biology and cell transformation mechanism of HPV [8]. Moreover, both virus-es are associated to benign (warts) and malignant neoplasm. Although it is well stated that both HPV [9] and BPV pro-mote DNA damages (mutations) that can lead to cancer initia-tion [10-13], there are few studies about the viral action in cell metabolism [5,14-16]. This occurs due to the lack of attention given to in vitro models [17]. In this sense, since 2003, our group has demonstrated that primary cultures derived from BPV-infected lesions are useful model to understand the viral interaction with host chromatin [18]. This because, primary cells derived from BPV-infected cutaneous papilloma, esopha-geal papilloma and urinary bladder lesions present chromo-some aberrations [19] similar to those verified in BPV-infected lymphocytes [10,12,20,21]. Similar results were also described in cell cultures derived from bovines, canines and equines in-fected with papillomavirus [22]. Currently, Potocki et al. [14] reported that sarcoid-derived fibroblast present a loss of mito-chondrial membrane potential and changes in energy-supply-ing pathways in BPV-1-positive cells, which are typical verified in cancer cells. In other study, based on HPV-16, Williams et al. [15] demonstrated that E6* oncoprotein, a splicing variant of E6 oncoprotein, promotes the SOD2 and GPx antioxidant enzymes downregulation, resulting in oxidative stress in CaS-ki and SiHa cells (derived from human cervical carcinoma). These results suggest that in vitro models are useful models to study the virus-associated metabolic deregulation. However, up to date, there is not any study about the cell metabolism of cutaneous papilloma, fibropapilloma and esophageal carci-noma infected by BPV.Since to 1953 it is known that energy metabolism deregulation is a cancer hallmark [23-26]. In normal (quiescent) cells, glu-cose is metabolized to pyruvate in the cytosol by a multi-step process kwon as glycosysis [27]. The pyruvate is predominate-ly directs to mitochondrial matrix where is oxidized to acetyl Coenzyme A (Co-A), that fed the tricarboxylic acid cycle, followed by oxidative phosphorylation (OXPHOS) [5,27,28]. This process generates an electron gradient with results in mi-tochondrial membrane potential (ΔΨm) [5,28]. This gradient is required to ATP synthesis [29], however, leads to reactive oxygen species (ROS) production, which can interact with proteins, lipids and DNA, resulting in nucleotide oxidation and/or DNA breaks (clastogenesis) [5].
By the contrast, most cancer cells increase the glucose uptake and glycolytic rates even in aerobic conditions, converting the pyruvate to lactate [5,27,30,31]. This metabolic switch, known as “Warburg effect”, guarantees the ATP supply to cell prolif-eration, reducing the ROS levels, which can lead to apoptosis, conferring a protective action to cancer cells [5]. Currently studies suggest that the STAT3 nuclear transcription factor is the pivot of metabolic switch verified in transformed cells [32,33]. This because, the STAT3 factor promotes the glucose-6-phosphatase and fructose-6-phosphatase downregulation, reducing the activity of respiratory chain complex I and, there-fore, the OXPHOS [34]. Based on these data, we analyzed the cell metabolism of cells derived from cutaneous papilloma, fibropapilloma and esophageal carcinoma infected by BPV. We also evaluated the action of BPV-1 E6 oncoprotein on cell metabolism of BPV-free cells. Our results showed that primary cultures derived from BPV-infected lesions are useful model to study the metabolic deregulation verified during the patho-logic evolution of neoplasm (benign to malignant).
Material and MethodsCell cultureTo elucidate the ROS-dependent signaling pathways is a labo-rious task, because free oxygen (singlet) has a short life time, being quickly converted to other reactive species, able to link to other molecules. In this sense, the cell cultures emerges as useful models to study the oxidative stress [5,35]. Thus, this study employed five primary culture: one of BPV-free normal skin (control), one of cutaneous papilloma (papilloma 01), two of fibropapillomas (papilloma 02 and 03) and one of es-ophageal carcinoma. These primary cultures were obtained by Campos et al. [19] from tissue fragments collected from adult bovines (Bos taurus), being part of biological collection of Genetics Laboratory of Butantan Institute. This study was approved by the Ethics Committee of Butantan Institute under process 1319/14. The cells were seeded in culture flasks of 25 cm2, containing 5 mL of DMEM medium (Cultilab, Campinas, Brazil), supplemented with 15% fetal bovine serum (Cultilab, Campinas, Brazil) and 1% ampicillin-streptomycin (Cultilab, Campinas, Brazil). The material was incubated at 37ºC, 5% CO2 up to 80% confluence (about 72 hours). The monolayer was disaggregated with 0.01% EDTA solution to preserve the cell morphology. Primary cultures were cultivated until sixth passage (P1-P6).
BPV DNA sequence identificationOne culture flask of each of primary culture was subjected to DNA extraction using the QIAamp DNA Blood Mini Kit (Qiagen, Germany), according to manufacturer’s instructions. DNA was quantified in BioPhomometer Plus spectrophotom-eter (Eppendorf, Germany) and subjected to BPV DNA se-quence identification by PCR. The PCR was performed in a reaction volume of 25 μL, composed of 10.0 μL of Dream Taq Green (Thermo Scientific, USA), 8.0 μL of DNase-free water, 1.0 μL of forward primer, 1.0 μL of reverse primer, and 5.0 μL of DNA template (200 ng).

3
JScholar Publishers J Cancer Res Therap Oncol 2016 | Vol 4: 103
For BPV sequence identification, we used specific primers for BPV-1 and 2 because these are the most frequent types of virus identified worldwide [36]. We also investigated the presence of BPV-4 due to association to esophageal carcinoma [37]. Moreover, these primers have most sensitivity than degener-ate primers (FAP59/64 and MY09/11) [36], which could result in false-negative results. The BPV-1 primer pair (forward 5’- GAGCGCCTGCTAACTATAGGA-3’ and reverse 5’- ATCT-GTTGTTTGGGTGGTGAC-3’) amplify the L1 region, result-ing in an amplicon of 301 bp, the BPV-2 primer pair (forward 5’-GTTATACCACCCAAAGAAGACCCT-3’ and reverse 5’-TGGTTGCAACAGCTCTCTTTCTC-3’) amplify the L2 region, resulting in 164 bp amplicon and BPV-4 primer pair (forward 5’- GCTGACCTTCCAGTCTTAAT-3’ and reverse 5’- CAGTTTCAATCTCCTCTTCA-3’) amplify the E7 region, resulting in 170 bp amplicon. PCR was performed in PTC-100 Programmable Thermal Controller (MJ Research, USA), us-ing the following program: 3 minutes at 94ºC (initial denatura-tion), 35 cycles of 50 seconds at 94ºC (denaturation), 1 minute at 60ºC (annealing), 1 minute at 72ºC (extension), and a final extension of 5 minutes at 72ºC. Genomes of BPV-1 (GenBank access number AB626705), 2 (M20219.1), and 4 (X0581.1) cloned in pAT153 vector [38], using Escherichia coli were used as positive control. These genomes are part of a biological col-lection at the Genetics Laboratory of Butantan Institute. PCR products were analyzed in 2.0% agarose gel in TAE buffer (0.04 M Tris base, 1 M acetic acid, 50 mM EDTA, pH 8.0) stained with 1.0% GelRed (Biotium, Hayward, USA). Electrophoresis was performed at 100 V, 300 mA for two hours. The 100 bp DNA Ladder (Invitrogen, Carlsbad, USA) was employed as marker.
Cell Cycle analysisCell cycle analysis was performed by flow cytometry, accord-ing to De-Sá-Júnior et al. [35], method widely used to evaluate cell proliferation [39-42]. The cells in second passage (P2) were synchronized by serum deprivation for 24 hours and induced to reenter the cell cycle by the subsequent reintroducing 10% of serum to culture medium. Cells were collected and fixed with cold 70% ethanol and stored at -20ºC. Afterwards, the cells were washed, re-suspended in PBS and incubated at 37ºC for 45 minutes with 10 mg/mL RNase and 1 mg/mL propidi-um iodide (PI) (Invitrogen, Carlsbad, USA). Flow cytometric analysis was performed in FACSCalibur flow cytometer (Bec-ton Dickinson, San Jose, CA). A total of 20,000 events were analyzed. The percentage of DNA content in the different cell cycle phases was determined using Modfit LT software (Verity Software House, Topsham, ME).
Mitochondrial membrane potential (ΔΨm) anal-ysis The mitochondrial membrane potential (∆Ψm) was evaluated by using the MitoTracker probe (Invitrogen, Carlsbad, USA), according to De-Sá-Júnior et al. [35]. MitoTracker is probe derived from X-rosamine, which has selective permeability to mitochondrial membrane.
One flask of each cell line, in second passage (P2), was des-tined to ΔΨm analysis. The second passage was used to avoid false positive results due to cell manipulation. Cells were in-cubated with 20 nM of MitoTracker probe, diluted in dime-thyl sulfoxide (DMSO) at 37ºC. Cells were washed with PBS and subjected to monolayer disaggregation. A total of 10,000 events were analyzed in Accuri C6 flow cytometer (BD Biosci-ence, USA). In addition, it was evaluated the action of BPV-1 E6 recombinant oncoprotein in ΔΨm. For this study, BPV-free cell line (normal skin) was treated with 1 μg/mL of BPV-1 re-combinant oncoprotein for 24 hours and after, subjected to the MitoTracker protocol. All analysis of ΔΨm was performed in duplicate. The E6 recombinant oncoprotein was expressed and purified according Mazzuchelli-de-Souza et al. [43]. The identity of this protein was previously verified in Araldi et al. [44]. The E6 oncoprotein concentration was chosen according to the literature, since the administration of 1 μg/mL of E6 on-coprotein has been suggest as therapeutic vaccine against both BPV and HPV [45]. Statistical analysis was based on cell per-centage and mean of fluorescence intensity (MFI) and stand deviation, since the mean of fluorescence is the most indicated method to analyze the expression of one specific marker in ab-solute terms. The Bonferroni’s test, with significant level of 5%, was used to multiple comparisons. The test was performed us-ing the GraphPad Prim 5.0 software.Reactive oxygen species (ROS) detection assayThe reactive oxygen species (ROS) generation was determined using the kit dichlorofluorescein diacetate (DCFH-DA) (Sig-ma, Germany), according to De-Sá-Júnior et al. [35]. Cells in second passage were incubated with 100 mM of DCFH-DA in a 6-well plate at a density of 4 x 10⁵ cells per well at 5% CO2/95% air at 37ºC for 30 minutes. After removing the DCFH-DA, the cells were washed twice with PBS. The cells were collected and analyzed in a flow cytometer (Accuri C6 flow cytometer, BD Bioscience, USA). Data were reported in terms of fold increase compared to a positive control (BPV uninfected cells treated with 100 nM hydrogen peroxide). Us-ing this same method, it was evaluated the action of BPV-1 E6 recombinant oncoprotein in ROS production. For this, normal skin cell line was treated with 1 μg/mL of E6 recombinant on-coprotein for 24 hours, produced according to Mazzuchelli-de-Souza et al. [43]. All analysis was performed in duplicate. Statistical analysis was based on cell percentage and mean of fluorescence intensity (MFI).Comet assayComet assay was performed according to alkaline technique [45] in order to evaluate DNA breaks (clastogenesis) along of the six cell passages . An aliquot of 10 µL (0.1 x 10⁵ cells) of the cells suspension was washed in PBS. Material was trans-ferred to 0.2 mL polypropylene tubes and mixed with 75 µL of low melting-point agarose (0.7% in PBS) at 37ºC. This LMA concentration do not affect the DNA migration (45). Cell sus-pension was transferred for 76 x 26mm microscope slides pre-coated with normal melting-point agarose (1.5% in PBS) at 60ºC. After the agarose solidification (4ºC for 10 min), the cov-erslips were carefully removed, and the slides were immersed in lysis solution (2.5M NaCl, 100mM Na2EDTA, 10mM Tris-HCl, pH 10, 1% Triton X100, 10% DMSO) for 1 hour at 4ºC.

J Cancer Res Therap Oncol 2016 | Vol 4: 103 JScholar Publishers
Slides were placed into a horizontal electrophoresis appara-tus containing the alkaline buffer (1mM Na2EDTA, 300mM NaOH) at 4ºC. The slides were incubated for 40 minutes in this buffer to unwind the DNA. The electrophoresis was run for 20 minutes at fixed voltage of 25V (0.83V/cm) and 300mA. The slides were washed three times with neutralization buffer (0.4M Tris-HCl, pH 7.5) and fixed in 100% ethanol for 5 min-utes. All steps described above were carried out in the dark with to avoid DNA damage. The slides were stained with 20 µL of propidium iodide (4µg/mL) and visualized in Axio Scope A1 fluorescent microscopy (Carl Zeiss, Germany). A total of 100 nucleoids was analyzed per sample, which was classified in 0 (without damage), 1 (medium damage) and 2 (maxi-mum damage). The number of nucleoids observed per class was multiplied to the class value, resulting in a comet score. Statistical analyses were performed by the Kruskal-Wallis test, followed by the Dunn test, both with 5% of significance level as proposed by Araldi et al. [45]. Linear regressions were used to evaluate the cell manipulation interference in clastogenesis.
Analysis of STAT3 activationGiven that the STAT3 transcription factor can bind to the P97 promoter, leading to E6 gene upregulation and reduces the activity of complex I and II of mitochondrial electron trans-porter chain, promoting the aerobic glycolysis activation [46], the levels of expression of this factor was analyzed by indirect immunofluorescence and flow cytometry. Indirect immunofluorescence: a total of 1 X 10⁵ cells were seeded per well, employing a six-well plate, containing 2 mL of complete DMEM medium and using a 24 X 24 mm sterile cov-er slip. Cells were incubated at 37ºC, with 5% CO2 atmosphere, until a confluency of 80% (about 24 hours). The medium was removed and cells were washed three times with sterile PBS at 37ºC for 5 minutes. Cells were fixated with 4.0% formalin, diluted in PBS, at 4ºC for 30 minutes and then washed three times with PBS at 37ºC for 5 minutes. Cells were permeabi-lized with 0.01% Triton X-100 (Sigma, Germany), diluted in PBS, at 4ºC for 10 minutes. Cells were washed once with PBS and incubated overnight at 4ºC, in a moist chamber, with the polyclonal anti-STAT3 Y705 antibody produced in rabbit (Im-muny, Campinas, Brazil) at 1:50 dilution in 1.0% BSA. The material was washed three times with PBS under described conditions and then incubated at 4ºC for 3 hours with anti-rabbit IgG conjugated with FITC secondary antibody (Sigma, Germany) at 1:200 dilution in 1.0% BSA. A cutaneous papil-loma 01 cell line, incubated only with secondary antibody, was used as negative control. Cells were washed three times with PBS and cover slips were mounted on slides, using 20 μL of ProLong Gold (Invitrogen, Carlsbad, USA) with DAPI. Slides were analyzed in Axio Scope A1 fluorescent microscope (Carls Zeiss, Germany) under total magnification of 400X.Flow cytometry: Cell lines were seeded in culture flasks of 25 cm2 with 5.0 mL of complete DMEM medium. Cells were sub-jected to monolayer disaggregation with 2 mL of EDTA solu-tion, centrifuged at 400 g for 5 minutes. Cells were transferred to 1.5 mL polypropylene tubes and fixed in 1.0 mL of 1.0% formalin solution at 4ºC for 2 hours.
The material was centrifuged under described conditions, and washed twice with 1.0 mL of PBS at 4ºC to remove the forma-lin residues. Cell were incubated with 1.0% BSA at 4ºC for 20 minutes, washed once with PBS, and incubated overnight at 4ºC with 1.0 μL of anti STAT3 Y705 primary antibody (Im-muny, Campinas, Brazil). Cells were centrifuged and washed twice with PBS at 4ºC. The material was incubated at 4ºC for 2 hours with anti-rabbit IgG1 conjugated with Alexa Fluor 633 secondary antibody (Invitrogen, Carlsbad, USA) at 1:200 dilu-tion. Next, cells were washed with PBS, centrifuged and resus-pended in 100 μL of PBS. The material was analyzed in Accuri C6 cytometer (BD Bioscience, USA). A total of 10,000 events were analyzed. Results were analyzed in FlowJo software (Tree-Star, Oregon, USA). Analyses were based on the percentage of immunostained cells and fluorescence median, as proposed elsewhere (47,48). Two controls were used: (1) normal skin cell line not treated with any antibody and (2) cutaneous papil-loma treated only with secondary antibody (Alexa Fluor 633).
ResultsMolecular identification of BPV DNA sequencesPCR results showed the presence of BPV DNA sequences in primary cultures derived from cutaneous papilloma (papil-loma 01), fibropapilomas (papillomas 02 and 03) and esopha-geal carcinoma, but not in normal skin (figure 1). Results also show the maintenance of BPV DNA sequences along the six passages analyzed in primary cultures derived from cutaneous papilloma, fibropapilloma and (figure 1).
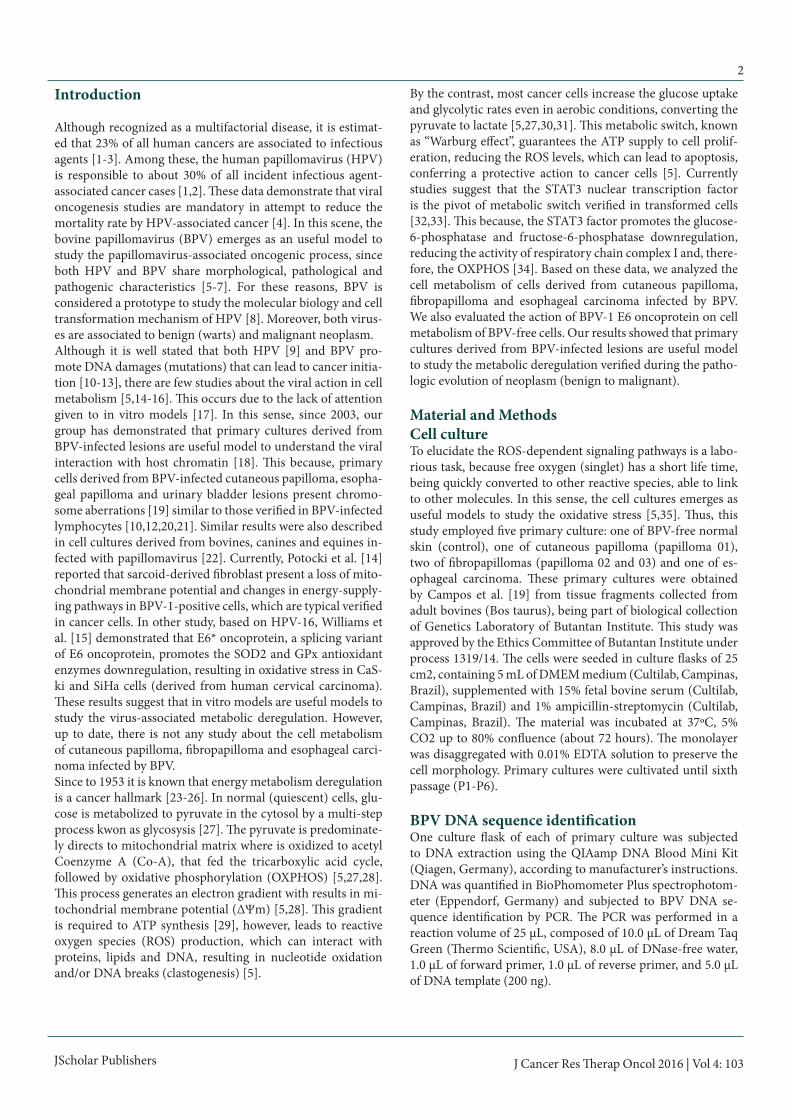
Cell cycle analysisAnalysis of division cell kinetics pointed out an increase in cell percentage in S and/or G2-M phases in BPV-infected cells in relation to normal skin (figure 2), suggesting that the virus can induce the hyperproliferation in vitro.
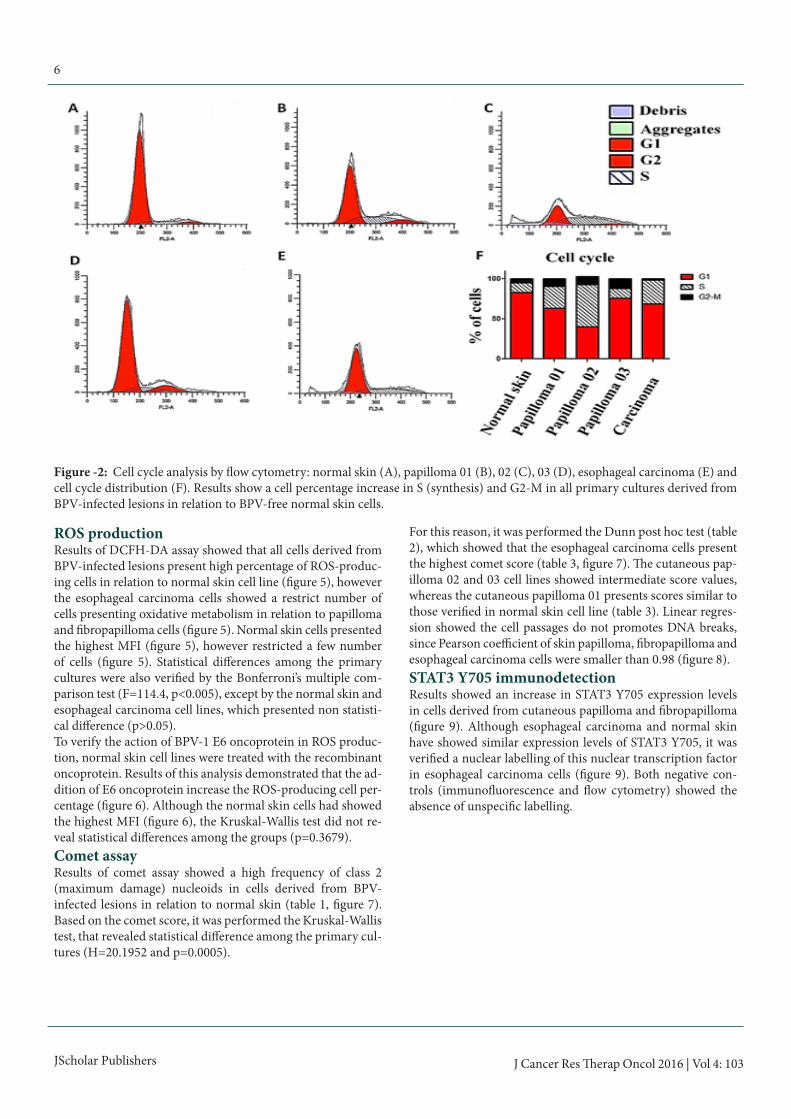
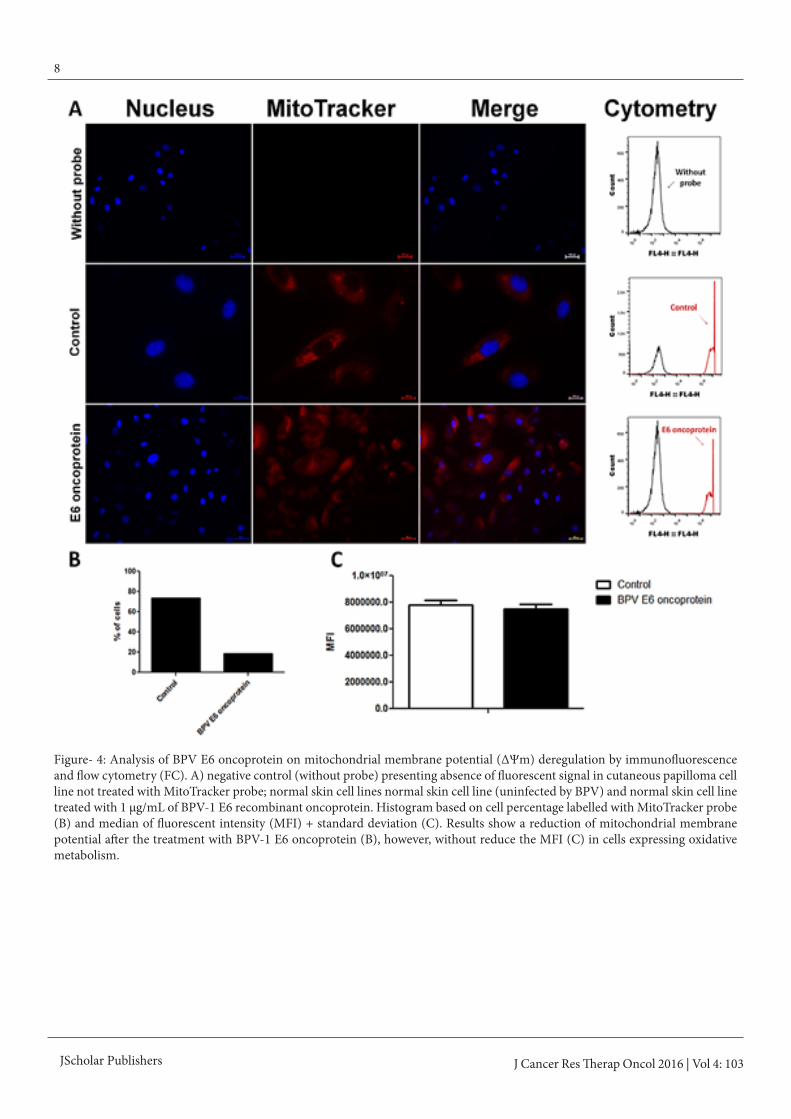
Mitochondrial membrane potential (ΔΨm) anal-ysisResults showed that cutaneous papilloma present an oxidative metabolism similar to those verified in normal skin (figure 3 A and B), being observed the ΔΨm maintenance. By the op-posite, it was verified a reduction in cell percentage in fibro-papilomas (papilloma 02 and 03) and esophageal carcinoma (figure 3A and B), indicating a loss of ΔΨm. Papilloma 02 (fibropapilloma) and esophageal carcinoma cells showed the highest MFI (figure 3C). Statistical differences among these cell lines and normal skin, papilloma 01 and 03 were also veri-fied by the Bonferroni’s multiple comparison test (p < 0.0001). These results suggest that dermis involvement is associated to energy metabolism switch.We also analyzed the action of BPV-1 E6 recombinant onco-protein in the ΔΨm. Results of this analysis showed that the addition of BPV-1 E6 oncoprotein in normal skin (uninfected by BPV) promote the loss of ΔΨm (figure 4).
4

JScholar Publishers J Cancer Res Therap Oncol 2016 | Vol 4: 103
Figure-1: BPV DNA sequences identified by PCR
5
JScholar Publishers J Cancer Res Therap Oncol 2016 | Vol 4: 103
Figure -2: Cell cycle analysis by flow cytometry: normal skin (A), papilloma 01 (B), 02 (C), 03 (D), esophageal carcinoma (E) and cell cycle distribution (F). Results show a cell percentage increase in S (synthesis) and G2-M in all primary cultures derived from BPV-infected lesions in relation to BPV-free normal skin cells.
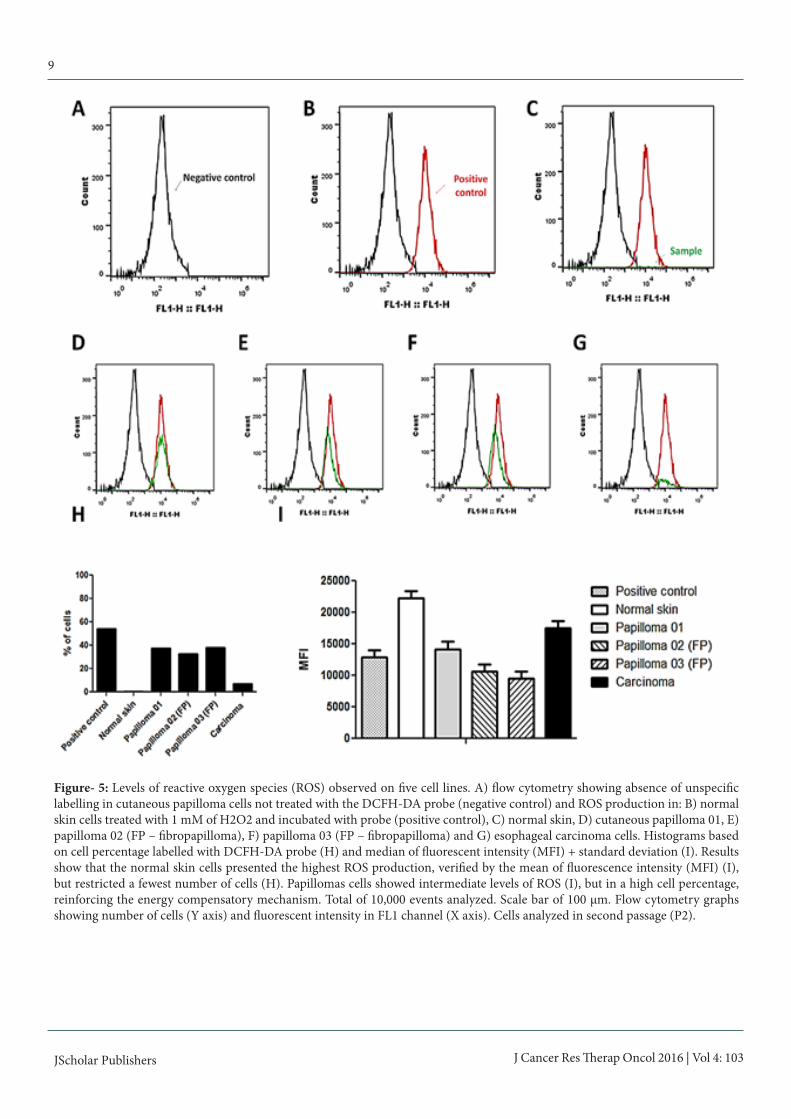
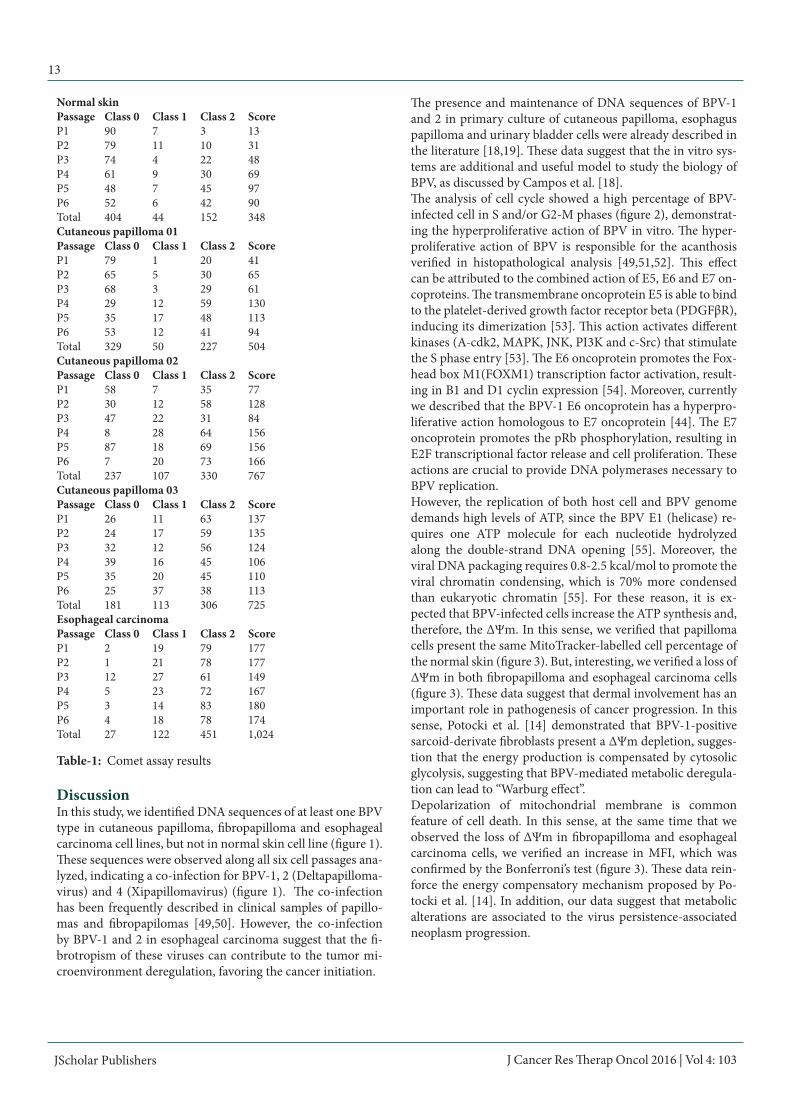
ROS productionResults of DCFH-DA assay showed that all cells derived from BPV-infected lesions present high percentage of ROS-produc-ing cells in relation to normal skin cell line (figure 5), however the esophageal carcinoma cells showed a restrict number of cells presenting oxidative metabolism in relation to papilloma and fibropapilloma cells (figure 5). Normal skin cells presented the highest MFI (figure 5), however restricted a few number of cells (figure 5). Statistical differences among the primary cultures were also verified by the Bonferroni’s multiple com-parison test (F=114.4, p<0.005), except by the normal skin and esophageal carcinoma cell lines, which presented non statisti-cal difference (p>0.05).To verify the action of BPV-1 E6 oncoprotein in ROS produc-tion, normal skin cell lines were treated with the recombinant oncoprotein. Results of this analysis demonstrated that the ad-dition of E6 oncoprotein increase the ROS-producing cell per-centage (figure 6). Although the normal skin cells had showed the highest MFI (figure 6), the Kruskal-Wallis test did not re-veal statistical differences among the groups (p=0.3679).Comet assayResults of comet assay showed a high frequency of class 2 (maximum damage) nucleoids in cells derived from BPV-infected lesions in relation to normal skin (table 1, figure 7). Based on the comet score, it was performed the Kruskal-Wallis test, that revealed statistical difference among the primary cul-tures (H=20.1952 and p=0.0005).
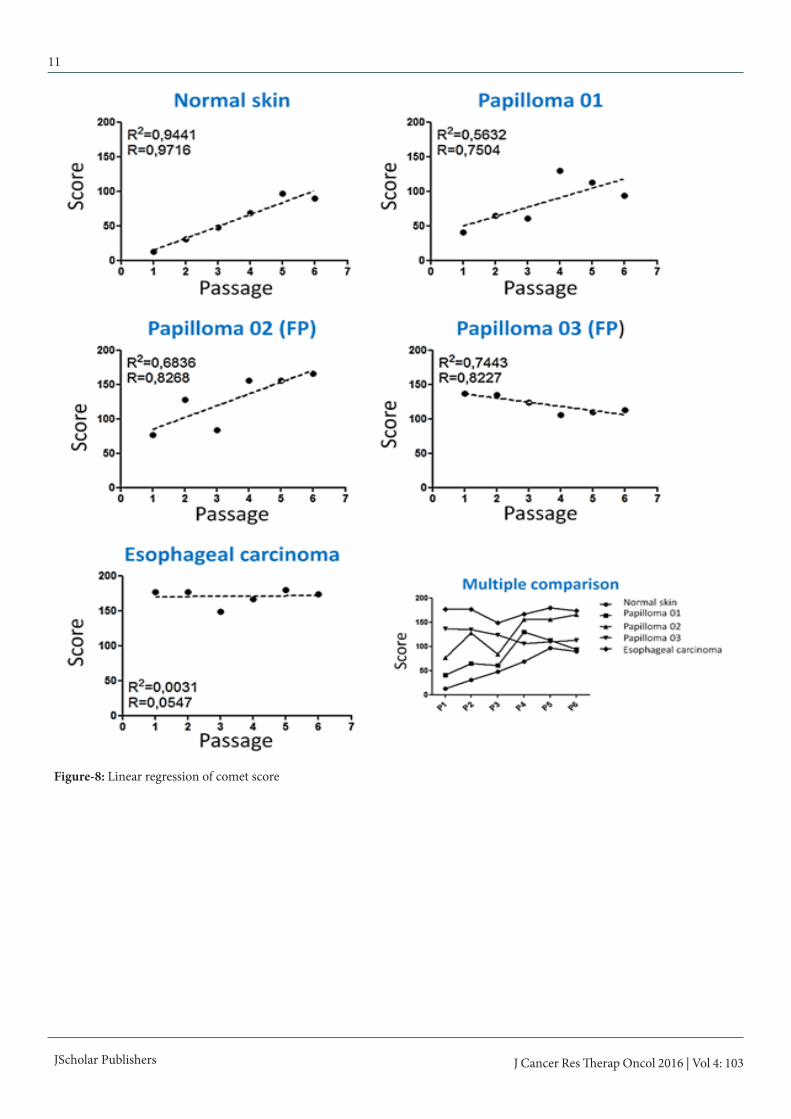
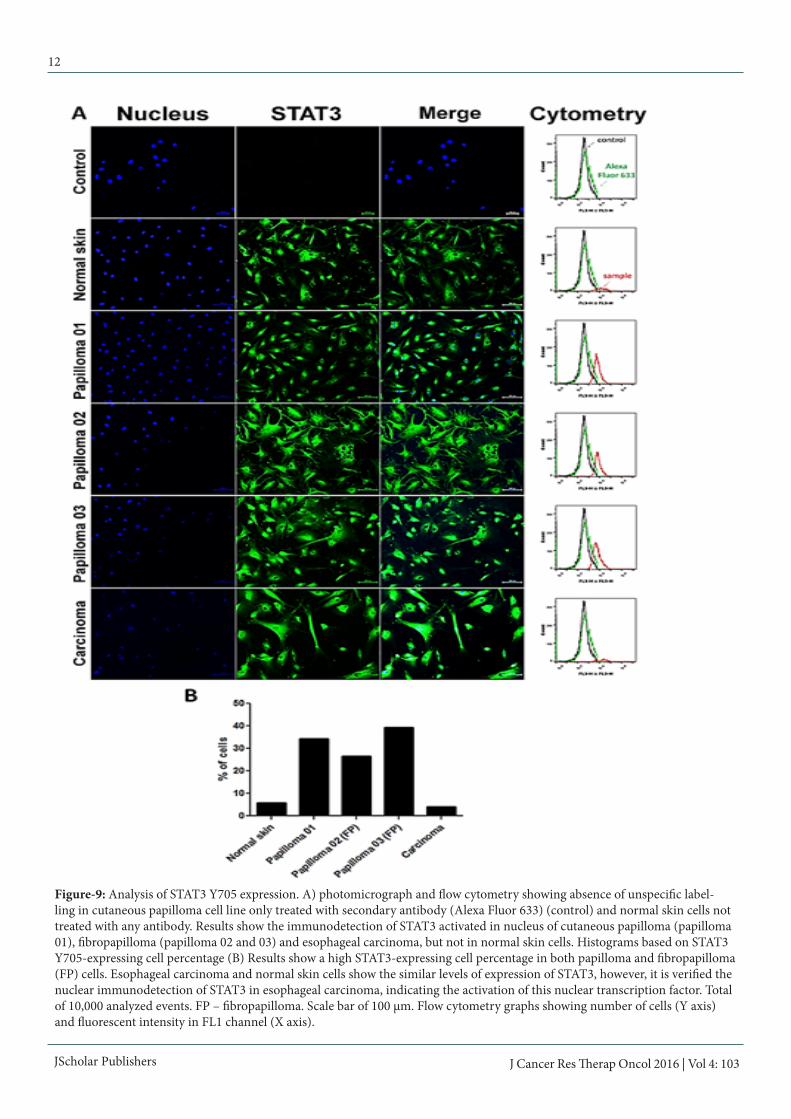
For this reason, it was performed the Dunn post hoc test (table 2), which showed that the esophageal carcinoma cells present the highest comet score (table 3, figure 7). The cutaneous pap-illoma 02 and 03 cell lines showed intermediate score values, whereas the cutaneous papilloma 01 presents scores similar to those verified in normal skin cell line (table 3). Linear regres-sion showed the cell passages do not promotes DNA breaks, since Pearson coefficient of skin papilloma, fibropapilloma and esophageal carcinoma cells were smaller than 0.98 (figure 8).STAT3 Y705 immunodetectionResults showed an increase in STAT3 Y705 expression levels in cells derived from cutaneous papilloma and fibropapilloma (figure 9). Although esophageal carcinoma and normal skin have showed similar expression levels of STAT3 Y705, it was verified a nuclear labelling of this nuclear transcription factor in esophageal carcinoma cells (figure 9). Both negative con-trols (immunofluorescence and flow cytometry) showed the absence of unspecific labelling.
6
JScholar Publishers J Cancer Res Therap Oncol 2016 | Vol 4: 103
Figure -3: Analysis of BPV action on mitochondrial membrane potential (ΔΨm) deregulation by immunofluorescence and flow cytometry (FC): A) control presenting absence of fluorescent signal in cutaneous papilloma cell line not treated with MitoTracker probe, MitoTracker labelling in normal skin, papillomas and esophageal carcinoma cells in second passage. Histograms based on cell percentage labelled with MitoTracker probe (B) and the median of fluorescent intensity (MFI) + standard deviation (C). Results show a reduction in cell percentage with oxidative metabolism in fibropapilloma (FP) and esophageal carcinoma cell lines, suggesting the activation of aerobic glycoslysis. Bonferroni’s multiple comparison analysis based on MFI showed an increase in MFI of papilloma 02 and esophageal carcinoma cells, suggesting an energy compensatory mechanism. Total of 10,000 events ana-lyzed. Scale bar of 100 μm. Flow cytometry graphs showing number of cells (Y axis) and fluorescent intensity in FL4 channel (X axis).
7
J Cancer Res Therap Oncol 2016 | Vol 4: 103 JScholar Publishers
Figure- 4: Analysis of BPV E6 oncoprotein on mitochondrial membrane potential (ΔΨm) deregulation by immunofluorescence and flow cytometry (FC). A) negative control (without probe) presenting absence of fluorescent signal in cutaneous papilloma cell line not treated with MitoTracker probe; normal skin cell lines normal skin cell line (uninfected by BPV) and normal skin cell line treated with 1 μg/mL of BPV-1 E6 recombinant oncoprotein. Histogram based on cell percentage labelled with MitoTracker probe (B) and median of fluorescent intensity (MFI) + standard deviation (C). Results show a reduction of mitochondrial membrane potential after the treatment with BPV-1 E6 oncoprotein (B), however, without reduce the MFI (C) in cells expressing oxidative metabolism.
8
J Cancer Res Therap Oncol 2016 | Vol 4: 103 JScholar Publishers
9
Figure- 5: Levels of reactive oxygen species (ROS) observed on five cell lines. A) flow cytometry showing absence of unspecific labelling in cutaneous papilloma cells not treated with the DCFH-DA probe (negative control) and ROS production in: B) normal skin cells treated with 1 mM of H2O2 and incubated with probe (positive control), C) normal skin, D) cutaneous papilloma 01, E) papilloma 02 (FP – fibropapilloma), F) papilloma 03 (FP – fibropapilloma) and G) esophageal carcinoma cells. Histograms based on cell percentage labelled with DCFH-DA probe (H) and median of fluorescent intensity (MFI) + standard deviation (I). Results show that the normal skin cells presented the highest ROS production, verified by the mean of fluorescence intensity (MFI) (I), but restricted a fewest number of cells (H). Papillomas cells showed intermediate levels of ROS (I), but in a high cell percentage, reinforcing the energy compensatory mechanism. Total of 10,000 events analyzed. Scale bar of 100 μm. Flow cytometry graphs showing number of cells (Y axis) and fluorescent intensity in FL1 channel (X axis). Cells analyzed in second passage (P2).

JScholar Publishers J Cancer Res Therap Oncol 2016 | Vol 4: 103
10
Figure- 6: Levels of reactive oxygen species (ROS) observed after E6 oncoprotein addition. A) normal skin cell line (uninfected by BPV) not incubated with DCFH-DA probe (negative control), showing absence of labelling, B) normal skin cell line treated with 1 mM of H2O2 and incubated with probe, showing ROS formation (positive control), C) normal skin cell line only incubated with probe, showing reduced ROS production as a consequence of normal oxidative metabolis, D) normal skin cell line treated with 1 μg/mL of BPV-1 E6 recombinant oncoprotein. Histogram based on ROS-producing cell percentage (E) and median of fluorescent intensity (MFI) + standard deviation (F). Results show an increase in ROS production in cells treated with BPV-1 E6 oncoprotein. Total of 10,000 events analyzed. Scale bar of 100 μm. Flow cytometry graphs showing number of cells (Y axis) and fluorescent in-tensity in FL1 channel (X axis). Cells analyzed in second passage (P2).
Figure -7: Analysis of clastogenic potential of BPV by comet assay. A) nucleoids showing absence of DNA damage (class 0) ob-served in normal skin (uninfected by BPV), nucleoids showing maximum level of DNA damage (class 2), observed in cutaneous papilloma 01 (B), 02 (C), 03 (D) and esophageal carcinoma cell lines (F). G) Boxplot showing maximum, minimum and median of comet scores, demonstrating high levels of clastogenesis in esophageal carcinoma cell line.
J Cancer Res Therap Oncol 2016 | Vol 4: 103 JScholar Publishers
11
Figure-8: Linear regression of comet score
J Cancer Res Therap Oncol 2016 | Vol 4: 103 JScholar Publishers
12
Figure-9: Analysis of STAT3 Y705 expression. A) photomicrograph and flow cytometry showing absence of unspecific label-ling in cutaneous papilloma cell line only treated with secondary antibody (Alexa Fluor 633) (control) and normal skin cells not treated with any antibody. Results show the immunodetection of STAT3 activated in nucleus of cutaneous papilloma (papilloma 01), fibropapilloma (papilloma 02 and 03) and esophageal carcinoma, but not in normal skin cells. Histograms based on STAT3 Y705-expressing cell percentage (B) Results show a high STAT3-expressing cell percentage in both papilloma and fibropapilloma (FP) cells. Esophageal carcinoma and normal skin cells show the similar levels of expression of STAT3, however, it is verified the nuclear immunodetection of STAT3 in esophageal carcinoma, indicating the activation of this nuclear transcription factor. Total of 10,000 analyzed events. FP – fibropapilloma. Scale bar of 100 μm. Flow cytometry graphs showing number of cells (Y axis) and fluorescent intensity in FL1 channel (X axis).
JScholar Publishers
13
Normal skinPassage Class 0 Class 1 Class 2 ScoreP1 90 7 3 13P2 79 11 10 31P3 74 4 22 48P4 61 9 30 69P5 48 7 45 97P6 52 6 42 90Total 404 44 152 348Cutaneous papilloma 01Passage Class 0 Class 1 Class 2 ScoreP1 79 1 20 41P2 65 5 30 65P3 68 3 29 61P4 29 12 59 130P5 35 17 48 113P6 53 12 41 94Total 329 50 227 504Cutaneous papilloma 02Passage Class 0 Class 1 Class 2 ScoreP1 58 7 35 77P2 30 12 58 128P3 47 22 31 84P4 8 28 64 156P5 87 18 69 156P6 7 20 73 166Total 237 107 330 767Cutaneous papilloma 03Passage Class 0 Class 1 Class 2 ScoreP1 26 11 63 137P2 24 17 59 135P3 32 12 56 124P4 39 16 45 106P5 35 20 45 110P6 25 37 38 113Total 181 113 306 725Esophageal carcinomaPassage Class 0 Class 1 Class 2 ScoreP1 2 19 79 177P2 1 21 78 177P3 12 27 61 149P4 5 23 72 167P5 3 14 83 180P6 4 18 78 174Total 27 122 451 1,024
Table-1: Comet assay results
DiscussionIn this study, we identified DNA sequences of at least one BPV type in cutaneous papilloma, fibropapilloma and esophageal carcinoma cell lines, but not in normal skin cell line (figure 1). These sequences were observed along all six cell passages ana-lyzed, indicating a co-infection for BPV-1, 2 (Deltapapilloma-virus) and 4 (Xipapillomavirus) (figure 1). The co-infection has been frequently described in clinical samples of papillo-mas and fibropapilomas [49,50]. However, the co-infection by BPV-1 and 2 in esophageal carcinoma suggest that the fi-brotropism of these viruses can contribute to the tumor mi-croenvironment deregulation, favoring the cancer initiation.
The presence and maintenance of DNA sequences of BPV-1 and 2 in primary culture of cutaneous papilloma, esophagus papilloma and urinary bladder cells were already described in the literature [18,19]. These data suggest that the in vitro sys-tems are additional and useful model to study the biology of BPV, as discussed by Campos et al. [18]. The analysis of cell cycle showed a high percentage of BPV-infected cell in S and/or G2-M phases (figure 2), demonstrat-ing the hyperproliferative action of BPV in vitro. The hyper-proliferative action of BPV is responsible for the acanthosis verified in histopathological analysis [49,51,52]. This effect can be attributed to the combined action of E5, E6 and E7 on-coproteins. The transmembrane oncoprotein E5 is able to bind to the platelet-derived growth factor receptor beta (PDGFβR), inducing its dimerization [53]. This action activates different kinases (A-cdk2, MAPK, JNK, PI3K and c-Src) that stimulate the S phase entry [53]. The E6 oncoprotein promotes the Fox-head box M1(FOXM1) transcription factor activation, result-ing in B1 and D1 cyclin expression [54]. Moreover, currently we described that the BPV-1 E6 oncoprotein has a hyperpro-liferative action homologous to E7 oncoprotein [44]. The E7 oncoprotein promotes the pRb phosphorylation, resulting in E2F transcriptional factor release and cell proliferation. These actions are crucial to provide DNA polymerases necessary to BPV replication. However, the replication of both host cell and BPV genome demands high levels of ATP, since the BPV E1 (helicase) re-quires one ATP molecule for each nucleotide hydrolyzed along the double-strand DNA opening [55]. Moreover, the viral DNA packaging requires 0.8-2.5 kcal/mol to promote the viral chromatin condensing, which is 70% more condensed than eukaryotic chromatin [55]. For these reason, it is ex-pected that BPV-infected cells increase the ATP synthesis and, therefore, the ΔΨm. In this sense, we verified that papilloma cells present the same MitoTracker-labelled cell percentage of the normal skin (figure 3). But, interesting, we verified a loss of ΔΨm in both fibropapilloma and esophageal carcinoma cells (figure 3). These data suggest that dermal involvement has an important role in pathogenesis of cancer progression. In this sense, Potocki et al. [14] demonstrated that BPV-1-positive sarcoid-derivate fibroblasts present a ΔΨm depletion, sugges-tion that the energy production is compensated by cytosolic glycolysis, suggesting that BPV-mediated metabolic deregula-tion can lead to “Warburg effect”. Depolarization of mitochondrial membrane is common feature of cell death. In this sense, at the same time that we observed the loss of ΔΨm in fibropapilloma and esophageal carcinoma cells, we verified an increase in MFI, which was confirmed by the Bonferroni’s test (figure 3). These data rein-force the energy compensatory mechanism proposed by Po-tocki et al. [14]. In addition, our data suggest that metabolic alterations are associated to the virus persistence-associated neoplasm progression.
J Cancer Res Therap Oncol 2016 | Vol 4: 103

JScholar Publishers
14
Comparition Post difference Z calculated Critical Z pNormal skin and Papilloma 01 3.9167 0.7706 2.807 nsNormal skin and Papilloma 02 11.8333 2.3282 2.807 nsNormal skin and Papilloma 03 10.7500 2.1150 2.807 nsNormal skin and esophageal carcinoma 21.0000 4.1317 2.807 < 0.05Papilloma 01 and Papilloma 02 7.9167 1.5576 2.807 nsPapilloma 01 and Papilloma 03 6.8333 1.3444 2.807 nsPapilloma 01 and esophageal carcinoma 17.0833 3.3611 2.807 < 0.05Papilloma 02 and Papilloma 03 1.0833 0.2131 2.807 nsPapilloma 02 and esophageal carcinoma 9.1667 1.8035 2.807 nsPapilloma 03 and esophageal carcinoma 10.2500 2.0167 2.807 ns
Table-2: Results of post hoc Dunn testns – non significative statiscal difference
Passage Normal skin Papilloma 01 Papilloma 02 Papilloma 03 Esophageal carcinomaP1 13ª* 41ª 77ª,b 137ª,b 177bP2 31ª 65ª 128ª,b 135ª,b 177bP3 48ª 61ª 84ª,b 124ª,b 149bP4 69ª 130ª 156ª,b 106ª,b 167bP5 97ª 113ª 156ª,b 110ª,b 180bP6 90ª 94ª 166ª,b 113ª,b 174bTable-3: Statistical results of comet assay*numbers followed by equal letters indicate the absence of significate statistical differences
Evidences of mutagenic potential of BPV have been described since 1998 [10-12,19]. However, up to date, the DNA damages verified in PVs-infected cells have been attributed to the rep-lication fork stress resulting of the hyperproliferative action of E5, E6 and E7 oncoproteins [13]. In this sense, the high levels of ROS observed in papilloma and fibropapilloma can be dis-cussed as an additional source of mutations. This because ROS can promote the DNA oxidation, leading to DNA breaks [5] observed in papillomavirus-infected cells lines (table 1, figure 7), as well as those described in literature [10-14,19]. Simi-lar results were also verified in HPV infected cells, in which it was demonstrated that the HPV-16 E6*-induced oxidative stress and DNA breaks, which are necessary to HPV integra-tion [15,16].Based on these data, we analyzed the action of BPV-1 E6 re-combinant oncoprotein in glycolytic metabolism. Results of these analysis showed that the BPV E6 oncoprotein lead to ΔΨm loss (figure 4). However, curiously, we observed an in-crease in ROS production in cells treated with E6 oncoprotein (figure 6), suggesting a paradoxical effect. This effect can be at-tributed to the E6-mediated downregulation of SOD2 and GPx antioxidant enzymes (figure 10) [15,16], resulting in hydrogen peroxide (ROS) production. These results suggest that BPV E6 oncoprotein has a pro-oxidant action homologous to those verified in HPV-16 E6* [15], hepatitis C virus (HCV) NS3 and NS5A [56], Epstein-Barr virus (EBV) EBNA1 [57] and dengue virus (DENV) NS1 proteins [58].
Considering the papillomavirus infection persistence, natu-rally verified in both human and bovines, the metabolic de-regulation induced by E6 oncoprotein can contribute to cell transformation. These findings indicate that E6 oncoprotein is a biotechnological target for anti-cancer drug design, since pro-oxidant molecules have revealed a high pharmaceutical valor, once therapies based on anti-oxidant agents (resvera-trol and vitamin E) demonstrated to reduce the DNA damages associated to E6-mediated ROS production [16]. However, in high levels, ROS can lead to apoptosis. For these reason, cancer cells direct their metabolism to glycolytic pathway, avoiding the excessive ROS production that could result in apoptosis. In this sense, we verified an expressive reduction in ΔΨm and ROS production (figure 5) in cells derived from es-ophageal cancer (figure 3), suggesting the activation of aerobic glycolysis, which is considered a cancer hallmark.We observed the activation and nuclear translocation of STAT3 in cells derived from BPV-infected lesions (figure 9). Similar results were also verified in cells infected by other oncogenic viruses, such as: human T-leukemia virus (HTLV) [59], HBV and HCV [60]. These data suggest that the activa-tion of STAT3 in a common pathway observed in the onco-genic process associated to infectious agents.
J Cancer Res Therap Oncol 2016 | Vol 4: 103

JScholar Publishers
15
Figure-10: Downregulation of SOD2 and GPx antioxidant enzymes A) Under normal conditions, the singlet oxygen produced by the mitochondrial complex is converted to hydrogen peroxide by the superoxide dismutase 1 (SOD1) or 2 (SOD2) and, the hydrogen peroxide is converted to water molecule by the GPx enzyme. B) However, the E6 oncoprotein expression leads to the SOD2 and GPx downregulation, reducing the catalysis of singlet oxygen and hydrogen peroxide (ROS). However the electron flux is conserved, avoiding the cytochrome c release and, therefore, conferring an anti-apoptotic stimulus.
The nuclear immunodetection of STAT3 Y705, verified in BPV-infected cells (figure 8), has clinical implications, since STAT3 can induce the D1 and D3 cyclin expression, promot-ing the S phase entry, necessary to the virus replication. In this sense, the STAT3 action can contributes to the cell prolifera-tion increase verified in BPV-infected cells (figure 2). However, the activation of STAT3 can lead the overexpression of glucose receptor GLUT1 [46]. This action affects the complex I and II of mitochondrial electron transporter chain [46], reducing the OXPHOS [46]. Thus, these actions can lead to the reduction of the ΔΨm and ROS production verified in the esophageal carcinoma cell line (figure 3 and 5). In this sense, our results suggest that the STAT3 action can lead to the Warburg effect.In summary, our results demonstrate that primary cultures derived from papillomavirus-infected lesions are useful model to study the energy metabolism alterations induced by viral oncoproteins. Considering that the metabolic switch is recog-nized as a cancer hallmark, our data also show that novel stud-ies involving the interaction between viral oncoprotein and cell metabolism are mandatory to understand the biochemical mechanism that lead to cell transformation, as well as to de-velop most efficient therapies to cancer treatment.
AcknowledgmentsThe authors thank the Fundação de Amparo à Pesquisa do Estado de São Paulo (FAPESP, process 2014/20617-5) by the financial support.
J Cancer Res Therap Oncol 2016 | Vol 4: 103
16
JScholar Publishers
References1) zur Hausen H (2009) The search for infectious causes of human cancers: where and why. Virology 392: 1-10.
2) Bravo IG, de Sanjosé S, Gottschling M (2010) The clinical impor-tance of understanding the evolution of papillomaviruses. Trends Mi-crobiol 18: 432-8.3) Ward M, Ward A, Johansson O (2016) Does the mosquito have more of a role in certain cancers than is currently appreciated? - The mosquito cocktail hypothesis. Med Hypotheses 86: 85-91.
7) Munday J (2014) Bovine and human papillomaviruses: A compar-ative review. Vet Pathol 1-13.
11) Araldi R, Melo T, Diniz N, Carvalho R, Beçak W, Stocco R (2013) Bovine papillomavirus clastogenic effect analyzed in comet assay. Bi-omed Res Int 2013: 1-7.
15) Williams V, Filippova M, Filippov V, Payne K, Duerksen-Hughes P (2014) Human papillomavirus type 16 e6* induces oxidative stress and DNA damage. J Virol 88: 6751-6761.
4) Mushtaq M, Darekar S, Kashuba E (2016) DNA tumor viruses and cell metabolism. Oxid Med Cell Longev 2016 :1-9.
8) Rapp L, Chen J (1998) The papillomavirus E6 proteins. Biochim Biophys Acta - Rev Cancer1378: 1-19.
12) Melo T, Araldi R, Pessoa N, De-Sá-Júnior P, Carvalho R, Beçak W, et al. (2015) Bos taurus papillomavirus activity in peripheral blood mononuclear cells: demonstrating a productive infection. Genet Mol Res14: 16712-16727.
16) Wongworawat Y, Filippova M, Williams V, Filippov V, Duerksen-Hughes P (2016) Chronic oxidative stress increases the integration frequency of foreign DNA and human papillomavirus 16 in human keratinocytes. Am J Cancer Res 6: 764-780.
5) Araldi R, Módolo D, De-Sá-Júnior P, Consonni S, Carvalho R, Roperto F, et al. (2016) Genetics and metabolic deregulation follow-ing cancer initiation: A world to explore. Biomed Pharmacother 82: 449-58.
9) Adam M, Pini C, Túlio S, Cristina J, Lins L, Torres R, et al.(2015) Assessment of the association between micronuclei and the degree of uterine lesions and viral load in women with human papillomavirus. Cancer Genomics Proteomics 12: 67-72.
13) Araldi R, Melo T, Neves A, Spadacci-Morena D, Magnelli R, Módulo D, et al.(2015) Hyperproliferative action of bovine papillo-mavirus (BPV): Genetics and histopathological aspects. Genet Mol Res 14: 12942-12954.
17) Doorbar J (2016) Model systems of human papillomavirus-asso-ciated disease. J Pathol 238: 166-179.
19) Campos S, Melo T, Assaf S, Araldi R, Mazzuchelli-de-Souza J, Sir-cili M, et al. (2013) Chromosome aberrations in cells infected with bovine papillomavirus: comparing cutaneous papilloma, esopha-gus papilloma, and urinary bladder lesion cells. ISRN Oncol 2013: 910849.
6) Araldi R, Assaf S, Carvalho R, Carvalho M, Mazzuchelli-de-Souza J, et al. (in press) Papillomaviruses: a systematic review. Genet Mol Biol.
10) Stocco dos Santos RC, Lindsey CJ, Ferraz OP, Pinto JR, Mirandola RS, et al.(1998) Bovine papillomavirus transmission and chromo-somal aberrations: an experimental model. J Gen Virol 79: 2127-2135.
14) Potocki L, Lewinska A, Klukowska-Rötzler J, Bielak-zmijewska A, Grabowska W, Rzeszutek I, et al. (2014) Sarcoid-derived fibroblasts: links between genomic instability, energy metabolism and senes-cence. Biochimie 97: 163-72.
18) Campos S, Trindade C, Ferraz O, Giovanni D, Lima A, Caetano HA, et al. (2008) Can established cultured papilloma cells harbor bo-vine papillomavirus? Genet Rolecular Res 7: 1119-1126.
J Cancer Res Therap Oncol 2016 | Vol 4: 103
26) Hanahan D, Weinberg R (2011) Hallmarks of cancer: the next generation. Cell 144: 646-74.
30) Garber K (2004) Energy boost: the Warburg effect returns in a new theory of cancer. J Natl Cancer Inst 96:1805-1806.
34) Wang B, Hsu SH, Frankel W, Ghoshal K, Jacob ST (2012) Stat3-mediated activation of microRNA-23a suppresses gluconeogenesis in hepatocellular carcinoma by down-regulating Glucose-6-phos-phatase and peroxisome proliferator-activated receptor gamma, co-activator 1 alpha. Hepatology 56: 186-197.
20) Melo TC, Diniz N, Campos SRC, Ferraz OP, Lindsey CJ, Rieger TT, et al.(2011) Cytogenetic studies in peripheral blood of bovines afflicted by papillomatosis. Vet Comp Oncol 9: 269-274.
27) Lu J, Tan M, Cai Q (2015) The Warburg effect in tumor pro-gression: mitochondrial oxidative metabolism as an anti-metastasis mechanism. Cancer Lett 356: 156-164.
31) Lu H, Forbes R a, Verma A (2002) Hypoxia-inducible factor 1 activation by aerobic glycolysis implicates the Warburg effect in car-cinogenesis. J Biol Chem 277: 23111-23115.
35) De-Sá-Júnior P, Câmara D, Costa A, Ruiz J, Levy D, et al. (2016) Apoptotic effect of eugenol envolves G2/M phase abrogation accom-panied by mitochondrial damage and clastogenic effect on cancer cell in vitro. Phytomedicine 23: 725-735.
24) Vander Heiden MG, Cantley LC, Thompson CB (2009) Under-standing the Warburg effect: the metabolic requirements of cell pro-liferation. Science 324: 1029-1033.
28) Cuninghame S, Jackson R, Zehbe I (2014) Hypoxia-inducible fac-tor 1 and its role in viral carcinogenesis. Virology 456-457: 370-383.
32) Dixit D, Sharma V, Ghosh S, Koul N, Mishra PK, Sen E (2009) Manumycin inhibits STAT3, telomerase activity, and growth of glio-ma cells by elevating intracellular reactive oxygen species generation. Free Radic Biol Med 47: 364-374.
36) Araldi R, Giovanni D, Melo T, Diniz N, Mazzuchelli-de-Souza J, et al. (2004) Bovine papillomavirus isolation by ultracentrifugation. J Virol Methods 208: 119-124.
25) Ferreira LMR (2010) Cancer metabolism: the Warburg effect to-day. Exp Mol Pathol 89: 372-80.
29) Reczek C, Chandel N (2015) ROS-dependent signal transduction. Curr Opin Cell Biol 33:8-13.
33) Demaria M, Giorgi C, Lebiedzinska M, Esposito G, D’angeli L, Bartoli A, et al. (2010) A STAT3-mediated metabolic switch is in-volved in tumour transformation and STAT3 addiction. Aging 2: 823-842.
21) Diniz N, Melo T, Santos J, Mori E, Brandão P, Richtzenhain L, et al.(2009) Simultaneous presence of bovine papillomavirus in blood and in short-term lymphocyte cultures from dairy cattle in Pernam-buco, Brazil. Genet Mol Res8: 1474-1480.22) Simões R, Barth O (2016) Chromosome aberrations as a bio-marker for genomic instability in cell cultures originated from bo-vines, canines and equines infected with papillomavirus. Int J Appl Sci Biotechnol 4 :104-112. 23) Warburg O (1953) On the origin of cancer cells. Science 123(3191):309-14.
37) Borzacchiello G, Ambrosio V, Roperto S, Poggiali F, Tsirimonakis E, et al. (2003) Bovine papillomavirus type 4 in oesophageal papil-lomas of cattle from the South of Italy. J Comp Pathol 128: 203-206.
38) Campo M, Coggins L (1982) Molecular cloning of bovine papil-lomavirus genomes and comparison of their sequence homologies by heteroduplex mapping. J Gen Virol 63: 255-264.
17
JScholar Publishers J Cancer Res Therap Oncol 2016 | Vol 4: 103
40) Darzynkiewicz Z, Bedner E, Smolewski P (2001) Flow cytometry in analysis of cell cycle and apoptosis. Semin Hematol 38: 179-193.
44) Araldi R, Mazzuchelli-de-souza J, Modolo D, Souza E, Melo T, et al. (2015) Mutagenic potential of Bos taurus papillomavirus type 1 E6 recombinant protein : First description. Biomed Res Int 2015:1-15
49) Araldi R, Carvalho R, Melo T, Diniz N, Sant’Ana T, et al. (2014) Bovine papillomavirus in beef cattle : first description of BPV-12 and putative type BAPV8 in Brazil. Genet Mol Res 13: 5644-5653.
48) Herzenberg L, Tung J, Moore W, Herzenberg L, Parks D (2006) Interpreting flow cytometry data: a guide for the perplexed. Nat Im-munol 7: 681-685.
53) Borzacchiello G, Russo V, Gentile F, Roperto F, Venuti A, et al. (2006) Bovine papillomavirus E5 oncoprotein binds to the activated form of the platelet-derived growth factor beta receptor in naturally occurring bovine urinary bladder tumours. Oncogene25: 1251-1260. 54) Wilson AD, Hicks C (2016) Both tumour cells and infiltrating T-cells in equine sarcoids express FOXP3 associated with an immune-supressed cytokine microenvironment. Vet Res 47: 55.55) Hauk G, Berger J (2016) The role of ATP-dependent machines in regulating genome topology. Curr Opin Struct Biol 36: 85-96.
41) Jayat C, Ratinaud M (1993) Cell cycle analysis by flow cytometry: principles and applications. Biol Cell 78:15-25.
45) Araldi R, de Melo T, Mendes T, De-Sá-Júnior P, Nozima B, et al. (2015) Using the comet and micronucleus assays for genotoxicity studies: A review. Biomed Pharmacother 72: 74-82.
50) Melo T, Carvalho R, Mazzucchelli-de-Souza J, Diniz N, Vascon-celos S, Assaf S, et al. (2014) Phylogenetic classification and clinical aspects of a new putative Deltapapillomavirus associated with skin lesions in cattle. Genet Mol Res13: 2458-2469.
42) Nunez R (2001) DNA measurement and cell cycle analysis by flow cytometry. Curr Issues Mol Biol 3: 67-70.
46) Poli V, Camporeale A (2015) STAT3-Mediated Metabolic Repro-graming in Cellular Transformation and Implications for Drug Re-sistance. Front Oncol 5:1-9.
51) Araldi R, Melo T, Neves A, Spadacci-Morena D, Magnelli R, et al. (2015) Hyperproliferative action of bovine papillomavirus (BPV): Genetics and histopathological aspects. Genet Mol Res 14: 12942-12954.
43) Mazzuchelli-de-Souza J, Carvalho R, Ruiz R, Melo T, Araldi R, et al.(2013) Expression and in silico analysis of the recombinant bovine papillomavirus E6 protein as a model for viral oncoproteins studies. Biomed Res Int 2013: 421398.
47) Chan L, Yim E, Choo A (2012) Normalized median fluorescence: An alternative flow cytometry analysis method for tracking human embryonic stem cell states during differentiation. Tissue Engineering: Methods 19:156-165.
52) Carvalho R, Sakata S, Giovanni D, Mori E, Brandão P, et al. (2013) Bovine papillomavirus in Brazil: detection of coinfection of unusual types by a PCR-RFLP method. Biomed Res Int 2013: 270898.
39) Aghaeepour N, Finak G, Hoos H, Mosmann T, Brinkman R, et al. (2013) Critical assessment of automated flow cytometry data analysis techniques. Nat Methods 10: 228-238.
58) Yen Y, Chen H, Lin Y, Shieh C, Wu-Hsieh B (2008) Enhancement by tumor necrosis factor alpha of dengue virus-induced endothelial cell production of reactive nitrogen and oxygen species is key to hem-orrhage development. J Virol 82: 12312-12324.59) Wake M, Watson C (2015) STAT3 the oncogene - still eluding therapy? FEBS J 282: 2600-2611.
56) Choi J, Lee K, Zheng Y, Yamaga A, Lai M, et al. (2004) Reactive oxygen species suppress hepatitis C virus RNA replication in human hepatoma cells. Hepatology 39: 81-9.57) Gruhne B, Sompallae R, Marescotti D, Kamranvar S, Gastaldello S, et al. (2009) The Epstein-Barr virus nuclear antigen-1 promotes genomic instability via induction of reactive oxygen species. Proc Natl Acad Sci USA 106: 2313-2318.
60) Williams V, Brichler S, Khan E, Chami M, Dény P, et al. (2012) Large hepatitis delta antigen activates STAT-3 and NF-kB via oxida-tive stress. J Viral Hepat 19: 744-753.

Submit your manuscript at http://www.jscholaronline.org/submit-manuscript.php
Submit your manuscript to a JScholar journal and benefit from:
¶ Convenient online submission ¶ Rigorous peer review ¶ Immediate publication on acceptance ¶ Open access: articles freely available online ¶ High visibility within the field ¶ Better discount for your subsequent articles
JScholar Publishers J Cancer Res Therap Oncol 2016 | Vol 4: 103
18