research open access urban and transport planning
TRANSCRIPT
RESEARCH Open Access
Urban and transport planning, environmentalexposures and health-new concepts, methodsand tools to improve health in citiesMark J. Nieuwenhuijsen1,2,3
From The 11th International Conference on Urban HealthManchester, UK. 6 March 2014
Abstract
Background: The majority of people live in cities and urbanization is continuing worldwide. Cities have long beenknown to be society’s predominant engine of innovation and wealth creation, yet they are also a main source ofpollution and disease.
Methods: We conducted a review around the topic urban and transport planning, environmental exposures andhealth and describe the findings.
Results: Within cities there is considerable variation in the levels of environmental exposures such as air pollution,noise, temperature and green space. Emerging evidence suggests that urban and transport planning indicatorssuch as road network, distance to major roads, and traffic density, household density, industry and natural andgreen space explain a large proportion of the variability. Personal behavior including mobility adds further variabilityto personal exposures, determines variability in green space and UV exposure, and can provide increased levels ofphysical activity.Air pollution, noise and temperature have been associated with adverse health effects including increasedmorbidity and premature mortality, UV and green space with both positive and negative health effects and physicalactivity with many health benefits. In many cities there is still scope for further improvement in environmentalquality through targeted policies. Making cities ‘green and healthy’ goes far beyond simply reducing CO2 emissions.Environmental factors are highly modifiable, and environmental interventions at the community level, such asurban and transport planning, have been shown to be promising and more cost effective than interventions at theindividual level. However, the urban environment is a complex interlinked system.Decision-makers need not only better data on the complexity of factors in environmental and developmental processesaffecting human health, but also enhanced understanding of the linkages to be able to know at which level to targettheir actions. New research tools, methods and paradigms such as geographical information systems, smartphones, andother GPS devices, small sensors to measure environmental exposures, remote sensing and the exposome paradigmtogether with citizens observatories and science and health impact assessment can now provide this information.(Continued on next page)
Correspondence: [email protected] for Research in Environmental Epidemiology (CREAL), Barcelona,Spain2Universitat Pompeu Fabra (UPF), Barcelona, SpainFull list of author information is available at the end of the article
© 2016 Nieuwenhuijsen. Open Access This article is distributed under the terms of the Creative Commons Attribution 4.0International License (http://creativecommons.org/licenses/by/4.0/), which permits unrestricted use, distribution, andreproduction in any medium, provided you give appropriate credit to the original author(s) and the source, provide a link tothe Creative Commons license, and indicate if changes were made. The Creative Commons Public Domain Dedication waiver(http://creativecommons.org/publicdomain/zero/1.0/) applies to the data made available in this article, unless otherwise stated.
Nieuwenhuijsen Environmental Health 2016, 15(Suppl 1):38DOI 10.1186/s12940-016-0108-1
(Continued from previous page)
Conclusion: While in cities there are often silos of urban planning, mobility and transport, parks and green space,environmental department, (public) health department that do not work together well enough, multi-sectorialapproaches are needed to tackle the environmental problems. The city of the future needs to be a green city, a socialcity, an active city, a healthy city.
BackgroundCities have long been known to be society’s predominantengine of innovation and wealth creation, yet they arealso its main source of crime, pollution, and disease [1].Bettencourt and colleagues [1] showed that processes re-lating urbanization to economic development and know-ledge creation are very general, being shared by all citiesbelonging to the same urban system and sustainedacross different nations and times but that there are effi-ciencies of scale; quantities reflecting wealth creationand innovation have increasing returns, whereas thoseaccounting for infrastructure show economies of scale.Recent estimates show that 60–80 % of final energy useglobally is consumed by urban areas [2] and more than70 % of global greenhouse gas emissions are producedwithin urban areas [3]. As a result, also environmentalpollution increases with urbanization.Lamsal and colleagues [4] found that urban NO2 pol-
lution, like other urban properties, is a power law scalingfunction of the population size: NO2 concentration in-creases proportional to population raised to an expo-nent. The value of the exponent varies by region from0.36 for India to 0.66 for China, reflecting regional dif-ferences in industrial development and per capita emis-sions. Fragkias and colleagues [5] found a near-linearrelationship between population size and carbon emis-sions suggests that large urban areas in the U.S. are onlyslightly more emissions efficient than small ones. Foreach year in their sample, variation in population sizeacross cities in the U.S. urban system explained approxi-mately 70 % of the variation of CO2 emissions.Already in 1973, Oke [6] described the relation be-
tween population and urban heat island effect. The highdensity of buildings and roads can cause so-called urbanheat islands defined as built up areas that are hotter thannearby rural areas [7]. Fuller and colleagues [8] showedthat in Europe green space coverage increases more rap-idly than city area, but that a decline in green spaceavailability per capita accelerates with increasing popula-tion density, suggesting that access to green space coulddecline rapidly as cities grow, increasing the geograph-ical isolation of people from opportunities to experiencenature.In cities, environmental exposures such as air pollu-
tion [9, 13] temperature [14, 15] and noise [16] havebeen associated with adverse health effects, while
ultraviolet radiation (UVR) [17] and green space [18, 20]have been associated with both positive and negativehealth effects, and are therefore important to measureand control.Today, more than two thirds of the European popula-
tion lives in urban areas and this share continues togrow. The development of our cities will determine thefuture economic, social and territorial development ofthe European Union [21]. Urban sprawl and the spreadof low-density settlements is one of the main threats tosustainable territorial development; public services aremore costly and difficult to provide, natural resourcesare overexploited, public transport networks are insuffi-cient and car reliance and congestion in and around cit-ies are heavy. Although air pollution decreased over thelast decades in North American and European cities,more than 80 % of the population in the WHOEuropean Region lives in areas with levels of ambientparticulate matter (PM) exceeding WHO Air QualityGuidelines. The exposure to traffic noise is increasing asa result of continuing urbanization and rising traffic vol-umes, and around 20 % of the Europeans are regularlyexposed to noise exceeding WHO guidelines [http://ec.europa.eu/environment/noise/health_effects.htm].In a seminal paper, Rydin and colleagues [22] provided
an analysis of how health outcomes can be improvedthrough modification of the physical fabric of towns andcities and discussed the role that urban planning canhave in delivering health improvements. The work beganfrom the premise that cities are complex systems, withurban health outcomes dependent on many interactionsand feedback loops, so that prediction within the plan-ning process is fraught with difficulties and unintendedconsequences are common. They provided, amongstothers, separate examples on built environment andphysical activity, green space and urban heat islands.Here we expand the work by Rydin and colleagues [22]on urban design, environmental exposures and health,evaluate the linkages and highlight the large exposurevariation that exists within cities. The focus here is oncities in higher income countries, but applicable to thosein low and middle income countries. The aim is toprovide a narrative towards new insights and possiblesolutions for the current environmental and health chal-lenges in cities, focusing on the links between builtenvironment, environmental exposure and health and
Nieuwenhuijsen Environmental Health 2016, 15(Suppl 1):38 Page 162 of 171
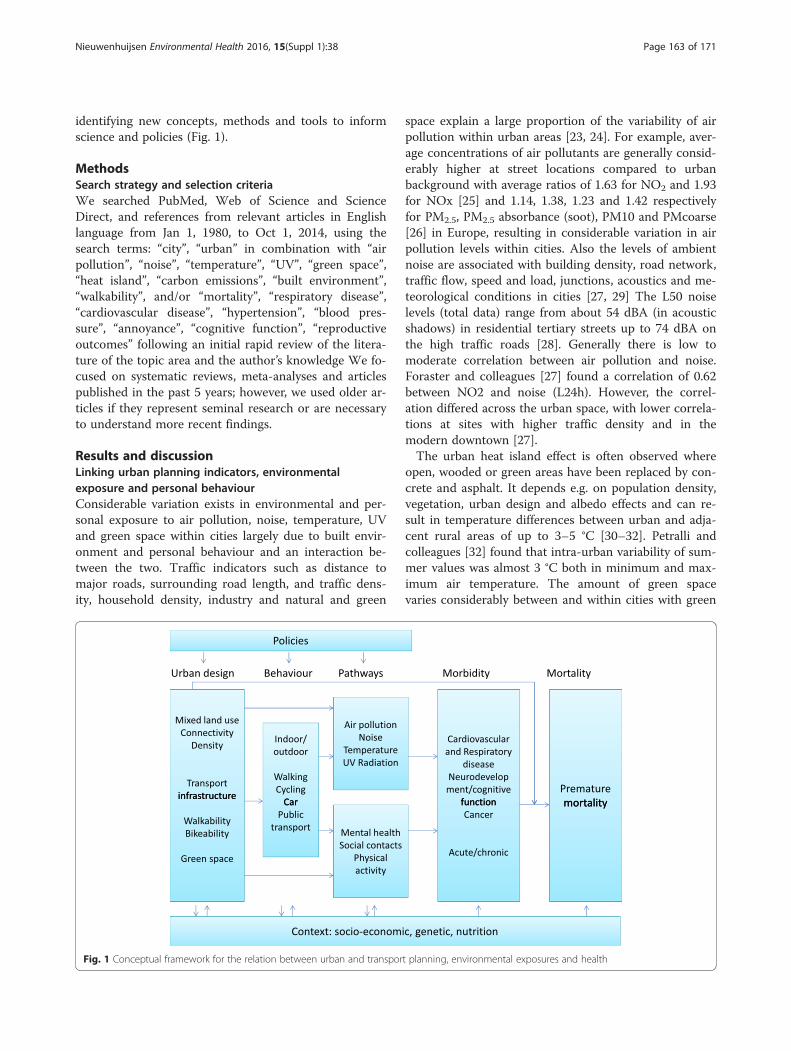
identifying new concepts, methods and tools to informscience and policies (Fig. 1).
MethodsSearch strategy and selection criteriaWe searched PubMed, Web of Science and ScienceDirect, and references from relevant articles in Englishlanguage from Jan 1, 1980, to Oct 1, 2014, using thesearch terms: “city”, “urban” in combination with “airpollution”, “noise”, “temperature”, “UV”, “green space”,“heat island”, “carbon emissions”, “built environment”,“walkability”, and/or “mortality”, “respiratory disease”,“cardiovascular disease”, “hypertension”, “blood pres-sure”, “annoyance”, “cognitive function”, “reproductiveoutcomes” following an initial rapid review of the litera-ture of the topic area and the author’s knowledge We fo-cused on systematic reviews, meta-analyses and articlespublished in the past 5 years; however, we used older ar-ticles if they represent seminal research or are necessaryto understand more recent findings.
Results and discussionLinking urban planning indicators, environmentalexposure and personal behaviourConsiderable variation exists in environmental and per-sonal exposure to air pollution, noise, temperature, UVand green space within cities largely due to built envir-onment and personal behaviour and an interaction be-tween the two. Traffic indicators such as distance tomajor roads, surrounding road length, and traffic dens-ity, household density, industry and natural and green
space explain a large proportion of the variability of airpollution within urban areas [23, 24]. For example, aver-age concentrations of air pollutants are generally consid-erably higher at street locations compared to urbanbackground with average ratios of 1.63 for NO2 and 1.93for NOx [25] and 1.14, 1.38, 1.23 and 1.42 respectivelyfor PM2.5, PM2.5 absorbance (soot), PM10 and PMcoarse[26] in Europe, resulting in considerable variation in airpollution levels within cities. Also the levels of ambientnoise are associated with building density, road network,traffic flow, speed and load, junctions, acoustics and me-teorological conditions in cities [27, 29] The L50 noiselevels (total data) range from about 54 dBA (in acousticshadows) in residential tertiary streets up to 74 dBA onthe high traffic roads [28]. Generally there is low tomoderate correlation between air pollution and noise.Foraster and colleagues [27] found a correlation of 0.62between NO2 and noise (L24h). However, the correl-ation differed across the urban space, with lower correla-tions at sites with higher traffic density and in themodern downtown [27].The urban heat island effect is often observed where
open, wooded or green areas have been replaced by con-crete and asphalt. It depends e.g. on population density,vegetation, urban design and albedo effects and can re-sult in temperature differences between urban and adja-cent rural areas of up to 3–5 °C [30–32]. Petralli andcolleagues [32] found that intra-urban variability of sum-mer values was almost 3 °C both in minimum and max-imum air temperature. The amount of green spacevaries considerably between and within cities with green
Fig. 1 Conceptual framework for the relation between urban and transport planning, environmental exposures and health
Nieuwenhuijsen Environmental Health 2016, 15(Suppl 1):38 Page 163 of 171

space coverage, averaging 18.6 % in European cities andranging from 1.9 to 46 % [8]. A reduction of personalexposure to air pollution has been observed in areaswith more green space [33], while vegetation has beensuggested to reduce air pollution levels, and temperature[34, 35, 36], and vegetation (trees, plants) and soil mayhave an impact on the sound level [37–41]. Frank andcolleagues [42] evaluated the association between a sin-gle index of walk ability that incorporated land use mix,street connectivity, net residential density, and retailfloor area ratios, with health-related outcomes in KingCounty, Washington. They found a 5 % increase in walk-ability to be associated with a per capita 32.1 % increasein time spent in physically active travel, a 0.23-point re-duction in body mass index, 6.5 % fewer vehicle milestraveled, 5.6 % reduction in oxides of nitrogen (NOx)emitted, and 5.5 % reduction in volatile organic com-pounds (VOC) emitted. In general, land use measuressuch as density, connectivity and land use mix, andtravel policies and interventions to increase walking andcycling are consistently associated with higher publictransport use, more walking, and less driving, but thereare few studies on the relation with environmental expo-sures [43]. Furthermore, many built environment attri-butes are strongly associated with higher densitiesmaking it difficult to isolate their effects. Finally peoplespent a large proportion of their time indoors (80–90 %), which affects the levels and frequency of their ex-posure to environmental factors [44, 45]. For example,de Nazelle and colleagues [45] found that people inBarcelona spent 51 % at home, 33 % at work 6 % of theirtime in transit. Dadvand and colleagues [44] found largevariability in personal UV exposure in cities, eventhough ambient levels show little variability, because ofthe variability in duration people spent outdoors.
Health effects of environmental exposuresSingle exposuresRecent studies have shown effects of long-term withincity exposure to air pollution on mortality [10, 11], lungcancer [12], cardiovascular disease incidence [13], de-creased lung function in children [46, 47], respiratory in-fections during early childhood [48] and low birthweight [49] confirming previous studies based on bothwithin and between city exposure to air pollution [9, 50].Furthermore, evidence is emerging for a role of airpollution in other diseases such as diabetes [51, 52].Ambient particulate air pollution was ninth in the rank-ing of the Global Burden of Disease estimates in 2010[53] contributing to an estimated 3–4 million prematuredeaths and is estimated to reduce life expectancy byalmost 9 months on average in Europe [54].Ambient noise has been associated with a range of differ-
ent health outcomes including cardio-vascular mortality
and morbidity [16, 55–57], annoyance and sleep distur-bances [16, 58, 59] high blood pressure in children [60],cognitive effects in children [16, 61, 62] and reproductiveoutcome [63]. Cardiovascular effects by ambient noise havebeen shown to be independent of air pollution exposures[62, 64–66].High and low ambient temperatures have been associ-
ated with mortality [15, 67], cardio respiratory morbidity[14, 68, 69], hospital admissions [70] and children’shealth [71]. Specifically, the urban heat island effect con-tributed significantly to health impacts of the 2003 heatwave in Paris [72]. The temperature-morbidity relation-ship however may be somewhat confounded or modifiedby sociodemographic factors and air pollution [68].Exposure UV radiation (UVR) is associated with both
beneficial effects such as Vitamin D increase [73, 74]and negative effects such as DNA damage [74]. Lucasand colleagues [17] suggested there is a global diseaseburden attributable to exposure to UVR of around50,000 deaths and 1.6 million DALYs specifically forcutaneous malignant melanoma, cortical cataracts of theeye, non-melanoma skin cancers, solar keratoses andpterygium. Furthermore, more recent work suggests thatchronic (not intermittent) sun exposure is associatedwith a reduced risk of colorectal-, breast-, prostate can-cer and Non Hodgkin’s Lymphoma [75], and auto im-mune diseases [76].Green space has been associated with a number of
beneficial health effects [19, 20] including on reducedmortality and increased longevity [18, 77, 78], cardiovas-cular disease [79, 80], people’s self-reported generalhealth [81–83], mental health [84], children’s behavioralproblems [85, 86], sleep patterns [87], recovery from ill-ness [88], social contacts [82, 89], the microbiome [90]and birth outcomes [91]. Increased physical activity andsocial contacts, psychological restoration/stress reduc-tion, and a reduction in pollutants such as noise andair pollution, and heat have been proposed as possiblemechanisms for the health benefits of green space[19, 20, 82]. However it has also been associated withsome negative effects such as increased risk for Lymedisease and skin cancer [19, 20].Finally it is important to note that exposure levels and
exposure response relationships may differ by gender,social economic and ethnic groups for the exposuresabove, which should be considered when evaluating thehealth impacts.
Multiple exposuresGenerally the effects described above have been obtainedthrough epidemiological studies which focused on aspecific environmental exposure and a health outcome,adjusted for important confounders, and occasionallyadjusted for environmental co-variates to assess if the
Nieuwenhuijsen Environmental Health 2016, 15(Suppl 1):38 Page 164 of 171
effects were independent of each other or whetherthere was some modifying or mediation effect, for ex-ample in terms of air pollution and noise [62, 64–66],temperature and air pollution [92–94] and greenspace, noise and air pollution [95, 96]. In a novel ap-proach, Dadvand and colleagues [97] extended previ-ous analyses, suggesting that proximity to major roadsis a risk for term low birth weight. They consideredthe mediating roles of air pollution, noise, heat, androad-adjacent trees in a cohort of births in Barcelona.Their analysis suggested that air pollution and heatjointly account for one-third of the measured associ-ation between road proximity and low birth weight.More than in prior analyses, they considered multiplepotential exposures related to urban form [98]. Thework provides more information on the potential path-ways. It matters what specific pathways link urban designto health, as these pathways can inform the most effectiveinterventions, allowing us to design and retrofit cities forhealth [98]. For example, mixed land use is thought tomake cities more livable—decreasing the distance betweenhome, work, and amenities. However, it is not known howmuch of the associated health benefit might be due tohousing quality, access to healthy or unhealthy amenities,environmental exposures, or the modification of individ-ual risk behaviors. An important question is whetherwe can continue to address each of these factors inisolation [98].
The application of new concepts, methods and tools toprovide new insightsMore recently to get away from studying the “one expos-ure, one health outcome” associations, a new paradigmhas been developed, the exposome. The paradigm envis-ages complex multi-level pathways and interactions withother environmental, socioeconomic, social, behavioraland life-style factors, and genetics. The exposome en-compasses the totality of human environmental (i.e.,non-genetic) exposures from conception onwards, com-plementing the genome [99, 100]. Therefore, it requiresconsideration of both the nature of those exposures andtheir changes over time [100]. The exposome comprisesprocesses internal to the body such as metabolism,endogenous circulating hormones, body morphology,physical activity, gut microflora, inflammation, lipid per-oxidation, oxidative stress and ageing. Secondly, there isthe extensive range of specific external exposures whichinclude air pollution, infectious agents, chemical con-taminants and environmental pollutants, diet, lifestylefactors (e.g. tobacco, alcohol), occupation and medicalinterventions. Thirdly, the exposome includes the widersocial, economic and psychological influences on the in-dividual, for example: social capital, education, financialstatus, psychological and mental stress, urban–rural
environment and climate [100]. The dynamic nature ofthe exposome presents one of the most challenging fea-tures of its characterization. Only because of the in-creased use of new technologies including geographicalinformation systems (GIS), sensors, remote sensing,OMICS technologies (e.g. transcriptomics, proteomics,metabolomics), combined with more traditional ap-proaches has it become possible to start assessing theexposome and first attempts are being made in largeEuropean projects such as HELIX (http://www.pro-jecthelix.eu/) [101], EXPOsOMICs (http://www.exposo-micsproject.eu/) and HEALS (http://www.heals-eu.eu/).The assessment of external environmental exposures
in cities has often been a limiting factor in this type ofresearch, but novel technologies may bring great ad-vancements. Relatively cheap sensors are becomingavailable nowadays to measure environmental exposuressuch as air pollution [102], noise [28] and temperature[32] and can be placed in various locations in a city tocapture the within city variation in exposure. Further-more also satellite data can now be used to capturewithin city variation in air pollution [103], temperature[72, 97, 104, 105], and green space [85, 95]. Also the useof new technologies including smartphones, other GPSdevices and small sensors can improve personal assess-ment of exposure by obtaining information on thelocation and mobility of a person, environmental ex-posure level information and physical activity levels[102, 106–113]. Many people in high income coun-tries nowadays have smartphones which with the useof Apps can provide information to characterize ex-posure [45, 112, 114, 115]. The smartphone data canbe used to show objectively where people spend theirtime, and therefore which level of exposure they mayexperience, when overlaid with exposure maps [45] orconnected to pollution sensors [115]. Furthermore,the combination of assessment of personal air pollu-tion concentrations and physical activity provides theopportunity to estimate the inhaled dose, which maybe a better measure than exposure [45, 116, 117]. Forexample, in Barcelona de Nazelle and colleagues [45]found using modeled NO2 data that, on average, timeat home, which represented 51 % of people’s time ina day, and similarly 54 % of daily time weighted ex-posures, accounted for 40 % of individuals’ total in-haled dose. Time at work, 33 % of people’s dailyactivity, led to 29 % daily time weighted exposuresand 28 % of daily inhaled NO2. In reverse, volunteersonly spent 6 % of their time in transit, yet this micro-environment contributed to 11 % of time weightedexposures in a day, and 24 % of daily inhaled NO2.Also in Barcelona using a Smartphone and a personalsensor measuring black carbon, Nieuwenhuijsen andcolleagues [115] showed travelling routes and varying
Nieuwenhuijsen Environmental Health 2016, 15(Suppl 1):38 Page 165 of 171

black carbon levels along the route, with the highestlevels of black carbon during commuting, lower levelsat school and the lowest level at home. Besides meas-uring exposures, other sensors worn personally canobtain information on health and physiological pa-rameters and thereby obtain continuously and simul-taneously information on environmental exposures andhealth [29, 112, 118, 119, 120]. This type of work also con-tributes to “smart cities” which are cities that use digitaltechnologies to enhance performance and wellbeing, toreduce costs and resource consumption, and also to en-gage more effectively and actively with its citizens.The involvement of a larger proportion of the popula-
tion in cities through citizens science or the new citizensobservatories that are being established to obtain moreinformation on our environment, may offer greater op-portunities for data collection [121–123]. Citizen sciencerefers to the engagement of the general public in scien-tific research activities in which citizens actively contrib-ute to science, be it through their intellectual inputs,knowledge or tools and resources. Citizens observatoriescan be defined as communities where citizens observeand try to understand environment-related problems,and more particularly assess, report and comment onthem. Involving citizens on-site at a local level by de-veloping knowledge pools, and obtaining and usingtheir knowledge, will help to create an atmosphere ofactive participation and generate a sustainable move-ment that can build over time and lead to empower-ment in environmental governance [124–126]. Citizenscan use the information to make changes themselvesor take it to policy makers to have them make thechanges.
From insights to actions to impactsPremature mortality and unhealthy life years due to theenvironment is largely preventable. High blood pressure,obesity and physical inactivity are among the leading riskfactors of non-communicable diseases (NCDs) such ascardiovascular disease, type 2 diabetes, and chronic lungdiseases, which are major causes of death in Europeancountries [127]). Non-communicable diseases (cardio-vascular and respiratory diseases, cancer and diabetes)account for some 86 % of disability adjusted life years(DALYs) in Europe [128], and an estimated impact of upto 7 % on a country’s GDP [129]. One in every six chil-dren has a neurodevelopmental disability [130]; child-hood obesity is one of the most serious public healthchallenges of the 21st century with dramatic rises inEurope in recent decades [131]; the prevalence of im-mune system-mediated outcomes - such as asthma andrespiratory infections - in children is more than 20 % insome countries [132]. To what extent morbidity andpremature mortality could be attributed to the built
environment and related environmental exposures is stillto a large extent unclear, but the numbers above are suf-ficiently large to warrant further action, even if the con-tribution is only small.Traditionally, successful prevention efforts are mainly
focused on adult life style related factors. However, anaccumulating body of evidence suggests that the preven-tion of NCDs should already start in the earliest phaseof life [133–135]. The pathways underlying the observedassociations may include developmental adaptations ofcardiovascular, metabolic, respiratory and cerebral sys-tems, in response to adverse exposures during criticalfetal and childhood periods. These adaptations mayshift developmental trajectories and lead to a highersusceptibility of development of NCDs in later lifeand to earlier ageing [101, 134, 135].Environmental factors are highly modifiable, but
evidence is needed to decide where and when to inter-vene. Particularly, environmental interventions at thecommunity level, such as urban and transport planning[136–139], have been shown to be promising and morecost effective than interventions at the individual level[140]. For example, the ban in coal burning in Dublinreduced the air pollution levels and related respiratoryand cardiovascular mortality by 10 to 15 % [141] andstronger legislation and improved technologies have ledto decreased air pollution levels and improved life ex-pectancy in the US [142].However the urban environment is a complex inter-
linked system. Decision-makers need not only betterdata on the complexity of factors in environmental, per-sonal behavioural and developmental processes affectinghuman health, but also enhanced understanding of thelinkages to be able to know at which level to target theiractions. The new concepts, method and tools describedabove could provide better insights. The modified D-P-S-E-E-A framework (driving forces, pressures, state,exposures, health effects and actions) may be helpful forpolicy and actions as it provides a logical chain of driv-ing forces, pressures, exposures and their specific deter-minants and effects and also identifies specific areas thatcan be targeted for actions [143–145]. However, it maybe limited because it may not include all the complex-ities and further work is needed on this. In cities, drivingforces such as increased urban and population growth,the economic climate and cultural preferences have aprofound effect on urban and transport planning andmay result in pressures such as high car traffic density,limited green and public space areas and mixed landzones, loss of social capital and increases in (fast) foodrestaurants. This may result in a state e.g. high air pollu-tion levels, reduced access to green space, larger dis-tances to travel and poor food environment, with asconsequence e.g. high exposures to air and noise
Nieuwenhuijsen Environmental Health 2016, 15(Suppl 1):38 Page 166 of 171

pollution and heat, limited physical activity, limited so-cial contacts/cohesion, a reduction of opportunities foractive transportation, greater opportunities for fast foodconsumption leading to possible effects on respiratoryand cardiovascular health, growth/obesity, and behav-ioral disorders/cognitive function. Finally, it is importantto consider the context including socioeconomic pos-ition, social environment, life style/behavior, nutritionalstatus and genetic may play a large role and modify therelationships (Fig. 2).To inform any proposed policies and actions, health
impact assessments have recently been conducted totake into account and quantify any potential health risksand benefits for different scenarios to evaluate the over-all potential impacts of a proposed action, especially foractions that may involve multiple exposures andhealth effects [146, 147]. Insightful assessments havebeen conducted for cities in relation to transport pol-icies quantifying both potential health risks and bene-fits in terms of e.g. physical activity, air pollution andaccidents [148–152].Making cities ‘green and healthy’ goes far beyond sim-
ply reducing CO2 emissions. A systemic approach tourban and transport planning, environmental and energyissues has to be adopted, as the many components ofthe natural ecosystem are interwoven with those of thesocial, economic, cultural and political urban system in aunique manner. A sustainable city must have attractiveopen public spaces and promote sustainable, inclusiveand healthy mobility. Non-car mobility has to becomemore attractive and multimodal public transport systems
favoured [21]. Initiatives like a car free Hamburg by2034 should be encouraged and replicated [153].Urban and transport planning therefore also plays a
key role. While in cities there are generally silos of urbanplanners, mobility and transport, parks and green space,environmental department, (public) health departmentthat do not work together well enough, multi-sectorialapproaches are needed to tackle the problems. Further-more work is needed to bring the various sectors to-gether and to show that systemic approaches involvingmultiple sectors may have benefits for all, through directand co-benefits of specific policies.For example, some potential policies such as a
reduction of car use by increasing public and activetransportation [43, 149–152] and increasing green spaceareas [154, 155] have joint benefits in that they may notonly reduce carbon emissions and environmental expo-sures such as air pollution, noise, and temperature (i.e.heat islands), but also increase physical activity, UV ex-posure, and social contacts and reduce stress, andthereby reduce morbidity and premature mortality [43].Furthermore, physical activity in green spaces appears tohave added benefits [156] and cyclists prefer to cyclethrough greener areas [157]. Furthermore they createco-benefits such as reduction in congestion.
ConclusionsIn conclusion, in this paper we have put cities in a widercontext and made links between urban and transportplanning, environment and health. We consideredmultiple environmental exposures identifying common
Fig. 2 The modified DPSEA frame work for urban and transport planning, environmental exposures and health
Nieuwenhuijsen Environmental Health 2016, 15(Suppl 1):38 Page 167 of 171

determinants and linking the built environment, envir-onmental concentrations, personal behavior and expo-sures and health. We provided a state of the art on thehealth effects of important environmental exposures incities and provided a framework to link science and pol-icies. Finally we proposed a range of new concepts,methods and tools such as the exposome, citizens sci-ence and citizens observatories, environmental, personaland remote sensing, and health impact assessment thatcan be employed to improve understanding and informpolicies and actions. Further work is urgently needed toreduce the burden of disease related to the built envir-onment and environmental exposures in cities and makecities a health promoting place. For this to happen weneed collaboration between e.g. researchers and prac-tioners in urban planning, mobility and transport en-gineering, architecture and landscape architecture,environmental science, behaviour, and public health.The city of the future needs to be a green city, a social city,an active city, a healthy city.
Additional file
Additional file 1: Peer review reports. (PDF 54 kb)
Competing interestsMJN declares no conflict of interest.
Authors’ contributionsMJN conceived the idea for the paper and wrote the paper.
DeclarationsCREAL structural core funding has covered the publication fee of this article.This article has been published as part of Environmental Health Volume 15Suppl 1, 2016: Healthy-Polis: Challenges and Opportunities for UrbanEnvironmental Health and Sustainability. The full contents of the supplementcan be found at http://www.ehjournal.net/supplements/15/S1.
Peer reviewPeer review reports for this article are attached as Additional file 1.
Author details1Center for Research in Environmental Epidemiology (CREAL), Barcelona,Spain. 2Universitat Pompeu Fabra (UPF), Barcelona, Spain. 3Centro deInvestigación Biomédica en Red de Epidemiología y Salud Pública(CIBERESP), Madrid, Spain.
Published: 8 March 2016
References1. Bettencourt LM, Lobo J, Helbing D, Kühnert C, West GB. Growth, innovation,
scaling, and the pace of life in cities. PNAS. 2007;104:7301–6.2. GEA. Global energy assessment–toward a sustainable future. Cambridge,
UK: Cambridge University Press; 2012. p. 1888.3. IEA. World energy outlook 2012. Paris: International Energy Agency (IEA);
2012. p. 700.4. Lamsal LN, Martin RV, Parrish DD, Krotkov NA. Scaling relationship for NO2
pollution and urban population size: a satellite perspective. Environ SciTechnol. 2013;47(14):7855–61.
5. Fragkias M, Lobo J, Strumsky D, Seto KC. Does size matter? Scaling of CO2emissions urban areas. Plos One. 2013;8, e64727.
6. Oke TR. City size and the urban heat island. Atmos Environ. 1973;7:769–79.
7. O’Neill MS, Ebi KL. Temperature extremes and health: impacts of climatevariability and change in the United States. J Occup Environ Med.2009;51(1):13–25.
8. Fuller RA, Gaston KJ. The scaling of green space coverage in Europeancities. Biol Lett. 2009;5:352–5.
9. Hoek G, Krishnan RM, Beelen R, Peters A, Ostro B, Brunekreef B, et al. Long-term air pollution exposure and cardio-respiratory mortality: a review.Environ Health. 2013;12(1):43.
10. Shah AS, Langrish JP, Nair H, McAllister DA, Hunter AL, Donaldson K,et al. Global association of air pollution and heart failure: a systematicreview and meta-analysis. Lancet. 2013;382:1039–48.
11. Beelen R, Raaschou-Nielsen O, Stafoggia M, Andersen ZJ, Weinmayr G, HoffmannB, et al. Effects of long-term exposure to air pollution on natural-cause mortality:an analysis of 22 European cohorts within the multicentre ESCAPE project.Lancet. 2014;383:785–95.
12. Raaschou-Nielsen O, Andersen ZJ, Beelen R, Samoli E, Stafoggia M,Weinmayr G, et al. Air pollution and lung cancer incidence in 17 Europeancohorts: prospective analyses from the European Study of Cohorts for AirPollution Effects (ESCAPE). Lancet Oncol. 2013;14(9):813–22.
13. Cesaroni G, Forastiere F, Stafoggia M, Andersen ZJ, Badaloni C, Beelen R,et al. Long term exposure to ambient air pollution and incidence of acutecoronary events: prospective cohort study and meta-analysis in 11European cohorts from the ESCAPE Project. BMJ. 2014;348:f7412.
14. Turner LR, Barnett AG, Connell D, Tong S. Ambient temperature andcardiorespiratory morbidity: a systematic review and meta-analysis.Epidemiology. 2012;23:594–606.
15. Guo Y, Gasparrini A, Armstrong B, Li S, Tawatsupa B, Tobias A, et al. Globalvariation in the effects of ambient temperature on mortality: a systematicevaluation. Epidemiology. 2014;25(6):781–9.
16. Basner M, Babisch W, Davis A, Brink M, Clark C, Janssen S, et al. Auditory andnon-auditory effects of noise on health. Lancet. 2014;383(9925):1325–32.
17. Lucas RM, McMichael AJ, Armstrong BK, Smith WT. Estimating the globaldisease burden due to ultraviolet radiation exposure. Int J Epidemiol.2008;37:654–67.
18. Mitchell R, Popham F. Effect of exposure to natural environment onhealth inequalities: an observational population study. Lancet.2008;372(9650):1655–60.
19. Lee ACK, Maheswaran R. The health benefits of urban green spaces: areview of the evidence. J Public Health. 2010;33:212–22.
20. Hartig T, Mitchell R, de Vries S, Frumkin H. Nature and health. Annu RevPublic Health. 2014;35:207–28.
21. EU Regional Policy. Cities of tomorrow, 2011 European Union, Brussels. 2011.22. Rydin Y, Bleahu A, Davies M, Dávila JD, Friel S, De Grandis, et al. Shaping
cities for health: complexity and the planning of urban environments inthe 21st century. Lancet. 2012;379(9831):2079–108.
23. Eeftens M, Beelen R, de Hoogh K, Bellander T, Cesaroni G, Cirach M, et al.Development of land use regression models for PM2.5, PM2.5 absorbance, PM10 1and PMcoarse in 20 European study areas; results of the ESCAPE project. EnvironSci Technol. 2012;46(20):11195–205.
24. Beelen R, Hoek G, Vienneau D, Eeftens M, Dimakopoulou K, Pedeli X, et al.Development of NO2 and NOx land use regression models for estimatingair pollution exposure in 36 study areas in Europe–the ESCAPE project.Atmos Environ. 2013;72:10–23.
25. Cyrys J, Eeftens M, Heinrich J, Ampe C, Armengaud A, Beelen R, et al.Variation of NO2 and NOx concentrations between and within 36European study areas. Atmos Environ. 2012;62:374–90.
26. Eeftens M, Tsai M-Y, Ampe C, Anwander B, Beelen R, Bellander T, et al. Variationof PM2.5, PM10, PM2.5 absorbance and PMcoarse concentrations between andwithin 20 European study areas–results of the ESCAPE project. Atmos Environ.2012;62:303–17.
27. Foraster M, Deltell A, Basagaña X, Medina-Ramón M, Aguilera I, Bouso L,et al. Local determinants of road traffic noise levels versus determinants ofair pollution levels in a Mediterranean city. Environ Res. 2011;111(1):177–83.
28. Bell MC, Galatioto F. Novel wireless pervasive sensor network to improvethe understanding of noise in street canyons. Appl Acoust. 2013;74:169–80.
29. Zuo F, Li Y, Johnson S, Johnson J, Varughese S, Copes R, et al. Temporal andspatial variability of traffic-related noise in the City of Toronto, Canada. SciTotal Environ. 2014;472:1100–7.
30. Zhang H, Qi Z-F, Ye X-Y, Cai Y-B, Ma WC, Chen M-N. Analysis of land use/landcover change, population shift, and their effects on spatiotemporal patterns ofurban heat islands in metropolitan Shanghai, China. Appl Geogr. 2013;44:121–33.
Nieuwenhuijsen Environmental Health 2016, 15(Suppl 1):38 Page 168 of 171
31. Gago EJ, Roldan J, Pacheco-Torres R, Ordóñez J. The city and urban heatislands: a review of strategies to mitigate adverse effects. Renew Sust EnergRev. 2013;25(2013):749–58.
32. Petralli M, Massetti L, Brandani G, Orlandini S. Urban planning indicators:useful tools to measure the effect of urbanization and vegetation onsummer air temperatures. Int J Climatol. 2014;34(2014):1236–44.
33. Dadvand P, de Nazelle A, Triguero-Mas M, Schembari A, Cirach M,Amoly E, et al. Surrounding greenness and exposure to air pollutionduring pregnancy: an analysis of personal monitoring data. EnvironHealth Perspect. 2012;120(9):1286–90.
34. Baldauf R, Watkins N, Heist D, Bailey C, Rowley P, Shores R. Near-road airquality monitoring: factors affecting network design and interpretation ofdata. Air Qual Atmos Health. 2009;2(1):1–9.
35. Su JG, Jerrett M, de Nazelle A, Wolch J. Does exposure to air pollution inurban parks have socioeconomic, racial or ethnic gradients? Environ Res.2011;111(3):319–28.
36. Park M, Hagishima A, Tanimoto J, Narita K-I. Effect of urban vegetation onoutdoor thermal environment: field measurement at a scale model site.Build Environ. 2012;56:38–46.
37. Fang CF, Ling DL. Investigation of the noise reduction provided by treebelts. Landscape Urban Plan. 2003;63:187–95.
38. Fang CF, Ling DL. Guidance for noise reduction provided by tree belts.Landscape Urban Plan. 2005;71:29–34.
39. Samara T, Tsitsoni T. Road traffic noise reduction by vegetation in the cityring road of a big city. In: Kungolos A, Aravossis K, Karagiannidis A,Samaras P, editors. Proceedings of the International Conference onEnvironmental Management, Engineering, Planning and Economics.2007. p. 2591–6. Skiathos.
40. Zhang M, Kang J. Towards the evaluation, description, and creation ofsoundscapes in urban open spaces. Environ Plann B. 2007;34:68–86.
41. Fan Y, Zhiyi B, Zhujun Z, Jiani L. The investigation of noise attenuation byplants and the corresponding noise-reducing spectrum. J Environ Health.2010;72:8–15.
42. Frank LD, Sallis JF, Conway TL, Chapman JE, Saelens BE, Bachman W. Manypathways from land use to health: associations between neighborhoodwalkability and active transportation, body mass index, and air quality. JAPA.2006;72:75–87.
43. de Nazelle A, Nieuwenhuijsen MJ, Anto JM, Brauer M, Briggs D, Braun-Fahrlander C, et al. Improving health through policies that to promoteactive travel: a review of evidence to support integrated health impactassessment. Environ Int. 2011;37:766–77.
44. Dadvand P, Basagaña X, Barrera-Gómez J, Diffey B, Nieuwenhuijsen M.Measurement errors in the assessment of exposure to solar ultraviolet radiationand its impact on risk estimates in epidemiological studies. Photochem PhotobiolSci. 2011;10(7):1161–8.
45. de Nazelle A, Seto E, Donaire-Gonzalez D, Mendez M, Matamala J, RodriguezD, et al. Improving estimates of air pollution exposure through ubiquitoussensing technologies. Environ Pollut. 2013;176:92–9.
46. Gehring U, Gruzieva O, Agius RM, Beelen R, Custovic A, Cyrys J, et al. Airpollution exposure and lung function in children: the ESCAPE project.Environ Health Perspect. 2013;121(11-12):1357–64.
47. Eeftens M, Hoek G, Gruzieva O, Mölter A, Agius R, Beelen R, et al.Elemental composition of particulate matter and the association withlung function. Epidemiology. 2014;25(5):648–57.
48. MacIntyre EA, Gehring U, Mölter A, Fuertes E, Klümper C, Krämer U, et al. Airpollution and respiratory infections during early childhood: an analysis of 10European birth cohorts within the ESCAPE Project. Environ Health Perspect.2014;122(1):107–13.
49. Pedersen M, Giorgis-Allemand L, Bernard C, Aguilera I, Nybo Andersen AM,Ballester F, et al. Ambient Air pollution and Low birth weight: a Europeancohort study (ESCAPE). Lancet Respir Med. 2013;1(9):695–704.
50. Brook RD, Rajagopalan S, Pope 3rd CA, Brook JR, Bhatnagar A, Diez-Roux AV,et al. Particulate matter air pollution and cardiovascular disease: an updateto the scientific statement from the American Heart Association. Circulation.2010;121(21):2331–78.
51. Coogan PF, White LF, Jerrett M, Brook RD, Su JG, Seto E, et al. Air pollutionand incidence of hypertension and diabetes mellitus in black women livingin Los Angeles. Circulation. 2012;125(6):767–72.
52. Eze IC, Schaffner E, Fischer E, Schikowski T, Adam M, Imboden M, et al.Long-term air pollution exposure and diabetes in a population-based Swisscohort. Environ Int. 2014;70:95–105.
53. Lim SS, Vos T, Flaxman AD, Danaei G, Shibuya K, Adair-Rohani H, et al. Acomparative risk assessment of burden of disease and injury attributable to 67risk factors and risk factor clusters in 21 regions, 1990–2010: a systematicanalysis for the global burden of disease study 2010. Lancet. 2012;380:2224–60.
54. WHO. Review of evidence on health aspects of air pollution–REVIHAAPproject: final technical report. Bonn, Germany: World Health Organization; 2013.
55. Ndrepepa A, Twardella D. Relationship between noise annoyance from roadtraffic noise and cardiovascular diseases: a meta-analysis. Noise Health.2011;13(52):251–9.
56. Babisch W, Wolf K, Petz M, Heinrich J, Cyrys J, Peters A. Associations betweentraffic noise, particulate air pollution, hypertension, and isolated systolichypertension in adults: the KORA study. Environ Health Perspect.2014;122(5):492–8.
57. Münzel T, Gori T, Babisch W, Basner M. Cardiovascular effects of environmentalnoise exposure. Eur Heart J. 2014;35(13):829–36.
58. Omlin S, Bauer GF, Brink M. Effects of noise from non-traffic-related ambientsources on sleep: review of the literature of 1990–2010. Noise Health.2011;13(53):299–309.
59. Laszlo HE, McRobie ES, Stansfeld SA, Hansell AL. Annoyance and otherreaction measures to changes in noise exposure–a review. Sci Total Environ.2012;435–436:551–62.
60. Paunović K, Stansfeld S, Clark C, Belojević G. Epidemiological studies onnoise and blood pressure in children: observations and suggestions.Environ Int. 2011;37(2011):1030–41.
61. Stansfeld SA, Berglund B, Clark C, Lopez-Barrio I, Fischer P, Ohrström E.Aircraft and road traffic noise and children’s cognition and health: a cross-national study. Lancet. 2005;365(9475):1942–9.
62. Van Kempen E, Babisch W. The quantitative relationship betweenroad traffic noise and hypertension: a meta-analysis. J Hypertens.2012;30:1075–86.
63. Ristovska G, Laszlo HE, Hansell AL. Reproductive outcomes associated withnoise exposure—a systematic review of the literature. Int J Environ ResPublic Health. 2014;11:7931–52.
64. Sørensen M, Andersen ZJ, Nordsborg RB, Jensen SS, Lillelund KG, Beelen R,et al. Road traffic noise and incident myocardial infarction: a prospectivecohort study. PLoS One. 2012;7(6), e39283.
65. Foraster M, Deltell A, Basagaña X, Medina-Ramón M, Aguilera I, Bouso L,et al. High blood pressure and long-term exposure to indoor noise and airpollution from road traffic. Environ Health Perspect. 2014;122(11):1193–200.
66. Liu C, Fuertes E, Tiesler CM, Birk M, Babisch W, Bauer CP, et al. Theassociations between traffic-related air pollution and noise with bloodpressure in children: results from the GINIplus and LISAplus studies. IntJ Hyg Environ Health. 2014;217(4-5):499–505.
67. Ma W, Chen R, Kan H. Temperature-related mortality in 17 largeChinese cities: how heat and cold affect mortality in China. Environ Res.2014;134C:127–33.
68. Ye X, Wolff R, Yu W, Vaneckova P, Pan X, Tong S. Ambient temperatureand morbidity: a review of epidemiological evidence. Environ HealthPerspect. 2012;120(1):19–28.
69. Cheng J, Xu Z, Zhu R, Wang X, Jin L, Song J, et al. Impact of diurnaltemperature range on human health: a systematic review. Int JBiometeorol. 2014;58(9):2011–24.
70. Hondula DM, Barnett AG. Heat-related morbidity in Brisbane, australia: spatialvariation and area-level predictors. Environ Health Perspect. 2014;122(8):831–6.
71. Xu Z, Etzel RA, Su H, Huang C, Guo Y, Tong S. Impact of ambienttemperature on children’s health: a systematic review. Environ Res. 2012;117:120–31.
72. Laaidi K, Zeghnoun A, Dousset B, Bretin P, Vandentorren S, Giraudet E, et al.The impact of heat islands on mortality in Paris during the August 2003heat wave. Environ Health Perspect. 2012;120(2):254–9.
73. McKenzie R, Liley B, Johnston P, Scragg R, Stewart A, Reeder AI, et al. Smalldoses from artificial UV sources elucidate the photo-production of vitaminD. Photochem Photobiol Sci. 2013;12:1726–37.
74. Petersen B, Wulf HC, Triguero-Mas M, Philipsen PA, Thieden E, Olsen P, et al.Sun and ski holidays improve vitamin D status, but are associated with highlevels of DNA damage. J Invest Dermatol. 2014;134(11):2806–13.
75. van der Rhee H, Coebergh JW, de Vries E. Is prevention of cancer bysun exposure more than just the effect of vitamin D? A systematicreview of epidemiological studies. Eur J Cancer. 2013;49(6):1422–36.
76. Miller FW, Alfredsson L, Costenbader KH, Kamen DL, Nelson LM, NorrisJM, et al. Epidemiology of environmental exposures and human
Nieuwenhuijsen Environmental Health 2016, 15(Suppl 1):38 Page 169 of 171
autoimmune diseases: findings from a National Institute ofEnvironmental Health Sciences Expert Panel Workshop. J Autoimmun.2012;39(4):259–71.
77. Takano T, Nakamura K, Watanabe M. Urban residential environmentsand senior citizens’ longevity in megacity areas: the importance ofwalkable green spaces. J Epidemiol Community Health. 2002;56:913–8.
78. Villeneuve PJ, Jerrett M, Su JG, Burnett R, Chen H, Wheeler AJ, et al. Acohort study relating urban green space with mortality in Ontario,Canada. Environ Res. 2012;115:51–8.
79. Pereira G, Foster S, Martin K, Christian H, Boruff BJ, Knuiman M. The associationbetween neighborhood greenness and cardiovascular disease: anobservational study. BMC Public Health. 2012;12:466.
80. Tamosiunas A, Grazuleviciene R, Luksiene D, Dedele A, Reklaitiene R,Baceviciene M, et al. Accessibility and use of urban green spaces, andcardiovascular health: findings from a Kaunas cohort study. Environ Health.2014;13(1):20.
81. Maas J, Verheij RA, Groenewegen PP, de Vries S, Spreeuwenberg P. Greenspace, urbanity and health: how strong is the relation? J EpidemiolCommunity Health. 2006;60:587–92.
82. de Vries S, van Dillen SM, Groenewegen PP, Spreeuwenberg P. Streetscapegreenery and health: stress, social cohesion and physical activity asmediators. Soc Sci Med. 2013;94:26–33.
83. Richardson EA, Pearce J, Mitchell R, Kingham S. Role of physical activity inthe relationship between urban green space and health. Public Health.2013;127(4):318–24.
84. Gascon M, Triguero-Mas M, Martínez D, Dadvand P, Forns J, Plasència A,et al. Mental health benefits of long-term exposure to residential green andblue spaces: a systematic review. Int J Environ Res Public Health. 2015;12:4354–79.
85. Markevych I, Tiesler CM, Fuertes E, Romanos M, Dadvand P, NieuwenhuijsenMJ, et al. Access to urban green spaces and behavioural problems in children:results from the GINIplus and LISAplus studies. Environ Int. 2014;71:29–35.
86. Balseviciene B, Sinkariova L, Grazuleviciene R, Andrusaityte S, UzdanaviciuteI, Dedele A, et al. Impact of residential greenness on preschool children’semotional and behavioral problems. Int J Environ Res Public Health. 2014;11(7):6757–70.
87. Astell-Burt T, Feng X, Kolt GS. Does access to neighbourhood green spacepromote a healthy duration of sleep? Novel findings from a cross-sectionalstudy of 259 319 Australians. BMJ Open. 2013;3(8), e003094.
88. Ulrich RS. Views through a Windows may influence recovery from surgery.Science. 1984;224(4647):420–1.
89. Maas J, van Dillen SM, Verheij RA, Groenewegen PP. Social contacts as apossible mechanism behind the relation between green space and health.Health Place. 2009;15(2):586–95.
90. Hanski I, von Hertzen L, Fyhrquist N, Koskinen K, Torppa K, Laatikainen T,et al. Environmental biodiversity, human microbiota, and allergy areinterrelated. Proc Natl Acad Sci U S A. 2012;109(21):8334–9.
91. Dzhambov AM, Dimitrova DD, Dimitrakova ED. Association betweenresidential greenness and birth weight: systematic review and meta-analysis.Urban For Urban Green. 2014;13(4):621–9.
92. Ren C, O’Neill MS, Park SK, Sparrow D, Vokonas P, Schwartz J. Ambienttemperature, air pollution, and heart rate variability in an agingpopulation. Am J Epidemiol. 2011;173(9):1013–21.
93. Jhun I, Fann N, Zanobetti A, Hubbell B. Effect modification of ozone relatedmortality risks by temperature in 97 US cities. Environ Int. 2014;73C:128–34.
94. Analitis A, Michelozzi P, D’Ippoliti D, De'Donato F, Menne B, Matthies F, et al.Effects of heat waves on mortality: effect modification and confoundingby air pollutants. Epidemiology. 2014;25(1):15–22.
95. Hystad P, Davies HW, Frank L, Van Loon J, Gehring U, Tamburic L, et al.Residential greenness and birth outcomes: evaluating the influence ofspatially correlated built-environment factors. Environ Health Perspect. 2014;122(10):1095–102.
96. Markevych I, Fuertes E, Tiesler CM, et al. Surrounding greenness and birthweight: results from the GINIplus and LISAplus birth cohorts in Munich.Health Place. 2014;26:39–46.
97. Dadvand P, Ostro B, Figueras F, Foraster M, Basagaña X, Valentín A, et al.Residential proximity to major roads and term low birth weight: the roles ofair pollution, heat, noise, and road-adjacent trees. Epidemiology.2014;25(4):518–25.
98. Brauer M, Hystad P. Commentary: cities and health…let me count the ways.Epidemiology. 2014;25(4):526–7.
99. Wild CP. Complementing the genome with an “exposome”: the outstandingchallenge of environmental exposure measurement in molecularepidemiology. Cancer Epidemiol Biomark Prev. 2005;14:1847–50.
100. Wild CP. The exposome: from concept to utility. Int J Epidemiol. 2012;41:24–32.101. Vrijheid M, Slama R, Robinson O, Chatzi L, Coen M, van den Hazel P, et al.
The human early-life exposome (HELIX): project rationale and design.Environ Health Perspect. 2014;122:535–44.
102. Mead MI, Popoola OAM, Stewart GB, Landshoff P, Calleja M, Hayes M, et al.The use of electrochemical sensors for monitoring urban air quality in low-cost, high-density networks. Atmos Environ. 2013;70:186–203.
103. Kloog I, Nordio F, Coull BA, Schwartz J. Incorporating local land useregression and satellite aerosol optical depth in a hybrid model ofspatiotemporal PM(2.5) exposures in the Mid-Atlantic states. Environ SciTechnol. 2012;46(21):11913–21.
104. Kloog I, Chudnovsky A, Koutrakis P, Schwartz J. Temporal and spatialassessments of minimum air temperature using satellite surface temperaturemeasurements in Massachusetts, USA. Sci Total Environ. 2012;432:85–92.
105. Kloog I, Nordio F, Coull BA, Schwartz J. Predicting spatiotemporal mean airtemperature using MODIS satellite surface temperature measurementsacross the Northeastern USA. Remote Sensing Environ. 2014;150:132–9.
106. Heydenreich J, Wulf HC. Miniature personal electronic UVR dosimeter witherythema response and time-stamped readings in a wristwatch. PhotochemPhotobiol. 2005;81(5):1138–44.
107. Berghmans P, Bleux N, Int Panis L, Mishra VK, Torfs R, Van Poppel M, et al.Exposure assessment of a cyclist to PM10 and ultrafine particles. Sci TotalEnviron. 2009;407:1286–98.
108. Boogaard H, Borgman F, Kamminga J, Hoek G. Exposure to ultrafine andfine particles and noise during cycling and driving in 11 Dutch cities. AtmosEnviron. 2009;43:4234–42.
109. Lane ND, Miluzzo E, Lu H, Peebles D, Choudhury T and Campbell AT. Asurvey of mobile phone sensing. IEEE Commun Mag. 2010;48(9):140–50.
110. Snyder EG, Watkins TH, Solomon PA, Thoma ED, Williams R, Hagler L, et al.The changing paradigm of air pollution monitoring. Environ Sci Technol.2013;47:11369–77.
111. Piedrahita R, Xiang Y, Masson N, Ortega J, Collier A, Jiang Y, et al. The nextgeneration of low-cost personal air quality sensors for quantitative exposuremonitoring. Atmos Meas Tech Discuss. 2014;7:2425–57.
112. Nieuwenhuijsen MJ, Donaire-Gonzalez D, Foraster M, Martinez D, Cisneros A.Using personal sensors to assess the exposome and acute health effect. IntJ Environ Res Public Health. 2014;11:7805–19.
113. Dons E, van Poppel M, Kochan B, Wets G, Int Panis, L. Implementation andvalidation of a modeling framework to assess personal exposure to blackcarbon. Environ Int. 2014;62:64–71.
114. Donaire-Gonzalez D, de Nazelle A, Seto E, Mendez M, Rodriguez D, MarkNieuwenhuijsen M, et al. Comparison of physical activity measures usingsmartphone based CalFit and Actigraph. J Med Internet Res. 2013;15(6), e111.
115. Nieuwenhuijsen MJ, Donaire-Gonzales D, Rivas I, Cirach M, Seto E, Jerrett M,et al. Variability and agreement between modeled and personalcontinuously measured black carbon levels using novel smartphone andsensor technologies. Environ Sci Technol. 2015;49(5):2977–82.
116. Buonanno G, Stabile L, Morawska L, Russi A. Children exposure assessmentto ultrafine particles and black carbon: the role of transport and cookingactivities. Atmos Environ. 2013;79:53–8.
117. Nyhan M, McNabola A, Misstear B. Comparison of particulate matter doseand acute heart rate variability response in cyclists, pedestrians, bus andtrain passengers. Sci Total Environ. 2014;468–469:821–31.
118. Kraus U, Schneider A, Breitner S, Hampel R, Rückerl R, Pitz M, et al.Individual daytime noise exposure during routine activities and heart ratevariability in adults: a repeated measures study. Environ Health Perspect.2013;121:607–12.
119. Lanzinger S, Hampel R, Breitner S, Rückerl R, Kraus U, Cyrys J, et al.Short-term effects of air temperature on blood pressure and pulsepressure in potentially susceptible individuals. Int J Hyg Environ Health.2014;217(7):775–84.
120. Hampel R, Rückerl R, Yli-Tuomi T, Breitner S, Lanki T, Kraus U, et al. Impact ofpersonally measured pollutants on cardiac function. Int J Hyg EnvironHealth. 2014;217:460–4.
121. D’Hondt E, Stevens M, Jacobs A. Participatory noise mapping works!An evaluation of participatory sensing as an alternative to standardtechniques for environmental monitoring. Pervasive Mob Comput.2013;9(5):681–94.
Nieuwenhuijsen Environmental Health 2016, 15(Suppl 1):38 Page 170 of 171
122. Overeem A, Robinson JCR, Leijnse H, Steeneveld GJ, Horn BKP, Uijlenhoet R,et al. Crowdsourcing urban air temperatures from smartphone batterytemperatures. Geophys Res Lett. 2013;40:4081–5.
123. Snik F, Rietjens JHH, Apituley A, Volten H, Mijling B, Di Noia A, et al.Mapping atmospheric aerosols with a citizen science network ofsmartphone spectropolarimeters. Geophys Res Lett. 2014;41(20):7351–8.
124. Castell N, Kobernus M, Liu H-Y, Schneider P, Lahoz W, Berre AJ, et al. Mobiletechnologies and services for environmental monitoring: The Citi-Sense-MOB approach. Urban climate 2014 (in press)
125. McGlade J. Global citizen observatory–the role of individuals in observingand understanding our changing world. 2009. http://www.eea.europa.eu/pressroom/speeches/global-citizen-observatory-the-role-of-individuals-in-observing-and-understanding-our-changing-world (accessed 22.08.14).
126. Citizen’ observatory. http://www.citizen-obs.eu/. Accessed 15 February 2016.127. GBD, 2012 http://www.thelancet.com/themed/global-burden-of-disease.
Accessed 15 February 2016.128. Busse R. Managing chronic disease in Europe, Department of Health Care
Management, Berlin University of Technology. 2009.129. Suhrcke M. The economic costs of ill health in the European Region. Health
systems, health, wealth and societal well-being: assessing the case forinvesting in health systems. 2011. p. 61.
130. Landrigan PJ, Sonawane B, Butler L, Trasande L, Callan R, Droller D. Earlyenvironmental origins of neurodegenerative disease in later life. EnvironHealth Perspect. 2005;113(9):1230–3.
131. Wang Y, Lobstein T. Worldwide trends in childhood overweight and obesity.Int J Pediatr Obes. 2006;1:11–25.
132. Bousquet J, Anto J, Auffray C, Akdis M, Cambon-Thomsen A, Keil T, et al.MeDALL (Mechanisms of the Development of ALLergy): an integratedapproach from phenotypes to systems medicine. Allergy. 2011;66(5):596–604.
133. Barker DJ. The origins of the developmental origins theory. J Intern Med.2007;261(5):412–7.
134. Beddington J, Cooper CL, Field J. The mental wealth of nations. Nature.2008;155:1057–60.
135. Power C, Kuh D, Morton S. From developmental origins of adult disease tolife course research on adult disease and aging: insights from birth cohortstudies. Annu Rev Public Health. 2013;34:7–28.
136. Jackson RJ, Dannenberg AL, Frumkin H. Health and the built environment:10 years after. Am J Public Health. 2013;103(9):1542–4.
137. Ferdinand A, Sen B, Rahurkar S, Engler S, Menachemi N. The relationshipbetween built environments and physical activity: a systematic review. Am JPublic Health. 2012;102(10):e7–13.
138. Ding D, Sallis JF, Kerr J, Lee S, Rosenberg DE. Neighborhood environment andphysical activity among youth a review. Am J Prev Med. 2011;41(4):442–55.
139. Durand CP, Andalib M, Dunton GF, Wolch J, Pentz MA. A systematic review ofbuilt environment factors related to physical activity and obesity risk:implications for smart growth urban planning. Obes Rev. 2011;12(501):e173–82.
140. Chokshi DA, Farley TA. The cost-effectiveness of environmental approachesto disease prevention. New Eng J Med. 2012;367:295–7.
141. Clancy L, Goodman P, Sinclair H. Effect of air-pollution control on deathrates in Dublin, Ireland: an intervention study. Lancet. 2002;360:1210–4.
142. Pope CA, Ezzati M, Dockery DW. Fine-particulate air pollution and lifeexpectancy in the United States. New Eng J Med. 2009;360:376–86.
143. Corvalán C, Briggs D, Kjellström T. Development of environmentalhealth indicators. In: Briggs D, Corvalán C, Nurminen M, editors. Linkagemethods for environment and health analysis: general guidelines. Areport of the health and environment analysis for decision-making(HEADLAMP) Project. Geneva: United Nations Environment Programme,United States Environmental Protection Agency, World Health Organization;1996. p. 19–53.
144. Morris G. New approaches to problem framing in environmental health:application to water. Public Health. 2010;124(11):607–12.
145. Stone DH, Morris GP. Injury prevention: a strategic priority for environmentalhealth? Public Health. 2010;124(10):559–64.
146. Joffe M, Mindell J. A framework for the evidence base to support healthimpact assessment. J Epidemiol Community Health. 2002;56:132–8.
147. Briggs DJ. A framework for integrated environmental health impactassessment of systemic risks. Environ Health. 2008;7:61.
148. Woodcock J, Edwards P, Tonne C, Armstrong BG, Ashiru O, Banister D, et al.Public health benefits of strategies to reduce greenhouse-gas emissions:urban land transport. Lancet. 2009;374:1930–43.
149. Rojas-Rueda D, de Nazelle A, Tainio M, Nieuwenhuijsen MJ. Bike sharingsystem (bicing) in Barcelona, Spain; a description and estimated healthimpacts. BMJ. 2011;343:d452.
150. Rojas-Rueda D, de Nazelle A, Teixidó O, Nieuwenhuijsen MJ. Replacing cartrips by increasing bike and public transport in the greater Barcelonametropolitan area: a health impact assessment study. Environ Int.2012;49:100–9.
151. Rojas-Rueda D, de Nazelle A, Teixidó O, Nieuwenhuijsen M. Health impactassessment of increasing public transport and cycling use in Barcelona: amorbidity and burden of disease approach. Prev Med. 2013;57(5):573–9.
152. Woodcock J, Givoni M, Morgan AS. Health impact modelling of active travelvisions for England and Wales using an IntegratedTransport and HealthImpact Modelling Tool (ITHIM). PLoS One. 2013;8(1), e51462.
153. http://inhabitat.com/hamburg-announces-plans-to-become-a-car-free-city-within-20-years/. Accessed 5/11/2014
154. Natural England. Nature nearby: accessible natural greenspace, UK. 2010.www.naturalengland.org.uk.
155. BOP Consulting. Green spaces: the benefits for London. 2013. http://www.cityoflondon.gov.uk/business/economic-research-and-information/research-publications/Documents/research-2013/Green-Spaces-The-Benefits-for-London.pdf. Accessed 15 February 2016.
156. Bowler DE, Buyung-Ali LM, Knight TM, Pullin AS. A systematic review ofevidence for the added benefits to health of exposure to naturalenvironments. BMC Public Health. 2010;10:456.
157. Wahlgren L, Schantz P. Exploring bike ability in a suburban metropolitanarea using the Active Communting Route Environment Scale (ACRES). Int JEnviron Res Public Health. 2014;11(8):8276–300.
• We accept pre-submission inquiries
• Our selector tool helps you to find the most relevant journal
• We provide round the clock customer support
• Convenient online submission
• Thorough peer review
• Inclusion in PubMed and all major indexing services
• Maximum visibility for your research
Submit your manuscript atwww.biomedcentral.com/submit
Submit your next manuscript to BioMed Central and we will help you at every step:
Nieuwenhuijsen Environmental Health 2016, 15(Suppl 1):38 Page 171 of 171