research paper causality test between...
TRANSCRIPT
TAF Journal of Administrative and Business Studies
2016, 2(2): 101-106 JABS 1
6
Content from this work is copyrighted by TAF Publishing, which permits restricted commercial use, distribution and reproduction in any medium under a written permission. Users may print articles for educational and research uses only, provided the original author and source are credited. Any further utilization of this work must maintain attribution to the author(s), the title of the work and journal citation in the form of a proper scientific referencing.
RESEARCH PAPER
Causality test between exchange rate, inflation rate
and Stock Price Index in Southeast Asia
Tifa Noer Amelia *
Perbanas Institute, Indonesia
Abstract. This paper examines the causality relationship between stock price index,
exchange rate and inflation. The sample is gathered from monthly report for the period of
2012-2015 published in Southeast Asia consisting of Lao PDR, Malaysia, Indonesia,
Singapore and Thailand. Hypothesis is found that all of the variables identified have a
causality relationship. Research proves that the Southeast Asian countries should monitor
each other’s Economic condition continuously since a change in a country’s indicator can
relate and has the impact on the other country. However, the relationship strength is
moderate and weak. So the research must be updated every year since it is valid for short
term or maximum for one year.
© 2016 TAF Publishing. All rights reserved.
I.
INTRODUCTION Association of Southeast Nations (ASEAN) was established
in 1867 to gather the nations under Southeast Asia region
that consists of ten countries. They are Brunei Darussalam,
Cambodia, Indonesia, Lao PDR, Malaysia, Myanmar,
Philippines, Singapore, Thailand, and Vietnam (Secretariat,
2014). Southeast Asian Nation’s territory is 4.494.733 km2
with of population around 629.709.024 people (Organik,
2015). With this number, Southeast Asia’s countries have
numerous development efforts such as APEC (Asia Pacific
Economic Co-operation), AFTA (ASEAN Free Trade Area),
SAARC (South Asia Association for Regional Cooperation),
GMS (Greater Mekong Sub-region, SCGT (Southern China
Growth Triangle), and SIJORI GT (Singapore Johor Riau
Growth Triangle). Southeast Asia’s Gross Domestic
Product (GDP) is 2.4 Billion U.S. dollar and predicted to
* Corresponding author: Tifa Noer Amelia E-mail: [email protected]
reach 5 Billion U.S. dollar in 2020, 45% contribution on its
sea lanes to the world. Stock price index, Exchange rate
and Inflation are the most common Economic indicators
that can be examined with any study background not only
from Economic and Finance. These indicator are strong
enough to affect the Economic condition in many
countries. This is why a research in this area is important
to examine.
LITERATURE REVIEW
There are previous researches that become the research
base. The supportive research is described how inflation
has an adverse effect on unemployment and poverty
(Chakravarty & Mitra, 2010). These economic indicators
also played role in Economic and Financial crisis in Nigeria
and South Africa affected by the spread between long and
short term interest rates, lending and deposit rates, foreign
trade, and hedging strategies (Ikoku & Okany, 2014). In
Pakistan, Inflation has a positively strong influence to
Keywords: Stock price index
Exchange rate
Inflation
Economic indicator
Received: 10 March 2016 Accepted: 16 March 2016 Published: 26 April 2016
102 T. N. Amelia – Causality between exchange … 2016
ISSN: 2414-309X DOI:10.20474/jabs-2.2.5 TAF
Publishing
Stock price Index (Ahmeda, & Mubarikb, 2012). On the
other hand, there is negative behavior of the inflation and
exchange rate to stock exchange in Bovespa (da Silva,
Coronel, & Vieira, 2014). Intraregional linkages are not the
only factor that improves Economic growth, there are
social and political factor as well (Singh, 2015). The other
cases are the fluctuation in gold price that is due to
inflation, exchange rate, and stock price index (Ismail,
Yahya, & Shabri, 2009). Dynamic fluctuation in dollar
countries also has the impact on economic growth so the
inflation persistence is similar between dollarized and
non-dollarized countries that spend more time away from
their equilibrium level on the real exchange rate (Caputo &
Magendzo, 2011). Abandoning a pegged in exchange rate
may be interpreted by some financial markets as signaling
a less strong counter inflationary commitment by the
government in Southeast Asian region (Bird & Rajan,
2002). The last is the evidence that all the ten countries in
Southeast Asia have strong Economic development ration,
around 5.6% unless they do not make domestic and
external risk prevention. So that, continuous reformation,
regional integration and strengthening institution’s
capacity (Taw, 2015) can be ensured.
Hypothesis
The research will examine these six hypotheses. A study
developed the hypothesis that there is a link between the
foreign exchange and stock markets. This link is positive
when stock prices are the lead variable and likely negative
when exchange rates are the lead variable (Dimitrova,
2005).
H1: Exchange Rate has positive causality relationship
to Stock Price index.
H2: Stock Price index has positive causality
relationship to Exchange Rate.
H3: Inflation Rate has positive causality relationship
to Stock Price Index.
H4: Stock Price Index has positive causality
relationship to Inflation Rate.
H5: Exchange rate has positive causality relationship
to Inflation rate.
H6: Inflation rate has positive causality relationship
to Exchange Rate.
METHODOLOGY
Sample
Indonesia, Singapore, Malaysia, Thailand, and Lao PDR are
considered as having the largest economic growth in
Southeast Asia (Geiger, 2014).
Data Collection
Data were gathered from five countries that represent
South East Asia taken from several web sites, especially
from the stock exchange, central bank and finance website
such as Bloomberg and Yahoo Finance. At the beginning,
the countries that will be examined consisted of all the
countries that were geographically listed in ASEAN
(Association of Southeast Asian Nations). Those countries
are Brunei Darussalam, Indonesia, Cambodia, Lao PDR,
Malaysia, Myanmar, Philippines, Singapore, Thailand, and
Vietnam. But then, because of data availability and access
limitation, this research can examine five countries, with
the range of monthly data from 2012-2015. They are:
1. Stock Price Index
Stock is an asset of ownership of a company in the form
of financial instrument. The value of fluctuation of stock
price will be determined by the company’s reputation,
supply and demand of the stock. All listed companies
will be the component of Stock price Index. In a stock
exchange, broker can make a bid for the stock price
offered. The stock price ups and downs are affected by
internal and external factors. Internal factor will relate
to the management ability to manage their business
and finance and make a massive gain, sometimes in the
form of revenue. External factor is mostly related to the
economics condition in a country. To make of sure the
stock price, stockbrokers can visit the Stock Exchange
in every country (Idx, 2004). Stock price index
information was gathered from the stock exchange web
site in involved countries. Such as, idx.co.id for
Indonesia, bursamalaysia.com for Malaysia, sgx.com for
Singapore, set.or.th for Thailand, and lsx.com for Lao
PDR.
2. Exchange Rate
Definition of exchange rate is to define a country’s
currency in term of foreign currency (Bank Indonesia
(BI), 2013). This information was also gathered from
the central bank in each country. Such as bingo for
Indonesia, bnm.gov.my for Malaysia, mas.gov.sg for
Singapore, bot.or.th for Thailand, and bol.gov.la for Lao
PDR.
3. Inflation
Inflation is one of the effects of the prolonged economic
crisis that is faced by a country. Inflation is a condition
where there is an increase in price that is quite sharp
(absolute), which takes place continuously in quite a
long time, followed by further decline in the real value
(intrinsic) of the currency of a country (Khalwaty,
2000). Inflation data from the involved countries were
2016 J. Admin. Bus. Stud. 103
ISSN: 2414-309X DOI: 10.20474/jabs-2.2.5 TAF
Publishing
gathered from finance.yahoo.com.
Model
The research model will define the path of the hypothesis.
Research Method
This research is using quantitative Time-Series method. So
the data will be examined by using EViews program. E
Views (acronym: Econometric Views) is a Windows-based
computer program that is widely used for statistical
analysis and econometric kind of time-series (time series).
The software was developed by Quantitative Micro
Software (QMS) in 1994, that in 2007 has released version
6.0 (Wikipedia, 2013).
1. Statistical Description
Descriptive statistics is a field of statistical science that
studies the ways of collecting, preparing, and
presenting research data. Activities included in the
category are activities of collecting or gathering the
data, or grouping of data, the determination of value
and statistical functions, including graphic and image
creation (Ghozali, 2005). In this part we will generate
several term related to the research such as Mean,
Median, Maximum, standard deviation, skewness and
Jarque-Bera.
2. Unit Root Test
This part of the test will provide the information about
the type of the test, exogenous variable, the lag length
used, test output and associated critical value that is
indicated with probability value. Augmented Dickey
Fuller (ADF) test equation will determine whether the
data is stationary or no by comparing the statistical
value of ADF with the critical value. If the ADF value is
higher than the critical value, the data is stationary.
When the data is not stationary, persistence of shocks
data will be infinite for no stationary series, the
unrelated data possibly has a high R-Square, and the
data validity is low.
3. Johansen Co integration Test
Johansen Co Integration test will explain about the
length of the variables relationship, whether it’s long or
short-term. This approach uses maximum likelihood
procedures that test for the number of co integration
relationships. The availability of Co integration is based
on likelihood ratio (LR) test. If the statistical value of LR
is higher than the critical value then the co integration
is acceptable.
4. Causality Test
Causality test is not just the relation between the
variables but more to see how much of the current
variable value can explain the past value of the variable
and how they predict each other.
5. Vector Auto Regression (VAR)
The VAR approach is needed for structural modeling of
the endogenous variable in the system as a function of
the lagged values of the variable. Here we will read the
R Square for the relation strength. R-Square shows the
strength of the Stock Price Index explaining Exchange
rate and Inflation in each country. Analysis of
Respondents
RESULTS
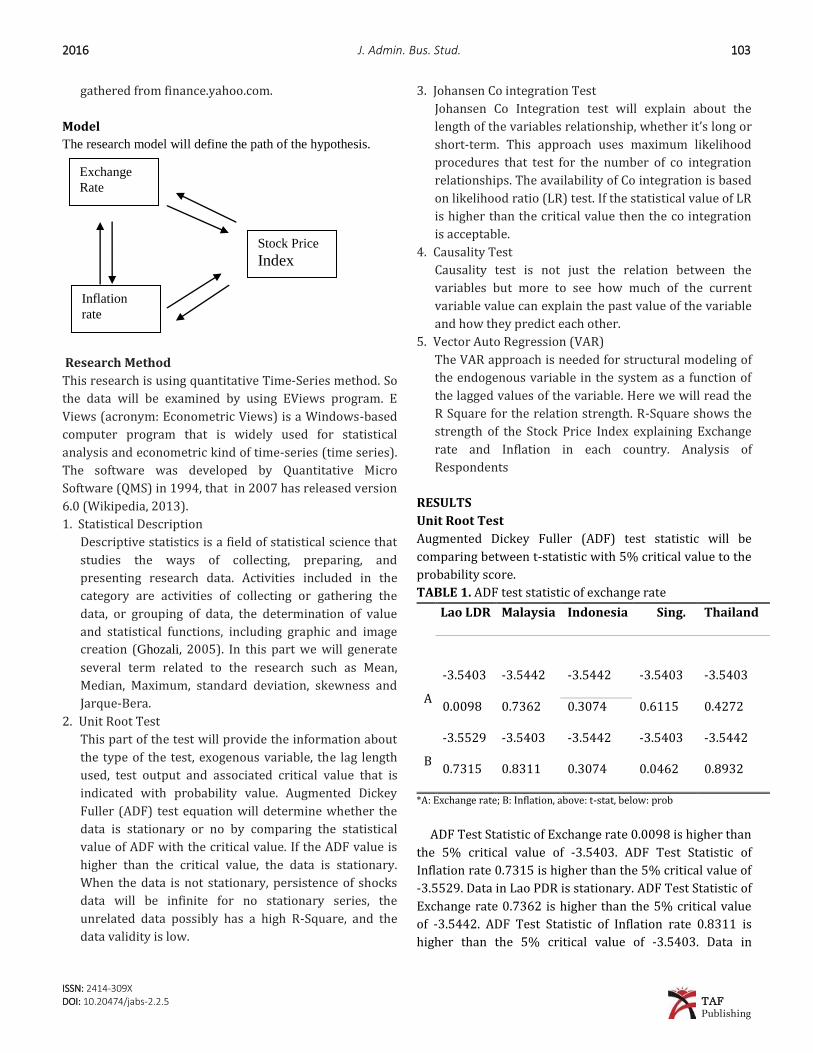
Unit Root Test
Augmented Dickey Fuller (ADF) test statistic will be
comparing between t-statistic with 5% critical value to the
probability score.
TABLE 1. ADF test statistic of exchange rate
Lao LDR Malaysia Indonesia Sing. Thailand
A
-3.5403 -3.5442 -3.5442 -3.5403 -3.5403
0.0098 0.7362 0.3074 0.6115 0.4272
B
-3.5529 -3.5403 -3.5442 -3.5403 -3.5442
0.7315 0.8311 0.3074 0.0462 0.8932
*A: Exchange rate; B: Inflation, above: t-stat, below: prob
ADF Test Statistic of Exchange rate 0.0098 is higher than
the 5% critical value of -3.5403. ADF Test Statistic of
Inflation rate 0.7315 is higher than the 5% critical value of
-3.5529. Data in Lao PDR is stationary. ADF Test Statistic of
Exchange rate 0.7362 is higher than the 5% critical value
of -3.5442. ADF Test Statistic of Inflation rate 0.8311 is
higher than the 5% critical value of -3.5403. Data in
Exchange
Rate
Stock Price Index
Inflation
rate
104 T. N. Amelia – Causality between exchange … 2016
ISSN: 2414-309X DOI:10.20474/jabs-2.2.5 TAF
Publishing
Malaysia is stationary. ADF Test Statistic of Exchange rate
0.3074 is higher than the 5% critical value of -3.5442. ADF
Test Statistic of Inflation rate 0.3817 is higher than the 5%
critical value of -3.5442. Data in Indonesia is stationary.
ADF Test Statistic of Exchange rate 0.6115 is higher than
the 5% critical value of -3.5403. ADF Test Statistic of
Inflation rate 0.0462 is higher than the 5% critical value of
-3.5403. Data in Singapore is stationary. ADF Test Statistic
of Exchange rate 0.4272 is higher than the 5% critical
value of -3.5403. ADF Test Statistic of Inflation rate 0.8932
is higher than the 5% critical value of -3.5442. Data in
Thailand is stationary.
TABLE 2. Johansen Co-integration test
Max-Eigen 0.05
Eigenvalue Statistic Critical Value Prob.**
Lao PDR
0.273481 11.18218 21.13162 0.6291
Malaysia
0.280367 11.51546 21.13162 0.5959
Indonesia
0.209774 8.240274 21.13162 0.8884
Singapore
0.313744 13.17768 21.13162 0.4360
Thailand
0.451010 20.98864 21.13162 0.0523
TABLE 3. Granger causality test
Null Hypothesis: Prob.
X1A does not Granger Cause Y2 0.8827
Y4 does not Granger Cause X1A 0.0567
X4B does not Granger Cause X1B 0.0929
X1B does not Granger Cause X4B 0.0737
X1B does not Granger Cause X5A 0.0507
Y2 does not Granger Cause X1B 0.0746
X2B does not Granger Cause X2A 0.0597
X3B does not Granger Cause X2A 0.0691
X2A does not Granger Cause X4A 0.9724
Y4 does not Granger Cause X2A 0.0676
X2B does not Granger Cause X3A 0.0705
X2B does not Granger Cause X4A 0.0332
X2B does not Granger Cause X4B 0.0843
Y2 does not Granger Cause X2B 0.0549
X4B does not Granger Cause X4A 0.0653
Y1 does not Granger Cause X4A 0.0997
X4B does not Granger Cause Y1 0.9748
Y4 does not Granger Cause X5A 0.0948
Y1 does not Granger Cause X5B 0.0936
Y3 does not Granger Cause Y1 0.0913
Y4 does not Granger Cause Y1 0.0619
Y3 does not Granger Cause Y4 0.0725
The critical value score is 0.6291 higher than the critical
value of 5%, so the relationship in Laos PDR is in the short
run. The probability value is 0.5959 higher than the critical
value of 5%, so the relationship in Malaysia is in the short
run. The probability value is 0.8884 higher than the critical
value of 5%, so the relationship in Indonesia is in the short
run. The probability value is 0.4360 higher than the critical
value of 5%, so the relationship in Singapore is in the short
run. The probability value is 0.0523 higher than the critical
value of 5%, so the relationship in Thailand is in the short
run. This research is symbolized by the use of Y1 as Stock
Price Index in Lao PDR, Y2 as Stock Price Index in
Malaysia, Y3 as Stock Price Index in Indonesia, Y4 as Stock
Price Index in Singapore and Y5 as Stock Price Index in
Thailand. Inflation is symbolized by XA1 as Inflation in Lao
PDR, XA2 as Inflation in Malaysia, XA3 as Inflation in
Indonesia, XA4 as Inflation in Singapore and XA5 as
Inflation in Thailand. Exchange rate is symbolized as XB1
as Exchange Rate in Lao PDR, XB2 as Exchange Rate in
Malaysia, XB3 as Exchange Rate in Indonesia, XB4 as
Exchange Rate in Singapore and XB5 as Exchange Rate in
Thailand. From the results above, this research found that
Exchange Rate in Lao PDR positively has causality
relationship with Stock Price Index in Malaysia. Stock Price
Index in Singapore positively has causality relationship
with Exchange Rate in Lao PDR. Inflation in Singapore
positively has causality relationship to Inflation in Lao
PDR. Inflation in Lao PDR positively has causality
relationship with Inflation in Singapore. Inflation in Lao
PDR positively has causality relationship with Exchange
rate in Thailand. Stock Price Index in Malaysia positively
has causality relationship with Inflation in Lao PDR.
Inflation in Malaysia positively has causality
relationship with Exchange rate in Malaysia. Inflation in
Indonesia positively has causality relationship with
Exchange rate in Malaysia. Exchange rate in Malaysia
positively has causality relationship with Exchange rate in
Singapore. Stock price index in Singapore positively has
causality relationship with Exchange rate in Malaysia.
Inflation in Malaysia positively has causality relationship
with Exchange rate in Indonesia. Inflation in Malaysia
positively has causality relationship to Exchange rate in
Singapore. Inflation in Malaysia positively has causality
2016 J. Admin. Bus. Stud. 105
ISSN: 2414-309X DOI: 10.20474/jabs-2.2.5 TAF
Publishing
relationship with inflation in Singapore. Stock price index
in Malaysia positively has causality relationship with
inflation in Malaysia. Inflation in Singapore positively has
causality relationship with Exchange rate in Singapore.
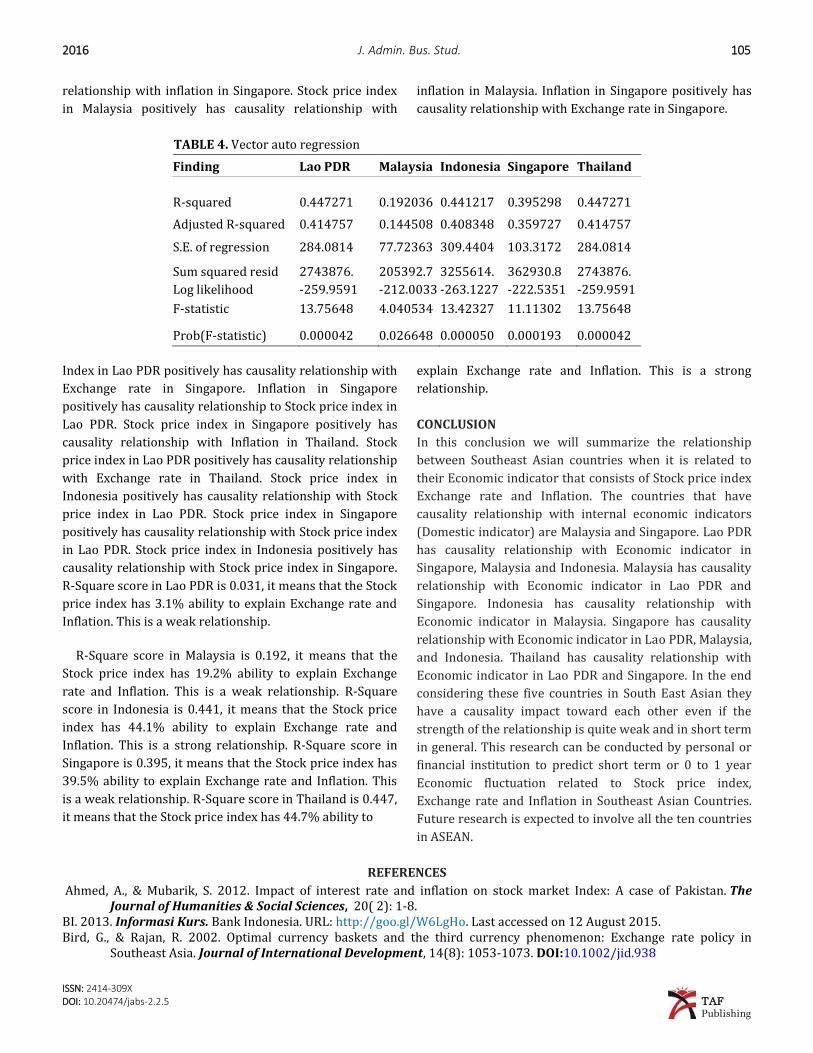
TABLE 4. Vector auto regression
Finding Lao PDR Malaysia Indonesia Singapore Thailand
R-squared 0.447271 0.192036 0.441217 0.395298 0.447271
Adjusted R-squared 0.414757 0.144508 0.408348 0.359727 0.414757
S.E. of regression 284.0814 77.72363 309.4404 103.3172 284.0814
Sum squared resid 2743876. 205392.7 3255614. 362930.8 2743876.
Log likelihood -259.9591 -212.0033 -263.1227 -222.5351 -259.9591
F-statistic 13.75648 4.040534 13.42327 11.11302 13.75648
Prob(F-statistic) 0.000042 0.026648 0.000050 0.000193 0.000042
Index in Lao PDR positively has causality relationship with
Exchange rate in Singapore. Inflation in Singapore
positively has causality relationship to Stock price index in
Lao PDR. Stock price index in Singapore positively has
causality relationship with Inflation in Thailand. Stock
price index in Lao PDR positively has causality relationship
with Exchange rate in Thailand. Stock price index in
Indonesia positively has causality relationship with Stock
price index in Lao PDR. Stock price index in Singapore
positively has causality relationship with Stock price index
in Lao PDR. Stock price index in Indonesia positively has
causality relationship with Stock price index in Singapore.
R-Square score in Lao PDR is 0.031, it means that the Stock
price index has 3.1% ability to explain Exchange rate and
Inflation. This is a weak relationship.
R-Square score in Malaysia is 0.192, it means that the
Stock price index has 19.2% ability to explain Exchange
rate and Inflation. This is a weak relationship. R-Square
score in Indonesia is 0.441, it means that the Stock price
index has 44.1% ability to explain Exchange rate and
Inflation. This is a strong relationship. R-Square score in
Singapore is 0.395, it means that the Stock price index has
39.5% ability to explain Exchange rate and Inflation. This
is a weak relationship. R-Square score in Thailand is 0.447,
it means that the Stock price index has 44.7% ability to
explain Exchange rate and Inflation. This is a strong
relationship.
CONCLUSION
In this conclusion we will summarize the relationship
between Southeast Asian countries when it is related to
their Economic indicator that consists of Stock price index
Exchange rate and Inflation. The countries that have
causality relationship with internal economic indicators
(Domestic indicator) are Malaysia and Singapore. Lao PDR
has causality relationship with Economic indicator in
Singapore, Malaysia and Indonesia. Malaysia has causality
relationship with Economic indicator in Lao PDR and
Singapore. Indonesia has causality relationship with
Economic indicator in Malaysia. Singapore has causality
relationship with Economic indicator in Lao PDR, Malaysia,
and Indonesia. Thailand has causality relationship with
Economic indicator in Lao PDR and Singapore. In the end
considering these five countries in South East Asian they
have a causality impact toward each other even if the
strength of the relationship is quite weak and in short term
in general. This research can be conducted by personal or
financial institution to predict short term or 0 to 1 year
Economic fluctuation related to Stock price index,
Exchange rate and Inflation in Southeast Asian Countries.
Future research is expected to involve all the ten countries
in ASEAN.
REFERENCES
Ahmed, A., & Mubarik, S. 2012. Impact of interest rate and inflation on stock market Index: A case of Pakistan. The Journal of Humanities & Social Sciences, 20( 2): 1-8.
BI. 2013. Informasi Kurs. Bank Indonesia. URL: http://goo.gl/W6LgHo. Last accessed on 12 August 2015. Bird, G., & Rajan, R. 2002. Optimal currency baskets and the third currency phenomenon: Exchange rate policy in
Southeast Asia. Journal of International Development, 14(8): 1053-1073. DOI:10.1002/jid.938
106 T. N. Amelia – Causality between exchange … 2016
ISSN: 2414-309X DOI:10.20474/jabs-2.2.5 TAF
Publishing
Caputo, R., & Magendzo, I. 2011. Do exchange rate regimes matter for inflation and exchange rate dynamics? The case of Central America. Journal of Latin American Studies, 43(02): 327-354. DOI:10.1017/S0022216X11000058
Chakravarty, S., & Mitra, A. 2010. Growth prices and poverty. Journal of Modelling & Simulation of Systems, 1(4): 235-251.
Dimitrova, B.E. 2005. Expertise and explicitation in the translation process. Amsterdam, ND: John Benjamins Publishing. DOI:10.1075/btl.64
Ghozali, I. 2005. Aplikasi analisis multivariate dengan program SPSS. Semarang, ID: Badan Penerbit Universitas Diponegoro . Geiger, T. 2014. Global Competitiveness Report 2014-2015. URL: http://goo.gl/lSna21. Last accessed on 19 April 2016. Idx. 2004. Indeks. URL: http://goo.gl/sdfr84. Last accessed on 15 December 2015. Ikoku, A.E., & Okany, C.T. 2014. Did the Economic and Financial Crises Affect Stock Market Sensitivity to Macroeconomic
Risk Factors? Evidence from Nigeria and South Africa. International Journal of Business, 19(3): 275-290. Ismail, Z., Yahya, A., & Shabri, A. 2009. Forecasting gold prices using multiple linear regression method. American
Journal of Applied Sciences, 6(8): 1509-1514. DOI:10.3844/ajassp.2009.1509.1514 Khalwaty, T. 2000. Inflasi dan solusinya. Jakarta, ID: Penerbit PT Gramedia Pustaka Utama. Organik, R. 2015. Solusi Tugas Sekolah. URL: http://goo.gl/ak4bTX. Last accessed on 19 April 2016. Secretariat, A. 2014. Asean member states . URL: http://goo.gl/OtZ9oa. Last acessed on 16 August 2015. da Silva, F.M., Coronel, D. A., & Vieira, K. M. 2014. Causality and Cointegration Analysis between Macroeconomic Variables
and the Bovespa. PloS One, 9(2): e89765. DOI:10.1371/journal.pone.0089765 Singh, M. 2015. Growth triangles of Southeast Asia: Relevance for peace and stability in ASEAN. International Journal on
Arts, Management & Humanities, 4(1): 61-67. Taw, N.P. 2015. SAEO Press Release 2015. URL: http://goo.gl/kKxkAq. Last acessed on 17 September 2015. Wikipedia. 2013. Eviews. URL: https://goo.gl/yzLaEE. Last acessed on 19 April 2016.
— This article does not have any appendix. —