research paper: occupational disease - canadian … papers do not necessarily represent the views of...
TRANSCRIPT

Research Paper
Occupational Disease
February 2015 Document 215005 Ce document sera bientôt disponible en français. © 2015 Canadian Institute of Actuaries Committee on Workers’ Compensation
Prepared by:
Oliver Wyman
Canadian Institute of Actuaries 1740-360 Albert, Ottawa ON K1R 7X7
Tel: 613-236-8196 Fax: 613-233-4552
cia-ica.ca
Research papers do not necessarily represent the views of the Canadian Institute of Actuaries. Members should be familiar with research papers. Research papers do not constitute standards of practice and therefore are not binding. Research papers
may or may not be in compliance with standards of practice. Responsibility for the manner of application of standards of practice in specific circumstances remains that of the members.

Occupational Disease Canadian Institute of Actuaries
Oliver Wyman Actuarial Consulting Table of Contents
Table of Contents
Introduction ..................................................................................................................... 3 Background ................................................................................................................ 3 Definitions .................................................................................................................. 4 Detailed Scope........................................................................................................... 7 General Approach ...................................................................................................... 8
Executive Summary ...................................................................................................... 10 Occupational Diseases ............................................................................................ 10
Identified Diseases ............................................................................................. 10 Recommended Diseases for Consideration ....................................................... 11 Recommended as Excluded Diseases ............................................................... 13 Latency and Categorization of Diseases ............................................................ 13
Other Disease-Related Items ................................................................................... 17 Coverage of Occupational Diseases .................................................................. 17 NWISP/ICD9 ....................................................................................................... 17 Variance of Exposure by Industry ....................................................................... 18 Cost Ranking ...................................................................................................... 19
Miscellaneous Items ................................................................................................ 22 Health and Safety Improvements ....................................................................... 22 Changes to Exposure Levels .............................................................................. 22 Changes in Average Age and Other Demographics ........................................... 22 Improvements to Mortality .................................................................................. 23 Improvements to Disease Treatment .................................................................. 23
Reported Claims, IBNR, and the AEC ..................................................................... 24 Considerations ......................................................................................................... 27 The Relationship of IBNR to the AEC ...................................................................... 28 Date of Last Exposure and the Date of Loss ........................................................... 29 Methods of Calculation ............................................................................................ 29
Reported Claims ................................................................................................. 29 IBNR Using Aggregate Claim Methods .............................................................. 29 AEC .................................................................................................................... 30
Presentation and Discussion of Results ........................................................................ 31 Diseases Identified in the Study ............................................................................... 31
Understanding the Metrics .................................................................................. 31 Included Diseases .............................................................................................. 36 Excluded Diseases ............................................................................................. 43 Diseases with a Significant Report Lag .............................................................. 45
Other Disease-Related Items ................................................................................... 46

Occupational Disease Canadian Institute of Actuaries
Oliver Wyman Actuarial Consulting Table of Contents
Jurisdictional Differences .................................................................................... 46 Variance of Exposure by Industry ....................................................................... 46 Definition of Industry Groups .............................................................................. 47
Methodology and Discussion ........................................................................................ 51 Data ......................................................................................................................... 51 Database Form and Content .................................................................................... 53 Discussion of Individual Diseases ............................................................................ 61
Understanding the Metrics .................................................................................. 65 Matrix Analysis of Key Metrics ............................................................................ 66 Matrix Analysis by Disease Type and Industry Group ........................................ 67
Distribution and Use ...................................................................................................... 68
Appendix A: Acknowledgement of Qualification ............................................................ 69
Appendix B: Basic Metrics ............................................................................................. 70
Appendix C: Metrics Illustrating Latency ..................................................................... 119
Appendix D: Definition of Industry Groupings .............................................................. 126
Appendix E: Distribution of Claims by Disease Type and Industry Group ................... 143
Appendix F: Combined Metrics for Recommended Set of Diseases ........................... 147
Appendix G: Industry Group Distribution ..................................................................... 154
Appendix H: Summary of Metrics ................................................................................ 159
Appendix I: Standards of Practice – Public Personal Injury Compensation Plans ....... 164

Occupational Disease Canadian Institute of Actuaries
Oliver Wyman Actuarial Consulting
Page 3
Introduction Background The Canadian Institute of Actuaries (CIA) engaged Oliver Wyman Actuarial Consulting, Inc., to provide information on issues relating to the consideration and measurement of unpaid costs associated with occupational diseases generated by the cumulative physical effect of long-term exposure to repetitive activities or hazardous substances. The purpose of this assignment is to generate sufficient information and intellectual capital on occupational diseases to allow each individual workers’ compensation board (WCB) in Canada to make informed decisions as to: 1. Which occupational diseases generate claims of sufficient frequency and severity to warrant
investigation of potential costs of the disease in question;
2. Whether or not the expected cost of potential claims due to the cumulative physical effect of long-term exposure to repetitive activities or hazardous substances of currently active employees should be quantified and included as part of the liability for unpaid claim costs; and
3. What actuarial approaches to use to generate reasonable estimates of unpaid costs. Philosophies and approaches related to the items above likely vary among the individual WCBs. There is concern within the actuarial community in Canada, represented by the CIA, that sufficient information may not be currently available (or at least currently available in a single document) to the individual jurisdictions for the purpose of making informed decisions on these items. Ideally, the information presented in this report, with supporting data acquired by Oliver Wyman, will serve as the basis for decision-making that reflects the unique risk exposure, current practice, and general operating philosophy of each individual WCB in the context of common practice in the numerous jurisdictions within the U.S. as well as other parts of the world.

Occupational Disease Canadian Institute of Actuaries
Oliver Wyman Actuarial Consulting
Page 4
Definitions For the purpose of this report, the following definitions apply: Traumatic (Acute) Claims: Claims generated by traumatic injuries are due to specific incidents at specific points in time. Examples are amputations and fractures. Another example is claims due to bee stings suffered by beekeepers. Data acquired for this assignment classified the latter claims as “occupational disease” given that poisoning due to bee venom is an occupational hazard for beekeepers. Nevertheless, these claims (and claims generated under similar circumstances for other occupations) are due to specific incidents at specific points in time and are therefore traumatic claims for the purpose this report. Occupational Disease: Diseases generated by the cumulative physical effect of long-term exposure to repetitive activities or environmental hazards (generally referred to as “exposure to loss” in this report). Data acquired for this assignment suggests that long-term refers to a minimum exposure of at least five to 10 years, extending through decades. Examples of occupational diseases are cancer and carpal tunnel syndrome. In this sense, for the purpose of this report, the definition of occupational disease is strict and does not include injuries or conditions commonly referred to as occupational but which are caused by incidents at a specific point in time (see the above paragraph). Data suggests two general categories of occupational diseases: latent occupational diseases and non-latent occupational diseases. Latent Occupational Disease: Latent occupational diseases generally emerge at higher ages (50s and above), often after retirement, and are due to the cumulative effect of long-term exposure to environmental hazards over the working life of an individual. Data suggests that for latent occupational diseases, exposure occurs over the course of many decades. Examples include cancer, coal worker pneumoconiosis, asbestosis, and hearing loss. Data shows that latent occupational diseases generally emerge later in life, in some cases many years (often decades) after the last date of exposure to loss. Non-latent Occupational Disease: Non-latent occupational diseases emerge at lower ages (30s to 40s) and are due to the cumulative effect of long-term exposure to repetitive motion. Data suggests that for non-latent occupational diseases, exposure occurs over the course of five to 20 years. Examples include carpal tunnel syndrome and various inflammatory conditions of the muscular-skeletal system (bursitis, tendonitis). Non-latent occupational diseases generally emerge relatively quickly after the last date of exposure to loss, often while the employee is still working. Latency Period: Latency Period refers to the time required, from first exposure to loss, for a specific disease to manifest itself in an individual. The data acquired for this assignment does not have sufficient information to precisely measure latency periods. However, the data does imply (assuming employees generally start work at the same age) that latency periods for latent

Occupational Disease Canadian Institute of Actuaries
Oliver Wyman Actuarial Consulting
Page 5
occupational disease claims are materially longer, perhaps by decades, than non-latent occupational disease claims, because they emerge at much greater ages. Active Employee: Individuals currently employed in occupations that expose them to the underlying hazards that generate occupational disease claims. Inactive Employee: Individuals no longer exposed to underlying hazards that generate occupational disease claims. Inactive employees either have retired from the workforce or changed employment to occupations that no longer expose them to loss. Date of Loss: The date the injury generating a claim occurred. For a traumatic claim, the date of loss is the date the injury occurred, and is unambiguous. For an occupational disease claim, the date of loss is ambiguous given that occupational diseases are due to long-term exposure to repetitive motion or hazardous substances. In practice, as respects insurance contracts and the analysis of data for determining the financial responsibility for occupational disease claims1 and liability valuations, the most common definition is the last date of exposure to loss. For an inactive employee, the last date of exposure loss is the last date worked. For an active employee, the last date of exposure to loss is generally coincident with the date the employee filed a claim. For the purpose of this report, the date of loss is defined using this common definition. Reported Claim: This is a claim that has been filed with (reported to) the respective WCB. Inactive Employee: The date of loss of a reported claim is the last date worked. Active Employee: The date of loss of a reported claim is the date the employee files a claim,
which is assumed to be (and generally is) coincident with the last date of exposure to loss. Unreported Claim: An unreported claim has a defined date of loss, but has not yet been filed with (reported to) the respective WCB. Incurred but not reported claims (IBNR) is a common term for unreported claims. Inactive Employee: Inactive employees generate IBNR claims the date they leave the
workforce. The claims exist because exiting the workforce establishes a date of loss for any future claim due to the accumulated exposure to loss during the working life of the employee. For latent occupational disease claims, claims may remain unreported for decades, until the underlying disease manifests itself and the employee files a claim for benefits.
1 The WCBs in Canada function as monopolistic provincial agencies. Financial responsibility lies almost exclusively
with the respective WCBs. In most U.S. jurisdictions, as well as jurisdictions in other countries, workers’ compensation insurance is sold through a competitive marketplace and the date of loss, as respects the assignment of the financial responsibility of an occupational disease claim, is important when an employer has contracted with different insurance enterprises over time.

Occupational Disease Canadian Institute of Actuaries
Oliver Wyman Actuarial Consulting
Page 6
Active Employee: Using the definitions established for the purpose of this report,
unreported occupational disease claims do not exist for active employees because a date of loss, as defined earlier, does not exist until an active employee files a claim or leaves the workforce. Active employees therefore have an accumulated exposure to loss with an associated liability that reflects the expected cost of potential future claims. The liability associated with active employees is referred to as the Active Employee Component, or AEC.
Report Lag (or Lag): The time difference between the date of loss (as defined above) and the date of report. Report lag is an indicator (though not a precise measure) of the degree of latency associated with a specific occupational disease. Latent occupational diseases generally have much greater lag (years to decades) than non-latent occupational diseases (zero to several years). For example, cancer often manifests itself years after the last date of exposure to loss while employees report carpal tunnel syndrome claims generally while still working. The definitions above suggest that there are three distinct cost components of occupational disease claims: Reported Claim Costs: The expected cost of occupational disease claims that have been
reported to the respective WCBs/employers. Unreported (IBNR) Claim Costs: The expected cost of occupational disease claims that have
not been reported to the respective WCBs/employers. Unreported claim costs, or IBNR, are exclusively due to inactive employees.2
Active Employee Component (AEC): The expected cost of potential future claims due to the
cumulative exposure to loss associated with active employees.
2 In practice, IBNR does exist for active employees. However, the nature of active employee IBNR is
fundamentally different from IBNR due to terminated employees. IBNR for active employees is almost exclusively due to delays in recording the claim into databases used for the purpose of analysis. Report lags associated with these claims are extraordinarily small, ranging for days to months. These claims are commonly referred to as “pipeline” claims. Pipeline claims are fundamentally different from IBNR claims associated with terminated employees, where claims are reported years or decades after the last exposure to loss.

Occupational Disease Canadian Institute of Actuaries
Oliver Wyman Actuarial Consulting
Page 7
Detailed Scope Oliver Wyman was engaged to address the following items, subject to data availability: 1. Identify a superset of occupational disease claims provided for by insurance in Canada. 2. Identify a superset of cumulative trauma claims that potentially could be included in the
superset of occupational disease claims. 3. Identify occupational diseases currently classified as workers’ compensation claims in
jurisdictions outside of Canada and not currently classified as workers’ compensation claims in Canadian jurisdictions.
4. Recommend a set of occupational disease claims for which a liability potentially could be determined.
5. Identify the set of occupational disease claims using the NWISP/ICD9 coding system in Canada.
6. Recommend and discuss the following occupational disease periods for each disease in the
set identified in item 4 above: a. Minimum exposure period required to contract the disease b. Average latency period from start of exposure to disease emergence c. Variance of exposure by industry d. Minimum latency period required for qualification as a latent occupational disease. 7. Identify, rank, and discuss the cost of the occupational diseases identified in item 4 above.
8. Propose and discuss potential liability calculations.
9. Illustrate potential liability calculations.
10. Identify best practices in the U.S., Canada, and other countries.
11. The final report will be the result of a collaborative effort on the part of the CIA and Oliver
Wyman and will address the items listed previously as well as the following: a. Impact of health and safety improvements b. Changes to exposure levels over time c. Changes in average age and other demographics d. Improvements to mortality e. Improvements to disease treatment f. Approaches to calculated and allocated liabilities by industry g. Other considerations.

Occupational Disease Canadian Institute of Actuaries
Oliver Wyman Actuarial Consulting
Page 8
General Approach The most important element of this assignment was the acquisition and subsequent compilation, examination, and analysis of data. This portion of the assignment directly addresses items 1 through 7 of the scope, and provides required information and context to address items 8 through 11. The following is an outline of this process:
Data Acquisition Oliver Wyman and the CIA jointly approached a number of Canadian provinces to discuss the contribution of data to this assignment. Additionally, Oliver Wyman approached current clients and contacts within the U.S. The following entities contributed data to this assignment: The Alberta Workers’ Compensation Board The Workers’ Compensation Board of British Columbia (WorkSafeBC) A competitive state fund in the U.S. Two large U.S. ship manufacturing, repair, and servicing corporations.
Data Editing Oliver Wyman reviewed, sorted, and tested data from each source for structure, information content, and reasonability, and removed data with little or no informational value as well as data with irrational content. Information initially acquired consisted of over 400,000 claim entries. Of this data, approximately 150,000 claim entries were used.
Data Compilation The form and content of the final database evolved during the editing and compilation process. The approach was iterative, in the sense that the editing and compilation process gave context and background to data structure and differences in content from the various contributors. The format accommodated common available data from all sources. Additionally, the form and structure of the final database considered the need to ensure confidentiality of contributor data. The structure of the final database follows. There is a discussion of the individual data elements later in this report.
Age at Date of Loss Claim Cost at Current Level Secondary Disease/Injury Age at Claim Report Industry Group Source of Injury Gender Primary Disease/Injury Category Body Part 1 Report Lag Primary Disease/Injury Classification Body Part 2 Primary Disease/Injury
Data Analysis Data was examined throughout the editing and compilation process to determine the key metrics that would address the CIA’s needs (as described in the scope), as well as to determine the most efficient and informative way to present the selected metrics. Data volume and reasonability were key considerations.

Occupational Disease Canadian Institute of Actuaries
Oliver Wyman Actuarial Consulting
Page 9
Best Practices, Liability Calculations, and Other Issues Oliver Wyman investigated how other jurisdictions outside North America address the liability for latent diseases. Other aspects of items 8 through 11 of the scope were developed throughout the acquisition, editing, compilation, and analysis of data. Items 8 through 11 were addressed to the degree permitted by available data.

Occupational Disease Canadian Institute of Actuaries
Oliver Wyman Actuarial Consulting
Page 10
Executive Summary Occupational Diseases Identified Diseases3 The study identified the following as potential occupational diseases, as defined previously for the purpose of this report. CANCER-RELATED CLAIMS MESOTHELIOMA LUNG CANCER ALL OTHER CANCER RESPIRATORY-RELATED CLAIMS OBSTRUCTIVE RESPIRATORY DISEASE PNEUMOCONIOSIS (EXCLUDING ASBESTOSIS) ASBESTOSIS ALL OTHER RESPIRATORY HEARING LOSS INFECTION EYE CONDITIONS MENTAL STRESS PHYSICAL STRESS REACTION TO A FOREIGN SUBSTANCE VASCULAR CUMULATIVE TRAUMA CLAIMS BURSITIS EPICONDYLITIS TENDONITIS TENOSYNOVITIS OTHER INFLAMMATION SPRAIN/STRAIN/TEAR HERNIA OTHER CUMULATIVE TRAUMA
CARPAL TUNNEL SYNDROME CUMULATIVE NERVE DISEASE
These diseases are potentially due to the cumulative effect of long-term exposure to loss. The following are important considerations underlying this list: 3 There is a detailed discussion of each disease in the Methodology and Discussion section of this report.

Occupational Disease Canadian Institute of Actuaries
Oliver Wyman Actuarial Consulting
Page 11
1. The list includes diseases defined as occupational disease in the underlying data. However, identification as an occupational disease in the underlying data does not necessarily mean that the disease or condition is due to the cumulative effect of long-term exposure to loss, the definition of occupational disease for the purpose of this report. Additional investigation demonstrated that certain conditions on this list are generally due to singular events and are therefore traumatic, not occupational disease, claims. A simple example is infection. The majority of these claims are due to hepatitis, with some tuberculosis claims. All of these claims are generally traceable to a specific incident exposing the employee to infection. Additionally, employees generally report these claims very quickly after the exposure incident. So while properly classified as occupational disease, this group of claims is not due to either repetitive motion or long-term exposure to hazardous substances. As such, while included in the initial list, the recommendation (later in this report) is to exclude this specific group of claims from consideration.
2. The absence of a specific disease on this list means that the specific disease is more likely
due to a specific incident at a specific point in time, rather than the cumulative exposure to repetitive motion or hazardous substances. In the simplest case, a claim due to a torn rotator cuff associated with a trip or fall would not be included. On the other hand, a claim identified as a shoulder sprain due to driving as an occupation would be included.
Recommended Diseases for Consideration Oliver Wyman recommends that the following diseases be included in the group of occupational diseases for which there is a significant loss component, either as potential costs due to the cumulative exposure to loss associated with active employees, or due to unreported costs associated with inactive employees. These diseases represent the starting point for any additional investigation by the individual WCBs. Ultimately, each individual WCB is responsible for the decision as to which specific diseases to consider. The following diseases are termed the “recommended set of diseases” for the remaining portion of this report: MESOTHELIOMA/ASBESTOSIS/LUNG CANCER ALL OTHER CANCER HEARING LOSS PNEUMOCONIOSIS (EXCLUDING ASBESTOSIS) OBSTRUCTIVE RESPIRATORY DISEASES (combined with All Other Respiratory) CUMULATIVE TRAUMA CLAIMS COMBINED (excluding Carpal Tunnel Syndrome) CARPAL TUNNEL SYNDROME This list is a recommendation based on Oliver Wyman’s examination of underlying data as well as research into the nature of specific diseases. Detailed data and metrics for all diseases are included in this report in Appendix B so that individual jurisdictions may independently assess the need to consider other diseases, or exclude diseases in the list above.

Occupational Disease Canadian Institute of Actuaries
Oliver Wyman Actuarial Consulting
Page 12
For the purpose of future analysis, the recommendation is to combine Mesothelioma, Asbestosis, and Lung Cancer into a single category. This is due to the similarity of key metrics for each of these individual diseases. All Other Cancer, Hearing Loss, and Pneumoconiosis (excluding Asbestosis) are single categories due to either data volume and/or uniqueness of underlying metrics. Metrics and distributions generated by data from pneumoconiosis (excluding asbestosis) were not consistent, as respects latency and age at emergence, with coal workers’ pneumoconiosis data from the U.S. Department of Labor database. Closer examination of the underlying data showed that the observed differences were due to 40 byssinosis4 claims included in this data. A detailed discussion of this and other concerns with data for this disease appears later in this report. For the purposes of this report, Oliver Wyman based key metrics as respects age at emergence and latency for pneumoconiosis on coal workers’ pneumoconiosis data from the U.S. Department of Labor. Oliver Wyman combined obstructive respiratory disease and all other respiratory disease into a single category for the purpose of analysis, given similarities in underlying metrics and distributions. The recommendation to include this combined category in the recommended set of diseases is contingent on excluding claims with relatively low report lag. An analysis of underlying claim data demonstrated there are likely two groups of fundamentally different claims in the combined category, best defined as claims with lag less than two years and claims with lag greater than two years.5 The first group, with lag less than two years, is composed of relatively low-cost claims with very low average lag that emerge at relatively low ages. The second group, with lag greater than two years, is composed of relatively high-cost claims with higher average lag that emerge at relatively high ages. Discussions with data sources indicated that lower-cost claims emerging at lower ages with minimal lag are likely due to respiratory conditions generated by short-term acute exposure to hazardous substances. These claims are more properly defined as traumatic claims, rather than latent occupational disease claims. Higher-cost claims emerging at higher ages with significant lag are likely due to longer-term exposure to hazardous substances resulting in respiratory diseases that emerge later in life. Examination of claim detail supports this interpretation. A detailed discussion of this disease appears later in this report. Oliver Wyman combined cumulative trauma claims into a single category, with the exception of carpal tunnel syndrome claims, due to almost identical underlying key metrics. Carpal tunnel syndrome claims are treated separately only because of the volume of claims and general interest in this specific disease. 4 Byssinosis is commonly referred to as brown lung disease and is caused by the inhalation of cotton fibres over
time. 5 Data indicated that a two-year report lag was a logical point to partition the data. Oliver Wyman provided
underlying data to the CIA. The CIA has the option of examining this data and selecting a different point to partition the data.

Occupational Disease Canadian Institute of Actuaries
Oliver Wyman Actuarial Consulting
Page 13
Recommended as Excluded Diseases The following diseases are not included in the recommended set of diseases due to low incidence, low cost, or claim characteristics that indicate a traumatic source of injury.
INFECTION EYE CONDITION ALL MENTAL STRESS PHYSICAL STRESS REACTION TO A FOREIGN SUBSTANCE VASCULAR CUMULATIVE NERVE DISEASE
There is a detailed discussion of the underlying reasons for excluding the above diseases later in this report. However, a brief note regarding cumulative nerve disease is warranted at this time. There are approximately 1,400 claims in this category, of which over 900 are in the Vessel Operation industry group. The large number of claims in this industry group is an artifact of the underlying data sources, of which two were U.S. shipbuilding firms. It is likely not useful to consider this disease group in general. However, for shipbuilding and possibly related occupations, cumulative nerve disease could reasonably be included in the recommended group of diseases. Ultimately, the decision regarding the treatment of this disease category is the responsibility of the individual jurisdictions. Latency and Categorization of Diseases Analysis of underlying data suggests using the profiles of diseases such as mesothelioma, asbestosis, and lung cancer to establish key characteristics representative of latent occupational diseases is a preferred approach, as opposed to defining benchmarks based on point values of certain metrics. Specifically, the profile of age at claim report (disease emergence) and the profile of report lag are used to establish key characteristics of latent occupational diseases6. 6 The primary reason why latent diseases emerge at later ages, well into retirement, is relatively long latency
periods, as compared to non-latent (repetitive motion) claims. This is the same reason why there is significant report lag with latent diseases. Correlation between report lag and age at emergence therefore exists, given that long latency periods is the primary causative factor for both observations. Therefore it is, to a degree, redundant to use both metrics to categorize a disease as latent or non-latent, given that both metrics have the same primary causative factor. However, another possible outcome would have been latency periods long enough to increase the age at emergence of latent diseases to a value high enough to distinguish them from non-latent diseases, but still low enough to allow the majority of claims due to latent diseases to emerge while employees were still active, resulting in low report lag. In this case, report lag would have been similar for both groups and age at emergence would have been the only differentiator between latent and non-latent diseases. Though this is clearly not the case, Oliver Wyman had no preconceived notion as to what the results of data analysis would show, and selected report lag and age at emergence as benchmark measures of latency at the start of the study.

Occupational Disease Canadian Institute of Actuaries
Oliver Wyman Actuarial Consulting
Page 14
1. The age profile at claim report for mesothelioma, asbestosis, and lung cancer demonstrates claim emergence in older individuals:
95% of claims are reported at ages greater than the mid-40s to the early 50s: Mesothelioma: 51 (for example, 95% of claims are reported after age 51) Asbestosis: 43 Lung Cancer: 45 The mean age at report is at or near the expected end of working life: Mesothelioma: 68 Asbestosis: 64 Lung Cancer: 66 5% of claims are reported at ages significantly past expected career end: Mesothelioma: 83 (for example, 5% of claims are reported after age 83) Asbestosis: 81 Lung Cancer: 81
2. The lag profile at claim report demonstrates significant latency, in the sense that the
diseases emerge years after the last date of exposure to loss:
Average Lag Measured in Years All Claims Top 90% Top 10% Mesothelioma: 1.7 1.9 13.0 Asbestosis: 3.9 4.4 24.7 Lung Cancer: 8.3 9.3 26.3 Top 90% refers to the average lag excluding 10% of total claims having the lowest lag. Top 10% refers to the average lag excluding 90% of total claims having the lowest lag.
Therefore, latent occupational disease claims exhibit a high age of disease emergence relative to expected retirement date as well as a significant amount of time between the last date of exposure to loss and the date of claim report. To cement these concepts, consider a comparison to the metrics identified above for the three benchmark latent diseases combined and all cumulative trauma claims combined:

Occupational Disease Canadian Institute of Actuaries
Oliver Wyman Actuarial Consulting
Page 15
Age Profile 5% Level Mean 95% Level Meso/Asbes/Cancer 45 65 82 Cumulative Trauma 23 42 59
Lag Profile Excluding Excluding Mean 10% Lowest 90% Lowest Meso/Asbes/Cancer 3.6 4.0 22.8 Cumulative Trauma 0.2 0.2 1.6 Cumulative trauma claims are reported at relatively low ages during active employment, with little or no time passage between last date of exposure to loss and the date of claim report (disease emergence). Latent disease claims are reported at relatively high ages extending well past expected retirement with material lag between the last date of exposure to loss and claim report (disease emergence). The highest lag for latent disease claims has values in decades. The scope suggests establishment of a minimum level of latency that would assist in liability calculations. Latency period, as defined in this report, is the time interval from the first exposure to loss to the age at disease emergence. Data acquired for this study is robust as respects age at disease emergence (assumed equal to age at claim report). However, information regarding first exposure to loss is simply not available. Nevertheless, an assumption that all individuals began working at a specific age, such as 20, combined with data gathered for this study, will allow an assessment of minimum latency periods. For example, one definition of minimum latency might be the time from age 20, the assumed age at which employment (and therefore exposure to loss) began, to the age at which 5% of all claims due to a specific disease are reported. Oliver Wyman provided this data to the CIA. Appendix C provides detailed metrics used for the analysis of latency for all diseases. Given this discussion, the recommended set of diseases is (as listed previously): Latent Occupational Diseases MESOTHELIOMA/ASBESTOSIS/LUNG CANCER ALL OTHER CANCER HEARING LOSS PNEUMOCONIOSIS (EXCLUDING ASBESTOSIS) OBSTRUCTIVE RESPIRATORY DISEASES (combined with All Other Respiratory) Non-latent Occupational Diseases (Cumulative Trauma Diseases) CUMULATIVE TRAUMA CLAIMS COMBINED (excluding Carpal Tunnel Syndrome) CARPAL TUNNEL SYNDROME Excluded diseases generally appear to be non-latent diseases in the context of the above discussion. There does not appear to be any question regarding the following:

Occupational Disease Canadian Institute of Actuaries
Oliver Wyman Actuarial Consulting
Page 16
INFECTION MENTAL STRESS REACTION TO A FOREIGN SUBSTANCE VASCULAR
However, the lag for the remaining diseases listed below tends to be somewhat higher than other non-latent diseases, as does the age at claim report for physical stress. Nevertheless, the age and lag profiles for these diseases are closer to non-latent diseases. Note that metrics for eye-related claims are highly variable due to low data volume.
EYE CONDITION ALL PHYSICAL STRESS CUMULATIVE NERVE DISEASE

Occupational Disease Canadian Institute of Actuaries
Oliver Wyman Actuarial Consulting
Page 17
Other Disease-Related Items Coverage of Occupational Diseases Coverage of occupational disease varies between jurisdictions. The data collected for this assignment is primarily from two jurisdictions (provinces) in Canada, and four jurisdictions in the U.S. (three states and one federal jurisdiction). The 2013 Analysis of Workers’ Compensation Laws, published annually by the U.S. Chamber of Commerce, provides a detailed description of the coverage of occupational disease claims for all jurisdictions in the U.S. and Canada. Chart IV provides a description of occupational disease coverage. Chart V discusses hearing loss specifically. Copies of the 2013 edition of this publication have been provided with the final version of this report as a courtesy to the CIA. New editions are available shortly after they are published for a nominal cost (US$68) from the U.S. Chamber of Commerce7. NWISP/ICD9 Jurisdictions outside of Canada provided the majority of the underlying claims data for this study. Additionally, the Canadian data acquired did not have precise mapping information.
7 www.uschamber.com/bookstore, or 1-800-638-6582.

Occupational Disease Canadian Institute of Actuaries
Oliver Wyman Actuarial Consulting
Page 18
Variance of Exposure by Industry Oliver Wyman defined the following industry groups for the purpose of this report:
AGRICULTURE/FARMING/AQUACULTURE AIRCRAFT OPERATION, SERVICE, MANUFACTURING, OR REPAIR ANIMAL CARE, TRAINING, BREEDING, BOARDING AUTOMOBILE SALES, SERVICE, MANUFACTURING, OR REPAIR BUILDING MAINTENANCE AND OPERATIONS CLERICAL CONSTRUCTION CONTRACTING EDUCATION AND RELIGIOUS INSTITUTIONS FIREFIGHTER FOOD MANUFACTURING FOOD SERVICE GENERAL SERVICES GOVERNMENT HEALTH CARE SERVICES HOSPITALITY AND ENTERTAINMENT LANDSCAPING LIVESTOCK AND POULTRY FARMING LOGGING AND TREE SERVICE MANUFACTURING GENERAL MARINE TERMINAL OPERATION MOTOR VEHICLE OPERATION OTHER THAN TRUCKING NATURAL RESOURCE EXTRACTION, REFINING, STORAGE, TRANSPORT POLICE OFFICERS RETAIL SERVICES SOCIAL SERVICES TELECOMMUNICATION AND BROADCASTING TRUCKING UNKNOWN UTILITY PRODUCTION, DISTRIBUTION, MAINTENANCE VEHICLE OTHER THAN AUTOMOBILE SALES, SERVICE, MANUFACTURING, OR REPAIR VESSEL OPERATION, SERVICE, MANUFACTURING, OR REPAIR WHOLESALE AND RETAIL GENERAL
Appendix D provides a detailed (but not complete list) of classifications by industry group. Appendix E provides charts detailing claim incidence by disease by industry group for the recommended set of diseases. Note that the measurement of incidence of diseases within each industry group is not biased. However, the distribution of incidence of a single disease by industry group is likely biased due to over- or under-representation of different industry groups within the source data. This is especially applicable to Vessel Operation due to the use of data from two large U.S. shipbuilding firms.

Occupational Disease Canadian Institute of Actuaries
Oliver Wyman Actuarial Consulting
Page 19
Cost Ranking To present a formal cost ranking, the calculated average claim cost for each disease excluded claims with a cost less than 10% of the raw mean, and excluded the cost of the five largest claims. This approach eliminates the impact of a large number of low- or zero-cost claims in some disease categories, and eliminates the potential distortion of extraordinarily large claims. All claim costs represent historical claim cost data8,9 adjusted from the date of loss to December 31, 2012, using 3% annual trends for expenses and wage replacement benefits, and a 5% annual trend for medical benefits. Combined data10 from U.S. and Canadian sources, without adjustment for current or historical exchange rates between currencies, underlies the cost ranking analysis. The summary for each disease, and each recommended disease grouping, is on the following page. Cost metrics by disease and disease combinations are in Appendix B (individual disease), Appendix F (combined metrics for recommended diseases combinations), and Appendix H (summary). The average claim cost results presented on the following page are reasonable in the context of the underlying diseases and relativities. The cost of pneumoconiosis, asbestosis, mesothelioma, obstructive respiratory, hearing loss, and carpal tunnel syndrome claims are consistent with Oliver Wyman’s experience examining these claims on behalf of clients in the U.S. Note the similarity of cost between obstructive respiratory disease and claims in the All Other Respiratory Disease category. The observed similarity of cost and other metrics was part of the basis for combining these categories. Additionally, observe that the cumulative trauma claims have costs between $25,000 and $40,000, with the exception of hernia injuries. Based on information provided by claims professionals, hernias are generally easily repaired tears in body tissue. Carpal tunnel syndrome and other cumulative trauma injuries generally require more complex medical treatment for longer time intervals than hernia injuries.
8 Claim costs include the cost of medical, wage replacement, and any other benefit (such as survivorship benefits and lump
sum compensation settlements for injuries) provided for in the jurisdiction in which the employee filed the claim. Claim adjustment expense, defence costs, and any other expenses associated with claims administration are not included.
9 The cost of a closed claim is the total paid cost of the claim at the time Oliver Wyman acquired the data. The cost of open claims is the total paid cost plus case reserves. Case reserves are best estimates of expected future claim costs established by claim adjustment professionals. Case reserves for workers’ compensation claims almost always prove to be too low when compared to the final cost of claims, when closed. This is primarily due to the unpredictability of medical costs associated with individual workers’ compensation claims. Actuaries will include a provision for case reserve inadequacy in estimates of unpaid costs. For the purpose of this study, the impact of this issue is not material because the majority of claims in the underlying data are closed.
10 Oliver Wyman did not attempt to examine differences between claim cost data from U.S. sources and Canadian sources, nor were differences between jurisdictions within each country considered. Such an examination would have required consideration of exchange rates, income replacement benefits by jurisdiction and injury type, and other items unique to each jurisdiction and claim type. Notwithstanding feasibility, it is questionable as to what value, if any, such an exercise would have added to the conclusions of this study. As such, Oliver Wyman made a decision at the start of the analysis of data to simply combine data without consideration of exchange rates and jurisdictional differences. This decision is justified by the results of the cost analysis, which are consistent with Oliver Wyman experience with workers’ compensation claim costs at current cost levels.

Occupational Disease Canadian Institute of Actuaries
Oliver Wyman Actuarial Consulting
Page 20
The higher cost of physical stress claims is reasonable given that almost all of these claims involve heart disease, primarily heart attacks occurring while performing job functions. Medical treatment and long-term disability payments are the primary contributors to the high cost of these claims. Of the recommended set of diseases, the following are of relatively low frequency with higher average cost. This set includes all diseases categorized as latent, except hearing loss, and excludes all diseases categorized as non-latent: MESOTHELIOMA/ASBESTOSIS/LUNG CANCER ALL OTHER CANCER PNEUMOCONIOSIS (EXCLUDING ASBESTOSIS) OBSTRUCTIVE/ALL OTHER RESPIRATORY DISEASES Of the recommended set of diseases, the following are of relatively high frequency with lower average cost. This set includes all diseases categorized as non-latent, as well as hearing loss. Hearing loss is the only disease categorized as latent with high-frequency, low-cost claims: CUMULATIVE TRAUMA CLAIMS COMBINED (excluding Carpal Tunnel Syndrome) CARPAL TUNNEL SYNDROME HEARING LOSS

Occupational Disease Canadian Institute of Actuaries
Oliver Wyman Actuarial Consulting
Page 21
INDIVIDUAL RECOMMENDEDDISEASES COMBINATIONS
MESOTHELIOMA 307,663ASBESTOSIS 267,089
LUNG CANCER 294,929
OBSTRUCTIVE RESPIRATORY 176,181ALL OTHER RESPIRATORY 168,024
ALL OTHER CANCER 287,330 287,330
PNEUMOCONIOSIS EXCEPT ASBESTOSIS 294,103 294,103
HEARING LOSS 14,100 14,100
BURSITIS 34,742EPICONDYLITIS 27,305
TENDONITIS 27,613TENOSYNOVITIS 24,209
OTHER INFLAMMATION 30,381SPRAIN / STRAIN / TEAR 39,014
HERNIA 17,693ALL OTHER CUMULATIVE TRAUMA 32,761
CARPAL TUNNEL SYNDROME 32,158 32,158
EXCLUDED DISEASESINFECTION 17,633 17,633
MENTAL STRESS 34,089 34,089PHYSICAL STRESS 241,072 241,072
NERVE DISEASE 79,758 79,758EYE CONDITION 3,869 3,869
REACTION TO FOREIGN SUBSTANCE 59,682 59,682VASCULAR 49,161 49,161
174,717
34,092
293,246

Occupational Disease Canadian Institute of Actuaries
Oliver Wyman Actuarial Consulting
Page 22
Miscellaneous Items Health and Safety Improvements Data was not available to quantify the impact of health and safety improvements on occupational disease frequency. If such data were available, measurements of frequency per employee-year worked for employees exposed to loss, by year of claim report, would be used to test correlation with implementation of health and safety improvements. The impact of statutory and regulatory changes on disease frequency is an important consideration that illustrates the difference between physical disease and legal disease. Changes to statutes and regulations governing the adjudication of occupational disease claims in a specific jurisdiction will affect the observed frequency of claims. In the U.S., changes to the Federal Black Lung Benefits Act implemented in 2010 materially decreased the legal challenges to successfully securing benefits under the act. The effect was a surge in claim filings and a subsequent surge in benefit awards. Some publications in the U.S. used this data as evidence of a surge in black lung disease, which was not the case as respects the physical disease, but which was the case with the legal disease. Additionally, over time various jurisdictions have enacted statutory and regulatory rules to differentiate the emergence of certain occupational diseases from diseases associated with ordinary life and/or aging. These changes will also affect measurements of occupational disease frequency. Changes to Exposure Levels Exposure is the annual number of employee-years worked with exposure to loss that generates occupational disease claims. Data was not available to quantify this item. However, in the U.S. long-term employment data by industry is generally available from the Department of Labor, Bureau of Labor Statistics. Using this data, analysts might identify general trends with respect to both employment responsible for latent occupational disease claims, and employment responsible for cumulative trauma claims. Changes in Average Age and Other Demographics Oliver Wyman did not research underlying demographics or changes to those demographics by province. Information regarding the age distribution, as well as gender distribution, of an active employee population can be gleaned from the general population, though it may be questionable as to whether it is appropriate to impute that distribution to specific industries. A material concern would be that high growth or new industries are likely populated by younger individuals, while mature or contracting industries are likely populated by higher-age

Occupational Disease Canadian Institute of Actuaries
Oliver Wyman Actuarial Consulting
Page 23
individuals. The actual age distribution of a specific employer, or industry, would be useful in forecasting the timing of occupational disease claim reports using the results of this study. Improvements to Mortality Improvement to mortality of the general population is a material concern as respects workers’ compensation claims. For valuation purposes, this author uses information published by the Social Security Administration of the U.S. to reflect expected improvements to mortality over time. This information is useful for valuing lifetime benefits for claimants without material medical impairments and for general adjustments to other actuarial parameters used for valuing unpaid workers’ compensation claim costs. The necessity for this type of valuation will vary with the jurisdiction. For individual claimants or groups of claimants with medical conditions that impact life expectancy, information from individual claim records is used to adjust life expectancy using rated age approaches (approaches where ages are increased to reflect greater-than-typical mortality). Improvements to Disease Treatment Improvement to disease treatment is a material issue as respects latent disease claims because of the additional costs inherent with improving treatment. An example is mesothelioma. Ten years ago, survival beyond 12 to 24 months after diagnosis was not expected and claim costs were composed of essentially a survivorship pension and end of life medical care. Since that time, improvements in treatment have extended survival times to five years, or more. However, treatment costs are extraordinarily expensive. This author is currently conducting research to determine the impact of changes in treatment for paraplegic and quadriplegic injuries. To date, information gathered suggests that long-term life expectancies, which are somewhat lower than general population life expectancies, are unchanged. However, the portion of individuals with these severe injuries that survive the first three years after injury has increased materially over the past 30 years. Currently, this author does not make direct adjustments to actuarial parameters for this contingency.

Occupational Disease Canadian Institute of Actuaries
Oliver Wyman Actuarial Consulting
Page 24
Reported Claims, IBNR, and the AEC The underlying exposure to loss associated with occupational disease claims is the accumulated exposure to hazardous substances (latent diseases) or repetitive motion (non-latent diseases) that ultimately results in workers’ compensation claims. There are three fundamental questions associated with this exposure to loss: 1) What is the expected cost of claims that have occurred, and how is it determined? 2) What is the expected cost of claims that have not yet occurred, and how is it determined? 3) What elements of expected cost should be recorded as a liability valuation? That is, should
the liability valuation include only the expected cost of claims that have occurred, or both the expected cost of claims that have occurred and of claims that have not yet occurred?
As respects traumatic claims, the response to these questions is straightforward: 1) For the purpose of a liability valuation, the expected cost of traumatic claims that have
occurred is quantified through actuarial analysis of historical loss data and includes provisions for claims that have been reported as well as claims that have not yet been reported, but for which the incidents have occurred (IBNR). Claims due to traumatic injuries are generally close to 100% reported within a year of the date of occurrence. The IBNR component due to traumatic claims is non-zero, but generally small, and is included in the calculated liability.
2) For the purpose of a liability valuation, the expected cost of traumatic claims that have not
yet occurred is zero. There is no underlying accumulated exposure to loss associated with traumatic incidents.
3) The full cost of claims that have occurred (both reported claims and IBNR claims) must be
recorded as a liability. As noted above, the expected cost of claims that have not yet occurred is zero.
The response for occupational disease claims is significantly more complex. 1) For the purpose of a liability calculation, the expected cost of occupational disease claims
that have occurred is quantified through actuarial analysis of historical loss data and includes provisions for claims that have been reported as well as IBNR claims. Using the definitions presented at the beginning of this report, IBNR occupational disease claims are claims where the underlying disease has not yet manifested itself, but for which the last date of exposure to loss has passed. This means that by definition, the only source of IBNR claims are inactive employees, that is, individuals no longer exposed to underlying hazards that generate occupational disease claims. Inactive employees have either retired from the

Occupational Disease Canadian Institute of Actuaries
Oliver Wyman Actuarial Consulting
Page 25
workforce or changed employment to occupations that no longer expose them to underlying hazards that generate occupational disease claims. Latent occupational disease claims have significant IBNR components, given the relatively high ages at which these diseases manifest themselves and the high report lag associated with these claims. Non-latent occupational disease claims have an IBNR component greater than a typical traumatic claim, but materially lower than a latent disease claim given that these diseases manifest themselves at much younger ages with much lower associated report lag.
2) There is an expected cost associated with the potential for latent occupational disease and
cumulative trauma claims due to accumulated exposure to loss during an active employee’s working career. If the active employee has not filed a claim, the claim has not occurred and therefore does not exist. The expected cost of potential claims associated with active employees is the Active Employee Component, or AEC. The AEC will grow as exposure continues to accumulate for active employees. If the active employee develops a disease while working, the AEC attributable to that specific employee transforms immediately into a reported claim with an associated cost. If the active employee becomes inactive (that is, either retires from the workforce or changes employment to an occupation that no longer exposes the employee to loss), the AEC transforms immediately into IBNR, with an associated cost.
3) The full cost of occupational disease claims that have occurred (both reported claims and
IBNR claims) must be recorded as a liability. This is no different from the treatment of costs due to traumatic claims, with the exception that occupational disease claims have a materially greater IBNR component than traumatic claims. However, unlike traumatic claims, a material AEC cost exists for occupational disease claims. The question is whether an entity should quantify and record the AEC as a liability. In the U.S., the answer to this question depends on the accounting standard underlying the basis for the accrual:
- Financial Accounting Standard (FAS) 5, Contingencies Under FAS 5, liability valuations provide for losses that are reasonably estimable and
relate to the current or prior period. The term “relate to the current or prior period” is the key element of this standard. Liability valuations should provide for losses associated with events (claims) in the current and past periods. This would exclude the AEC since, by definition, a claim has not occurred (though at least a portion of the exposure to loss that will ultimately generate claims has occurred with each active employee).
- FAS 106, Accounting for Postretirement Benefits Other than Pensions Under FAS 106, workers’ compensation programs are treated as a post-retirement benefit
in a manner similar to retiree health plans. Liability valuations provide for losses associated with claims that have occurred as well as the expected cost due to potential future claims associated with active employees.
Almost all of Oliver Wyman’s clients in the U.S. treat liability valuations for workers’ compensation claims under FAS 5 and do not provide for the AEC. Notably, this includes the

Occupational Disease Canadian Institute of Actuaries
Oliver Wyman Actuarial Consulting
Page 26
two ship manufacturing firms that contributed data for this study. Both of these firms have a substantial AEC associated with potential future claims due to the accumulated exposure to hazardous substances and repetitive motion associated with their active employee workforce. Oliver Wyman has had numerous discussions with one of these firms regarding the magnitude of the AEC and whether or not the AEC should be quantified, even if it is not recorded as a liability. Rough estimates by Oliver Wyman for this client demonstrated that the AEC is on the order of 20% to 40% of the entity’s total liability for reported and unreported claims (occupational disease and traumatic).11 A small number of Oliver Wyman clients, several large coal mining operators, treat traumatic workers’ compensation injuries as a FAS 5 balance sheet item, but treat black lung claims filed under the Federal Coal Mine Health and Safety Act as a post-retirement benefit plan. These entities record liabilities for both current claims as well as the expected cost of potential claims associated with the active employee workforce. The reasons for this treatment are not clear, but appear to have evolved during the 1970s after enactment of the United States Federal Coal Mine Health and Safety Act. All of these operators are large and self-insure all of their workers’ compensation exposures. Oliver Wyman is aware of one coal operator that is currently insured (through a large deductible insurance program) that was forced, this year, by its current auditor to establish a liability for the AEC under FAS 106. Finally, Oliver Wyman is aware of only one other situation in the U.S. where the expected cost of potential workers’ compensation claims associated with active employees is considered. This is in the state of Nevada, regarding presumptive benefit statutes. These statutes state that there is a presumption that public safety officers (police, firefighters, corrections officials, sheriffs, emergency medical personnel, etc.) who develop heart disease, lung disease, hepatitis, or various cancers and have worked a minimum number of years developed these diseases due to employment and are therefore entitled to workers’ compensation benefits. The presumption is generally non-rebuttable (conclusive), but may be rebuttable depending on the specific disease or whether a specific employee has worked the required number of years defined by statute. In practice, case law supports the presumption as conclusive. The impact is essentially an extraordinarily large unfunded liability for municipalities in Nevada. The concern of the magnitude of this liability as well as questions of how to fund it led Nevada to publish regulations requiring municipalities to estimate the cost of both claims that have occurred
11 The large size of the AEC is due to high age of the current active workforce (average age in the early 50s) and
therefore the large accumulated exposure to loss for the active employee population. Additionally, many of this client’s employees (those in the upper half of the age distribution) began their working careers during the late 1960s through to the late 1970s, prior to full implementation of U.S. federal and/or individual state statutes and regulations governing exposure to hazardous substances such as asbestos. Consequently, these employees have a material accumulated exposure to loss expected to generate latent occupational disease claims as these individuals age. Current latent occupational disease claim emergence from this population of employees is as expected, based on the results of this study.
Occupational Disease Canadian Institute of Actuaries
Oliver Wyman Actuarial Consulting
Page 27
(reported and IBNR) as well as the AEC. However, while municipalities must record the unpaid cost of reported and IBNR claims (as per GAAP), the regulation does not require municipalities to record a liability valuation for the AEC. Oliver Wyman is aware of only one municipality that records the AEC as a liability valuation (City of Las Vegas). Discussions with jurisdictions in other parts of the world (Europe and Australia) indicate that liability valuations for workers’ compensation claims generally follow the FAS 5 approach, where the loss exists only if the claim has occurred. That is, jurisdictions in other parts of the world record liabilities for reported claims and IBNR, as defined earlier in this report, but do not record a liability for the AEC. Oliver Wyman is not an expert in auditing matters. Conversations with clients, auditing firms, and other actuaries as well as independent investigation forms the basis of information presented in this report. Oliver Wyman believes the basic information as to the applicable standards described to be correct. However, Oliver Wyman is not qualified to offer a formal opinion on these matters. Considerations
Current actuarial standards of practice in Canada require that the AEC be included as part of the liability for future claim costs. There is potential benefit to knowing the specific value of the AEC, as opposed to determining a total value for future claim costs that includes, but does not specifically quantify, the AEC component. As noted earlier, the AEC may be significant. Additionally, the AEC transforms into IBNR upon employee termination. Sudden changes in economic conditions that lead to significant workforce reductions will cause a measurable portion of the AEC (the portion associated with terminated employees) to transform immediately into IBNR, or actual claims.

Occupational Disease Canadian Institute of Actuaries
Oliver Wyman Actuarial Consulting
Page 28
The Relationship of IBNR to the AEC This following example illustrates how the AEC accumulates over time and transforms into reported claim cost if an employee files a claim during active employment. In this example, IBNR does not materialize. Active Coal Miner Hired 06/30/1980 Claim Filed 06/30/1990
Liability Valuation Measurement Dates from 6/30/1980 through 6/29/1990 IBNR: IBNR associated with an active employee will always be zero. AEC: The AEC will continuously grow in value through 6/29/1990 due to the
accumulation of exposure to coal dust.
Liability Valuation Measurement Dates on or after 6/30/1990 IBNR: IBNR associated with an active employee will always be zero. AEC: On 6/30/1990 the AEC becomes zero and is replaced with the expected cost of
the filed claim. The following example demonstrates the migration of cost from the AEC, which represents the potential cost of claims due to accumulating exposure to loss in active employees, to IBNR upon termination, to the actual cost associated with a filed claim. If the employee never files a claim, the IBNR will taper down to zero as the employee ages, and equal zero upon death. Inactive Coal Miner Hired 06/30/1980 Terminated 06/30/2005 Claim Filed 06/30/2015
Liability Valuation Measurement Dates from 6/30/1980 through 6/29/2005 IBNR: IBNR associated with an active employee is always zero. AEC: The AEC will continuously grow in value through 6/29/2005 due to the
accumulation of exposure to coal dust.
Liability Valuation Measurement Dates from 6/30/2005 through 6/29/2015 IBNR: IBNR associated with this employee will change from zero to an actuarially
determined value on 6/30/2005, the date of termination. AEC: On 6/30/2005, the AEC becomes zero and is replaced with IBNR.
Liability Valuation Measurement Dates on or after 6/30/2015 IBNR: IBNR associated with this employee becomes zero the day this employee files a
claim. AEC: The AEC is zero as this is no longer an active employee.

Occupational Disease Canadian Institute of Actuaries
Oliver Wyman Actuarial Consulting
Page 29
Date of Last Exposure and the Date of Loss This report defines date of loss as the last date of exposure to loss. For inactive employees, this is generally the last date worked. For active employees, it is generally the date of claim filing. In most U.S. jurisdictions (and other jurisdictions with competitive markets) the date of loss is necessary to place the financial responsibility for a specific claim. In Canada, where the WCBs are essentially the only markets for workers’ compensation insurance, the date of loss is necessary for the purpose of analysis to determine the point in time when the AEC (the cost of potential claims from active employees) transforms into IBNR. In Canada, the date of loss, as defined in this report, can serve as the basis of allocating the financial impact of the cost of claims to a specific time interval (policy or accident year). Alternatively, the WCBs can distribute, or apportion, the cost of individual claims to the time intervals during which the employees filing the claims have been exposed to loss, that is, across the employees’ years of service. For example, if the cost of a cancer claim reported by an employee in 2013 is $100,000, and the employee worked in a chemical conversion plant from 1990 to 1999, then $10,000 would be apportioned to each individual year of service from 1990 through 1999. In many respects, this type of distribution is more equitable than the singular date of loss approach used in most other jurisdictions, as it ties the financial impact of these claims back to the periods of loss exposure that generated the injuries. Methods of Calculation The following are descriptions of general approaches used by Oliver Wyman to estimate the cost of reported claims, IBNR, and the AEC. The intent of these general descriptions is to convey concepts. The final approach used by any jurisdiction will depend critically on available data. Reported Claims Claim administrators are generally the best estimators of the expected cost of reported claims. In the U.S., Oliver Wyman’s experience has been that actuarial input can refine these estimates as respects ensuring appropriate life expectancy tables are used, as well as ensuring that claims with an annual expected medical cost for the life expectancy of the claimant have cost estimates that consider medical inflation and the potential for future significant medical procedures. IBNR Using Aggregate Claim Methods Oliver Wyman has developed models that forecast the reporting pattern of IBNR claims, as defined in this report, as of a specific liability valuation date. The reporting pattern is based on actual claims data, and generates the expected number of IBNR claims by report year. The IBNR liability is the expected number of claims to be reported by year, multiplied by the expected

Occupational Disease Canadian Institute of Actuaries
Oliver Wyman Actuarial Consulting
Page 30
cost of claims by year of emergence. This method requires detailed claim data, but does not require terminated employee data. Oliver Wyman uses these methods to estimate IBNR associated with coal worker pneumoconiosis for coal operator clients, as well as presumptive benefit claims for clients in the state of Nevada. The general approach is commonly referred to as a claim count-severity method. AEC All approaches reviewed by Oliver Wyman as well as approaches used by Oliver Wyman rely on details of the active employee population. Key elements include date of birth, gender, and date of hire. The process is straightforward and similar to approaches used to determine pension obligations. Essentially, each individual life is incrementally moved forward one year at a time. The life is decremented by mortality, the likelihood of termination, the likelihood of filing a claim, etc. At each age, the likelihood of a claim is multiplied by the expected cost of a claim if filed at that age, etc. The final estimated liability for a specific life is prorated to reflect the portion of the expected work life earned. For coal worker pneumoconiosis, models consider the likelihood of an employee leaving the workforce at every age, with a general assumption that at some point between age 65 and age 70, all workers will have left the workforce. For presumptive benefit calculations, actual retirement age data is used to determine the working lifetime. Oliver Wyman has not come across any approaches used to calculate the AEC that use a period to prorate other than the ratio of expected earned work life to total work life. As respects the WCBs, this detailed active employee data is likely not available. However, assumptions regarding employment levels, age distribution, and working life could be made, assuming that general industrial employment data is available in Canada at the provincial level. This type of data is generally available in the U.S. from the Department of Labor, Bureau of Labor Statistics.

Occupational Disease Canadian Institute of Actuaries
Oliver Wyman Actuarial Consulting
Page 31
Presentation and Discussion of Results Diseases Identified in the Study The study identified the following diseases as potentially occupational diseases, as defined for the purpose of this report. CANCER-RELATED CLAIMS MESOTHELIOMA LUNG CANCER ALL OTHER CANCER RESPIRATORY-RELATED CLAIMS OBSTRUCTIVE RESPIRATORY DISEASE PNEUMOCONIOSIS (EXCLUDING ASBESTOSIS) ASBESTOSIS ALL OTHER RESPIRATORY HEARING LOSS INFECTION EYE CONDITION ALL MENTAL STRESS PHYSICAL STRESS REACTION TO A FOREIGN SUBSTANCE VASCULAR CUMULATIVE TRAUMA CLAIMS BURSITIS EPICONDYLITIS TENDONITIS TENOSYNOVITIS OTHER INFLAMMATION SPRAIN/STRAIN/TEAR HERNIA OTHER CUMULATIVE TRAUMA
CARPAL TUNNEL SYNDROME CUMULATIVE NERVE DISEASE
Understanding the Metrics Disease selection must consider the nature of the underlying causative factor (cumulative exposure to loss or a specific incident), relative occurrence or frequency, as well as average cost per claim, or severity, on both an overall basis as well as for the selected industry groups. Clearly, if the primary causative factor for a specific disease is a traumatic incident as opposed to cumulative exposure to loss, it is not a viable candidate. Diseases of relatively low frequency

Occupational Disease Canadian Institute of Actuaries
Oliver Wyman Actuarial Consulting
Page 32
and cost overall as well as for all the individual industry groups are likely not viable candidates. However, there are specific diseases with low relative occurrence and cost, but for which claims are concentrated in a specific industry group. In this latter situation, including this disease for the specific industry group in question is a reasonable consideration. The basic analysis of each disease provides calculations/tabulations of claim count, average cost, average age at report, and average lag for the following groups of claims within each disease category:
Metric Claims Included
Raw Mean: All Claims
Cut Off: Claims with cost equal to or less than 10% of the raw mean
Adjusted Mean: All claims excluding cut-off claims
Adj. X 5 Largest: All claims excluding cut-off claims as well as the five largest claims
5 Largest: The five largest claims
Largest: The largest claim.
These metrics provide information for all claims combined, information excluding the impact of low-cost claims, and information excluding the potential distortion of extraordinarily high cost claims. Low-cost claims presented an issue in the analysis, most notably because of a very high number of zero- or minimal-cost claims, even for extraordinarily complex diseases such as cancer. One reason for zero- or minimal-cost claims is incomplete data, according to one data source. Nevertheless, low-cost claims data was included because it contained viable information on lag and age at claim report. The approach of examining metrics including and excluding claims systemically provides unedited information as well as insight into the impact of low-cost claims, without introducing a bias into the analysis by simply excluding groups of data because the cost (or any other metric) does not appear to be sensible. Additionally, there is an analysis of lag for each industry group. The analysis calculates the average age and average lag for all claims, for claims with lag less than or equal to two years, and for claims with lag greater than two years. The distribution of claims by lag is included as well. This basic analysis provides key insight into the underlying latency as respects time between last exposure to loss and the date the disease emerges. The distribution by gender is also included. Graphical presentations show distribution of claim reports by age and the distribution of claim costs as a percentage of the raw mean. Distribution of costs as a percentage of the raw mean provides a method of easily comparing distributions for diseases with materially different average claim costs. It also readily identifies diseases potentially distorted by low-cost claims. The selected base metrics and presentation for each individual disease are included in Appendix B. Results using carpal tunnel syndrome as an example follow:

Occupational Disease Canadian Institute of Actuaries
Oliver Wyman Actuarial Consulting
Page 33
AVERAGE AVERAGE AVERAGE
COUNT COST AGE LAG (DAYS)
RAW MEAN 22,092 29,951 42 122
CUT OFF 1,912 2,995
ADJ MEAN 20,180 32,555 42 124
ADJ X 5 LARGEST 20,175 32,158 42 124
5 LARGEST 5 1,637,173 46 55
LARGEST 1 2,394,022 39 3
ALL LAG <= 2 Yrs LAG > 2 Yrs
AVERAGE AGE 42 42 47
AVERAGE LAG (YEARS) 0.3 0.2 5.0
COUNT 21,705 21,008 697
COUNT PERCENTAGE 97% 3%
M F U
GENDER 11,056 10,869 167
GENDER PERCENTAGE 50% 49% 1%
CARPAL TUNNEL SYNDROME
COUNT PERCENTAGE
AGRICULTURE / FARMING / AQUACULTURE 146 1%
AIRCRAFT OPERATION, SERVICE, MANUFACTURING, OR REPAIR 105 0%
ANIMAL CARE, TRAINING, BREEDING, BOARDING 39 0%
AUTOMOBILE SALES, SERVICE, MANUFACTURING, OR REPAIR 1,096 5%
BUILDING MAINTAINENCE AND OPERATIONS 440 2%
CLERICAL 1,424 6%
CONSTRUCTION 736 3%
CONTRACTING 1,648 7%
EDUCATION AND RELIGIOUS INSTITUTIONS 622 3%
FIREFIGHTER 17 0%
FOOD MANUFACTURING 1,473 7%
FOOD SERVICE 1,031 5%
GENERAL SERVICES 165 1%
GOVERNMENT 1,764 8%
HEALTH CARE SERVICES 1,360 6%
HOSPITALITY AND ENTERTAINMENT 641 3%
LANDSCAPING 98 0%
LIVESTOCK AND POULTRY FARMING 111 1%
LOGGING AND TREE SERVICE 285 1%
MANUFACTURING GENERAL 3,667 17%
MARINE TERMINAL OPERATION 89 0%
MOTOR VEHICLE OPERATION OTHER THAN TRUCKING 162 1%
NATURAL RESOURCE EXTRACTION, REFINING, STORAGE, TRANSPORT 458 2%
POLICE OFFICERS 29 0%
RETAIL SERVICES 406 2%
SOCIAL SERVICES 284 1%
TELECOMMUNICATION AND BROADCASTING 111 1%
TRUCKING 360 2%
UNKNOWN 215 1%
UTILITY PRODUCTION, DISTRIBUTION, MAINTAINENCE 103 0%
VEHICLE OTHER THAN AUTOMOBILE SALES, SERVICE, MANUFACTURING, OR REPAIR 48 0%
VESSEL OPERATION, SERVICE, MANUFACTURING, OR REPAIR 1,474 7%
WHOLESALE AND RETAIL GENERAL 1,485 7%
CARPAL TUNNEL SYNDROME

Occupational Disease Canadian Institute of Actuaries
Oliver Wyman Actuarial Consulting
Page 34
0.00
0.20
0.40
0.60
0.80
1.00
20 25 30 35 40 45 50 55 60 65 70 75 80 85 90 95 100
Rela
tive
Clai
m C
ount
Age at Report
CARPAL TUNNEL SYNDROMEAge at Report
0.00
0.20
0.40
0.60
0.80
Rela
tive
Clai
m C
ount
Cost as Measured of Portion of Raw Mean
CARPAL TUNNEL SYNDROMECost Distribution at 2013 Cost Level Relative to Raw Mean
Raw Mean = $29,951
Occupational Disease Canadian Institute of Actuaries
Oliver Wyman Actuarial Consulting
Page 35
Appendix C provides a series of matrices showing key metrics used to define latency, by disease. The grouping of diseases by matrix anticipates recommendations for combining disease types presented later in this report. The key metric information provided is as follows: Age at the 5% Level: Ninety-five percent of claims are reported at ages greater than the 5% level. Age at claim report is assumed to represent age at disease emergence. Mean Age: Average age at report, all claim. Age at the 95% Level: Five percent of claims are reported at ages greater than the 95% level. Average Lag, All Claims: Lag is defined as the time between date of last exposure to loss (generally the last date worked) and the date of claim report. Average Lag, Excluding Lowest 10%: Average lag for 90% of claims. Measurement excludes 10% of total claims with the lowest lag. Average Lag, Excluding Lowest 90%: Average lag for 10% of claims. Measurement excludes 90% of total claims with the lowest lag. Discussion The metrics and matrices in the various appendices allow for an analysis of underlying disease data that considers the occurrence or frequency of claims, cost, and underlying latency (as measured by lag). The analysis provides for an examination of all claims combined as well as experience individually by industry grouping. In addition to base quantitative data, there must be consideration of overrepresentation of claims data within the industry grouping labelled Vessel Operation, Service, Manufacturing, or Repair (Vessel Operation). This is a natural consequence of the source data—two large U.S. ship manufacturers contributed 10 to 30 years of claims data. This data proved to be critical in measuring latency and emergence of asbestosis (and other claims) that have measurable occurrence in other industry groupings. On the other hand, 70% of nerve disease claims are in this industry group. Finally, there is a qualitative context underlying the quantitative aspects of the data. The source of the qualitative context was Oliver Wyman’s review of comments and notations for tens of thousands of claims. The following are Oliver Wyman’s recommendations.
Occupational Disease Canadian Institute of Actuaries
Oliver Wyman Actuarial Consulting
Page 36
Included Diseases Oliver Wyman recommends that the following diseases be included in the group of occupational diseases for which there is a significant unreported loss component due to cumulative exposure to some underlying hazard. These diseases are termed the “recommended set of diseases”. Mesothelioma, Asbestosis, and Lung Cancer: Underlying key metrics for these three diseases are extraordinarily similar, with the exception of the portion of claims with lag greater than two years. As respects this latter difference, it is not clear as to why this is the case. Notwithstanding concerns regarding quality of data (that is, accuracy of date of report and date of loss), age at retirement is a direct determinant of measured lag. Put simply, if all workers in a contracting operation remain employed and retire between age 65 and 70, unless they develop a lung disease earlier, the measured lag for this group of employees will be materially lower than the lag for an identical operation, but where all workers generally retire between age 55 and 60. This type of information was simply not available for this analysis. The approach taken for the purpose of this assignment was to combine the data of these three diseases and assume that the combined data generates an accurate measurement of underlying claim reporting patterns for all three diseases combined. All Other Cancer: This disease potentially could have been included in a common class with Mesothelioma, Asbestosis, and Lung Cancer. However, the latter three diseases involve the lungs or body tissues associated with the lungs, and have sufficiently similar metrics to warrant combination. All Other Cancer shows somewhat different metrics and affects other organs or body systems. All Other Pneumoconiosis Age at emergence as well as underlying latency is unique and warrants separate treatment. Metrics generated by data in this category are not consistent with metrics generated by coal worker pneumoconiosis (CWP or black lung) data from the U.S. The primary issue is the distribution of age at emergence, which includes claims from relatively young ages. Examination of underlying data shows that this issue is primarily due to 40 claims due to byssinosis (a lung disease caused by inhalation of cotton dust, also known as brown lung disease). The average age at emergence from this group of claims is 41, while the average age at emergence for all other claims is 57. The latter is consistent with expectations based on black lung data. Given this observation, the recommendation is to exclude byssinosis from this category and base emergence metrics on U.S. black lung data. Relevant metrics based on U.S. data are displayed on the following graph:

Occupational Disease Canadian Institute of Actuaries
Oliver Wyman Actuarial Consulting
Page 37
Obstructive Respiratory Disease and All Other Respiratory Disease The initial recommendation is to include obstructive respiratory disease, combined with all other respiratory disease, in the set of latent occupational diseases for which a liability could be determined. However, as noted earlier, there are concerns regarding underlying metrics and the impact of U.S. shipbuilding data. Specifically, the following is noted: - Both groups exhibit age distributions with high dispersion. - Both groups exhibit a materially lower age at emergence for claims with low lag when
compared to age at emergence for claims with high lag.
These observations indicate that these disease categories are composed of two fundamentally different types of claims. The following metrics, individually by disease group as well as for Vessel Operation and for all other industry groups combined, were calculated to better understand underlying claims data:

Occupational Disease Canadian Institute of Actuaries
Oliver Wyman Actuarial Consulting
Page 38
The metrics above indicate two fundamentally different types of claims. The first type is relatively low-cost claims with low lag that emerge at relatively low ages. The second type is relatively high-cost claims with higher lag that emerge at relatively high ages. Discussions with data sources indicate that lower-cost claims emerging at lower ages with minimal lag may be due to respiratory conditions generated by short-term acute exposure to hazardous substances. This is to be compared to higher-cost claims emerging at higher ages with significant lag, which are likely due to longer term exposure to hazardous substances resulting in respiratory diseases that emerge later in life. Additionally, metrics specific to Vessel Operation have similar relative behavior between claims with short and long lag, though claims with short lag for Vessel Operation are more expensive than for other industry groups. This may be an artifact of the U.S. shipbuilding data, which comprised the bulk of the Vessel Operation industry group. Given the above discussion, the recommendation is to include obstructive and other respiratory claims due to longer-term exposure to hazardous substances that emerge at later ages with material latency. These claims are characterized by the metrics and distribution on the following pages. This data underlying this information is compiled from both disease categories and all industry groups, but for claims with measured lag greater than two years. Metrics and distribution for claims with measured lag less than two years follow and are included for the sake of completeness.
OBSTRUCTIVE RESPIRATORY DISEASECOUNT AGE LAG COST
All Other Industry Groups Lag > 2 Years 39 56 5.5 338,627 Lag <= 2 Years 965 43 0.1 55,530
Vessal Operation…. Lag > 2 Years 9 48 6.9 463,710 Lag <= 2 Years 78 42 0.4 220,333
ALL OTHER RESPIRATORY DISEASECOUNT AGE LAG COST
All Other Industry Groups Lag > 2 Years 115 57 6.6 272,148 Lag <= 2 Years 2,578 41 0.2 69,964
Vessal Operation…. Lag > 2 Years 254 60 11.5 210,912 Lag <= 2 Years 469 50 0.4 165,445

Occupational Disease Canadian Institute of Actuaries
Oliver Wyman Actuarial Consulting
Page 39

Occupational Disease Canadian Institute of Actuaries
Oliver Wyman Actuarial Consulting
Page 40

Occupational Disease Canadian Institute of Actuaries
Oliver Wyman Actuarial Consulting
Page 41

Occupational Disease Canadian Institute of Actuaries
Oliver Wyman Actuarial Consulting
Page 42

Occupational Disease Canadian Institute of Actuaries
Oliver Wyman Actuarial Consulting
Page 43
Hearing Loss Eight percent of hearing loss claims are reported more than two years after the date of loss. While this metric is materially greater than the comparable metric for cumulative trauma, it is a great deal lower than the comparable metric for respiratory diseases, most notably cancer and asbestos. The following are key considerations underlying this recommendation:
- The overall frequency of hearing loss claims is extraordinarily high—representing about one-third of collected data;
- The incidence of hearing loss claims is broad and across all industry groupings; and - The measured lag for claims with lag greater than two years is 8.6 years, which is materially
greater than comparable metrics for cumulative trauma claims, similar to the metric for obstructive respiratory disease, though somewhat lower than the comparable metrics for cancer and asbestos-related respiratory diseases.
Calculations of unpaid costs for hearing loss claims must reflect underlying workers’ compensation law within the specific jurisdiction. Cumulative Trauma and Carpal Tunnel Syndrome The recommendation is that with the exception of Carpal Tunnel Syndrome, all diseases within the cumulative trauma category be combined into a single category labelled Cumulative Trauma/Repetitive Motion. Carpal Tunnel Syndrome is included in this recommendation, but as an individual category. The following is the basis for this recommendation:
- All metrics as respects age, lag, and cost for all diseases in the cumulative trauma category are extraordinarily close, if not identical.
- Claim cost distributions for all diseases in the cumulative trauma category are extraordinarily close, if not identical.
- Metrics and claim cost distributions for Carpal Tunnel Syndrome are similar to other cumulative trauma diseases. However, Carpal Tunnel Syndrome is a unique condition that represents approximately 10% of the overall database.
Excluded Diseases The decision as to what diseases should or should not be included in the recommended set of diseases lies with the individual jurisdictions. Oliver Wyman recommends that the following diseases be excluded, based on the review of underlying claims data. There is a brief discussion of the underlying reasoning for each disease. Eye Conditions: There are too few claims to warrant consideration. Additionally, this disease does not contribute materially to overall measured cost, nor do claims exhibit material lag. Infection: There are too few claims to warrant consideration. Additionally, this disease does not contribute materially to overall cost. There is an implied latency because the metrics show that for claims with lag greater than two years, the average lag is over five years. This measurement is due to only four data elements. A large number of these claims were excluded due to low

Occupational Disease Canadian Institute of Actuaries
Oliver Wyman Actuarial Consulting
Page 44
cost. Examination of individual claims data shows that many of these claims are due to singular incidents exposing the employee to bodily fluids or other infectious agents. Vascular: There are too few claims to warrant consideration. Additionally, this disease does not contribute materially to overall cost. Finally, there is no implied latency. Reaction to a Foreign Substance: There is a non-trivial claim volume in this category (1,183), with a measurable average cost of approximately $60,000, excluding cut-off claims and the five largest claims. Additionally, there is an implied lag of approximately eight years for claims with lag greater than two years. Nevertheless, Oliver Wyman does not recommend including this disease in the recommended set of diseases for which a liability should be determined. The following are considerations: - Slightly less than half the claims have recorded costs below the cut-off, or less than 10% of the
raw mean. The implication is that this is a relatively low claim cost category. - Respiratory and other claims stemming from exposure to foreign substances were mapped
into other disease categories. In this sense, as discussed earlier, this is a residual disease category. One-third of the claims in this category have no information regarding underlying disease, and list body system or an internal organ as part of body affected. It is likely that had additional details been available on individual claims, a measurable portion of these claims would have mapped elsewhere.
Physical Stress: Oliver Wyman recommends excluding this disease category. The following are considerations: - Approximately 66% of the claims have costs below 10% of the mean. The remaining claims
are extraordinarily expensive. - There is little or no lag associated with these claims. - The disease type is overrepresented in the Vessel Operation industry group. - The claims are generally heart disease related.
Given there is little or no lag associated with these claims and the claims are almost exclusively heart disease related, these claims are likely more a manifestation of general health-related disease rather than latent occupational disease. The large number of claims with low cost potentially is an indicator of denial of benefits, though this is speculation. Additionally, overrepresentation from the Vessel Operation industry group exaggerates the cost and frequency of these claims.
Mental Stress: Oliver Wyman recommends excluding this disease category. The following are considerations: - Unlike cumulative trauma, there is a question as to whether these claims are triggered by a
near-term incident or change of circumstance, or long-term exposure to a loss generating hazard.

Occupational Disease Canadian Institute of Actuaries
Oliver Wyman Actuarial Consulting
Page 45
- 90% of the claims data are from one non-Canadian contributor. It is possible that these claims are a manifestation of the specific statutes within the jurisdictions that the contributor operates.
- There are no claims in this category from Canadian contributors. - Some Canadian provinces specifically exclude mental stress unless the condition results from
an acute reaction to a traumatic event. Nerve Disease: There are approximately 1,400 claims in this category, of which over 900 are in the Vessel Operation industry group. The large number of claims in this industry group is an artifact of the underlying data sources, of which two were U.S. shipbuilding firms. Most injuries associated with this group are to the hand, wrist, or fingers, as noted below: Distribution by Body Part 1,015 Fingers 143 Hand 84 Wrist 149 Other The vast majority of the injuries are associated with Raynaud’s syndrome, also known as vibratory white finger. This is a disease where long-term use of vibratory tools damages nerves in the hand area. The nerve damage impedes circulation, resulting in this disease. In this category, 1,023 of the 1,391 claims are listed as Raynaud’s syndrome. There are an additional 103 claims listed with numbness as a symptom associated with fingers or hands. There is high likelihood that these claims are Raynaud’s syndrome cases as well. It is therefore likely not useful to consider this disease group in general. However, for shipbuilding and possibly related occupations, cumulative nerve disease could reasonably be included in the group of diseases for which consideration is given to determining a liability. Ultimately, the decision regarding the treatment of this disease category is the responsibility of the individual jurisdictions. Diseases with a Significant Report Lag MESOTHELIOMA/ASBESTOSIS/LUNG CANCER ALL OTHER CANCER PNEUMOCONIOSIS (EXCLUDING ASBESTOSIS) OBSTRUCTIVE RESPIRATORY DISEASES/ALL OTHER RESPIRATORY DISEASES HEARING LOSS The diseases listed above demonstrate a significant level of latency with a material IBNR component.

Occupational Disease Canadian Institute of Actuaries
Oliver Wyman Actuarial Consulting
Page 46
Diseases with Minimal Report Lag BURSITIS EPICONDYLITIS TENDONITIS TENOSYNOVITIS OTHER INFLAMMATION SPRAIN/STRAIN/TEAR due to repetitive motion HERNIA OTHER CUMULATIVE TRAUMA due to repetitive motion CARPAL TUNNEL SYNDROME Oliver Wyman combined data for all cumulative trauma diseases, except Carpal Tunnel Syndrome, to calculate metrics for this analysis as well as for potential liability calculations. Additionally, the categories labelled Strain/Sprain/Tear and Other Cumulative Trauma include claims due to repetitive motion only. Other Disease-Related Items Jurisdictional Differences There do not appear to be diseases identified in the study that are specifically excluded from compensation in any Canadian or U.S. jurisdiction. - There are limitations on claims due to mental illness in some Canadian jurisdictions and U.S.
jurisdictions. Examples include: o North Dakota excludes mental illness except stress due to an acute event. o Washington State and West Virginia exclude all conditions due to mental illness. o New Brunswick and Nova Scotia exclude mental illness except stress due to an acute
event. - Constraints, rules, and administration of hearing loss claims vary widely among jurisdictions.
For example, in some U.S. jurisdictions, failure to wear protective devices is an absolute defense against hearing loss claims. In all Canadian provinces, this specific issue has no impact, but administrative and statutory rules vary.
- In addition to statute, case law and administration will vary materially between jurisdictions. - Oliver Wyman did not conduct a detailed review of statutes in all jurisdictions. The basis of
the content of this section is a review of summary charts published by the U.S. Department of Commerce.
Variance of Exposure by Industry Appendix E provides the following information by industry group and recommended disease combination: Raw Claims

Occupational Disease Canadian Institute of Actuaries
Oliver Wyman Actuarial Consulting
Page 47
Raw Claims Normalized by Recommended Disease Combination across each Industry Group The sum of percentages equal 100% for each industry group. Conclusions drawn as respects
the incidence of each disease type within each industry group are viable and unbiased. The information in this chart is useful in understanding the relative distribution of disease by industry group. For example, within clerical, over 90% of the claims are cumulative trauma claims, with 44% Carpal Tunnel Syndrome, the highest of any industry group. For clerical exposures, this result was expected. However, an interesting observation is that the majority of claims for logging and tree service are hearing loss.
Raw Claims Normalized by Industry Group across each Recommended Disease Combination The sum of percentages equal 100% for each disease type. Conclusions drawn as respects
the portion of each disease type by industry group are potentially biased by over- or under-representation of each industry group within the underlying data. This is true for Vessel Operation, simply because two large contributors to the assignment are large U.S. shipbuilding concerns. Information in this chart would be accurate if the cross-section of claims underlying the charts represented the actual distribution of claims for a province in a specified accident period. This is likely not the case.
Definition of Industry Groups Oliver Wyman defined the industry groups during an iterative process of review of underlying claims data. The selection reflected an attempt to keep the number of industry groups reasonably low while concurrently attempting to create reasonably homogenous groups as respects employment description. Another important consideration was to ensure that certain employee classifications unique to a single contributor were not discernible in the final database to preserve confidentiality of data submitted for this assignment. The following are general descriptions of the employee classifications mapped into each industry group. AGRICULTURE/FARMING/AQUACULTURE Farming, fishing, hatcheries, fish farming, orchard workers, nurseries AIRCRAFT OPERATION, SERVICE, MANUFACTURING, OR REPAIR Fixed wing and rotary aircraft, aviation school, commercial airlines, airport operation ANIMAL CARE, TRAINING, BREEDING, BOARDING Grooming, kennels, ranching, breeding, training, shelters, veterinary AUTOMOBILE SALES, SERVICE, MANUFACTURING, OR REPAIR Dealers, service, wreckers, junking, parts, garage operations, service stations, towing BUILDING MAINTENANCE AND OPERATIONS Cleaning, custodial, janitorial, operations, inspection CLERICAL

Occupational Disease Canadian Institute of Actuaries
Oliver Wyman Actuarial Consulting
Page 48
Accounting, banks, administration, advertising, data processing, engineering, computer operations, financial services, insurance services, actuarial, legal, medical administration, real estate, telemarketing CONSTRUCTION Bridge, asbestos removal, concrete, towers, building demolition, building movers, debris removal, tunnel, foundation, equipment operation, road, rail, iron worker, painting structures, steel framing CONTRACTING Acoustic material installation, alarm, sprinkler, boiler, window treatment installation, carpentry, cabinets, interior finishing, chimney, drywall, plaster, doors, windows, HVAC, electrical, fence, flooring, framing, glazier, home maintenance, lighting, fireproofing, insulation, painting, wall treatments, pools, hot tubs, roofing, siding, tiling, wood working EDUCATION AND RELIGIOUS INSTITUTIONS Charitable, church, college, driving, daycare, primary, secondary, kindergarten, vocational FIREFIGHTER EMS, forest, firefighter FOOD MANUFACTURING Bakery, brewery, dairy products, candy, cannery, grain products, egg, fruit juice, packing, milling, ice cream, preserving, processing, liquor, meat, pasta, wine, pickle, rendering, sugar, vineyard, vegetables, smoking, curing, prepared meat FOOD SERVICE Catering, butchering, shops, concessions, restaurants GENERAL SERVICES Avalanche control, cemeteries, commercial diving, recycling, delivery services, funeral, equipment rental and service, inspection, design, laundries, surveying, photographer, packing, storage, employment agencies, light repair GOVERNMENT Municipal, counties, state, provincial, federal, library, labor union, associations, professional trade associations, toll collector HEALTH CARE SERVICES Adult home, acute care, chiropractic, ambulance, home health care, nursing, medical diagnostics, physician, physician assistant, paramedic, pharmaceutical preparation, optometry, ophthalmologist, hospitals HOSPITALITY AND ENTERTAINMENT

Occupational Disease Canadian Institute of Actuaries
Oliver Wyman Actuarial Consulting
Page 49
Theatre, amusement park, arcades, art galleries, museums, actions, gaming, bowling, camping, exhibitions, golf, circus, carnival, hotels, motels, horse racing, motion picture, ballet, maid, pub, bar, nightclub, ski, park, zoo, sports LANDSCAPING Brush cutting, lawn, landscaping, garden supply, landscape supply LIVESTOCK AND POULTRY FARMING Fur-bearing animal farming, hog farming, poultry farming, poultry farming, ranching LOGGING AND TREE SERVICE Logging, forest management, log towing, log scaling, manual tree felling, timber management, tree trimmer, tree services, tree removal, tree climber, tree worker MANUFACTURING GENERAL Feed, ornament, battery, coatings, clothing, clay, chemical, coffin, cord, rope, concrete products, electrical components, fertilizer, explosives, steel, sheetrock, gaskets, filters, foam, footwear, luggage, leather, heat treating, hardware, gypsum, jewellery, iron product, metal, machinist, metal goods, plywood, mattress, wood products, welding, tools, rubber products, valves, vinyl window, tanneries, stoves, ovens, sporting goods MARINE TERMINAL OPERATION Stevedoring, salvage, garbage collection, operation, container handling MOTOR VEHICLE OPERATION OTHER THAN TRUCKING Bus, taxi, tractor, armored car, limousine, route drivers NATURAL RESOURCE EXTRACTION, REFINING, STORAGE, TRANSPORT Drilling, storage, gas main construction, mining, gas processing, petrochemical manufacture, pipeline maintenance, smelting, refining, gravel pit POLICE OFFICERS Private security, police, law enforcement RETAIL SERVICES Carpet, tailoring, dry cleaners, blacksmith, barber, beauty, Laundromats, office services, locksmiths, appliances, small equipment, vending, office services SOCIAL SERVICES Counselling, day homes, domestic child care, retirement living centre, social club, alcohol/drug treatment, community services, continuing care TELECOMMUNICATION AND BROADCASTING

Occupational Disease Canadian Institute of Actuaries
Oliver Wyman Actuarial Consulting
Page 50
Station broadcasting, cable service, security and alarm systems, telephone operations, telecommunication system operations TRUCKING All codes with “trucking” in description UTILITY PRODUCTION, DISTRIBUTION, MAINTENANCE Gas, electric, sewage, water, power poles, telecommunication line construction VEHICLE OTHER THAN AUTOMOBILE SALES, SERVICE, MANUFACTURING, OR REPAIR Buses, trailers, mobile homes, sport vehicles, trucks, cabs VESSEL OPERATION, SERVICE, MANUFACTURING, OR REPAIR Barge, tub, boat, ship, tours, commercial marine, dredging, pleasure craft, marina, ferry, docking, water taxi WHOLESALE AND RETAIL GENERAL Hardware, clothing, dry goods, sheet metal, shoe, scrap, junk, retailers, specialty, wholesalers, supermarket, newspaper, newsstand, plumbing

Occupational Disease Canadian Institute of Actuaries
Oliver Wyman Actuarial Consulting
Page 51
Methodology and Discussion Data Oliver Wyman and the CIA jointly approached a number of Canadian provinces to discuss the contribution of data to this assignment. Additionally, Oliver Wyman approached current clients and contacts within the U.S. The following entities contributed data to this assignment: The Alberta Workers’ Compensation Board The British Columbia Workers’ Compensation Board (WorkSafeBC) A competitive state fund in the U.S. First large U.S. ship manufacturing, repair, and servicing corporation Second large U.S. ship manufacturing, repair, and servicing corporation. Data was received over a six-month period beginning early in 2013. Data from the Alberta and British Columbia boards was received first and was therefore reviewed first. Data from the other U.S. sources was received later in the process, with the final data received in July 2013. A brief discussion of the nature and quality of the data from each source follows. Alberta Workers’ Compensation Board
- Approximately 119,400 claims with detailed claim information were acquired. - Approximately 54,400 claims were used. - Approximately 55,700 claims had reported costs less than $1,500 and were excluded. - Approximately 200 asbestosis, silicosis, and pneumoconiosis claims had costs less than $1,500
but were included to capture age and lag information. - The remaining claims were excluded due to injury descriptions not consistent with cumulative
trauma (slips, falls, struck by, etc.), lack of information, or contradictory data elements. The $1,500 benchmark represents the trended current cost of the claims using a 3% annual trend factor for non-medical benefits (temporary wage replacement, disability, fatality, other compensation, and Non-Economic Loss Payment and a 5% annual trend factor for medical benefits (Personal Care Allowance and all other medical). The very low cost of a large number of claims raised concerns regarding whether the data from low-cost claims would distort claim cost measurements. On the other hand, there was a concern that excluding a large portion of the data would eliminate valuable information by lag. The selected cut-off represented a balance between these two items. WorkSafeBC
- Approximately 54,700 claims with detailed claim information were acquired. - Approximately 44,900 claims were used. - Approximately 8,300 claims had a reported cost of less than $1,500 and were excluded. - Less than 20 asbestosis, cancer, and other respiratory claims had costs less than $1,500 but
were included to capture age and lag information.

Occupational Disease Canadian Institute of Actuaries
Oliver Wyman Actuarial Consulting
Page 52
- Approximately 1,500 claims were excluded due to injury descriptions not consistent with cumulative trauma (slips, falls, struck by, etc.), lack of information, or contradictory data elements.
U.S. Competitive State Fund
- Approximately 86,400 claims with detailed claim information were acquired. - Approximately 30,700 claims were used. - Approximately 50,100 claims had reported cost less than $1,500 and were excluded. There
were no claims with costs less than $1,500 used in the study. - Approximately 5,600 claims were excluded due to injury descriptions not consistent with
cumulative trauma (slips, falls, struck by, etc.), lack of information, or contradictory data elements.
U.S. Ship Manufacturing Data
- Approximately 143,600 claims with detailed claim information were acquired. - Approximately 20,300 claims were used. - No claims were excluded due to cost benchmarking. Many claims simply had no cost data
available due to age and data limitations. However, many claims with no cost information did have viable and usable information regarding other claim characteristics. As such, the approach was to use all claims with good claim information regardless as to whether cost information was provided. Claims included in the database with costs less than $1,500 were composed of the following injury types:
91 cancer 580 respiratory, including 189 asbestosis claims 963 hearing loss claims All of the information in claims with costs less than $1,500 was viable and useful.
- Claims were excluded from the data if they had injury descriptions not consistent with cumulative trauma (slips, falls, struck by, etc.), lack of information, or contradictory data elements. There were many of these claims because the entities providing the data could not easily isolate claims due to hazardous substance exposure or cumulative trauma. However, given that this data was provided gratis, Oliver Wyman attempted to limit the amount of work requested from these entities, with the thought that Oliver Wyman would screen the acquired data.

Occupational Disease Canadian Institute of Actuaries
Oliver Wyman Actuarial Consulting
Page 53
Database Form and Content The form and content of the final database evolved during the editing and compilation process. The approach was iterative, in the sense that the editing and compilation process gave context and background to data structure and differences in content from the various contributors. The format accommodated common available data from all sources. Additionally, the form and structure of the final database considered the need to ensure confidentiality of contributor data. The structure of the final database follows, with explanation. List of Data Elements
Age at Date of Loss Age at Claim Report Gender Report Lag Claim Cost at Current Level Industry Group Primary Disease/Injury Category Primary Disease/Injury Classification Primary Disease/Injury Detail Secondary Disease/Injury Detail Source of Injury Body Part 1 Body Part 2
Discussion of Data Elements
Age at Date of Loss: this is self-explanatory. Age at Claim Report: this is self-explanatory. Gender: this is self-explanatory. Report Lag: this is the difference between the date of loss and date of report. Report lag is a direct measure of latency. Claim Cost at Current Level: reported medical costs are adjusted to a 12/31/12 cost level using a 5% annual inflation factor. All other costs are adjusted to a 12/31/12 cost level using a 3% annual inflation factor. Industry Group: each individual claim was mapped into one of 33 industry groups. Oliver Wyman defined the industry groups based on the examination of the employer classification and employer industry data acquired from each contributor as well as the claim volume of individual classifications. Information and nomenclature varied materially between contributors. There were approximately 1,500 individual employee classifications.
Occupational Disease Canadian Institute of Actuaries
Oliver Wyman Actuarial Consulting
Page 54
Additionally, there were a large number of claims without a true employee classification, but with a description of employee job function. An approach of searching for key words using various spreadsheet functions assisted in the categorization of the employee classifications into potential groups. The definition of the industry groups also considered the need to ensure confidentiality. Upon analysis of employee classifications, it was readily apparent that some classifications were unique to a specific contributor. The mapping process was especially sensitive to this issue because it was imperative that there exist no possibility for any reader of this report to be able to glean information from a specific contributor. The final mapping was reasonable, but by no means perfect from an underwriting perspective. For example, it is not clear whether certain codes in construction would be better suited for contracting, or vice versa. From an analytical viewpoint, it might be best to combine the two groups. Education/religious institutions and government is another example of two groups that potentially could be combined. Another concern is that the mapping process entailed manual examination of a large number of individual claim descriptions. However, Oliver Wyman did not individually review every claim. As a result, the placement of some classifications is not ideal. An example would be highway repair work with a government indicator in the description. The process mapped these claims into government, but a more appropriate group for these claims potentially is construction. The following are the industry groups defined in this study.
AGRICULTURE/FARMING/AQUACULTURE AIRCRAFT OPERATION, SERVICE, MANUFACTURING, OR REPAIR ANIMAL CARE, TRAINING, BREEDING, BOARDING AUTOMOBILE SALES, SERVICE, MANUFACTURING, OR REPAIR BUILDING MAINTAINENCE AND OPERATIONS CLERICAL CONSTRUCTION CONTRACTING EDUCATION AND RELIGIOUS INSTITUTIONS FIREFIGHTER FOOD MANUFACTURING FOOD SERVICE GENERAL SERVICES GOVERNMENT HEALTH CARE SERVICES HOSPITALITY AND ENTERTAINMENT LANDSCAPING LIVESTOCK AND POULTRY FARMING LOGGING AND TREE SERVICE MANUFACTURING GENERAL MARINE TERMINAL OPERATION MOTOR VEHICLE OPERATION OTHER THAN TRUCKING NATURAL RESOURCE EXTRACTION, REFINING, STORAGE, TRANSPORT POLICE OFFICERS RETAIL SERVICES SOCIAL SERVICES TELECOMMUNICATION AND BROADCASTING TRUCKING UNKNOWN UTILITY PRODUCTION, DISTRIBUTION, MAINTENANCE

Occupational Disease Canadian Institute of Actuaries
Oliver Wyman Actuarial Consulting
Page 55
VEHICLE OTHER THAN AUTOMOBILE SALES, SERVICE, MANUFACTURING, OR REPAIR VESSEL OPERATION, SERVICE, MANUFACTURING, OR REPAIR WHOLESALE AND RETAIL GENERAL
Primary Disease/Injury Category: The intent of this data element is to define the primary disease or injury category. Bolded labels indicate that there are classifications or specific injuries/diseases within the category—see the next data element.
CANCER CUMULATIVE TRAUMA EYE CONDITION HEARING LOSS INFECTION MENTAL STRESS PHYSICAL STRESS REACTION TO A FOREIGN SUBSTANCE RESPIRATORY DISEASE VASCULAR
Primary Disease/Injury Classification: This category provides a distribution of the primary category by classification. For example, the process partitioned the primary category of cancer into three classifications: Lung, Mesothelioma, and All Other Cancer. The definition and number of classifications is data driven—there were sufficient lung cancer and mesothelioma claims to warrant their own classification. Remaining types are included in the All Other Classification. Classifications are further refined in the primary disease/injury data field. In some situations, such as for the category labelled Eye Condition, separate classifications are not warranted, so the category description is repeated in the classification description. However, there are individual diseases associated with the classification, which are listed in the Primary Disease/Injury data field. This is an artifact of how the data was sorted and compiled. (Bolded labels indicate that there are detailed injuries within the classification.)
ALL OTHER CANCER CANCER LUNG MESOTHELIOMA BURSITIS CARPAL TUNNEL SYNDROME EPICONDYLITIS HERNIA

Occupational Disease Canadian Institute of Actuaries
Oliver Wyman Actuarial Consulting
Page 56
CUMULATIVE TRAUMA NERVE DISEASE OTHER CUMULATIVE TRAUMA OTHER INFLAMMATION TENDONITIS SPRAIN/STRAIN/TEAR TENOSYNOVITIS EYE CONDITION EYE CONDITION
(See Primary Injury/Disease data field for specific injuries or diseases in this classification.)
INFECTION INFECTION
(See Primary Injury/Disease data field for specific injuries or diseases in this classification.)
MENTAL STRESS MENTAL STRESS
(See Primary Injury/Disease data field for specific injuries or diseases in this classification.)
PHYSICAL STRESS PHYSICAL STRESS
(See Primary Injury/Disease data field for specific injuries or diseases in this classification.)
REACTION TO A FOREIGN SUBSTANCE
REACTION TO A FOREIGN SUBSTANCE (See Primary Injury/Disease data field for specific injuries
or diseases in this classification.)
ALL OTHER RESPIRATORY RESPIRATORY DISEASE ASBESTOSIS OBSTRUCTIVE RESPIRATORY DISEASE PNEUMOCONIOSIS ALL EXCEPT ASBESTOSIS VASCULAR VASCULAR
(See Primary Injury/Disease data field for specific injuries or diseases in this classification.)

Occupational Disease Canadian Institute of Actuaries
Oliver Wyman Actuarial Consulting
Page 57
Primary Disease/Injury Detail: This is the additional detailed information associated with the above bolded categories.
ALL OTHER CANCER BLADDER BRAIN BREAST COLON-RECTAL ESOPHOGEAL LYMPHOMA LIVER FOLLICULAR LARGE CELL GASTROINTESTINAL MELANOMA HODGKIN’S DISEASE KIDNEY LARYNX LEUKEMIA LYMPHOSARCOMA MOUTH MULTIPLE MYELOMA PROSTATE SEMINOMA SINUSES SKIN (NOT MELANOMA) STOMACH TESTICULAR THROAT VOCAL CHORDS UNKNOWN NERVE DISEASE NUMBNESS NERVE DISEASE (NOC) NERVE DAMAGE SCIATICA RAYNAUD’S SYNDROME OR PHENOMENA THORACIC OUTLET SYNDROME OTHER CUMULATIVE TRAUMA BENIGN NEOPLASM BRUISE/CONTUSION BUNION CALLOUSES CYST (NON-GANGLION) DORSOPATHY DUPUYTREN’S FACET SYNDROME FIBROMYALGIA FISTUAL ANAL FRACTURE HEADACHE HAEMORRHOIDS INGROWN NAIL LARYNGITIS MALAISE OSTEOPATHY POLYP SPASMS ULCER UNKNOWN GENERAL SORENESS/PAIN/HURT REFLEX SYMPATHETIC DYSTROPHY OTHER INFLAMMATION ARTHRITIS BONE SPUR CAPSULITIS GANGLION CYST HEEL SPUR MYOSITIS OSTEOARTHRITIS OTHER INFLAMMATION PLANTAR FASCIITIS SYNOVITIS

Occupational Disease Canadian Institute of Actuaries
Oliver Wyman Actuarial Consulting
Page 58
SPRAIN/STRAIN/TEAR DISC DISEASE DISLOCATION ROTATOR CUFF SYNDROME HERNIATED DISC MENISCUS TEAR MUSCULOSKELETAL DISORDER TORN TENDON ROTATOR CUFF TEAR SPRAIN/STRAIN/TEAR NOC TENOSYNOVITIS TENOSYNOVITIS NOC DE QUERVAIN’S TRIGGER FINGER EYE CONDITION CATARACT EYE CONDITION NOC INFECTION REACTION TO A FOREIGN SUBSTANCE VISION LOSS INFECTION BRUCELLOSIS SALMONELLA CAMPHYLOBACTERIA CAT SCRATCH FEVER CELLULITIS PSITTACOSIS CHICKENPOX CHLAMYDIAE CRYPTOCOCCOSIS DYSENTERY GASTROENTERITIS HEPATITIS HERPES ZOSTER HISTOPLASMOSIS SCARLET FEVER INFLUENZA LEPTOSPIROSIS UNDULANT FEVER MENINGITIS MONONUCLEOSIS TYPHOID FEVER TULAREMIA MYCOBACTERIUM PARONYCHIA MUMPS MALARIA SHIGELLA SCABIES STAPH MRSA RUBELLA IMPETIGO MENTAL STRESS ANEURYSM ANGINA ANXIETY COLITIS DEPRESSION EXHAUSTION GASTRITIS HEADACHE/MIGRAINE HEART ATTACK HEART DISEASE NERVE DISEASE NERVOUS BREAKDOWN SEIZURES SLEEP APNEA ULCER VERTIGO UNKNOWN
PHYSICAL STRESS HEART DISEASE HEART ATTACK ANGINA UNKNOWN RESPIRATORY DISEASE

Occupational Disease Canadian Institute of Actuaries
Oliver Wyman Actuarial Consulting
Page 59
REACTION TO A FOREIGN SUBSTANCE ALLERGIC REACTION ANGINA POISONING GASTROENTERITIS SCLERODERMA INCONTINENCE SKIN RELATED INFLAMMATION OF JOINT/MUSCLE LIVER DISEASE NERVOUS SYSTEM DISEASE HEADACHE/MIGRAINE HEART ATTACK UNKNOWN VOMITING ALL OTHER RESPIRATORY PSITTACOSIS PNEUMONIA COUGH RADIATION SICKNESS PULMONARY FIBROSIS PULMONARY EDEMA SEPTIC SHOCK REACTION TO A FOREIGN SUBSTANCE SINUSITIS TUBERCULOSIS UNKNOWN OBSTRUCTIVE RESPIRATORY DISEASE COPD BRONCHITIS ASTHMA EMPHYSEMA PNEUMOCONIOSIS EXCEPT ASBESTOSIS BLACK LUNG BYSSINOSIS ASTHMA SILICOSIS PNEUMOCONIOSIS NOC VASCULAR REACTION TO A FOREIGN SUBSTANCE VASCULAR INJURY
Occupational Disease Canadian Institute of Actuaries
Oliver Wyman Actuarial Consulting
Page 60
Secondary Disease/Injury: Multiple injuries or multiple diseases are associated with many claims. For example, with cancer, the individual may have lung cancer and kidney cancer. In that specific situation, lung cancer would have been listed as the primary disease/injury, and kidney cancer would have been listed as the secondary disease/injury. In these situations, the primary injury would have been chosen to maximize the number of data elements for a specific condition, in this case lung cancer. Similar situations exist with cumulative trauma, where carpal tunnel would be listed with another disease, such as tendonitis. The same approach would have been used in those cases, where carpal tunnel syndrome would be the primary disease, and tendonitis would be the secondary disease. Source of Injury: This is self-explanatory. Note that the review of data shows that typing and keyboard entry was the source of a large number of cumulative trauma claims. Body Part 1: The body part associated with the primary injury. Body Part 2: The body part associated with the secondary injury.

Occupational Disease Canadian Institute of Actuaries
Oliver Wyman Actuarial Consulting
Page 61
Discussion of Individual Diseases A discussion of each individual disease follows. CANCER-RELATED CLAIMS MESOTHELIOMA: Mesothelioma is a cancer of the cells composing the membrane that lines
the internal organs of the body. Mesothelioma most often occurs in the pleural membrane lining the lungs. Medical literature generally considers exposure to asbestos as the only known cause of mesothelioma. Claims identified in the database as mesothelioma include claims specifically labelled as mesothelioma in the source data as well as claims labelled as cancer of the pleura or pleural membrane. There are 935 claims labelled as mesothelioma.
LUNG CANCER: This was the second most common cancer claim in the data (after
mesothelioma). There are 249 claims labelled as lung cancer. These include claims with multiple cancer sites.
ALL OTHER CANCER: There are 452 claims in this category. The specific cancers found in the
data are listed in the prior section. RESPIRATORY-RELATED CLAIMS OBSTRUCTIVE RESPIRATORY DISEASE: There are 1,165 claims in this category. Obstructive
respiratory disease includes diseases that obstruct the airways leading to the lungs. Diseases in this category differ from restrictive respiratory diseases, which inhibit the ability of the lungs to expand and fill with air. Obstructive diseases include asthma, emphysema, bronchitis, and cardio obstructive pulmonary disease (a general term that refers to all obstructive respiratory diseases). Restrictive respiratory diseases include the class of diseases termed pneumoconiosis (discussed below), pneumonia, and other medical conditions that inhibit the ability of the lungs to expand. Pneumoconiosis is the primary restrictive lung disease in the class of latent occupational diseases.
PNEUMOCONIOSIS (EXCLUDING ASBESTOSIS): Pneumoconiosis is a disease caused by the
inhalation of dust. The dust remains in the lungs, causing lesions and scarring. Forms of pneumoconiosis include coal worker pneumoconiosis (black lung), asbestosis, silicosis, byssinosis (cotton dust), and others. This study treated asbestosis claims individually as a class, with the remaining pneumoconiosis claims combined into a single category. There are two reasons for this approach. The first is that there are 2,228 asbestosis claims and only 188 all other claims. The second is that the metric profile for asbestosis is fundamentally different from the other pneumoconiosis claims. Most notably, the average age at report for all other pneumoconiosis claims is 54, which is consistent with coal miner data in the U.S. The average age at report for asbestosis claims is 64. Other differences exist as well.

Occupational Disease Canadian Institute of Actuaries
Oliver Wyman Actuarial Consulting
Page 62
ASBESTOSIS: Discussed above. ALL OTHER RESPIRATORY: There are 3,795 claims in this category, of which approximately
2,900 claims have no disease information and 800 have reaction to a foreign substance as the only disease information. The remaining claims include 33 pneumonia claims and 30 tuberculosis claims. About 2,800 of the claims list exposure to chemicals, fumes, fire, smoke, chips, particles, or dust as the source of injury.
HEARING LOSS: There are 56,628 claims in this category. Note that hearing loss represents more than one-third of the entire database. INFECTION: There are 249 infection claims. Hepatitis represents about one-third of these claims. Note that claims due to tuberculosis were included in the All Other Respiratory disease group. The remaining claims in this category are due to a variety of generally non-respiratory infections. The individual diseases are listed in the prior section. EYE CONDITION: There are 35 claims in this category, which includes all injuries involving vision. This category generally includes cataracts (resulting from radiation exposure from welding or other manufacturing operations), eye damage resulting from exposure to chemicals or other substances, and eye strain. It is important to note that a large portion of the claims excluded due to low cost are associated with eye damage due to welding. These claims were generally of very low lag and very low cost. MENTAL STRESS: There are 2,990 claims in this category. Mental stress claims manifest themselves as angina, anxiety, depression, gastro-intestinal disorders, heart disease, headache, ulcers, hypertension, and others. PHYSICAL STRESS: There are 376 claims in this category. The underlying presumption is that cumulative long-term exposure to physical exertion due to employment generated the physical symptoms/diseases associated with these claims. These claims are almost exclusively due to heart disease (angina and heart attack). REACTION TO A FOREIGN SUBSTANCE: There are 1,183 claims in this category; 468 are poisoning, most of which are due to lead or carbon monoxide; 272 claims are skin-related conditions; and 390 claims have unknown conditions. Note that this disease category is in a sense residual, given that it is composed of claims not mapped into other disease categories. For example, many cancer claims had “reaction to a foreign substance” recorded as source of injury. These claims were included in the cancer claim categories. Similarly, respiratory illnesses due to exposure to chemicals, fumes, or any other foreign substance, were included in the appropriate respiratory disease category as well. VASCULAR: There are 114 claims in this category, composed primarily of varicose veins, phlebitis, blood clots, strokes, and hypertension. Though small, this category is interesting because of over-representation in trucking, other motor vehicle operation, police officers, retail

Occupational Disease Canadian Institute of Actuaries
Oliver Wyman Actuarial Consulting
Page 63
services, and food service industry groups. Driving occupations, and occupations requiring long periods of sitting or standing, increase the likelihood of the diseases included in this category. CUMULATIVE TRAUMA: This is the class of claims generated by repetitive motion. The general class of cumulative trauma claims is composed of three subgroups: inflammatory diseases, nerve-related diseases, and sprain/strain/tear-related injuries. INFLAMMATORY DISEASES: This is class of diseases with symptoms characterized by
inflammation. Inflammation is pain, heat, redness, and swelling, resulting in loss of function of a specific body part.
BURSITIS: There are 5,149 claims for this disease. Bursa are small sacs of fluid located at key points where muscle and tendons slide across bone, and promote frictionless movement. Bursitis is the inflammation of one or more bursa. Seventy-three percent of these claims are elbow related and 17% are shoulder related, with the remaining claims generally associated with upper body parts and the back. EPICONDYLITIS: There are 2,384 claims for this disease. The epicondyle is a bony protrusion at the end of the humerus in the elbow joint. Ligaments attached to the epicondyle in the humerus and the bones in the lower arm form the elbow joint. Epicondylitis is the inflammation of the area of the epicondyle where the ligaments attach. “Tennis Elbow” commonly refers to epicondylitis originating from the epicondyle on the outer portion of the elbow. “Golfer’s Elbow” commonly refers to epicondylitis originating from the epicondyle on the inner portion of the elbow. Almost all claims have the elbow coded as the affected body part. The remaining data shows other body parts; however, this information is likely incorrect, by definition. TENDONITIS: There are 14,944 claims of this type. Tendonitis is inflammation of tendons, which are fibrous tissue that join muscles to bone (as opposed to ligaments, which are fibrous tissue that attach bone to bone). Ninety-five percent of all tendonitis claims are due to upper body parts: 34% involve the wrist, 26% the shoulder, 11% the arm, 9% the elbow, and 15% involve other upper body parts. TENOSYNOVITIS: There are 351 claims of this type. Tenosynovitis is the inflammation of a fluid-filled sheath that surrounds the tendon. Eighty percent of the claims are specifically identified with the hand, wrist, or fingers. One-third of the claims are labelled as De Quervain’s disease, which is tenosynovitis of the two tendons passing through the wrist that control the thumb. One-third of these claims are labelled as trigger finger, also known as stenosing tenosynovitis (this term was also found in the source data). Trigger finger is tenosynovitis of a tendon controlling finger movement. OTHER INFLAMMATION: there are 4,268 claims of this type. Roughly 95% of the claims have no disease description other than inflammation. The remaining 5% are composed of arthritis, ganglion cysts, myositis, capsulitis, synovitis, and bone spurs. The category

Occupational Disease Canadian Institute of Actuaries
Oliver Wyman Actuarial Consulting
Page 64
includes claims that impact primarily upper body parts, though there are a measurable number of knee injuries.
NERVE-RELATED DISEASES: Carpal tunnel syndrome is included in this category because the primary nature of the disease is nerve related. The remaining category, nerve disease, is a miscellaneous grouping of nerve-related diseases generated by repetitive motion.
CARPAL TUNNEL SYNDROME: There are 14,092 claims in this category, representing approximately 10% of the total claim volume in the study. The carpal tunnel is a passageway, defined by bones and tendons, on the underside of the wrist. The carpal tunnel connects the arm to the hand. The median nerve and tendons controlling finger movement pass through the carpal tunnel. Carpal tunnel syndrome results when there is compression to the median nerve due to inflammation or degeneration of any of the tendons passing through the carpal tunnel. The body parts listed for claims labelled and included in the data as carpal tunnel syndrome include the arm, fingers, wrist, shoulder, and hand. Nevertheless, carpal tunnel syndrome is a disease of the wrist. In circumstances when the data had other body parts for claims labelled as carpal tunnel, such as the knee, neck, or back, Oliver Wyman tested claim descriptions to verify the precise nature of the injury. The process mapped claims to the appropriate disease category when descriptions indicated an injury other than carpal tunnel syndrome.
NERVE DISEASE: There are 1,391 claims in this category. Approximately 73% of these claims are Raynaud’s Disease, or vibratory white finger disease. Long-term exposure to tool-related vibration causes this disease, which damages nerves in the fingers, which in turn results in circulatory problems. The majority of other claims in this category included numbness as an injury description with no specific disease listed. Approximately 90% of the claims are due to injuries to the wrist, hand, or fingers. Approximately 70% of the claims are associated with Vessel Operation. This is consistent with over-representation of this industry group in the source data (two of the five data sources are shipbuilding operations).
SPRAIN/STRAIN/TEAR: There are 24,558 claims in this category. The disease title is self-explanatory. These claims involve all body parts.
HERNIA: There are 1,161 claims in this category. Hernias are, by definition, a
sprain/strain/tear. These claims were isolated during the initial examination simply because of their number. Approximately 70% are associated with Vessel Operation.
OTHER CUMULATIVE TRAUMA: There are 3,411 claims in this category. Approximately 94%
of these claims have no description or general pain or soreness.

Occupational Disease Canadian Institute of Actuaries
Oliver Wyman Actuarial Consulting
Page 65
Understanding the Metrics Disease selection for liability determination must consider relative occurrence, or frequency, as well as average cost per claim, or severity, on both an overall basis as well as for the selected industry groups. Clearly, if a disease within the superset is of low frequency and cost overall as well as for all the individual industry groups, it is not a viable candidate. However, there are specific diseases with low relative occurrence and cost, but for which claims are concentrated in a specific industry group. In this latter situation, including this disease for the specific industry group in question is a reasonable consideration. The selected base metrics and presentation for each disease, using carpal tunnel syndrome as an example, follows this discussion. Results for each individual disease are included in Appendix E. The basic analysis provides calculations/tabulations of claim count, average cost, average age at report, and average lag for the following groups of claims:
Metric Claims Included
Raw Mean: All claims
Cut Off: Claims with cost equal to or less than 10% of the raw mean.
Adjusted Mean: All claims excluding cut-off claims.
Adj. X 5 Largest: All claims excluding cut-off claims as well as the five largest claims.
5 Largest: The five largest claims.
Largest: The largest claim.
These metrics provide information for all claims combined, information excluding the impact of low-cost claims, and information excluding the potential distortion of extraordinarily high cost claims. Low-cost claims presented an issue in the analysis, most notably because of a very high number of zero- or minimal-cost claims, even for extraordinarily complex diseases such as cancer. One reason for zero- or minimal-cost claims is incomplete data, according to one data source. Nevertheless, low-cost claims data was included because it contained viable information on lag and age at claim report. The approach of examining metrics including and excluding claims systemically provides unedited information as well as insight into the impact of low-cost claims, without introducing a bias into the analysis by simply excluding groups of data because the cost (or any other metric) does not appear to be sensible. Additionally, there is an analysis of lag for each industry group. The analysis calculates the average age and average lag for all claims, for claims with lag less than or equal to two years, and for claims with lag greater than two years. The distribution of claims by lag is included as well. This basic analysis provides key insight into the underlying latency as regards time between last exposure to loss and the date the disease emerges. The distribution by gender is also included.

Occupational Disease Canadian Institute of Actuaries
Oliver Wyman Actuarial Consulting
Page 66
The graphical presentations show distribution of claim reports by age and the distribution of claim costs as a percentage of the raw mean. Distribution of costs as a percentage of the raw mean provides a method of easily comparing distributions for diseases with materially different average claim costs. It also readily identifies diseases potentially distorted by low-cost claims. Matrix Analysis of Key Metrics Appendix D provides a series of matrices showing key metrics by disease. The grouping of diseases by matrix anticipates recommendations for combining disease types presented later in this report. The key metric information provided is as follows: COUNT Raw Mean Cut Off Adjusted Mean AVERAGE COST Raw Mean Cut Off Adjusted Mean Adjusted Excluding Five Largest Five Largest Largest AVERAGE AGE Raw Mean Adjusted Mean Lag <= 2 Years Lag >= 2 Years AVERAGE LAG Raw Mean Adjusted Mean Lag <= 2 Years Lag > 2 Years % Claims <= 2 Years % Claims > 2 Years

Occupational Disease Canadian Institute of Actuaries
Oliver Wyman Actuarial Consulting
Page 67
Matrix Analysis by Disease Type and Industry Group Appendix C provides a series of matrices showing claim distribution and cost by disease type an industry group, described below: Distribution of Claims by Disease Type and Industry Group This displays the distribution of all claims in the database by disease type and industry group. Distribution of Claims by Disease Type and Industry Group, Normalized by Industry Group This is Exhibit 1, normalized by industry group. The sum of the percentages for each industry group is 100%. Distribution of Cost by Disease Type and Industry Group This displays the cost by disease type and industry group. Each cell is equal to the product of the corresponding claim count multiplied by the average cost per claim for the applicable disease type. The average cost per claim used for this analysis excludes all claims below the selected cut-off value and excludes the five largest claims. Distribution of Cost by Disease Type and Industry Group, Normalized by Industry Group This is Exhibit 4, normalized by industry group. The sum of the percentages for each industry group is 100%.

Occupational Disease Canadian Institute of Actuaries
Oliver Wyman Actuarial Consulting
Page 68
Distribution and Use Usage and Responsibility of Client – This report was prepared for the sole use of the client. All
decisions in connection with the implementation or use of advice or recommendations contained in this report are the sole responsibility of the client.
Circulation or Publication – This report, if distributed, must be distributed in its entirety. Third-Party Reliance and Due Diligence – Distribution of this report to parties other than the
client does not constitute advice by Oliver Wyman to any such third parties and shall be solely for informational purposes and not for purposes of reliance by any such third parties. Oliver Wyman assumes no liability related to third-party use of this report or any actions taken or decisions made as a consequence of the results, advice, or recommendations set forth herein. This report should not replace the due diligence on behalf of any such third party.
Public Dissemination – Neither all nor any part of the contents of this report, any opinions
expressed herein, or the firm with which this report is connected, shall be disseminated to the public through advertising media, public relations, news media, sales media, mail, direct transmittal, or any other public means of communications, without the prior written consent of Oliver Wyman. Release of Report – Except as may have otherwise been agreed in the written agreement
pursuant to which this report has been issued, our permission is granted for the client’s release of this report to its directors, officers, employees, auditors, insurance brokers, commercial insurance carriers, reinsurers, and consultants who have a need to know and are bound by reasonable obligations of confidentiality. Except as may have otherwise been agreed in the written agreement pursuant to which this report has been issued, distribution to parties other than those specifically mentioned is prohibited without our prior written consent.

Occupational Disease Canadian Institute of Actuaries
Oliver Wyman Actuarial Consulting
Page 69
Appendix A: Acknowledgement of Qualification I, Scott J. Lefkowitz, am a Partner for Oliver Wyman Actuarial Consulting Inc. I am a member of the American Academy of Actuaries, a Fellow of the Casualty Actuarial Society, and a Fellow of the Conference of Consulting Actuaries. I meet the Qualification Standards of the American Academy of Actuaries to render the actuarial opinion contained herein. ______________________________ Scott J. Lefkowitz, FCAS, MAAA, FCA

Occupational Disease Canadian Institute of Actuaries
Oliver Wyman Actuarial Consulting
Page 70
Appendix B: Basic Metrics The following are the basic metric analysis for each identified disease.

Occupational Disease Canadian Institute of Actuaries
Oliver Wyman Actuarial Consulting
Page 71
AVERAGE AVERAGE AVERAGE
COUNT COST AGE LAG (DAYS)
RAW MEAN 22,092 29,951 42 122
CUT OFF 1,912 2,995
ADJ MEAN 20,180 32,555 42 124
ADJ X 5 LARGEST 20,175 32,158 42 124
5 LARGEST 5 1,637,173 46 55
LARGEST 1 2,394,022 39 3
ALL LAG <= 2 Yrs LAG > 2 Yrs
AVERAGE AGE 42 42 47
AVERAGE LAG (YEARS) 0.3 0.2 5.0
COUNT 21,705 21,008 697
COUNT PERCENTAGE 97% 3%
M F U
GENDER 11,056 10,869 167
GENDER PERCENTAGE 50% 49% 1%
CARPAL TUNNEL SYNDROME
COUNT PERCENTAGE
AGRICULTURE / FARMING / AQUACULTURE 146 1%
AIRCRAFT OPERATION, SERVICE, MANUFACTURING, OR REPAIR 105 0%
ANIMAL CARE, TRAINING, BREEDING, BOARDING 39 0%
AUTOMOBILE SALES, SERVICE, MANUFACTURING, OR REPAIR 1,096 5%
BUILDING MAINTAINENCE AND OPERATIONS 440 2%
CLERICAL 1,424 6%
CONSTRUCTION 736 3%
CONTRACTING 1,648 7%
EDUCATION AND RELIGIOUS INSTITUTIONS 622 3%
FIREFIGHTER 17 0%
FOOD MANUFACTURING 1,473 7%
FOOD SERVICE 1,031 5%
GENERAL SERVICES 165 1%
GOVERNMENT 1,764 8%
HEALTH CARE SERVICES 1,360 6%
HOSPITALITY AND ENTERTAINMENT 641 3%
LANDSCAPING 98 0%
LIVESTOCK AND POULTRY FARMING 111 1%
LOGGING AND TREE SERVICE 285 1%
MANUFACTURING GENERAL 3,667 17%
MARINE TERMINAL OPERATION 89 0%
MOTOR VEHICLE OPERATION OTHER THAN TRUCKING 162 1%
NATURAL RESOURCE EXTRACTION, REFINING, STORAGE, TRANSPORT 458 2%
POLICE OFFICERS 29 0%
RETAIL SERVICES 406 2%
SOCIAL SERVICES 284 1%
TELECOMMUNICATION AND BROADCASTING 111 1%
TRUCKING 360 2%
UNKNOWN 215 1%
UTILITY PRODUCTION, DISTRIBUTION, MAINTAINENCE 103 0%
VEHICLE OTHER THAN AUTOMOBILE SALES, SERVICE, MANUFACTURING, OR REPAIR 48 0%
VESSEL OPERATION, SERVICE, MANUFACTURING, OR REPAIR 1,474 7%
WHOLESALE AND RETAIL GENERAL 1,485 7%
CARPAL TUNNEL SYNDROME

Occupational Disease Canadian Institute of Actuaries
Oliver Wyman Actuarial Consulting
Page 72
0.00
0.20
0.40
0.60
0.80
1.00
20 25 30 35 40 45 50 55 60 65 70 75 80 85 90 95 100
Rela
tive
Clai
m C
ount
Age at Report
CARPAL TUNNEL SYNDROMEAge at Report
0.00
0.20
0.40
0.60
0.80
Rela
tive
Clai
m C
ount
Cost as Measured of Portion of Raw Mean
CARPAL TUNNEL SYNDROMECost Distribution at 2013 Cost Level Relative to Raw Mean
Raw Mean = $29,951

Occupational Disease Canadian Institute of Actuaries
Oliver Wyman Actuarial Consulting
Page 73
AVERAGE AVERAGE AVERAGE
COUNT COST AGE LAG (DAYS)
RAW MEAN 5,149 31,182 43 33
CUT OFF 744 3,118
ADJ MEAN 4,405 36,025 43 34
ADJ X 5 LARGEST 4,400 34,742 43 34
5 LARGEST 5 1,164,316 42 51
LARGEST 1 1,478,077 31 5
ALL LAG <= 2 Yrs LAG > 2 Yrs
AVERAGE AGE 43 43 46
AVERAGE LAG (YEARS) 0.1 0.1 3.2
COUNT 5,081 5,064 17
COUNT PERCENTAGE 100% 0%
M F U
GENDER 3,165 1,966 18
GENDER PERCENTAGE 61% 38% 0%
BURSITIS
COUNT PERCENTAGE
AGRICULTURE / FARMING / AQUACULTURE 63 1%
AIRCRAFT OPERATION, SERVICE, MANUFACTURING, OR REPAIR 63 1%
ANIMAL CARE, TRAINING, BREEDING, BOARDING 5 0%
AUTOMOBILE SALES, SERVICE, MANUFACTURING, OR REPAIR 182 4%
BUILDING MAINTAINENCE AND OPERATIONS 80 2%
CLERICAL 69 1%
CONSTRUCTION 124 2%
CONTRACTING 747 15%
EDUCATION AND RELIGIOUS INSTITUTIONS 192 4%
FIREFIGHTER 1 0%
FOOD MANUFACTURING 195 4%
FOOD SERVICE 139 3%
GENERAL SERVICES 46 1%
GOVERNMENT 342 7%
HEALTH CARE SERVICES 385 7%
HOSPITALITY AND ENTERTAINMENT 207 4%
LANDSCAPING 43 1%
LIVESTOCK AND POULTRY FARMING 48 1%
LOGGING AND TREE SERVICE 129 3%
MANUFACTURING GENERAL 853 17%
MARINE TERMINAL OPERATION 29 1%
MOTOR VEHICLE OPERATION OTHER THAN TRUCKING 58 1%
NATURAL RESOURCE EXTRACTION, REFINING, STORAGE, TRANSPORT 55 1%
POLICE OFFICERS 5 0%
RETAIL SERVICES 66 1%
SOCIAL SERVICES 48 1%
TELECOMMUNICATION AND BROADCASTING 42 1%
TRUCKING 46 1%
UNKNOWN 2 0%
UTILITY PRODUCTION, DISTRIBUTION, MAINTAINENCE 15 0%
VEHICLE OTHER THAN AUTOMOBILE SALES, SERVICE, MANUFACTURING, OR REPAIR 19 0%
VESSEL OPERATION, SERVICE, MANUFACTURING, OR REPAIR 164 3%
WHOLESALE AND RETAIL GENERAL 687 13%
BURSITIS

Occupational Disease Canadian Institute of Actuaries
Oliver Wyman Actuarial Consulting
Page 74
0.00
0.20
0.40
0.60
0.80
1.00
20 25 30 35 40 45 50 55 60 65 70 75 80 85 90 95 100
Rela
tive
Clai
m C
ount
Age at Report
BURSITISAge at Report
0.00
0.20
0.40
0.60
0.80
Rela
tive
Clai
m C
ount
Cost as Measured of Portion of Raw Mean
BURSITISCost Distribution at 2013 Cost Level Relative to Raw Mean
Raw Mean = $31,182

Occupational Disease Canadian Institute of Actuaries
Oliver Wyman Actuarial Consulting
Page 75
AVERAGE AVERAGE AVERAGE
COUNT COST AGE LAG (DAYS)
RAW MEAN 2,384 26,287 44 57
CUT OFF 238 2,629
ADJ MEAN 2,146 28,949 44 59
ADJ X 5 LARGEST 2,141 27,305 44 58
5 LARGEST 5 732,837 41 586
LARGEST 1 1,036,253 39 224
ALL LAG <= 2 Yrs LAG > 2 Yrs
AVERAGE AGE 44 44 45
AVERAGE LAG (YEARS) 0.2 0.1 4.0
COUNT 2,381 2,364 17
COUNT PERCENTAGE 99% 1%
M F U
GENDER 49 47 2
GENDER PERCENTAGE 50% 48% 2%
EPICONDYLITIS
COUNT PERCENTAGE
AGRICULTURE / FARMING / AQUACULTURE 2 0%
AIRCRAFT OPERATION, SERVICE, MANUFACTURING, OR REPAIR 32 1%
ANIMAL CARE, TRAINING, BREEDING, BOARDING 1 0%
AUTOMOBILE SALES, SERVICE, MANUFACTURING, OR REPAIR 100 4%
BUILDING MAINTAINENCE AND OPERATIONS 29 1%
CLERICAL 27 1%
CONSTRUCTION 112 5%
CONTRACTING 179 8%
EDUCATION AND RELIGIOUS INSTITUTIONS 87 4%
FIREFIGHTER 0 0%
FOOD MANUFACTURING 290 12%
FOOD SERVICE 113 5%
GENERAL SERVICES 50 2%
GOVERNMENT 205 9%
HEALTH CARE SERVICES 196 8%
HOSPITALITY AND ENTERTAINMENT 84 4%
LANDSCAPING 8 0%
LIVESTOCK AND POULTRY FARMING 0 0%
LOGGING AND TREE SERVICE 5 0%
MANUFACTURING GENERAL 345 14%
MARINE TERMINAL OPERATION 21 1%
MOTOR VEHICLE OPERATION OTHER THAN TRUCKING 17 1%
NATURAL RESOURCE EXTRACTION, REFINING, STORAGE, TRANSPORT 68 3%
POLICE OFFICERS 5 0%
RETAIL SERVICES 30 1%
SOCIAL SERVICES 78 3%
TELECOMMUNICATION AND BROADCASTING 21 1%
TRUCKING 58 2%
UNKNOWN 6 0%
UTILITY PRODUCTION, DISTRIBUTION, MAINTAINENCE 13 1%
VEHICLE OTHER THAN AUTOMOBILE SALES, SERVICE, MANUFACTURING, OR REPAIR 7 0%
VESSEL OPERATION, SERVICE, MANUFACTURING, OR REPAIR 8 0%
WHOLESALE AND RETAIL GENERAL 187 8%
EPICONDYLITIS

Occupational Disease Canadian Institute of Actuaries
Oliver Wyman Actuarial Consulting
Page 76
0.00
0.20
0.40
0.60
0.80
1.00
20 25 30 35 40 45 50 55 60 65 70 75 80 85 90 95 100
Rela
tive
Clai
m C
ount
Age at Report
EPICONDYLITISAge at Report
0.00
0.20
0.40
0.60
0.80
Rela
tive
Clai
m C
ount
Cost as Measured of Portion of Raw Mean
EPICONDYLITISCost Distribution at 2013 Cost Level Relative to Raw Mean
Raw Mean = $26,287

Occupational Disease Canadian Institute of Actuaries
Oliver Wyman Actuarial Consulting
Page 77
AVERAGE AVERAGE AVERAGE
COUNT COST AGE LAG (DAYS)
RAW MEAN 14,944 25,517 40 35
CUT OFF 1,490 2,552
ADJ MEAN 13,454 28,092 40 37
ADJ X 5 LARGEST 13,449 27,613 40 37
5 LARGEST 5 1,316,688 37 8
LARGEST 1 1,686,616 41 2
ALL LAG <= 2 Yrs LAG > 2 Yrs
AVERAGE AGE 40 40 48
AVERAGE LAG (YEARS) 0.1 0.1 3.7
COUNT 14,883 14,814 69
COUNT PERCENTAGE 100% 0%
M F U
GENDER 6,708 8,169 67
GENDER PERCENTAGE 45% 55% 0%
TENDONITIS
COUNT PERCENTAGE
AGRICULTURE / FARMING / AQUACULTURE 228 2%
AIRCRAFT OPERATION, SERVICE, MANUFACTURING, OR REPAIR 175 1%
ANIMAL CARE, TRAINING, BREEDING, BOARDING 16 0%
AUTOMOBILE SALES, SERVICE, MANUFACTURING, OR REPAIR 341 2%
BUILDING MAINTAINENCE AND OPERATIONS 161 1%
CLERICAL 293 2%
CONSTRUCTION 331 2%
CONTRACTING 1,167 8%
EDUCATION AND RELIGIOUS INSTITUTIONS 512 3%
FIREFIGHTER 2 0%
FOOD MANUFACTURING 1,546 10%
FOOD SERVICE 650 4%
GENERAL SERVICES 209 1%
GOVERNMENT 1,053 7%
HEALTH CARE SERVICES 1,413 9%
HOSPITALITY AND ENTERTAINMENT 582 4%
LANDSCAPING 119 1%
LIVESTOCK AND POULTRY FARMING 152 1%
LOGGING AND TREE SERVICE 344 2%
MANUFACTURING GENERAL 2,426 16%
MARINE TERMINAL OPERATION 77 1%
MOTOR VEHICLE OPERATION OTHER THAN TRUCKING 89 1%
NATURAL RESOURCE EXTRACTION, REFINING, STORAGE, TRANSPORT 186 1%
POLICE OFFICERS 19 0%
RETAIL SERVICES 325 2%
SOCIAL SERVICES 210 1%
TELECOMMUNICATION AND BROADCASTING 115 1%
TRUCKING 118 1%
UNKNOWN 9 0%
UTILITY PRODUCTION, DISTRIBUTION, MAINTAINENCE 40 0%
VEHICLE OTHER THAN AUTOMOBILE SALES, SERVICE, MANUFACTURING, OR REPAIR 30 0%
VESSEL OPERATION, SERVICE, MANUFACTURING, OR REPAIR 138 1%
WHOLESALE AND RETAIL GENERAL 1,868 13%
TENDONITIS

Occupational Disease Canadian Institute of Actuaries
Oliver Wyman Actuarial Consulting
Page 78
0.00
0.20
0.40
0.60
0.80
1.00
20 25 30 35 40 45 50 55 60 65 70 75 80 85 90 95 100
Rela
tive
Clai
m C
ount
Age at Report
TENDONITISAge at Report
0.00
0.10
0.20
0.30
0.40
0.50
Rela
tive
Clai
m C
ount
Cost as Measured of Portion of Raw Mean
TENDONITISCost Distribution at 2013 Cost Level Relative to Raw Mean
Raw Mean = $25,517

Occupational Disease Canadian Institute of Actuaries
Oliver Wyman Actuarial Consulting
Page 79
AVERAGE AVERAGE AVERAGE
COUNT COST AGE LAG (DAYS)
RAW MEAN 351 28,215 41 63
CUT OFF 55 2,821
ADJ MEAN 296 33,014 42 69
ADJ X 5 LARGEST 291 24,209 42 67
5 LARGEST 5 545,484 34 223
LARGEST 1 955,931 35 6
ALL LAG <= 2 Yrs LAG > 2 Yrs
AVERAGE AGE 41 41 49
AVERAGE LAG (YEARS) 0.2 0.1 3.8
COUNT 327 323 4
COUNT PERCENTAGE 99% 1%
M F U
GENDER 140 206 5
GENDER PERCENTAGE 40% 59% 1%
TENOSYNOVITIS
COUNT PERCENTAGE
AGRICULTURE / FARMING / AQUACULTURE 2 1%
AIRCRAFT OPERATION, SERVICE, MANUFACTURING, OR REPAIR 2 1%
ANIMAL CARE, TRAINING, BREEDING, BOARDING 0 0%
AUTOMOBILE SALES, SERVICE, MANUFACTURING, OR REPAIR 12 3%
BUILDING MAINTAINENCE AND OPERATIONS 5 1%
CLERICAL 14 4%
CONSTRUCTION 11 3%
CONTRACTING 13 4%
EDUCATION AND RELIGIOUS INSTITUTIONS 16 5%
FIREFIGHTER 1 0%
FOOD MANUFACTURING 71 20%
FOOD SERVICE 23 7%
GENERAL SERVICES 1 0%
GOVERNMENT 18 5%
HEALTH CARE SERVICES 26 7%
HOSPITALITY AND ENTERTAINMENT 9 3%
LANDSCAPING 1 0%
LIVESTOCK AND POULTRY FARMING 0 0%
LOGGING AND TREE SERVICE 2 1%
MANUFACTURING GENERAL 56 16%
MARINE TERMINAL OPERATION 1 0%
MOTOR VEHICLE OPERATION OTHER THAN TRUCKING 0 0%
NATURAL RESOURCE EXTRACTION, REFINING, STORAGE, TRANSPORT 7 2%
POLICE OFFICERS 1 0%
RETAIL SERVICES 10 3%
SOCIAL SERVICES 3 1%
TELECOMMUNICATION AND BROADCASTING 4 1%
TRUCKING 5 1%
UNKNOWN 0 0%
UTILITY PRODUCTION, DISTRIBUTION, MAINTAINENCE 0 0%
VEHICLE OTHER THAN AUTOMOBILE SALES, SERVICE, MANUFACTURING, OR REPAIR 0 0%
VESSEL OPERATION, SERVICE, MANUFACTURING, OR REPAIR 10 3%
WHOLESALE AND RETAIL GENERAL 27 8%
TENOSYNOVITIS

Occupational Disease Canadian Institute of Actuaries
Oliver Wyman Actuarial Consulting
Page 80
0.00
0.20
0.40
0.60
0.80
1.00
20 25 30 35 40 45 50 55 60 65 70 75 80 85 90 95 100
Rela
tive
Clai
m C
ount
Age at Report
TENOSYNOVITISAge at Report
0.00
0.10
0.20
0.30
0.40
0.50
Rela
tive
Clai
m C
ount
Cost as Measured of Portion of Raw Mean
TENOSYNOVITISCost Distribution at 2013 Cost Level Relative to Raw Mean
Raw Mean = $28,215

Occupational Disease Canadian Institute of Actuaries
Oliver Wyman Actuarial Consulting
Page 81
AVERAGE AVERAGE AVERAGE
COUNT COST AGE LAG (DAYS)
RAW MEAN 4,268 28,386 44 115
CUT OFF 584 2,839
ADJ MEAN 3,684 32,507 44 122
ADJ X 5 LARGEST 3,679 30,381 44 122
5 LARGEST 5 1,597,070 40 169
LARGEST 1 3,645,086 39 748
ALL LAG <= 2 Yrs LAG > 2 Yrs
AVERAGE AGE 44 43 49
AVERAGE LAG (YEARS) 0.3 0.2 5.8
COUNT 3,707 3,605 102
COUNT PERCENTAGE 97% 3%
M F U
GENDER 2,187 2,050 31
GENDER PERCENTAGE 51% 48% 1%
OTHER INFLAMMATION
COUNT PERCENTAGE
AGRICULTURE / FARMING / AQUACULTURE 24 1%
AIRCRAFT OPERATION, SERVICE, MANUFACTURING, OR REPAIR 12 0%
ANIMAL CARE, TRAINING, BREEDING, BOARDING 8 0%
AUTOMOBILE SALES, SERVICE, MANUFACTURING, OR REPAIR 204 5%
BUILDING MAINTAINENCE AND OPERATIONS 152 4%
CLERICAL 252 6%
CONSTRUCTION 126 3%
CONTRACTING 366 9%
EDUCATION AND RELIGIOUS INSTITUTIONS 78 2%
FIREFIGHTER 6 0%
FOOD MANUFACTURING 258 6%
FOOD SERVICE 228 5%
GENERAL SERVICES 34 1%
GOVERNMENT 398 9%
HEALTH CARE SERVICES 310 7%
HOSPITALITY AND ENTERTAINMENT 113 3%
LANDSCAPING 5 0%
LIVESTOCK AND POULTRY FARMING 6 0%
LOGGING AND TREE SERVICE 64 1%
MANUFACTURING GENERAL 755 18%
MARINE TERMINAL OPERATION 9 0%
MOTOR VEHICLE OPERATION OTHER THAN TRUCKING 55 1%
NATURAL RESOURCE EXTRACTION, REFINING, STORAGE, TRANSPORT 27 1%
POLICE OFFICERS 12 0%
RETAIL SERVICES 89 2%
SOCIAL SERVICES 49 1%
TELECOMMUNICATION AND BROADCASTING 7 0%
TRUCKING 98 2%
UNKNOWN 76 2%
UTILITY PRODUCTION, DISTRIBUTION, MAINTAINENCE 28 1%
VEHICLE OTHER THAN AUTOMOBILE SALES, SERVICE, MANUFACTURING, OR REPAIR 5 0%
VESSEL OPERATION, SERVICE, MANUFACTURING, OR REPAIR 123 3%
WHOLESALE AND RETAIL GENERAL 291 7%
OTHER INFLAMMATION

Occupational Disease Canadian Institute of Actuaries
Oliver Wyman Actuarial Consulting
Page 82
0.00
0.20
0.40
0.60
0.80
1.00
20 25 30 35 40 45 50 55 60 65 70 75 80 85 90 95 100
Rela
tive
Clai
m C
ount
Age at Report
OTHER INFLAMMATIONAge at Report
0.00
0.10
0.20
0.30
0.40
0.50
Rela
tive
Clai
m C
ount
Cost as Measured of Portion of Raw Mean
OTHER INFLAMMATIONCost Distribution at 2013 Cost Level Relative to Raw Mean
Raw Mean = $28,386

Occupational Disease Canadian Institute of Actuaries
Oliver Wyman Actuarial Consulting
Page 83
AVERAGE AVERAGE AVERAGE
COUNT COST AGE LAG (DAYS)
RAW MEAN 1,161 19,917 44 96
CUT OFF 0 1,992
ADJ MEAN 1,161 19,917 44 96
ADJ X 5 LARGEST 1,156 17,693 44 96
5 LARGEST 5 534,013 48 58
LARGEST 1 1,187,016 40 90
ALL LAG <= 2 Yrs LAG > 2 Yrs
AVERAGE AGE 44 44 44
AVERAGE LAG (YEARS) 0.3 0.2 4.3
COUNT 1,054 1,031 23
COUNT PERCENTAGE 98% 2%
M F U
GENDER 1,131 28 2
GENDER PERCENTAGE 97% 2% 0%
HERNIA
COUNT PERCENTAGE
AGRICULTURE / FARMING / AQUACULTURE 1 0%
AIRCRAFT OPERATION, SERVICE, MANUFACTURING, OR REPAIR 0 0%
ANIMAL CARE, TRAINING, BREEDING, BOARDING 0 0%
AUTOMOBILE SALES, SERVICE, MANUFACTURING, OR REPAIR 35 3%
BUILDING MAINTAINENCE AND OPERATIONS 11 1%
CLERICAL 0 0%
CONSTRUCTION 18 2%
CONTRACTING 32 3%
EDUCATION AND RELIGIOUS INSTITUTIONS 0 0%
FIREFIGHTER 1 0%
FOOD MANUFACTURING 4 0%
FOOD SERVICE 14 1%
GENERAL SERVICES 2 0%
GOVERNMENT 17 1%
HEALTH CARE SERVICES 5 0%
HOSPITALITY AND ENTERTAINMENT 9 1%
LANDSCAPING 3 0%
LIVESTOCK AND POULTRY FARMING 4 0%
LOGGING AND TREE SERVICE 8 1%
MANUFACTURING GENERAL 81 7%
MARINE TERMINAL OPERATION 0 0%
MOTOR VEHICLE OPERATION OTHER THAN TRUCKING 4 0%
NATURAL RESOURCE EXTRACTION, REFINING, STORAGE, TRANSPORT 0 0%
POLICE OFFICERS 1 0%
RETAIL SERVICES 2 0%
SOCIAL SERVICES 1 0%
TELECOMMUNICATION AND BROADCASTING 0 0%
TRUCKING 22 2%
UNKNOWN 7 1%
UTILITY PRODUCTION, DISTRIBUTION, MAINTAINENCE 0 0%
VEHICLE OTHER THAN AUTOMOBILE SALES, SERVICE, MANUFACTURING, OR REPAIR 0 0%
VESSEL OPERATION, SERVICE, MANUFACTURING, OR REPAIR 837 72%
WHOLESALE AND RETAIL GENERAL 42 4%
HERNIA

Occupational Disease Canadian Institute of Actuaries
Oliver Wyman Actuarial Consulting
Page 84
0.00
0.20
0.40
0.60
0.80
1.00
20 25 30 35 40 45 50 55 60 65 70 75 80 85 90 95 100
Rela
tive
Clai
m C
ount
Age at Report
HERNIAAge at Report
0.00
0.10
0.20
0.30
0.40
0.50
Rela
tive
Clai
m C
ount
Cost as Measured of Portion of Raw Mean
HERNIACost Distribution at 2013 Cost Level Relative to Raw Mean
Raw Mean = $19,917

Occupational Disease Canadian Institute of Actuaries
Oliver Wyman Actuarial Consulting
Page 85
AVERAGE AVERAGE AVERAGE
COUNT COST AGE LAG (DAYS)
RAW MEAN 24,558 33,022 42 107
CUT OFF 4,618 3,302
ADJ MEAN 19,940 40,069 43 119
ADJ X 5 LARGEST 19,935 39,014 43 118
5 LARGEST 5 4,248,385 38 1,629
LARGEST 1 5,717,959 66 5,264
ALL LAG <= 2 Yrs LAG > 2 Yrs
AVERAGE AGE 42 42 49
AVERAGE LAG (YEARS) 0.3 0.1 7.0
COUNT 23,008 22,439 569
COUNT PERCENTAGE 98% 2%
M F U
GENDER 14,507 9,699 352
GENDER PERCENTAGE 59% 39% 1%
SPRAIN/STRAIN/TEAR
COUNT PERCENTAGE
AGRICULTURE / FARMING / AQUACULTURE 56 0%
AIRCRAFT OPERATION, SERVICE, MANUFACTURING, OR REPAIR 136 1%
ANIMAL CARE, TRAINING, BREEDING, BOARDING 11 0%
AUTOMOBILE SALES, SERVICE, MANUFACTURING, OR REPAIR 805 3%
BUILDING MAINTAINENCE AND OPERATIONS 340 1%
CLERICAL 764 3%
CONSTRUCTION 537 2%
CONTRACTING 1,179 5%
EDUCATION AND RELIGIOUS INSTITUTIONS 611 2%
FIREFIGHTER 25 0%
FOOD MANUFACTURING 2,223 9%
FOOD SERVICE 572 2%
GENERAL SERVICES 208 1%
GOVERNMENT 1,645 7%
HEALTH CARE SERVICES 1,843 8%
HOSPITALITY AND ENTERTAINMENT 585 2%
LANDSCAPING 41 0%
LIVESTOCK AND POULTRY FARMING 16 0%
LOGGING AND TREE SERVICE 132 1%
MANUFACTURING GENERAL 2,726 11%
MARINE TERMINAL OPERATION 55 0%
MOTOR VEHICLE OPERATION OTHER THAN TRUCKING 217 1%
NATURAL RESOURCE EXTRACTION, REFINING, STORAGE, TRANSPORT 380 2%
POLICE OFFICERS 45 0%
RETAIL SERVICES 242 1%
SOCIAL SERVICES 411 2%
TELECOMMUNICATION AND BROADCASTING 83 0%
TRUCKING 429 2%
UNKNOWN 201 1%
UTILITY PRODUCTION, DISTRIBUTION, MAINTAINENCE 89 0%
VEHICLE OTHER THAN AUTOMOBILE SALES, SERVICE, MANUFACTURING, OR REPAIR 22 0%
VESSEL OPERATION, SERVICE, MANUFACTURING, OR REPAIR 6,692 27%
WHOLESALE AND RETAIL GENERAL 1,237 5%
SPRAIN/STRAIN/TEAR

Occupational Disease Canadian Institute of Actuaries
Oliver Wyman Actuarial Consulting
Page 86
0.00
0.20
0.40
0.60
0.80
1.00
20 25 30 35 40 45 50 55 60 65 70 75 80 85 90 95 100
Rela
tive
Clai
m C
ount
Age at Report
SPRAIN/STRAIN/TEARAge at Report
0.00
0.10
0.20
0.30
0.40
0.50
Rela
tive
Clai
m C
ount
Cost as Measured of Portion of Raw Mean
SPRAIN/STRAIN/TEARCost Distribution at 2013 Cost Level Relative to Raw Mean
Raw Mean = $33,022

Occupational Disease Canadian Institute of Actuaries
Oliver Wyman Actuarial Consulting
Page 87
AVERAGE AVERAGE AVERAGE
COUNT COST AGE LAG (DAYS)
RAW MEAN 3,411 29,689 42 102
CUT OFF 569 2,969
ADJ MEAN 2,842 35,147 43 108
ADJ X 5 LARGEST 2,837 32,761 43 108
5 LARGEST 5 1,388,614 35 56
LARGEST 1 1,813,565 0 0
ALL LAG <= 2 Yrs LAG > 2 Yrs
AVERAGE AGE 42 42 49
AVERAGE LAG (YEARS) 0.3 0.1 6.1
COUNT 3,277 3,205 72
COUNT PERCENTAGE 98% 2%
M F U
GENDER 1,735 1,647 29
GENDER PERCENTAGE 51% 48% 1%
CUMULATIVE ALL OTHER
COUNT PERCENTAGE
AGRICULTURE / FARMING / AQUACULTURE 7 0%
AIRCRAFT OPERATION, SERVICE, MANUFACTURING, OR REPAIR 22 1%
ANIMAL CARE, TRAINING, BREEDING, BOARDING 4 0%
AUTOMOBILE SALES, SERVICE, MANUFACTURING, OR REPAIR 127 4%
BUILDING MAINTAINENCE AND OPERATIONS 65 2%
CLERICAL 106 3%
CONSTRUCTION 116 3%
CONTRACTING 252 7%
EDUCATION AND RELIGIOUS INSTITUTIONS 128 4%
FIREFIGHTER 3 0%
FOOD MANUFACTURING 760 22%
FOOD SERVICE 106 3%
GENERAL SERVICES 43 1%
GOVERNMENT 303 9%
HEALTH CARE SERVICES 229 7%
HOSPITALITY AND ENTERTAINMENT 107 3%
LANDSCAPING 5 0%
LIVESTOCK AND POULTRY FARMING 2 0%
LOGGING AND TREE SERVICE 33 1%
MANUFACTURING GENERAL 422 12%
MARINE TERMINAL OPERATION 13 0%
MOTOR VEHICLE OPERATION OTHER THAN TRUCKING 28 1%
NATURAL RESOURCE EXTRACTION, REFINING, STORAGE, TRANSPORT 69 2%
POLICE OFFICERS 2 0%
RETAIL SERVICES 56 2%
SOCIAL SERVICES 68 2%
TELECOMMUNICATION AND BROADCASTING 12 0%
TRUCKING 77 2%
UNKNOWN 29 1%
UTILITY PRODUCTION, DISTRIBUTION, MAINTAINENCE 20 1%
VEHICLE OTHER THAN AUTOMOBILE SALES, SERVICE, MANUFACTURING, OR REPAIR 3 0%
VESSEL OPERATION, SERVICE, MANUFACTURING, OR REPAIR 4 0%
WHOLESALE AND RETAIL GENERAL 190 6%
CUMULATIVE ALL OTHER

Occupational Disease Canadian Institute of Actuaries
Oliver Wyman Actuarial Consulting
Page 88
0.00
0.20
0.40
0.60
0.80
1.00
20 25 30 35 40 45 50 55 60 65 70 75 80 85 90 95 100
Rela
tive
Clai
m C
ount
Age at Report
CUMULATIVE ALL OTHERAge at Report
0.00
0.10
0.20
0.30
0.40
0.50
Rela
tive
Clai
m C
ount
Cost as Measured of Portion of Raw Mean
CUMULATIVE ALL OTHERCost Distribution at 2013 Cost Level Relative to Raw Mean
Raw Mean = $29,689

Occupational Disease Canadian Institute of Actuaries
Oliver Wyman Actuarial Consulting
Page 89
AVERAGE AVERAGE AVERAGE
COUNT COST AGE LAG (DAYS)
RAW MEAN 2,228 166,223 64 1,431
CUT OFF 905 16,622
ADJ MEAN 1,323 277,441 66 1,535
ADJ X 5 LARGEST 1,318 267,089 66 1,515
5 LARGEST 5 3,006,278 59 6,741
LARGEST 1 5,318,207 55 7,540
ALL LAG <= 2 Yrs LAG > 2 Yrs
AVERAGE AGE 64 63 67
AVERAGE LAG (YEARS) 3.9 0.4 12.4
COUNT 2,159 1,524 635
COUNT PERCENTAGE 71% 29%
M F U
GENDER 2,164 36 28
GENDER PERCENTAGE 97% 2% 1%
ASBESTOSIS
COUNT PERCENTAGE
AGRICULTURE / FARMING / AQUACULTURE 0 0%
AIRCRAFT OPERATION, SERVICE, MANUFACTURING, OR REPAIR 3 0%
ANIMAL CARE, TRAINING, BREEDING, BOARDING 0 0%
AUTOMOBILE SALES, SERVICE, MANUFACTURING, OR REPAIR 16 1%
BUILDING MAINTAINENCE AND OPERATIONS 54 2%
CLERICAL 3 0%
CONSTRUCTION 202 9%
CONTRACTING 495 22%
EDUCATION AND RELIGIOUS INSTITUTIONS 22 1%
FIREFIGHTER 0 0%
FOOD MANUFACTURING 7 0%
FOOD SERVICE 0 0%
GENERAL SERVICES 38 2%
GOVERNMENT 62 3%
HEALTH CARE SERVICES 18 1%
HOSPITALITY AND ENTERTAINMENT 4 0%
LANDSCAPING 0 0%
LIVESTOCK AND POULTRY FARMING 0 0%
LOGGING AND TREE SERVICE 1 0%
MANUFACTURING GENERAL 221 10%
MARINE TERMINAL OPERATION 37 2%
MOTOR VEHICLE OPERATION OTHER THAN TRUCKING 0 0%
NATURAL RESOURCE EXTRACTION, REFINING, STORAGE, TRANSPORT 93 4%
POLICE OFFICERS 0 0%
RETAIL SERVICES 0 0%
SOCIAL SERVICES 1 0%
TELECOMMUNICATION AND BROADCASTING 1 0%
TRUCKING 9 0%
UNKNOWN 102 5%
UTILITY PRODUCTION, DISTRIBUTION, MAINTAINENCE 24 1%
VEHICLE OTHER THAN AUTOMOBILE SALES, SERVICE, MANUFACTURING, OR REPAIR 3 0%
VESSEL OPERATION, SERVICE, MANUFACTURING, OR REPAIR 787 35%
WHOLESALE AND RETAIL GENERAL 25 1%
ASBESTOSIS

Occupational Disease Canadian Institute of Actuaries
Oliver Wyman Actuarial Consulting
Page 90
0.00
0.20
0.40
0.60
0.80
1.00
20 25 30 35 40 45 50 55 60 65 70 75 80 85 90 95 100
Rela
tive
Clai
m C
ount
Age at Report
ASBESTOSISAge at Report
0.00
0.20
0.40
0.60
0.80
Rela
tive
Clai
m C
ount
Cost as Measured of Portion of Raw Mean
ASBESTOSISCost Distribution at 2013 Cost Level Relative to Raw Mean
Raw Mean = $166,223

Occupational Disease Canadian Institute of Actuaries
Oliver Wyman Actuarial Consulting
Page 91
AVERAGE AVERAGE AVERAGE
COUNT COST AGE LAG (DAYS)
RAW MEAN 935 273,907 68 619
CUT OFF 128 27,391
ADJ MEAN 807 316,188 68 446
ADJ X 5 LARGEST 802 307,663 68 448
5 LARGEST 5 1,683,616 60 206
LARGEST 1 2,069,935 63 50
ALL LAG <= 2 Yrs LAG > 2 Yrs
AVERAGE AGE 68 68 68
AVERAGE LAG (YEARS) 1.7 0.4 10.7
COUNT 934 815 119
COUNT PERCENTAGE 87% 13%
M F U
GENDER 894 36 5
GENDER PERCENTAGE 96% 4% 1%
MESOTHELIOMA
COUNT PERCENTAGE
AGRICULTURE / FARMING / AQUACULTURE 0 0%
AIRCRAFT OPERATION, SERVICE, MANUFACTURING, OR REPAIR 3 0%
ANIMAL CARE, TRAINING, BREEDING, BOARDING 0 0%
AUTOMOBILE SALES, SERVICE, MANUFACTURING, OR REPAIR 21 2%
BUILDING MAINTAINENCE AND OPERATIONS 15 2%
CLERICAL 7 1%
CONSTRUCTION 47 5%
CONTRACTING 236 25%
EDUCATION AND RELIGIOUS INSTITUTIONS 22 2%
FIREFIGHTER 0 0%
FOOD MANUFACTURING 6 1%
FOOD SERVICE 2 0%
GENERAL SERVICES 28 3%
GOVERNMENT 29 3%
HEALTH CARE SERVICES 13 1%
HOSPITALITY AND ENTERTAINMENT 8 1%
LANDSCAPING 1 0%
LIVESTOCK AND POULTRY FARMING 0 0%
LOGGING AND TREE SERVICE 4 0%
MANUFACTURING GENERAL 140 15%
MARINE TERMINAL OPERATION 17 2%
MOTOR VEHICLE OPERATION OTHER THAN TRUCKING 2 0%
NATURAL RESOURCE EXTRACTION, REFINING, STORAGE, TRANSPORT 66 7%
POLICE OFFICERS 1 0%
RETAIL SERVICES 2 0%
SOCIAL SERVICES 1 0%
TELECOMMUNICATION AND BROADCASTING 6 1%
TRUCKING 16 2%
UNKNOWN 52 6%
UTILITY PRODUCTION, DISTRIBUTION, MAINTAINENCE 14 1%
VEHICLE OTHER THAN AUTOMOBILE SALES, SERVICE, MANUFACTURING, OR REPAIR 0 0%
VESSEL OPERATION, SERVICE, MANUFACTURING, OR REPAIR 142 15%
WHOLESALE AND RETAIL GENERAL 34 4%
MESOTHELIOMA

Occupational Disease Canadian Institute of Actuaries
Oliver Wyman Actuarial Consulting
Page 92
0.00
0.20
0.40
0.60
0.80
1.00
20 25 30 35 40 45 50 55 60 65 70 75 80 85 90 95 100
Rela
tive
Clai
m C
ount
Age at Report
MESOTHELIOMAAge at Report
0.00
0.10
0.20
0.30
0.40
0.50
Rela
tive
Clai
m C
ount
Cost as Measured of Portion of Raw Mean
MESOTHELIOMACost Distribution at 2013 Cost Level Relative to Raw Mean
Raw Mean = $273,907

Occupational Disease Canadian Institute of Actuaries
Oliver Wyman Actuarial Consulting
Page 93
AVERAGE AVERAGE AVERAGE
COUNT COST AGE LAG (DAYS)
RAW MEAN 249 237,012 66 3,044
CUT OFF 84 23,701
ADJ MEAN 165 354,825 67 2,642
ADJ X 5 LARGEST 160 294,929 67 2,674
5 LARGEST 5 2,271,490 45 1,613
LARGEST 1 3,373,094 43 363
ALL LAG <= 2 Yrs LAG > 2 Yrs
AVERAGE AGE 66 62 68
AVERAGE LAG (YEARS) 8.3 0.5 13.2
COUNT 239 91 148
COUNT PERCENTAGE 38% 62%
M F U
GENDER 243 6 0
GENDER PERCENTAGE 98% 2% 0%
LUNG CANCER
COUNT PERCENTAGE
AGRICULTURE / FARMING / AQUACULTURE 0 0%
AIRCRAFT OPERATION, SERVICE, MANUFACTURING, OR REPAIR 0 0%
ANIMAL CARE, TRAINING, BREEDING, BOARDING 0 0%
AUTOMOBILE SALES, SERVICE, MANUFACTURING, OR REPAIR 1 0%
BUILDING MAINTAINENCE AND OPERATIONS 0 0%
CLERICAL 0 0%
CONSTRUCTION 4 2%
CONTRACTING 7 3%
EDUCATION AND RELIGIOUS INSTITUTIONS 3 1%
FIREFIGHTER 3 1%
FOOD MANUFACTURING 0 0%
FOOD SERVICE 1 0%
GENERAL SERVICES 6 2%
GOVERNMENT 10 4%
HEALTH CARE SERVICES 1 0%
HOSPITALITY AND ENTERTAINMENT 0 0%
LANDSCAPING 0 0%
LIVESTOCK AND POULTRY FARMING 0 0%
LOGGING AND TREE SERVICE 0 0%
MANUFACTURING GENERAL 11 4%
MARINE TERMINAL OPERATION 0 0%
MOTOR VEHICLE OPERATION OTHER THAN TRUCKING 0 0%
NATURAL RESOURCE EXTRACTION, REFINING, STORAGE, TRANSPORT 4 2%
POLICE OFFICERS 0 0%
RETAIL SERVICES 0 0%
SOCIAL SERVICES 0 0%
TELECOMMUNICATION AND BROADCASTING 0 0%
TRUCKING 0 0%
UNKNOWN 0 0%
UTILITY PRODUCTION, DISTRIBUTION, MAINTAINENCE 0 0%
VEHICLE OTHER THAN AUTOMOBILE SALES, SERVICE, MANUFACTURING, OR REPAIR 1 0%
VESSEL OPERATION, SERVICE, MANUFACTURING, OR REPAIR 195 78%
WHOLESALE AND RETAIL GENERAL 2 1%
LUNG CANCER

Occupational Disease Canadian Institute of Actuaries
Oliver Wyman Actuarial Consulting
Page 94
0.00
0.20
0.40
0.60
0.80
1.00
20 25 30 35 40 45 50 55 60 65 70 75 80 85 90 95 100
Rela
tive
Clai
m C
ount
Age at Report
LUNG CANCERAge at Report
0.00
0.20
0.40
0.60
0.80
Rela
tive
Clai
m C
ount
Cost as Measured of Portion of Raw Mean
LUNG CANCERCost Distribution at 2013 Cost Level Relative to Raw Mean
Raw Mean = $237,012

Occupational Disease Canadian Institute of Actuaries
Oliver Wyman Actuarial Consulting
Page 95
AVERAGE AVERAGE AVERAGE
COUNT COST AGE LAG (DAYS)
RAW MEAN 3,795 84,006 44 456
CUT OFF 2,075 8,401
ADJ MEAN 1,720 181,735 48 574
ADJ X 5 LARGEST 1,715 168,024 48 571
5 LARGEST 5 4,884,754 43 1,507
LARGEST 1 7,187,645 55 7,316
ALL LAG <= 2 Yrs LAG > 2 Yrs
AVERAGE AGE 44 43 59
AVERAGE LAG (YEARS) 1.2 0.2 9.9
COUNT 3,416 3,046 370
COUNT PERCENTAGE 89% 11%
M F U
GENDER 3,003 783 9
GENDER PERCENTAGE 79% 21% 0%
RESPIRATORY ALL OTHER
COUNT PERCENTAGE
AGRICULTURE / FARMING / AQUACULTURE 14 0%
AIRCRAFT OPERATION, SERVICE, MANUFACTURING, OR REPAIR 21 1%
ANIMAL CARE, TRAINING, BREEDING, BOARDING 1 0%
AUTOMOBILE SALES, SERVICE, MANUFACTURING, OR REPAIR 206 5%
BUILDING MAINTAINENCE AND OPERATIONS 101 3%
CLERICAL 59 2%
CONSTRUCTION 151 4%
CONTRACTING 241 6%
EDUCATION AND RELIGIOUS INSTITUTIONS 109 3%
FIREFIGHTER 25 1%
FOOD MANUFACTURING 107 3%
FOOD SERVICE 33 1%
GENERAL SERVICES 64 2%
GOVERNMENT 271 7%
HEALTH CARE SERVICES 181 5%
HOSPITALITY AND ENTERTAINMENT 56 1%
LANDSCAPING 4 0%
LIVESTOCK AND POULTRY FARMING 7 0%
LOGGING AND TREE SERVICE 23 1%
MANUFACTURING GENERAL 588 15%
MARINE TERMINAL OPERATION 15 0%
MOTOR VEHICLE OPERATION OTHER THAN TRUCKING 14 0%
NATURAL RESOURCE EXTRACTION, REFINING, STORAGE, TRANSPORT 203 5%
POLICE OFFICERS 13 0%
RETAIL SERVICES 43 1%
SOCIAL SERVICES 25 1%
TELECOMMUNICATION AND BROADCASTING 5 0%
TRUCKING 94 2%
UNKNOWN 99 3%
UTILITY PRODUCTION, DISTRIBUTION, MAINTAINENCE 7 0%
VEHICLE OTHER THAN AUTOMOBILE SALES, SERVICE, MANUFACTURING, OR REPAIR 8 0%
VESSEL OPERATION, SERVICE, MANUFACTURING, OR REPAIR 880 23%
WHOLESALE AND RETAIL GENERAL 127 3%
RESPIRATORY ALL OTHER
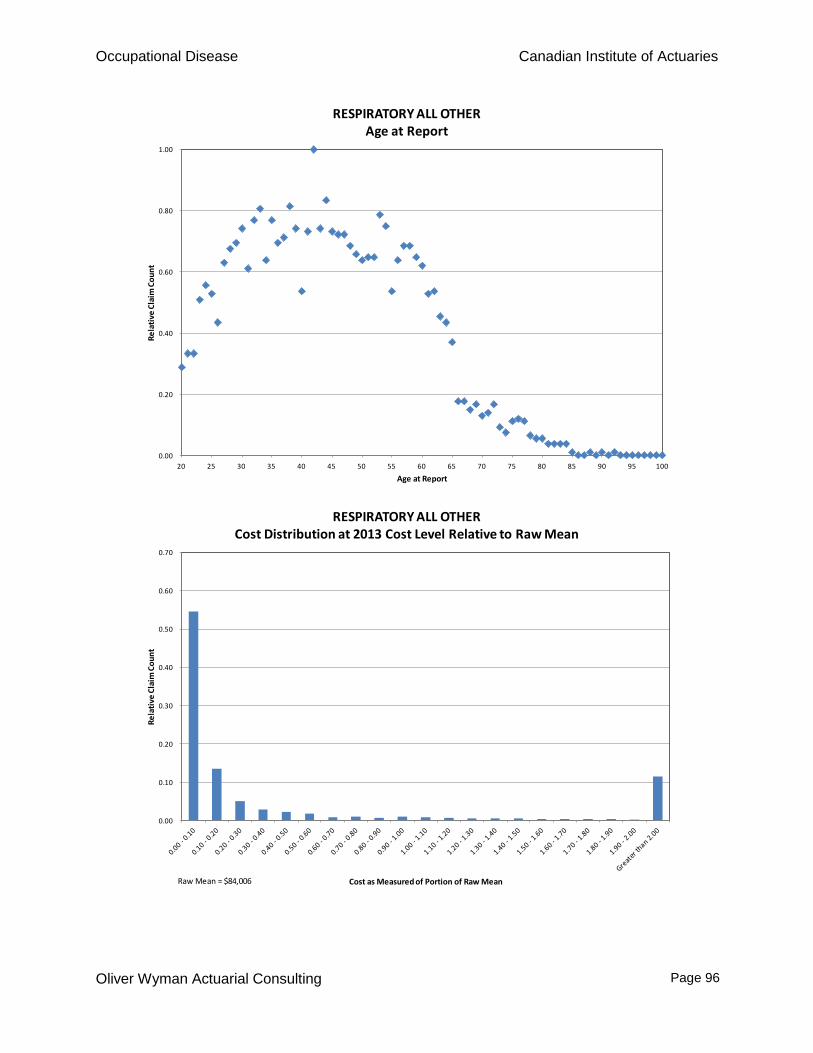
Occupational Disease Canadian Institute of Actuaries
Oliver Wyman Actuarial Consulting
Page 96
0.00
0.20
0.40
0.60
0.80
1.00
20 25 30 35 40 45 50 55 60 65 70 75 80 85 90 95 100
Rela
tive
Clai
m C
ount
Age at Report
RESPIRATORY ALL OTHERAge at Report
0.00
0.10
0.20
0.30
0.40
0.50
0.60
0.70
Rela
tive
Clai
m C
ount
Cost as Measured of Portion of Raw Mean
RESPIRATORY ALL OTHERCost Distribution at 2013 Cost Level Relative to Raw Mean
Raw Mean = $84,006

Occupational Disease Canadian Institute of Actuaries
Oliver Wyman Actuarial Consulting
Page 97
AVERAGE AVERAGE AVERAGE
COUNT COST AGE LAG (DAYS)
RAW MEAN 1,165 80,334 44 138
CUT OFF 713 8,033
ADJ MEAN 452 204,040 46 281
ADJ X 5 LARGEST 447 176,181 46 277
5 LARGEST 5 2,694,641 36 612
LARGEST 1 3,420,807 0 0
ALL LAG <= 2 Yrs LAG > 2 Yrs
AVERAGE AGE 44 43 54
AVERAGE LAG (YEARS) 0.4 0.1 5.8
COUNT 1,090 1,043 47
COUNT PERCENTAGE 96% 4%
M F U
GENDER 684 474 7
GENDER PERCENTAGE 59% 41% 1%
RESPIRATORY OBSTRUCTIVE
COUNT PERCENTAGE
AGRICULTURE / FARMING / AQUACULTURE 5 0%
AIRCRAFT OPERATION, SERVICE, MANUFACTURING, OR REPAIR 24 2%
ANIMAL CARE, TRAINING, BREEDING, BOARDING 2 0%
AUTOMOBILE SALES, SERVICE, MANUFACTURING, OR REPAIR 44 4%
BUILDING MAINTAINENCE AND OPERATIONS 16 1%
CLERICAL 35 3%
CONSTRUCTION 19 2%
CONTRACTING 60 5%
EDUCATION AND RELIGIOUS INSTITUTIONS 75 6%
FIREFIGHTER 3 0%
FOOD MANUFACTURING 26 2%
FOOD SERVICE 17 1%
GENERAL SERVICES 11 1%
GOVERNMENT 98 8%
HEALTH CARE SERVICES 161 14%
HOSPITALITY AND ENTERTAINMENT 33 3%
LANDSCAPING 2 0%
LIVESTOCK AND POULTRY FARMING 5 0%
LOGGING AND TREE SERVICE 9 1%
MANUFACTURING GENERAL 258 22%
MARINE TERMINAL OPERATION 3 0%
MOTOR VEHICLE OPERATION OTHER THAN TRUCKING 10 1%
NATURAL RESOURCE EXTRACTION, REFINING, STORAGE, TRANSPORT 15 1%
POLICE OFFICERS 3 0%
RETAIL SERVICES 13 1%
SOCIAL SERVICES 24 2%
TELECOMMUNICATION AND BROADCASTING 3 0%
TRUCKING 8 1%
UNKNOWN 27 2%
UTILITY PRODUCTION, DISTRIBUTION, MAINTAINENCE 1 0%
VEHICLE OTHER THAN AUTOMOBILE SALES, SERVICE, MANUFACTURING, OR REPAIR 1 0%
VESSEL OPERATION, SERVICE, MANUFACTURING, OR REPAIR 94 8%
WHOLESALE AND RETAIL GENERAL 60 5%
RESPIRATORY OBSTRUCTIVE

Occupational Disease Canadian Institute of Actuaries
Oliver Wyman Actuarial Consulting
Page 98
0.00
0.20
0.40
0.60
0.80
1.00
20 25 30 35 40 45 50 55 60 65 70 75 80 85 90 95 100
Rela
tive
Clai
m C
ount
Age at Report
RESPIRATORY OBSTRUCTIVEAge at Report
0.00
0.20
0.40
0.60
0.80
Rela
tive
Clai
m C
ount
Cost as Measured of Portion of Raw Mean
RESPIRATORY OBSTRUCTIVECost Distribution at 2013 Cost Level Relative to Raw Mean
Raw Mean = $80,334
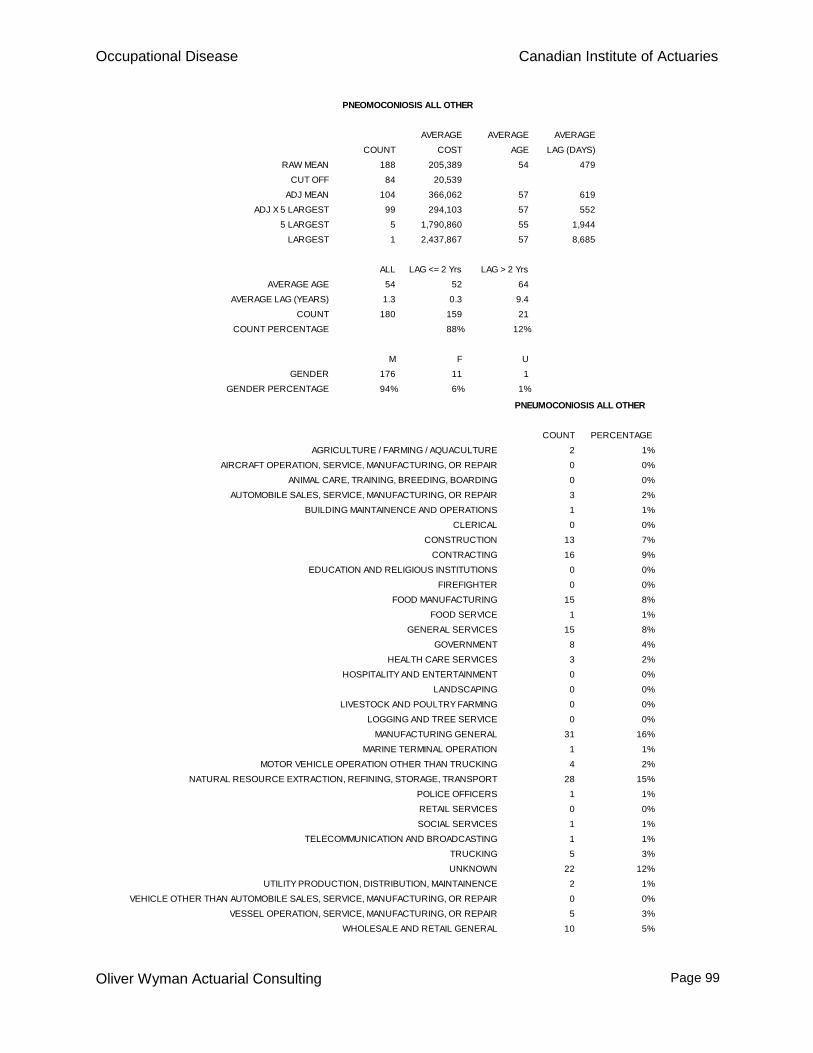
Occupational Disease Canadian Institute of Actuaries
Oliver Wyman Actuarial Consulting
Page 99
AVERAGE AVERAGE AVERAGE
COUNT COST AGE LAG (DAYS)
RAW MEAN 188 205,389 54 479
CUT OFF 84 20,539
ADJ MEAN 104 366,062 57 619
ADJ X 5 LARGEST 99 294,103 57 552
5 LARGEST 5 1,790,860 55 1,944
LARGEST 1 2,437,867 57 8,685
ALL LAG <= 2 Yrs LAG > 2 Yrs
AVERAGE AGE 54 52 64
AVERAGE LAG (YEARS) 1.3 0.3 9.4
COUNT 180 159 21
COUNT PERCENTAGE 88% 12%
M F U
GENDER 176 11 1
GENDER PERCENTAGE 94% 6% 1%
PNEOMOCONIOSIS ALL OTHER
COUNT PERCENTAGE
AGRICULTURE / FARMING / AQUACULTURE 2 1%
AIRCRAFT OPERATION, SERVICE, MANUFACTURING, OR REPAIR 0 0%
ANIMAL CARE, TRAINING, BREEDING, BOARDING 0 0%
AUTOMOBILE SALES, SERVICE, MANUFACTURING, OR REPAIR 3 2%
BUILDING MAINTAINENCE AND OPERATIONS 1 1%
CLERICAL 0 0%
CONSTRUCTION 13 7%
CONTRACTING 16 9%
EDUCATION AND RELIGIOUS INSTITUTIONS 0 0%
FIREFIGHTER 0 0%
FOOD MANUFACTURING 15 8%
FOOD SERVICE 1 1%
GENERAL SERVICES 15 8%
GOVERNMENT 8 4%
HEALTH CARE SERVICES 3 2%
HOSPITALITY AND ENTERTAINMENT 0 0%
LANDSCAPING 0 0%
LIVESTOCK AND POULTRY FARMING 0 0%
LOGGING AND TREE SERVICE 0 0%
MANUFACTURING GENERAL 31 16%
MARINE TERMINAL OPERATION 1 1%
MOTOR VEHICLE OPERATION OTHER THAN TRUCKING 4 2%
NATURAL RESOURCE EXTRACTION, REFINING, STORAGE, TRANSPORT 28 15%
POLICE OFFICERS 1 1%
RETAIL SERVICES 0 0%
SOCIAL SERVICES 1 1%
TELECOMMUNICATION AND BROADCASTING 1 1%
TRUCKING 5 3%
UNKNOWN 22 12%
UTILITY PRODUCTION, DISTRIBUTION, MAINTAINENCE 2 1%
VEHICLE OTHER THAN AUTOMOBILE SALES, SERVICE, MANUFACTURING, OR REPAIR 0 0%
VESSEL OPERATION, SERVICE, MANUFACTURING, OR REPAIR 5 3%
WHOLESALE AND RETAIL GENERAL 10 5%
PNEUMOCONIOSIS ALL OTHER

Occupational Disease Canadian Institute of Actuaries
Oliver Wyman Actuarial Consulting
Page 100
0.00
0.20
0.40
0.60
0.80
1.00
20 25 30 35 40 45 50 55 60 65 70 75 80 85 90 95 100
Rela
tive
Clai
m C
ount
Age at Report
PNEOMOCONIOSIS ALL OTHERAge at Report
0.00
0.10
0.20
0.30
0.40
0.50
0.60
0.70
Rela
tive
Clai
m C
ount
Cost as Measured of Portion of Raw Mean
PNEOMOCONIOSIS ALL OTHERCost Distribution at 2013 Cost Level Relative to Raw Mean
Raw Mean = $205,389

Occupational Disease Canadian Institute of Actuaries
Oliver Wyman Actuarial Consulting
Page 101
AVERAGE AVERAGE AVERAGE
COUNT COST AGE LAG (DAYS)
RAW MEAN 56,628 13,950 62 267
CUT OFF 928 1,395
ADJ MEAN 55,700 14,176 63 261
ADJ X 5 LARGEST 55,695 14,100 63 260
5 LARGEST 5 856,468 52 4,812
LARGEST 1 1,096,385 50 2,376
ALL LAG <= 2 Yrs LAG > 2 Yrs
AVERAGE AGE 62 62 63
AVERAGE LAG (YEARS) 0.7 0.1 8.6
COUNT 56,121 51,897 4,224
COUNT PERCENTAGE 92% 8%
M F U
GENDER 42,788 811 13,029
GENDER PERCENTAGE 76% 1% 23%
HEARING LOSS
COUNT PERCENTAGE
AGRICULTURE / FARMING / AQUACULTURE 456 1%
AIRCRAFT OPERATION, SERVICE, MANUFACTURING, OR REPAIR 605 1%
ANIMAL CARE, TRAINING, BREEDING, BOARDING 141 0%
AUTOMOBILE SALES, SERVICE, MANUFACTURING, OR REPAIR 2,040 4%
BUILDING MAINTAINENCE AND OPERATIONS 387 1%
CLERICAL 204 0%
CONSTRUCTION 2,998 5%
CONTRACTING 6,184 11%
EDUCATION AND RELIGIOUS INSTITUTIONS 945 2%
FIREFIGHTER 72 0%
FOOD MANUFACTURING 1,197 2%
FOOD SERVICE 44 0%
GENERAL SERVICES 474 1%
GOVERNMENT 3,714 7%
HEALTH CARE SERVICES 743 1%
HOSPITALITY AND ENTERTAINMENT 395 1%
LANDSCAPING 118 0%
LIVESTOCK AND POULTRY FARMING 128 0%
LOGGING AND TREE SERVICE 2,811 5%
MANUFACTURING GENERAL 11,034 19%
MARINE TERMINAL OPERATION 1,548 3%
MOTOR VEHICLE OPERATION OTHER THAN TRUCKING 283 0%
NATURAL RESOURCE EXTRACTION, REFINING, STORAGE, TRANSPORT 5,189 9%
POLICE OFFICERS 198 0%
RETAIL SERVICES 148 0%
SOCIAL SERVICES 44 0%
TELECOMMUNICATION AND BROADCASTING 442 1%
TRUCKING 2,493 4%
UNKNOWN 461 1%
UTILITY PRODUCTION, DISTRIBUTION, MAINTAINENCE 602 1%
VEHICLE OTHER THAN AUTOMOBILE SALES, SERVICE, MANUFACTURING, OR REPAIR 117 0%
VESSEL OPERATION, SERVICE, MANUFACTURING, OR REPAIR 8,484 15%
WHOLESALE AND RETAIL GENERAL 1,929 3%
HEARING LOSS

Occupational Disease Canadian Institute of Actuaries
Oliver Wyman Actuarial Consulting
Page 102
0.00
0.20
0.40
0.60
0.80
1.00
20 25 30 35 40 45 50 55 60 65 70 75 80 85 90 95 100
Rela
tive
Clai
m C
ount
Age at Report
HEARING LOSSAge at Report
0.00
0.10
0.20
0.30
0.40
0.50
Rela
tive
Clai
m C
ount
Cost as Measured of Portion of Raw Mean
HEARING LOSSCost Distribution at 2013 Cost Level Relative to Raw Mean
Raw Mean = $13,950

Occupational Disease Canadian Institute of Actuaries
Oliver Wyman Actuarial Consulting
Page 103
AVERAGE AVERAGE AVERAGE
COUNT COST AGE LAG (DAYS)
RAW MEAN 452 200,188 62 1,364
CUT OFF 159 20,019
ADJ MEAN 293 304,983 62 1,025
ADJ X 5 LARGEST 288 287,330 62 1,027
5 LARGEST 5 1,321,802 53 896
LARGEST 1 1,526,740 50 1,387
ALL LAG <= 2 Yrs LAG > 2 Yrs
AVERAGE AGE 62 59 69
AVERAGE LAG (YEARS) 3.7 0.5 9.8
COUNT 447 290 157
COUNT PERCENTAGE 65% 35%
M F U
GENDER 442 10 0
GENDER PERCENTAGE 98% 2% 0%
ALL OTHER CANCER
COUNT PERCENTAGE
AGRICULTURE / FARMING / AQUACULTURE 1 0%
AIRCRAFT OPERATION, SERVICE, MANUFACTURING, OR REPAIR 1 0%
ANIMAL CARE, TRAINING, BREEDING, BOARDING 0 0%
AUTOMOBILE SALES, SERVICE, MANUFACTURING, OR REPAIR 11 2%
BUILDING MAINTAINENCE AND OPERATIONS 1 0%
CLERICAL 1 0%
CONSTRUCTION 11 2%
CONTRACTING 19 4%
EDUCATION AND RELIGIOUS INSTITUTIONS 1 0%
FIREFIGHTER 7 2%
FOOD MANUFACTURING 2 0%
FOOD SERVICE 0 0%
GENERAL SERVICES 22 5%
GOVERNMENT 223 49%
HEALTH CARE SERVICES 7 2%
HOSPITALITY AND ENTERTAINMENT 2 0%
LANDSCAPING 1 0%
LIVESTOCK AND POULTRY FARMING 3 1%
LOGGING AND TREE SERVICE 0 0%
MANUFACTURING GENERAL 24 5%
MARINE TERMINAL OPERATION 0 0%
MOTOR VEHICLE OPERATION OTHER THAN TRUCKING 1 0%
NATURAL RESOURCE EXTRACTION, REFINING, STORAGE, TRANSPORT 21 5%
POLICE OFFICERS 0 0%
RETAIL SERVICES 0 0%
SOCIAL SERVICES 0 0%
TELECOMMUNICATION AND BROADCASTING 1 0%
TRUCKING 1 0%
UNKNOWN 4 1%
UTILITY PRODUCTION, DISTRIBUTION, MAINTAINENCE 1 0%
VEHICLE OTHER THAN AUTOMOBILE SALES, SERVICE, MANUFACTURING, OR REPAIR 1 0%
VESSEL OPERATION, SERVICE, MANUFACTURING, OR REPAIR 84 19%
WHOLESALE AND RETAIL GENERAL 1 0%
ALL OTHER CANCER

Occupational Disease Canadian Institute of Actuaries
Oliver Wyman Actuarial Consulting
Page 104
0.00
0.20
0.40
0.60
0.80
1.00
20 25 30 35 40 45 50 55 60 65 70 75 80 85 90 95 100
Rela
tive
Clai
m C
ount
Age at Report
ALL OTHER CANCERAge at Report
0.00
0.20
0.40
0.60
0.80
Rela
tive
Clai
m C
ount
Cost as Measured of Portion of Raw Mean
ALL OTHER CANCERCost Distribution at 2013 Cost Level Relative to Raw Mean
Raw Mean = $200,188

Occupational Disease Canadian Institute of Actuaries
Oliver Wyman Actuarial Consulting
Page 105
AVERAGE AVERAGE AVERAGE
COUNT COST AGE LAG (DAYS)
RAW MEAN 114 108,572 46 103
CUT OFF 66 10,857
ADJ MEAN 48 251,878 44 130
ADJ X 5 LARGEST 43 49,161 44 114
5 LARGEST 5 1,995,237 50 265
LARGEST 1 8,440,907 31 66
ALL LAG <= 2 Yrs LAG > 2 Yrs
AVERAGE AGE 46 46 46
AVERAGE LAG (YEARS) 0.3 0.2 2.6
COUNT 80 76 4
COUNT PERCENTAGE 95% 5%
M F U
GENDER 82 32 0
GENDER PERCENTAGE 72% 28% 0%
VASCULAR
COUNT PERCENTAGE
AGRICULTURE / FARMING / AQUACULTURE 0 0%
AIRCRAFT OPERATION, SERVICE, MANUFACTURING, OR REPAIR 0 0%
ANIMAL CARE, TRAINING, BREEDING, BOARDING 0 0%
AUTOMOBILE SALES, SERVICE, MANUFACTURING, OR REPAIR 4 4%
BUILDING MAINTAINENCE AND OPERATIONS 0 0%
CLERICAL 3 3%
CONSTRUCTION 0 0%
CONTRACTING 4 4%
EDUCATION AND RELIGIOUS INSTITUTIONS 1 1%
FIREFIGHTER 0 0%
FOOD MANUFACTURING 1 1%
FOOD SERVICE 11 10%
GENERAL SERVICES 2 2%
GOVERNMENT 14 12%
HEALTH CARE SERVICES 2 2%
HOSPITALITY AND ENTERTAINMENT 5 4%
LANDSCAPING 0 0%
LIVESTOCK AND POULTRY FARMING 0 0%
LOGGING AND TREE SERVICE 2 2%
MANUFACTURING GENERAL 8 7%
MARINE TERMINAL OPERATION 0 0%
MOTOR VEHICLE OPERATION OTHER THAN TRUCKING 2 2%
NATURAL RESOURCE EXTRACTION, REFINING, STORAGE, TRANSPORT 0 0%
POLICE OFFICERS 3 3%
RETAIL SERVICES 6 5%
SOCIAL SERVICES 1 1%
TELECOMMUNICATION AND BROADCASTING 0 0%
TRUCKING 15 13%
UNKNOWN 4 4%
UTILITY PRODUCTION, DISTRIBUTION, MAINTAINENCE 0 0%
VEHICLE OTHER THAN AUTOMOBILE SALES, SERVICE, MANUFACTURING, OR REPAIR 0 0%
VESSEL OPERATION, SERVICE, MANUFACTURING, OR REPAIR 16 14%
WHOLESALE AND RETAIL GENERAL 10 9%
VASCULAR

Occupational Disease Canadian Institute of Actuaries
Oliver Wyman Actuarial Consulting
Page 106
0.00
0.20
0.40
0.60
0.80
1.00
20 25 30 35 40 45 50 55 60 65 70 75 80 85 90 95 100
Rela
tive
Clai
m C
ount
Age at Report
VASCULARAge at Report
0.00
0.10
0.20
0.30
0.40
0.50
0.60
0.70
Rela
tive
Clai
m C
ount
Cost as Measured of Portion of Raw Mean
VASCULARCost Distribution at 2013 Cost Level Relative to Raw Mean
Raw Mean = $108,572

Occupational Disease Canadian Institute of Actuaries
Oliver Wyman Actuarial Consulting
Page 107
AVERAGE AVERAGE AVERAGE
COUNT COST AGE LAG (DAYS)
RAW MEAN 2,990 36,817 44 82
CUT OFF 529 3,682
ADJ MEAN 2,461 44,206 44 80
ADJ X 5 LARGEST 2,456 34,089 43 80
5 LARGEST 5 5,013,661 52 66
LARGEST 1 13,309,054 44 51
ALL LAG <= 2 Yrs LAG > 2 Yrs
AVERAGE AGE 44 44 49
AVERAGE LAG (YEARS) 0.2 0.2 4.9
COUNT 2,814 2,771 43
COUNT PERCENTAGE 98% 2%
M F U
GENDER 1,211 1,719 60
GENDER PERCENTAGE 41% 57% 2%
MENTAL STRESS
COUNT PERCENTAGE
AGRICULTURE / FARMING / AQUACULTURE 1 0%
AIRCRAFT OPERATION, SERVICE, MANUFACTURING, OR REPAIR 2 0%
ANIMAL CARE, TRAINING, BREEDING, BOARDING 7 0%
AUTOMOBILE SALES, SERVICE, MANUFACTURING, OR REPAIR 95 3%
BUILDING MAINTAINENCE AND OPERATIONS 83 3%
CLERICAL 471 16%
CONSTRUCTION 18 1%
CONTRACTING 15 1%
EDUCATION AND RELIGIOUS INSTITUTIONS 128 4%
FIREFIGHTER 30 1%
FOOD MANUFACTURING 7 0%
FOOD SERVICE 62 2%
GENERAL SERVICES 10 0%
GOVERNMENT 992 33%
HEALTH CARE SERVICES 237 8%
HOSPITALITY AND ENTERTAINMENT 66 2%
LANDSCAPING 2 0%
LIVESTOCK AND POULTRY FARMING 2 0%
LOGGING AND TREE SERVICE 14 0%
MANUFACTURING GENERAL 129 4%
MARINE TERMINAL OPERATION 1 0%
MOTOR VEHICLE OPERATION OTHER THAN TRUCKING 16 1%
NATURAL RESOURCE EXTRACTION, REFINING, STORAGE, TRANSPORT 5 0%
POLICE OFFICERS 97 3%
RETAIL SERVICES 24 1%
SOCIAL SERVICES 66 2%
TELECOMMUNICATION AND BROADCASTING 7 0%
TRUCKING 52 2%
UNKNOWN 36 1%
UTILITY PRODUCTION, DISTRIBUTION, MAINTAINENCE 17 1%
VEHICLE OTHER THAN AUTOMOBILE SALES, SERVICE, MANUFACTURING, OR REPAIR 3 0%
VESSEL OPERATION, SERVICE, MANUFACTURING, OR REPAIR 140 5%
WHOLESALE AND RETAIL GENERAL 155 5%
MENTAL STRESS

Occupational Disease Canadian Institute of Actuaries
Oliver Wyman Actuarial Consulting
Page 108
0.00
0.20
0.40
0.60
0.80
1.00
20 25 30 35 40 45 50 55 60 65 70 75 80 85 90 95 100
Rela
tive
Clai
m C
ount
Age at Report
MENTAL STRESSAge at Report
0.00
0.10
0.20
0.30
0.40
0.50
Rela
tive
Clai
m C
ount
Cost as Measured of Portion of Raw Mean
MENTAL STRESSCost Distribution at 2013 Cost Level Relative to Raw Mean
Raw Mean = $36,817

Occupational Disease Canadian Institute of Actuaries
Oliver Wyman Actuarial Consulting
Page 109
AVERAGE AVERAGE AVERAGE
COUNT COST AGE LAG (DAYS)
RAW MEAN 1,391 72,443 44 390
CUT OFF 212 7,244
ADJ MEAN 1,179 84,667 45 407
ADJ X 5 LARGEST 1,174 79,758 45 408
5 LARGEST 5 1,237,389 40 116
LARGEST 1 2,202,907 32 9
ALL LAG <= 2 Yrs LAG > 2 Yrs
AVERAGE AGE 44 43 50
AVERAGE LAG (YEARS) 1.1 0.3 5.2
COUNT 1,371 1,160 211
COUNT PERCENTAGE 85% 15%
M F U
GENDER 1,229 161 1
GENDER PERCENTAGE 88% 12% 0%
CUMULATIVE NERVE DISEASE
COUNT PERCENTAGE
AGRICULTURE / FARMING / AQUACULTURE 3 0%
AIRCRAFT OPERATION, SERVICE, MANUFACTURING, OR REPAIR 1 0%
ANIMAL CARE, TRAINING, BREEDING, BOARDING 0 0%
AUTOMOBILE SALES, SERVICE, MANUFACTURING, OR REPAIR 48 3%
BUILDING MAINTAINENCE AND OPERATIONS 7 1%
CLERICAL 16 1%
CONSTRUCTION 21 2%
CONTRACTING 25 2%
EDUCATION AND RELIGIOUS INSTITUTIONS 10 1%
FIREFIGHTER 0 0%
FOOD MANUFACTURING 14 1%
FOOD SERVICE 16 1%
GENERAL SERVICES 6 0%
GOVERNMENT 22 2%
HEALTH CARE SERVICES 17 1%
HOSPITALITY AND ENTERTAINMENT 6 0%
LANDSCAPING 4 0%
LIVESTOCK AND POULTRY FARMING 4 0%
LOGGING AND TREE SERVICE 28 2%
MANUFACTURING GENERAL 79 6%
MARINE TERMINAL OPERATION 3 0%
MOTOR VEHICLE OPERATION OTHER THAN TRUCKING 6 0%
NATURAL RESOURCE EXTRACTION, REFINING, STORAGE, TRANSPORT 13 1%
POLICE OFFICERS 1 0%
RETAIL SERVICES 8 1%
SOCIAL SERVICES 1 0%
TELECOMMUNICATION AND BROADCASTING 1 0%
TRUCKING 8 1%
UNKNOWN 1 0%
UTILITY PRODUCTION, DISTRIBUTION, MAINTAINENCE 1 0%
VEHICLE OTHER THAN AUTOMOBILE SALES, SERVICE, MANUFACTURING, OR REPAIR 2 0%
VESSEL OPERATION, SERVICE, MANUFACTURING, OR REPAIR 995 72%
WHOLESALE AND RETAIL GENERAL 24 2%
CUMULATIVE NERVE DISEASE

Occupational Disease Canadian Institute of Actuaries
Oliver Wyman Actuarial Consulting
Page 110
0.00
0.20
0.40
0.60
0.80
1.00
20 25 30 35 40 45 50 55 60 65 70 75 80 85 90 95 100
Rela
tive
Clai
m C
ount
Age at Report
CUMULATIVE NERVE DISEASEAge at Report
0.00
0.10
0.20
0.30
0.40
0.50
Rela
tive
Clai
m C
ount
Cost as Measured of Portion of Raw Mean
CUMULATIVE NERVE DISEASECost Distribution at 2013 Cost Level Relative to Raw Mean
Raw Mean = $72,443
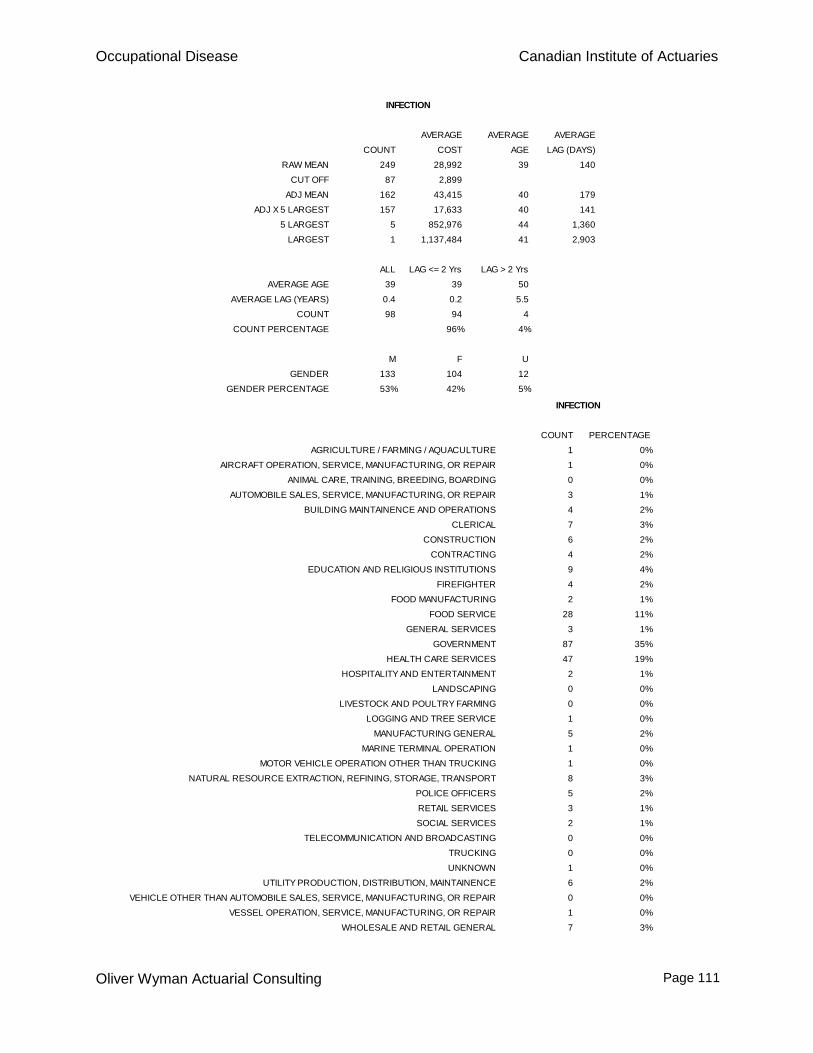
Occupational Disease Canadian Institute of Actuaries
Oliver Wyman Actuarial Consulting
Page 111
AVERAGE AVERAGE AVERAGE
COUNT COST AGE LAG (DAYS)
RAW MEAN 249 28,992 39 140
CUT OFF 87 2,899
ADJ MEAN 162 43,415 40 179
ADJ X 5 LARGEST 157 17,633 40 141
5 LARGEST 5 852,976 44 1,360
LARGEST 1 1,137,484 41 2,903
ALL LAG <= 2 Yrs LAG > 2 Yrs
AVERAGE AGE 39 39 50
AVERAGE LAG (YEARS) 0.4 0.2 5.5
COUNT 98 94 4
COUNT PERCENTAGE 96% 4%
M F U
GENDER 133 104 12
GENDER PERCENTAGE 53% 42% 5%
INFECTION
COUNT PERCENTAGE
AGRICULTURE / FARMING / AQUACULTURE 1 0%
AIRCRAFT OPERATION, SERVICE, MANUFACTURING, OR REPAIR 1 0%
ANIMAL CARE, TRAINING, BREEDING, BOARDING 0 0%
AUTOMOBILE SALES, SERVICE, MANUFACTURING, OR REPAIR 3 1%
BUILDING MAINTAINENCE AND OPERATIONS 4 2%
CLERICAL 7 3%
CONSTRUCTION 6 2%
CONTRACTING 4 2%
EDUCATION AND RELIGIOUS INSTITUTIONS 9 4%
FIREFIGHTER 4 2%
FOOD MANUFACTURING 2 1%
FOOD SERVICE 28 11%
GENERAL SERVICES 3 1%
GOVERNMENT 87 35%
HEALTH CARE SERVICES 47 19%
HOSPITALITY AND ENTERTAINMENT 2 1%
LANDSCAPING 0 0%
LIVESTOCK AND POULTRY FARMING 0 0%
LOGGING AND TREE SERVICE 1 0%
MANUFACTURING GENERAL 5 2%
MARINE TERMINAL OPERATION 1 0%
MOTOR VEHICLE OPERATION OTHER THAN TRUCKING 1 0%
NATURAL RESOURCE EXTRACTION, REFINING, STORAGE, TRANSPORT 8 3%
POLICE OFFICERS 5 2%
RETAIL SERVICES 3 1%
SOCIAL SERVICES 2 1%
TELECOMMUNICATION AND BROADCASTING 0 0%
TRUCKING 0 0%
UNKNOWN 1 0%
UTILITY PRODUCTION, DISTRIBUTION, MAINTAINENCE 6 2%
VEHICLE OTHER THAN AUTOMOBILE SALES, SERVICE, MANUFACTURING, OR REPAIR 0 0%
VESSEL OPERATION, SERVICE, MANUFACTURING, OR REPAIR 1 0%
WHOLESALE AND RETAIL GENERAL 7 3%
INFECTION

Occupational Disease Canadian Institute of Actuaries
Oliver Wyman Actuarial Consulting
Page 112
0.00
0.20
0.40
0.60
0.80
1.00
20 25 30 35 40 45 50 55 60 65 70 75 80 85 90 95 100
Rela
tive
Clai
m C
ount
Age at Report
INFECTIONAge at Report
0.00
0.10
0.20
0.30
0.40
0.50
Rela
tive
Clai
m C
ount
Cost as Measured of Portion of Raw Mean
INFECTIONCost Distribution at 2013 Cost Level Relative to Raw Mean
Raw Mean = $28,992

Occupational Disease Canadian Institute of Actuaries
Oliver Wyman Actuarial Consulting
Page 113
AVERAGE AVERAGE AVERAGE
COUNT COST AGE LAG (DAYS)
RAW MEAN 35 12,550 43 426
CUT OFF 7 1,255
ADJ MEAN 28 15,629 40 257
ADJ X 5 LARGEST 23 3,869 38 277
5 LARGEST 5 69,725 46 164
LARGEST 1 189,814 49 51
ALL LAG <= 2 Yrs LAG > 2 Yrs
AVERAGE AGE 43 41 47
AVERAGE LAG (YEARS) 1.2 0.2 4.7
COUNT 29 23 6
COUNT PERCENTAGE 79% 21%
M F U
GENDER 19 14 2
GENDER PERCENTAGE 54% 40% 6%
EYE CONDITION ALL
COUNT PERCENTAGE
AGRICULTURE / FARMING / AQUACULTURE 0 0%
AIRCRAFT OPERATION, SERVICE, MANUFACTURING, OR REPAIR 0 0%
ANIMAL CARE, TRAINING, BREEDING, BOARDING 0 0%
AUTOMOBILE SALES, SERVICE, MANUFACTURING, OR REPAIR 2 6%
BUILDING MAINTAINENCE AND OPERATIONS 0 0%
CLERICAL 1 3%
CONSTRUCTION 0 0%
CONTRACTING 1 3%
EDUCATION AND RELIGIOUS INSTITUTIONS 2 6%
FIREFIGHTER 0 0%
FOOD MANUFACTURING 1 3%
FOOD SERVICE 1 3%
GENERAL SERVICES 0 0%
GOVERNMENT 3 9%
HEALTH CARE SERVICES 10 29%
HOSPITALITY AND ENTERTAINMENT 0 0%
LANDSCAPING 0 0%
LIVESTOCK AND POULTRY FARMING 0 0%
LOGGING AND TREE SERVICE 0 0%
MANUFACTURING GENERAL 3 9%
MARINE TERMINAL OPERATION 0 0%
MOTOR VEHICLE OPERATION OTHER THAN TRUCKING 0 0%
NATURAL RESOURCE EXTRACTION, REFINING, STORAGE, TRANSPORT 0 0%
POLICE OFFICERS 0 0%
RETAIL SERVICES 1 3%
SOCIAL SERVICES 1 3%
TELECOMMUNICATION AND BROADCASTING 0 0%
TRUCKING 0 0%
UNKNOWN 1 3%
UTILITY PRODUCTION, DISTRIBUTION, MAINTAINENCE 0 0%
VEHICLE OTHER THAN AUTOMOBILE SALES, SERVICE, MANUFACTURING, OR REPAIR 0 0%
VESSEL OPERATION, SERVICE, MANUFACTURING, OR REPAIR 8 23%
WHOLESALE AND RETAIL GENERAL 0 0%
EYE CONDITION ALL

Occupational Disease Canadian Institute of Actuaries
Oliver Wyman Actuarial Consulting
Page 114
0.00
0.20
0.40
0.60
0.80
1.00
20 25 30 35 40 45 50 55 60 65 70 75 80 85 90 95 100
Rela
tive
Clai
m C
ount
Age at Report
EYE CONDITION ALLAge at Report
0.00
0.10
0.20
0.30
0.40
0.50
0.60
Rela
tive
Clai
m C
ount
Cost as Measured of Portion of Raw Mean
EYE CONDITION ALLCost Distribution at 2013 Cost Level Relative to Raw Mean
Raw Mean = $12,550

Occupational Disease Canadian Institute of Actuaries
Oliver Wyman Actuarial Consulting
Page 115
AVERAGE AVERAGE AVERAGE
COUNT COST AGE LAG (DAYS)
RAW MEAN 1,183 43,855 39 205
CUT OFF 523 4,386
ADJ MEAN 660 76,672 41 271
ADJ X 5 LARGEST 655 59,682 41 272
5 LARGEST 5 2,302,282 33 150
LARGEST 1 4,301,036 0 0
ALL LAG <= 2 Yrs LAG > 2 Yrs
AVERAGE AGE 39 39 47
AVERAGE LAG (YEARS) 0.6 0.2 8.2
COUNT 1,098 1,053 45
COUNT PERCENTAGE 96% 4%
M F U
GENDER 860 309 14
GENDER PERCENTAGE 73% 26% 1%
REACTION TO FOREIGN SUBSTANCE
COUNT PERCENTAGE
AGRICULTURE / FARMING / AQUACULTURE 12 1%
AIRCRAFT OPERATION, SERVICE, MANUFACTURING, OR REPAIR 11 1%
ANIMAL CARE, TRAINING, BREEDING, BOARDING 1 0%
AUTOMOBILE SALES, SERVICE, MANUFACTURING, OR REPAIR 92 8%
BUILDING MAINTAINENCE AND OPERATIONS 25 2%
CLERICAL 19 2%
CONSTRUCTION 60 5%
CONTRACTING 86 7%
EDUCATION AND RELIGIOUS INSTITUTIONS 30 3%
FIREFIGHTER 2 0%
FOOD MANUFACTURING 63 5%
FOOD SERVICE 23 2%
GENERAL SERVICES 27 2%
GOVERNMENT 97 8%
HEALTH CARE SERVICES 98 8%
HOSPITALITY AND ENTERTAINMENT 30 3%
LANDSCAPING 4 0%
LIVESTOCK AND POULTRY FARMING 5 0%
LOGGING AND TREE SERVICE 10 1%
MANUFACTURING GENERAL 201 17%
MARINE TERMINAL OPERATION 7 1%
MOTOR VEHICLE OPERATION OTHER THAN TRUCKING 10 1%
NATURAL RESOURCE EXTRACTION, REFINING, STORAGE, TRANSPORT 59 5%
POLICE OFFICERS 5 0%
RETAIL SERVICES 41 3%
SOCIAL SERVICES 12 1%
TELECOMMUNICATION AND BROADCASTING 3 0%
TRUCKING 27 2%
UNKNOWN 36 3%
UTILITY PRODUCTION, DISTRIBUTION, MAINTAINENCE 3 0%
VEHICLE OTHER THAN AUTOMOBILE SALES, SERVICE, MANUFACTURING, OR REPAIR 2 0%
VESSEL OPERATION, SERVICE, MANUFACTURING, OR REPAIR 24 2%
WHOLESALE AND RETAIL GENERAL 58 5%
REACTION TO FOREIGN SUBSTANCE

Occupational Disease Canadian Institute of Actuaries
Oliver Wyman Actuarial Consulting
Page 116
0.00
0.20
0.40
0.60
0.80
1.00
20 25 30 35 40 45 50 55 60 65 70 75 80 85 90 95 100
Rela
tive
Clai
m C
ount
Age at Report
REACTION TO FOREIGN SUBSTANCEAge at Report
0.00
0.10
0.20
0.30
0.40
0.50
0.60
Rela
tive
Clai
m C
ount
Cost as Measured of Portion of Raw Mean
REACTION TO FOREIGN SUBSTANCECost Distribution at 2013 Cost Level Relative to Raw Mean
Raw Mean = $43,855

Occupational Disease Canadian Institute of Actuaries
Oliver Wyman Actuarial Consulting
Page 117
AVERAGE AVERAGE AVERAGE
COUNT COST AGE LAG (DAYS)
RAW MEAN 376 144,510 52 404
CUT OFF 224 14,451
ADJ MEAN 152 349,967 53 454
ADJ X 5 LARGEST 147 241,072 53 430
5 LARGEST 5 3,551,496 53 1,153
LARGEST 1 9,275,801 46 4,686
ALL LAG <= 2 Yrs LAG > 2 Yrs
AVERAGE AGE 52 52 54
AVERAGE LAG (YEARS) 1.1 0.3 6.5
COUNT 344 297 47
COUNT PERCENTAGE 86% 14%
M F U
GENDER 349 23 4
GENDER PERCENTAGE 93% 6% 1%
PHYSICAL STRESS
COUNT PERCENTAGE
AGRICULTURE / FARMING / AQUACULTURE 0 0%
AIRCRAFT OPERATION, SERVICE, MANUFACTURING, OR REPAIR 0 0%
ANIMAL CARE, TRAINING, BREEDING, BOARDING 0 0%
AUTOMOBILE SALES, SERVICE, MANUFACTURING, OR REPAIR 6 2%
BUILDING MAINTAINENCE AND OPERATIONS 8 2%
CLERICAL 15 4%
CONSTRUCTION 10 3%
CONTRACTING 21 6%
EDUCATION AND RELIGIOUS INSTITUTIONS 4 1%
FIREFIGHTER 27 7%
FOOD MANUFACTURING 1 0%
FOOD SERVICE 5 1%
GENERAL SERVICES 0 0%
GOVERNMENT 32 9%
HEALTH CARE SERVICES 3 1%
HOSPITALITY AND ENTERTAINMENT 2 1%
LANDSCAPING 0 0%
LIVESTOCK AND POULTRY FARMING 1 0%
LOGGING AND TREE SERVICE 9 2%
MANUFACTURING GENERAL 8 2%
MARINE TERMINAL OPERATION 0 0%
MOTOR VEHICLE OPERATION OTHER THAN TRUCKING 1 0%
NATURAL RESOURCE EXTRACTION, REFINING, STORAGE, TRANSPORT 2 1%
POLICE OFFICERS 8 2%
RETAIL SERVICES 0 0%
SOCIAL SERVICES 1 0%
TELECOMMUNICATION AND BROADCASTING 0 0%
TRUCKING 26 7%
UNKNOWN 13 3%
UTILITY PRODUCTION, DISTRIBUTION, MAINTAINENCE 2 1%
VEHICLE OTHER THAN AUTOMOBILE SALES, SERVICE, MANUFACTURING, OR REPAIR 0 0%
VESSEL OPERATION, SERVICE, MANUFACTURING, OR REPAIR 160 43%
WHOLESALE AND RETAIL GENERAL 11 3%
PHYSICAL STRESS
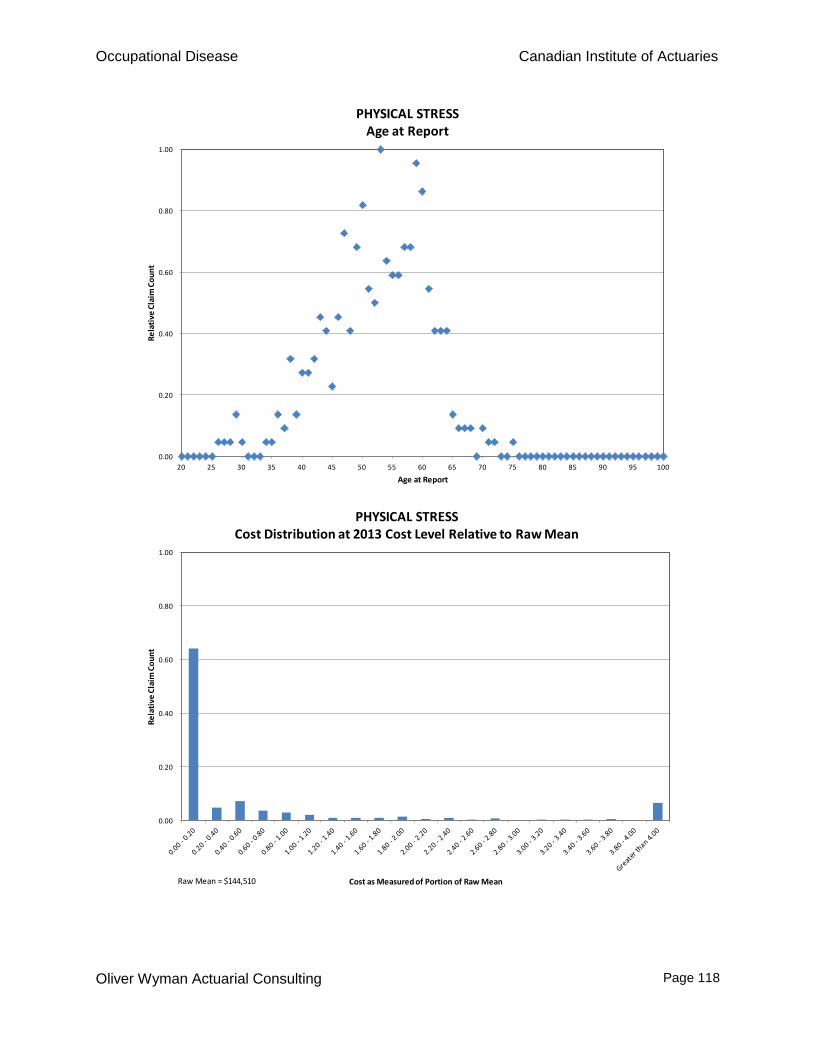
Occupational Disease Canadian Institute of Actuaries
Oliver Wyman Actuarial Consulting
Page 118
0.00
0.20
0.40
0.60
0.80
1.00
20 25 30 35 40 45 50 55 60 65 70 75 80 85 90 95 100
Rela
tive
Clai
m C
ount
Age at Report
PHYSICAL STRESSAge at Report
0.00
0.20
0.40
0.60
0.80
1.00
Rela
tive
Clai
m C
ount
Cost as Measured of Portion of Raw Mean
PHYSICAL STRESSCost Distribution at 2013 Cost Level Relative to Raw Mean
Raw Mean = $144,510

Occupational Disease Canadian Institute of Actuaries
Oliver Wyman Actuarial Consulting
Page 119
Appendix C: Metrics Illustrating Latency The following are metrics illustrating latency. These include: Age at the 5% Level: 95% of claims are reported at ages greater than the 5% level. Age at claim report is assumed to represent age at disease emergence. Mean Age: Average age at report, all claim. Age at the 95% Level: 5% of claims are reported at ages greater than the 95% level. Average Lag, All Claims: Lag is defined as the time between date of last exposure to loss (generally the last date worked) and the date of claim report. Average Lag, Excluding Lowest 10%: Average lag for 90% of claims. Measurement excludes 10% of total claims with the lowest lag. Average Lag, Excluding Lowest 90%: Average lag for 10% of claims. Measurement excludes 90% of total claims with the lowest lag.

Occupational Disease Canadian Institute of Actuaries
Oliver Wyman Actuarial Consulting
Page 120
AGE AT CLAIM REPORT: 5% LEVEL
INDIVIDUAL RECOMMENDEDDISEASES COMBINATIONS
MESOTHELIOMA 51ASBESTOSIS 43
LUNG CANCER 45
OBSTRUCTIVE RESPIRATORY 24ALL OTHER RESPIRATORY 23
ALL OTHER CANCER 43 43
PNEUMOCONIOSIS EXCEPT ASBESTOSIS 24 24
HEARING LOSS 44 44
BURSITIS 25EPICONDYLITIS 29
TENDONITIS 21TENOSYNOVITIS 22
OTHER INFLAMMATION 25SPRAIN / STRAIN / TEAR 24
HERNIA 27ALL OTHER CUMULATIVE TRAUMA 24
CARPAL TUNNEL SYNDROME 24 24
EXCLUDED DISEASESINFECTION 22 22
MENTAL STRESS 26 26PHYSICAL STRESS 37 37
NERVE DISEASE 28 28EYE CONDITION 21 21
REACTION TO FOREIGN SUBSTANCE 21 21VASCULAR 25 25
23
23
45

Occupational Disease Canadian Institute of Actuaries
Oliver Wyman Actuarial Consulting
Page 121
AGE AT CLAIM REPORT: MEAN
INDIVIDUAL RECOMMENDEDDISEASES COMBINATIONS
MESOTHELIOMA 68ASBESTOSIS 64
LUNG CANCER 66
OBSTRUCTIVE RESPIRATORY 44ALL OTHER RESPIRATORY 44
ALL OTHER CANCER 62 62
PNEUMOCONIOSIS EXCEPT ASBESTOSIS 54 54
HEARING LOSS 62 62
BURSITIS 43EPICONDYLITIS 44
TENDONITIS 40TENOSYNOVITIS 41
OTHER INFLAMMATION 44SPRAIN / STRAIN / TEAR 42
HERNIA 44ALL OTHER CUMULATIVE TRAUMA 42
CARPAL TUNNEL SYNDROME 42 42
EXCLUDED DISEASESINFECTION 39 39
MENTAL STRESS 44 44PHYSICAL STRESS 52 52
NERVE DISEASE 44 44EYE CONDITION 43 43
REACTION TO FOREIGN SUBSTANCE 39 39VASCULAR 46 46
65
44
42

Occupational Disease Canadian Institute of Actuaries
Oliver Wyman Actuarial Consulting
Page 122
AGE AT CLAIM REPORT: 95% LEVEL
INDIVIDUAL RECOMMENDEDDISEASES COMBINATIONS
MESOTHELIOMA 83ASBESTOSIS 81
LUNG CANCER 81
OBSTRUCTIVE RESPIRATORY 63ALL OTHER RESPIRATORY 67
ALL OTHER CANCER 81 81
PNEUMOCONIOSIS EXCEPT ASBESTOSIS 78 78
HEARING LOSS 79 79
BURSITIS 57EPICONDYLITIS 57
TENDONITIS 57TENOSYNOVITIS 59
OTHER INFLAMMATION 60SPRAIN / STRAIN / TEAR 59
HERNIA 62ALL OTHER CUMULATIVE TRAUMA 59
CARPAL TUNNEL SYNDROME 59 59
EXCLUDED DISEASESINFECTION 59 59
MENTAL STRESS 59 59PHYSICAL STRESS 64 64
NERVE DISEASE 62 62EYE CONDITION 62 62
REACTION TO FOREIGN SUBSTANCE 59 59VASCULAR 62 62
82
66
59

Occupational Disease Canadian Institute of Actuaries
Oliver Wyman Actuarial Consulting
Page 123
AVERAGE LAG IN YEARS: ALL CLAIMS
INDIVIDUAL RECOMMENDEDDISEASES COMBINATIONS
MESOTHELIOMA 1.7ASBESTOSIS 3.9
LUNG CANCER 8.3
OBSTRUCTIVE RESPIRATORY 0.4ALL OTHER RESPIRATORY 1.2
ALL OTHER CANCER 3.7 3.7
PNEUMOCONIOSIS EXCEPT ASBESTOSIS 1.3 1.3
HEARING LOSS 0.7 0.7
BURSITIS 0.1EPICONDYLITIS 0.2
TENDONITIS 0.1TENOSYNOVITIS 0.2
OTHER INFLAMMATION 0.3SPRAIN / STRAIN / TEAR 0.3
HERNIA 0.3ALL OTHER CUMULATIVE TRAUMA 0.3
CARPAL TUNNEL SYNDROME 0.3 0.3
EXCLUDED DISEASESINFECTION 0.4 0.4
MENTAL STRESS 0.2 0.2PHYSICAL STRESS 1.1 1.1
NERVE DISEASE 1.1 1.1EYE CONDITION 1.2 1.2
REACTION TO FOREIGN SUBSTANCE 0.6 0.6VASCULAR 0.3 0.3
3.6
1.0
0.2

Occupational Disease Canadian Institute of Actuaries
Oliver Wyman Actuarial Consulting
Page 124
AVERAGE LAG IN YEARS: EXCLUDING LOWEST 10%
INDIVIDUAL RECOMMENDEDDISEASES COMBINATIONS
MESOTHELIOMA 1.9ASBESTOSIS 4.4
LUNG CANCER 9.3
OBSTRUCTIVE RESPIRATORY 0.4ALL OTHER RESPIRATORY 1.4
ALL OTHER CANCER 4.1 4.1
PNEUMOCONIOSIS EXCEPT ASBESTOSIS 1.5 1.5
HEARING LOSS 0.8 0.8
BURSITIS 0.1EPICONDYLITIS 0.2
TENDONITIS 0.1TENOSYNOVITIS 0.2
OTHER INFLAMMATION 0.4SPRAIN / STRAIN / TEAR 0.3
HERNIA 0.3ALL OTHER CUMULATIVE TRAUMA 0.3
CARPAL TUNNEL SYNDROME 0.4 0.4
EXCLUDED DISEASESINFECTION 0.4 0.4
MENTAL STRESS 0.3 0.3PHYSICAL STRESS 1.2 1.2
NERVE DISEASE 1.2 1.2EYE CONDITION 1.3 1.3
REACTION TO FOREIGN SUBSTANCE 0.6 0.6VASCULAR 0.3 0.3
4.0
1.2
0.2

Occupational Disease Canadian Institute of Actuaries
Oliver Wyman Actuarial Consulting
Page 125
AVERAGE LAG IN YEARS: TOP 10%
INDIVIDUAL RECOMMENDEDDISEASES COMBINATIONS
MESOTHELIOMA 13.0ASBESTOSIS 24.7
LUNG CANCER 26.3
OBSTRUCTIVE RESPIRATORY 3.1ALL OTHER RESPIRATORY 10.6
ALL OTHER CANCER 18.0 18.0
PNEUMOCONIOSIS EXCEPT ASBESTOSIS 10.5 10.5
HEARING LOSS 6.8 6.8
BURSITIS 0.5EPICONDYLITIS 0.9
TENDONITIS 0.6TENOSYNOVITIS 1.1
OTHER INFLAMMATION 2.3SPRAIN / STRAIN / TEAR 2.4
HERNIA 1.7ALL OTHER CUMULATIVE TRAUMA 2.1
CARPAL TUNNEL SYNDROME 2.3 2.3
EXCLUDED DISEASESINFECTION 3.0 3.0
MENTAL STRESS 1.5 1.5PHYSICAL STRESS 7.9 7.9
NERVE DISEASE 6.6 6.6EYE CONDITION 6.4 6.4
REACTION TO FOREIGN SUBSTANCE 4.2 4.2VASCULAR 1.8 1.8
22.8
8.9
1.6

Occupational Disease Canadian Institute of Actuaries
Oliver Wyman Actuarial Consulting
Page 126
Appendix D: Definition of Industry Groupings The following are the groupings used to map individual workers’ compensation classifications.
AGRICULTURE/FARMING/AQUACULTURE AIRCRAFT OPERATION, SERVICE, MANUFACTURING, OR REPAIR ANIMAL CARE, TRAINING, BREEDING, BOARDING AUTOMOBILE SALES, SERVICE, MANUFACTURING, OR REPAIR BUILDING MAINTAINENCE AND OPERATIONS CLERICAL CONSTRUCTION CONTRACTING EDUCATION AND RELIGIOUS INSTITUTIONS FIREFIGHTER FOOD MANUFACTURING FOOD SERVICE GENERAL SERVICES GOVERNMENT HEALTH CARE SERVICES HOSPITALITY AND ENTERTAINMENT LANDSCAPING LIVESTOCK AND POULTRY FARMING LOGGING AND TREE SERVICE MANUFACTURING GENERAL MARINE TERMINAL OPERATION MOTOR VEHICLE OPERATION OTHER THAN TRUCKING NATURAL RESOURCE EXTRACTION, REFINING, STORAGE, TRANSPORT POLICE OFFICERS RETAIL SERVICES SOCIAL SERVICES TELECOMMUNICATION AND BROADCASTING TRUCKING UNKNOWN UTILITY PRODUCTION, DISTRIBUTION, MAINTENANCE VEHICLE OTHER THAN AUTOMOBILE SALES, SERVICE, MANU-FACTURING, OR REPAIR VESSEL OPERATION, SERVICE, MANUFACTURING, OR REPAIR WHOLESALE AND RETAIL GENERAL
The following pages display examples of individual classifications mapped into each industry group. The lists are not complete, but do provide a cross-section of the mapping process.

Occupational Disease Canadian Institute of Actuaries
Oliver Wyman Actuarial Consulting
Page 127
AGRICULTURE/FARMING/AQUACULTURE AGRICULTURE WORKER BERRY FARMING FARM WORKER FARMING OPERATIONS FARMS – GRAIN AND VEGETABLE FIN FISH FARMING FISH WHOLESALE FISHING/FISH OR FUR FARMS GILLNET AND TROLL FISHING GRAIN FARMING HARVESTING & BALING, CUSTOM HATCHERIES – COMMERCIAL MUSHROOM PRODUCERS/BAIT FARMS NURSERIES – TREE/SHRUB NURSERY WORKER ORCHARD WORKER ORNAMENTAL NURSERY TRAWL FISHING VEGETABLE FARMING
AIRCRAFT OPERATION, SERVICE, MANUFACTURING, OR REPAIR
AERIAL PHOTOGRAPHY, SURVEY, ETC. AIR NAVIGATION SUPPORT AIR SERVICE – REGULAR & CHARTER AIR SERVICE – SCHEDULED COMMERCIAL AIRCRAFT – GROUND SUPPORT SERVICES AIRCRAFT & ENGINE OVERHAUL AIRCRAFT HANDLING OR FUELLING AIRCRAFT MAINTENANCE AIRPLANE MANUFACTURING AIRPORT AVIATION OR FLYING SCHOOL FIXED-WING IFR OPERATION FIXED-WING VFR OPERATION FLIGHT OPERATIONS – MISCELLANEOUS HELICOPTER AERIAL WORK HELICOPTER SERVICES PILOT
ANIMAL CARE, TRAINING, BREEDING, BOARDING
ANIMAL HUMANE SOCIETY OR WILDLIFE REHAB ANIMAL SHELTERS/POUNDS ANIMAL TRAINING DOMESTIC ANIMAL BREEDING OR BOARDING HORSE RANCHING, RAISING, AND BREEDING KENNELS/PET GROOMING PET GROOMING VETERINARY VETERINARY HOSPITAL, VETERINARY SERVICES

Occupational Disease Canadian Institute of Actuaries
Oliver Wyman Actuarial Consulting
Page 128
AUTOMOBILE SALES, SERVICE, MANUFACTURING, OR REPAIR AIRCRAFT, AUTOMOBILE, OR TRUCK ASSEMBLY AUTO DEALERS AUTO GLASS SHOP AUTO PARTS SUPPLY AUTO RECYCLING AUTO SERVICE OR REPAIR AUTO SPRING OR CHAIN MANUFACTURE AUTO TOWING AUTO TRANSMISSION REPAIR SHOP AUTO WRECKERS AUTOBODY PAINTING AUTOBODY SHOP ALL EMPLOYEES AUTOMOBILE DEALERSHIP AUTOMOBILE PAINT SHOPS AUTOMOBILE PARTS AND ACCESSORIES SALES AUTOMOBILE REPAIR AND SERVICE AUTOMOTIVE MACHINE SHOP AUTOMOTIVE PART MANUFACTURING BATTERY REPAIR AUTO ELECTRIC BRAKE SHOPS CAR WASH OR AUTO DETAILING ELECTROPLATING AUTO PARTS ENGINE, CYLINDER, AUTO PART MFG, REBUILD GAS BAR OR SERVICE STATION GAS BARS/CAR WASH, RETAIL – NO SERVICING GASOLINE STATION AND CONVENIENCE HARDWARE/AUTO PARTS STORES/ETC. MFG OF RADIATOR CORES SERVICE STATION EQUIP – SALES/SERVICE TIRE REPAIR SHOP, VULCANIZING TIRES, RETREADING TOWING AUTO VEHICLES
BUILDING MAINTENANCE AND OPERATIONS
BUILDING MANAGEMENT, RENTAL BUILDING OPERATION BUILDING OR HOME INSPECTION COMMERCIAL CLEANING, JANITORIAL SERVICES CUSTODIAL, GENERAL JANITOR, ENGINEER, FOOD AREA MECHANICS DOMESTIC CLEANING JANITORIAL AND MAID SERVICES

Occupational Disease Canadian Institute of Actuaries
Oliver Wyman Actuarial Consulting
Page 129
CLERICAL ACCOUNTING ACTUARIAL SERVICES ADVERTISING AGENCIES ADVERTISING OR PUBLIC RELATIONS SERVICES ARCHITECTS BANKS/FINANCIAL SERVICES BUSINESS CONSULTING BUSINESS SERVICES CLERICAL WORKER SUPPLY COMMERCIAL STOCK AUDIT COMPUTER CONSULTING OR PROGRAMMING CONSULTING CONSULTING ENGINEERING DATA PROCESSING ENGINEERING FINANCIAL SERVICES GEOLOGICAL AND ENVIRONMENTAL CONSULTING INSURANCE, ACTUARIAL, OR BONDING SERVICES LEGAL OFFICES ALL EMPLOYEES LEGAL SERVICES MAIL ROOM OPERATIONS MAILING OR ADDRESSING SERVICES MAP MAKING MEDICAL SERVICES GENERAL ACCOUNTING, MEDICAL PROFESSIONALS, ETC. OFFICE AND CLERICAL GENERAL PROFESSIONAL OR EMPLOYERS’ ASSOCIATION PROJECT MANAGEMENT REAL ESTATE AGENCY STAFFING SERVICES – CLERICAL/PROFESSIONAL

Occupational Disease Canadian Institute of Actuaries
Oliver Wyman Actuarial Consulting
Page 130
CONSTRUCTION ASBESTOS ABATEMENT OR MOULD REMEDIATION ASBESTOS REMOVAL BRIDGE CONSTRUCTION BUILDING DEMOLITION BUILDING MOVER CAISSON OPERATIONS CELL, MICROWAVE, TRANSMISSION TOWER ERECT CONCRETE CONSTRUCTION CONCRETE CONSTRUCTION INCIDENTAL NOC CONCRETE CUTTING OR CORING CONCRETE PUMPING CONCRETE REINFORCING CONDUIT CONSTRUCTION FOR CABLES AND WIRES CONSTRUCION SITE CLEANING AND DEBRIS REMOVAL CONSTRUCTION CONSTRUCTION – INDUSTRIAL CONSTRUCTION MANAGEMENT CONSTRUCTION MANAGEMENT CONSULTING CONSTRUCTION TRADE SERVICES – NEC CONSTRUCTION, GENERAL LABOUR SUPPLY CRANE OPERATION CUT AND COVER TUNNEL CONSTRUCTION EARTH & ROCK STRUCTURE CONSTRUCTION ELELVATOR CONSTRUCTION AND REPAIR EQUIPMENT OPERATOR ERECT – PRECAST CONCRETE ERECT – SHEET/METAL STRUCTURES ERECT – STRUCTURAL STEEL ESCAVATION AND DRIVERS EXTERIOR HIGH-RISE WINDOW CLEANING FOUNDATION BORING HEAVY EQUIPMENT MAINTENANCE INCLUDING MECHANIC, FOREMAN, WELDING, YARD HEAVY EQUIPMENT OPERATOR HIGH PRESSURE WATER CLEANING HIGHWAY, ROAD, OR PARKING LOT PAINTING HIGHWAY, ROAD, RAILWAY CONTR INDUSTRIAL PIPEFITTING IRON WORKER IRRIGATION CONSTRUCTION IRRIGATION/DRAINAGE DISTRICT LOG HOME CONSTRUCTION MACHINERY/EQUIPMENT ERECTION AND REPAIR MECHANIZED TUNNEL BORING CONSTRUCTION PAINTING METAL STRUCTURES PIER, WHARF, DOCK CONSTRUCTION, REPAIR PILE DRIVING RENT/ERECT – SCAFFOLD/CRANES RIGGING ROAD CONSTRUCTION STEEL FRAME ERECTION, STRUCTURAL REPAIR STRUCTURAL STRUCTURAL CONCRETE FORMING STRUCTURAL DAM/DYKE CONSTRUCTION, REPAIR STRUCTURAL INSULATION TUNNEL CONSTRUCTION TUNNELING ALL OPERATIONS

Occupational Disease Canadian Institute of Actuaries
Oliver Wyman Actuarial Consulting
Page 131
CONTRACTING ACOUSTIC MATERIALS – SELL/INSTALL ALARM INSTALLATION APPLIANCE INSTALLATION/REPAIR/SERVICE AUTOMATIC DOOR, GATE INSTALL, SRV, RPR AUTOMATIC SPRINKLER BLIND OR DRAPERY TRACK INSTALLATION BOILER INSTALLATION AND REPAIR BRICK/MASONRY CONTRACTING CARPENTRY FINISHING CEILING INSTALLER COMM TANK OR BOILER INSTALL, REMOVAL COMMERCIAL REFRIGERATION, COMM AC WORK DECK, RAILING, OR FENCE INSTALLATION DOOR AND WINDOW INSTALLATION DRYWALL WORKER DUST SUPPRESSION SYSTEMS ELECTRICAL ELECTRICIAN ELEVATORS/ESCALATORS – SERVICE/INSTALL FENCE INSTALLATION AND BUILDING FILTERS, IND – SALE/SERVICE/INSTALL FIRE AND FLOOD RESTORATION FLOOR COVERING INSTALLATIONS GLASS SHOP, WINDOW INSTALL, GLASS RPR HARDWOOD FLOOR LAYING OR REFINISHING HAZARDOUS WASTE GENERAL HEATING SYSTEMS – FAB/INSTALL HVAC INDUSTRIAL BELTING – INSTALL/SERVICE INSTALL SWIM POOL, HOT TUB, ETC. INSULATION WORK OR FIREPROOFING LIGHT EQUIPMENT SERVICE, REPAIR, INSTALL LIGHT METAL PRODUCTS – ASMB/INSTALL LOW SLOPE ROOFING MASONRY MECHANICAL CONTRACTING MECHANICAL INSULATION OFFICE MACHINE INSTALLATION AND REPAIR OVERBURDEN REMOVAL OVERHEAD DOOR INSTALLATION OVERHEAD DOORS – INSTALL/REPAIR PAINTING PAINTING OR WALLPAPERING PAVING/SURFACING PEST CONTROL OR FUMIGATION PLASTERING PLUMBING POOL, SPA, HOT TUB INSTALL OR REPAIR RESIDENTIAL GENERAL CONTRACTOR ROOFING SIDING, AWNING, GUTTER INSTALL OR REPAIR SIDING/EAVESTROUGH – FAB./INST. STEAM CLEAN, SANDBLAST, PRESSURE WSH BLDGS STEEP SLOPE ROOFING TILE WORK OR TERRAZZO LAYING TILE/TERRAZZO – SELL/INSTALL

Occupational Disease Canadian Institute of Actuaries
Oliver Wyman Actuarial Consulting
Page 132
UNDERGROUND SPRINKERS INSTALL VACUUM SYSTEMS – ASMB/INSTALL WINDOW, GUTTER, OR AWNING CLEANING WOOD WORKER
EDUCATION AND RELIGIOUS INSTITUTIONS
CHARITABLE ASSOCIATIONS CHURCHES/RELIGIOUS ORDERS COLLEGE DAYCARE CENTRE, PRESCHOOL, OR PLAYSCHOOL DRIVING SCHOOL FUNDRAISING OR CHARITABLE ORGANIZATION INSTITUTES OF TECHNOLOGY KINDERGARTENS PLAY SCHOOLS PUBLIC SCHOOL DISTRICT RELIGIOUS ORGANIZATION SCHOOL BOARDS SCHOOL DIVISIONS SCHOOLS – DANCE, MUSIC, HOBBY SPECIALTY SCHOOLS – PROFESSIONAL/PERSONAL SPORTS INSTRUCTION SCHOOL UNIVERSITY
FIREFIGHTER FIREFIGHTER FOREST FIRE FIGHTING
FOOD MANUFACTURING
BACKERY BREWERY BUTTER, CHEESE, OR ICE CREAM MANUFACTURE CANDY MANUFACTURING CANNERY COFFEE, TEA, HERB, OR SPICE PKG OR MFG DAIRY/FRUIT JUICE PROCESSING EGG GRADING FISH PACKING FLOUR MILLS FOOD PROCESS – MISC FOOD PRODUCT MANUFACTURING FRUIT JUICE MANUFACTURING FRUIT OR VEG PROCESSING OR PRODUCT MFG FRUIT OR VEGETABLE PACKING OR PACKAGING FRUIT PACKING GRAIN ELEVATOR OPERATIONS GRAIN OR FEED MILLING ICE CREAM MANUFACTURING LIQUID DAIRY PRODUCT MANUFACTURE LIQUOR PRODUCTION MEAT PACKING HOUSE MEAT PROCESSING MEAT PRODUCT MANUFACTURING MILK PRODUCT MANUFACTURING OYSTER PROCESSING PICKLE MANUFACTURING RENDERING PLANTS RETAIL BREWING OR WINE-MAKING SHOP

Occupational Disease Canadian Institute of Actuaries
Oliver Wyman Actuarial Consulting
Page 133
SAUSAGE OR SAUSAGE CASING MANUFACTURE SUGAR BEETS, PROCESSING SUGAR MANUFACTURING AND REFINING SUGAR REFINING AND PACKAGING VEGETABLE OILS & BEET SUGAR PROCESSING VEGETABLE PACKING OPERATIONS VINEYARD WORKER WINERY
FOOD SERVICE
AIRLINE CATERING BUTCHER CATERING CATERING – INDUSTRIAL CAMPS COFFEE SHOPS OR FOOD CONCESSIONS FOOD SERVICE, INCLUDING: WAITSTAFF, COOKING, CLERICAL, CASHIER, DIETICIAN, ETC. INDUSTRIAL CATERING MOBILE CATERING RESTAURANT ALL EMPLOYEES
GENERAL SERVICES
AUDIO/VIDEO POST-PRODUCTION OR ANIMATION BLASTING OR AVALANCHE CONTROL CATHODIC PROTECTION SERVICE CEMETERY WORKER COLD STORAGE COMMERCIAL DIVING CONTAINER RECYCLING COURIER OR LOCAL DELIVERY SERVICES DOCUMENT STORAGE/EXCHANGE FEED LOT/CORRAL CLEANING FENCES – SELL/RENT/INSTALL FUNERAL HOME/DIRECTOR/EMBALMER/CREMATORY/GENERAL FUNERAL UNDERTAKING FURNACE CLEANING SERVICES GEOLOGICAL/GEOPHYSICAL SERVICES HEAVY EQUIPMENT RENT WITH SERVICE HOME & OFFICE FURNITURE MOVERS INCINERATION INDUSTRIAL COATING SERVICES INTERIOR DESIGN INVESTIGATIVE SERVICES LAUNDRIES – COMMERCIAL LIGHT REPAIR SHOPS MASSAGE PARLOUR, STEAM BATH, MASSAGE SRV MATERIALS, LIGHT EQUIP TESTING (>500LB) MISCELLANEOUS INDUSTRIAL CODE MOVING AND STORAGE OUTDOOR ADVERTISING PACKING/CRATING – CUSTOM PARKING FACILITIES/STORAGE GARAGES PHOTOGRAPHER POOL, SPA, OR HOT TUB SERVICE RECORDS STORAGE RECYCLING DEPOT RESEARCH SERVICES SEPTIC TANK, SEWER, SEWAGE DISPOS SYS SRV STEEL SERVICE CENTRE – NO SALVAGE

Occupational Disease Canadian Institute of Actuaries
Oliver Wyman Actuarial Consulting
Page 134
STORAGE EXCLUDING TRUCKING SURVEY – ARCHAEOLOGICAL SURVEY – LAND/GENERAL SURVEYING SURVEYING ALL OPERATIONS WAREHOUSE OPERATION WAREHOUSING – PUBLIC
GOVERNMENT
BOARDS, AGENCIES, COMM (COMPUL) CHAMBER OF COMMERCE CITIES COUNTIES DEPARTMENT OF HIGHWAYS DEPARTMENT OF PUBLIC WORKS FEDERAL GOVERNMENT GARBAGE COLLECION GARBAGE COLLECTION/DISPOSAL GOVERNMENT EMPLOYMENT ALL ASPECTS: PUBLIC SAFETY, OFFICE, SOCIAL SERVICES HIGHWAY LABORER GENERAL HOUSING AUTHORITIES LIBRARY OR RESOURCE CENTRE LOCAL GOVERNMENT AND RELATED OPERATIONS MUNICIPAL DISTRICTS PROVINCIAL GOVERNMENT STREET CLEANING STREET CLEANING/MAINTENANCE TOLL COLLECTOR TOWNS TRADE UNIONS TRAFFIC CONTROL UNION VILLAGES
HEALTH CARE SERVICES
ACUTE CARE ADULT HOMES ALTERNATIVE HEALTH CARE AMBULANCE OR FIRST AID SERVICES AMBULANCE SERVICES AUXILIARY HOSPITAL CHIROPRACTIC PRACTICE, SERVICES, OR CARE COMMUNITY HEALTH SUPPORT SERVICES DENTAL LABORATORY DENTISTRY OR ANCILLARY DENTAL SERVICES EMERGENCY HEALTH SERVICES COMMISSION FITNESS CENTRE, GYM, OR HEALTH CENTRE HEALTH CARE SERVICES – COVENANT HEALTH HEALTH CARE SERVICES – OTHER PROVIDERS HEALTH/ALLIED SERVICE – MISC HOME HEALTH CARE HOSPITAL PROFESSIONAL EMPLOYEES LABORATORY TECHNICIAN LONG-TERM CARE MASSAGE THERAPY (LICENSED) MEDICAL CLINIC OR MEDICAL PRACTICE MEDICAL DIAGNOSTIC LABORATORY MEDICAL EMPLOYEES PROFESSIONAL NOT HOSPITAL

Occupational Disease Canadian Institute of Actuaries
Oliver Wyman Actuarial Consulting
Page 135
MEDICAL TRANSPORTATION NURSING HOME OPHTHALMIC DISPENSING OPTOMETRY PARAMEDIC PHARMACEUTICAL PREPARATION PHYSIOTHERAPY CENTERS PSYCHIATRIC HOSPITALS RETIREMENT LIVING CENTRE HEALTH CARE ONLY SHORT-TERM CARE SUPPLEMENTARY HEALTH CARE SURGICAL CENTRE
HOSPITALITY AND ENTERTAINMENT
AMUSEMENT PARK OPERATIONS ARCADES ARENAS/STADIUMS – OPERATION OF ART GALLERIES ARTISTS/ENTERTAINERS/PERFORMERS AUCTIONING SERVICES BINGO OPERATIONS BOWLING OPERATIONS CAMPGROUND CASINO ALL EMPLOYEES CIRCUS, CARNIVAL, RODEO, MECH AMUSE RIDE COUNTRY CLUB ALL EMPLOYEES EXHIBITION ASSOCIATIONS FILM PRODUCTION INCLUDING PERFORMERS GOLF CLUBS/RANGES GUIDING/RAFTING/PACK TRAINS HALL RENTAL HOTEL ALL EMPLOYEES LIVE PERFORMANCE VENUE LIVE THEATRES/BALLET MAID SERVICE MOTELS & CABINS MOTION PICTURE, COMMERCIAL, OR TELEVISION MUSEUMS & ART GALLERIES MUSIC SHOP ORGANIZING, CONDUCTING SPECIAL EVENTS OUTDOOR SPORT TOUR OUTDOOR SPORTS AND RECREATION PARK MAINTENANCE GENERAL ALL EMPLOYEES PARK, CAMPGROUND, OR TRAIL MAINTENANCE PERFORMING ARTS PRIVATE CLUBS PRIVATE PARK, GARDEN, OR ZOO PROFESSIONAL SPORTS PROPERTY MANAGEMENT/HOSTELS PUB, BAR, NIGHT CLUB, OR LOUNGE RIDING ACADEMIES, HORSE STABLES SKATING/CURLING RINKS, COMM ASSN SKI HILL OR GONDOLA RIDE SKI INDUSTRY SPORTS ADMINISTRATION SPORTS AND ENTERTAINMENT FACILITY TENNIS & SQUASH FACILITIES THEATRE PROFESSIONAL, MUSICIAN, TECHNICIAN, ACTOR, DANCE, ETC.

Occupational Disease Canadian Institute of Actuaries
Oliver Wyman Actuarial Consulting
Page 136
TRAVEL AGENCY OR ACCOMMODATION REGISTRY TRAVEL AGENCY/MOTOR ASSOCIATION YOUTH/RELIGIOUS CAMPS
LANDSCAPING
BRUSH CUTTING BRUSHING, WEEDING, TREE THINNING, SPACING CHEM BCLAY, PEAT, SOIL, TOPSOIL DIGGING, PROCESS GARDEN OR LANDSCAPING SUPPLY LANDSCAPING LAWN MAINTENANCE LAWN MAINTENANCE, GARDENING, WEED CONTROL (EXPIRED JAN 1, 2010) PROCURING SOIL SAMPLES SOIL, TOPSOIL, PEAT, OTHER GARDEN MTL PKG
LIVESTOCK AND POULTRY FARMING
DAIRY FARMING OR LIVESTOCK AUCTIONING EGG FARMING FARMS AND RANCHES – LIVESTOCK FARMS, POULTRY/RABBIT HOG FARMING LIVESTOCK DEALER LIVESTOCK STABLE AND BREEDING POULTRY FARMING AND RELATED SERVICES POULTRY PACKING PLANTS POULTRY PROCESSING RANCH HAND WATERFOWL PRESERVATION ZOOS/GAME FARMS
LOGGING AND TREE SERVICE
CABLE OR HI-LEAD LOGGING INTEGRATED FOREST MANAGEMENT LOG HAULING LOG PROCESSING LOG SCALING LOG TOWING LOGGING MANUAL TREE FELLING AND BUCKING MECHANIZED TREE FELLING TIMBER MANAGEMENT TREE BALER TREE CLIMBER TREE PLANTER TREE SERVICES TREE TECHNICIAN TREE TRIMMER
MANUFACTURING GENERAL
ACID, BASE, SALT, CHEMICAL, DYE MANUFACTURE ALUMINUM CANS, MFG ALUMINUM/METAL EXTRUSION ARMATURE REWIND & MOTOR REPAIR ARMATURE WINDING FOR SMALL MOTORS ART, CRAFT, OR ORNAMENT MANUFACTURE ARTIFICIAL STONE PRODUCTS – MFG ASPHALT ROOFING PRODUCTS – MFG AUTOMATED WOOD PROCESSING EQUIPMENT MFG

Occupational Disease Canadian Institute of Actuaries
Oliver Wyman Actuarial Consulting
Page 137
AWNING OR AWNING SIGN MANUFACTURE BABY CARRIAGE MANUFACTURING BATTERY OR FUEL CELL MANUFACTURE BOOK MANUFACTURING BRASS COPPER GOODS MANUFACTURING BRUSH, BROOM, OR MOP MANUFACTURE CARDBOARD OR PAPER CONTAINER MANUFACTURE CARPET OR RUG MANUFACTURE CEMENT MANUFACTURE CERAMIC, TERRA COTTA TILE, CLAY BRICK MFG CERAMIC/PORCELAIN PRODUCTS – INDUST., MFG CHEMICAL PULP AND PAPER MILL (EXPIRED JAN 1, 2008) CLAY PRODUCT MFG CLOTHING MANUFACTURING COATINGS COMMERCIAL SIGN MANUFACTURE COMPRESSORS/POWER UNIT – MFG CORD, ROPE, OR NET MANUFACTURE DIE CASTING DRAPERY MANUFACTURE DRUG, VITAMIN, OR PHARMACEUTICAL MFG ELECTRICAL COMPONENTS – MFG ELECTROPLATING EXPLOSIVE MANUFACTURING FIBREGLASS INSULATION – MFG FOOTWEAR, LUGGAGE, LEATHER PROD MFG, REPAIR FOUNDRIES, IRON & STEEL FURNITURE REFINISHING FURNITURE STOCK MANUFACTURING GALVANIZE, ELECTROPLATE, PROTECTION PLATE GALVANIZING SHOP GLUE OR ADHESIVE MANUFACTURE GYPSUM PRODUCT MANUFACTURE ICE MANUFACTURE INDUST SAW BLADE MFG, SHARPEN, SERV, REPAIR JEWELLERY MANUFACTURING MATTRESS MANUFACTURING METAL RECYCLING METAL SCRAP OPERATIONS ALL EMPLOYEES MFG OF DRILLING MUD AGGREGATE MFG OF GLASS PRODUCTS MFG OF MATTRESSES MFG OF PLYWOOD MFG OF PREMIX CEMENT/SAND/SOIL MFG OF RUBBER STAMPS/STENCILS/VINYL GOODS MFG OF SHIPPING BAGS MFG OF WOODEN TRUSSES MFG/REPAIR ORNAMENTAL IRON, ETC. MILL WORK FLOORING, DRESSED LUMBER, UNASSEMBLED MILLWORK MODULAR, PREFAB BUILDING MANUFACTURE ORIENTED STRAND BOARD MANUFACTURE PAINT MANUFACTURING PANELBOARD – MFG PAPER COATING PLASTIC PRODUCT MFG (BY BLOW MOULDING) PLUMBERS’ SUPPLIES MANUFACTURING PORTABLE WOOD MILL POTTERY – MFG

Occupational Disease Canadian Institute of Actuaries
Oliver Wyman Actuarial Consulting
Page 138
POWER TRANSMISSION EQUIPMENT MANUFACTURING PRECISION INSTRUMENT, FISHING TACKLE MFG PREFABRICATED LOG HOME KIT MANUFACTURE PRESSED BOARD MANUFACTURE PRINTING PUBLISHING PULP MILLS PULPWOOD PUMP MANUFACTURING RADIATOR REPAIR SHOPS RAILROAD CAR MANUFACTURING SHOE MANUFACTURING SRAP METAL OPERATIONS STAFFING SERVICES – LABOUR STEEL PIPE MFG STILE AND RAIL DOOR MANUFACTURE STONE, MARBLE CUT, DRESS, SHAPE, PROD MFG SUPPLYING OF AMMONIUM NITRATE TANNERIES TOOL AND DIE MAKING WOOD CHIP MILL WOODEN TOY OR MUSICAL INSTRUMENT MFG WOODENWARE MANUFACTURING
MARINE TERMINAL OPERATION
DRY DOCK OR MARINE RAILWAY (EXPIRED JAN 1, 2009) FREIGHT FORWARDING – OVERSEAS FREIGHT HANDLING FEDERAL ACT FREIGHT HANDLING STATE ACT GENERAL WHARF OPERATIONS LAND OR MARINE POLLUTION CONTROL MARINE BULK TERMINAL MARINE CONTAINER TERMINAL MARINE SHIP AGENCY AND RELATED SERVICES RAIL OPERATIONS RAILWAY STEVEDORING FEDERAL ACT STEVEDORING
MOTOR VEHICLE OPERATION OTHER THAN TRUCKING
ARMOURED CAR SERVICE BAKERY ROUTE SUPERVISORS AND DRIVERS BOTTLING ROUTES SUPERVISORS DRIVERS BUS – SCHOOL BUS LINES DAIRY ROUTE SUPERVISORS AND DRIVERS LIMOUSINE OR CHAUFFEUR SERVICES STORAGE WAREHOUSE OPERATIONS AND DRIVERS TAXI CABS/LIMOUSINE SERVICE TRACTOR DRIVER TRANSIT MIX OPERATIONS TRANSPORTATION
NATURAL RESOURCE EXTRACTION, REFINING, STORAGE, TRANSPORT
BULK PETROLEUM DEALERS CEMENT & LIME MFG, INCL. QUARRYING COAL/WOOD YARDS DIAMOND DRILLING

Occupational Disease Canadian Institute of Actuaries
Oliver Wyman Actuarial Consulting
Page 139
DRILLING – OIL/GAS WELLS DRILLING – WATERWELL/DEEP CORE FUEL DELIVERY OPERATIONS GAS MAIN CONSTRUCTION HEAVY OIL/OILSANDS – R & D INDUSTRIAL/OILFIELD EQUIP – RENT MINE/REFINE – SALT MINER – UNDERGROUND NATURAL GAS DISTRIBUTION NATURAL GAS PROCESSING PLANTS OIL & GAS – UPSTREAM OIL FIELD MAINT/CONSTRUCTION OIL REFINING OILFIELD DOWNHOLE SERVICES OILSANDS OPERATIONS OPEN PIT COAL MINING PIPELINE CLEANING PIPELINE TRANSMISSION – OIL/GAS PURCHASE SALE TRANSPORT OF GAS QUARRY RECLAMATION OF WASTE COAL REFINING OF SAND/COAL SAND GRAVEL ESCAVATION SEISMIC & WATER WELL DRILLNG SMELTER STONE CRUSHING UNDERGROUND MINING WELL SERVICING WITH SERVICE RIGS
POLICE OFFICERS
LAW ENFORCEMENT POLICE OFFICERS SECURITY OR PATROL SERVICES
RETAIL SERVICES
ANALYTICAL LABORATORIES BEAUTY/BARBER SHOPS AND SCHOOLS BICYCLE SHOP OR SPORTS EQUIPMENT RENTAL BLACKSMITH SHOPS CARPET, RUG, OR UPHOLSTERY CLEANING COMMERCIAL LAUNDRY OR LINEN SUPPLY CUSTOM TAILORING DRY CLEANING FACILITY OR LAUNDROMAT EMPLOYMENT, DATING AGENCY, RELATED TESTING ENGRAVING GRAPHIC DESIGN HAIR/BEAUTY/SALON HOUSEHOLD APPLIANCE – SVC ONLY INVENTORY SERVICES JEWELLERY, EYEWEAR, CLOCK REPAIR, KEYCUT LOCKSMITHING ORNAMENTAL PLANT RENTAL, OFFICE PLANT SVC PACKAGED OFFICE SERVICE SMALL ELEC EQUIP, HOUSEHOLD APPLIANCE SRV TAXIDERMISTS UPHOLSTERING VENDING OPERATIONS

Occupational Disease Canadian Institute of Actuaries
Oliver Wyman Actuarial Consulting
Page 140
SOCIAL SERVICES ALCOHOL OR DRUG TREATMENT CENTRE CHILD DAY CARE COMMUNITY SERVICES ALL PROFESSIONALS CONTINUING CARE FACILITIES COUNSELLING OR SOCIAL SERVICES DAY HOMES/DAY CARE CENTRES HIRING OR PROVIDING DOMESTIC CHILDCARE REHABILITATION OF HANDICAPPED REHABILITATION SERVICES FOR DISABLED RESIDENTIAL SOCIAL SERVICE FACILITY RETIREMENT LIVING CENTRE RETIREMENT LIVING CENTRE FOOD SERVICE ONLY RETIREMENT OR SENIORS’ HOME (ACCOM ONLY) SENIORS’ SUPPORTIVE LIVING/LODGES
TELECOMMUNICATION AND BROADCASTING
BROADCASTING STATION ALL EMPLOYEES ALL MEDIA CLOSED CIRCUIT TV/CABLEVISION RADIO/TV STATIONS SECURITY ALARM SYS, TELECOM, CABLEWIRING TELECOMMUNICATION LINE ALL OTHER EMPLOYEES TELECOMMUNICATION SYSTEMS TELEPHONE OPERATIONS TELEPHONE SYSTEM TELEVISION OR RADIO BROADCASTING
UNKNOWN NO USABLE EMPLOYEE CLASSIFICATION INFORMATION TRUCKING
CAR OR TRUCK RENTAL DUMP TRUCK OPERATION GENERAL TRUCKING LOG TRUCK DRIVER RENT FIRE TRUCKS WITH OPERATOR SAND, GRAVEL, AND DIRT TRUCKING TRUCK AND OTHER DRIVERS TRUCK MAIL PACKAGE TRUCKING – SPECIALIZED TRUCKING OF BULK PRODUCTS TRUCKING OF LIQUIDS BY TANKER TRUCKING OF LIVESTOCK TRUCKING OF LOGS TRUCKING SERVICE – GENERAL TRUCKING SERVICE – OILFIELD

Occupational Disease Canadian Institute of Actuaries
Oliver Wyman Actuarial Consulting
Page 141
UTILITY PRODUCTION, DISTRIBUTION, MAINTENANCE ELECTRIC UTILITIES GAS UTILITIES INSTALL SEWER & WATER LINES, ETC. LAYING BURIED TELEPHONE CABLE POWER LINE – CONSTRUCT/REMOVE POWER POLE, TRANS LINE INSTALL, SRV, RPR SEWAGE PLANT TELECOMMUNICATION LINE CONSTRUCTION TEST/PRESERVE – POWER POLES UTILITY LINEMAN AND MAINTENANCE OPERATIONS WATER WORKS OPERATIONS
VEHICLE OTHER THAN AUTOMOBILE SALES, SERVICE, MANUFACTURING, OR REPAIR
BUS MAINTENANCE AND REPAIR INDUSTRIAL CAMP TRAILERS – RENTAL MFG CABS FOR TRACTORS & COMBINES MFG HOLIDAY TRAILERS, CAMPERS MOBILE HOME SALES OR INSTALLATION REC VEHICLE SALES, SERVICE OR RENTAL SPORT VEHICLES – SALE/SERVICE TRAILERS – SALES/RENTAL WITH SERVICE TRUCK BODY OR TRAILER MANUFACTURE TRUCK MAINTENANCE
VESSEL OPERATION, SERVICE, MANUFACTURING, OR REPAIR
BARGE, TUG, OTHER WATER TRANSPORT OF GOODS BOAT MAINTENANCE CHARTERED BOAT TOURS COMMERCIAL MARINE VESSEL MFG, SERV, RPR DREDGING FERRY SERVICE HARBOUR COMM, PORT AUTHORITY, MARINE PILOT MARINA OR BOAT RENTAL MARINE PILOTING (EXPIRED JAN 1, 2009) MARINE PLEASURE CRAFT MANUFACTURE MARINE VESSEL SURVEYING MOBILE HOME OR BOAT TOWING PLEASURE BOAT, MOTORCYCLE, SNOWMBL SLS, SRV SHIP BUILDING GENERAL SHIP DOCKING (EXPIRED JAN 1, 2009) SHIPBUILDING SHIPFITTER STRUCTURAL RPR OF MARINE PLEASURE CRAFT WATER TAXI
WHOLESALE AND RETAIL GENERAL APPLIANCES – SALE & SERVICE BEER DEALER AND DELIVERY BOOK, STATIONERY STORES, ETC. BUILDING MATERIALS WHOLESALE CARD STORE CLERK CHEMICAL WHOLESALE CLOTHING AND SHOE STORES CLOTHING, LINEN, OTHER TEXTILE WHOLESALE COMMERCIAL RETAIL SIGN SHOP CONVENIENCE OPERATION FUEL AND FOOD DEPARTMENT/GENERAL STORES

Occupational Disease Canadian Institute of Actuaries
Oliver Wyman Actuarial Consulting
Page 142
DRUG STORES DRUG, VITAMIN, OR BEAUTY AID WHOLESALE ELECTRONIC EQUIPMENT – SELL/SERVICE FARM IMPLEMENT DEALERS FEED FERTILIZER GRAIN HAY DEALER FIRE PREV EQUIP SALES, SERV, INSTL, INSPECT FLOORING STORE FLORISTS, WHOLESALE AND RETAIL FOOD, BEVERAGE, TOBACCO PRODUCT WHOLESALE FURNITURE SALES AND DISTRIBUTORS FURRIERS GARDEN SUPPLY CENTRE GENERAL RETAIL HEAVY EQUIP, MACH, PARTS SALES, RNT, SRV, RPR HOME IMPROVEMENT CENTRES HOME PROVISIONER/BUTCHER SHOPS INDUSTRIAL SUPPLY STORES JEWELLERY STORES JUNK DEALER LARGE MACHINE DISTRIBUTION LARGE RETAIL STORE LEATHER, WOOL, FABRIC DEALER LIQUOR DISTRIBUTION BRANCH LUMBERYARD OPERATIONS MACHINERY DEALERS AND DRIVERS MEDICAL EQUIPMENT – SALES/SERVICE MEDICAL OR DENTAL SUPPLIES WHOLESALE NEWS STAND SALES NEWSPAPER/FLYER DISTRIBUTION OFFICE EQUIPMENT – SALES/SERVICE OUTSIDE SALES PARTY SUPPLY PHOTOGRAPHIC SUPPLIES PIPE SHOP PLUMBERS’ SUPPLY DEALERS PROPANE DEALERS REFRIGERATION EQUIP – SALES/SERVICE RETAIL BAKERY OR DELICATESSEN RETAILERS NOC SAFETY EQUIPMENT – SALE/RENTAL SCRAP/SALVAGE DEALERS SEATING, SALES/INSTALLATION SEED DEALER SHOE STORES STEEL OR METAL WHOLESALE (PRIMARY FORM) STORE – MEAT, GROCERIES, PROVISIONS COMBINED STORES CLOTHING, APPAREL, DRY GOODS, RETAIL STORES HARDWARE SUPERMARKET WHOLESALE

Occupational Disease Canadian Institute of Actuaries
Oliver Wyman Actuarial Consulting
Page 143
Appendix E: Distribution of Claims by Disease Type and Industry Group The following three charts provide the distribution of claims by disease type and industry group for the set of recommended diseases. First Chart: Raw Claim Count Data Second Chart: Normalized by Industry Group The sum of the percentages in each row will equal 100%, for each industry group. This chart is unbiased and gives an accurate (to the extent data is credible) representation of the likelihood of a specific disease within each industry group. Third Chart: Normalized by Disease The sum of the percentages in each column will equal 100% for each disease. This chart is likely biased due to over-/under-representation of each industry group in the underlying data. This is especially true for Vessel Operation, which includes data from two large U.S. shipbuilding firms.

Occupational Disease Canadian Institute of Actuaries
Oliver Wyman Actuarial Consulting
Page 144
MES
OTH
ELIO
MA
ASB
ESTO
SIS
OBS
TRU
CTIV
EA
LL C
UM
ULA
TIV
ECA
RPA
LPN
EUM
OCO
NIO
SIS
& L
UN
G C
AN
CER
RESP
IRA
TORY
TRA
UM
A E
XCEP
TTU
NN
ELA
LL O
THER
EXCE
PTCO
MBI
NED
DIS
EASE
SCA
RPA
L TU
NN
ELSY
ND
ROM
ECA
NCE
RA
SBES
TOSI
SH
EARI
NG
LO
SS
AG
RICU
LTU
RE /
FA
RMIN
G /
AQ
UA
CULT
URE
019
383
146
12
456
AIR
CRA
FT O
PERA
TIO
N, S
ERV
ICE,
MA
NU
FACT
URI
NG
, OR
REPA
IR6
4544
210
51
060
5A
NIM
AL
CARE
, TRA
ININ
G, B
REED
ING
, BO
ARD
ING
03
4539
00
141
AU
TOM
OBI
LE S
ALE
S, S
ERV
ICE,
MA
NU
FACT
URI
NG
, OR
REPA
IR38
250
1,80
61,
096
113
2,04
0BU
ILD
ING
MA
INTA
INEN
CE A
ND
OPE
RATI
ON
S69
117
843
440
11
387
CLER
ICA
L10
941,
525
1,42
41
020
4CO
NST
RUCT
ION
253
170
1,37
573
611
132,
998
CON
TRA
CTIN
G73
830
13,
935
1,64
819
166,
184
EDU
CATI
ON
AN
D R
ELIG
IOU
S IN
STIT
UTI
ON
S47
184
1,62
462
21
094
5FI
REFI
GH
TER
328
3917
70
72FO
OD
MA
NU
FACT
URI
NG
1313
35,
347
1,47
32
151,
197
FOO
D S
ERV
ICE
350
1,84
51,
031
01
44G
ENER
AL
SERV
ICES
7275
593
165
2215
474
GO
VER
NM
ENT
101
369
3,98
11,
764
223
83,
714
HEA
LTH
CA
RE S
ERV
ICES
3234
24,
407
1,36
07
374
3H
OSP
ITA
LITY
AN
D E
NTE
RTA
INM
ENT
1289
1,69
664
12
039
5LA
ND
SCA
PIN
G1
622
598
10
118
LIV
ESTO
CK A
ND
PO
ULT
RY F
ARM
ING
012
228
111
30
128
LOG
GIN
G A
ND
TRE
E SE
RVIC
E5
3271
728
50
02,
811
MA
NU
FACT
URI
NG
GEN
ERA
L37
284
67,
664
3,66
724
3111
,034
MA
RIN
E TE
RMIN
AL
OPE
RATI
ON
5418
205
890
11,
548
MO
TOR
VEH
ICLE
OPE
RATI
ON
OTH
ER T
HA
N T
RUCK
ING
224
468
162
14
283
NA
TURA
L RE
SOU
RCE
EXTR
ACT
ION
, REF
ININ
G, S
TORA
GE,
TRA
NSP
ORT
163
218
792
458
2128
5,18
9PO
LICE
OFF
ICER
S1
1690
290
119
8RE
TAIL
SER
VIC
ES2
5682
040
60
014
8SO
CIA
L SE
RVIC
ES2
4986
828
40
144
TELE
COM
MU
NIC
ATI
ON
AN
D B
ROA
DCA
STIN
G7
828
411
11
144
2TR
UCK
ING
2510
285
336
01
52,
493
UN
KNO
WN
154
126
330
215
422
461
UTI
LITY
PRO
DU
CTIO
N, D
ISTR
IBU
TIO
N, M
AIN
TAIN
ENCE
388
205
103
12
602
VEH
ICLE
OTH
ER T
HA
N A
UTO
MO
BILE
SA
LES,
SER
VIC
E, M
AN
UFA
CTU
RIN
G, O
R RE
PAIR
49
8648
10
117
VES
SEL
OPE
RATI
ON
, SER
VIC
E, M
AN
UFA
CTU
RIN
G, O
R RE
PAIR
1,12
497
47,
976
1,47
484
58,
484
WH
OLE
SALE
AN
D R
ETA
IL G
ENER
AL
6118
74,
529
1,48
51
101,
929
TOTA
L3,
412
4,96
056
,226
22,0
9245
218
856
,628
DIS
TRIB
UTI
ON
OF
CLAI
MS
BY D
ISEA
SE T
YPE
AND
IND
UST
RY G
ROU
P

Occupational Disease Canadian Institute of Actuaries
Oliver Wyman Actuarial Consulting
Page 145
MES
OTH
ELIO
MA
ASB
ESTO
SIS
OBS
TRU
CTIV
EA
LL C
UM
ULA
TIV
ECA
RPA
LPN
EUM
OCO
NIO
SIS
& L
UN
G C
AN
CER
RESP
IRA
TORY
TRA
UM
A E
XCEP
TTU
NN
ELA
LL O
THER
EXCE
PTCO
MBI
NED
DIS
EASE
SCA
RPA
L TU
NN
ELSY
ND
ROM
ECA
NCE
RA
SBES
TOSI
SH
EARI
NG
LO
SS
AG
RICU
LTU
RE /
FA
RMIN
G /
AQ
UA
CULT
URE
0%2%
38%
14%
0%0%
45%
AIR
CRA
FT O
PERA
TIO
N, S
ERV
ICE,
MA
NU
FACT
URI
NG
, OR
REPA
IR0%
4%37
%9%
0%0%
50%
AN
IMA
L CA
RE, T
RAIN
ING
, BRE
EDIN
G, B
OA
RDIN
G0%
1%20
%17
%0%
0%62
%A
UTO
MO
BILE
SA
LES,
SER
VIC
E, M
AN
UFA
CTU
RIN
G, O
R RE
PAIR
1%5%
34%
21%
0%0%
39%
BUIL
DIN
G M
AIN
TAIN
ENCE
AN
D O
PERA
TIO
NS
4%6%
45%
24%
0%0%
21%
CLER
ICA
L0%
3%47
%44
%0%
0%6%
CON
STRU
CTIO
N5%
3%25
%13
%0%
0%54
%CO
NTR
ACT
ING
6%2%
31%
13%
0%0%
48%
EDU
CATI
ON
AN
D R
ELIG
IOU
S IN
STIT
UTI
ON
S1%
5%47
%18
%0%
0%28
%FI
REFI
GH
TER
2%17
%23
%10
%4%
0%43
%FO
OD
MA
NU
FACT
URI
NG
0%2%
65%
18%
0%0%
15%
FOO
D S
ERV
ICE
0%2%
62%
35%
0%0%
1%G
ENER
AL
SERV
ICES
5%5%
42%
12%
2%1%
33%
GO
VER
NM
ENT
1%4%
39%
17%
2%0%
37%
HEA
LTH
CA
RE S
ERV
ICES
0%5%
64%
20%
0%0%
11%
HO
SPIT
ALI
TY A
ND
EN
TERT
AIN
MEN
T0%
3%60
%23
%0%
0%14
%LA
ND
SCA
PIN
G0%
1%50
%22
%0%
0%26
%LI
VES
TOCK
AN
D P
OU
LTRY
FA
RMIN
G0%
2%47
%23
%1%
0%27
%LO
GG
ING
AN
D T
REE
SERV
ICE
0%1%
19%
7%0%
0%73
%M
AN
UFA
CTU
RIN
G G
ENER
AL
2%4%
32%
16%
0%0%
47%
MA
RIN
E TE
RMIN
AL
OPE
RATI
ON
3%1%
11%
5%0%
0%81
%M
OTO
R V
EHIC
LE O
PERA
TIO
N O
THER
TH
AN
TRU
CKIN
G0%
3%50
%17
%0%
0%30
%N
ATU
RAL
RESO
URC
E EX
TRA
CTIO
N, R
EFIN
ING
, STO
RAG
E, T
RAN
SPO
RT2%
3%12
%7%
0%0%
76%
POLI
CE O
FFIC
ERS
0%5%
27%
9%0%
0%59
%RE
TAIL
SER
VIC
ES0%
4%57
%28
%0%
0%10
%SO
CIA
L SE
RVIC
ES0%
4%70
%23
%0%
0%4%
TELE
COM
MU
NIC
ATI
ON
AN
D B
ROA
DCA
STIN
G1%
1%33
%13
%0%
0%52
%TR
UCK
ING
1%3%
22%
9%0%
0%65
%U
NKN
OW
N12
%10
%25
%16
%0%
2%35
%U
TILI
TY P
ROD
UCT
ION
, DIS
TRIB
UTI
ON
, MA
INTA
INEN
CE4%
1%21
%11
%0%
0%63
%V
EHIC
LE O
THER
TH
AN
AU
TOM
OBI
LE S
ALE
S, S
ERV
ICE,
MA
NU
FACT
URI
NG
, OR
REPA
IR2%
3%32
%18
%0%
0%44
%V
ESSE
L O
PERA
TIO
N, S
ERV
ICE,
MA
NU
FACT
URI
NG
, OR
REPA
IR6%
5%40
%7%
0%0%
42%
WH
OLE
SALE
AN
D R
ETA
IL G
ENER
AL
1%2%
55%
18%
0%0%
24%
DIS
TRIB
UTI
ON
OF
CLAI
MS
BY D
ISEA
SE T
YPE
AND
IND
UST
RY G
ROU
P, N
ORM
ALIZ
ED B
Y IN
DU
STRY
GRO
UP

Occupational Disease Canadian Institute of Actuaries
Oliver Wyman Actuarial Consulting
Page 146
MES
OTH
ELIO
MA
ASB
ESTO
SIS
OBS
TRU
CTIV
EA
LL C
UM
ULA
TIV
ECA
RPA
LPN
EUM
OCO
NIO
SIS
& L
UN
G C
AN
CER
RESP
IRA
TORY
TRA
UM
A E
XCEP
TTU
NN
ELA
LL O
THER
EXCE
PTCO
MBI
NED
DIS
EASE
SCA
RPA
L TU
NN
ELSY
ND
ROM
ECA
NCE
RA
SBES
TOSI
SH
EARI
NG
LO
SS
AG
RICU
LTU
RE /
FA
RMIN
G /
AQ
UA
CULT
URE
0%0%
1%1%
0%1%
1%A
IRCR
AFT
OPE
RATI
ON
, SER
VIC
E, M
AN
UFA
CTU
RIN
G, O
R RE
PAIR
0%1%
1%0%
0%0%
1%A
NIM
AL
CARE
, TRA
ININ
G, B
REED
ING
, BO
ARD
ING
0%0%
0%0%
0%0%
0%A
UTO
MO
BILE
SA
LES,
SER
VIC
E, M
AN
UFA
CTU
RIN
G, O
R RE
PAIR
1%5%
3%5%
2%2%
4%BU
ILD
ING
MA
INTA
INEN
CE A
ND
OPE
RATI
ON
S2%
2%1%
2%0%
1%1%
CLER
ICA
L0%
2%3%
6%0%
0%0%
CON
STRU
CTIO
N7%
3%2%
3%2%
7%5%
CON
TRA
CTIN
G22
%6%
7%7%
4%9%
11%
EDU
CATI
ON
AN
D R
ELIG
IOU
S IN
STIT
UTI
ON
S1%
4%3%
3%0%
0%2%
FIRE
FIG
HTE
R0%
1%0%
0%2%
0%0%
FOO
D M
AN
UFA
CTU
RIN
G0%
3%10
%7%
0%8%
2%FO
OD
SER
VIC
E0%
1%3%
5%0%
1%0%
GEN
ERA
L SE
RVIC
ES2%
2%1%
1%5%
8%1%
GO
VER
NM
ENT
3%7%
7%8%
49%
4%7%
HEA
LTH
CA
RE S
ERV
ICES
1%7%
8%6%
2%2%
1%H
OSP
ITA
LITY
AN
D E
NTE
RTA
INM
ENT
0%2%
3%3%
0%0%
1%LA
ND
SCA
PIN
G0%
0%0%
0%0%
0%0%
LIV
ESTO
CK A
ND
PO
ULT
RY F
ARM
ING
0%0%
0%1%
1%0%
0%LO
GG
ING
AN
D T
REE
SERV
ICE
0%1%
1%1%
0%0%
5%M
AN
UFA
CTU
RIN
G G
ENER
AL
11%
17%
14%
17%
5%16
%19
%M
ARI
NE
TERM
INA
L O
PERA
TIO
N2%
0%0%
0%0%
1%3%
MO
TOR
VEH
ICLE
OPE
RATI
ON
OTH
ER T
HA
N T
RUCK
ING
0%0%
1%1%
0%2%
0%N
ATU
RAL
RESO
URC
E EX
TRA
CTIO
N, R
EFIN
ING
, STO
RAG
E, T
RAN
SPO
RT5%
4%1%
2%5%
15%
9%PO
LICE
OFF
ICER
S0%
0%0%
0%0%
1%0%
RETA
IL S
ERV
ICES
0%1%
1%2%
0%0%
0%SO
CIA
L SE
RVIC
ES0%
1%2%
1%0%
1%0%
TELE
COM
MU
NIC
ATI
ON
AN
D B
ROA
DCA
STIN
G0%
0%1%
1%0%
1%1%
TRU
CKIN
G1%
2%2%
2%0%
3%4%
UN
KNO
WN
5%3%
1%1%
1%12
%1%
UTI
LITY
PRO
DU
CTIO
N, D
ISTR
IBU
TIO
N, M
AIN
TAIN
ENCE
1%0%
0%0%
0%1%
1%V
EHIC
LE O
THER
TH
AN
AU
TOM
OBI
LE S
ALE
S, S
ERV
ICE,
MA
NU
FACT
URI
NG
, OR
REPA
IR0%
0%0%
0%0%
0%0%
VES
SEL
OPE
RATI
ON
, SER
VIC
E, M
AN
UFA
CTU
RIN
G, O
R RE
PAIR
33%
20%
14%
7%19
%3%
15%
WH
OLE
SALE
AN
D R
ETA
IL G
ENER
AL
2%4%
8%7%
0%5%
3%
DIS
TRIB
UTI
ON
OF
CLAI
MS
BY D
ISEA
SE T
YPE
AND
IND
UST
RY G
ROU
P, N
ORM
ALIZ
ED B
Y D
ISEA
SE

Occupational Disease Canadian Institute of Actuaries
Oliver Wyman Actuarial Consulting
Page 147
Appendix F: Combined Metrics for Recommended Set of Diseases Cumulative Trauma Except Carpal Tunnel Syndrome Asbestosis, Mesothelioma, and Lung Cancer Respiratory Diseases Combined

Occupational Disease Canadian Institute of Actuaries
Oliver Wyman Actuarial Consulting
Page 148
AVERAGE AVERAGE AVERAGE
COUNT COST AGE LAG (DAYS)
RAW MEAN 56,226 29,718 42 78
CUT OFF 8,454 2,972
ADJ MEAN 47,772 34,544 40 24
ADJ X 5 LARGEST 47,767 34,092
5 LARGEST 5 4,347,569
LARGEST 1 5,717,959
ALL LAG <= 2 Yrs LAG > 2 Yrs
AVERAGE AGE 40 42 49
AVERAGE LAG (YEARS) 0.2 0.1 6.3
COUNT 53,718 52,845 873
COUNT PERCENTAGE 98% 2%
M F U
GENDER 30,773 24,932 521
GENDER PERCENTAGE 55% 44% 1%
ALL CUMULATIVE TRAUMA COMBINED
COUNT PERCENTAGE
AGRICULTURE / FARMING / AQUACULTURE 383 1%
AIRCRAFT OPERATION, SERVICE, MANUFACTURING, OR REPAIR 442 1%
ANIMAL CARE, TRAINING, BREEDING, BOARDING 45 0%
AUTOMOBILE SALES, SERVICE, MANUFACTURING, OR REPAIR 1,806 3%
BUILDING MAINTAINENCE AND OPERATIONS 843 1%
CLERICAL 1,525 3%
CONSTRUCTION 1,375 2%
CONTRACTING 3,935 7%
EDUCATION AND RELIGIOUS INSTITUTIONS 1,624 3%
FIREFIGHTER 39 0%
FOOD MANUFACTURING 5,347 10%
FOOD SERVICE 1,845 3%
GENERAL SERVICES 593 1%
GOVERNMENT 3,981 7%
HEALTH CARE SERVICES 4,407 8%
HOSPITALITY AND ENTERTAINMENT 1,696 3%
LANDSCAPING 225 0%
LIVESTOCK AND POULTRY FARMING 228 0%
LOGGING AND TREE SERVICE 717 1%
MANUFACTURING GENERAL 7,664 14%
MARINE TERMINAL OPERATION 205 0%
MOTOR VEHICLE OPERATION OTHER THAN TRUCKING 468 1%
NATURAL RESOURCE EXTRACTION, REFINING, STORAGE, TRANSPORT 792 1%
POLICE OFFICERS 90 0%
RETAIL SERVICES 820 1%
SOCIAL SERVICES 868 2%
TELECOMMUNICATION AND BROADCASTING 284 1%
TRUCKING 853 2%
UNKNOWN 330 1%
UTILITY PRODUCTION, DISTRIBUTION, MAINTAINENCE 205 0%
VEHICLE OTHER THAN AUTOMOBILE SALES, SERVICE, MANUFACTURING, OR REPAIR 86 0%
VESSEL OPERATION, SERVICE, MANUFACTURING, OR REPAIR 7,976 14%
WHOLESALE AND RETAIL GENERAL 4,529 8%
ALL CUMULATIVE TRAUMA COMBINED

Occupational Disease Canadian Institute of Actuaries
Oliver Wyman Actuarial Consulting
Page 149
0.00
0.20
0.40
0.60
0.80
1.00
20 25 30 35 40 45 50 55 60 65 70 75 80 85 90 95 100
Rela
tive
Clai
m C
ount
Age at Report
ALL CUMULATIVE TRAUMA COMBINEDAge at Report
0.00
0.15
0.30
0.45
0.60
Rela
tive
Clai
m C
ount
Cost as Measured of Portion of Raw Mean
ALL CUMULATIVE TRAUMA COMBINEDCost Distribution at 2013 Cost Level Relative to Raw Mean
Raw Mean = $29,718

Occupational Disease Canadian Institute of Actuaries
Oliver Wyman Actuarial Consulting
Page 150
AVERAGE AVERAGE AVERAGE
COUNT COST AGE LAG (DAYS)
RAW MEAN 3,412 200,898 65 1,319
CUT OFF 1,146 20,090
ADJ MEAN 2,266 300,228 66 1,228
ADJ X 5 LARGEST 2,261 293,246 66 1,230
5 LARGEST 5 3,457,662 45 521
LARGEST 1 5,318,207 43 363
ALL LAG <= 2 Yrs LAG > 2 Yrs
AVERAGE AGE 64 65 68
AVERAGE LAG (YEARS) 3.6 0.4 12.3
COUNT 3,332 2,430 902
COUNT PERCENTAGE 73% 27%
M F U
GENDER 3,301 78 33
GENDER PERCENTAGE 97% 2% 1%
ASBESTOSIS, MESOTHELIOMA, LUNG CANCER
COUNT PERCENTAGE
AGRICULTURE / FARMING / AQUACULTURE 0 0%
AIRCRAFT OPERATION, SERVICE, MANUFACTURING, OR REPAIR 6 0%
ANIMAL CARE, TRAINING, BREEDING, BOARDING 0 0%
AUTOMOBILE SALES, SERVICE, MANUFACTURING, OR REPAIR 38 1%
BUILDING MAINTAINENCE AND OPERATIONS 69 2%
CLERICAL 10 0%
CONSTRUCTION 253 7%
CONTRACTING 738 22%
EDUCATION AND RELIGIOUS INSTITUTIONS 47 1%
FIREFIGHTER 3 0%
FOOD MANUFACTURING 13 0%
FOOD SERVICE 3 0%
GENERAL SERVICES 72 2%
GOVERNMENT 101 3%
HEALTH CARE SERVICES 32 1%
HOSPITALITY AND ENTERTAINMENT 12 0%
LANDSCAPING 1 0%
LIVESTOCK AND POULTRY FARMING 0 0%
LOGGING AND TREE SERVICE 5 0%
MANUFACTURING GENERAL 372 11%
MARINE TERMINAL OPERATION 54 2%
MOTOR VEHICLE OPERATION OTHER THAN TRUCKING 2 0%
NATURAL RESOURCE EXTRACTION, REFINING, STORAGE, TRANSPORT 163 5%
POLICE OFFICERS 1 0%
RETAIL SERVICES 2 0%
SOCIAL SERVICES 2 0%
TELECOMMUNICATION AND BROADCASTING 7 0%
TRUCKING 25 1%
UNKNOWN 154 5%
UTILITY PRODUCTION, DISTRIBUTION, MAINTAINENCE 38 1%
VEHICLE OTHER THAN AUTOMOBILE SALES, SERVICE, MANUFACTURING, OR REPAIR 4 0%
VESSEL OPERATION, SERVICE, MANUFACTURING, OR REPAIR 1,124 33%
WHOLESALE AND RETAIL GENERAL 61 2%
ASBESTOSIS, MESOTHELIOMA, LUNG CANCER

Occupational Disease Canadian Institute of Actuaries
Oliver Wyman Actuarial Consulting
Page 151
0.00
0.20
0.40
0.60
0.80
1.00
20 25 30 35 40 45 50 55 60 65 70 75 80 85 90 95 100
Rela
tive
Clai
m C
ount
Age at Report
ASBESTOSIS, MESOTHELIOMA, LUNG CANCERAge at Report
0.00
0.15
0.30
0.45
0.60
Rela
tive
Clai
m C
ount
Cost as Measured of Portion of Raw Mean
ASBESTOSIS, MESOTHELIOMA, LUNG CANCERCost Distribution at 2013 Cost Level Relative to Raw Mean
Raw Mean = $200,898

Occupational Disease Canadian Institute of Actuaries
Oliver Wyman Actuarial Consulting
Page 152
AVERAGE AVERAGE AVERAGE
COUNT COST AGE LAG (DAYS)
RAW MEAN 4,960 83,144 44 379
CUT OFF 2,778 8,314
ADJ MEAN 2,182 185,561 44 475
ADJ X 5 LARGEST 2,177 174,717
5 LARGEST 5 4,907,085
LARGEST 1 7,187,645 55 7,316
ALL LAG <= 2 Yrs LAG > 2 Yrs
AVERAGE AGE 40 43 59
AVERAGE LAG (YEARS) 1.0 0.2 9.5
COUNT 4,506 4,089 417
COUNT PERCENTAGE 91% 9%
M F U
GENDER 3,687 1,257 16
GENDER PERCENTAGE 74% 25% 0%
RESPIRATORY DISEASES COMBINED
COUNT PERCENTAGE
AGRICULTURE / FARMING / AQUACULTURE 19 0%
AIRCRAFT OPERATION, SERVICE, MANUFACTURING, OR REPAIR 45 1%
ANIMAL CARE, TRAINING, BREEDING, BOARDING 3 0%
AUTOMOBILE SALES, SERVICE, MANUFACTURING, OR REPAIR 250 5%
BUILDING MAINTAINENCE AND OPERATIONS 117 2%
CLERICAL 94 2%
CONSTRUCTION 170 3%
CONTRACTING 301 6%
EDUCATION AND RELIGIOUS INSTITUTIONS 184 4%
FIREFIGHTER 28 1%
FOOD MANUFACTURING 133 3%
FOOD SERVICE 50 1%
GENERAL SERVICES 75 2%
GOVERNMENT 369 7%
HEALTH CARE SERVICES 342 7%
HOSPITALITY AND ENTERTAINMENT 89 2%
LANDSCAPING 6 0%
LIVESTOCK AND POULTRY FARMING 12 0%
LOGGING AND TREE SERVICE 32 1%
MANUFACTURING GENERAL 846 17%
MARINE TERMINAL OPERATION 18 0%
MOTOR VEHICLE OPERATION OTHER THAN TRUCKING 24 0%
NATURAL RESOURCE EXTRACTION, REFINING, STORAGE, TRANSPORT 218 4%
POLICE OFFICERS 16 0%
RETAIL SERVICES 56 1%
SOCIAL SERVICES 49 1%
TELECOMMUNICATION AND BROADCASTING 8 0%
TRUCKING 102 2%
UNKNOWN 126 3%
UTILITY PRODUCTION, DISTRIBUTION, MAINTAINENCE 8 0%
VEHICLE OTHER THAN AUTOMOBILE SALES, SERVICE, MANUFACTURING, OR REPAIR 9 0%
VESSEL OPERATION, SERVICE, MANUFACTURING, OR REPAIR 974 20%
WHOLESALE AND RETAIL GENERAL 187 4%
RESPIRATORY DISEASES COMBINED

Occupational Disease Canadian Institute of Actuaries
Oliver Wyman Actuarial Consulting
Page 153
0.00
0.20
0.40
0.60
0.80
1.00
20 25 30 35 40 45 50 55 60 65 70 75 80 85 90 95 100
Rela
tive
Clai
m C
ount
Age at Report
RESPIRATORY DISEASES COMBINEDAge at Report
0.00
0.20
0.40
0.60
0.80
Rela
tive
Clai
m C
ount
Cost as Measured of Portion of Raw Mean
RESPIRATORY DISEASES COMBINEDCost Distribution at 2013 Cost Level Relative to Raw Mean
Raw Mean = $83,144

Occupational Disease Canadian Institute of Actuaries
Oliver Wyman Actuarial Consulting
Page 154
Appendix G: Industry Group Distribution 1 MESOTHELIOMA 2 LUNG CANCER 3 ALL OTHER CANCER 4 HEARING LOSS 5 INFECTION 6 EYE CONDITION 7 MENTAL STRESS 8 PHYSICAL STRESS 9 REACTION TO FOREIGN SUBSTANCE 10 VASCULAR 11 OBSTRUCTIVE RESPIRATORY DISEASE 12 PNEUMOCONIOSIS EXCEPT ASBESTOSIS 13 ASBESTOSIS 14 ALL OTHER RESPIRATORY 15 BURSITIS 16 EPICONDYLITIS 17 TENDONITIS 18 TENOSYNOVITIS 19 OTHER INFLAMMATION 20 CARPAL TUNNEL SYNDROME 21 NERVE DISEASE 22 SPRAIN/STRAIN/TEAR 23 HERNIA 24 OTHER CUMULATIVE TRAUMA

Occupational Disease Canadian Institute of Actuaries
Oliver Wyman Actuarial Consulting
Page 155
1
2
3
4
5
6
7
8
9
10
11
12
13
14
15
16
17
18
19
20
21
22
23
24
AG
RIC
ULT
UR
E / F
AR
MIN
G /
AQ
UA
CU
LTU
RE
00
145
61
01
012
05
20
1463
222
82
2414
63
561
7A
IRC
RA
FT O
PER
ATI
ON
, SER
VIC
E, M
AN
UFA
CTU
RIN
G, O
R R
EPA
IR3
01
605
10
20
110
240
321
6332
175
212
105
113
60
22A
NIM
AL
CA
RE,
TR
AIN
ING
, BR
EED
ING
, BO
AR
DIN
G0
00
141
00
70
10
20
01
51
160
839
011
04
AU
TOM
OB
ILE
SALE
S, S
ERVI
CE,
MA
NU
FAC
TUR
ING
, OR
REP
AIR
211
112,
040
32
956
924
443
1620
618
210
034
112
204
1,09
648
805
3512
7B
UIL
DIN
G M
AIN
TAIN
ENC
E A
ND
OPE
RA
TIO
NS
150
138
74
083
825
016
154
101
8029
161
515
244
07
340
1165
CLE
RIC
AL
70
120
47
147
115
193
350
359
6927
293
1425
21,
424
1676
40
106
CO
NST
RU
CTI
ON
474
112,
998
60
1810
600
1913
202
151
124
112
331
1112
673
621
537
1811
6C
ON
TRA
CTI
NG
236
719
6,18
44
115
2186
460
1649
524
174
717
91,
167
1336
61,
648
251,
179
3225
2ED
UC
ATI
ON
AN
D R
ELIG
IOU
S IN
STIT
UTI
ON
S22
31
945
92
128
430
175
022
109
192
8751
216
7862
210
611
012
8FI
REF
IGH
TER
03
772
40
3027
20
30
025
10
21
617
025
13
FOO
D M
AN
UFA
CTU
RIN
G6
02
1,19
72
17
163
126
157
107
195
290
1,54
671
258
1,47
314
2,22
34
760
FOO
D S
ERVI
CE
21
044
281
625
2311
171
033
139
113
650
2322
81,
031
1657
214
106
GEN
ERA
L SE
RVI
CES
286
2247
43
010
027
211
1538
6446
5020
91
3416
56
208
243
GO
VER
NM
ENT
2910
223
3,71
487
399
232
9714
988
6227
134
220
51,
053
1839
81,
764
221,
645
1730
3H
EALT
H C
AR
E SE
RVI
CES
131
774
347
1023
73
982
161
318
181
385
196
1,41
326
310
1,36
017
1,84
35
229
HO
SPIT
ALI
TY A
ND
EN
TER
TAIN
MEN
T8
02
395
20
662
305
330
456
207
8458
29
113
641
658
59
107
LAN
DSC
API
NG
10
111
80
02
04
02
00
443
811
91
598
441
35
LIVE
STO
CK
AN
D P
OU
LTR
Y FA
RM
ING
00
312
80
02
15
05
00
748
015
20
611
14
164
2LO
GG
ING
AN
D T
REE
SER
VIC
E4
00
2,81
11
014
910
29
01
2312
95
344
264
285
2813
28
33M
AN
UFA
CTU
RIN
G G
ENER
AL
140
1124
11,0
345
312
98
201
825
831
221
588
853
345
2,42
656
755
3,66
779
2,72
681
422
MA
RIN
E TE
RM
INA
L O
PER
ATI
ON
170
01,
548
10
10
70
31
3715
2921
771
989
355
013
MO
TOR
VEH
ICLE
OPE
RA
TIO
N O
THER
TH
AN
TR
UC
KIN
G2
01
283
10
161
102
104
014
5817
890
5516
26
217
428
NA
TUR
AL
RES
OU
RC
E EX
TRA
CTI
ON
, REF
ININ
G, S
TOR
AG
E, T
RA
NSP
OR
T66
421
5,18
98
05
259
015
2893
203
5568
186
727
458
1338
00
69PO
LIC
E O
FFIC
ERS
10
019
85
097
85
33
10
135
519
112
291
451
2R
ETA
IL S
ERVI
CES
20
014
83
124
041
613
00
4366
3032
510
8940
68
242
256
SOC
IAL
SER
VIC
ES1
00
442
166
112
124
11
2548
7821
03
4928
41
411
168
TELE
CO
MM
UN
ICA
TIO
N A
ND
BR
OA
DC
AST
ING
60
144
20
07
03
03
11
542
2111
54
711
11
830
12TR
UC
KIN
G16
01
2,49
30
052
2627
158
59
9446
5811
85
9836
08
429
2277
UN
KN
OW
N52
04
461
11
3613
364
2722
102
992
69
076
215
120
17
29U
TILI
TY P
RO
DU
CTI
ON
, DIS
TRIB
UTI
ON
, MA
INTA
INEN
CE
140
160
26
017
23
01
224
715
1340
028
103
189
020
VEH
ICLE
OTH
ER T
HA
N A
UTO
MO
BIL
E SA
LES,
SER
VIC
E, M
AN
UFA
CTU
RIN
G, O
R R
EPA
IR0
11
117
00
30
20
10
38
197
300
548
222
03
VESS
EL O
PER
ATI
ON
, SER
VIC
E, M
AN
UFA
CTU
RIN
G, O
R R
EPA
IR14
219
584
8,48
41
814
016
024
1694
578
788
016
48
138
1012
31,
474
995
6,69
283
74
WH
OLE
SALE
AN
D R
ETA
IL G
ENER
AL
342
11,
929
70
155
1158
1060
1025
127
687
187
1,86
827
291
1,48
524
1,23
742
190
TOTA
L93
524
945
256
,628
249
352,
990
376
1,18
311
41,
165
188
2,22
83,
795
5,14
92,
384
14,9
4435
14,
268
22,0
921,
391
24,5
581,
161
3,41
1
DIS
TRIB
UTI
ON
OF
CLA
IMS
BY
DIS
EASE
TYP
E A
ND
IND
UST
RY
GR
OU
P

Occupational Disease Canadian Institute of Actuaries
Oliver Wyman Actuarial Consulting
Page 156
1
2
3
4
5
6
7
8
9
10
11
12
13
14
15
16
17
18
19
20
21
22
23
24
A
GR
ICU
LTU
RE
/ FA
RM
ING
/ A
QU
AC
ULT
UR
E0%
0%0%
45%
0%0%
0%0%
1%0%
0%0%
0%1%
6%0%
22%
0%2%
14%
0%5%
0%1%
AIR
CR
AFT
OPE
RA
TIO
N, S
ERVI
CE,
MA
NU
FAC
TUR
ING
, OR
REP
AIR
0%0%
0%50
%0%
0%0%
0%1%
0%2%
0%0%
2%5%
3%14
%0%
1%9%
0%11
%0%
2%A
NIM
AL
CA
RE,
TR
AIN
ING
, BR
EED
ING
, BO
AR
DIN
G0%
0%0%
60%
0%0%
3%0%
0%0%
1%0%
0%0%
2%0%
7%0%
3%17
%0%
5%0%
2%A
UTO
MO
BIL
E SA
LES,
SER
VIC
E, M
AN
UFA
CTU
RIN
G, O
R R
EPA
IR0%
0%0%
37%
0%0%
2%0%
2%0%
1%0%
0%4%
3%2%
6%0%
4%20
%1%
15%
1%2%
BU
ILD
ING
MA
INTA
INEN
CE
AN
D O
PER
ATI
ON
S1%
0%0%
19%
0%0%
4%0%
1%0%
1%0%
3%5%
4%1%
8%0%
8%22
%0%
17%
1%3%
CLE
RIC
AL
0%0%
0%5%
0%0%
12%
0%1%
0%1%
0%0%
2%2%
1%8%
0%7%
38%
0%20
%0%
3%C
ON
STR
UC
TIO
N1%
0%0%
53%
0%0%
0%0%
1%0%
0%0%
4%3%
2%2%
6%0%
2%13
%0%
9%0%
2%C
ON
TRA
CTI
NG
2%0%
0%48
%0%
0%0%
0%1%
0%0%
0%4%
2%6%
1%9%
0%3%
13%
0%9%
0%2%
EDU
CA
TIO
N A
ND
REL
IGIO
US
INST
ITU
TIO
NS
1%0%
0%26
%0%
0%4%
0%1%
0%2%
0%1%
3%5%
2%14
%0%
2%17
%0%
17%
0%4%
FIR
EFIG
HTE
R0%
1%3%
31%
2%0%
13%
12%
1%0%
1%0%
0%11
%0%
0%1%
0%3%
7%0%
11%
0%1%
FOO
D M
AN
UFA
CTU
RIN
G0%
0%0%
14%
0%0%
0%0%
1%0%
0%0%
0%1%
2%4%
19%
1%3%
18%
0%27
%0%
9%FO
OD
SER
VIC
E0%
0%0%
1%1%
0%2%
0%1%
0%1%
0%0%
1%4%
4%21
%1%
7%33
%1%
18%
0%3%
GEN
ERA
L SE
RVI
CES
2%0%
2%32
%0%
0%1%
0%2%
0%1%
1%3%
4%3%
3%14
%0%
2%11
%0%
14%
0%3%
GO
VER
NM
ENT
0%0%
2%33
%1%
0%9%
0%1%
0%1%
0%1%
2%3%
2%9%
0%3%
15%
0%14
%0%
3%H
EALT
H C
AR
E SE
RVI
CES
0%0%
0%10
%1%
0%3%
0%1%
0%2%
0%0%
2%5%
3%19
%0%
4%19
%0%
25%
0%3%
HO
SPIT
ALI
TY A
ND
EN
TER
TAIN
MEN
T0%
0%0%
13%
0%0%
2%0%
1%0%
1%0%
0%2%
7%3%
20%
0%4%
22%
0%20
%0%
4%LA
ND
SCA
PIN
G0%
0%0%
26%
0%0%
0%0%
1%0%
0%0%
0%1%
9%2%
26%
0%1%
21%
1%9%
1%1%
LIVE
STO
CK
AN
D P
OU
LTR
Y FA
RM
ING
0%0%
1%26
%0%
0%0%
0%1%
0%1%
0%0%
1%10
%0%
31%
0%1%
22%
1%3%
1%0%
LOG
GIN
G A
ND
TR
EE S
ERVI
CE
0%0%
0%72
%0%
0%0%
0%0%
0%0%
0%0%
1%3%
0%9%
0%2%
7%1%
3%0%
1%M
AN
UFA
CTU
RIN
G G
ENER
AL
1%0%
0%46
%0%
0%1%
0%1%
0%1%
0%1%
2%4%
1%10
%0%
3%15
%0%
11%
0%2%
MA
RIN
E TE
RM
INA
L O
PER
ATI
ON
1%0%
0%80
%0%
0%0%
0%0%
0%0%
0%2%
1%2%
1%4%
0%0%
5%0%
3%0%
1%M
OTO
R V
EHIC
LE O
PER
ATI
ON
OTH
ER T
HA
N T
RU
CK
ING
0%0%
0%29
%0%
0%2%
0%1%
0%1%
0%0%
1%6%
2%9%
0%6%
17%
1%22
%0%
3%N
ATU
RA
L R
ESO
UR
CE
EXTR
AC
TIO
N, R
EFIN
ING
, STO
RA
GE,
TR
AN
SPO
RT
1%0%
0%75
%0%
0%0%
0%1%
0%0%
0%1%
3%1%
1%3%
0%0%
7%0%
5%0%
1%PO
LIC
E O
FFIC
ERS
0%0%
0%44
%1%
0%21
%2%
1%1%
1%0%
0%3%
1%1%
4%0%
3%6%
0%10
%0%
0%R
ETA
IL S
ERVI
CES
0%0%
0%10
%0%
0%2%
0%3%
0%1%
0%0%
3%4%
2%21
%1%
6%27
%1%
16%
0%4%
SOC
IAL
SER
VIC
ES0%
0%0%
3%0%
0%5%
0%1%
0%2%
0%0%
2%4%
6%16
%0%
4%21
%0%
31%
0%5%
TELE
CO
MM
UN
ICA
TIO
N A
ND
BR
OA
DC
AST
ING
1%0%
0%51
%0%
0%1%
0%0%
0%0%
0%0%
1%5%
2%13
%0%
1%13
%0%
10%
0%1%
TRU
CK
ING
0%0%
0%63
%0%
0%1%
1%1%
0%0%
0%0%
2%1%
1%3%
0%2%
9%0%
11%
1%2%
UN
KN
OW
N4%
0%0%
33%
0%0%
3%1%
3%0%
2%2%
7%7%
0%0%
1%0%
5%15
%0%
14%
0%2%
UTI
LITY
PR
OD
UC
TIO
N, D
ISTR
IBU
TIO
N, M
AIN
TAIN
ENC
E1%
0%0%
61%
1%0%
2%0%
0%0%
0%0%
2%1%
2%1%
4%0%
3%10
%0%
9%0%
2%VE
HIC
LE O
THER
TH
AN
AU
TOM
OB
ILE
SALE
S, S
ERVI
CE,
MA
NU
FAC
TUR
ING
, OR
REP
AIR
0%0%
0%43
%0%
0%1%
0%1%
0%0%
0%1%
3%7%
3%11
%0%
2%18
%1%
8%0%
1%VE
SSEL
OPE
RA
TIO
N, S
ERVI
CE,
MA
NU
FAC
TUR
ING
, OR
REP
AIR
1%1%
0%40
%0%
0%1%
1%0%
0%0%
0%4%
4%1%
0%1%
0%1%
7%5%
31%
4%0%
WH
OLE
SALE
AN
D R
ETA
IL G
ENER
AL
0%0%
0%23
%0%
0%2%
0%1%
0%1%
0%0%
1%8%
2%22
%0%
3%18
%0%
15%
0%2%
DIS
TRIB
UTI
ON
OF
CLA
IMS
BY
DIS
EASE
TYP
E A
ND
IND
UST
RY
GR
OU
P, N
OR
MA
LIZE
D B
Y IN
DU
STR
Y G
RO
UP

Occupational Disease Canadian Institute of Actuaries
Oliver Wyman Actuarial Consulting
Page 157
1
2
3
4
5
6
7
8
9
10
11
12
13
14
15
16
17
18
19
20
21
22
23
24
A
GR
ICU
LTU
RE
/ FA
RM
ING
/ A
QU
AC
ULT
UR
E0
028
76,
430
180
340
716
088
158
80
2,35
22,
189
575
6,29
648
729
4,69
523
92,
185
1822
9A
IRC
RA
FT O
PER
ATI
ON
, SER
VIC
E, M
AN
UFA
CTU
RIN
G, O
R R
EPA
IR92
30
287
8,53
118
068
065
70
4,22
80
801
3,52
82,
189
9,19
54,
832
4836
53,
377
805,
306
072
1A
NIM
AL
CA
RE,
TR
AIN
ING
, BR
EED
ING
, BO
AR
DIN
G0
00
1,98
80
023
90
600
352
00
168
174
287
442
024
31,
254
042
90
131
AU
TOM
OB
ILE
SALE
S, S
ERVI
CE,
MA
NU
FAC
TUR
ING
, OR
REP
AIR
6,46
129
53,
161
28,7
6553
83,
238
1,44
65,
491
197
7,75
288
24,
273
34,6
136,
323
28,7
339,
416
291
6,19
835
,245
3,82
831
,406
619
4,16
1B
UIL
DIN
G M
AIN
TAIN
ENC
E A
ND
OPE
RA
TIO
NS
4,61
50
287
5,45
771
02,
829
1,92
91,
492
02,
819
294
14,4
2316
,970
2,77
98,
333
4,44
612
14,
618
14,1
4955
813
,265
195
2,12
9C
LER
ICA
L2,
154
028
72,
876
123
416
,056
3,61
61,
134
147
6,16
60
801
9,91
32,
397
7,75
88,
091
339
7,65
645
,792
1,27
629
,806
03,
473
CO
NST
RU
CTI
ON
14,4
601,
180
3,16
142
,273
106
061
42,
411
3,58
10
3,34
73,
823
53,9
5225
,372
4,30
832
,181
9,14
026
63,
828
23,6
681,
675
20,9
5031
83,
800
CO
NTR
AC
TIN
G72
,608
2,06
55,
459
87,1
9671
451
15,
063
5,13
319
710
,571
4,70
613
2,20
940
,494
25,9
5351
,432
32,2
2431
511
,119
52,9
961,
994
45,9
9756
68,
256
EDU
CA
TIO
N A
ND
REL
IGIO
US
INST
ITU
TIO
NS
6,76
988
528
713
,325
159
84,
363
964
1,79
049
13,2
140
5,87
618
,315
6,67
124
,998
14,1
3838
72,
370
20,0
0279
823
,837
04,
193
FIR
EFIG
HTE
R0
885
2,01
11,
015
710
1,02
36,
509
119
052
90
04,
201
350
5524
182
547
097
518
98FO
OD
MA
NU
FAC
TUR
ING
1,84
60
575
16,8
7835
423
924
13,
760
494,
581
4,41
21,
870
17,9
796,
775
83,3
2642
,690
1,71
97,
838
47,3
681,
117
86,7
2771
24,8
99FO
OD
SER
VIC
E61
529
50
620
494
42,
114
1,20
51,
373
541
2,99
529
40
5,54
54,
829
32,4
6817
,948
557
6,92
733
,154
1,27
622
,316
248
3,47
3G
ENER
AL
SER
VIC
ES8,
615
1,77
06,
321
6,68
453
034
10
1,61
198
1,93
84,
412
10,1
4910
,754
1,59
814
,367
5,77
124
1,03
35,
306
479
8,11
535
1,40
9G
OVE
RN
MEN
T8,
922
2,94
964
,075
52,3
681,
534
1233
,816
7,71
45,
789
688
17,2
662,
353
16,5
5945
,534
11,8
8258
,903
29,0
7743
612
,092
56,7
261,
755
64,1
7730
19,
927
HEA
LTH
CA
RE
SER
VIC
ES4,
000
295
2,01
110
,477
829
398,
079
723
5,84
998
28,3
6588
24,
808
30,4
1213
,376
56,3
1739
,017
629
9,41
843
,734
1,35
671
,902
887,
502
HO
SPIT
ALI
TY A
ND
EN
TER
TAIN
MEN
T2,
461
057
55,
570
350
2,25
048
21,
790
246
5,81
40
1,06
89,
409
7,19
224
,136
16,0
7121
83,
433
20,6
1347
922
,823
159
3,50
5LA
ND
SCA
PIN
G30
80
287
1,66
40
068
023
90
352
00
672
1,49
42,
299
3,28
624
152
3,15
131
91,
600
5316
4LI
VEST
OC
K A
ND
PO
ULT
RY
FAR
MIN
G0
086
21,
805
00
6824
129
80
881
00
1,17
61,
668
04,
197
018
23,
569
319
624
7166
LOG
GIN
G A
ND
TR
EE S
ERVI
CE
1,23
10
039
,636
180
477
2,17
059
798
1,58
60
267
3,86
54,
482
1,43
79,
499
481,
944
9,16
52,
233
5,15
014
21,
081
MA
NU
FAC
TUR
ING
GEN
ERA
L43
,073
3,24
46,
896
155,
582
8812
4,39
71,
929
11,9
9639
345
,455
9,11
759
,027
98,7
9829
,635
99,1
2966
,989
1,35
622
,938
117,
922
6,30
110
6,35
11,
433
13,8
25M
AR
INE
TER
MIN
AL
OPE
RA
TIO
N5,
230
00
21,8
2718
034
041
80
529
294
9,88
22,
520
1,00
86,
034
2,12
624
273
2,86
223
92,
146
042
6M
OTO
R V
EHIC
LE O
PER
ATI
ON
OTH
ER T
HA
N T
RU
CK
ING
615
028
73,
990
180
545
241
597
981,
762
1,17
60
2,35
22,
015
4,88
52,
458
01,
671
5,21
047
98,
466
7191
7N
ATU
RA
L R
ESO
UR
CE
EXTR
AC
TIO
N, R
EFIN
ING
, STO
RA
GE,
TR
AN
SPO
RT
20,3
061,
180
6,03
473
,166
141
017
048
23,
521
02,
643
8,23
524
,839
34,1
091,
911
19,5
385,
136
169
820
14,7
281,
037
14,8
250
2,26
1PO
LIC
E O
FFIC
ERS
308
00
2,79
288
03,
307
1,92
929
814
752
929
40
2,18
417
41,
437
525
2436
593
380
1,75
618
66R
ETA
IL S
ERVI
CES
615
00
2,08
753
481
80
2,44
729
52,
290
00
7,22
52,
293
8,62
08,
974
242
2,70
413
,056
638
9,44
135
1,83
5SO
CIA
L SE
RVI
CES
308
00
620
354
2,25
024
171
649
4,22
829
426
74,
201
1,66
822
,412
5,79
973
1,48
99,
133
8016
,035
182,
228
TELE
CO
MM
UN
ICA
TIO
N A
ND
BR
OA
DC
AST
ING
1,84
60
287
6,23
20
023
90
179
052
929
426
784
01,
459
6,03
43,
175
9721
33,
569
803,
238
039
3TR
UC
KIN
G4,
923
028
735
,152
00
1,77
36,
268
1,61
173
71,
409
1,47
12,
404
15,7
941,
598
16,6
653,
258
121
2,97
711
,577
638
16,7
3738
92,
523
UN
KN
OW
N15
,998
01,
149
6,50
018
41,
227
3,13
42,
149
197
4,75
76,
470
27,2
4316
,634
691,
724
249
02,
309
6,91
480
7,84
212
495
0U
TILI
TY P
RO
DU
CTI
ON
, DIS
TRIB
UTI
ON
, MA
INTA
INEN
CE
4,30
70
287
8,48
810
60
580
482
179
017
658
86,
410
1,17
652
13,
735
1,10
50
851
3,31
280
3,47
20
655
VEH
ICLE
OTH
ER T
HA
N A
UTO
MO
BIL
E SA
LES,
SER
VIC
E, M
AN
UFA
CTU
RIN
G, O
R R
EPA
IR0
295
287
1,65
00
010
20
119
017
60
801
1,34
466
02,
011
828
015
21,
544
160
858
098
VESS
EL O
PER
ATI
ON
, SER
VIC
E, M
AN
UFA
CTU
RIN
G, O
R R
EPA
IR43
,688
57,5
1124
,136
119,
627
1831
4,77
238
,572
1,43
278
716
,561
1,47
121
0,19
914
7,86
15,
698
2,29
93,
811
242
3,73
747
,400
79,3
5926
1,07
914
,809
131
WH
OLE
SALE
AN
D R
ETA
IL G
ENER
AL
10,4
6159
028
727
,199
123
05,
284
2,65
23,
462
492
10,5
712,
941
6,67
721
,339
23,8
6853
,731
51,5
8165
48,
841
47,7
541,
914
48,2
6074
36,
225
TOTA
L28
7,66
473
,437
129,
873
798,
470
4,39
113
510
1,92
690
,643
70,6
045,
604
205,
250
55,2
9159
5,07
363
7,64
917
8,88
968
4,99
541
2,64
98,
497
129,
666
710,
425
110,
943
958,
098
20,5
4211
1,74
9
DIS
TRIB
UTI
ON
OF
CO
ST B
Y D
ISEA
SE T
YPE
AN
D IN
DU
STR
Y G
RO
UP
($00
0s)

Occupational Disease Canadian Institute of Actuaries
Oliver Wyman Actuarial Consulting
Page 158
1
2
3
4
5
6
7
8
9
10
11
12
13
14
15
16
17
18
19
20
21
22
23
24
A
GR
ICU
LTU
RE
/ FA
RM
ING
/ A
QU
AC
ULT
UR
E0%
0%1%
23%
0%0%
0%0%
3%0%
3%2%
0%8%
8%2%
22%
0%3%
16%
1%8%
0%1%
AIR
CR
AFT
OPE
RA
TIO
N, S
ERVI
CE,
MA
NU
FAC
TUR
ING
, OR
REP
AIR
2%0%
1%19
%0%
0%0%
0%1%
0%9%
0%2%
8%5%
20%
11%
0%1%
7%0%
12%
0%2%
AN
IMA
L C
AR
E, T
RA
ININ
G, B
REE
DIN
G, B
OA
RD
ING
0%0%
0%34
%0%
0%4%
0%1%
0%6%
0%0%
3%3%
5%8%
0%4%
22%
0%7%
0%2%
AU
TOM
OB
ILE
SALE
S, S
ERVI
CE,
MA
NU
FAC
TUR
ING
, OR
REP
AIR
3%0%
1%13
%0%
0%1%
1%2%
0%3%
0%2%
16%
3%13
%4%
0%3%
16%
2%14
%0%
2%B
UIL
DIN
G M
AIN
TAIN
ENC
E A
ND
OPE
RA
TIO
NS
5%0%
0%5%
0%0%
3%2%
1%0%
3%0%
14%
17%
3%8%
4%0%
5%14
%1%
13%
0%2%
CLE
RIC
AL
1%0%
0%2%
0%0%
11%
2%1%
0%4%
0%1%
7%2%
5%5%
0%5%
31%
1%20
%0%
2%C
ON
STR
UC
TIO
N6%
0%1%
17%
0%0%
0%1%
1%0%
1%2%
21%
10%
2%13
%4%
0%2%
9%1%
8%0%
1%C
ON
TRA
CTI
NG
12%
0%1%
15%
0%0%
0%1%
1%0%
2%1%
22%
7%4%
9%5%
0%2%
9%0%
8%0%
1%ED
UC
ATI
ON
AN
D R
ELIG
IOU
S IN
STIT
UTI
ON
S4%
1%0%
8%0%
0%3%
1%1%
0%8%
0%4%
11%
4%15
%9%
0%1%
12%
0%15
%0%
3%FI
REF
IGH
TER
0%5%
11%
6%0%
0%6%
36%
1%0%
3%0%
0%23
%0%
0%0%
0%1%
3%0%
5%0%
1%FO
OD
MA
NU
FAC
TUR
ING
1%0%
0%5%
0%0%
0%0%
1%0%
1%1%
1%5%
2%23
%12
%0%
2%13
%0%
24%
0%7%
FOO
D S
ERVI
CE
0%0%
0%0%
0%0%
2%1%
1%0%
2%0%
0%4%
3%23
%13
%0%
5%24
%1%
16%
0%2%
GEN
ERA
L SE
RVI
CES
9%2%
7%7%
0%0%
0%0%
2%0%
2%5%
11%
12%
2%16
%6%
0%1%
6%1%
9%0%
2%G
OVE
RN
MEN
T2%
1%13
%10
%0%
0%7%
2%1%
0%3%
0%3%
9%2%
12%
6%0%
2%11
%0%
13%
0%2%
HEA
LTH
CA
RE
SER
VIC
ES1%
0%1%
3%0%
0%2%
0%2%
0%8%
0%1%
9%4%
17%
11%
0%3%
13%
0%21
%0%
2%H
OSP
ITA
LITY
AN
D E
NTE
RTA
INM
ENT
2%0%
0%4%
0%0%
2%0%
1%0%
5%0%
1%7%
6%19
%13
%0%
3%16
%0%
18%
0%3%
LAN
DSC
API
NG
2%0%
2%10
%0%
0%0%
0%1%
0%2%
0%0%
4%9%
14%
20%
0%1%
20%
2%10
%0%
1%LI
VEST
OC
K A
ND
PO
ULT
RY
FAR
MIN
G0%
0%5%
11%
0%0%
0%2%
2%0%
5%0%
0%7%
10%
0%26
%0%
1%22
%2%
4%0%
0%LO
GG
ING
AN
D T
REE
SER
VIC
E1%
0%0%
47%
0%0%
1%3%
1%0%
2%0%
0%5%
5%2%
11%
0%2%
11%
3%6%
0%1%
MA
NU
FAC
TUR
ING
GEN
ERA
L5%
0%1%
17%
0%0%
0%0%
1%0%
5%1%
7%11
%3%
11%
7%0%
3%13
%1%
12%
0%2%
MA
RIN
E TE
RM
INA
L O
PER
ATI
ON
9%0%
0%39
%0%
0%0%
0%1%
0%1%
1%18
%5%
2%11
%4%
0%0%
5%0%
4%0%
1%M
OTO
R V
EHIC
LE O
PER
ATI
ON
OTH
ER T
HA
N T
RU
CK
ING
2%0%
1%11
%0%
0%1%
1%2%
0%5%
3%0%
6%5%
13%
6%0%
4%14
%1%
22%
0%2%
NA
TUR
AL
RES
OU
RC
E EX
TRA
CTI
ON
, REF
ININ
G, S
TOR
AG
E, T
RA
NSP
OR
T9%
1%3%
31%
0%0%
0%0%
1%0%
1%4%
11%
14%
1%8%
2%0%
0%6%
0%6%
0%1%
POLI
CE
OFF
ICER
S2%
0%0%
16%
1%0%
19%
11%
2%1%
3%2%
0%13
%1%
8%3%
0%2%
5%0%
10%
0%0%
RET
AIL
SER
VIC
ES1%
0%0%
3%0%
0%1%
0%4%
0%4%
0%0%
11%
4%14
%14
%0%
4%21
%1%
15%
0%3%
SOC
IAL
SER
VIC
ES0%
0%0%
1%0%
0%3%
0%1%
0%6%
0%0%
6%2%
31%
8%0%
2%13
%0%
22%
0%3%
TELE
CO
MM
UN
ICA
TIO
N A
ND
BR
OA
DC
AST
ING
6%0%
1%22
%0%
0%1%
0%1%
0%2%
1%1%
3%5%
21%
11%
0%1%
12%
0%11
%0%
1%TR
UC
KIN
G4%
0%0%
27%
0%0%
1%5%
1%1%
1%1%
2%12
%1%
13%
3%0%
2%9%
0%13
%0%
2%U
NK
NO
WN
15%
0%1%
6%0%
0%1%
3%2%
0%4%
6%26
%16
%0%
2%0%
0%2%
7%0%
7%0%
1%U
TILI
TY P
RO
DU
CTI
ON
, DIS
TRIB
UTI
ON
, MA
INTA
INEN
CE
12%
0%1%
23%
0%0%
2%1%
0%0%
0%2%
18%
3%1%
10%
3%0%
2%9%
0%10
%0%
2%VE
HIC
LE O
THER
TH
AN
AU
TOM
OB
ILE
SALE
S, S
ERVI
CE,
MA
NU
FAC
TUR
ING
, OR
REP
AIR
0%3%
3%15
%0%
0%1%
0%1%
0%2%
0%7%
12%
6%18
%7%
0%1%
14%
1%8%
0%1%
VESS
EL O
PER
ATI
ON
, SER
VIC
E, M
AN
UFA
CTU
RIN
G, O
R R
EPA
IR4%
5%2%
11%
0%0%
0%4%
0%0%
2%0%
19%
14%
1%0%
0%0%
0%4%
7%24
%1%
0%W
HO
LESA
LE A
ND
RET
AIL
GEN
ERA
L3%
0%0%
8%0%
0%2%
1%1%
0%3%
1%2%
6%7%
16%
15%
0%3%
14%
1%14
%0%
2%
DIS
TRIB
UTI
ON
OF
CO
ST B
Y D
ISEA
SE T
YPE
AN
D IN
DU
STR
Y G
RO
UP,
NO
RM
ALI
ZED
BY
IND
UST
RY
GR
OU
P

Occupational Disease Canadian Institute of Actuaries
Oliver Wyman Actuarial Consulting
Page 159
Appendix H: Summary of Metrics The following are tabular summaries of the basic metrics presented in Appendix B. Combinations of various metrics are presented in anticipation of recommendations regarding the combination of disease types.

Occupational Disease Canadian Institute of Actuaries
Oliver Wyman Actuarial Consulting
Page 160
MES
OTE
LIO
MA
,A
LL O
THER
OBS
TRU
CTIV
E &
LUN
GA
SBES
TOSI
S, &
OBS
TRU
CTIV
ERE
SPIR
ATO
RYA
LL O
THER
MES
OTH
ELIO
MA
ASB
ESTO
SIS
CAN
CER
LUN
G C
AN
CER
RESP
IRA
TORY
DIS
EASE
COM
BIN
EDCO
UN
TRa
w M
ean
935
2,22
824
93,
412
1,16
53,
795
4,96
0Cu
t Off
128
905
841,
146
713
2,07
52,
778
Adju
sted
Mea
n80
71,
323
165
2,26
645
21,
720
2,18
2
AV
ERA
GE
COST
Raw
Mea
n27
3,90
716
6,22
323
7,01
220
0,89
880
,334
84,0
0683
,144
Cut O
ff27
,391
16,6
2223
,701
20,0
908,
033
8,40
18,
314
Adju
sted
Mea
n31
6,18
827
7,44
135
4,82
530
0,22
820
4,04
018
1,73
518
5,56
1Ad
just
ed E
x 5
Larg
est
307,
663
267,
089
294,
929
293,
246
176,
181
168,
024
174,
717
Five
Lar
gest
1,68
3,61
63,
006,
278
2,27
1,49
03,
457,
662
2,69
4,64
14,
884,
754
4,90
7,08
5La
rges
t2,
069,
935
5,31
8,20
73,
373,
094
5,31
8,20
73,
420,
807
7,18
7,64
57,
187,
645
AV
ERA
GE
AG
ERa
w M
ean
6864
6665
4444
44Ad
just
ed M
ean
6866
6766
4648
44La
g <=
2 Y
rs68
6362
6543
4343
Lag
> 2
Yrs
6867
6868
5459
59
AV
ERA
GE
LAG
(YEA
RS)
Raw
Mea
n1.
73.
98.
33.
60.
41.
21.
0Ad
just
ed M
ean
1.2
4.2
7.2
3.4
0.8
1.6
1.3
Lag
<= 2
Yrs
0.4
0.4
0.5
0.4
0.1
0.2
0.2
Lag
> 2
Yrs
10.7
12.4
13.2
12.3
5.8
9.9
9.5
% C
laim
s <=
2 Y
rs87
%71
%38
%73
%96
%89
%91
%%
Cla
ims
> 2
Yrs
13%
29%
62%
27%
4%11
%9%

Occupational Disease Canadian Institute of Actuaries
Oliver Wyman Actuarial Consulting
Page 161
ALL
PNEU
MO
CON
IOSI
SCA
RPA
LO
THER
EXCE
PTTU
NN
ELH
EARI
NG
NER
VE
CAN
CER
ASB
ESTO
SIS
SYN
DRO
ME
LOSS
DIS
EASE
COU
NT
Raw
Mea
n45
218
822
,092
56,6
281,
391
Cut O
ff15
984
1,91
292
821
2Ad
just
ed M
ean
293
104
20,1
8055
,700
1,17
9
AV
ERA
GE
COST
Raw
Mea
n20
0,18
820
5,38
929
,951
13,9
5072
,443
Cut O
ff20
,019
20,5
392,
995
1,39
57,
244
Adju
sted
Mea
n30
4,98
336
6,06
232
,555
14,1
7684
,667
Adju
sted
Ex
5 La
rges
t28
7,33
029
4,10
332
,158
14,1
0079
,758
Five
Lar
gest
1,32
1,80
21,
790,
860
1,63
7,17
385
6,46
81,
237,
389
Larg
est
1,52
6,74
02,
437,
867
2,39
4,02
21,
096,
385
2,20
2,90
7
AV
ERA
GE
AG
ERa
w M
ean
6254
4262
44Ad
just
ed M
ean
6257
4263
45La
g <=
2 Y
rs59
5242
6243
Lag
> 2
Yrs
6964
4763
50
AV
ERA
GE
LAG
(YEA
RS)
Raw
Mea
n3.
71.
30.
30.
71.
1Ad
just
ed M
ean
2.8
1.7
0.3
0.7
1.1
Lag
<= 2
Yrs
0.5
0.3
0.2
0.1
0.3
Lag
> 2
Yrs
9.8
9.4
5.0
8.6
5.2
% C
laim
s <=
2 Y
rs65
%88
%97
%92
%85
%%
Cla
ims
> 2
Yrs
35%
12%
3%8%
15%

Occupational Disease Canadian Institute of Actuaries
Oliver Wyman Actuarial Consulting
Page 162
SPRA
IN /
ALL
OTH
ERA
LLO
THER
STRA
IN /
CUM
ULA
TIV
ECU
MU
LATI
VE
BURS
ITIS
EPIC
ON
DYL
ITIS
TEN
DO
NIT
ISTE
NO
SYN
OV
ITIS
INFL
AM
MA
TIO
NTE
AR
HER
NIA
TRA
UM
ATR
AU
MA
COU
NT
Raw
Mea
n5,
149
2,38
414
,944
351
4,26
824
,558
1,16
13,
411
56,2
26Cu
t Off
744
238
1,49
055
584
4,61
80
569
8,45
4Ad
just
ed M
ean
4,40
52,
146
13,4
5429
63,
684
19,9
401,
161
2,84
247
,772
AV
ERA
GE
COST
Raw
Mea
n31
,182
26,2
8725
,517
28,2
1528
,386
33,0
2219
,917
29,6
8929
,718
Cut O
ff3,
118
2,62
92,
552
2,82
12,
839
3,30
21,
992
2,96
92,
972
Adju
sted
Mea
n36
,025
28,9
4928
,092
33,0
1432
,507
40,0
6919
,917
35,1
4734
,544
Adju
sted
Ex
5 La
rges
t34
,742
27,3
0527
,613
24,2
0930
,381
39,0
1417
,693
32,7
6134
,092
Five
Lar
gest
1,16
4,31
673
2,83
71,
316,
688
545,
484
1,59
7,07
04,
248,
385
534,
013
1,38
8,61
44,
347,
569
Larg
est
1,47
8,07
71,
036,
253
1,68
6,61
695
5,93
13,
645,
086
5,71
7,95
91,
187,
016
1,81
3,56
55,
717,
959
AV
ERA
GE
AG
ERa
w M
ean
4344
4041
4442
4442
42Ad
just
ed M
ean
4344
4042
4443
4443
40La
g <=
2 Y
rs43
4440
4143
4244
4242
Lag
> 2
Yrs
4645
4849
4949
4449
49
AV
ERA
GE
LAG
(YEA
RS)
Raw
Mea
n0.
10.
20.
10.
20.
30.
30.
30.
30.
2Ad
just
ed M
ean
0.1
0.2
0.1
0.2
0.3
0.3
0.3
0.3
0.1
Lag
<= 2
Yrs
0.1
0.1
0.1
0.1
0.2
0.1
0.2
0.1
0.1
Lag
> 2
Yrs
3.2
4.0
3.7
3.8
5.8
7.0
4.3
6.1
6.3
% C
laim
s <=
2 Y
rs10
0%99
%10
0%99
%97
%98
%98
%98
%98
%%
Cla
ims
> 2
Yrs
0%1%
0%1%
3%2%
2%2%
2%

Occupational Disease Canadian Institute of Actuaries
Oliver Wyman Actuarial Consulting
Page 163
REA
CTIO
NM
ENTA
LPH
YSIC
AL
EYE
TO F
ORE
IGN
INFE
CTIO
NST
RESS
STRE
SSCO
ND
ITIO
NSU
BSTA
NCE
VA
SCU
LAR
COU
NT
Raw
Mea
n24
92,
990
376
351,
183
114
Cut O
ff87
529
224
752
366
Adju
sted
Mea
n16
22,
461
152
2866
048
AV
ERA
GE
COST
Raw
Mea
n28
,992
36,8
1714
4,51
012
,550
43,8
5510
8,57
2Cu
t Off
2,89
93,
682
14,4
511,
255
4,38
610
,857
Adju
sted
Mea
n43
,415
44,2
0634
9,96
715
,629
76,6
7225
1,87
8Ad
just
ed E
x 5
Larg
est
17,6
3334
,089
241,
072
3,86
959
,682
49,1
61Fi
ve L
arge
st85
2,97
65,
013,
661
3,55
1,49
669
,725
2,30
2,28
21,
995,
237
Larg
est
1,13
7,48
413
,309
,054
9,27
5,80
118
9,81
44,
301,
036
8,44
0,90
7
AV
ERA
GE
AG
ERa
w M
ean
3944
5243
3946
Adju
sted
Mea
n40
4453
4041
44La
g <=
2 Y
rs39
4452
4139
46La
g >
2 Yr
s50
4954
4747
46
AV
ERA
GE
LAG
(YEA
RS)
Raw
Mea
n0.
40.
21.
11.
20.
60.
3Ad
just
ed M
ean
0.5
0.2
1.2
0.7
0.7
0.4
Lag
<= 2
Yrs
0.2
0.2
0.3
0.2
0.2
0.2
Lag
> 2
Yrs
5.5
4.9
6.5
4.7
8.2
2.6
% C
laim
s <=
2 Y
rs96
%98
%86
%79
%96
%95
%%
Cla
ims
> 2
Yrs
4%2%
14%
21%
4%5%

Occupational Disease Canadian Institute of Actuaries
Oliver Wyman Actuarial Consulting
Page 164
Appendix I: Standards of Practice – Public Personal Injury Compensation Plans Workers’ compensation is covered in part 5000 of the actuarial standards of practice produced by the Actuarial Standards Board (ASB), which are included herein for reference purposes. The ASB’s mission is to develop, establish, and maintain standards of practice governing actuarial practice in Canada.

Page 5001
5000—PUBLIC PERSONAL INJURY COMPENSATION PLANS

Page 5002
TABLE OF CONTENTS
5000 PUBLIC PERSONAL INJURY COMPENSATION PLANS…………………………5001
5100 Scope ....................................................................................................................................... 5003
5200 Extension of scope ............................................................................................................. 5004
5300 General .................................................................................................................................. 5005
5310 Circumstances of the work ........................................................................... 5005
5320 Data .............................................................................................................. 5006
5400 Benefits liabilities .............................................................................................................. 5007
5410 Methods ........................................................................................................ 5007
5420 Assumptions ................................................................................................. 5008
5430 Economic assumptions ................................................................................. 5009
5440 Non-economic assumptions ......................................................................... 5010
5450 Margins for adverse deviations .................................................................... 5010
5460 Sensitivity testing ......................................................................................... 5012
5500 Other related items ........................................................................................................... 5013
5600 Gain and loss analysis ...................................................................................................... 5014
5700 Reporting .............................................................................................................................. 5015

Standards of Practice
5100.00 Effective March 15, 2011 Revised June 13, 2013
Page 5003
5100 SCOPE
.00 Part 1000 applies to work within the scope of this part 5000.
.01 The standards in this part apply to an actuary’s work on the valuation of benefits liabilities of a public personal injury compensation plan, including its benefits liabilities in respect of a self-insured employer, and to any other items required under the terms of an appropriate engagement for a public personal injury compensation plan, for the purpose of its financial statements and for the purpose of providing input into its funding arrangements.
.02 The standards in this part do not apply to an actuary’s work for an employer on the valuation of benefits liabilities and other related items in respect of its employees who are covered by a self-insured element of a public personal injury compensation plan, where such work is covered by the Practice-Specific Standards for Post-Employment Benefit Plans. Nevertheless, the standards in this part may provide useful guidance for such work.

Standards of Practice
5200.01 Effective March 15, 2011 Page 5004
5200 EXTENSION OF SCOPE
.01 The standards in this part may also provide useful guidance for other work of an actuary for a public personal injury compensation plan, such as work on the development of assessment rates or premiums, the costing of benefits or policy changes, or work on experience-rating programs.
.02 The standards in this part do not, however, provide useful guidance in the case of an entity merely because it is a monopoly, such as a monopoly of benefits that are optional or a government monopoly that is required to operate like a private sector entity.

Standards of Practice
5310.01 Effective March 15, 2011 Page 5005
5300 GENERAL
5310 CIRCUMSTANCES OF THE WORK .01 The actuary’s work on the valuation of the benefits liabilities or other items for the
purpose of the financial statement of a public personal injury compensation plan or for the purpose of providing input into its funding arrangements should take into account the circumstances of the work. [Effective March 15, 2011]
.02 The circumstances of the work would include
terms of the relevant statute,
relevant accounting standards and policies, and
terms of an appropriate engagement under which the work is being performed,
and the circumstances of the work may include the funding policy of the public personal injury compensation plan.
.03 The terms of an appropriate engagement would define the role of the actuary and the purpose of the work. The work of the actuary may be limited to the valuation of the benefits liabilities, or the work may also include the provision of advice on the funding of the public personal injury compensation plan, its financial position, its financial condition and any other actuarial item required under the terms of an appropriate engagement.
.04 The terms of an appropriate engagement may specify applicable policies of the public personal injury compensation plan relevant to the work of the actuary. These policies may include a formal or informal funding policy, an accounting policy and an investment policy.
.05 Significant terms of an appropriate engagement may stipulate one or more of use of a specified asset value or method of asset valuation, and
depending on the circumstances of the work, treatment of definitive amendments and other pending changes.
.06 Objectives of funding specified by the terms of an appropriate engagement may include, but are not limited to, a specific funding target, the security of benefits, a principle of equity among various groups of employers or various groups of individuals or among generations, or a funding approach for occupational disease claims.

Standards of Practice
5320.01 Effective March 15, 2011 Page 5006
5320 DATA .01 Where sufficient, reliable and relevant data are not available for the valuation of a
specific benefit, the actuary should make appropriate assumptions or introduce appropriate methods to compensate for any perceived deficiencies in the data. [Effective March 15, 2011]
.02 Sufficient, reliable and relevant data may not be available to the actuary in various circumstances, for example,
the relevant statute may have been amended to provide a new or revised benefit,
an applicable policy of the public personal injury compensation plan may have been revised recently,
the public personal injury compensation plan’s claim adjudication practices or administration practices may have changed recently,
a recent appeal decision may be expected to have a material effect on future benefit payments, or
economic conditions or health care practices in the relevant jurisdiction may have changed, which may be expected to have a material effect on benefits.
.03 Where the data are not sufficient, not fully reliable or not sufficiently relevant to expected future experience for a specific benefit, the actuary may consider taking one or more of the following actions,
introducing appropriate assumptions regarding missing, incomplete or unreliable data, and
adjusting data and historic claim settlement patterns for the purpose of the work, as appropriate, to remove any perceived distortions, such as the effect of historical inflation or one-time benefit changes.

Standards of Practice
5410.01 Effective March 15, 2011 Page 5007
5400 BENEFITS LIABILITIES
5410 METHODS .01 The actuary should value the benefits liabilities assuming that the public personal injury
compensation plan continues indefinitely as a going concern entity.
.02 The value of the benefits liabilities is the value, by the actuarial present value method, of cash flows after the calculation date with respect to all claims incurred before that date and not fully discharged as of that date, whether reported or not, and for calculation dates on and after December 31, 2014, the value, by the actuarial present value method, of cash flows after the calculation date with respect to workplace exposures that have occurred prior to that date. The workplace exposures should include those which may potentially lead to occupational disease claims, in accordance with the policy of the plan.
.03 The cash flows after the calculation date on account of all claims incurred before that date should include all expenses expected to be incurred after the calculation date which are related to those claims, including relevant administration expenses.
.04 The actuary’s work should take into account the benefits, relevant policies and administration practices of the public personal injury compensation plan as of the calculation date, and should take into account any definitive amendment to these items that is expected to have a material effect on benefits, unless the circumstances of the work require otherwise.
.05 The benefits liabilities should include an amount in respect of benefits for employees of a self-insured employer, unless the exclusion of such benefits is in accordance with the circumstances of the work.
.06 When estimating the benefits liabilities, the actuary should consider all claims, whether reported or not, until the claims are fully discharged or closed, with no or minimal chance of re-opening. [Effective March 15, 2011]
Occupational disease .07 The actuary would value the benefits liabilities in respect of occupational disease claims,
and would include the benefits liabilities for all occupational disease claims reported prior to the calculation date.

Standards of Practice
5410.08 Effective March 15, 2011 Page 5008
.08 For calculation dates on or after December 31, 2014, the actuary would also include in the benefits liabilities an appropriate allowance for all occupational disease claims expected to arise after the calculation date as a result of exposures incurred in the workplace prior to the calculation date in respect of occupational diseases with a long latency period that are recognized as such by the public personal injury compensation plan, by legislation, by regulation, or by appeal, regardless of the public personal injury compensation plan’s approach to funding potential occupational disease claims. For calculation dates preceding December 31, 2014, the actuary may include in the benefits liabilities an appropriate allowance for such potential occupational disease claims.
Amendments and subsequent events .09 The actuary’s valuation of the benefits liabilities would normally reflect all definitive
amendments of which the actuary is aware on the calculation date, including those amendments with an effective date after the calculation date. Where the circumstances of the work require otherwise, the actuary may exclude the effect of a known definitive amendment, but the actuary would disclose the effect of such amendment.
5420 ASSUMPTIONS .01 The actuary should set assumptions that reflect the expectation that the public personal
injury compensation plan will continue indefinitely as a going concern entity, but may make adjustment for short-term considerations, where appropriate.
.02 The actuary should select either best estimate assumptions or best estimate assumptions modified to incorporate margins for adverse deviations to the extent, if any, required by law or by the circumstances of the work, and should provide the rationale for the decision made with respect to the inclusion or exclusion of margins.
.03 Where a public personal injury compensation plan has an established practice of providing ad hoc increases to benefits, or a periodic update to rates or tables used in the administration of the plan, the actuary should recognize such established practice when valuing the benefits liabilities by assuming the continuation of such practice, unless a definitive policy decision to discontinue such established practice has been taken by the plan. [Effective March 15, 2011]

Standards of Practice
5430.01 Effective March 15, 2011 Page 5009
5430 ECONOMIC ASSUMPTIONS .01 The needed economic assumptions include the expected rate of investment income, the
expected investment expenses and, depending on the benefit being valued, one or more of
expected rate of general inflation,
expected rate of health care cost inflation,
expected rate of wage inflation,
if different, expected earnings increase specific to wage loss benefits, and
expected rate of change of any other economic factor that may be applicable.
.02 The economic assumptions that are needed would depend on the nature of the benefits that are being valued, and may vary by year.
.03 The actuary would develop and disclose separate nominal assumptions, but may prefer to complete the calculations using rates that are net of inflation, net of expenses or net of some other factor. Such calculations may, however, be approximations.
.04 When determining the best estimate assumption for the expected rate of investment income, the actuary would take into account the expected pattern of risk-free rates of return, the expected additional investment return on the assets of the public personal injury compensation plan at the calculation date (if any) and the expected investment policy after that date. The expected additional investment return would depend on one or more of
additional returns over risk-free rates expected to be earned on non-risk-free fixed income assets of the type and quality owned on the reporting date and expected to be acquired pursuant to the investment policy of the plan,
additional returns over risk-free interest rates expected to be earned on other types of investments, including publicly traded common or preferred equities, private placements, real estate and private equity, and
projected composition of the investment portfolio in future years.
In establishing the assumption for the expected rate of investment income, the actuary would assume that there would be no additional returns achieved, net of investment expenses, from an active investment management strategy compared to a passive investment management strategy except to the extent that the actuary has reason to believe, based on relevant supporting data, that such additional returns will be consistently and reliably earned over the long term.

Standards of Practice
5430.05 Effective March 15, 2011 Page 5010
.05 The expected investment expenses would depend on the investment policy of the plan and the types of investments held and projected to be held in future.
.06 The actuary may adopt an assumption for the expected rate of investment income that varies depending on the part of the public personal injury compensation plan being valued, and the assets backing the liabilities in that part.
.07 The assumed expected rate of investment income need not be a flat rate but may vary from period to period.
5440 NON-ECONOMIC ASSUMPTIONS .01 When setting non-economic assumptions, the actuary would reflect all material
contingencies.
.02 The actuary would recognize the effect of varying experience and settlement patterns that result from definitive or virtually definitive revisions to the plan’s benefits or claims practices and would consider the relevance of historical claims experience.
.03 When setting the assumptions for wage loss, disability, pension and other benefits, the actuary would take into account all applicable material contingencies, including the possibility of recoveries, relapses, mortality improvements, changing benefit levels and the intermittence of income replacement and rehabilitation benefits throughout the lifetime of claimants. Further, the actuary would consider the potential effect on future benefit payments of factors such as changing economic conditions, employment levels, the claimant’s occupation and industry and seasonal variations.
5450 MARGINS FOR ADVERSE DEVIATIONS .01 The actuary should not include a margin for adverse deviations when the circumstances
of the work require a best estimate calculation or an unbiased calculation. .02 The actuary should include margins for adverse deviations when the circumstances of the
work require such margins. A non-zero margin should be sufficient, without being excessive, and should have the effect of increasing the benefits liabilities or reducing the reported value of the offsetting assets, the computation of which falls within the scope of the work of the actuary. In addition, the provision resulting from the application of all margins for adverse deviations should be appropriate in the aggregate.
.03 If the actuary is required by legislation, regulation, accounting standards, the accounting policy or the funding policy of the plan to use a margin for adverse deviations that is outside the range that the actuary considers appropriate, the actuary may use such imposed assumption, but the actuary should disclose that the margin is outside of the appropriate range and disclose the reason for using such margin. [Effective March 15, 2011]

Standards of Practice
5450.04 Effective March 15, 2011 Page 5011
.04 Examples of situations where the circumstances of the work might require an unbiased calculation include
legislation governing the plan may require an unbiased calculation,
the relevant accounting standards or the accounting policy of the public personal injury compensation plan may require the use of best estimate assumptions, or
the plan’s funding policy may recognize the monopoly nature of the plan and place a high priority on equity among generations, employers and other groups, and hence require the use of best estimate assumptions.
.05 Examples of situations where the circumstances of the work might require the inclusion of a margin for adverse deviations include
where the relevant accounting standards or the accounting policy of the plan, or its funding policy, require inclusion of a margin for adverse deviations, or
where the level of uncertainty or volatility may be high, and not considered to be sufficiently mitigated by the underlying adaptability of the plan.
.06 Where the actuary includes a margin for adverse deviations, the actuary would provide the rationale for inclusion of the margin and for the selection of the specific amount of the margin. The rationale may include considerations such as
funding policy or accounting policy of the public personal injury compensation plan,
relative importance placed on the balancing of competing interests compared to the achievement of full funding,
level of uncertainty inherent in the assumptions,
level of reliability or credibility of the data or historical information upon which the assumptions are based,
asset/liability mismatch risk,
propensity for ad hoc changes to be made to plan conditions, and
legislative or other restrictions on the ability to mitigate past losses.

Standards of Practice
5460.01 Effective March 15, 2011 Page 5012
5460 SENSITIVITY TESTING .01 The actuary should perform sensitivity testing of adverse scenarios, to illustrate and aid
the understanding of the effect of adverse changes to assumptions. .02 The adverse scenarios that the actuary tests should include at least
a decrease of 100 basis points in the assumed rate of investment earnings in all future years, an increase of 100 basis points in the assumed general rate of inflation, a discount rate that is equal to the expected rate of return earned on a hypothetical fixed income portfolio, consisting of high-quality bonds of pertinent durations. [Effective March 15, 2011]
.03 The actuary would consider testing other scenarios, depending on the plausible material risks to which the plan may be exposed.
.04 The actuary may also perform sensitivity testing of favourable scenarios.
.05 When selecting the assumptions and scenarios for sensitivity testing, the actuary would consider the circumstances of the work, and would select those assumptions that have a material impact on the benefits liabilities. The actuary may consider the use of testing of integrated sensitivity scenarios, for example, the effect of a deep and prolonged recession.

Standards of Practice
5500.01 Effective March 15, 2011 Page 5013
5500 OTHER RELATED ITEMS
.01 The actuary should compute, separately from the benefits liabilities, the present value on the reporting date of any future assessments that have been specifically earmarked to amortize a current deficit and any future scheduled reductions to assessments that have been specifically identified to reduce a current surplus, in accordance with the circumstances of the work. [Effective March 15, 2011]
.02 Where the public personal injury compensation plan has specifically earmarked a defined portion of specified future assessments to amortize a current deficit, the actuary would determine the actuarial present value of such earmarked assessments, and disclose such amount separately from the benefits liabilities and assets of the plan, provided that such disclosure is in accordance with the terms of the engagement.
.03 Where the public personal injury compensation plan has specifically identified reductions to future assessments to reduce a current surplus, the actuary would estimate the actuarial present value of such reductions to future assessments, and disclose such amount separately from the benefits liabilities and assets of the plan, provided that such disclosure is in accordance with the terms of the engagement.

Standards of Practice
5600.01 Effective March 15, 2011 Page 5014
5600 GAIN AND LOSS ANALYSIS
.01 The actuary should conduct a gain and loss analysis, including a comparison of actual and expected experience for the period between the prior calculation date and the current calculation date.
.02 The actuary should also conduct a reconciliation of the surplus or deficit position of the plan, provided that such reconciliation is in accordance with the terms of the engagement. [Effective March 15, 2011]
.03 The actuary’s analysis would include all material gains and losses. At a minimum, the actuary’s gain and loss analysis would consider the impact of any significant changes to the assumptions or methods used, any significant changes to the benefits or policies of the plan, gains or losses due to investment returns on the plan’s assets, legislative changes, and any other areas where the difference between actual and expected experience is significant.
.04 The actuary would report a change in assumption if the current assumption differs nominally from the corresponding prior assumption, unless the change in the nominal amount results from the application of the same calculation method. For example, if certain rates used in the valuation are based on historical claims experience and calculated using the same averaging formula, the difference in assumed rates between the calculation date and the prior calculation date would not normally be considered as a change in assumptions. Nevertheless, the actuary may choose to disclose the effect of the updated rate assumption on the valuation results.

Standards of Practice
5700.01 Effective March 15, 2011 Page 5015
5700 REPORTING
.01 For work pursuant to this part, the actuary should prepare a report that states the calculation date and the prior calculation date, identifies the legislation or other authority under which the work is completed, describes any significant terms of the appropriate engagement that are material to the actuary’s work, including the purpose of the work, describes the sources of data, benefit provisions and policies used in the work, and any limitations thereon, summarizes the data used for the valuation, the data tests conducted to assess the accuracy and completeness of the data used in the work, and issues regarding insufficient or unreliable data, describes the plan’s benefits, significant policies and relevant administration practices, including the identification of any amendments made since the prior calculation date, and the effect of such amendment on the benefits liabilities, describes any pending definitive or virtually definitive amendment, policy change or change to administration practice, confirms whether or not such amendment or change has been reflected in the benefits liabilities, and identifies the effect of such amendment or change on the benefits liabilities, identifies any significant changes to the relevant statute, strategic direction or management policy, or any significant appeal decision that changes management policy or practice, since the prior calculation date and the consequent effect on the benefits liabilities, summarizes the benefits liabilities, describes the method and the assumptions used to determine the benefits liabilities, provides the rationale for each assumption that is material to the actuary’s work, states that there is no provision for adverse deviations, where that is the case,

Standards of Practice
5700.02 Effective March 15, 2011 Page 5016
describes the margins for adverse deviations included with respect to each assumption where that is the case, and discloses
any imposed margins that the actuary has used in accordance with paragraph 5450.03 that, in the opinion of the actuary, are outside of the appropriate range, the rationale for each margin, and the aggregate provision for adverse deviations included in the benefits liabilities,
describes changes to the assumptions or methods used since the prior calculation date, and the rationale for those changes, describes the treatment of liabilities for self-insured employers, discloses subsequent events of which the actuary is aware, whether or not the events are taken into account in the work, or, if there are no significant events of which the actuary is aware, include a statement to that effect, describes and quantifies the gains and losses between the prior calculation date and the current calculation date, and provides an analysis and explanation of the significant gain and loss items, and describes the treatment of the liabilities for occupational disease claims, and states either that the amount of the benefits liabilities includes an appropriate allowance for potential occupational disease claims that are expected to arise after the calculation date as a result of exposures in the workplace prior to the calculation date or, if such is the case for calculation dates preceding December 31, 2014, that the amount of the benefits liabilities excludes such an allowance.
.02 Depending on the terms of the engagement, the report should
describe the sources of information on the plan’s assets, describe the plan’s assets, including their market value, the methods and assumptions used to value the assets and a summary of the assets by major category, report the financial position at the calculation date, and report the actuarial present value of any future assessments earmarked to amortize a current deficit or of any reductions in future assessments intended to reduce a current surplus.

Standards of Practice
5700.03 Effective March 15, 2011 Page 5017
.03 If the report does not include the results of the sensitivity testing that was completed, the actuary should prepare a separate report for the management of the public personal injury compensation plan that does include such sensitivity testing results.
.04 The report should provide the following five statements of opinion, all in the same section of the report and in the following order
a statement regarding data, which would usually be, “In my opinion, the data on which the valuation is based are sufficient and reliable for the purpose of the valuation.”, a statement regarding assumptions, which would usually be, “In my opinion, the assumptions are appropriate for the purpose of the valuation.”, a statement regarding methods, which would usually be, “In my opinion, the methods employed in the valuation are appropriate for the purpose of the valuation.”, a statement regarding appropriateness, which would usually be “In my opinion the amount of the benefits liabilities makes appropriate provision for all personal injury compensation obligations and the financial statements fairly present the results of the valuation.”, and a statement regarding conformation, which should be, “This report has been prepared, and my opinions given, in accordance with accepted actuarial practice in Canada.” [Effective March 15, 2011]
.05 The report would be sufficiently detailed to enable another actuary to examine the reasonableness of the valuation.
.06 The circumstances of the work may result in a deviation from accepted actuarial practice in Canada. For example, the applicable legislation or the terms of the engagement may require that the actuary use a margin for adverse deviations that is outside the range that the actuary considers appropriate, or require that the actuary exclude the benefits liabilities in respect of certain occupational disease claims. In such case, the actuary would disclose such deviation in the report.

Oliver Wyman 48 South Service Road, Suite 310 Melville, NY 11747 1 631 577 0500