research performance of indian lis faculties from central
TRANSCRIPT
Library Progress (International) Vol.41, No.1, January-June 2021: P.79-94 DOI: 10.5958/2320-317X.2021.00008.8
Print version ISSN 0970 1052 Online version ISSN 2320 317X
Original Article Available online at www.bpasjournals.com
Research Performance of Indian LIS Faculties from Central Universities: A Scientometric Exploration through the Lens of Web of Science (WoS)
Sanjay Kumar Maurya*, Akhandanand Shukla**, R.K. Ngurtinkhuma***
Author’s Affiliation: *Librarian, BRM Govt. Model College, Doomdooma, Tinsukia, Assam 786151, India E-mail: [email protected] **Associate Professor, Department of Library & Information Science, Central University of Tamil Nadu, Thiruvarur, Tamil Nadu 610005, India E-mail: [email protected] ***Professor, Department of Library & Information Science, Mizoram University, Aizawl, Mizoram 796004, India E-mail: [email protected] Corresponding Author: Akhandanand Shukla, Associate Professor, Department of Library & Information Science, Central University of Tamil Nadu, Thiruvarur, Tamil Nadu 610005, India E-mail: [email protected] Received on 24.01.2021, Accepted on 18.05.2021
INTRODUCTION Effectiveness of research and research productivity is one of the major criteria for evaluating faculties engaged in institutions of higher education. But, what best practices/methods be adopted for effective evaluation of faculties given that there are no
fixed metrics available is an issue that evaluators have battled for long. To some extent bibliometric and scientometric studies have helped to analyze the qualitative and quantitative aspect of research productivity with the help of mathematical and statistical methods. Basically in these studies, three types of indicators are considered as effective tool -
ABSTRACT
This study explores the research performance of LIS faculties from Central Universities of India through Web of Science using scientometric indicators. It was observed that there were 81 LIS faculties working in 17 Central Universities in India. A total of 157 unique publications were retrieved belonging to 42 LIS faculties from 14 Central Universities. BibliometrixR and VOSviewer were used for analyzing and visualization of data retrieved from WoS. Mukherjee B, of BHU, emerged as the most influential author (faculty) of LIS in terms of publications, citations, h-index and g-index. BHU was the most productive Central University in terms of LIS research. DESIDOC Journal of Library and Information Technology emerged out as the most productive source for LIS research while Scientometrics was the most cited source. “India” and its related terms were central to LIS research as observed from author’s keyword analysis. KEYWORDS: Research Growth, Research Productivity, Publication Impact, Co-authorship Pattern, Source Impact, Keyword Occurrence, Faculty’ Research Performance, LIS Faculty, Scientometrics, Web of Science, Central Universities, LIS Research.
Sanjay Kumar Maurya, Akhandanand Shukla, R.K. Ngurtinkhuma
80
that measures the quantity through publication productivity, quality through publication performance and structural indicators to measure the connection between publications, authors and thrust areas of research. These indicators are widely used in institutes of higher education in areas of selection, promotion and decisions concerning funding; and thus these have become important parameters to evaluate research productivity and simultaneously make an impact on the researchers as well. RELATED WORKS Research productivity of Malaysian authors and LIS institution were analyzed by Yazit & Zainab (2007) to determine the total number of publications, active authors, authorship patterns, authors affiliation during the period 1965 to 2005 and they found that a total number of 506 authors contributed 1045 publications of which 309 contributed as first-time authors, that National Library of Malaysia was the top productive institution, and that collection development and management, information centres and services, and ICT applications in LIS were the core subject areas of publication. Meho & Spurgin (2005) analyzed 68 faculties of 18 ALA-accredited LIS schools and found 2625 publications during the period 1982-2002. Journal articles were most widely distributed document and core subject areas of publication were bibliometrics, information retrieval and public libraries etc., Carol Tenopir (43), Peter Jacso (32), and Blaise Cronin (26) were the topmost productive authors in the number of journal publications. Patra & Chand (2006) analyzed the growth of LIS research in India during the period 1967 to 2004 and found a total of 3396 documents. The highest number of publications was observed during the year 1999; single authorship was most prevalent with 1.24 articles per author; P.N. Kaula (65), S.R. Ranganathan (29), P.B. Mangla (29), and B.M. Gupta (27) were the highest contributing authors during the period of study. Adkins & Budd (2006) examined the productivity of LIS faculty of U.S. during the year 1999-2004 and found that Carol Tenopir (59), Peter Jacso (32) & Blaise Cronin (25) were the most productive authors; and that Tefko Sarasevic (438), N.J. Belkin (395) & Pual Resnick (365) were the top cited authors.
Shaw & Vaughan (2008) analyzed the publication and citation pattern of LIS faculty according to their designation and found that Assistant Professor produced less journal articles and more conference proceedings in comparison to Associate Professors and full Professors. Similarly, full Professors published a large number of publications in comparison to Assistant Professors and Associate Professors. Weller, Hurd & Wiberley (1999) examined the contribution of Librarian of the US in peer-reviewed literature during the period 1993 to 1997 and they observed that out of 3624 journal articles, 1579 articles were authored by academic librarians; 78.35% of the total Librarians had published only single article while co-authorship pattern was found to be maximum (55.03%) for single articles; Pennsylvania State University libraries ranked top in terms of research productivity (46 articles by 35 authors) in the study. Onyancha & Ocholla (2007) analyzed country wise collaborations in HIV/AIDS research in Kenya and South Africa during 1980-2005. They observed a strong link as well as high impact of publications between the researchers in Kenya as compared to South Africa; co-authored papers had a higher average impact than single-authored papers. Gautam & Mishra (2015) analyzed research trends of Banaras Hindu University during 2004-2013 based on Indian Citation Index and found a total of 1041 articles. They explored and identified year-wise distribution, prolific authors and collaboration with other institutions, countries & states. Out of 1041 publications, 60 publications (5.76%) were as a result of collaborations with 18 countries of which USA was the top collaborating country followed by Japan & UK. Tian, Wen & Hong (2008) evaluated global scientific production on GIS during 1997 to 2006 and found that research productivity increased nearly three times during the decade; International Journal of Geographical Information Science ranked first amongst journals in GIS; the USA contributed maximum cited papers; they also identified frequently occuring keywords in those countries that had highest publications. Bornmann & Bauer (2015) analyzed the global distribution of highly cited researchers across institutions and found that University of California, USA had the highest number of highly cited researchers per institution. Ho (2013) analyzed and identified the
Library Progress (International)/ Vol.41 No.1/ January-June 2021
81
characteristics of highly cited publications indexed in Web of Science (WoS) from 1991 to 2000. It was found that 71% of most-cited publications originated from the US; Science, Nature, New England Journal of Medicine & Cell were the most cited journals; journal articles were the most preferred medium of publication; the USA emerged as the most cited country while Harvard University the most productive institution. Igoumenou, Ebmeier, Roberts & Fazel (2014) examined the citation practices in the field of Psychiatry of different countries, institutions, journals in terms of total local and total global citations. Liao et al. (2018) visualized Medical Big Data research based on the WoS database by using VOSviewer, CiteSpace & GraphPad Prism 5 software. They analyzed keywords co-occurrence network, keywords density visualization, keywords timeline, co-authorship pattern of countries, institutions & references. Further co-citation analysis of the journals was also studied. Lv et al. (2011) analyzed trends of global research on Graphene indexed in WoS by using visualization technology during the year 1991 to 2010. They found that the USA was the most productive country; increasing authorship pattern; the collaboration between one or two organizations was 76% of the total; Carbon Nanotubes and Graphite were the most popular author keywords. Gao & Guo (2014) evaluated global Nitrogen research by selecting 9748 articles from WoS during the period 1900 to 2011. They analyzed the influence of authors, institutions, and countries in terms of publication and citation; co-occurrence of keywords was analyzed to determine co-operation among countries and research hotspot. SCOPE & LIMITATIONS OF THE STUDY This study explores and visualizes the research performance of LIS faculties based on their research publications and citations with the help of scientometric tools. LIS faculties working in the Central Universities of India were considered as population. It was found that while 20 Central Universities in India offered LIS courses, not all of them had permanent faculties. Hemvati Nandan Bahuguna Garhwal University, Srinagar (HNBGU) did not have permanent faculties and were thus excluded from the study.
Further, universities like Mahatma Gandhi Central University, Motihari (MGCU) and Central University of Punjab, Bathinda (CUP) started LIS department with permanent faculties only recently i.e. after the data collection period, and therefore these institutes were also not covered under the study. Finally, information about 81 LIS faculties from 17 Central Universities was retrieved through the concerned university website. It was further observed that out of 81 LIS faculties from 17 Central Universities, the data of only 42 LIS faculties were available for retrieval from Web of Science (WoS). Therefore, the results, findings and conclusions of the study are based on those 42 LIS faculties.
METHODOLOGY Data were collected through the Web of Science (WoS) database provided by Clarivate Analytics during the period from 15th March – 20th March 2019. In India, 20 Central Universities offer LIS education at different program levels. At first, Central University websites were accessed to determine the list of LIS faculties working in the respective departments. The Web of Science Core Collection was selected to get the required data. The Author Search field was selected under the Basic Search domain and the last name followed by the initial name of faculty was entered. Further, for each faculty, the subject domain was searched under Social Science and finally by selecting the organization associated with the faculty’s name. By using such parameters, data for 42 LIS faculty were retrieved out of a total of 81 LIS faculties; the data retrieved for 42 LIS faculty belonged to 14 Central Universities of India. The retrieved bibliographic and citation data was analyzed by using scientometric techniques. Microsoft Excel, R-Package, Bibliometrix & VOSviewer software tools were also utilized for processing and analysis of data for the purpose.
RESULTS AND DISCUSSION University and Faculty Coverage in WoS Table 1 depicts the university-wise faculty count, share of faculty publications along with the total number of LIS faculties indexed in WoS from each LIS department. Out of the total LIS faculties, 51.85% faculties were

Sanjay Kumar Maurya, Akhandanand Shukla, R.K. Ngurtinkhuma
82
indexed in WoS with a total of 191 publications. The study observed maximum 6 LIS faculties from AMU & DU, who shared 18.84% and 13.08% of total publications respectively, followed by IGNOU and MZU
with 5 LIS faculties with a share of 7.32% & 6.28% publications respectively while BHU and PU had 4 LIS faculties indexed in WoS, who contributed 29.31% & 9.94% publications respectively.
Table 1: University-wise Productivity of LIS Faculty
Name of the University (Code Name) No. of Faculty in WoS
Total LIS Faculty in Uni-versity
Total No. of Publica-tions in WoS
% Share of Publications
Aligarh Muslim University, Aligarh (AMU) 6 7 36 18.84 University of Delhi, New Delhi (DU) 6 7 25 13.08 Indira Gandhi National Open University, New Delhi (IGNOU)
5 5 14 7.32
Mizoram University, Aizawl (MZU) 5 8 12 6.28 Banaras Hindu University, Varanasi (BHU) 4 8 56 29.31 Pondicherry University, Puducherry (PU) 4 5 19 9.94 Babasaheb Bhimrao Ambedkar University, Lucknow (BBAU)
3 6 12 6.28
North-Eastern Hill University, Shillong (NEHU) 3 6 7 3.66 Assam University, Silchar (AU) 1 4 4 2.09 Central University of Haryana, Mahendergarh (CUH)
1 2 2 1.04
Dr. Harisingh Gour University, Sagar (HSGU) 1 3 1 0.52 Manipur University, Imphal (MU) 1 5 1 0.52 Central University of Tamil Nadu, Thiruvarur (CUTN)
1 5 1 0.52
Tripura University, Agartala (TU) 1 3 1 0.52 Central University of Gujarat, Gandhinagar (CUG)
0 3 0 0
Central University of Himachal Pradesh, Dharamshala (CUHP)
0 3 0 0
Guru Ghasidas University, Bilaspur (GGU) 0 1 0 0 Total 42 81 191 100
(Source: Survey Data) Further, BBAU & NEHU with 3 LIS faculties shared 6.28% and 3.66% of the total publications respectively. There were 6 Central Universities from where single (1) LIS faculty was found and collectively shared 5.21% of the total publications. From the Table 1, it can be seen that BHU (56) was the most productive LIS department followed by AMU (36) and DU (25). Moreover, publications per faculty (PPF) were analyzed and it was found that BHU had 14 publications per faculty followed by AMU (6) and PU (4.75). AU, BBAU & DU had nearly 4 publications per faculty whereas IGNOU, MZU, NEHU and CUH had at least 2 publications per faculty. Universities like HSGU, MU, CUTN, and TU had 1 publication per faculty. On an average,
there were 4.54 publications per faculty (indexed) in WoS from Central Universities of India in LIS domain. Research Productivity of LIS Faculty Table 2 shows the research productivity of LIS faculties of Central Universities of India based on the WoS database. There were a total of 191 publications having 117 authors that includes LIS faculties, LIS professionals from the same or other institutions. After filtration of publications data, 157 unique publications were found for 42 LIS faculties. From the observation of data, it was found that 14 LIS faculties contributed single (1) publication each, 12 LIS faculties had 2 publications each, 5 LIS faculties had 3 publications each and 11
Library Progress (International)/ Vol.41 No.1/ January-June 2021
83
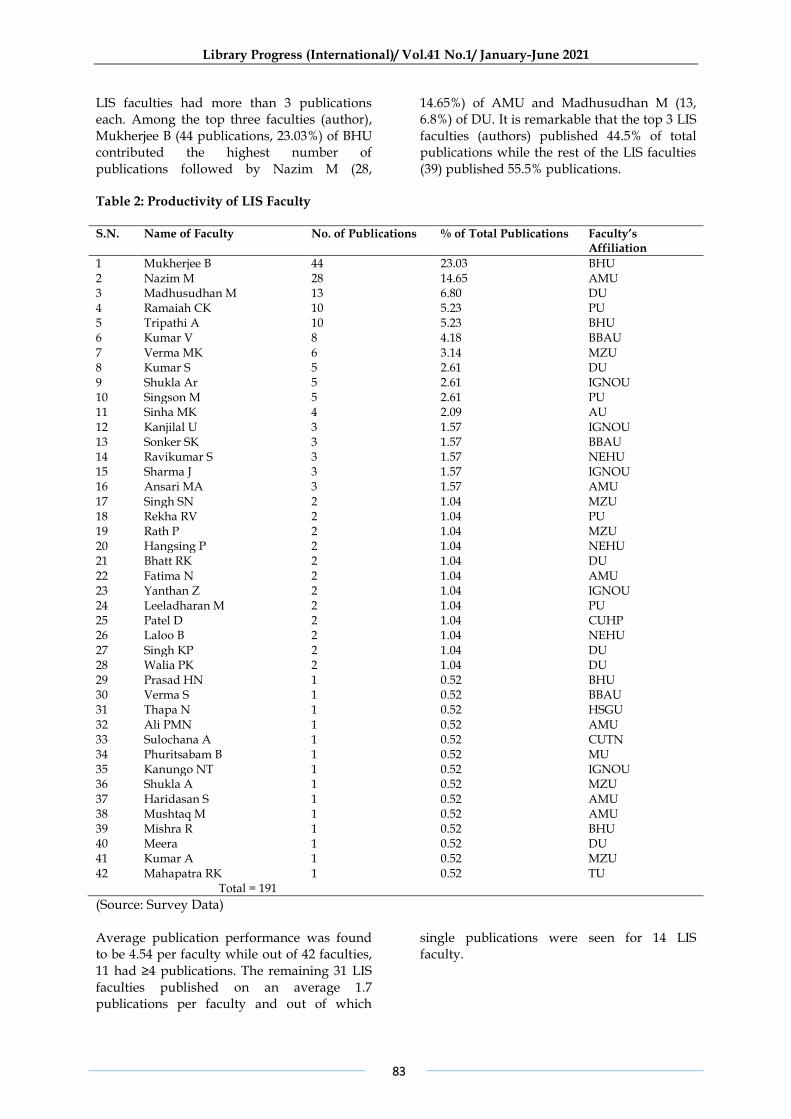
LIS faculties had more than 3 publications each. Among the top three faculties (author), Mukherjee B (44 publications, 23.03%) of BHU contributed the highest number of publications followed by Nazim M (28,
14.65%) of AMU and Madhusudhan M (13, 6.8%) of DU. It is remarkable that the top 3 LIS faculties (authors) published 44.5% of total publications while the rest of the LIS faculties (39) published 55.5% publications.
Table 2: Productivity of LIS Faculty S.N. Name of Faculty No. of Publications % of Total Publications Faculty’s
Affiliation
1 Mukherjee B 44 23.03 BHU 2 Nazim M 28 14.65 AMU 3 Madhusudhan M 13 6.80 DU 4 Ramaiah CK 10 5.23 PU 5 Tripathi A 10 5.23 BHU 6 Kumar V 8 4.18 BBAU 7 Verma MK 6 3.14 MZU 8 Kumar S 5 2.61 DU 9 Shukla Ar 5 2.61 IGNOU 10 Singson M 5 2.61 PU 11 Sinha MK 4 2.09 AU 12 Kanjilal U 3 1.57 IGNOU 13 Sonker SK 3 1.57 BBAU 14 Ravikumar S 3 1.57 NEHU 15 Sharma J 3 1.57 IGNOU 16 Ansari MA 3 1.57 AMU 17 Singh SN 2 1.04 MZU 18 Rekha RV 2 1.04 PU 19 Rath P 2 1.04 MZU 20 Hangsing P 2 1.04 NEHU 21 Bhatt RK 2 1.04 DU 22 Fatima N 2 1.04 AMU 23 Yanthan Z 2 1.04 IGNOU 24 Leeladharan M 2 1.04 PU 25 Patel D 2 1.04 CUHP 26 Laloo B 2 1.04 NEHU 27 Singh KP 2 1.04 DU 28 Walia PK 2 1.04 DU 29 Prasad HN 1 0.52 BHU 30 Verma S 1 0.52 BBAU 31 Thapa N 1 0.52 HSGU 32 Ali PMN 1 0.52 AMU 33 Sulochana A 1 0.52 CUTN 34 Phuritsabam B 1 0.52 MU 35 Kanungo NT 1 0.52 IGNOU 36 Shukla A 1 0.52 MZU 37 Haridasan S 1 0.52 AMU 38 Mushtaq M 1 0.52 AMU 39 Mishra R 1 0.52 BHU 40 Meera 1 0.52 DU 41 Kumar A 1 0.52 MZU 42 Mahapatra RK 1 0.52 TU Total = 191
(Source: Survey Data) Average publication performance was found to be 4.54 per faculty while out of 42 faculties, 11 had ≥4 publications. The remaining 31 LIS faculties published on an average 1.7 publications per faculty and out of which
single publications were seen for 14 LIS faculty.
Sanjay Kumar Maurya, Akhandanand Shukla, R.K. Ngurtinkhuma
84
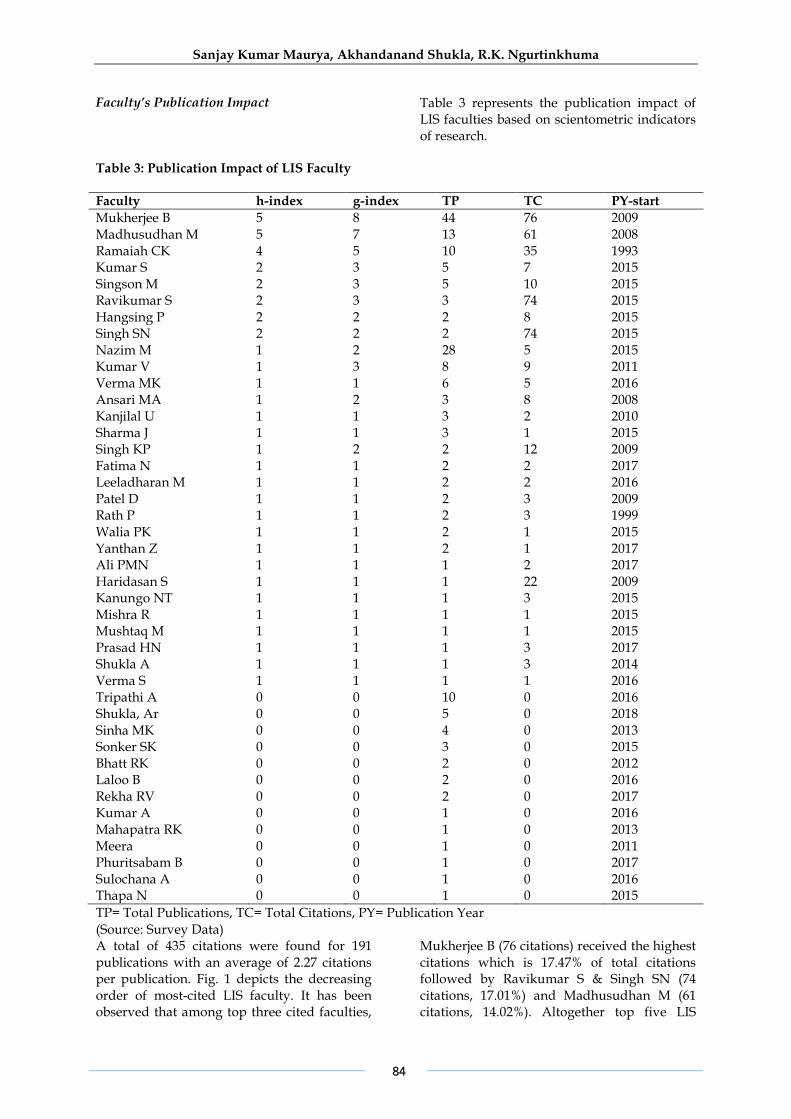
Faculty’s Publication Impact Table 3 represents the publication impact of LIS faculties based on scientometric indicators of research.
Table 3: Publication Impact of LIS Faculty
Faculty h-index g-index TP TC PY-start
Mukherjee B 5 8 44 76 2009 Madhusudhan M 5 7 13 61 2008 Ramaiah CK 4 5 10 35 1993 Kumar S 2 3 5 7 2015 Singson M 2 3 5 10 2015 Ravikumar S 2 3 3 74 2015 Hangsing P 2 2 2 8 2015 Singh SN 2 2 2 74 2015 Nazim M 1 2 28 5 2015 Kumar V 1 3 8 9 2011 Verma MK 1 1 6 5 2016 Ansari MA 1 2 3 8 2008 Kanjilal U 1 1 3 2 2010 Sharma J 1 1 3 1 2015 Singh KP 1 2 2 12 2009 Fatima N 1 1 2 2 2017 Leeladharan M 1 1 2 2 2016 Patel D 1 1 2 3 2009 Rath P 1 1 2 3 1999 Walia PK 1 1 2 1 2015 Yanthan Z 1 1 2 1 2017 Ali PMN 1 1 1 2 2017 Haridasan S 1 1 1 22 2009 Kanungo NT 1 1 1 3 2015 Mishra R 1 1 1 1 2015 Mushtaq M 1 1 1 1 2015 Prasad HN 1 1 1 3 2017 Shukla A 1 1 1 3 2014 Verma S 1 1 1 1 2016 Tripathi A 0 0 10 0 2016 Shukla, Ar 0 0 5 0 2018 Sinha MK 0 0 4 0 2013 Sonker SK 0 0 3 0 2015 Bhatt RK 0 0 2 0 2012 Laloo B 0 0 2 0 2016 Rekha RV 0 0 2 0 2017 Kumar A 0 0 1 0 2016 Mahapatra RK 0 0 1 0 2013 Meera 0 0 1 0 2011 Phuritsabam B 0 0 1 0 2017 Sulochana A 0 0 1 0 2016 Thapa N 0 0 1 0 2015
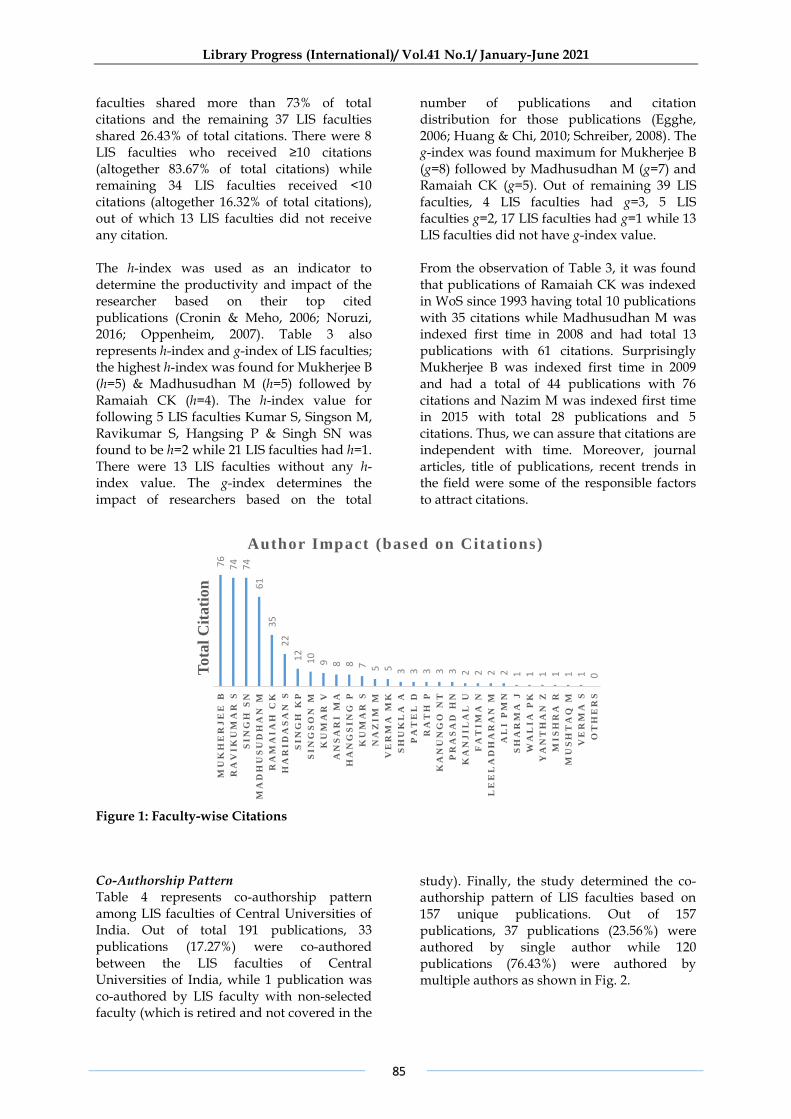
TP= Total Publications, TC= Total Citations, PY= Publication Year (Source: Survey Data) A total of 435 citations were found for 191 publications with an average of 2.27 citations per publication. Fig. 1 depicts the decreasing order of most-cited LIS faculty. It has been observed that among top three cited faculties,
Mukherjee B (76 citations) received the highest citations which is 17.47% of total citations followed by Ravikumar S & Singh SN (74 citations, 17.01%) and Madhusudhan M (61 citations, 14.02%). Altogether top five LIS
Library Progress (International)/ Vol.41 No.1/ January-June 2021
85
faculties shared more than 73% of total citations and the remaining 37 LIS faculties shared 26.43% of total citations. There were 8 LIS faculties who received ≥10 citations (altogether 83.67% of total citations) while remaining 34 LIS faculties received <10 citations (altogether 16.32% of total citations), out of which 13 LIS faculties did not receive any citation. The h-index was used as an indicator to determine the productivity and impact of the researcher based on their top cited publications (Cronin & Meho, 2006; Noruzi, 2016; Oppenheim, 2007). Table 3 also represents h-index and g-index of LIS faculties; the highest h-index was found for Mukherjee B (h=5) & Madhusudhan M (h=5) followed by Ramaiah CK (h=4). The h-index value for following 5 LIS faculties Kumar S, Singson M, Ravikumar S, Hangsing P & Singh SN was found to be h=2 while 21 LIS faculties had h=1. There were 13 LIS faculties without any h-index value. The g-index determines the impact of researchers based on the total
number of publications and citation distribution for those publications (Egghe, 2006; Huang & Chi, 2010; Schreiber, 2008). The g-index was found maximum for Mukherjee B (g=8) followed by Madhusudhan M (g=7) and Ramaiah CK (g=5). Out of remaining 39 LIS faculties, 4 LIS faculties had g=3, 5 LIS faculties g=2, 17 LIS faculties had g=1 while 13 LIS faculties did not have g-index value. From the observation of Table 3, it was found that publications of Ramaiah CK was indexed in WoS since 1993 having total 10 publications with 35 citations while Madhusudhan M was indexed first time in 2008 and had total 13 publications with 61 citations. Surprisingly Mukherjee B was indexed first time in 2009 and had a total of 44 publications with 76 citations and Nazim M was indexed first time in 2015 with total 28 publications and 5 citations. Thus, we can assure that citations are independent with time. Moreover, journal articles, title of publications, recent trends in the field were some of the responsible factors to attract citations.
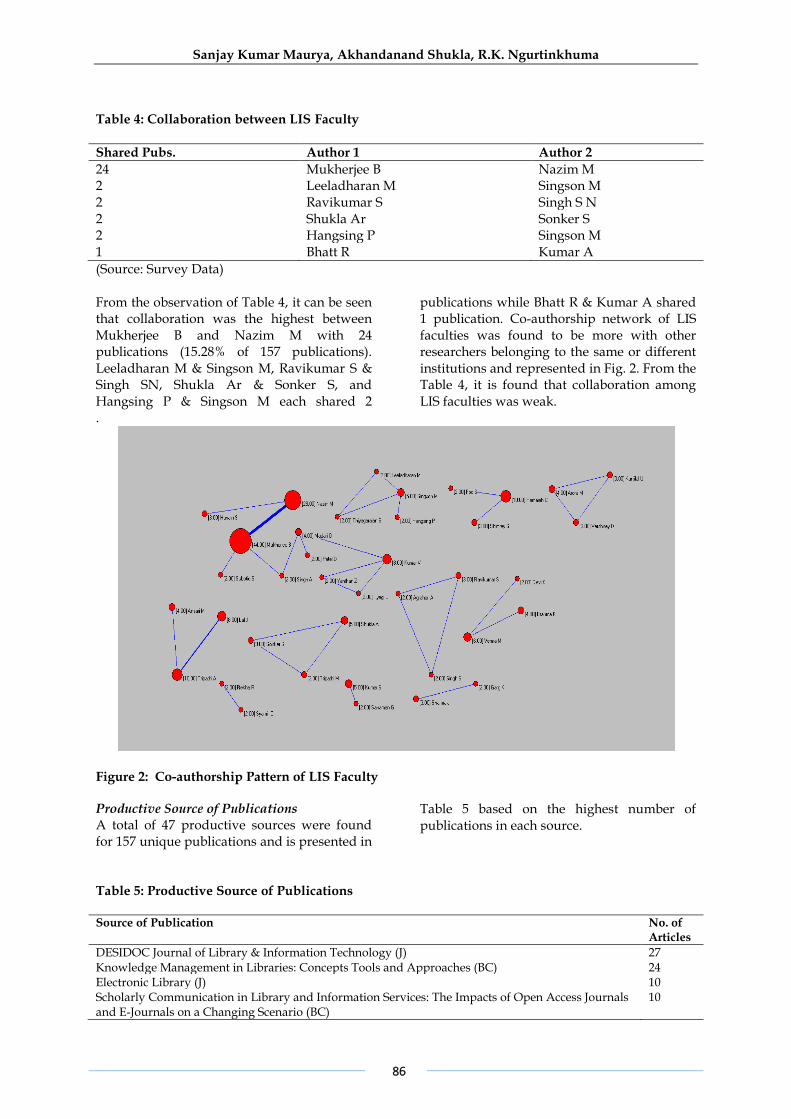
Figure 1: Faculty-wise Citations Co-Authorship Pattern Table 4 represents co-authorship pattern among LIS faculties of Central Universities of India. Out of total 191 publications, 33 publications (17.27%) were co-authored between the LIS faculties of Central Universities of India, while 1 publication was co-authored by LIS faculty with non-selected faculty (which is retired and not covered in the
study). Finally, the study determined the co-authorship pattern of LIS faculties based on 157 unique publications. Out of 157 publications, 37 publications (23.56%) were authored by single author while 120 publications (76.43%) were authored by multiple authors as shown in Fig. 2.
76
74
74
61
35
22
12
10
9 8 8 7 5 5 3 3 3 3 3 2 2 2 2 1 1 1 1 1 1 0
MU
KH
ER
JE
E B
RA
VI
KU
MA
R S
SI
NG
H S
N
MA
DH
US
UD
HA
N M
RA
MA
IA
H C
K
HA
RI
DA
SA
N S
SI
NG
H K
P
SI
NG
SO
N M
KU
MA
R V
AN
SA
RI
MA
HA
NG
SI
NG
P
KU
MA
R S
NA
ZI
M M
VE
RM
A M
K
SH
UK
LA
A
PA
TE
L D
RA
TH
P
KA
NU
NG
O N
T
PR
AS
AD
HN
KA
NJ
IL
AL
U
FA
TI
MA
N
LE
EL
AD
HA
RA
N M
AL
I P
MN
SH
AR
MA
J
WA
LI
A P
K
YA
NT
HA
N Z
MI
SH
RA
R
MU
SH
TA
Q M
VE
RM
A S
OT
HE
RS
Tota
l C
itati
on
Author Impact (based on Citations)
Sanjay Kumar Maurya, Akhandanand Shukla, R.K. Ngurtinkhuma
86
Table 4: Collaboration between LIS Faculty
Shared Pubs. Author 1 Author 2
24 Mukherjee B Nazim M 2 Leeladharan M Singson M 2 Ravikumar S Singh S N 2 Shukla Ar Sonker S 2 Hangsing P Singson M 1 Bhatt R Kumar A
(Source: Survey Data) From the observation of Table 4, it can be seen that collaboration was the highest between Mukherjee B and Nazim M with 24 publications (15.28% of 157 publications). Leeladharan M & Singson M, Ravikumar S & Singh SN, Shukla Ar & Sonker S, and Hangsing P & Singson M each shared 2
publications while Bhatt R & Kumar A shared 1 publication. Co-authorship network of LIS faculties was found to be more with other researchers belonging to the same or different institutions and represented in Fig. 2. From the Table 4, it is found that collaboration among LIS faculties was weak.
.
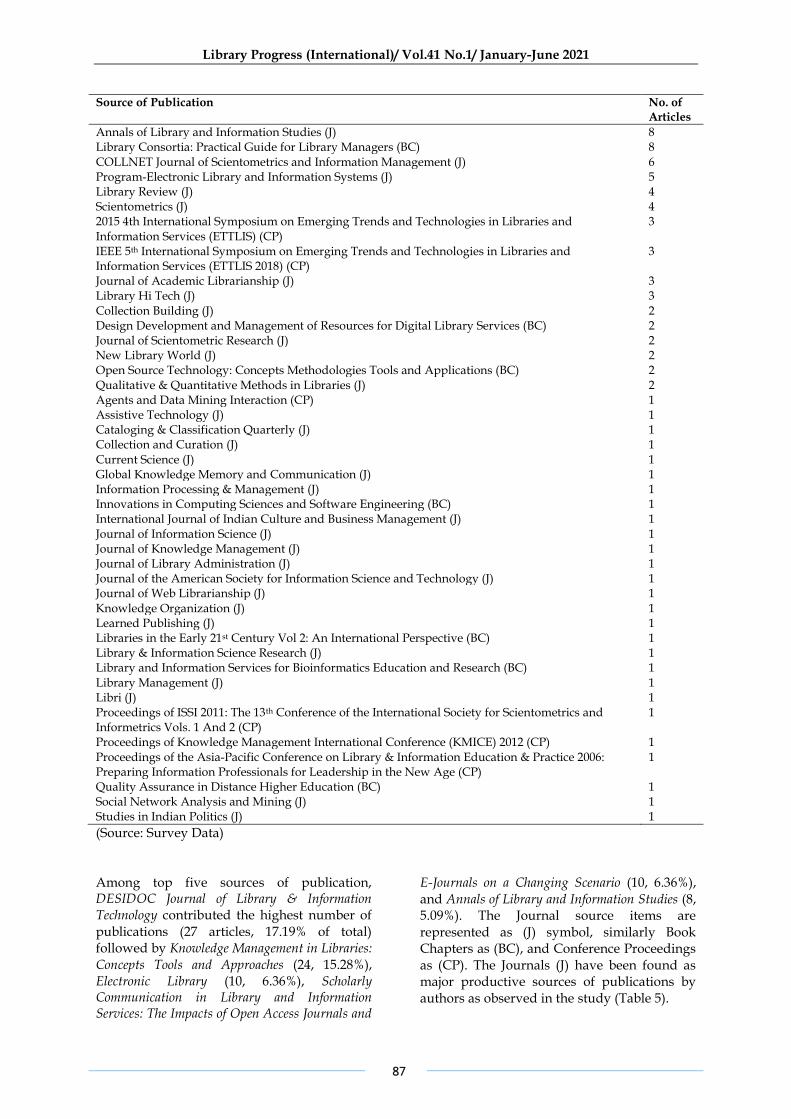
Figure 2: Co-authorship Pattern of LIS Faculty Productive Source of Publications A total of 47 productive sources were found for 157 unique publications and is presented in
Table 5 based on the highest number of publications in each source.
Table 5: Productive Source of Publications Source of Publication No. of
Articles
DESIDOC Journal of Library & Information Technology (J) 27 Knowledge Management in Libraries: Concepts Tools and Approaches (BC) 24 Electronic Library (J) 10 Scholarly Communication in Library and Information Services: The Impacts of Open Access Journals and E-Journals on a Changing Scenario (BC)
10
Library Progress (International)/ Vol.41 No.1/ January-June 2021
87
Source of Publication No. of Articles
Annals of Library and Information Studies (J) 8 Library Consortia: Practical Guide for Library Managers (BC) 8 COLLNET Journal of Scientometrics and Information Management (J) 6 Program-Electronic Library and Information Systems (J) 5 Library Review (J) 4 Scientometrics (J) 4 2015 4th International Symposium on Emerging Trends and Technologies in Libraries and Information Services (ETTLIS) (CP)
3
IEEE 5th International Symposium on Emerging Trends and Technologies in Libraries and Information Services (ETTLIS 2018) (CP)
3
Journal of Academic Librarianship (J) 3 Library Hi Tech (J) 3 Collection Building (J) 2 Design Development and Management of Resources for Digital Library Services (BC) 2 Journal of Scientometric Research (J) 2 New Library World (J) 2 Open Source Technology: Concepts Methodologies Tools and Applications (BC) 2 Qualitative & Quantitative Methods in Libraries (J) 2 Agents and Data Mining Interaction (CP) 1 Assistive Technology (J) 1 Cataloging & Classification Quarterly (J) 1 Collection and Curation (J) 1 Current Science (J) 1 Global Knowledge Memory and Communication (J) 1 Information Processing & Management (J) 1 Innovations in Computing Sciences and Software Engineering (BC) 1 International Journal of Indian Culture and Business Management (J) 1 Journal of Information Science (J) 1 Journal of Knowledge Management (J) 1 Journal of Library Administration (J) 1 Journal of the American Society for Information Science and Technology (J) 1 Journal of Web Librarianship (J) 1 Knowledge Organization (J) 1 Learned Publishing (J) 1 Libraries in the Early 21st Century Vol 2: An International Perspective (BC) 1 Library & Information Science Research (J) 1 Library and Information Services for Bioinformatics Education and Research (BC) 1 Library Management (J) 1 Libri (J) 1 Proceedings of ISSI 2011: The 13th Conference of the International Society for Scientometrics and Informetrics Vols. 1 And 2 (CP)
1
Proceedings of Knowledge Management International Conference (KMICE) 2012 (CP) 1 Proceedings of the Asia-Pacific Conference on Library & Information Education & Practice 2006: Preparing Information Professionals for Leadership in the New Age (CP)
1
Quality Assurance in Distance Higher Education (BC) 1 Social Network Analysis and Mining (J) 1 Studies in Indian Politics (J) 1
(Source: Survey Data) Among top five sources of publication, DESIDOC Journal of Library & Information Technology contributed the highest number of publications (27 articles, 17.19% of total) followed by Knowledge Management in Libraries: Concepts Tools and Approaches (24, 15.28%), Electronic Library (10, 6.36%), Scholarly Communication in Library and Information Services: The Impacts of Open Access Journals and
E-Journals on a Changing Scenario (10, 6.36%), and Annals of Library and Information Studies (8, 5.09%). The Journal source items are represented as (J) symbol, similarly Book Chapters as (BC), and Conference Proceedings as (CP). The Journals (J) have been found as major productive sources of publications by authors as observed in the study (Table 5).
Sanjay Kumar Maurya, Akhandanand Shukla, R.K. Ngurtinkhuma
88
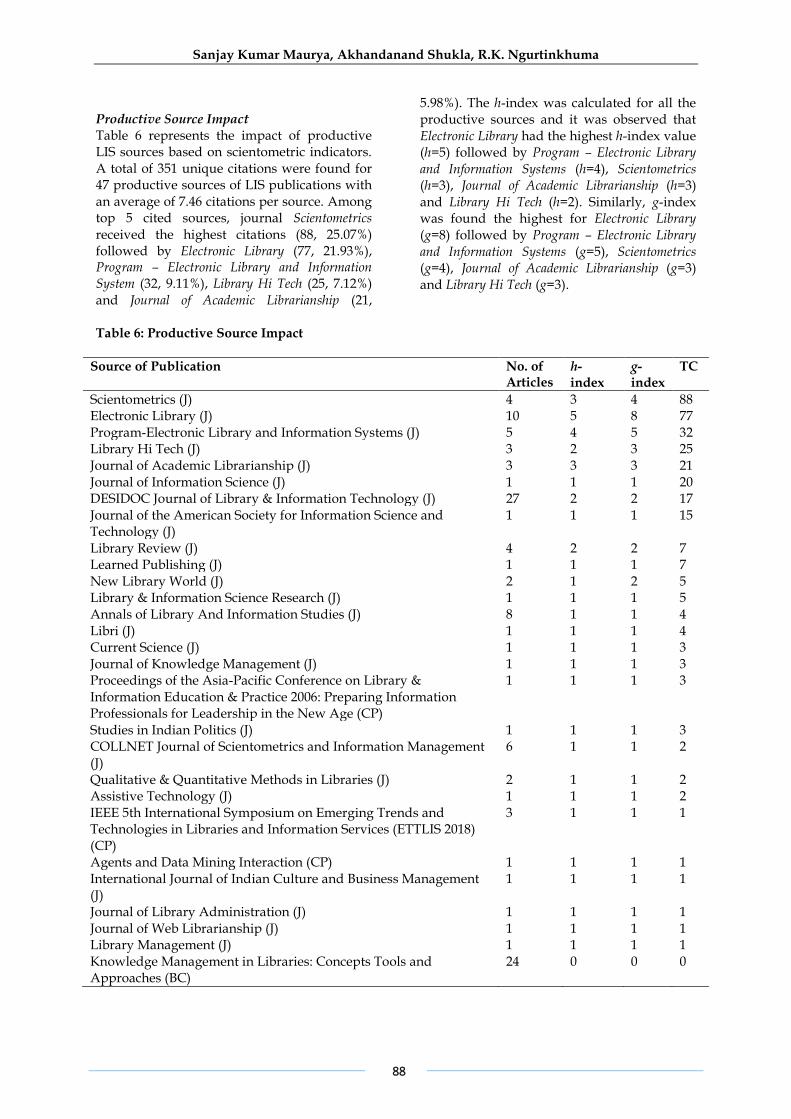
Productive Source Impact Table 6 represents the impact of productive LIS sources based on scientometric indicators. A total of 351 unique citations were found for 47 productive sources of LIS publications with an average of 7.46 citations per source. Among top 5 cited sources, journal Scientometrics received the highest citations (88, 25.07%) followed by Electronic Library (77, 21.93%), Program – Electronic Library and Information System (32, 9.11%), Library Hi Tech (25, 7.12%) and Journal of Academic Librarianship (21,
5.98%). The h-index was calculated for all the productive sources and it was observed that Electronic Library had the highest h-index value (h=5) followed by Program – Electronic Library and Information Systems (h=4), Scientometrics (h=3), Journal of Academic Librarianship (h=3) and Library Hi Tech (h=2). Similarly, g-index was found the highest for Electronic Library (g=8) followed by Program – Electronic Library and Information Systems (g=5), Scientometrics (g=4), Journal of Academic Librarianship (g=3) and Library Hi Tech (g=3).
Table 6: Productive Source Impact
Source of Publication No. of Articles
h- index
g-index
TC
Scientometrics (J) 4 3 4 88 Electronic Library (J) 10 5 8 77 Program-Electronic Library and Information Systems (J) 5 4 5 32 Library Hi Tech (J) 3 2 3 25 Journal of Academic Librarianship (J) 3 3 3 21 Journal of Information Science (J) 1 1 1 20 DESIDOC Journal of Library & Information Technology (J) 27 2 2 17 Journal of the American Society for Information Science and Technology (J)
1 1 1 15
Library Review (J) 4 2 2 7 Learned Publishing (J) 1 1 1 7 New Library World (J) 2 1 2 5 Library & Information Science Research (J) 1 1 1 5 Annals of Library And Information Studies (J) 8 1 1 4 Libri (J) 1 1 1 4 Current Science (J) 1 1 1 3 Journal of Knowledge Management (J) 1 1 1 3 Proceedings of the Asia-Pacific Conference on Library & Information Education & Practice 2006: Preparing Information Professionals for Leadership in the New Age (CP)
1 1 1 3
Studies in Indian Politics (J) 1 1 1 3 COLLNET Journal of Scientometrics and Information Management (J)
6 1 1 2
Qualitative & Quantitative Methods in Libraries (J) 2 1 1 2 Assistive Technology (J) 1 1 1 2 IEEE 5th International Symposium on Emerging Trends and Technologies in Libraries and Information Services (ETTLIS 2018) (CP)
3 1 1 1
Agents and Data Mining Interaction (CP) 1 1 1 1 International Journal of Indian Culture and Business Management (J)
1 1 1 1
Journal of Library Administration (J) 1 1 1 1 Journal of Web Librarianship (J) 1 1 1 1 Library Management (J) 1 1 1 1 Knowledge Management in Libraries: Concepts Tools and Approaches (BC)
24 0 0 0
Library Progress (International)/ Vol.41 No.1/ January-June 2021
89
Source of Publication No. of Articles
h- index
g-index
TC
Scholarly Communication in Library and Information Services: The Impacts of Open Access Journals and E-Journals on a Changing Scenario (BC)
10 0 0 0
Library Consortia: Practical Guide for Library Managers (BC) 8 0 0 0 2015 4th International Symposium on Emerging Trends and Technologies in Libraries and Information Services (ETTLIS) (CP)
3 0 0 0
Collection Building (J) 2 0 0 0 Design Development and Management of Resources for Digital Library Services (BC)
2 0 0 0
Journal of Scientometric Research (J) 2 0 0 0 Open Source Technology: Concepts Methodologies Tools and Applications (BC)
2 0 0 0
Cataloging & Classification Quarterly (J) 1 0 0 0 Collection and Curation (J) 1 0 0 0 Global Knowledge Memory and Communication (J) 1 0 0 0 Information Processing & Management (J) 1 0 0 0 Innovations in Computing Sciences and Software Engineering (BC) 1 0 0 0 Knowledge Organization (J) 1 0 0 0 Libraries in the Early 21st Century Vol 2: An International Perspective (BC)
1 0 0 0
Library and Information Services for Bioinformatics Education and Research (BC)
1 0 0 0
Proceedings of ISSI 2011: The 13th Conference of the International Society for Scientometrics and Informetrics Vols 1 and 2 (CP)
1 0 0 0
Proceedings of Knowledge Management International Conference (KMICE) 2012 (CP)
1 0 0 0
Quality Assurance in Distance Higher Education (BC) 1 0 0 0 Social Network Analysis and Mining (J) 1 0 0 0
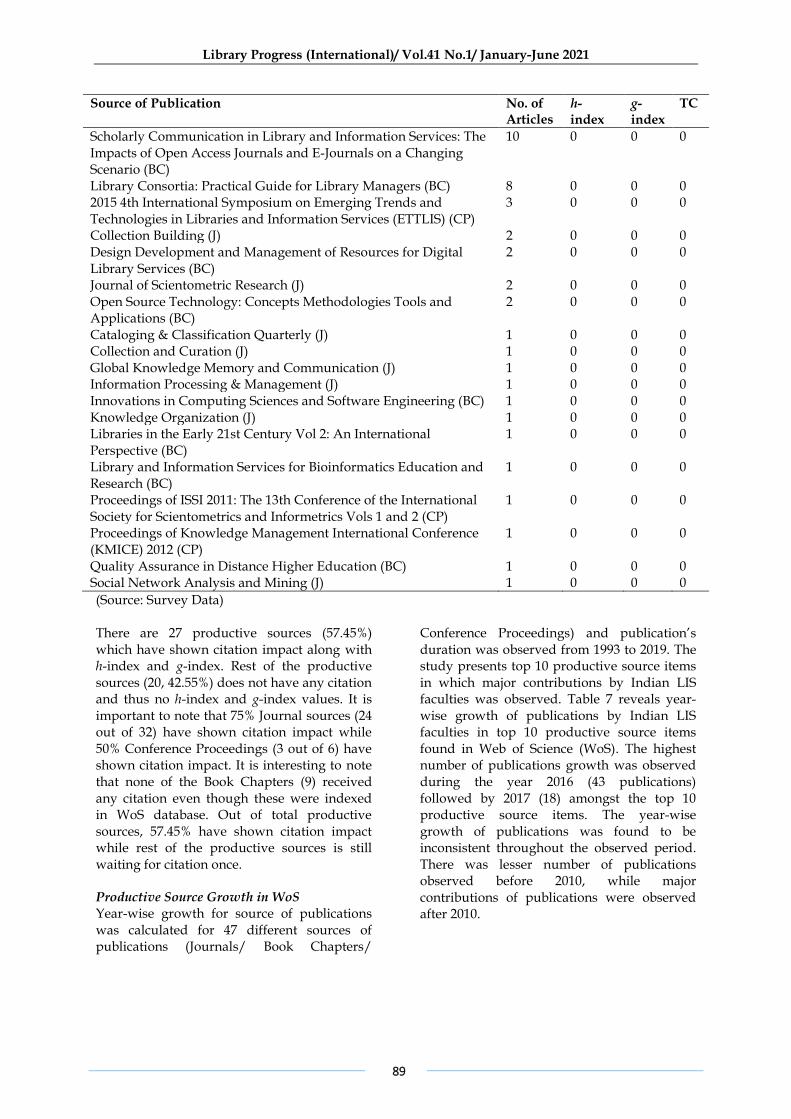
(Source: Survey Data) There are 27 productive sources (57.45%) which have shown citation impact along with h-index and g-index. Rest of the productive sources (20, 42.55%) does not have any citation and thus no h-index and g-index values. It is important to note that 75% Journal sources (24 out of 32) have shown citation impact while 50% Conference Proceedings (3 out of 6) have shown citation impact. It is interesting to note that none of the Book Chapters (9) received any citation even though these were indexed in WoS database. Out of total productive sources, 57.45% have shown citation impact while rest of the productive sources is still waiting for citation once. Productive Source Growth in WoS Year-wise growth for source of publications was calculated for 47 different sources of publications (Journals/ Book Chapters/
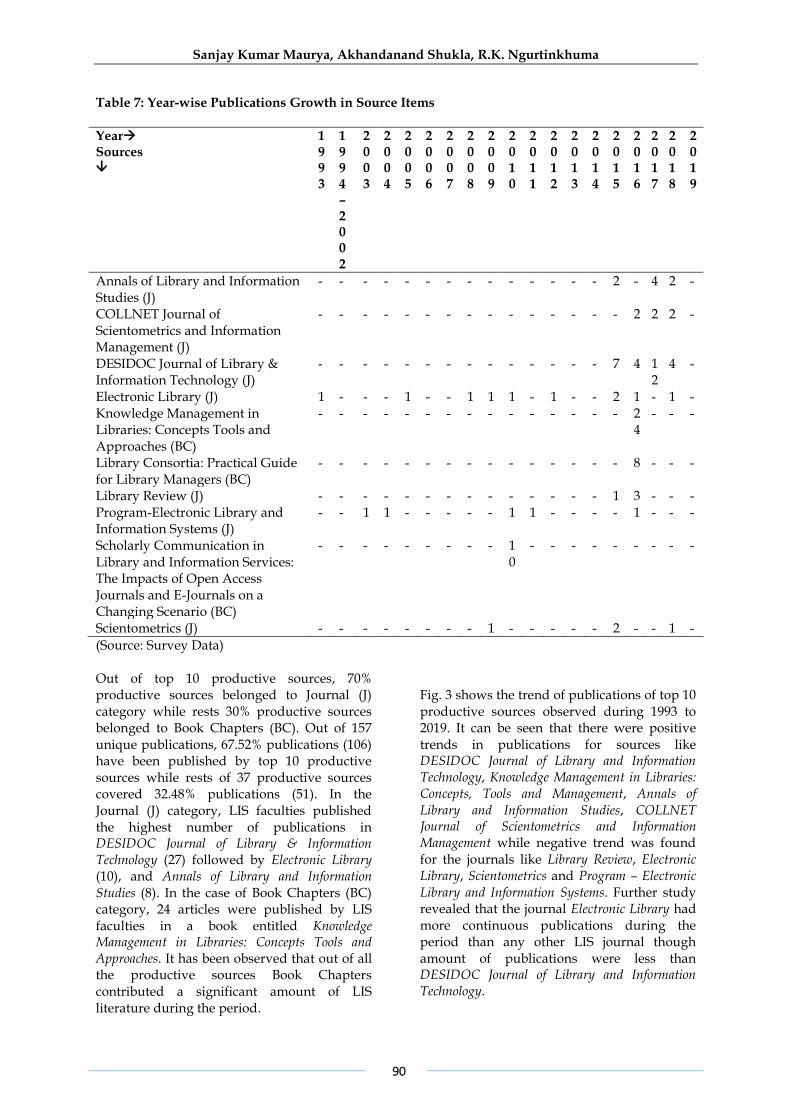
Conference Proceedings) and publication’s duration was observed from 1993 to 2019. The study presents top 10 productive source items in which major contributions by Indian LIS faculties was observed. Table 7 reveals year-wise growth of publications by Indian LIS faculties in top 10 productive source items found in Web of Science (WoS). The highest number of publications growth was observed during the year 2016 (43 publications) followed by 2017 (18) amongst the top 10 productive source items. The year-wise growth of publications was found to be inconsistent throughout the observed period. There was lesser number of publications observed before 2010, while major contributions of publications were observed after 2010.
Sanjay Kumar Maurya, Akhandanand Shukla, R.K. Ngurtinkhuma
90
Table 7: Year-wise Publications Growth in Source Items
Year→ Sources
1993
19 94 – 20 02
2003
2004
2005
2006
2007
2008
2009
2010
2011
2012
2013
2014
2015
2 0 1 6
2 0 1 7
2018
2019
Annals of Library and Information Studies (J)
- - - - - - - - - - - - - - 2 - 4 2 -
COLLNET Journal of Scientometrics and Information Management (J)
- - - - - - - - - - - - - - - 2 2 2 -
DESIDOC Journal of Library & Information Technology (J)
- - - - - - - - - - - - - - 7 4 12
4 -
Electronic Library (J) 1 - - - 1 - - 1 1 1 - 1 - - 2 1 - 1 - Knowledge Management in Libraries: Concepts Tools and Approaches (BC)
- - - - - - - - - - - - - - - 24
- - -
Library Consortia: Practical Guide for Library Managers (BC)
- - - - - - - - - - - - - - - 8 - - -
Library Review (J) - - - - - - - - - - - - - - 1 3 - - - Program-Electronic Library and Information Systems (J)
- - 1 1 - - - - - 1 1 - - - - 1 - - -
Scholarly Communication in Library and Information Services: The Impacts of Open Access Journals and E-Journals on a Changing Scenario (BC)
- - - - - - - - - 10
- - - - - - - - -
Scientometrics (J) - - - - - - - - 1 - - - - - 2 - - 1 -
(Source: Survey Data) Out of top 10 productive sources, 70% productive sources belonged to Journal (J) category while rests 30% productive sources belonged to Book Chapters (BC). Out of 157 unique publications, 67.52% publications (106) have been published by top 10 productive sources while rests of 37 productive sources covered 32.48% publications (51). In the Journal (J) category, LIS faculties published the highest number of publications in DESIDOC Journal of Library & Information Technology (27) followed by Electronic Library (10), and Annals of Library and Information Studies (8). In the case of Book Chapters (BC) category, 24 articles were published by LIS faculties in a book entitled Knowledge Management in Libraries: Concepts Tools and Approaches. It has been observed that out of all the productive sources Book Chapters contributed a significant amount of LIS literature during the period.
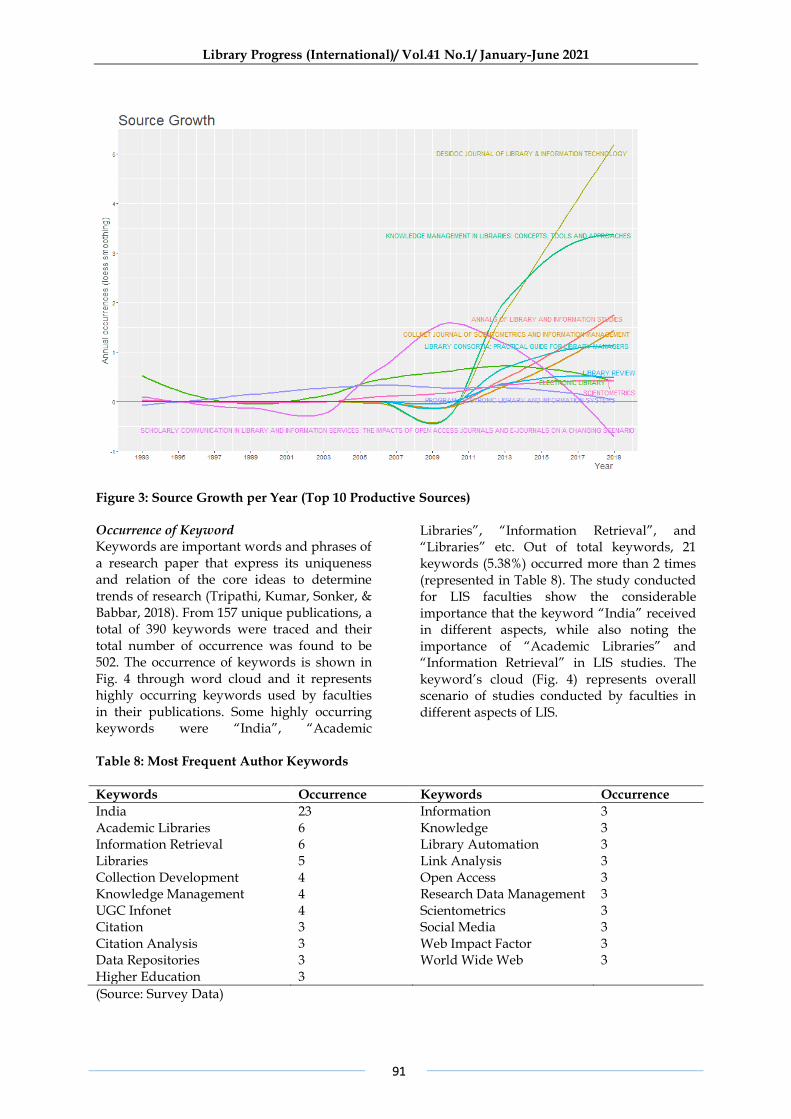
Fig. 3 shows the trend of publications of top 10 productive sources observed during 1993 to 2019. It can be seen that there were positive trends in publications for sources like DESIDOC Journal of Library and Information Technology, Knowledge Management in Libraries: Concepts, Tools and Management, Annals of Library and Information Studies, COLLNET Journal of Scientometrics and Information Management while negative trend was found for the journals like Library Review, Electronic Library, Scientometrics and Program – Electronic Library and Information Systems. Further study revealed that the journal Electronic Library had more continuous publications during the period than any other LIS journal though amount of publications were less than DESIDOC Journal of Library and Information Technology.
Library Progress (International)/ Vol.41 No.1/ January-June 2021
91
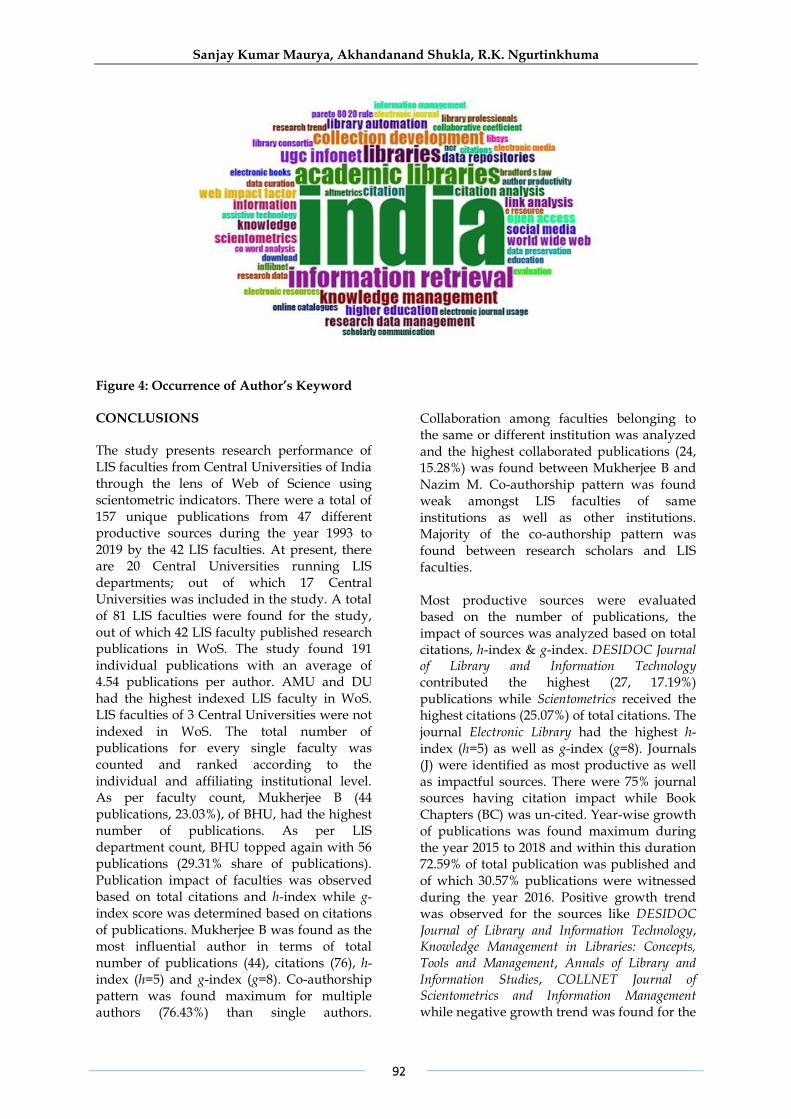
Figure 3: Source Growth per Year (Top 10 Productive Sources) Occurrence of Keyword Keywords are important words and phrases of a research paper that express its uniqueness and relation of the core ideas to determine trends of research (Tripathi, Kumar, Sonker, & Babbar, 2018). From 157 unique publications, a total of 390 keywords were traced and their total number of occurrence was found to be 502. The occurrence of keywords is shown in Fig. 4 through word cloud and it represents highly occurring keywords used by faculties in their publications. Some highly occurring keywords were “India”, “Academic
Libraries”, “Information Retrieval”, and “Libraries” etc. Out of total keywords, 21 keywords (5.38%) occurred more than 2 times (represented in Table 8). The study conducted for LIS faculties show the considerable importance that the keyword “India” received in different aspects, while also noting the importance of “Academic Libraries” and “Information Retrieval” in LIS studies. The keyword’s cloud (Fig. 4) represents overall scenario of studies conducted by faculties in different aspects of LIS.
Table 8: Most Frequent Author Keywords
Keywords Occurrence Keywords Occurrence
India 23 Information 3 Academic Libraries 6 Knowledge 3 Information Retrieval 6 Library Automation 3 Libraries 5 Link Analysis 3 Collection Development 4 Open Access 3 Knowledge Management 4 Research Data Management 3 UGC Infonet 4 Scientometrics 3 Citation 3 Social Media 3 Citation Analysis 3 Web Impact Factor 3 Data Repositories 3 World Wide Web 3 Higher Education 3
(Source: Survey Data)
Sanjay Kumar Maurya, Akhandanand Shukla, R.K. Ngurtinkhuma
92
Figure 4: Occurrence of Author’s Keyword CONCLUSIONS The study presents research performance of LIS faculties from Central Universities of India through the lens of Web of Science using scientometric indicators. There were a total of 157 unique publications from 47 different productive sources during the year 1993 to 2019 by the 42 LIS faculties. At present, there are 20 Central Universities running LIS departments; out of which 17 Central Universities was included in the study. A total of 81 LIS faculties were found for the study, out of which 42 LIS faculty published research publications in WoS. The study found 191 individual publications with an average of 4.54 publications per author. AMU and DU had the highest indexed LIS faculty in WoS. LIS faculties of 3 Central Universities were not indexed in WoS. The total number of publications for every single faculty was counted and ranked according to the individual and affiliating institutional level. As per faculty count, Mukherjee B (44 publications, 23.03%), of BHU, had the highest number of publications. As per LIS department count, BHU topped again with 56 publications (29.31% share of publications). Publication impact of faculties was observed based on total citations and h-index while g-index score was determined based on citations of publications. Mukherjee B was found as the most influential author in terms of total number of publications (44), citations (76), h-index (h=5) and g-index (g=8). Co-authorship pattern was found maximum for multiple authors (76.43%) than single authors.
Collaboration among faculties belonging to the same or different institution was analyzed and the highest collaborated publications (24, 15.28%) was found between Mukherjee B and Nazim M. Co-authorship pattern was found weak amongst LIS faculties of same institutions as well as other institutions. Majority of the co-authorship pattern was found between research scholars and LIS faculties. Most productive sources were evaluated based on the number of publications, the impact of sources was analyzed based on total citations, h-index & g-index. DESIDOC Journal of Library and Information Technology contributed the highest (27, 17.19%) publications while Scientometrics received the highest citations (25.07%) of total citations. The journal Electronic Library had the highest h-index (h=5) as well as g-index (g=8). Journals (J) were identified as most productive as well as impactful sources. There were 75% journal sources having citation impact while Book Chapters (BC) was un-cited. Year-wise growth of publications was found maximum during the year 2015 to 2018 and within this duration 72.59% of total publication was published and of which 30.57% publications were witnessed during the year 2016. Positive growth trend was observed for the sources like DESIDOC Journal of Library and Information Technology, Knowledge Management in Libraries: Concepts, Tools and Management, Annals of Library and Information Studies, COLLNET Journal of Scientometrics and Information Management while negative growth trend was found for the
Library Progress (International)/ Vol.41 No.1/ January-June 2021
93
journals like Library Review, Electronic Library, Scientometrics and Program – Electronic Library and Information Systems. The occurrence of keywords was analyzed from the total 390 author keywords. The high frequency of keywords implies the core areas of research preferred by the LIS faculties in their publications. REFERENCES 1. Adkins, D., & Budd, J. (2006). Scholarly
productivity of U.S. LIS faculty. Library & Information Science Research, 28(3), 374–389. https://doi.org/10.1016/j.lisr.2006.03.021
2. Bornmann, L., & Bauer, J. (2015). Which of the world’s institutions employ the most highly cited researchers? An analysis of the data from highlycited.com. Journal of the Association for Information Science and Technology, 66(10), 2146–2148. https://doi.org/10.1002/asi.23396
3. Cronin, B., & Meho, L. (2006). Using the h-index to rank influential information scientists. Journal of the American Society for Information Science and Technology, 57(9), 1275–1278. https://doi.org/10.1002/asi.20354
4. Egghe, L. (2006). Theory and practise of the g-index. Scientometrics, 69(1), 131-152.
5. Gao, W., & Guo, H.-C. (2014). Nitrogen research at watershed scale: a bibliometric analysis during 1959–2011. Scientometrics, 99(3), 737–753. https://doi.org/10.1007/s11192-014-1240-8
6. Gautam, V. K., & Mishra, R. (2015). Scholarly research trend of Banaras Hindu University during 2004-2013: A scientometric study based on Indian citation index. DESIDOC Journal of Library & Information Technology, 35(2), 75-81.
7. Ho, Y.-S. (2013). The top-cited research works in the Science Citation Index Expanded. Scientometrics, 94(3), 1297–1312. https://doi.org/10.1007/s11192-012-0837-z
8. Huang, M., & Chi, P. (2010). A comparative analysis of the application of h-index, g-index, and a-index in institutional-level research evaluation. Journal of Library and Information Studies (JLIS), 8(2), 1–10.
9. Igoumenou, A., Ebmeier, K., Roberts, N., & Fazel, S. (2014). Geographic trends of scientific output and citation practices in
psychiatry. BMC Psychiatry, 14, Article no. 332. https://doi.org/10.1186/s12888-014-0332-6
10. Liao, H., Tang, M., Luo, L., Li, C., Chiclana, F., & Zeng, X.-J. (2018). A bibliometric analysis and visualization of medical big data research. Sustainability, 10, 166.
11. Lv, P. H., Wang, G.-F., Wan, Y., Liu, J., Liu, Q., & Ma, F. (2011). Bibliometric trend analysis on global graphene research. Scientometrics, 88(2), 399–419. https://doi.org/10.1007/s11192-011-0386-x
12. Meho, L. I., & Spurgin, K. M. (2005). Ranking the research productivity of library and information science faculty and schools: An evaluation of data sources and research methods. Journal of the American Society for Information Science and Technology, 56(12), 1314–1331. https://doi.org/10.1002/asi.20227
13. Noruzi, A. (2016). Impact Factor, h-index, i10-index and i20-index of Webology. Webology, 13(1), Editorial 21.
14. Onyancha, O. B., & Ocholla, D. N. (2007). Country-wise Collaborations in HIV/AIDS Research in Kenya and South Africa, 1980–2005. Libri, 57(4), 239-254. https://doi.org/10.1515/LIBR.2007.239
15. Oppenheim, C. (2007). Using the h-index to rank influential British researchers in information science and librarianship. Journal of the American Society for Information Science and Technology, 58(2), 297–301. https://doi.org/10.1002/asi.20460
16. Patra, S. K., & Chand, P. (2006). Library and information science research in India: A bibliometric study, 53(4), 219–223.
17. Schreiber, M. (2008). An empirical investigation of the g-index for 26 physicists in comparison with the h-index, the A-index, and the R-index. Journal of the Association for Information Science and Technology, 59(9), 1513–1522.
18. Shaw, D., & Vaughan, L. (2008). Publication and citation patterns among LIS faculty: Profiling a “typical professor.” Library & Information Science Research, 30(1), 47–55.
19. Tian, Y., Wen, C., & Hong, S. (2008). Global scientific production on GIS research by bibliometric analysis from 1997 to 2006. Journal of Informetrics, 2(1),
Sanjay Kumar Maurya, Akhandanand Shukla, R.K. Ngurtinkhuma
94
65–74. https://doi.org/10.1016/j.joi.2007.10.001
20. Tripathi, M., Kumar, S., Sonker, S. K., & Babbar, P. (2018). Occurrence of author keywords and keywords plus in social sciences and humanities research : A preliminary study. COLLNET Journal of Scientometrics and Information Management, 12(2), 215–232. https://doi.org/10.1080/09737766.2018.1436951
21. Weller, A. C., Hurd, J. M., & Wiberley, S. E. (1999). Publication patterns of US academic librarians from 1993 to 1997. College & Research Libraries, 60(4), 352–362.
22. Yazit, N., & Zainab, A. N. (2007). Publication productivity of Malaysian authors and institutions in LIS. Malaysian Journal of Library and Information Science, 12(2), 35-55. Available at https://mjlis.um.edu.my/article/view/6995/4653
How to cite this article: Maurya SK., Shukla A., Ngurtinkhuma RK. (2021). Research Performance of Indian LIS Faculties from Central Universities: A Scientometric Exploration through the Lens of Web of Science (WoS). Library Progress (International), 41(1), 79-94.