research proposal - mospace
TRANSCRIPT

THE RELATIONSHIP BETWEEN PRINCIPAL LEADERSHIP SKILLS AND
SCHOOL-WIDE POSITIVE BEHAVIOR SUPPORT: AN EXPLORATORY STUDY
A Dissertation Presented to the Faculty of the Graduate School
University of Missouri-Columbia
In Partial Fulfillment
Of the Requirements for the Degree
Doctor of Philosophy
By
Mary M. Richter
Dr. Timothy J. Lewis, Dissertation Supervisor
December 2006

© Mary M. Richter 2006 All Rights Reserved

The undersigned, appointed by the Dean of the Graduate School, have examined the dissertation entitled: THE RELATIONSHIP BETWEEN PRINCIPAL LEADERSHIP SKILLS AND SCHOOL-WIDE POSITIVE BEHAVIOR SUPPORT: AN EXPLORATORY STUDY
Presented by Mary M. Richter, a candidate for the degree of Doctor of Philosophy, and
hereby certify that in their opinion it is worthy of acceptance.
_______________________________
Dr. Timothy Lewis
_______________________________
Dr. Sharon Huntze
_______________________________
Dr. Janine Stichter
_______________________________
Dr. Melissa Stormont
_______________________________ Dr. Jerry Valentine

DEDICATION
This study is dedicated to my family – To my parents, John and Marjorie Miller, who always put others first, believed in and
demonstrated the responsibility we all have to improve our world, and who have
supported me throughout my life in whatever I have striven to do.
To my sister Ann and brother-in-law Bill, for their unyielding faith in me and sincere
interest in learning about my work.
To my husband, Roy, for many sacrifices large and small that helped me accomplish this
goal, for his continued support, and for his pride in my accomplishments.
And to my daughters, Amanda and Laura, who bring joy and meaning to my life every
day and give me purpose in all that I do.

ACKNOWLEDGEMENTS
I would like to thank Dr. Tim Lewis for many things including offering me the
opportunity to participate in the Ph.D. program, tolerating my incessant and sometimes
inane questions with good humor, for pushing me to grow as a professional educator and
a researcher, and for sharing his wide-ranging and deep knowledge of the field.
I would like to thank Dr. Melissa Stormont for her open-door policy literally and
figuratively, which often provided the support, encouragement, and guidance I needed to
improve my writing and clarify my objectives. I would also like to thank Dr. Janine
Stichter for making me think, think, think and scrutinize every detail of my work, and for
encouraging me in multiple ways. To Dr. Sharon Huntze, I would like to offer my
appreciation for the example you have set for me as a humanitarian, scholar, and
educator. I will do my best to follow your example.
Next I would like to thank Dr. Jerry Valentine for sharing his vast knowledge of
research associated with principal leadership, and for his willingness to step across the
street into a shared project with special education.
I would like to thank Lynne and Janice for the behind the scenes support that
makes programs and departments run well; John Hagar for his unending patience in
answering and explaining many questions and issues associated with statistical research;
and to the fellow doc students who have become lifelong friends – thanks Shawna, Nanci,
Linda, Lori, Becky, and Connie – you’re the best.
ii

THE RELATIONSHIP BETWEEN PRINCIPAL LEADERSHIP SKILLS AND
SCHOOL-WIDE POSITIVE BEHAVIOR SUPPORT: AN EXPLORATORY STUDY
Mary M. Richter
Dr. Timothy J. Lewis, Dissertation Supervisor
ABSTRACT
The purposes of this study were to (1) identify key principal leadership skills
associated with socially proactive school environments, (2) examine the relationship
between SW-PBS implementation and increased evidence of those skills, (3) examine the
relationship between evidence of those skills and improved certified staff job satisfaction,
and (4) examine the leadership variables associated with SW-PBS and recommendations
from the field. Additionally, this study sought to initiate a line of research associated with
principal leadership and SW-PBS. In Phase I, descriptive analysis of the literature related
to principal leadership, special education, and SW-PBS resulted in the identification of 31
key principal leadership skills In Phase II, a questionnaire developed for the study was
administered to 725 respondents (431 from schools implementing SW-PBS and 294 from
schools that were not implementing SW-PBS) within the state of Missouri. Findings
from this phase indicated: (1) certified staff and principals rated the importance of each of
the 31 skills highly, (2) principals in SW-PBS schools received significantly higher
ratings associated with behavior management effectiveness and (3) principals from SW-
PBS and non-PBS schools received relatively equivalent ratings in regard to
transformational and managerial skills. In Phase III, SW-PBS certified staff respondents
indicated statistically significant greater rates of job satisfaction than did those in non-
iii

PBS schools. In Phase IV, the predictive ability for job satisfaction in relation to
principal behavior management skills and SW-PBS status were simultaneously examined.
Principal behavior management skills were found to be the most statistically significant
indicator of certified staff job satisfaction.
iv

CONTENTS
ACKNOWLEDGEMENTS………………………………………………………...ii
ABSTRACT………………………………………………………………………...iii
LIST OF TABLES………………………………………………………………….viii
Chapter
I. INTRODUCTION AND LITERATURE REVIEW .............................................1
Statement of the Problem..............................................................................8
Review of Related Literature .......................................................................11
Summary ......................................................................................................52
Statement of Purpose ...................................................................................53
Research Questions......................................................................................53
Significance of Study...................................................................................54
Need for Study .............................................................................................55
Definition of Terms......................................................................................57
II. METHODOLOGY .............................................................................................59
Project Overview .........................................................................................59
Design and Procedure ..................................................................................60
Phase 1: Survey Questionnaire Development Participants and Setting ......61
Phase 2: Survey Questionnaire Administration and Analysis ....................64
Participants and Setting................................................................................65
Phase 3: Collection and Analysis of Demographic Data .............................75
Phase 4: Case Studies...................................................................................76
v

III. RESULTS ..........................................................................................................81
Phase 1: Survey Questionnaire Development..............................................82
Content Validity, Internal Reliability and Construct Validity .....................82
Data Analysis of the Questionnaire Instrument ...........................................83
Phase 2: Survey Questionnaire Administration and Analysis ....................101
Research Question 1 ...................................................................................107
Research Question 2 ...................................................................................112
Research Question 3 ...................................................................................116
Research Question 4 ...................................................................................117
Research Question 5 ...................................................................................118
Phase 3: Collection and Analysis of Demographic Data ............................122
Demographic Data Related to Participating Schools..................................122
Demographic Data Related to Sample Respondents ..................................126
Phase 4: Case Studies..................................................................................127
SET Results……………………………………………………………… 127
Interview Results ........................................................................................128
Office Discipline Referral Results ..............................................................133
IV. DISCUSSION...................................................................................................135
Phase 1: Survey Questionnaire Development.............................................138
Phase 2: Survey Questionnaire Administration and Analysis ....................140
Phase 3: Demographic Data Collection and Analysis ................................145
Phase 4: Case Studies..................................................................................149
Limitations ..................................................................................................150
vi

Implications for Practice .............................................................................151
Implications for Future Research................................................................152
Conclusion ..................................................................................................154
APPENDICES
A. Principal Leadership Skill Questionnaire …………………………….156
B. Principal Introductory Letter and Consent Form……………………...161
C. Superintendent Introductory Letter and Consent Form……………….163
D. Teacher Written Consent Form………………………………………..165
E. Principal Written Consent Form………………………………………166
F. Teacher Instructions Letter…………………………………………….167
G. Focus Interview Questions…………………………………………….168
H. Table of Descriptive Statistics, All Participants Items A and B………169
I. Internal Consistency of Questionnaire Subscale Items………………...201
J. Descriptive Statistics for Reduced and Transformed Datasets…………208
K. Tables Reporting Student and School Demographic Characteristics….214
L. Tables of Demographics Related to Questionnaire Respondents……...220
REFERENCES……………………………………………………………………228
VITA ……………………………………………………………………………...256
vii

LIST OF TABLES
Table Page
1. Matrix of Primary Sources for Identification of Principal Leadership Skills.....44
2. Descriptive Statistics, All Respondents, Importance (A) Values .......................85
3. Descriptive Statistics, All Respondents, Effectiveness (B) Values ....................91
4. Inter-scale Correlations for Importance (A1 to A3) to All Items .......................99
5. Inter-scale Correlations for Effectiveness (B1 to B3) to All Items ...................100
6. Percentage Rates of Respondents by School .....................................................101
7. Levene’s Test for Homogeneity of Error Variances..........................................104
8. Two-way ANOVA Results for A1 Transformational Scale (Importance) ........109
9. Two-way ANOVA Results for A2 Managerial Scale (Importance)................. .110
10. Two-way ANOVA Results for A3 Behavior Management Scale (Importance)111
11. Two-way ANOVA Results for B1 Transformational Scale (Effectiveness) ... .113
12. Two-way ANOVA Results for B2 Managerial Scale (Effectiveness)..............114
13. Two-way ANOVA Results B3 Behavior Management Scale (Effectiveness) 115
14. N and Percentages for Job Satisfaction, by PBS Status....................................117
15. Results Z-test of Independent Proportions, Job Satisfaction, by PBS Status ...117
16. Results of Linear Regression ............................................................................120
17. N and Frequencies for Item 4_7, More Satisfied with Job ...............................121
18. N and Frequencies for Item 4_8, More Satisfied with Principal Performance.121
19. Primary Demographic Characteristics Related to Schools and Students..........123
20. Demographic Characteristics of Sample Respondents by Sex, Ethnicity, Current Position and Highest Degree Earned ................................................................126
viii

21. Focus Interview Question 1: Job Satisfaction...................................................128
22. Focus Interview Question 2: Improved Student Behavior................................129
23. Focus Interview Question 3: Improved Behavior in Students At-risk for or Identified with E/BD...............................................................................................130 24. Focus Interview Question 4: Changes in Principal Leadership Style...............131
25. Focus Interview Question 5: Other Principal Changes.....................................132
26. Summary of Major Themes by Schools............................................................132
ix

1
CHAPTER I
INTRODUCTION AND REVIEW OF LITERATURE
Challenges Facing Schools
General education and special education are becoming increasingly aligned
through federal legislation, particularly the No Child Left Behind Act of 2001 (NCLB),
the Individuals with Disabilities Education Improvement Act (IDEA) of 2004, and
Section 504 of the Rehabilitation Act of 1973. Additionally, more students with
disabilities are being educated in general education classrooms for larger portions of the
school day, and standardized assessments of schools’ progress toward meeting adequate
yearly progress (AYP) goals must include their results (Ysseldke et al. 2004). As such it
is prudent for general and special education researchers and practitioners to develop,
examine, and implement programs that are effective and efficient for all students (Young,
Petersen, & Short, 2002).
A consistent theme throughout federal education legislation is the accountability
of public schools for the educational progress of all students (Council for Exceptional
Children, 2002; Yell, 2006). School personnel are to meet requirements to demonstrate
their status as “highly qualified” and accountability for academic progress of all students
is to be measured by standardized assessment instruments (Council for Exceptional
Children, 2004). Additionally, school personnel are charged with maintaining safe and
orderly school environments (U.S. Department of Education, 2001; Walker & Horner,
1996). Demands for safer schools have intensified as public awareness and concerns

2
about issues related to discipline, drug use, and violence have increased (Rose & Gallup,
2006; Sugai & Horner, 2002).
Public school principals are on the front lines of those being held accountable for
the educational progress of all students and for maintaining safe school environments
(Davis, Darling-Hammond, LaPointe, & Meyerson, 2005; Lucas & Valentine, 2002).
Fortunately, there is a growing consensus in the field of education that there are
identifiable competencies of effective school principals that increase the likelihood of
overall school success (Day, 2000; DiPaola & Walther-Thomas, 2003; Learning First
Alliance, 2005). These competencies support increased achievement for all students,
including those identified with disabilities, and enhanced job satisfaction among staff
members. Additionally, there is agreement among researchers and policymakers
regarding which competencies should be objectively assessed as demonstrable skills
(Hale & Moorman, 2003; Waters, Marzano, & McNulty, 2003). “Competencies”
generally refer to broad categories of demonstrable ability whereas “skills” implies
specific abilities that are more amenable to being operationalized and measured. Formal
assessment of competencies and skills are employed by over 40 states as one facet of
administrator licensure (Davis, et al. 2005).
As the assessment of administrator competencies and skills are becoming more
commonplace, the expectations and challenges faced by principals are increasing.
Teacher satisfaction with their principals related to accessibility, support in matters of
student discipline, and guidance related to curriculum implementation have been
identified as a critical factor in retaining highly qualified general and special education

3
teachers (Embich, 2001; Johnson & Birkeland, 2003; Minarik, Thornton, & Perreault,
2003; Richards, 2003). The student population is changing demographically,
educationally, and behaviorally (Epstein, et al. 2005; Lewis & Sugai, 1999b; Lucas &
Valentine, 2002; Salisbury & McGregor, 2002). Therefore, strategies that can better
support principals to meet these expectations and challenges are needed.
Federal and state laws require principals to be more knowledgeable about
providing a variety of student academic and behavioral supports, and more skillful at
making best use of the available resources to do so (Patterson & Protheroe, 2000).
However, individual state licensure requirements for principals as a whole are not
consistent, and many do not require demonstration of competencies associated with
behavior management or knowledge of characteristics associated with students with
diverse learning needs (Hale & Moorman, 2003; Praisner, 2003; Sirotnik & Kimball,
1994). In addition, there is a shrinking pool of experienced principals and they are
quickly aging out of the profession (Davis et al. 2005; Shen, Cooley, & Wegenke, 2004).
Courses of study through universities and colleges in preparing principals are also
diverse, utilizing varying degrees of implementation and instruction in the generally
agreed upon competencies and skills (Hale & Moorman, 2003; Young, et al. 2002). If
principals are to be successful in meeting the challenges associated with providing
effective leadership and support to school personnel so that proactive and research-based
practices will be utilized to promote success for all students, they must be provided with
the requisite skills (Crockett, 2002). Thus, although principals are charged with ensuring

4
academic and behavioral success for all students, they may not have adequate knowledge
and expertise to do so.
Federal special education laws have been in place since 1975, but many school
administrators have limited knowledge about them (Crockett, 2002; Yell, Katsiyannis, &
Bradley, 2003). Many principals have limited experience or coursework directly related
to students with disabilities. The concepts of least restrictive environment and inclusion
have varying meanings for different principals, (Powell & Hyle, 1997) yet it is frequently
their responsibility as the local education agency (LEA) representative to ensure that an
appropriate education is developed for students with disabilities (Salisbury & McGregor,
2002; Yell, et al.). “In providing leadership for the special education program in their
schools, principals must blend knowledge of effective educational practice with
knowledge of the law in order to develop and maintain the best program for all students.”
(Patterson & Protheroe, 2000, p.1).
Additionally, administration preparation programs often do not include any
significant coursework or training associated with proactive behavioral intervention
and/or management (DiPaola & Walther-Thomas, 2003). These are critical skills for
principals to possess given the behavioral and academic challenges students are bringing
to schools and the evidence of teacher frustration and need for guidance related to these
issues (Minarik, et al., 2003). Students who do not qualify for services through special
education but who continue to display significant difficulties in meeting accepted
academic and behavioral standards provide an additional ongoing challenge to schools
and their administrators (Newcomer, Lewis, & Powers, 2002). Teachers cite lack of

5
administrative support in matters related to student discipline as a contributing factor to
job dissatisfaction, burnout, and deciding to leave teaching positions (Embich, 2001;
Johnson & Birkeland, 2003; Richards, 2003). Developing safe and supportive school
communities is recognized as a critical factor in establishing environments where student
achievement increases and staff members choose to work (Learning First Alliance, 2001;
Rubin, 2004). “To more fully respond to the issue of creating improved school
environments ...informed policy and interventions are urgently needed.” (Lewis,
Newcomer, Trussell, & Richter, 2006, p. 834).
In summary, administrator preparation appears to be lacking with respect to
creating proactive school environments that can efficiently and effectively manage,
improve, and provide instruction in academics and appropriate behavior for all students
while supporting school staff members. Given the challenges associated with retaining
quality general and special education teachers, the growing number of students with
diverse needs, and the shrinking pool of qualified administrators, it is imperative that
principals are given training in effective leadership skills associated with establishing and
maintaining proactive school environments that can potentially meet their needs as well
as the staff and students they serve.
An Emerging Research Base to Assist in Meeting the Challenges
Positive Behavioral Supports (PBS) are identified in the 2004 reauthorization of
IDEA as a means to address the behavioral needs of children prior to placing them in
special education, as well as after they are identified (IDEA, 2004). School-wide PBS
provides a framework for implementing and sustaining effective, research-based practices

6
in a systematic, data-based manner to improve student outcomes through a balanced
integration of four elements (Sugai, Hagan-Burke, & Lewis-Palmer, 2004). First, schools
select clear and measurable outcomes they value for improving their school-wide
discipline systems. These outcomes are then expressed as expectations which are taught
to all students, staff and parents. For example, a common set of expectations selected by
schools is “I am safe, I am respectful, and I am a learner.”
Second, evidence-based practices to teach and reinforce appropriate behaviors framed
within the expectations are identified and agreed upon by building staff. Third, systems
within the school are implemented and refined as needed to assure staff members are
supported in their efforts to teach and reinforce the expectations with fidelity (Lewis &
Sugai, 1999a, Taylor-Greene, et al., 1997). Because the expectations are to be taught,
reinforced and monitored across all school settings, school staff members identify how to
teach and model them to fit those settings. For instance, “be safe” would imply one set of
actions and routines in the cafeteria and a potentially different set in the classroom or on
the playground (Lewis, Powers, Kelk, & Newcomer, 2002). Finally, accurate and
objective data must be collected, analyzed, and disseminated to all stakeholders so that
ongoing assessment of the systems and practices can be accomplished (Lewis-Palmer,
1999; National Technical Assistance Center on PBIS, 2004; Sugai, Hagan-Burke, &
Lewis-Palmer, 2004).
The three-tiered School-wide PBS (SW-PBS) framework provides administrators
and staff with a working model on how to build within-school capacity and competence
to (a) incorporate proactive strategies, (b) teach appropriate behaviors to all students, and

7
(c) match behavioral interventions to students’ needs (Colvin, et al. 1996; Colvin &
Sprick, 1999; Nelson, 2000, National Technical Assistance Center on PBIS, 2004). The
three tiers, primary (universal), secondary (small group), and tertiary (individual),
comprise a continuum of systems of support that make best use of a school’s resources.
Primary efforts are implemented school-wide, across all settings, for all students, and are
implemented by all staff. They form the basis of the school discipline system and have
been demonstrated to be effective with approximately 80% of the student population
(Sugai, et al. 2004; Sugai & Lewis, 2004).
Secondary efforts are implemented to support students at-risk for more serious
problem behavior (National Technical Assistance Center on PBIS, 2004) and may
include small groups designed to re-teach the school-wide expectations in specific
settings and/or simple individualized strategies and behavior intervention plans (BIPs)
(Lewis & Garrison-Harrell, 1999). These efforts may be led by a variety of school staff
members including counselors, administrators, social workers, teachers, and auxiliary
staff members. Approximately 15% of a student population will fall within this category
and will respond to the interventions.
Tertiary supports are necessary for students who engage in on-going, chronic
displays of inappropriate behaviors and who usually have a history of behavioral
difficulties (National Technical Assistance Center on PBIS, 2004; Sugai, et al. 1999;
Turnbull, et al. 2002). The focus of these supports is to reduce the complications, overall
intensity, and potential severity of the behaviors. Students with these behavioral patterns
comprise approximately 5% of a school population, are likely to have already been

8
identified for special education services, and will usually require on-going supports
throughout their school careers (Walker, Colvin, & Ramsey, 1995). By more
appropriately implementing efforts across a three-tiered system, schools make more
efficient and effective use of the personnel, time and resources available (Horner, Sugai,
Todd, & Lewis-Palmer, 2005; Lewis & Sugai, 1999a).
Training in SW-PBS methods has traditionally been presented through
professional development activities but a growing number of colleges and universities are
offering coursework in its principles and practices (R. Freeman [personal
communication], January 31, 2005). The emphases in training of establishing a clear
mission, clearly defining behavioral expectations, developing a working action plan to
implement and teach the expectations and to assess progress through data-based decision
making can assist administrators and staff to collaborate in building a proactive school
environment through school-wide PBS.
Statement of the Problem
School-wide Positive Behavior Support has been identified as an effective
framework to provide principals with a process to adequately identify, implement, and
assess appropriate behavioral supports and systems for staff and students (Horner, R.,
Sugai, & Horner, H., 2000; Taylor-Greene & Kartub, 2000). While there have been
studies associated with the effectiveness of SW-PBS in improving outcomes for students
(Lewis, Sugai, & Colvin, 1998; Lewis-Palmer, Flannery, Sugai, & Eber, 2002;
Newcomer & Lewis, 2004; Newcomer & Powers, 2002), there have been few
publications specifically describing factors associated with effective leadership by

9
principals in schools employing SW-PBS (Colvin & Sprick, 1999; Taylor-Greene &
Kartub, 2000), and no research-based studies investigating leadership skills in relation to
SW-PBS.
The credibility of any aspect of a school’s environment, whether formal or
informal, ultimately rests with the administrator in charge. The principal is the chief
learning officer, charged with leading the school and its community members forward to
meet the challenges of preparing all students to be academically and behaviorally
successful (National Association of Elementary School Principals Collaborative
Communications Group, 2002).
Principals who are more knowledgeable about special education, diverse learning
needs, and behavior management are more likely to view inclusionary practices as
appropriate (Praisner, 2003), and to provide the necessary supports for successful
collaboration of general education and special education teachers (Brotherson, Sheriff,
Milburn, & Schertz, 2001; Patterson, Marshall, & Bowling, 2000; Salisbury &
McGregor, 2002). Those who have been adequately trained in principles of behavior,
functional assessments, proactive strategies, and developing consistent and cohesive
discipline systems are more likely to be successful in leading teachers and other
stakeholders to develop appropriate IEP’s for students who display ongoing inappropriate
behaviors and/or the lack of appropriate social skills (Bays, 2004; Nersesian, Todd,
Lehmann, & Watson, 2000; Smith & Katsiyannis, 2004; Yell, et al. 2003).
SW-PBS has been recognized as a viable tool in developing appropriate social
and behavioral skills for all children (U.S. Office of Special Education and Rehabilitative

10
Services, 2003), and has been demonstrated to provide school personnel with a
continuum of skills, practices, and systems in behavioral instruction and management
which can potentially support them in making better informed and more appropriate
educational decisions for students at-risk for or identified with E/BD (Colvin & Sprick,
1999; Horner, et al. 2005; Sugai et al., 1999). Administrative leadership has been
identified as a critical component of establishing and maintaining SW-PBS (Horner &
Sugai, 2000; Lewis & Sugai, 1999a; O’Rourke, et al. 2000; Sugai, et al. 1999). Training
in SW-PBS can theoretically provide administrators with direction and enhance skills
associated with establishing and maintaining proactive school environments where
evidence of appropriate student behavior is increased. Identifying how SW-PBS can
guide principals to utilize skills in establishing school environments where all teachers
and students are more likely to be successful is imperative.
To date, no research-based studies have been conducted to assess the
effectiveness of SW-PBS in improving key principal leadership skills associated with
proactive school management of behavioral systems and supports. Safran and Oswald
(2003) noted, “In researchers’ zest to evaluate intervention effectiveness, they (PBS)
have yet to examine process and leadership factors, including team decision-making
practices, how staff consensus for intervention priorities are developed, and the role of
school leadership (p. 370).” This is a significant gap in the knowledge-base regarding
SW-PBS if it is to be implemented and sustained with fidelity.

11
Purpose Statement Summary
In summary, the purposes of this study are: (a) to investigate which principal
leadership skills demonstrate evidence as being most efficacious in establishing proactive
school environments conducive to student and staff success, and (b) to determine if SW-
PBS is a factor in the evidence of increased leadership effectiveness of principals. The
following literature review is designed to more fully explore and delineate the issues and
current knowledge-base associated with key principal leadership skills.
Review of Related Literature
Taking into account the challenges principals currently face and the potential SW-
PBS may hold to assist in meeting the challenges, the purposes of the literature review
are to: (a) identify some of the most salient features of and potential gaps in principal
leadership training, (b) examine how principal leadership skills may impact teacher
satisfaction and student achievement, and (c) further investigate the interface between
principal leadership skills and SW-PBS. To accomplish these purposes, the review of
related literature is presented in five sections. The first section is an overview of
principal leadership skills as they relate to this study. The second section focuses on
issues related to teacher satisfaction with respect to administrative performance. The
third section addresses issues of student behavior and how they relate to the overall
school climate. The fourth section provides a review of prominent features of SW-PBS
and how they interface with identified principal leadership skills associated with behavior
management, teacher job satisfaction and student behavior. The final section summarizes
gaps in the current research base and the importance of the study.

12
Principal Leadership Skills
This section includes a discussion of the interface between leadership and public
school law, particularly as it relates to accountability for student educational results;
development of proactive systems of discipline; and ensuring safe school environments.
Secondly, a review of some of the prominent foundations from which principal
leadership skills have been developed is identified. Finally, mechanisms to train
principals in leadership skills are reviewed.
Leadership and Federal Mandates for Accountability
Administrative leadership has been recognized as a critical factor in implementing
and sustaining effective programs and practices in schools for students with and without
disabilities (Crockett, 2002; OSEP, 1999; Patterson, Marshall, & Bowling, 2000; Waters,
Marzano, & McNulty, 2003). Because many school districts employ site-based
management procedures, decisions involving programs and practices often become the
prerogatives of individual school principals and their faculties (Patterson & Protheroe,
2000; Usdan, McCloud, & Podmostko, 2000).
Public school principals are facing increasing challenges and changing
professional expectations. They are charged with providing a high degree of
accountability as effective instructional leaders who assure that all students are given the
opportunity to reach their full potential as learners and to prepare them to be competent
citizens (Leithwood, Louis, Anderson, & Wahlstrom, 2004; Porch & Protheroe, 2002).
They are also charged with ensuring a safe, supportive school climate is in place
(Learning First Alliance, 2001).
13
No Child Left Behind requirements. The No Child Left Behind Act of 2001
(NCLB) places high priority on accountability of educational results for all students; the
use of effective, research-based practices; closing the achievement gap by race and class;
and reducing the number of children identified for special education services (U. S.
Department of Education NCLB Executive Summary, 2001). The protections and
expectations in NCLB apply to all students, including those receiving special education
services (Council for Exceptional Children, 2002).
Adequate yearly progress (AYP) is an integral concept of NCLB, and refers to
student-demonstrated academic success as measured through standardized testing
instruments. Academic subject areas are targeted for testing by grade levels, with
specific emphasis placed on reading and math achievement. The results of the tests are
used to assess the overall progress of individual schools, and have direct implications in
terms of how those schools are rated and funded. Because NCLB specifies testing of all
students, this implies that individualized education plans (IEP) for those served through
special education must reflect the accommodations and modifications needed to provide
access to and successful acquisition of general education curriculum content (Ysseldyke
et al. 2004) to be adequately prepared and accommodated to participate in AYP
measures. Principals must ensure a school environment that enhances opportunities for
all students to learn and maximizes opportunities for teachers to protect instructional time
to increase the likelihood that school AYP goals can be achieved.
Federal special education mandates. Congress’s 1997 amendments to the
Individuals with Disabilities Education Act (IDEA) also placed an emphasis on increased

14
accountability of educational results for students with disabilities, and for reducing the
number of students placed in special education services. It mandated more
communication with and direct involvement of parents in educational decision-making.
It required that students who qualified for special education be served in the least
restrictive environment (LRE) and to be a part of the general education classroom for as
much of the school day as possible, with supports and accommodations available as
deemed appropriate by their IEP. Disciplinary procedures for students with disabilities
now required assurances that positive behavior supports had been instituted and
functional behavioral assessments had been conducted when appropriate (U. S. Office of
Special Education and Rehabilitative Services, 2003).
The recent reauthorization of IDEA signed into law December 3, 2004 continues
to stress placement through the LRE, accountability of schools for the academic progress
of students with disabilities, inclusion of positive behavior supports and functional
behavioral assessments, and meaningful participation of parents/guardians. There
continues to be an emphasis placed on educating students with identified disabilities in
general education classrooms for the maximum amount of the school day deemed
appropriate by the IEP team. Additionally administrators are charged with assuring
several key provisions are implemented at the school site including (a) the
implementation of new approaches to prevent overidentification or misidentification of
students with disabilities and to better support the needs of students deemed to be “at-
risk,” (b) resolution sessions with parents/guardians before moving to due process, (c)
providing meaningful professional development for all staff in how to identify and

15
implement appropriate alternative academic and behavioral strategies, and (d) ensuring
adherence to laws and regulations associated with special education (Charting the
Changes, 2004; Council for Exceptional Children, 2004). Laws and regulations
associated with the Americans with Disabilities Act (ADA) Section 504, as well as those
mandated by state and local educational agencies, must also be understood and
implemented with fidelity (Byrnes, 2000; Maag & Katsiyannis, 2000; Yell et al., 2003).
Federal mandates and safe schools. Principals are also charged with maintaining
and encouraging a safe, supportive school climate through NCLB and IDEA 2004
(Council for Exceptional Children, 2004; Horner et al. 2000; Usdan et al. 2000).
Creating a safe school environment requires having a range of preventive measures for
children’s behavioral and emotional problems (U. S. Department of Education, Office of
Special Education Programs, 1999; Walker & Eaton-Walker, 2000). “An important
feature of schools that claim success in building safe environments is that instruction on
appropriate behavior is not saved just for those students who demonstrate problems, but
is designed for school-wide implementation” (Horner & Sugai, 2000, p. 231). Effective
behavioral instruction is recognized to be specific; built into the general education school
curriculum; applied across school-wide, classroom, and targeted settings; and focused on
two basic social outcomes, positive peer relations/interactions and favorable adult
judgments about the social skills (Cotton, 2003; Learning First Alliance, 2001; Sugai &
Lewis, 1996).
The expectations for principals associated with being effective leaders regarding
students with disabilities require not only a significant understanding of the letter of these

16
laws but also the spirit and intent of each mandate. This would imply a need for future
and current principals to receive ongoing training in special education as well as general
education law, understanding of disability categories and their implications regarding
instruction, understanding of how to support students with disabilities and general
education staff as inclusion becomes more prevalent, and awareness of current issues
associated with special education (Monteith, 2000; Patterson & Protheroe, 2000).
Unfortunately, many school principals do not receive adequate information within the
principal preparation programs (Crockett, 2002; Powell & Hyle, 1997; Yell, et al. 2003;
Young, et al. 2002).
Research Related to the Identification of Specific Administrative Skills
There is a growing body of literature related to key competencies exhibited by
effective school administrators. Broad categories, defined as standards, were adopted by
the Council of Chief State School Officers (CCSSO) in partnership with the National
Policy Board for Educational Administration in 1996 to form the Interstate School
Leaders Licensure Consortium (ISLLC). The Consortium, currently comprised of 23
states and the District of Columbia, developed six standards that were operationalized
through sets of knowledge, disposition, and performance indicators. These standards have
been incorporated into state recommendations for administrator education and
certification standards in more than 40 states (Davis et al. 2005). The standards address
competencies related to: (a) development of a school vision; (b) understanding,
responding to, and influencing the larger political, social, economic, legal, and cultural
context; (c) collaboration with families and community members; (d) ensuring a safe,

17
effective, and efficient learning environment; (e) advocating and nurturing a school
culture conducive to student learning and staff professional growth; (f) acting with
integrity and fairness in an ethical manner; and (g) completing an approved internship
(Council of Chief State School Officers, 1996; Jackson & Kelley, 2002). A variety of
assessment instruments have been developed to measure completion of the above listed
competencies and skills. The Interstate School Leaders Licensure Consortium (ISLLC)
standards became the framework for the creation of an administrative assessment and
licensure tool, the School Leaders Licensure Assessment, under the direction of the
Educational Testing Service (ETS). The assessment is based on the ISLLC competencies
which are further divided into skills specific to each competency (Hale & Moorman,
2003; Walter, 2003) and is currently required for administrator licensure in 17 states and
the District of Columbia.
Administrator standards and accreditation of preparation programs. The ISLLC
standards have also been adopted by the National Policy Board for Educational
Administration through the National Council for the Accreditation of Teacher Education
(NCATE) for accreditation review of educational administrator preparation programs
(Jackson & Kelley, 2002; Young et al. 2002).
Within the NCATE standards, several are relevant to the issues of creating
supportive school environments for at-risk students and students with disabilities (see
Appendix A for the complete list of standards). For example, standard 2.0 includes
references to leaders identifying, clarifying, and addressing barriers to student learning
for diverse populations. Standard 4.0 specifically addresses the need to advocate for

18
students with special needs and to provide leadership to programs serving students with
special needs. Standard 5.0 includes reference to educational leaders advocating for all
children, including those with special needs who might be underserved. Finally,
Standard 6.0 includes expectations related to leadership candidates demonstrating and
applying an understanding of policies, laws, and regulations. There are no specific or
targeted references in the standards associated with behavioral management but an
implicit theme is evident across several with respect to school climate and safety
(National Policy Board for Educational Administration, 2002).
Similar sets of standards by the National Association of Elementary School
Principals (2002) and the American Association of School Administrators expand on the
above set and include skills related to current federal mandates such as (a) data-based
decision making, (b) planning and developing curriculum for all students, and (c) the
ability to use recommendations based in research and best practice (Mid-continent
Research for Education and Learning, 2001). The National Policy Board for Educational
Administration (2002) provides further elaboration of competencies to demonstrate the
acquisition of those standards through a set of leadership program activities to be
completed during the internship. Thus, consensus with respect to key characteristics of
effective school leaders appears to be emerging among major professional associations.
Administrator standards and special education. The Council for Exceptional
Children (CEC) has also created a set of standards for special education administration
training that is aligned with current NCATE standards. Special education administration
standards include general education standards and outcomes as well as issues unique to

19
serving students with disabilities (Boscardin, 2004). Given the expectations and situations
principals face related to special education and diverse learning needs it would be logical
to create a unified system of standards similar to the CEC model, which would include
training for general education administrators in special education law, characteristics of
disability categories, and behavioral management strategies. To date the lack of inclusion
of competencies related to special education in general education administrator training
reflects the perpetuation of a dual system of general and special education that is no
longer viable (Lashley & Boscardin, 2003).
When schools are faced with more significant and fundamental changes such as
those involved with increased accountability through NCLB and fuller inclusion of
students with disabilities in general classroom settings through IDEA 2004, specific
leadership skills associated with supporting the maintenance of a positive school climate,
providing appropriate professional development, and increasing venues for
communication among stakeholders become more critical (Cotton, 2003; Marzano et al.
2005; Mid-continent Research for Education and Leadership, 2001).
Domains of Principal Leadership Skills
Principal leadership skills are customarily divided into three domains;
transformational, managerial, and instructional (Leithwood & Duke, 1999; Murphy &
Louis, 1999). Transformational and managerial skills include those more closely aligned
with school culture, climate, and aspects of the day-to-day operations of a school,
including behavioral management (Day, 2000; Leithwood & Duke, 1999; Peterson &
Deal, 1998). In contrast, instructional leadership skills are primarily aligned with issues

20
associated with academic curricula (Blasé, J. & Blasé, J., 2000; Leithwood, 1992;
Leithwood & Duke). Each of the three domains has been the subject of numerous studies
and has a rich history within the field of educational administration. The two that are
more closely aligned with the purpose and research questions of this study are
transformational and managerial.
The identification of specific transformational and managerial leadership skills
potentially associated with proactive school environments, behavioral instruction, and
student management will be explored. Given the complexity and breadth of information
associated with these skills, a thorough inclusion of all aspects of each is beyond the
scope of this study. Rather, a review of some of the most salient features as they relate to
this investigation is included.
Transformational leadership skills. Research and understanding of principal
leadership skills has continued to evolve. A current focus of significance in the research
has been transformational leadership. Transformational leadership is centered on the
concept of leaders engaging and encouraging organizational members to become active
and committed participants in evaluating and improving their school culture through
shared decision-making and developing school-based solutions to challenges, including
accepting ownership for student success (Leithwood & Jantzi, 1997; Lucas & Valentine,
2002; Valentine, 2001).
The capacities and responsibilities for leadership are shared among organizational
members, thus potentially increasing the cohesion of staff members toward improving a
set of common and specifically identified school goals. At the same time, there is

21
recognition that the principal must take responsibility and have the ultimate decision-
making power for some aspects of the school culture (Day, 2000). Seven dimensions of
leadership identified through transformational leadership are; (a) developing a school
vision, (b) establishing goals to realize the vision, (c) developing a collaborative decision-
making structure, (d) symbolizing good professional practice, (e) providing
individualized support, (f) providing intellectual stimulation, and (g) holding high
performance expectations (Leithwood & Duke, 1999). Transformational leadership has
become an accepted model of principal instruction and training in college and university
preparation programs, and is substantiated by a body of evidence that supports its
contribution to the development of capacity and commitment for school personnel
(Bogler, 2001; Leithwood & Jantzi, 1999; Murphy & Louis, 1999).
Managerial leadership skills. Advocates of the transformational leadership
model recognize that a second set of skills associated with effective school management
are needed to addresses the duties and responsibilities inherent in the day-to-day
operation of schools (Leithwood & Duke, 1999; Miller, 2003; Valentine, 2001).
Although many of the tasks may appear to be mundane, they are important in buffering
the school environment from distractions and interruptions (Day, 2000, Levine &
Lezotte, 1990). Managerial tasks involve: (a) securing adequate funding for materials and
activities; (b) anticipating and addressing predictable problems; (c) ensuring compliance
with district, state, and federal regulations; (d) establishing systems of communication
among staff, students, parents, and the community; (e) maintaining a safe and orderly
environment; and (f) maintaining the school’s physical plant (Learning First Alliance,

22
2001; Leithwood & Duke, 1999). Other identified managerial tasks include: (a)
establishing effective staffing practices, (b) providing instructional support, (c)
monitoring school activities, and (d) providing a community focus (Leithwood & Jantzi,
1997). The underlying assumption is that if the principal adequately addresses and
performs managerial tasks well, the work of others in the organization will be enhanced
(Copland, 2001).
Research Related to Transformational and Managerial Leadership Skills
Hallinger and Heck’s (1998) review of empirical research from 1980-1995
supports transformational leadership’s direct positive effects on teacher satisfaction and
indirect positive effects on student achievement. Specific skills demonstrated to be
effective include: establishing a clear school mission, maintaining high performance
expectations, gaining staff consensus, fostering cooperation, shared decision-making, and
coordinating school goals with curriculum. A variety of other studies have substantiated
these findings (Leithwood & Jantzi, 2000; Lucas & Valentine, 2002; Marzano, 2000;
National Commission on Teaching and America’s Future [NCTAF], 2002).
Managerial skills have been identified through empirical research to increase
teacher satisfaction, improve school climate and culture, and/or to have indirect positive
effects on student achievement. These skills include: establishment of a set of standard
operating procedures and routines, provision of material resources and professional
development, provision for systems to actively monitor the effectiveness of school
practices, awareness and anticipation of predictable problem areas, maintaining effective
communication among stakeholders, understanding and complying with regulations and

23
policies, and managing the school facility (Leithwood & Duke, 1999; Waters, Marzano,
& McNulty, 2003). It is interesting to note that Walker et al. (1995) provided a similar
set of recommendations for school-wide discipline plans that included: (a) establishment
of a school mission, (b) visible, supportive principal leadership, (c) collegial
commitment, (d) staff development and effective teacher-training practices, (e) high
expectations set, (f) data management and evaluation, (g) articulation of clear rules and
expectations, and (h) provision of a continuum of behavioral interventions including
individualized support for staff and students.
Administrator Preparation
There is evidence that the curriculum of a number of educational administration
preparation programs is unrelated to the daily demands of contemporary principals
(Peterson, 2002; Young et al. 2002). A survey of educational leaders found 69% of the
responding principals agreed that traditional leadership preparation programs were “out
of touch with the realities of what it takes to run today’s schools” (Hale & Moorman,
2003, p. 5).
While initiatives are currently underway to assess and remediate educational
leadership training programs, it has been recognized this will take time and collaboration
among a wide array of stakeholders (Young et al. 2002). Identification of aspects of
preparation programs in need of change, and of those that are proving successful is
currently being undertaken by a national panel of experts, the National Commission for
the Advancement of Educational Leadership Preparation (Young et al., 2002). Issues

24
related to training in principles associated with successful integration of diverse learners
are also being considered by the panel.
Administrator Preparation Programs and Special Education
Principals have identified the need for knowledge and skills associated with
special education as a priority, including behavior management (DiPaola & Tschannen-
Moran, 2003; Goor & Schwenn, 1997; O’Neill, Johnson, O’Donnell, McDonnell, 2001;
Protz, 2005). States currently have a variety of requirements associated with
administrator certification and special education. To date, nine states require aspiring
principals to meet competencies related to special education, 18 require aspiring
principals to take one introductory course in special education, and 20 require no
coursework specific to special education (Crockett, 2002).
Assisting principals in understanding special education laws and their
implications for not only establishing disciplinary procedures, but also implementing
proactive systems that teach and encourage appropriate behaviors is critical (Goor &
Schwenn, 1997; Porch & Protheroe, 2002; Taylor& Baker, 2002). Principals who have
been exposed to special education concepts and who have an increased understanding of
characteristics of specific disabilities and behavior management have demonstrated a
more positive attitude towards inclusion (Praisner, 2003). Principals must have the
requisite skills to foster a collaborative school environment, model positive attitudes,
solve problems, and establish effective discipline procedures (Patterson, et al., 2000;
Taylor & Baker, 2002). This is important from a legal standpoint given the clarity within
IDEA ’97 and IDEA 2004 that children with identified disabilities should be placed in

25
general education classrooms and educated with non-disabled peers to the maximum
extent appropriate (Council for Exceptional Children, 2004; Patterson & Protheroe,
2000). It is equally important from the standpoint of instituting best educational practices
that support special education teachers, general education teachers, and students with
diverse needs to make inclusion successful (Patterson & Protheroe; Porch & Protheroe,
2002; Salisbury & McGregor, 2002; Walther-Thomas, Bryant, & Land, 1996).
Aspiring principals benefit from training associated with establishing a set of attitudes,
knowledge, and skills that form the basis of the tools they will need to prepare themselves
to be school leaders who can implement collaborative school cultures supportive of all
students and staff (Goor & Schwenn, 1997; Salisbury & McGregor).
Professional Development Training and Leadership Skills
Effective professional development among in-service administrators may hold
equal promise as a vehicle for providing training in skills associated with principal
leadership, including those related to serving students with special needs or who are
identified as “at risk” (Goor & Schwenn, 1997, Praisner, 2003). Principals in the field
bring a set of practical experiences, on-the-job challenges, understandings associated with
the diverse schools they serve, and individual needs for ongoing support and education
(Curtis & Stollar, 1996; DiPaola & Walther-Thomas, 2003; Patterson et al. 2000;
Salisbury & McGregor, 2002). “The National Staff Development Council suggests that
effective professional development programs should be long-term, carefully planned, job
embedded, and focus on student achievement,” (Peterson, 2002, p. 1). Other
characteristics supported by the literature include: (a) reflective practice, (b) opportunities

26
for peer coaching and collaboration, (c) instructional strategies, (d) linkage to state
initiatives, (e) use of information technologies, (f) the reinforcement of positive norms
and assumptions, (g) linkage to the school community, and (h) a format that includes all-
day, multiple-session meetings (Peterson, 2002). Further, professional development
provides opportunities for reflection and skill development associated with the challenges
principals are facing in applied school settings rather than within the more theoretical
framework of academic preparation programs (McCarthy, 1999; Peterson, 2002).
Providing in-service principals with professional development related to the
successful implementation of systems that will improve the behavioral and social skills of
students is critical. Principal supports have been recognized to be essential in initiating
and sustaining new practices in schools (Boscardin, 2004; Klinger, Ahwee, Pilonieta, &
Menendez, 2003; Klinger, Arguelles, Hughes, & Vaughn, 2001).
Summary
The literature regarding school administrator leadership skills has established a set
of expected competencies and skills that have garnered agreement among many of the
primary agencies and professional organizations associated with school administration.
These expectations are suggested to be important in fostering and supporting educational
environments conducive to academic and behavioral success for all students, including
those with more intensive needs. At the same time, there is a recognized need for more
training, information, and support for principals related to issues associated with students
at-risk for and identified with disabilities who exhibit behavioral problems (DiPaola &
Tschannen-Moran, 2003; Patterson, et al., 2000).

27
Leadership and Teacher Job Satisfaction
Principals’ roles related to establishing school climates and cultures that are conducive to
the inclusion of students with diverse learning needs and providing teachers with supports
to be successful are critical. The role of administrators in supporting fuller access to
general education curriculum for students with diverse needs requires supporting
collaboration and planning time for general and special education teachers, as well as
appropriate in-service opportunities (Jackson, Harper, & Jackson, 2002). Teachers’
understanding of diverse learning styles and needs require ongoing and well-defined
professional development activities (Youngs & King, 2002). Innovative organizational
and management strategies facilitate communication with families and the community, as
well as staff teamwork to make best use of scarce resources (Hoachlander, Alt, &
Beltranena, 2001). “Questions may create new tensions…but they should also signal the
important need for ever-increasing communication and collaboration between special and
general education teachers and administrators” (McLaughlin, 2001, p. 128).
When principals utilize available resources to provide certified staff with adequate
time to collaborate with their peers, support their efforts to learn about and utilize
effective practices and encourage active communication across stakeholders, they are
providing a foundation from which certified staff job satisfaction can be established and
sustained. This section will include a review of principal supports and attitudes which
have been demonstrated to impact certified staff job satisfaction. It will also address
specific challenges faced by principals and staff in establishing effective supports for
students who exhibit challenging behaviors.

28
Administrative Support and Attitudes
Administrative/principal support has been identified in multiple studies as a
determining factor associated with teacher job satisfaction for both general education and
special education teachers (Bogler, 2001; Embich, 2001; George & George, 1995;
Johnson & Birkeland, 2003; Lashley & Boscardin, 2003; Minarik, Thornton, & Perreault,
2003). Teachers relate administrator support with their sense of autonomy, belonging,
competence, and commitment, among others. Principal transformational leadership has
been recognized to be a significant influence in schools where teachers are supported to
take on greater leadership roles and to improve their professional skills (Lucas &
Valentine, 2002).
The level of administrative support regarding discipline, both in backing teachers
in specific instances of student misbehavior and in establishing clear and consistent
student behavioral expectations has been identified as an important factor for teachers in
deciding to stay in the field (Charles, 1999; Johnson & Birkeland, 2003: Learning First
Alliance, 2005; Richards, 2003). High rates of teacher turnover undermine the building
and sustainability of professional development communities in schools, and may be a
factor in student achievement rates (National Commission on Teaching and America’s
Future, 2002). “The consequences of high teacher mobility…. can be devastating. When
districts fail to find and keep competent teachers, administrators must scramble to hire
less qualified personnel….That, in turn, creates problems….(in ensuring) continuity of
quality instruction” (George & George, 1995, p. 227).

29
Principals’ attitudes and actions have also been identified as a pivotal feature of
teacher satisfaction with inclusion of students with special needs in general education
classrooms (Cook, Semmel, & Gerber, 1999; DiPaola & Walther-Thomas, 2003; Noell &
Witt, 1999). General and special education teachers report an ongoing need for guidance,
support, and dissemination of knowledge from principals regarding successful
collaboration among staff in implementing effective programming for students, including
discipline issues (Walter-Thomas & Bryant, 1996; Yoon & Gilchrist, 2003). This is
particularly challenging given reports of administrators that they need information and
training about special education law, implementing successful special education
programs, and supporting effective interventions (DiPaola & Tschannen-Moran, 2003:
Monteith, 2000; Patterson et al. 2000; Praisner, 2003).
Given the increased emphasis and legal mandates associated with AYP, inclusion
of students with disabilities in general education classrooms, and proactive discipline
procedures, principals’ establishment of school-wide environments that support improved
teacher job satisfaction and use of best practices are indicated.
Principal Leadership, Student Behavior and Achievement
Improving achievement for all students is a primary focus of general and special
education. Principals are instrumental in establishing school environments where staff
can provide support for all students and in creating a school community that includes all
students (Patterson & Protheroe, 2000). Research has shown principal understanding
about and attitudes toward inclusion are linked to improved outcomes for children with
disabilities (Cook, et al., 1999; Praisner, 2003). Inclusion has also been demonstrated to
30
improve academic and social skills for low-achieving students who were not identified
with specific disabilities (Walther-Thomas, Bryant, & Land, 1996). Inclusion requires
principal support for providing the time for active collaboration between general and
special educators, visible commitment on their part for the use of inclusive practices, and
ongoing teacher professional development, and problem-solving support (Cook et al.;
DiPaola & Walther-Thomas, 2003; Praisner, 2003).
Principal Leadership and Student Behavior
Students who exhibit inappropriate behaviors are particularly challenging for
school personnel. They are less likely to be successfully integrated in general education
classroom environments, and more likely to exhibit increased academic deficits (Mayer,
1995; Praisner, 2003; Smith & Katsiyannis, 2004). Research has demonstrated the need
to keep students actively engaged academically to decrease the likelihood of
inappropriate behaviors and increase the likelihood of school success (Coyne,
Kame’enui, & Simmons, 2004; Nelson, Benner, Lane, & Smith, 2004; Wehby, Lane, &
Falk, 2005). If teachers are to be successful in academically engaging students with
challenging behaviors so that more time is spent in instruction, they will need appropriate
material resources and professional development opportunities to do so
Particularly since the reauthorization of IDEA in 1997, schools are placing
growing numbers of children with identified disabilities in the regular classroom for
larger portions of the school day. It has also been recognized that a population of
students exist who do not meet the criteria to receive services through special education,
but who also display ongoing inappropriate behaviors (O’Neill, et al., 2001; Safran &

31
Oswald, 2003; Scott, 2001). “Administrators have always been charged with creating a
school environment that promotes academic achievement for all students. As increasing
numbers of students with behavioral and emotional issues come to school, potentially
disrupting their learning and others, that challenge grows.” (U.S. Department of
Education, Office of Special Education Programs, 1999, p.16).
Behavior problems, lack of discipline, and concerns about school violence and
student safety impact the learning environment and draw resources away from teaching
and learning (U.S. Department of Education, Office of Special Education Programs,
1999; Lewis & Sugai, 1999b; Walker et al. 1995). When principals support the
establishment of clear behavioral guidelines which are understood by all staff and
students they increase the likelihood that more time and energy can be focused on
learning (Porch & Protheroe, 2002).
Principal Leadership and Student Achievement
While principals do not necessarily have a direct effect on student achievement,
they have been shown to have an important indirect effect through the establishment of
high expectations for all students to learn, providing professional development supports
for teachers, and maintaining clear and consistent behavioral expectations (Boudah,
Logan, & Greenwood, 2001; Salisbury & McGregor, 2002; Youngs & King, 2002).
A meta-analysis of research-based studies from the 1970’s through the 1990’s by
Waters, Marzano, and McNulty (2003) related to the effects of leadership on student
achievement identified only 72 studies that met the criteria of being based on quantitative
data using standardized or other verified objective measures of achievement. Of those,

32
58 were unpublished doctoral dissertations. The remaining 14 included 9 published in
peer-reviewed journals and 5 published as technical briefs, educational or governmental
reports. The majority of the studies assessed similar skills and found complementary
results.
Data from the meta-analysis identified the average effect size between the
relationship of educational leadership and student achievement to be .25, or a mean
percentage increase/decrease impact on student achievement of approximately 10%. The
authors identified two variables that indicated whether leadership will have a primarily
positive or negative effect on achievement; (a) leaders properly identified and then
followed through with changes to impact achievement, and (b) leaders correctly assessed
the magnitude of the changes requested and tailored their leadership style to ensure
successful implementation. Average effect size was computed through comparison of the
correlation between student achievement on standardized tests or other objective
measures of achievement (the dependent variable) and teacher perceptions of leadership
(the independent variable) reported in the studies. Of the 21 leadership responsibilities
significantly correlated with student achievement, nine demonstrated a correlation of 0.25
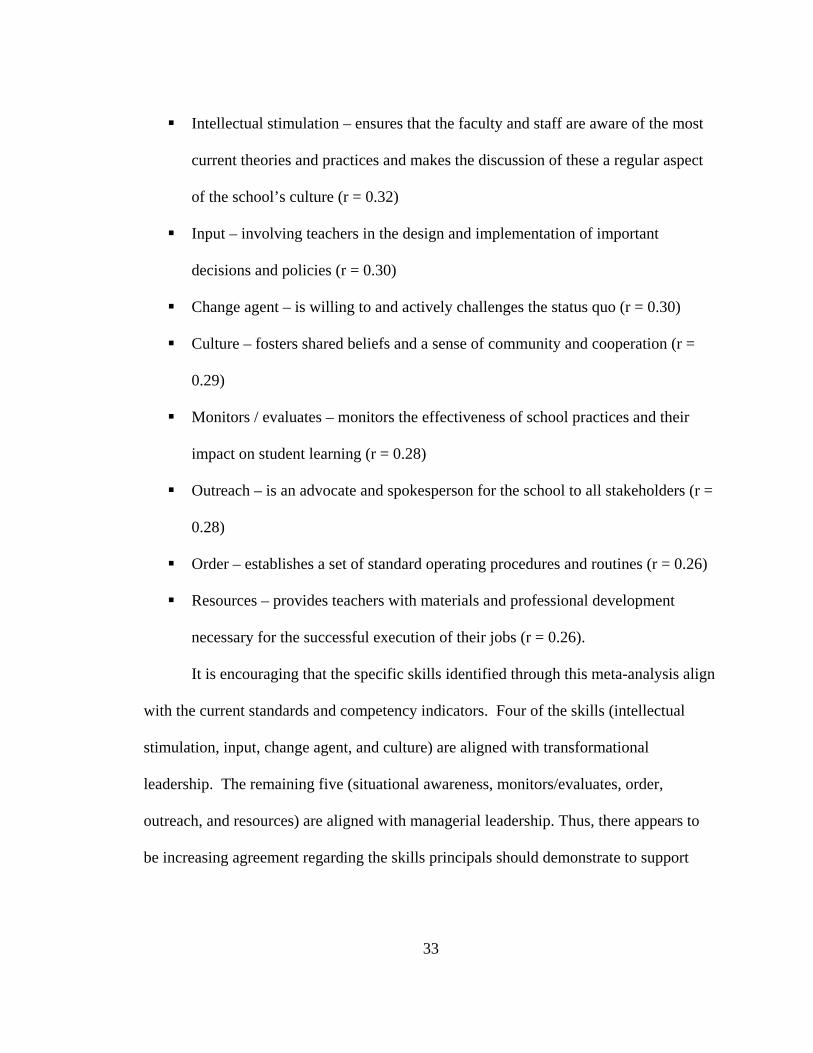
or higher. They are (Waters, Marzano, & McNulty, 2003):
Situational awareness – is aware of the details and undercurrents in the running of
the school and uses this information to address current and potential problems (r =
0.33)
33
Intellectual stimulation – ensures that the faculty and staff are aware of the most
current theories and practices and makes the discussion of these a regular aspect
of the school’s culture (r = 0.32)
Input – involving teachers in the design and implementation of important
decisions and policies (r = 0.30)
Change agent – is willing to and actively challenges the status quo (r = 0.30)
Culture – fosters shared beliefs and a sense of community and cooperation (r =
0.29)
Monitors / evaluates – monitors the effectiveness of school practices and their
impact on student learning (r = 0.28)
Outreach – is an advocate and spokesperson for the school to all stakeholders (r =
0.28)
Order – establishes a set of standard operating procedures and routines (r = 0.26)
Resources – provides teachers with materials and professional development
necessary for the successful execution of their jobs (r = 0.26).
It is encouraging that the specific skills identified through this meta-analysis align
with the current standards and competency indicators. Four of the skills (intellectual
stimulation, input, change agent, and culture) are aligned with transformational
leadership. The remaining five (situational awareness, monitors/evaluates, order,
outreach, and resources) are aligned with managerial leadership. Thus, there appears to
be increasing agreement regarding the skills principals should demonstrate to support

34
school environments conducive to increased academic achievement and behavioral
competencies for all students.
The nine leadership responsibilities identified by Waters et al. (2003) as having
the most significant effect on student achievement are input, change agent, situational
awareness, intellectual stimulation, culture, monitors/evaluates, outreach, and resources.
They have also been identified as critical in recruiting and retaining highly qualified
general education and special education teachers. Further, the leadership responsibilities
align with ISLLC and NCATE standards, and are supported through transformational,
managerial, and SW-PBS publications.
Summary
While the literature does not support a direct link between evidence of specific
principal leadership skills and student achievement, it does reinforce an indirect link that
connects the principal’s role in establishing a school environment built on effective
practices which in turn supports student achievement (Hallinger & Heck, 1998; Horner,
Sugai, Todd, & Lewis-Palmer, 2005; Leithwood & Duke, 1999). The small number of
studies, however, indicates a need for more empirically-based research to verify the
identification of these skills as effective indicators of links between principal leadership
skills and student achievement.
School-wide Positive Behavior Supports
A promising intervention proven to impact student behavior, and indirectly
student achievement, is the implementation of School-wide Positive Behavior Support
(SW-PBS) (Horner et al. 2005). SW-PBS has proven to be successful in improving the

35
school climate for principals, certified staff, and students (Luiselli et al., 2005; Taylor-
Greene et al. 1997).
SW-PBS, Transformational and Managerial Leadership
The components of successful school-wide PBS align with transformational and
managerial leadership principles. The national PBS center recommends the following
steps when setting up school-wide systems of discipline: (a) establish a school-wide
leadership team to guide and direct the process that is representative of school staff
members and parents, (b) secure administrator support and participation, (c) secure
agreement and commitment from at least 80% of staff members, (d) conduct an
assessment of the current discipline system, (e) establish an action plan that reflects
agreed-upon goals by staff for improvement, and (f) establish a way to collect
representative data to help monitor the success of the system objectively (National
Technical Assistance Center on PBIS, 2004). A model based on transformational and
managerial leadership skills is conducive to including the establishment of a SW-PBS
initiative to implement proactive discipline procedures that support principals, teachers
and students, and which addresses issues associated with supporting students with diverse
needs as outlined in the NCATE standards, NCLB, and IDEA 2004.
Basic Principles of SW-PBS
School districts in 40 states and the District of Columbia are actively engaged in
implementing school-wide systems of PBS to address behavioral and social skills issues
(OSEP Center on PBIS, 2006). SW-PBS is a systems approach, enhancing the capacity of
schools to adopt and sustain the use of effective behavioral practices for all students

36
(Luiselli, et. al. 2005; Stormont, Lewis, & Covington Smith, 2005). It is a proactive
approach, emphasizing the efficacy of building school-wide systems that reduce the
likelihood of the occurrence of problem behavior, and of actively teaching appropriate
social skills as an integral part of the school curriculum (Lewis et al. 1998; Scott, 2001;
Sugai & Horner, 2001).
As described earlier, SW- PBS systems emphasize efficient use of school
resources through a three-tiered approach employing universal procedures of effective
school management and direct teaching/modeling of school-wide procedures, secondary
procedures to address the needs of students considered to be at-risk (Kern & Manz,
2004), and tertiary procedures to meet the challenges of providing meaningful support for
students with chronic behavioral issues (Sugai et al. 1999). SW-PBS is identified as a
“Promising Program” through the Office of Special Education Programs (OSEP), and has
established a national technical assistance center at the University of Oregon. PBS for
individual students with disabilities is specifically mentioned in the Part B regulations of
IDEA ’97 and the regulations for IDEA 2004. The inclusion of PBS in IDEA 1997 was
based on sound, empirical evidence established over a number of years and studies
(Michaels, Brown, & Mirabella, 2005: Turnbull et al. 2000).
A variety of studies have articulated the importance of establishing a school
atmosphere that supports learning. Purkey and Smith (1983) identified four
characteristics supported through research-based studies that included collaborative
planning and collegial relationships, a sense of community, clear goals and high
expectations, and order and discipline. They noted that consistently reinforced clear,

37
reasonable rules not only reduced behavior problems but also promoted feelings of pride
and responsibility.
Curtis and Stoller (1996) supported the findings of Purkey and Smith and reported
that regardless of the issue(s) being considered for change, collaboration is the essential
foundation, and this is usually accomplished through a representative group or team of
the major stakeholders. They also identified a clear plan for change, commitment of key
personnel, established goals and strategies to accomplish them, and direct instruction
with adequate practice and follow-up as necessary to embed problem-solving skills.
Peterson (2002) reiterated the above findings by identifying critical structural
arrangements (i.e., clear mission and purpose, curriculum coherence, instructional
strategies, linkage to state initiatives, use of information technologies, adequate length
and time structure) and cultural elements (i.e., linkage to values, community and mission,
and establishing clear symbols and ceremonies). These studies add credence to the
understanding that SW-PBS is not a new phenomenon, but a systematic compilation of
best practices (Horner & Sugai, 2000).
The goal of SW-PBS is to increase a school’s capacity to meet the behavioral
support needs of all students and staff (Lewis & Sugai, 1999b). SW-PBS incorporates
positive behavior interventions to teach appropriate behavior and social skills, and to
identify and remediate problem behaviors. Appropriate behavior and social skills training
are integrated into the school curriculum, are directly taught, regularly practiced in the
settings in which they are expected to be utilized, and are reinforced through processes
that are selected by the school as fitting their environment (OSEP Center on Positive

38
Behavioral Interventions and Supports, 2004). By reducing the numbers of inappropriate
behavioral incidents and office discipline referrals (ODR), schools stand to garner more
teaching and learning time (Horner et al. 2005; Liapsun, Jolivette, & Scott, 2004; Luiselli
et al. 2005). This may have a secondary, indirect effect on improving student academic
outcomes (Scott & Barrett, 2004; Witt, VanDerHeyden, & Gilbertson, 2004).
SW-PBS emphasizes operationally defining outcomes, incorporating research-
validated practices, and providing systems changes in schools that are consistent (Luiselli
et al. 2005; Nelson, 2000; OSEP Center on Positive Behavioral Interventions and
Supports, 2005). It emphasizes the importance of training schools in establishing
systems, practices, and data-based decision-making to support socially important
outcomes for students and staff related to academic and behavioral achievement (Scott,
2001; Sprague, Walker, et al. 2001).
The seven recommended components of effective school-wide PBS are: (a) an
agreed upon and common approach to discipline, (b) a positive statement of purpose, (c)
a small number of positively stated expectations, (d) procedures for teaching expectations
to students (e) procedures for encouraging appropriate behaviors, (f) procedures for
discouraging inappropriate behaviors, and (g) procedures for monitoring the effectiveness
of the system through data (Lewis & Sugai, 1999a; National Technical Assistance Center
on PBIS, 2004). School-wide implementation of PBS is designed to be preventative and
to establish a supportive school community (Guthrie, 2002) and serves as a means to
identify students who are in need of more intensive supports and interventions. This is
beneficial not only to students, but to principals and teachers who may have had little to

39
no instruction in principles of behavior management or characteristics of students who
are at risk for or who have been identified with specific disabilities (Walker & Horner,
1996).
Secondary or targeted levels of intervention assist school personnel in identifying
setting and environmental factors, as well as skill deficits, which may underlie student
behaviors that are inappropriate but unlikely to be considered severe. These are also
proactive in nature (Horner et al. 2005; Nelson et al. 1999) and align with the inclusion of
response to intervention (RTI) methodology in accurately identifying students for referral
to special education services identified in IDEA 2004. Social skills’ training for identified
and specific skill deficits has been recognized as a viable intervention at the secondary
level (Gresham, 1998; Lane, Wehby, et al. 2003; Mayer, 1995; Walker et al. 1995).
Training personnel to conduct brief functional assessments, complete screening
instruments, conduct semi-structured student and environmental observations, and re-
teach behavioral expectations along with giving students the opportunity to practice the
skills, have been relatively simple interventions that have reduced and/or alleviated
second-tier behavioral concerns (Kamps, Kravits, Stolze, & Swaggart, 1999). Some SW-
PBS teams and school staffs have employed a second team to address and implement
targeted interventions so that more staff members are knowledgeable regarding
behavioral management strategies (Scott et al., 2005; Todd, Horner, Sugai, & Colvin,
1999).
Tertiary, or individual, intensive interventions are specifically matched to the
identified behaviors that are chronic and/or more severe in nature. Functional behavioral

40
assessments (FBA) would typically be utilized at this level. Principals and other SW-
PBS team members may receive training in developing and implementing an articulated
set of procedures for intensive/tertiary referrals. FBA’s also support a proactive school
climate by effectively and efficiently addressing problematic behaviors, and helping to
inform the development of appropriately targeted behavior support plans (Alberto &
Troutman, 2003; Sugai & Lewis, 1999). SW-PBS provides supports for principals and
staff in understanding the continuum of behavioral supports which are necessary to adopt
and sustain a comprehensive set of procedures to support all students in an effective and
efficient system that meets both the letter and spirit of the laws and regulations with
which schools must comply (Dunlap et al. 2000; Safran & Oswald, 2003; Sugai et al.
1999).
SW-PBS and Principal Leadership Skills
Colvin and Sprick (1999) described ten principal leadership strategies observed to
be effective in establishing SW-PBS and in effecting change in a school. The strategies
are:
1. Maintaining standards regarding which innovations their school would employ
2. Making a public statement of support once the faculty selected an innovation
3. Establishing a representative leadership team to lead the process of implementing
the innovation
4. Supporting the team members to have the time and resources to accomplish the
task
5. Guiding rather than dictating decision-making

41
6. Taking a leadership role to model and reinforce implementing the innovation with
fidelity
7. Regularly attending and participating in team meetings
8. Providing recognition to faculty and the team for their hard work
9. Serving as the spokesperson to community stakeholders about the worth and
importance of the innovations
10. Establishing objective means to monitor and provide feedback to all staff about
the effect of the innovation
The authors based these ten recommendations on their combined experiences of work in
schools with many principals and published research regarding best practices in
administrative leadership.
Taylor-Greene and Kartub (2000) described the implementation of SW-PBS over
a period of several years at the school in which they were the school administrators. SW-
PBS was effective in yielding significant decreases in office discipline referrals (ODR).
Between the school years of 1993-1994 (when SW-PBS was first introduced) and 1998-
1999, referrals dropped from over 5,000 to approximately 800. They reported other
outcomes associated with SW-PBS implementation including all adults in the school
operating from a positive team approach, staff encouraging students by teaching and
reinforcing appropriate behavior, and an overall school climate described as proactive
and positive. The authors suggested long-term strategic planning based on five SW-PBS
principles: (a) focusing on the articulated school improvement goals, (b) a high degree of

42
administrative support, (c) teamwork, (d) reinforcement for all students, and (e)
continuous program evaluation through data analysis and other established indicators.
SW-PBS, Professional Development Training, and Principal Leadership Skills
Professional development training in SW-PBS for school teams provides one
viable means to initiate and sustain its use. The training of representative school teams,
which include the administrator, in school-wide positive behavior support includes
guidance in how to obtain and utilize input from all stakeholders (Luiselli et al. 2005).
Strategies for active assessment of the school environment at school-wide, classroom,
non-classroom, and individual student levels are taught and modeled by PBS trainers.
Knowledge and implementation of effective research-based behavior management
practices assist teams in developing a repertoire of skills aligned with the three-tiered
model of prevention (Porch & Protheroe, 2002; Sugai, Hagan-Burke, & Lewis-Palmer,
2004). Practices to foster and encourage a school-wide culture and to facilitate outreach
to parents and the community encourage the implementation of transformational
leadership whereby team members take increasing responsibility for establishing and
sustaining the SW-PBS process (Colvin & Sprick, 1999). The principal and team
members are instructed in how to use objective data to monitor and evaluate current
systems and practices, and the necessity for the provision of resources to support the
implementation and sustainability of PBS (Horner et al. 2005; Lewis & Sugai, 1999a;
2002; Scott & Hunter, 2001).
SW-PBS in-service training is a viable means for principals to enhance their
expertise in implementing transformational and managerial leadership skills associated

43
with effective behavior management. Principals are encouraged to actively participate in
and support SW-PBS while encouraging other staff members to lead the process. It also
affords the opportunity for administrators and school teams to identify the issues unique
to their school environment while they are developing the skills to proactively address
them.
SW-PBS Summary
School-wide PBS has demonstrated improvement in the overall social climate of
schools as well as providing appropriate intervention programming for students with
high-risk problem behavior (OSEP Center on Positive Behavioral Interventions and
Supports, 2004). Empirical research supports the SW-PBS process and documents
indirect academic and direct behavioral outcomes for students (Horner et al. 2005).
Decreases in office discipline referrals have been demonstrated to yield increased
opportunity for academic learning time. PBS schools have documented decreased ODR,
thereby increasing the likelihood of increased opportunity for academic learning time
(Scott & Barrett, 2004; Taylor-Greene & Kartub, 2000).
Building on the previous reviewed research, Table 1 provides a synthesis of
recommended leadership skills associated with transformational, managerial and
behavioral management and the intersection with SW-PBS. This summary will provide
the foundation for exploring the relationship between principal leadership skills and SW-
PBS.

44
Table 1
Matrix of Primary Sources for Identification of Principal Leadership Skills
Source Leith
woo
d et
al.,
(200
4)
Leith
woo
d &
Duk
e (1
999)
Hal
linge
r & H
eck
(199
8)
Jant
zi &
Lei
thw
ood
(199
6)
Val
entin
e &
Bow
man
(198
6)
Wat
ers e
t al.,
(200
3)
OSE
P C
ente
r on
PBIS
Blu
e prin
t (20
04)
Col
vin
& S
pric
k (1
999)
Tayl
or-G
reen
e &
Kar
tub
(200
0)
Lew
is &
Sug
ai, (
1999
)
Hor
ner e
t al.,
(200
5)
Transformational Skills
Leads staff/teams in
establishing a school
vision
X X X X X X X X X
Leads staff in
establishing a set of
goals to implement the
vision
X X X X X X X X X X
Actively encourages
staff input and
participation to
prioritize goals
X X X X X X X X X

45
Table 1 (continued)
Matrix of Primary Sources for Identification of Principal Leadership Skills
Source
Leith
woo
d et
al.,
(200
4)
Leith
woo
d &
Duk
e (1
999)
Hal
linge
r & H
eck
(199
8)
Jant
zi &
Lei
thw
ood
(199
6)
Val
entin
e &
Bow
man
(198
6)
Wat
ers e
t al.,
(200
3)
OSE
P C
ente
r on
PBIS
Blu
e prin
t (20
04)
Col
vin
& S
pric
k (1
999)
Tayl
or-G
reen
e &
Kar
tub
(200
0)
Lew
is &
Sug
ai, (
1999
)
Hor
ner e
t al.,
(200
5)
Works toward whole
staff consensus on
important school-wide
issues/goals
X X X X X X X X X
Models and uses
problem-solving skills
to help staff reach
consensus
X X X X X X X X
Uses data to help staff
prioritize goals X X X X X X X X
Maintains performance
expectations X X X X X X X

46
Table 1 (continued)
Matrix of Primary Sources for Identification of Principal Leadership Skills
Source
Leith
woo
d et
al.,
(200
4)
Leith
woo
d &
Duk
e (1
999)
Hal
linge
r & H
eck
(199
8)
Jant
zi &
Lei
thw
ood
(199
6)
Val
entin
e &
Bow
man
(198
6)
Wat
ers e
t al.,
(200
3)
OSE
P C
ente
r on
PBIS
Blu
e prin
t (20
04)
Col
vin
& S
pric
k (1
999)
Tayl
or-G
reen
e &
Kar
tub
(200
0)
Lew
is &
Sug
ai, (
1999
)
Hor
ner e
t al.,
(200
5)
Encourages/supports
staff to self-evaluate
progress in
implementing goals
X X X X X X X
Provides professional
development activities
to support goals
X X X X X X X X X X
Provides resources to
support goals X X X X X X X X
Models skills that
support goals/change
agent
X X X X X X X X
Establishes leadership
teams as needed X X X X X X X X
X

47
Table 1 (continued)
Matrix of Primary Sources for Identification of Principal Leadership Skills
Source
Leith
woo
d et
al.,
(200
4)
Leith
woo
d &
Duk
e (1
999)
Hal
linge
r & H
eck
(199
8)
Jant
zi &
Lei
thw
ood
(199
6)
Val
entin
e &
Bow
man
(198
6)
Wat
ers e
t al.,
(200
3)
OSE
P C
ente
r on
PBIS
Blu
e prin
t (20
04)
Col
vin
& S
pric
k (1
999)
Tayl
or-G
reen
e &
Kar
tub
(200
0)
Lew
is &
Sug
ai, (
1999
)
Hor
ner e
t al.,
(200
5)
Managerial Skills
Provides and enforces
clear school-wide
structures
X X X X X X
Provides and enforces
clear school-wide
procedures
X X X X
Consistently
monitors/modifies
school-wide structures/
procedures as needed &
apprises staff of
changes
X X X X X
Anticipates predictable
problems, develops
means for responding
X X X X X X X X

48
Table 1 (continued)
Matrix of Primary Sources for Identification of Principal Leadership Skills
Source
Leith
woo
d et
al.,
(200
4)
Leith
woo
d &
Duk
e (1
999)
Hal
linge
r & H
eck
(199
8)
Jant
zi &
Lei
thw
ood
(199
6)
Val
entin
e &
Bow
man
(198
6)
Wat
ers e
t al.,
(200
3)
OSE
P C
ente
r on
PBIS
Blu
e prin
t (20
04)
Col
vin
& S
pric
k (1
999)
Tayl
or-G
reen
e &
Kar
tub
(200
0)
Lew
is &
Sug
ai, (
1999
)
Hor
ner e
t al.,
(200
5)
Assures school is in
compliance with
district, state, federal
regulations/politics
X X X X X X
Promotes staff
cooperation and
cohesion
X X X X X X X X
Provides staff with
materials, resources,
shared planning times
as needed
X X X X X X X X X
Advocate &
spokesperson for the
school X X X X X
X

49
Table 1 (continued)
Matrix of Primary Sources for Identification of Principal Leadership Skills
Source
Leith
woo
d et
al.,
(200
4)
Leith
woo
d &
Duk
e (1
999)
Hal
linge
r & H
eck
(199
8)
Jant
zi &
Lei
thw
ood
(199
6)
Val
entin
e &
Bow
man
(198
6)
Wat
ers e
t al.,
(200
3)
OSE
P C
ente
r on
PBIS
Blu
e prin
t (20
04)
Col
vin
& S
pric
k (1
999)
Tayl
or-G
reen
e &
Kar
tub
(200
0)
Lew
is &
Sug
ai, (
1999
)
Hor
ner e
t al.,
(200
5)
Behavioral Management Skills
Actively exposes staff
to research/rationale
supporting school-wide
behavioral management
systems
X X X X
Includes staff in
decision-making
regarding behavioral
management issues
X X X X X X X
Establishes leadership
team to guide
implementation of
proactive school-wide
behavioral management
system
X X X X X X X

50
Table 1 (continued)
Matrix of Primary Sources for Identification of Principal Leadership Skills
Source
Leith
woo
d et
al.,
(200
4)
Leith
woo
d &
Duk
e (1
999)
Hal
linge
r & H
eck
(199
8)
Jant
zi &
Lei
thw
ood
(199
6)
Val
entin
e &
Bow
man
(198
6)
Wat
ers e
t al.,
(200
3)
OSE
P C
ente
r on
PBIS
Blu
e prin
t (20
04)
Col
vin
& S
pric
k (1
999)
Tayl
or-G
reen
e &
Kar
tub
(200
0)
Lew
is &
Sug
ai, (
1999
)
Hor
ner e
t al.,
(200
5)
Publicly supports team
efforts X X X X X
X
Active participant in
team X X X X X
X
Supports team in
formulating school-
wide behavioral
management action
plan
X X X X
Provides resources to
implement school-wide
proactive behavioral
management plan
X X X X

51
Table 1 (continued)
Matrix of Primary Sources for Identification of Principal Leadership Skills
Source
Leith
woo
d et
al.,
(200
4)
Leith
woo
d &
Duk
e (1
999)
Hal
linge
r & H
eck
(199
8)
Jant
zi &
Lei
thw
ood
(199
6)
Val
entin
e &
Bow
man
(198
6)
Wat
ers e
t al.,
(200
3)
OSE
P C
ente
r on
PBIS
Blu
e prin
t (20
04)
Col
vin
& S
pric
k (1
999)
Tayl
or-G
reen
e &
Kar
tub
(200
0)
Lew
is &
Sug
ai, (
1999
)
Hor
ner e
t al.,
(200
5)
Supports and provides
recognition for staff
who implement
proactive behavioral
management
X X X X
Supports and provides
recognition for students
who display improved
behavior/social skills
X X X X X X
Regularly informs
students, parents &
community
stakeholders regarding
procedures, and/or
progress toward
meeting school goals
X X X X X X X X X

52
Table 1 (continued)
Matrix of Primary Sources for Identification of Principal Leadership Skills
Source
Leith
woo
d et
al.,
(200
4)
Leith
woo
d &
Duk
e (1
999)
Hal
linge
r & H
eck
(199
8)
Jant
zi &
Lei
thw
ood
(199
6)
Val
entin
e &
Bow
man
(198
6)
Wat
ers e
t al.,
(200
3)
OSE
P C
ente
r on
PBIS
Blu
e prin
t (20
04)
Col
vin
& S
pric
k (1
999)
Tayl
or-G
reen
e &
Kar
tub
(200
0)
Lew
is &
Sug
ai, (
1999
)
Hor
ner e
t al.,
(200
5)
Consistently maintains
agreed upon school-
wide behavioral
management standards,
procedures, and
systems
X X X X X X X
Ensures all staff know,
understand, and follow
behavioral management
procedures
X X X X X
Summary
The practices, systems and data decision-making strategies employed through
SW-PBS are research-based and align with NCLB and IDEA 2004 requirements
associated with employing scientifically-based research and practices (OSEP Center on
Positive Behavioral Interventions and Supports, 2004). SW-PBS literature identifies the
administrator’s participation as a member of the school PBS leadership team as essential,

53
and publications have included principals’ reports of improved school environments with
the implementation of SW-PBS (Colvin et al. 1996; Nersesian, Todd, Lehmann, &
Watson, 2000; Taylor-Greene & Kartub, 2000). However, to date research has not been
conducted that examines the relationship between critical administrator skills and the
establishment of SW-PBS relative to certified staff job satisfaction and/or student
behavioral performance.
Statement of Purpose
This study was designed to (a) identify key administrative leadership skills
associated with socially proactive school environments, (b) examine the relationship
between SW-PBS implementation and increased evidence of those leadership skills, (c)
examine the relationship between evidence of those skills and improved certified staff job
satisfaction and (d) examine leadership skill variables associated with SW-PBS and
recommendations from the field that support increased certified staff job satisfaction,
effective student behavioral management and principal leadership skill acquisition.
Research Questions
This study was designed to answer the following research questions:
1. Is there agreement between principals and certified staff as to the identification of
key leadership skills associated with proactive school environments in SW-PBS
and non-PBS schools?
2. Is there agreement between principals’ and certified staffs’ rating scores of the
evidence of principal demonstration of the identified key leadership skills in SW-
PBS and non-PBS schools?

54
3. Do certified staff members report higher rates of job satisfaction in SW-PBS
schools than certified staff members report in non-PBS schools?
4. Is principal effectiveness identified as a factor related to higher certified staff job
satisfaction in SW-PBS or non-PBS schools?
5. Are principal behavior management effectiveness and SW-PBS status predictive
of certified staff job satisfaction?
Significance of Study
Research-based studies from a variety of sources have yielded a substantial body
of work that can potentially serve as a guide in identifying specific leadership skills that
are important in establishing socially effective, efficient and proactive school
environments conducive to supporting principals, staff and students (DiPaola &
Tschannen-Moran, 2003; Jantzi & Leithwood, 1996; Marzano et al. 2005).
Environments which are safe, orderly, and have clear expectations for all members of the
school community may help to lower incidents of inappropriate behavior and may as a
secondary outcome increase the amount of time available for effective instruction
(Horner et al. 2005; Liapsun et al. 2004; Nelson, 2000).
Given that SW-PBS is currently being implemented throughout the United States,
it is imperative to continually investigate the relevance and accuracy of the training and
recommendations participants receive (Horner et al. 2005). This study can help to
establish an initial foundation of empirically-based research related to identifying
principal leadership skills in schools implementing SW-PBS which are valued by
certified staff and principals (Stichter & Conroy, 2004). Second, it can provide

55
information about the evidence of those skills in schools with varying demographic
variables, thus potentially facilitating the generalization of the findings (Stichter &
Conroy, 2004). Third, it may help to explicate an aspect of SW-PBS effectiveness that
has been identified as critical to successful implementation (Kern & Manz, 2004).
SW-PBS may provide an important link between general and special education
research, particularly in skills associated with the establishment and sustainability of
proactive school environments where a continuum of behavioral instruction and supports
can support the acquisition of behavioral management skills for teachers and other school
staff, and behavioral competence for all students. As researchers, experts, and
practitioners across disciplines within education have articulated throughout writings
cited in this study, general education and special education expectations and challenges
are increasingly aligned. This study can help establish a line of research to elucidate
which specific leadership skills are conducive to establishing and maintaining proactive
school environments for the diverse populations we serve.
Need for Study
To date there have been no studies related to the interface between SW-PBS and
the leadership skills of principals. References to the necessity of active and effective
administrator involvement in SW-PBS literature (Colvin & Sprick, 1999; Odom et al.
2005; Lewis & Sugai, 1999a; OSEP Center on Positive Behavioral Interventions and
Supports, 2004; Sugai, Hagan-Burke, & Lewis-Palmer, 2004; Sugai et al. 1999), suggest
there is reason to investigate which leadership skills are correlated with effective
implementation of SW-PBS.

56
General education researchers have continued to explore, refine, and delineate
specific leadership skills principals should demonstrate to increase their effectiveness in
the domains of transformational, managerial, and instructional skills (Cotton, 2003;
Marzano, Waters, & McNulty, 2005). Leadership skills in these areas are essential to
providing environments conducive to effective schools. However, a significant area of
concern identified by teachers and principals is the lack of sufficient training and support
in behavior management skills (Abbey & Esposito, 2001; DiPaola & Tschannen-Moran,
2003; Johnson & Birkeland, 2003; Landrum & Tankersley, 1999; Patterson, Marshall, &
Bowling, 2000; Simpson, 2004; Yoon & Gilchrist, 2003). Special education researchers
have identified skills principals should demonstrate to provide environments conducive to
the educational progress and inclusion of students at risk for and/or identified with
disabilities (Cook et al. 1999; Miller et al. 1999; Nelson, 1996; Salisbury & McGregor,
2002). Taken together, these separate areas of research provide information related to the
need for the development and implementation of cohesive strategies to address effective
behavior management of all students. However, further research is needed to clarify the
role of the principal in the SW-PBS process, and the specific skills inherent in that role,
to increase the likelihood of the establishment and sustainability of proactive school
environments that promote the potential for success of all teachers and students.

57
Definition of Terms
For the purposes of this study, the following terms were operationally defined as
follows:
School-wide Positive behavior support (SW-PBS): a broad range of systemic and
individualized strategies for achieving important social and learning outcomes while
preventing problem behavior (OSEP Center on PBS, 2004). Earlier literature regarding
PBS was identified as “EBS” (effective behavior support). Additionally, current
literature sometimes uses the acronym “PBIS” (positive behavioral interventions and
supports).
Proactive approaches: positive and constructive problem-solving approaches designed to
prevent problem behaviors, imply anticipating where and when problems may occur, and
teaching appropriate behaviors (Charles, 1999; Walker, Colvin, & Ramsey, 1995).
Effective practices: those that have been empirically proven to result in positive, durable
student outcomes that have been replicated in research studies in diverse locations and
across a range of student populations (Nelson, 2000).
Competencies: evidence of broadly defined abilities that are not identifiable, observable
or measurable in and of themselves.
Skills: evidence of specific actions or abilities that are identifiable, observable, and
measurable.
Transformational leadership: “where a principal establishes a belief system and related
practices that disperse leadership and ownership for success across a wide segment of the
school faculty” (Valentine, 2001, p. 1).

58
Managerial leadership: leadership encompassing principal tasks associated with the
effective daily management of the school, including maintaining an orderly school
through organizational stability, buffering the curriculum and instruction from excessive
distractions, ensuring that routine organizational tasks are performed correctly, and
providing adequate material and financial resources (Leithwood & Duke, 1999).
Major discipline offenses: incidences resulting in in-school suspension, out-of-school
suspension and/or expulsion.
School climate: a school’s personality, or pervasive atmosphere, that is discernible by
students and staff and which may affect their behaviors.
School culture: the norms, values, beliefs, rituals, and traditions of a school that have
developed over time and are accepted by the group members (Peterson & Deal, 1998).

59
CHAPTER II
METHODOLOGY
Overview
This correlational study employed a mixed-method design, identified as
appropriate for the exploration of effective practices in naturalistic contexts where
experimental control may not be feasible and where a complementary set of information
would more effectively inform practice (Creswell, 2003; Odom et al. 2005). The study is
exploratory in that, to the best of the investigator’s knowledge, no previous studies have
been conducted regarding identification of key principal leadership skills and
implementation of SW-PBS.
As previously outlined in Chapter I, the four primary purposes of the study were
as follows:
1. Identify key administrative leadership skills associated with socially proactive
school environments.
2. Examine the relationship between SW-PBS implementation and increased
evidence of those leadership skills
3. Examine the relationship between evidence of those skills and improved
certified staff job satisfaction
4. Examine leadership skill variables associated with SW-PBS and
recommendations from the field that support increased certified staff satisfaction,
effective behavioral management and principal leadership skill acquisition.

60
Design
A combination of survey data and a case study format were utilized to form a
mixed-method design. The study was conducted in four phases: (1) development of a
survey instrument (questionnaire) by the investigator, (2) distribution of questionnaires to
selected schools and analysis of results, (3) collection and analysis of school
demographic data, and (4) case studies conducted at identified schools. Phase 1 included
the synthesis of key literature associated with principal leadership skills and SW-PBS,
identification of a set of skills supported by the literature as important variables, and the
development of a questionnaire based on the identified skills. Phase 2 included
identification of SW-PBS and non-PBS schools to participate in the study, distribution of
the questionnaire, and analysis of the results. Phase 3 involved analyses of the
demographic data and its relationship to results on individual questionnaire items and
subscales, as well as the overall results. In Phase 4, three of the schools identified in
Phase 2 participated in a case study format.
Procedures
Phase 1: Development of Survey Questionnaire
Selection of key leadership skills. Principal leadership encompasses a set of
broad, deep and complex skills. This study was primarily concerned with identifying
skills associated with managerial and transformational leadership, which align most
closely with the administrator skills recommended through SW-PBS literature (Heck &
Hallinger, 1999; Horner et al. 2004; Leithwood & Duke, 1999; Leithwood & Jantzi,
2000; Lewis & Sugai, 1999a; Lewis, Sugai, & Colvin, 1998; Valentine, 2001). To

61
identify the skills, a five-step procedure was employed. In Step 1, literature from
transformational, managerial, and SW-PBS sources were reviewed and summarized as
reported in the Literature Review section. In Step 2, skills identified through the
literature as being most representative were cross-referenced (see Table 1). In Step 3, the
prevalence with which the skills were identified within and across representative
literature for transformational, managerial and behavior management leadership skills
was coded. In Step 4, the identified skills were selected. A minimum criterion was set
whereby the skill was identified at least three times per discipline (general education
administration literature for transformational and managerial leadership skills and SW-
PBS literature for behavior management skills) in sources that were peer-reviewed. In
Step 5, the skills were scrutinized to determine that they were stated in operational
terminology.
Development of the questionnaire instrument. A Likert Scale questionnaire
format is a viable method for conducting questionnaire research. The Likert Scale format
is recommended when attitudes or opinions are being measured (Suskie, 1992). It elicits
scaled responses in which the attitudes of the respondent are measured in increments
indicating highly favorable to highly unfavorable (Rea & Parker, 2005). Rating scales
are not designed to capture opinions per se, but to capture estimations of magnitude.
Data from Likert Scales are identified as quantitative (Hodgson, 2003). Likert items
produce weighted responses that can be converted and analyzed statistically in a number
of formats, thereby potentially yielding more in-depth analysis of results as compared to
other types of surveys (Barnette, 2001; Borg & Gall, 1989).

62
Construct validity of questionnaire. Construct validity of the questionnaire was
addressed through three steps. In Step 1, guidelines for survey research from The Survey
Research Handbook, 3rd Ed. (Alreck & Settle, 2004), Survey Research Methods, 2nd Ed.
(Babbie, 1990), Designing Surveys: A Guide to Decisions and Procedures, 2nd Ed. (Czaja
& Blair, 2005), and Designing and Conducting Survey Research: A Comprehensive
Guide, 3rd Ed. (Rea & Parker, 2005) were reviewed. From these sources, the following
decisions were made: (a) a comparison group would be comprised of a random stratified
sample, (b) the first section of the questionnaire would address principal leadership skills
and subsequent sections would address demographic data and participation in SW-PBS
training, (c) the first section of the questionnaire would employ Likert Scale questions
and the sections addressing demographic data and SW-PBS training would employ
forced choice and open-ended questions.
In Step 2, survey instruments which (a) have established reliability, (b)
specifically measure principal leadership skills, (c) use a Likert Scale format, and (d) are
recognized as viable instruments in the field of education through their inclusion in the
Handbook of Tests and Measurement in Education and the Social Sciences (Lester &
Bishop, 1997), were reviewed for overall format construction and design of response
statements. Those reviewed were the Audit of Principal Effectiveness (APE) (Valentine
& Bowman, 1988a), the Principal Leadership Questionnaire (PLQ) (Jantzi & Leithwood,
1996), the Purdue Teacher Opinionnaire (Bentley & Rempel, 1970), the Principal
Performance Rating Scale (Weiss,1989), and the Communication Effectiveness
Questionnaire (Viggiano, 1990).

63
Each of the example instruments listed above employed a statement format for
responses. Four of the five utilized only statements phrased in the affirmative.
Additionally, four of the five organized the statements by specific domains or factors.
The questionnaire constructed for this study, The Principal Leadership Skill
Questionnaire, followed these basic guidelines by utilizing statements phrased in the
affirmative and organizing the questions by the factors of transformational, managerial,
and behavior management skill sets.
The Likert Scale constructed for this study employed a scale of 1 to 5 for each of
two sets of responses to the 31 leadership skills presented. On the left side respondents
assessed the importance of each skill by indicating a 1 for “strongly disagree”, a 2
indicating “disagree”, a 3 indicating “neutral/not sure”, a 4 indicating “agree”, and a 5
indicating “strongly agree.” On the right side of the scale, respondents rated the
principals’ overall skill level for each of the 31 skills by indicating a 1 for “does not
exhibit this skill”, a 2 for “exhibits skill but is not effective”, a 3 for “is somewhat
effective”, a 4 for “is effective”, and a 5 for “is very effective” (See Appendix B for
complete questionnaire).
In Step 3, the questionnaire was (a) reviewed by an expert in SW-PBS and an
expert in principal leadership, (b) reviewed by two survey development experts and (c)
revised according to their recommendations.
Content validity of questionnaire. The 31 items selected for inclusion in the
questionnaire were grouped according to their alignment with transformational (items 1-
11), managerial (items 12-19), and behavior management (items 20-31) principal

64
leadership skills as derived from the Matrix of Primary Sources for Identification of
Principal Leadership Skills (Table 1, pp. 42-50). The specific items included in the
questionnaire were cross-referenced and aligned to those identified through Phase 1. The
items were verified to assure they were stated in operational terms. Operationalization of
leadership skills was necessary to provide clarity and uniformity regarding what was
specifically being evaluated by the subjects (Weisberg, Krosnick, & Bowen, 1996; Tull
& Albaum, 1973). Operational variables clarify the meaning of important terms in a
study so that readers are more likely to understand the precise meaning the researcher
intends (Gay & Airasian, 2003).
The selected skills were evaluated by two recognized researchers, one with SW-
PBS expertise and one with principal leadership expertise, to provide recommendations
associated with (a) clarity of wording, (b) usefulness of each question, and (c)
recommendations to delete original questions or to include additional questions (Alreck
& Settle, 2004; Czaja & Blair, 2005; Rea & Parker, 2005).
Phase 2: Questionnaire Distribution, Administration, and Analysis
Preliminary power analysis. A preliminary power analysis was conducted under
the supervision of the director of the University of Missouri-Columbia Social Sciences
Statistics Center to identify the approximate number of study participants needed to
achieve a power equaling .80 at a 95% confidence level with analysis computed for 2-4
groups (Gersten et al. 2005, Rea & Parker, 2005, Tabachnick & Fidell, 2001). Given an
estimated average population of certified staff per school of 15 members, it was
determined that a range of 24-30 schools (360-450 participants), was a probable estimate

65
to yield an acceptable effect size regardless of whether the data was analyzed by building
or individual.
Participants and setting. Participants and setting are discussed in two parts: those
participating in SW-PBS and those included in the comparison group.
SW-PBS participants and setting. Fifteen elementary schools in Missouri
representing diverse demographic populations and geographic locations and which were
verified to have been implementing SW-PBS with fidelity for a minimum of two years
were selected through stratified random sampling. Because the first year of PBS is
typically a training year, only schools in their second or subsequent years of
implementation of recommended SW-PBS strategies were included.
To be identified as implementing SW-PBS, the schools: (a) had a designated SW-
PBS team, (b) verified the team met on a regular basis, (c) identified the mission
statement and set of expectations employed, and (d) verified an action plan existed to
guide SW-PBS implementation. Additionally, the schools provided evidence of scoring
80% or above on the School-wide Evaluation Tool (SET) within a twelve month period
prior to being included in this study (Sugai, Lewis-Palmer, Todd, & Horner, 2001). The
SET assesses the level of fidelity with which SW-PBS is being implemented within a
given school, has been demonstrated to meet basic psychometric criteria as a
measurement tool, and can provide an objective assessment of the evidence of the
primary prevention (universal) features within a school (Horner, et al. 2004).
A series of steps were employed to accurately identify elementary schools in
which SW-PBS was being implemented with fidelity. First, a database supplied by the

66
University of Missouri Center for School-wide PBS of all elementary schools within
Missouri which had participated in formal SW-PBS training conducted by certified PBS
trainers from 2000 through 2005 was secured. Second, the state PBS coordinator
assigned by the Missouri Department of Elementary and Secondary Education was
contacted to verify which elementary schools within the state were currently
implementing SW-PBS. Third, personnel from each of the nine regional professional
development centers within Missouri were asked to review the proposed list of SW-PBS
schools within their region to verify its accuracy and to identify those that had met the
80% SET criterion within the last 12 months. Fourth, school district SW-PBS personnel
and administrators from the identified schools were contacted by telephone, mail and/or
email to verify current SW-PBS implementation status as previously outlined, and to
indicate their willingness to participate in the administration of the questionnaire to
building-level certified staff and administrators. Fifth, a database of all elementary
schools and their relevant demographic data (size, free and reduced lunch percentage,
ethnic diversity, population, geographic location) within Missouri was provided by the
University of Missouri-Columbia Office of Social and Economic Data Analysis
(OSEDA). Selection of these demographic characteristics and the decision to place the
identification of a mixed sample of elementary schools representing low, medium, and
high percentages of students eligible to receive free and reduced lunch as a first priority
were determined based on recommendations from the professional literature (Nelson,
2000; Nelson et al. 2003; Scott & Nelson, 1999; Sugai et al. 2005; Walker, et al. 1999)
and from a review of the data OSEDA annually collects, analyzes and reports to the

67
Missouri Department of Education (DESE). Data related to these characteristics is also
collected annually and reported by the National Center for Education Statistics (Sable,
Thomas, & Shen, 2006).
From the OSEDA database and the list of elementary schools verified through the
steps outlined above as implementing SW-PBS with fidelity, a final list of 24 SW-PBS
schools from which to draw the sample was constructed. An a priori decision was made
to identify schools based on matching as closely as possible to Missouri population
patterns utilizing the data available from OSEDA representing all elementary schools
within the state for the 2005-2006 school year.
First the SW-PBS list of 24 schools was sorted according to free and reduced
lunch percentage status as low (less than 25%), medium (between 25 and 50%) or high
(greater than 50%). Elementary schools in Missouri demonstrated 18.12% low, 30.05 %
medium and 51.83% high rates of free and reduced lunch. The 16 SW-PBS schools
selected yielded a distribution of 25% low, 31.25% medium, and 43.75% high. These
schools represented a data pattern similar to the Missouri’s and were within a 10% range
for the state averages per category.
Next the list was sorted according to the percentage of students per elementary
buildings in Missouri classified as representing minority groups (other than
white/Caucasian) utilizing the categories of low (less than 25%), medium (25-50%) or
high (greater than 50%). The state distribution demonstrated 51.87 % of all schools were
classified as low, 21.22 % as medium and 27.9% as high. The 16 SW-PBS schools first
selected through free and reduced lunch percentages yielded a minority distribution of

68
56.25% classified as low, 25% as medium, and 18.75% as high. Because the minority
distribution for the SW-PBS schools first selected through free and reduced lunch was
distributed within 10% ranges for minority status as well, this sample was retained.
Third, the list of 16 schools identified through free and reduced lunch and
minority status was sorted according to numbers of students enrolled. Approximately
18.75% were categorized as small (1-250 students), 43.75% as medium (251-500
students) and 31.25% as large (larger than 500 students). The OSEDA data base
demonstrated enrollment percentages of 31.8% as small, 50.64% as medium, and 17.57%
as large. Although these percentages did not retain a 10% match per category, the largest
differential was 13.68%. Given that the overall distribution pattern was similar and the
first two categories of free and reduced lunch and minority status had been met, this
sample was retained.
Finally, the list was sorted by geographic location. Approximately half of the 16
SW-PBS schools were classified as rural, small town, or mid-sized city and the other half
as city or city/fringe. The OSEDA data base demonstrated relatively equivalent
percentages of 49.17% classified as rural, small town or mid-sized city and 50.83 as city
or city/fringe. The characteristics associated with geographic locations of the stratified
random sample of 16 SW-PBS schools initially identified represented a similar pattern to
schools overall within Missouri.
In summary, the stratified random sample of 16 SW-PBS schools was identified
by aligning as closely as possible with the percentage guidelines as outlined above. The
schools were selected in order by the following categories: (1) free and reduced lunch

69
percentages, (2) percentage of students by minority status other than white/Caucasian, (3)
size of school population, and (4) geographic location.
The identified schools were contacted via the building principals to invite them to
participate. Principals indicating a willingness to allow their schools to participate were
requested to sign a formal letter of consent (see Appendix C). Fifteen of the 16 agreed to
participate and returned the signed formal letters of consent. The loss of one school in
the sample did not appreciably alter the demographic characteristics of the sample or
their alignment with Missouri elementary school demographics.
Participants and setting in comparison schools. Fifteen elementary schools in
Missouri which overall represented complementary demographic characteristics and
geographic regions to the identified SW-PBS schools included in the study were selected
through stratified random sampling (Gay & Airasian, 2003; Gersten, et al. 2005; Rea &
Parker, 2005) as the comparison group. This methodology was employed through a
series of steps. First, an a priori decision was made to match the schools as closely as
possible across the first two variables of free and reduced lunch percentages and
percentages by minority status. Second, after a possible sample had been derived related
to these variables, the last two variables of size of school population and geographic
location would be matched as closely as possible. Third, the OSEDA database would be
analyzed to procure a list of possible schools to match the demographic characteristics in
the same order of priority used in the selection of the SW-PBS sample with the following
guidelines: (1) free and reduced lunch percentage within a 10% range of the SW-PBS
sample, (2) minority status representative across the 3 categories as previously outlined

70
within a 10% range of the SW-PBS sample, (3) number of students enrolled across the 3
categories as previously outlined within a 15% range of the SW-PBS sample, and (4)
geographic locations represented across the 2 categories within a 15% range.
For the 15 identified schools in the comparison sample, the following
demographic characteristics were obtained:
• free and reduced lunch percentages of 20% low, 33.3% medium, and
46.7% high, all within a 10% range of SW-PBS sample schools
• minority status of 46.7% low, 33.3% medium, and 20% high, all within a
10% range of SW-PBS sample schools
• number of students enrolled of 20% small, 60% medium, and 20% large,
all within a 15% range of SW-PBS sample schools
• geographic location of 60% rural/small town/mid-sized city and 40% city
or city/fringe, all within a 15% range of SW-PBS sample schools
In summary, the criteria established for the selection of the comparison schools
related to demographic characteristics were met. Selection of schools to be included in
this phase was in part determined by demographics and geographic locations in order to
achieve results that are more representative of schools overall within Missouri.
Demographic variables have been identified as potentially significant when investigating
the relationships between principal behaviors, teacher perceptions, and student
achievement (Hallinger & Heck, 1998; Kern & Manz, 2004; Leithwood et al. 2004). The
decision to utilize random stratified sampling is appropriate to focus attention on the
primary independent variable of the effect of PBS implementation and to decrease the

71
likelihood of confounding variables that could emerge if the comparison group schools
varied significantly in terms of demographic factors (Alreck & Settle, 2004; Weisberg et
al. 1996).
Other demographic data collected for the 30 schools were: (a) number of certified
staff employed, (b) discipline records related to major offenses (in-school and out-of
school suspensions and expulsions) and numbers of these associated with students with
disabilities (and by E/BD disability), (c) standardized academic scores related to math
and reading and (d) percentage of students receiving special education services (and by
E/BD disability). These data are available and were collected through the Missouri
Department of Elementary and Secondary Education (DESE). Data was collected for the
2002-2003, 2003-2004, and 2004-2005 school years related to discipline records and
standardized academic scores. Records for 2005-2006 were unavailable. The number of
certified staff employed and percentage of students served through special education
were reported for the 2005-2006 school year.
Survey distribution and administration. As previously stated, the questionnaire
was administered in 30 schools – 15 implementing SW-PBS and 15 not. Prior to
distribution, permission from schools was obtained through the following steps: (1) all
requirements, forms, and timelines to obtain IRB approval were met prior to contacting
individual schools, (2) a formal introductory letter to the principal of each school was
sent outlining the purpose of the study, procedures and timelines, and what activities the
school was being requested to complete (see Appendix B), and (3) principals were
contacted by the investigator to discuss the study and to obtain formal written consent

72
from the principal. The decision to personally contact the principals was made to address
issues of low response rates potentially inherent in surveys (Alreck & Settle, 2004;
Babbie, 1990; Weisberg, et al. 1996). If the district in which the school resided also had
a protocol for district approval, it was followed prior to study implementation as well (see
Appendix C).
Once all building-level permissions had been secured, a schedule to administer
the questionnaires was agreed upon by the schools’ principal and the investigator.
Confidentiality of respondents was ensured and described in the cover letter. The
decision to provide confidentiality rather than anonymity was made so that non-
responders could be contacted should the need arise. At the pre-arranged date and time
the investigator or a designated representative administered and collected the
questionnaires and provided a secure placement for them. The primary purpose for the
investigator or a designated representative to administer and collect the questionnaires,
typically during a faculty meeting, was to increase response rates. The threat of
nonresponse bias is considered to be a serious problem that can produce systematic error
in the findings within survey research (Alreck & Settle, 2004; Czaja & Blair, 2005).
Prior to the distribution of the questionnaire, certified staff and principals were
provided individual permission letters outlining the purpose of the study and their right to
agree or not agree to participate (see Appendices D and E). Those agreeing to participate
signed and turned in the letters to the investigator or designated collector. Prior to
administration of the questionnaire, one of two procedures were followed. In buildings
where the investigator administered the questionnaire, the principal elected whether or

73
not to be present during the introduction of the activity and its purpose. When the
investigator’s introduction was complete, participants were apprised of the location of a
box where they were to place the sealed questionnaires when completed and given an
opportunity to ask any questions. The investigator and principal then exited the location.
The investigator remained in close proximity to answer additional questions if requested.
The principal had no more contact with the staff during the completion of the
questionnaire.
School staff members were given a copy of the Principal Leadership Skill
Questionnaire by a fellow certified staff member that was pre-coded with a number
representing the school and participant and an unmarked envelope in which to place the
completed questionnaire. When finished, respondents placed them in the box and exited
the meeting.
In buildings where either the certified staff or principal elected to complete the
questionnaires individually, the principal introduced the purpose of the activity to the
staff either in a staff meeting time or via letters supplied by the investigator (Appendix
F), along with a blank permission letter. If the staff member elected to complete the
questionnaire, a designated staff member other than the principal or assistant principal
collected them and returned them to the building secretary and they were placed in an
envelope supplied by the investigator. Then, either a designated staff member or the
building secretary gave them a copy of the questionnaire and an unmarked envelope.
When completed, the staff members returned them to the designated person and they
were placed in a lidded box to ensure confidentiality. The investigator collected all

74
questionnaires and the signed permission forms from the building secretary on a pre-
arranged date agreed to by the building principal.
In schools where more than one principal was employed, the investigator had
previously obtained information from the head principal regarding which one had been
assigned primary responsibility for the implementation of SW-PBS in the school setting
and participants were instructed either by the investigator or designated staff member to
base their responses on the assessment of that individual.
Data entry and reliability procedures. Once the questionnaires were returned, a
master list was marked and the percentage of staff available to participate was computed
and recorded (Babbie, 1990). The master list was not made available to anyone beyond
the principal investigator. The questionnaires were then placed in a locked file cabinet
housed in the Special Education Department at the University of Missouri-Columbia.
Data from the questionnaires were entered into a previously constructed data-
base. The surveys were pre-coded according to identity of the school, and whether it was
an administrator or teacher set of data. The data for SW-PBS schools was entered and
coded as schools 1-15. The data for the control group schools was entered and coded as
schools 16-30. For each school, the principal questionnaire was coded as respondent #1.
If the data from a school also included the responses of an assistant principal, that data
was coded as respondent #2 for that building.
Once all data were entered by a data recorder for the 725 returned questionnaires
(695 certified staff and 30 principals), the investigator performed a hand check of each
one to answer marked questions for which the data recorder had requested clarity. The

75
data recorder then entered the remaining data. Next, the investigator performed a second
reliability check whereby a random sample of between 33% and 40% of the items on
each questionnaire, for an average of 37% overall, were compared to the original
questionnaire for accuracy of entry. The reliability check yielded 11 items in
disagreement, or a reliability agreement rate of 99%. The inter-rater agreement was
calculated as the number of agreements divided by the number of agreements plus
number of disagreements multiplied by 100 (Kazdin, 1982). The investigator corrected
these items in the data base before data analysis began.
Phase 3: Collection and Analysis of Demographic Data
In Phase 3, items were compared in relation to the demographic data collected
through DESE as previously identified (numbers of students enrolled and certified staff
employed, free/reduced lunch percentage, ethnicity, factors related to AYP, factors
related to special education percentages, attendance rates, and geographic location).
These demographic variables were used as a part of the analysis of the research questions
to determine if any significant differences existed among subgroups within the sample
(Rea & Parker, 2005).
A second set of demographic data related to certified staff and principals that was
not readily available from DESE was collected as a part of the questionnaire and
included: (a) gender, (b) ethnicity, (c) employment assignment, (d) areas of educational
certification, and (e) years of full-time experience as a general educator, special educator,
and/or principal. The primary purpose for analyzing the data in relation to the second set
of demographic factors was to ascertain if any were potential classification variables.

76
Classification variables are weaker in the inferences that can be derived from them given
that differences between groups can be identified, but there is no evidence to identify
why the differences exist. The differences, however, are worth noting to (a) identify
potential future lines of research, and (b) account for any variables that might influence,
confound, or distort the apparent effects of the independent variable (Babbie, 1990;
Keppel & Wickens, 2004).
Phase 4: Case Studies of Identified Schools
Given that this study is the first to directly investigate the relationship of the role
of principal leadership skills and SW-PBS, the collection of additional measures from
schools implementing school-wide PBS was warranted. A case study format was
implemented in two stages with three elementary schools found to have the highest
ratings associated with principal demonstration of effectiveness of leadership skills in
SW-PBS schools. These two steps included: (1) completing focus interviews with SW-
PBS team members, and (2) collecting and comparing results of the School-wide
Evaluation Tool 2.0 (SET) obtained by the three schools during the 2005-2006 school
year and rates of office discipline referrals from 2002-2006. The SET is specifically
constructed for gathering data in SW-PBS schools related to the primary (universal) level
of implementation. As previously described, the SET research instrument has been
assessed and deemed to be reliable and valid (Horner et al. 2004).
The principals of the schools were contacted and all agreed to allow their SW-
PBS team members to participate in the case study phase. They were asked to select a
date and time convenient to the team members to meet for no longer than 45 minutes, and

77
to inform members that participation was voluntary. Approximately one week before the
scheduled interviews, the investigator sent an email to the principals confirming the
appointments, reminding them that they were asked not to attend, and including an
attachment of the Principal Leadership Skill Questionnaire to forward to team members
as a reminder of what they had previously filled out.
Stage 1: Focus interview format. The focus interview format included conducting
the interviews with a set of participants identified through purposeful sampling. In this
study the sample was SW-PBS team members because they theoretically have had the
most training in PBS principles and practices, the most consistent access to evaluating the
principal’s relationship with implementing SW-PBS, and the most active roles in the
implementation of SW-PBS among staff members in their building.
The investigator developed a set of 6 open-ended predetermined questions that
were recorded on a form with space for reporting participant responses (Appendix H).
The investigator began each meeting by informing potential participants of the voluntary
and confidential nature of the interview. Team members were also apprised of the
general content of the questions. They were asked to read the Consent to Participate form
(Appendix D) and to sign it if they were willing to participate. All members at the three
schools chose to sign the consent forms. The interviews were audio taped and a second
observer was present to take notes to increase the likelihood of reliably reporting the
results of the responses (Creswell, 1998). In each of the schools, all team members
agreed to the presence of a second observer prior to that person’s entrance into the
interview site. A SW-PBS consultant was the second observer in two of the buildings.

78
An assistant principal served as the second observer in the third school due to the
unexpected inability of the SW-PBS consultant to attend. The assistant principal was
suggested as a replacement by the team members because she had been a member of their
team for several years and was knowledgeable about the SW-PBS process in general and
its implementation in their school in particular. The investigator also took notes during
the interview in case the audio recorder malfunctioned.
The interview format (appendix G) was followed in order each time. The
questions were purposefully constructed to elicit themes related to the influence of
implementing SW-PBS on job satisfaction, student behavior and principal leadership. At
the end of the interviews, the second recorders handed their notes to the investigator who
briefly reviewed them to ascertain if clarification was needed on any information. The
investigator reviewed and made notes from the audio recordings and then compared these
notes to those taken at the interviews. From these sources a list of primary categories of
responses and major themes was determined. Next the audio recorder was given to an
independent reviewer who is a doctoral candidate in special education. The second
reviewer followed the same protocol of taking notes while listening to the audio
recordings, condensing these into categories, and identifying major themes. The
investigator then compared the first findings to those of the second reviewer. The
investigator and second reviewer were in agreement regarding the primary categories of
responses and major themes at each of the three schools.
Stage 2: SET results and discipline data. In Stage 2, the SET 2.0 results for the
2005-2006 school year were reviewed by the primary investigator to compare the

79
assessed level of implementation of SW-PBS across the three schools. The SET involves
approximately 1-2 hours of time spent in observing for designated archival items;
randomly selecting teachers, students, and staff members to answer prescribed questions;
and conducting a separate interview with at least one building administrator. The
responses and ratings of archival items are recorded on a protocol form, are given number
values, and then computed to percentages. Inter-rater reliability is also computed and
recorded (Horner et al. 2004). The SET is viewed as a “snapshot” of a school’s overall
implementation of SW-PBS.
A review of the data related to office discipline referrals (ODR) rates over a
multi-year period was conducted for two reasons: (1) more in-depth records related to
accurate counts of all discipline referrals were available in these schools, and (2) potential
patterns in numbers of referrals could help to elucidate how SW-PBS is impacting the
overall school environment. These two stages of information gathering during the case
study phase were descriptive in nature and designed to further expand the previous
findings. ODR data in and of itself is not identified as an indicator of behavior change,
but a metric for guiding decision-making related to interventions (Sprague, et al., 2001).
Multi-year analysis of overall rates of ODR may assist schools in assessing the overall
usefulness of interventions, systems, and practices utilized if viewed as an indicator
rather than a predictor (Irvin et al. 2004; Irvin et al. 2006; Luiselli et al. 2002; Nelson et
al. 2002).
To analyze the data from the case studies, the following steps were taken: (1) the
interview responses were recorded through note-taking by the investigator, and cross-

80
checked with those of the second recorder and/or audio recording, (2) the interview data
was read and categorized according to potentially emerging clusters of responses, themes
and agreements across participants by the investigator, (3) a second reviewer read and
categorized the responses independently of the principal investigator, (4) the principal
investigator and second reviewer reviewed the results together to determine areas of
agreement and disagreement, (5) any areas of disagreement were categorized by a third
reviewer, (6) the results of the responses as agreed to among and between reviewers were
sorted once again according to themes, and (7) the responses and themes were compared
to the results from Research Questions 1-4 to determine if any new information of
significance had been identified, or if it added either agreement or disagreement to the
mean rating of satisfaction with the specific administrator skills included in the survey
(Creswell, 1998; Gay & Airasian, 2003).
The SET results and ODR findings were recorded and compared to the
questionnaire outcomes and interview results. This triangulation of qualitative and
quantitative results was intended to give a more complete picture of the most salient
variables associated with principal leadership skills and implementation of SW-PBS
(Creswell, 2003). Including case study results from schools reporting highest levels of
principal leadership skills through SW-PBS team interviews, and the review of SET and
ODR records allowed for a potentially more complete understanding of the process.

81
CHAPTER III
RESULTS
Data Analysis Overview
In this chapter treatment of the data, descriptive statistics and frequencies where
appropriate, transformation of variables, demographic characteristics of the schools and
respondents, and hypothesis tests results of this study are presented in relation to the
phases of the study. As previously stated, the study was conducted in four phases: (1)
development of the questionnaire, (2) distribution of the questionnaire and analysis of
results, (3) collection and analysis of demographic data, and (4) case studies at the three
SW-PBS schools demonstrating the highest scores related to principal effectiveness. The
first part of this chapter (related to Phase 1) is subdivided into the following sections: (1)
data analysis of the questionnaire instrument and (2) results related to the content
validity, internal reliability and construct validity of the instrument.
In the second part of this chapter, the results of the questionnaire are reported in
relation to the five research questions (Phase 2). In the third part of this chapter, the
demographic characteristics related to the schools and respondents included in the sample
are reported (Phase 3) in relation to the questionnaire results. In the fourth part, the case
study results and how the results align with the questionnaire are presented (Phase 4).
For all statistical tests except ANOVA F ratio (which computes F ratio significance at
.001 level), the level of significance was set at alpha = .05.

82
Phase 1: Development of the Questionnaire
Questionnaire Purposes and Sections
The questionnaire instrument developed for this study, the Principal Leadership
Skill Questionnaire (Appendix A), was designed to assess the perceptions of certified
staff and principals as to the importance and evidence of a set of 31 leadership skills
(survey section I). Second, the questionnaire was designed to determine what, if any,
impact training in SW-PBS had on the job satisfaction of the certified staff and principals
(survey section II). Third, a second set of demographic questions related to participants’
gender, highest academic degree earned, current job assignment, ethnicity, areas of
educational certification, and years of educational experience was included to ascertain if
there were any areas of significant difference in respondents between those employed in
SW-PBS or non PBS schools (survey section III). Fourth, a set of questions related to
respondents’ participation in SW-PBS training history and their assessment of SW-PBS
was included to more fully describe potential variables of interest (survey section IV).
Content validity of the questionnaire. As previously stated in Chapter 2, the
content validity of the questionnaire was addressed through a series of steps. First, the 31
skill items included in the questionnaire were cross-referenced to those reported through
the literature as being associated with transformational, managerial, and behavior
management leadership. Second, the selected skills were evaluated by two recognized
researchers, one with SW-PBS expertise and one with principal leadership expertise. The
experts confirmed they believed the 31 items and analysis in relation to importance and
evidence of effectiveness to be appropriate. No additional items were recommended for

83
inclusion in Section I of the questionnaire. The 31 items were grouped according to their
alignment with transformational (items 1-11), managerial (items 12-19), and behavior
management (items 20-31) principal leadership skills (Table 1). The content of Sections
II and III were approved as written.
The addition of one item, “I am more satisfied with my principal’s job
performance since my school has been using SW-PBS” was recommended for Section
IV. All recommendations were incorporated into the final questionnaire instrument.
Data Analysis of the Questionnaire Instrument
Internal reliability of the questionnaire instrument. The results of the
questionnaire were analyzed according to mean ratings and differences among groups.
Data analysis of the descriptive statistics by item for frequency of response, mean,
standard deviation, and standard error were employed. Any statistical procedures for this
phase were conducted using the Statistical Package for the Social Sciences (SPSS)
version 13 (SPSS Inc., 2004). Items that fit cluster analysis by groups of respondents
(SW-PBS and non-PBS, and certified staff and principals) and by the six subscales of: (1)
Transformational importance, coded as A1, (2) managerial importance, coded as A2, (3)
behavior management importance, coded as A3, (4) transformational exhibits skill, coded
as B1, (5) managerial exhibits skill, coded as B2, and (6) behavior management exhibits
skill, coded as B3, were also analyzed within those clusters for the same descriptive
statistics (Creswell, 2003; Gay & Airasian, 2003).
The internal reliability of the instrument was first analyzed in relation to the
descriptive statistics related to the responses of all participants. In all, 695 certified staff

84
and 30 principals participated in the study. The number of respondents per item varies
according to those who answered each item. The lowest percentage rate of response for
any individual item was 97.5%. Therefore, an a priori decision was made to preserve all
cases and to calculate the average of the available responses for each respondent, and to
use that averaged response score to replace any missing items of that individual for each
scale (Tabachnick & Fidell, 2001). Table B.i (Appendix H) reports the descriptive
statistics results related to status by Position and PBS code for all items. These results
provided the basis from which to analyze individual items and by groups of items.
Table 2 reports the descriptive statistics results related to the perceptions of all
certified staff and principals of the importance (A values) of each of the 31 skills. Table 2
provided the most concise summation of the descriptive results for the A items, and was
utilized to assess overall values of means, skewness and kurtosis.
The mean average per item ranged from 4.42-4.815, indicating assessment as to
the importance of all leadership skills included to be closest to the descriptor “strongly
agree.” The lowest response rate on an individual item was 97.5%. The skew range of -
1.306 to -3.835 corresponds to the overall high ratings of the skills. The kurtosis range of
2.416 to 20.34 relates to the overall high frequency of the proximity of ratings of the
skills.

85
Table 2
Descriptive Statistics, All Respondents, Importance (A) Values
Skew. Kurt.
N Mean SD Skew.
Std.
Error Kurt.
Std.
Error
01a Leads establishing
school vision. 719 4.715 0.552 -2.656 0.091
11.25
7 0.182
02a Leads establishing
goals to implement
vision. 718 4.660 0.585 -2.239 0.091 8.130 0.182
Item 03a Encourages staff
input/participation to
prioritize goals. 719 4.661 0.589 -2.242 0.091 7.956 0.182
Item 04a Works toward
staff consensus on school-
wide issues/goals. 718 4.565 0.671 -1.896 0.091 5.199 0.182
Item 05a Models/uses
problem-solving 716 4.527 0.659 -1.598 0.091 3.988 0.182
Item 06a Uses data to
help staff prioritize goals. 715 4.436 0.706 -1.306 0.091 2.416 0.183
Item 07a Maintains high
perform. expect. all staff. 717 4.815 0.502 -3.835 0.091
20.30
4 0.182

86
Table 2 (continued)
Descriptive Statistics, All Respondents, Importance (A) Values
Skew. Kurt.
N Mean SD Skew.
Std.
Error Kurt.
Std.
Error
Item 08a Encourages staff
to self-evaluate. 716 4.511 0.672 -1.538 0.091 3.538 0.182
Item 09a Provides prof.
dev. activities to support
goals. 707 4.604 0.651 -2.043 0.092 5.858 0.184
Item 10a Actively models
skills that support school-
wide goals. 714 4.602 0.632 -1.875 0.091 5.001 0.183
Item 11a Establishes
leadership teams to guide
implement. of goals. 714 4.549 0.669 -1.803 0.091 4.899 0.183
Item 12a Provides and
enforces clear school-
wide systems. 711 4.653 0.632 -2.153 0.092 5.915 0.183
Item 13a Provides and
enforces clear school-
wide practices. 711 4.681 0.599 -2.343 0.092 7.567 0.183

87
Table 2 (continued)
Descriptive Statistics, All Respondents, Importance (A) Values
Skew. Kurt.
N Mean SD Skew.
Std.
Error Kurt.
Std.
Error
Item 14a Monitors
modifies systems and
practices as needed. 714 4.601 0.628 -1.833 0.091 4.847 0.183
Item 15a Keeps staff up-
to-date on mods. to
systems/practices. 713 4.670 0.592 -2.231 0.092 7.210 0.183
Item 16a Anticipates
problems and effectively
responds to them. 713 4.647 0.624 -2.293 0.092 7.745 0.183
Item 17a Assures school
compliance with
government regulations. 714 4.758 0.572 -3.156 0.091
13.34
5 0.183
Item 18a Promotes staff
cohesion and cooperation. 712 4.768 0.552 -3.263 0.092
14.41
6 0.183
Item 19a Provides staff
materials/resources/plan
times. 713 4.784 0.509 -3.166 0.092
14.49
3 0.183

88
Table 2 (continued)
Descriptive Statistics, All Respondents, Importance (A) Values
Skew. Kurt.
N Mean SD Skew.
Std.
Error Kurt.
Std.
Error
Item 20a Exposes staff to
research/rationale for beh.
mgmt.. 713 4.422 0.729 -1.323 0.092 2.395 0.183
Item 21a Includes staff in
decision-making about
beh. mgmt. issues. 713 4.603 0.667 -2.105 0.092 6.067 0.183
Item 22a Established
leadership team. 711 4.546 0.755 -2.089 0.092 5.318 0.183
Item 23a Publicly
supports the leadership
team’s efforts. 713 4.607 0.719 -2.256 0.092 6.155 0.183
Item 24a Is an active
participant on the
leadership team. 712 4.636 0.718 -2.575 0.092 8.058 0.183
Item 25a Support
leadership team to form
beh. mgmt. action plan. 708 4.595 0.696 -2.056 0.092 5.252 0.183

89
Table 2 (continued)
Descriptive Statistics, All Respondents, Importance (A) Values
Skew. Kurt.
N Mean SD Skew.
Std.
Error Kurt.
Std.
Error
Item 26a Provides
resources to implement
beh. mgmt. plan. 709 4.540 0.715 -1.896 0.092 4.745 0.183
Item 27a Supports
recognizes who
implement beh. mgmt.
plan. 712 4.497 0.739 -1.764 0.092 4.131 0.183
Item 28a Supports
recognizes students
improved skills. 712 4.698 0.621 -2.694 0.092 9.616 0.183
Item 29a Informs all
about beh. mgmt. 715 4.503 0.723 -1.654 0.091 3.496 0.183
Item 30a Maintains beh.
mgmt.systems/practices. 712 4.643 0.631 -2.199 0.092 6.685 0.183
Item 31a Ensures staff
know/follow beh. mgmt.
practices. 713 4.679 0.635 -2.539 0.092 8.470 0.183

90
The descriptive statistics results of the perceptions of all certified staff and
principals related to the effectiveness (B values) of principals in utilizing the 31 skills is
presented in Table 3. The mean average per item ranged from 3.73 - 4.46, indicating an
assessment as to the importance of all leadership skills included to be across two
descriptors, “agree” and “strongly agree.” The lowest response rate on an individual item
was 97.8%. The skew range of -.653 to -1.613 corresponds to the medium to high ratings
of the skills, although these results are not as skewed as those related to the A items,
which is in keeping with the wider range of score responses. The kurtosis range of -0.231
to 2.674 also relates to the medium to high ratings of the skills. Given that the number
for a normal distribution is 0, the kurtosis overall also indicates the high frequency with
which participants selected similar ratings for these items.
While these results are lower than those for the importance items in Table 2,
overall they are still relatively high ratings. The results also indicate a consistency
across items given the less than 1 point differential between the highest and lowest
ratings per item.

91
Table 3
Descriptive Statistics, All Respondents, Effectiveness (B) values
Skewness Kurtosis
N Mean SD Skew. Std. Error Kurt.
Std.
Error
Item 01b Leads establish
school vision. 722 4.179 0.889 -1.070 0.091 1.028 0.182
Item 02b Leads establish
goals/implement vision. 719 4.125 0.907 -0.957 0.091 0.669 0.182
Item 03b Encourages staff
input/participation to
prioritize goals. 718 4.114 0.967 -1.176 0.091 1.256 0.182
Item 04b Works toward
staff consensus on school-
wide issues/goals. 722 3.916 1.056 -0.852 0.091 0.204 0.182
Item 05b Models/uses
problem-solving to help
staff reach consensus. 719 3.839 1.046 -0.743 0.091 0.115 0.182
Item 06b Uses data to
help staff prioritize goals. 716 4.052 0.977 -0.969 0.091 0.683 0.182
Item 07b Maintains high
performance expectations 720 4.224 0.969 -1.334 0.091 1.495 0.182

92
for all staff.
Table 3 (continued)
Descriptive Statistics, All Respondents, Effectiveness (B) values
Skewness Kurtosis
N Mean SD Skew. Std. Error Kurt.
Std.
Error
Item 08b Encourages
supports staff to self-
evaluate goals progress. 721 4.028 0.980 -0.961 0.091 0.658 0.182
Item 09b Provides prof.
dev. to support goals. 709 4.155 0.927 -1.058 0.092 0.861 0.183
Item 10b Models skills to
support school-wide
goals. 714 4.001 0.966 -0.846 0.091 0.376 0.183
Item 11b Establishes
leadership teams to guide
implement. of goals. 714 4.171 0.951 -1.082 0.091 0.693 0.183
Item 12b Provides and
enforces clear systems. 712 3.989 1.024 -0.899 0.092 0.274 0.183
Item 13b Provides
enforces clear practices. 713 3.978 1.005 -0.828 0.092 0.121 0.183
Item 14b Monitors 712 3.902 1.004 -0.746 0.092 0.138 0.183

93
modifies systems and
practices as needed.
Table 3 (continued)
Descriptive Statistics, All Respondents, Effectiveness (B) values
Skewness Kurtosis
N Mean SD Skew. Std. Error Kurt.
Std.
Error
Item 15b Keeps staff up-
to-date on mods. to
systems/practices. 715 4.014 1.038 -0.954 0.091 0.350 0.183
Item 16b Anticipates
problems and effectively
responds to them. 709 3.874 1.084 -0.743 0.092 -0.131 0.183
Item 17b Assures comp.
with gov. regulations. 712 4.461 0.802 -1.613 0.092 2.674 0.183
Item 18b Promotes staff
cohesion and cooperation. 713 3.957 1.133 -0.996 0.092 0.192 0.183
Item 19b Provides staff
with materials
resources/plan times. 713 4.240 0.906 -1.174 0.092 1.044 0.183
Item 20b Exposes staff to
research for beh. mgmt.. 715 3.906 1.048 -0.763 0.091 0.003 0.183

94
Item 21b Includes staff in
decision-making about
beh. mgmt. issues. 716 3.867 1.111 -0.823 0.091 -0.032 0.182
Table 3 (continued)
Descriptive Statistics, All Respondents, Effectiveness (B) values
Skewness Kurtosis
N Mean SD Skew. Std. Error Kurt.
Std.
Error
Item 22b Established
leadership team to guide
beh. mgmt. system. 712 4.038 1.135 -1.058 0.092 0.306 0.183
Item 23b Publicly
supports leadership
team’s efforts. 714 4.069 1.134 -1.187 0.091 0.664 0.183
Item 24b Active on the
leadership team. 713 4.079 1.152 -1.208 0.092 0.645 0.183
Item 25b Support
leadership team beh.
mgmt. action plan. 711 4.004 1.079 -1.067 0.092 0.621 0.183
Item 26b Provides
resources to implement
beh. mgmt. plan. 712 3.876 1.107 -0.840 0.092 0.044 0.183

95
Item 27b
Supports/recognizes staff
who implement beh.
mgmt. plan. 710 3.807 1.144 -0.767 0.092 -0.177 0.183
Table 3 (continued)
Descriptive Statistics, All Respondents, Effectiveness (B) values
Skewness Kurtosis
N Mean SD Skew. Std. Error Kurt.
Std.
Error
Item 28b
Supports/recognizes
students improved
beh./social skills. 719 4.031 1.038 -0.968 0.091 0.373 0.182
Item 29b Informs
stakeholders about meeting
beh. mgmt. goals. 718 3.731 1.117 -0.653 0.091 -0.231 0.182
Item 30b Maintains beh.
mgmt.
standards/systems/practices. 716 3.873 1.113 -0.896 0.091 0.169 0.182
Item 31b Ensures all staff
know/follow beh. mgmt.
practices. 716 3.863 1.089 -0.872 0.091 0.198 0.182

96
Determination of internal reliability by item analysis. The information provided
in Tables 2 and 3 established a basis from which item-by-item analysis could be
computed, to determine which, if any, questionnaire items should be eliminated. Items
for each scale and respondent were averaged (Keppel & Wickens, 2004). Reliability, in
the form of scale cohesiveness, is an important measure of scale quality. Cronbach’s
Alpha is a measure of the internal consistency within the subscales. Tables B.ii through
B.vii (Appendix I) show the results of the analysis of the internal consistency and item
characteristics of the six subscales. Some item descriptions were abbreviated to improve
the appearance of the tables. The results from the tables demonstrate the appropriateness
of including all 31 items for analysis in relation to assessment of importance (A scales)
and effectiveness (B scales). The Cronbach’s Alpha scores within each subscale ranged
from .912 to .959, indicating a high degree of interrelatedness of items within each
subscale. This suggests the items within each subscale are measuring similar or
complementary skills. The highest Alphas for importance and effectiveness were
associated with behavior management. The Alphas for the subscales are: (A1)
Transformational Importance = 0.920, (A2) Managerial Importance = 0.912,
(A3) Behavior Management Importance = 0.945, (B1) Transformational Effectiveness =
0.954, (B2) Managerial Effectiveness = 0.935, and (B3) Behavior Management
Effectiveness = 0.959.
Construct validity of questionnaire. Guidelines for survey research were
reviewed through a variety of empirically validated survey instruments related to
principal leadership skills (see Chapter 2). Of those instruments, ones employing a Likert

97
Scale format were reviewed for overall format construction and design of response
statements. The proposed questionnaire was then reviewed by an expert in SW-PBS, an
expert in principal leadership, and two survey development experts. The
recommendation for Section I was to incorporate one set of descriptors for assessment of
the importance of each skill, and a different set of descriptors for the assessment of
evidence of each skill. This recommendation was made to: (a) more accurately reflect
the purpose of each section, and (b) make clear to respondents what they were being
asked to assess. The recommendation for Sections II was to decrease the number of
possible respondent choices from 5 to 4 for both items by eliminating “neutral/not sure.”
The items in Section III and IV were approved as written.
Determination of construct validity. The construct validity of the questionnaire in
relation to the six subscales was analyzed statistically by examining the correlation
among them through Pearson’s Correlation Coefficient. One concern with instruments
having multiple scales is the potential for the scales to be so highly correlated with each
other that they are collinear. Tables 4 and 5 below summarize the scale inter-correlations
for the six scales. The inter-scale correlations for the 3 subscales related to importance
ranged from .726 to .819, indicating a “very strong positive association” (Rea & Parker,
2005, p. 194) among them. The inter-scale correlations for the 3 subscales related to
effectiveness ranged from .805 to .893, also indicating a “very strong positive
association” (Rea & Parker, 2005, p. 194). Thus, the subscales related to importance and
the subscales related to effectiveness are each constructed to measure similar variables.

98
The 3 subscales related to importance are not strongly associated with the 3
subscales related to effectiveness (range of .177 to .323). This indicates the two sets of
subscales are measuring different variables appropriately. Given the strong positive
association among the three subscales within each of the two sets and the substantially
weaker association between the two sets of subscales, the construct validity of the 31
items and decision to subdivide them into six subscales appears to be upheld.
Table 4
Inter-scale Correlations for Importance Items (A1 to A3) to All Items

99
Scale Statistic
A1
Transformational
Scale (Imp.)
A2
Managerial
Scale (Imp.)
A3
Beh. Man. Scale
(Imp.)
r 1 0.819 0.726A1 (Imp.)
Transformational
Scale N 721 716 720
r 0.819 1 0.803A2 (Imp.)
Managerial
Scale N 716 716 716
r 0.726 0.803 1A3 (Imp.)
Beh. Man.
Scale N 720 716 720
r 0.321 0.228 0.197B1 (Eff.)
Transform.
Scale N 719 714 718
r 0.254 0.216 0.177B2 (Eff.)
Managerial
scale N 714 714 714
Table 5

100
Inter-scale Correlations for Effectiveness Items (B1 to B3) to All Items
Scale
Statistic
B1
Transformational
Scale (Eff.)
B2
Managerial
Scale (Eff.)
B3 Behavior
Management
Scale (Eff.)
r 0.321 0.254 0.272A1 (Imp.)
Transformational
Scale N 719 714 718
r 0.228 0.216 0.227A2 (Imp.)
Managerial Scale N 714 714 714
r 0.197 0.177 0.323A3 (Imp.)
Behavior
Management Scale N 718 714 718
r 1 0.893 0.805B1 (Eff.)
Transformational
Scale N 723 718 722
r 0.893 1 0.817B2 (Eff.)
Managerial scale N 718 718 718
r 0.805 0.817 1B3 (Eff.)
Behavior
Management Scale N 722 718 722
Phase 2: Questionnaire Distribution and Analysis

101
Questionnaire Distribution and Response Rate
Questionnaires were distributed in accordance to the process outlined in Chapter
2. The response rate was the number of eligible sample members who completed the
survey divided by the total number of eligible sample members (Babbie, 1990; Rea &
Parker, 2005). In SW-PBS schools, 75% of the buildings elected to complete the
questionnaires during staff meetings. In non-PBS schools, 33% elected to complete the
questionnaires during staff meetings.
The response rates at SW-PBS schools ranged from 64% - 100%, for an average
of 93.6%. The response rates at non-PBS schools ranged from 27% - 100%, for an
average of 75.9%. In general, a response rate of 50% is considered adequate, 60% is
considered good, and a response rate of 70% is considered very good (Babbie, 1990).
The percentage rates are reported as follows:
Table 6
Percentage Rates of Respondents by School
SW-PBS Buildings
Questionnaire Number
Completed During
*
Participation
%
Non SW-PBS Buildings
Questionnaire Number
Completed During
*
Participation
%
01 1 78 16 2 77
02 1 96 17 1 96
03 2 64 18 2 97
04 1 85 19 2 71
05 1 100 20 2 90
Table 6 Continued

102
Percentage Rates of Respondents by School
06 1 100 21 2 27
07 1 100 22 2 29
08 1 100 23 1 100
09 1 100 24 1 100
10 1 100 25 1 100
11 1 98 26 2 61
12 2 91 27 1 70
13 1 97 28 2 83
14 2 100 29 2 42
15 2 95 30 2 95
Average % Participation for Building
93.6 Average % Participation for
Building
75.9
* 1 = completed during staff meeting time, 2 = completed on own & returned to secretary
Scale Descriptive Statistics Considerations
The method of data analysis chosen for research questions one and two uses two-
way analysis of variance (two-way ANOVA), which is a subset of the general linear
model (GLM). This method was selected so that simultaneous analysis of the effects of
the dichotomous variables: (1) SW-PBS status (PBS/non-PBS) and (2) Position
(Principal/Certified Staff) as the independent variables, and the six subscales (A1, A2,
A3, B1, B2, and B3) as the dependent variables, could be studied in relation to the two
independent variables separately and together.

103
Two-way ANOVA is based on a set of assumptions: (1) cell sizes are adequate
and relatively well-matched in size (Keppel & Wickens, 2004), (2) between-cell
variances are reasonably equal (Tabachnick & Fidell, 2001), and (3) observations and
responses are normally distributed (Tabachnick & Fidell, 2001). A commonly applied
metric to cell sizes in ANOVA is that each cell should have at least 10 observations and
the largest N should be no more than 10 times the smallest (SPSS, Inc., 2004). Unequal
cell size proportions can be a factor in rejecting the null hypothesis when this is not
appropriate (Ferguson & Takane, 1989; Tabachnick & Fidell, 2001). Since there were
only 30 schools in the study, and therefore only 30 principals (equally divided between
PBS and non-PBS schools) and many certified staff respondents in each school, there was
a large difference in cell sizes between the Principal cells and the Certified Staff cells.
These cell size differences were greater than the 10:1 differential recommended for
ANOVA techniques (SPSS, Inc., 2004). To address this, all principals were retained for
subsequent two-way ANOVA analyses, and a random sample of a smaller number of
certified staff was selected. To select a random sample of certified staff, each observation
was assigned a random number between one and five from the uniform distribution.
Then, all observations with a random number of two or three were chosen to remain in
the analysis dataset, which will be referred to as the reduced dataset (Shannon &
Davenport, 2000). After sampling from the certified staff respondents, the cell size
recommendations were met; with no cell differentials greater than 10:1.
Levene’s test for homogeneity of error (within-cell) variances tests the null
hypothesis that error variances are equal across cells, and in the case of two-way

104
ANOVA, for the interaction term as well. Levene’s test was performed for each of the
six prospective two-way ANOVA’s and the results are shown in Table 7. The cell error
variances were significantly different for the three proposed analyses using scales B1 to
B3 (the effectiveness scales), which violates the ANOVA assumption of homogeneity of
variances.
Table 7
Levene’s Test for Homogeneity of Error Variances (a)
Dependent variable (scale) F df1 df2 Sig.
A1 Transformational Scale (Importance) 1.28280 3 196 0.28148
A2 Managerial Scale (Importance) 0.25425 3 196 0.85824
A3 Behavior Management Scale (Importance) 1.24162 3 196 0.29582
B1 Transformational Scale (Effectiveness) 2.68153 3 197 * 0.04803
B2 Managerial scale (Effectiveness) 2.77273 3 197 * 0.04267
B3 Behavior Management Scale (Effectiveness) 3.27028 3 197 * 0.02231
The design for each test was: Intercept + PBS Status + Position + PBS Status x Position * Cell variances significantly different, alpha=0.05.
Although ANOVA is relatively robust against the assumption that observations be
normally distributed, very large values for skewness or kurtosis may invalidate its use
(Ferguson & Takane, 1989). Relatively large values for skewness and kurtosis for the
three importance scales across all observations made it likely that within-cell and main
effects skewness and kurtosis values might also be large, resulting in a J-shaped
distribution (Ferguson & Takane, 1989). Because within-cell and main effects normality
are assumptions of ANOVA (e.g., Principal and PBS cell, Cert. Staff and Non-PBS cell,

105
etc.), the skewness and kurtosis analyses were reproduced by cell for main effects and for
individual cells (Appendix K, Tables B.viii and B.ix).
Data transformation. The data from Levene’s Test (Table 7) and Tables B.viii
and B.ix showed there were violations of the homogeneity of variance, main effects and
within-cell assumptions for normality of distributions. One method of compensating for
strong deviations from normality is to transform the data, which does not alter its
statistical properties (Ferguson & Takane, 1989; Keppel & Wickens, 2004; Tabachnick &
Fidell, 2001). The transformations chosen for the data were to reflect (reverse the sign of
the skew from negative to positive) and then create the inverse of the scale scores by
dividing each score into 1. When the scales demonstrate similar properties and the
overall distribution pattern is significantly different from a normal distribution, this is a
recommended transformation (Keppel & Wickens, 2004; Tabachnick & Fidell, 2001).
The resulting transformation should provide a more uniform distribution and reduce the
levels of skewness and kurtosis. The scale scores resulting from the transformation were
renamed by adding “(RI)” to denote their subsequent use in this study rather than the
original scale scores.
Data from Tables B.x through B.xii (Appendix J) show the resulting statistics for
overall, main effects and within-cells normality after transformation. No large values for
kurtosis or skewness remain in the overall data for the six subscales after transformation.
Thus, the assumptions for normality were met using the transformed data. Table 7
showed there were violations of the ANOVA assumption of homogeneity of variance for

106
scales B1 – B3. Table B.xii (Appendix J) shows that following transformation no
violations of the assumption of homogeneity of variance remained for scales B1 – B3.
Summary of Descriptive Statistics and Data Transformation
The initial dataset had several characteristics that violated the assumptions for the
proposed two-way ANOVA analysis: (1) for some scales, there was a greater than 10:1
cell size ratio (assumption of relatively equal cell sizes); (2) Levene’s test for
homogeneity of variances showed that there were statistically significant differences in
between-cell variances; and (3) scale skewness and kurtosis values, both across-cells and
within-cells, showed that some cells differed dramatically from normality in their
distributions (assumption of normality). In order to perform the two-way ANOVA tests
required to answer research questions 1 and 2, these violations were addressed.
The cell size differentials were addressed by randomly sampling a smaller set of
observations from the larger (certified staff) group of observations, thereby reducing the
cell-size differentials to an acceptable level of <10:1. To address the normality and
homogeneity of variance violations, the data were transformed by reflecting their
distributions and then taking the inverse of each scale score. Following the
transformation, all overall and within cells normality indicators (i.e., skewness and
kurtosis) were at acceptable levels, and Levene’s tests indicated acceptable equality of
variances. The revised sampling reduced cell differential to acceptable levels and the
transformation addressed the remaining violations of ANOVA assumptions. Following
the transformations, the two-way ANOVA tests were assessed to be appropriate measures
to analyze data associated with research questions 1 and 2.

107
Analysis of Research Questions 1 and 2
All statistical procedures for this phase were conducted using the Statistical
Package for the Social Sciences (SPSS) version 13 (SPSS Inc., 2004). Two-way
ANOVA (also referred to as mixed-model ANOVA) is an appropriate analysis to
simultaneously test the effects of two dichotomous independent variables on a single,
continuous dependent variable, and to test the interaction between the independent
variables (Shannon & Davenport, 2001). All data analyzed were derived from the
transformed data sets. This model fit the purpose of questions 1 and 2 in that there were
two independent variables (position status as a principal or certified staff member, and
PBS status as a SW-PBS or non-PBS school) simultaneously being assessed in relation to
the dependent variable(s) of the six subscales related to principal leadership skills. It is
also appropriate for descriptive studies such as this one.
First, two-way ANOVA was performed for the three Importance (A) subscales
associated with Research Question 1 and then was performed for the three Effectiveness
(B) subscales associated with Research Question 2. The independent variables for all
ANOVA tests were PBS Status (PBS, Non-PBS) and Position (Principal, Cert. Staff).
Tables 8 – 10 show the results for two-way ANOVA tests for the importance subscales.
Research question 1: Leadership skills importance ratings. Research Question 1
is stated as: “Is there agreement between principals and certified staff as to the
identification of key leadership skills associated with proactive environments in SW-PBS
and non-PBS schools?” This question was addressed through three separate analyses
corresponding to the three subscales associated with importance (A1, A2, and A3).

108
There was no statistically significant effect on the mean A1 Transformational
Scale (Importance) for PBS Status, or for Position (main effects). The interaction effect
was also not significant. The adjusted R squared value of .005 indicates that the main
effects and interaction explain approximately 0.5% of the variance in the dependent
variable. Table 8 provides a summary of these results.
Table 8
Two-way ANOVA Results for the A1 Transformational Scale (Importance) (Table is split
for presentation)

109
Source SS (Type III) df MS F Sig.
Corrected Model .146(b) 3 0.049 1.310 0.272
Intercept 62.838 1 62.838 1686.663 0.000
PBS_CODE 0.054 1 0.054 1.441 0.231
POSITION_CODE 0.088 1 0.088 2.367 0.126
PBS_CODE *
POSITION_CODE 0.005 1 0.005 0.142 0.707
Error 7.302 196 0.037
Total 126.129 200
Corrected Total 7.449 199
Source Partial Eta
Squared
Noncent.
Parameter
Observed
Power(a)
Corrected Model 0.020 3.930 0.346
Intercept 0.896 1686.663 1.000
PBS_CODE 0.007 1.441 0.223
POSITION_CODE 0.012 2.367 0.334
PBS_CODE *
POSITION_CODE 0.001 0.142 0.066
(a) Computed using alpha = .05 (b) R Squared = .020 (Adjusted R Squared = .005)
There also was no statistically significant effect on the mean A2 Managerial Scale
(Importance) for PBS Status, or for Position (main effects). The interaction effect was not
significant. The adjusted R squared value of .003 indicates that the main effects and

110
interaction explain approximately 0.3% of the variance in the dependent variable. Table
9 provides a summary of these results.
Table 9
Two-way ANOVA Results for the A2 Managerial Scale (Importance) (Table is split for
presentation)
Source SS (Type III) df MS F Sig.
Corrected Model .101(b) 3 0.034 0.820 0.484
Intercept 66.511 1 66.511 1615.484 0.000
PBS_CODE 0.063 1 0.063 1.519 0.219
POSITION_CODE 0.002 1 0.002 0.057 0.812
PBS_CODE *
POSITION_CODE 0.001 1 0.001 0.036 0.850
Error 8.069 196 0.041
Total 142.012 200
Corrected Total 8.171 199
Source Partial Eta
Squared
Noncent.
Parameter
Observed
Power(a)
Corrected Model 0.012 2.461 0.226
Intercept 0.892 1615.484 1.000
PBS_CODE 0.008 1.519 0.232
POSITION_CODE 0.000 0.057 0.056
PBS_CODE *
POSITION_CODE 0.000 0.036 0.054
(a) Computed using alpha = .05
(b) R Squared = .012 (Adjusted R Squared = -.003)
There was a statistically significant effect on the mean A3 Behavior Management Scale
(Importance) for PBS Status (main effect), but not for Position (main effect). The
interaction effect was also not significant. The adjusted R squared value of .027 indicates

111
that the main effects and interaction explain approximately 2.7% of the variance in the
dependent variable. These results are summarized in Table 10.
Table 10
Two-way ANOVA Results for the A3 Behavior Management Scale (Importance)
Source SS (Type III) df MS F Sig.
Corrected Model .421(b) 3 0.140 2.857 0.038
Intercept 56.849 1 56.849 1157.125 0.000
PBS_CODE 0.299 1 0.299 6.077 0.015
POSITION_CODE 0.011 1 0.011 0.228 0.634
PBS_CODE *
POSITION_CODE 0.021 1 0.021 0.432 0.512
Error 9.629 196 0.049
Total 126.919 200
Corrected Total 10.050 199
Source Partial Eta
Squared
Noncent.
Parameter
Observed
Power(a)
Corrected Model 0.042 8.570 0.678
Intercept 0.855 1157.125 1.000
PBS_CODE 0.030 6.077 0.689
POSITION_CODE 0.001 0.228 0.076
PBS_CODE *
POSITION_CODE 0.002 0.432 0.100
(a) Computed using alpha = .05, (b) R Squared = .042 (Adjusted R Squared = .027)
Summary of research question 1 data analysis. There were no statistically
significant effects associated with the importance subscales of A1 Transformational or
A2 Managerial. There was a statistically significant effect associated with the subscale
A3 Behavior Management by PBS status. Subscale A3 demonstrated an observed power

112
of .678 and an adjusted R squared that accounts for approximately 2.7% of the variance
in the dependent variable of behavior management importance.
Principals and certified staff members in SW-PBS and non-PBS schools were in
agreement as to the importance of transformational and managerial leadership skills.
Findings related to behavior management importance indicate agreement across position
status but a statistically significant difference related to PBS status, with participants
from SW-PBS schools assessing the importance of behavior management skills at higher
rates than those in non-PBS schools. The results of the findings associated with the
statistically significant difference between participants from SW-PBS and non-PBS
schools related to behavior management importance are best viewed with caution given
the reported power of the test as .678.
Two-way ANOVA tests for research question 2. Research Question 2 is stated,
“Is there agreement between principals’ and certified staffs’ rating scores of the evidence
of principal demonstration of the identified key leadership skills in SW-PBS and non-
PBS schools?” Tables 11 - 13 show the results of the two-way ANOVA tests for the
effectiveness scales. The data from Table 11 demonstrate there was no statistically
significant effect on the mean B1 Transformational Scale (Effectiveness) for PBS Status,
or for Position (main effects). The interaction effect was also not significant. The
adjusted R squared value of 0.005 indicates that the main effects and interaction explain
approximately 0.5% of the variance in the dependent variable. There is in fact a high
level of agreement across the main effects.
Table 11

113
Two-way ANOVA Results for the B1 Transformational Scale (Effectiveness) (Table is
split for presentation)
Source SS (Type
III)df MS F Sig.
Corrected Model .106(b) 3 0.035 0.636 0.593
Intercept 38.593 1 38.593 692.133 0.000
PBS_CODE 0.027 1 0.027 0.477 0.490
POSITION_CODE 0.030 1 0.030 0.546 0.461
PBS_CODE *
POSITION_CODE 0.004 1 0.004 0.063 0.802
Error 10.985 197 0.056
Total 85.525 201
Corrected Total 11.091 200
Source Partial Eta
Squared
Noncent.
Parameter
Observed
Power(a)
Corrected Model 0.010 1.907 0.182
Intercept 0.778 692.133 1.000
PBS_CODE 0.002 0.477 0.106
POSITION_CODE 0.003 0.546 0.114
PBS_CODE *
POSITION_CODE 0.000 0.063 0.057
(a) Computed using alpha = .05
(b) R Squared = .010 (Adjusted R Squared = -.005)
Table 12 demonstrates there was no statistically significant effect on the mean B2
Managerial Scale (Effectiveness) for PBS Status, or for Position (main effects). The
interaction effect was also not significant. The adjusted R squared value of .000
indicates that the main effects and interaction are very closely aligned and account for
none of the variance in the dependent variable.

114
Table 12
Two-way ANOVA Results for the B2 Managerial Scale (Effectiveness) (Table is split for
presentation)
Source SS (Type III) df MS F Sig.
Corrected Model .172(b) 3 0.057 1.002 0.393
Intercept 40.567 1 40.567 707.934 0.000
PBS_CODE 0.011 1 0.011 0.184 0.669
POSITION_CODE 0.119 1 0.119 2.078 0.151
PBS_CODE *
POSITION_CODE 0.010 1 0.010 0.175 0.676
Error 11.289 197 0.057
Total 86.718 201
Corrected Total 11.461 200
Source Partial Eta
Squared
Noncent.
Parameter
Observed
Power(a)
Corrected Model 0.015 3.007 0.270
Intercept 0.782 707.934 1.000
PBS_CODE 0.001 0.184 0.071
POSITION_CODE 0.010 2.078 0.300
PBS_CODE *
POSITION_CODE 0.001 0.175 0.070
(a) Computed using alpha = .05 (b) R Squared = .015 (Adjusted R Squared = .000)
The data in Table 13 demonstrate there was a statistically significant effect on the
mean B3 Behavior Management Scale (Effectiveness) for PBS Status (main effect).
There was no statistically significant effect for Position (main effect), or for the
interaction. The adjusted R squared value of .040 indicates that the main effects and
interaction explain approximately 4.0% of the variance in the dependent variable.

115
Table 13
Two-way ANOVA Results for the B3 Behavior Management Scale (Effectiveness) (Table
is split for presentation)
Source SS (Type III) df MS F Sig.
Corrected Model .623(b) 3 0.208 3.805 0.011
Intercept 34.573 1 34.573 633.197 0.000
PBS_CODE 0.365 1 0.365 6.684 0.010
POSITION_CODE 0.029 1 0.029 0.536 0.465
PBS_CODE *
POSITION_CODE 0.003 1 0.003 0.064 0.801
Error 10.756 197 0.055
Total 79.308 201
Corrected Total 11.379 200
Source Partial Eta
Squared
Noncent.
Parameter
Observed
Power(a)
Corrected Model 0.055 11.415 0.811
Intercept 0.763 633.197 1.000
PBS_CODE 0.033 6.684 0.730
POSITION_CODE 0.003 0.536 0.113
PBS_CODE *
POSITION_CODE 0.000 0.064 0.057
(a) Computed using alpha = .05 (b) R Squared = .055 (Adjusted R Squared = .040)
Summary of research question 2 data analysis. The findings associated with
Research Question 2 indicate that both groups (SW-PBS and non-PBS) and both sets of
participants (principals and certified staff) reported similar assessments of principals
related to transformational and managerial leadership skill effectiveness. The findings
also indicated a statistically significant higher assessment of principal leadership skill

116
effectiveness associated with behavior management in SW-PBS schools. The statistically
significant effect associated with the subscale B3 Behavior Management by SW-PBS
status with an observed power of .811 and an adjusted R squared that accounted for
approximately 4.0 % of the variance is indicative of a true difference in relation to the
assessment of principal effectiveness associated with behavior management in SW-PBS
schools.
Analysis of Results for Research Question 3: Job Satisfaction
Research Question 3: “Do certified staff members report higher rates of job
satisfaction in SW-PBS schools than certified staff members report in non-PBS schools?”
Questionnaire item 2-1, “I am satisfied with my job” was re-coded into two groups with
“Strongly Disagree” and “Disagree” grouped as “Less Satisfied”, and “Agree” and
“Strongly Agree” grouped as “More Satisfied.”
With the items dichotomously coded, a z-test of independent proportions was
decided a priori to be an appropriate means to statistically analyze Research Question 3.
The only cell size requirement for a z-test of independent proportions is that cells should
be five or larger. Utilizing the z-test allowed analysis of the original full untransformed
dataset. The z-test is also appropriate for skewed distributions (Ferguson & Takane,
1989) and for a one-tail test (Rea & Parker, 2005), which is indicated by the
questionnaire item, “I am satisfied with my job.” Table 14 shows the N and percentage
for job satisfaction by SW-PBS Status, followed by Table 15, which reports the results of
the one-tailed z-test. Certified staff in SW-PBS schools had a 5.3% higher rate of
reporting job satisfaction than did their non-PBS peers. The z-test P level of .008

117
indicated there is a statistically significant difference in the proportion of certified staff in
SW-PBS schools reporting they are more satisfied with their jobs than those in non-PBS
schools.
Table 14
N and Percentages for Job Satisfaction, by PBS Status
N Percent
PBS Non-PBS PBS Non-PBS
More Satisfied 388 243 93.0456 87.7256
Less Satisfied 29 34 6.9544 12.2744
Total 417 277 100.0000 100.0000
Table 15
Results of Z-test of Independent Proportions of Job Satisfaction, by PBS Status
Proportion PBS
Proportion Non-PBS
Diff. in Proportions df z
z Crit. (1-Tailed Test) P (Sig.)
0.930 0.877 0.053 692 2.389 1.645 0.008
Analysis of Results for Research Question 4: Principal Effectiveness
Research question 4 asked, “Is principal effectiveness identified as a factor related
to higher certified staff job satisfaction in SW-PBS or non-PBS schools?” This question
was analyzed in relation to questionnaire item 2_2 which states, “My principal’s
effectiveness and support has increased my job satisfaction.” This item was re-coded with
“Strongly Disagree” and “Disagree” grouped as “Principal effectiveness did not increase
job satisfaction,” and “Agree” and “Strongly Agree” coded as “Principal effectiveness
did increase job satisfaction.” With the item dichotomously coded, a z-test of independent
proportions was also used to statistically answer research question 4. There was less than

118
a 1% difference between the percentage of certified staff respondents in SW-PBS and
non-PBS schools. A z-test of independent proportions (1 tailed) confirmed there were no
differences between the proportions of SW-PBS or non-PBS certified staff reporting
greater job satisfaction associated with principal effectiveness.
Analysis of Results for Research Question 5: Principal Behavior Management and SW-
PBS Status
Research question 5 asked: “Are principal behavior management effectiveness
and SW-PBS status predictive of job satisfaction?” This question analyzed the
relationship between job satisfaction (DV), principal behavior management effectiveness
(IV1) and SW-PBS Status (IV2). It should be noted that this is a different perspective
from research question 4, which addressed overall principal effectiveness, while this
question specifically examines principal behavior management effectiveness. The
dependent variable, Item 2_1 job satisfaction, has a 4-level Likert-type response set of
Strongly Disagree, Disagree, Agree and Strongly Agree. Since it is a Likert-type item, an
underlying normal distribution is assumed. The data demonstrated no extreme variations
in skewness or kurtosis, indicating there was no extreme deviation from the assumption
of normality for the dependent variables in this linear regression. Since linear regression
is also susceptible to the influence of outliers an a priori decision was made to remove all
cases with standardized residuals having absolute values greater than 2.0 (Keppel &
Wickens, 2004).
Principal behavior management effectiveness had a statistically significant
positive correlational relationship to job satisfaction. SW-PBS Status, when viewed

119
simultaneously (t test) with principal behavior management effectiveness, had a
statistically significant negative correlational relationship to job satisfaction. At the same
time, Beta weights for both variables were positive, indicating each had a positive
correlational effect on job satisfaction independently. In summary, while both IV’s had a
positive effect independently, principal behavior management was the stronger predictor
of certified job satisfaction. The adjusted R squared (coefficient of determination) for
this model is 0.063, which indicates the covariance explains approximately 6.3% of the
variance in the dependent variable.
Table 16
Results of Linear Regression*
Unstandardized
Coefficients
Standardized
Coeff.
B Std. Error Beta t Sig.
(Constant) 3.0374 0.0937 32.4251 0.0000

120
BEHAVIOR_MANAGEMENT
SCALE - EFFECTIVENESS 0.1517 0.0234 0.2498 6.4754 0.0000
PBS CODE -0.1330 0.0448 0.1145 -2.9682 0.0031
* Dependent Variable: Item 2_1 I am satisfied with my job. (a) Computed using alpha = .05, (b) R Squared = .068 (Adjusted R Squared = .063 Job and principal satisfaction in SW-PBS schools. Two questions related to job
satisfaction for SW-PBS staff were included in questionnaire Section IV. The descriptive
statistics of frequency and percent of these respondents are reported below. The numbers
reflect certified staff only. Approximately three times as many respondents reported
being more satisfied with their job since their school had been implementing SW-PBS
(Table 17). Approximately two times as many respondents reported being more satisfied
with their principal’s performance since their school had been implementing SW-PBS
(Table 18). Items 4_7 and 4_8 do uphold earlier analyses of Items 2_1 and 2_2 that
reports of overall job satisfaction are positive in SW-PBS schools, and while the rates of
satisfaction associated with the principal’s performance are not as great, they also
indicate a positive trend. However, the large number of non-respondents suggests these
results should be viewed with caution.
Table 17
N and Frequencies for Item 4_7, More Satisfied with Job (Y/N)
Frequency Percent
Valid
Percent
Cumulative
Percent
No 68 16.3 22.4 22.4 Valid
Yes 236 56.6 77.6 100.0

121
Total 304 72.9 100.0
Missing System 113 27.1
Total 417 100.0
Table 18
N and Frequencies for Item 4_8, More Satisfied With Principal’s Performance (Y/N)
Frequency Percent Valid Percent
Cumulative
Percent
No 90 21.6 30.4 30.4
Yes 206 49.4 69.6 100.0Valid
Total 296 71.0 100.0
Missing System 121 29.0
Total 417 100.0
Phase 3: Demographic Characteristics Related to Schools, Students and Respondents
Demographic Characteristics of Schools and Student Populations
Four primary categories of demographic data associated with schools and
students were utilized through stratified random sampling when identifying schools to be
included in the study’s sample. These categories were free and reduced lunch

122
percentages, ethnic percentages, size of student population, and geographic location. The
following ranges for the schools by category were as follows:
• Free and reduced lunch percentages were 12-77% for SW-PBS schools
(average of 40.73%) and 14-75% for non-PBS schools (average of
42.13%).
• Percentages of students identified as non-Caucasian were 6-98% in SW-
PBS schools (average of 31.07%) and 1-97% in non-PBS schools (average
of 33.07%).
• The numbers of students enrolled were 115-656 (3 small, 7 medium and 5
large for average of 415.33 students) in SW-PBS schools and 198-1070 (4
small, 8 medium, and 3 large for average of 441.67 students) in non-PBS
schools.
• Geographic locations were 4 rural or small towns and 3 mid-size cities
(equaling 7 in lower population regions), 2 city/fringe and 6 cities
(equaling 8 in greater population regions) in SW-PBS schools. For non-
PBS schools, 5 were rural and 4 small town (equaling 9 lower population
regions) and there were 2 city/fringe and 4 cities (equaling 6 in greater
population areas).
Table 19 provides a complete list of these demographic characteristics for all 30
schools. The schools within the sample appear to be well-matched within each of the
four categories, with no outstanding areas of difference that would potentially influence

123
the results from the questionnaire analyses. Therefore, no tests of statistical significance
were calculated for any of the categories.
Table 19 Primary Demographic Characteristics Related to Schools and Students
PBS
Surv
ey #
F/R
Lun
ch %
Ethn
ic %
# St
uden
ts
Enro
lled
Geo
grap
hic
Loca
tion
Non
PBS
Surv
ey #
F/R
Lun
ch %
Ethn
ic %
# St
uden
ts
Enro
lled
Geo
grap
hic
Loca
tion
1.
1
35
06
522
ST
1.
30
39
43
296
R
2. 2 59 98 431 C 2. 19 64 97 666 C/F
3. 3 12 08 456 C/F 3. 26 20 01 435 C/F
4. 4 53 09 115 R 4. 24 50 13 239 ST
5. 5 60 06 135 R 5. 17 53 06 198 R
6. 6 17 20 505 C/F 6. 27 27 17 870 C/F
7. 7 23 21 432 C 7. 18 22 25 417 C/F
8. 8 41 75 330 C/F 8. 16 43 41 341 R
9. 9 52 25 329 C/F 9. 25 48 24 334 ST
10. 10 17 22 420 C 10. 21 27 13 462 C/F
11. 11 43 08 577 ST 11. 23 49 12 330 ST
12. 12 43 28 656 MSC
12. 29 42 33 1070 ST
13. 13 63 49 439 C/F 13. 22 59 58 351 R
14. 14 77 66 227 MSC
14. 20 75 72 371 C
15. 15 17 26 656 MSC 15. 28 14 41 245 R

124
Geographic Location Codes: R = Rural, ST = Small Town, C = City, C/F = City Fringe, MSC = Mid-Sized City * = School has been in existence 2 years
Information related to five other categories of demographic characteristics was
collected and included numbers of certified staff, percentages of schools meeting annual
yearly progress (AYP) goals associated with Communication Arts and mathematics,
attendance rates, and percentages of students identified with disabilities and specifically
with emotional behavioral disorders (E/BD). While these categories were not utilized in
the sample selection process, a decision was made to collect the data and analyze it to
assure there were no areas of outstanding differences associated with them that might
influence the results from the questionnaire. The numbers of certified staff reflect the
2005-2006 school year. AYP information is reported in terms of the numbers of years
out of the past four that each school met their goals for Communication Arts and
mathematics. The percentages reported for attendance rates reflect a 3-year average. The
information related to disability percentages is for the 2005-2006 school year. These data
are summarized in Tables B.xiii through B.xvii. in Appendix L. A summary of the data
from the tables is as follows:
• Ten of the 15 comparisons for numbers of certified staff were in a 10%
range, 1 was within 15%, 1 was within 17%, and 3 ranged from 24-30%.
• One SW-PBS school and one non-PBS school did not meet AYP goals
associated with Communication Arts for the last four years.
• One SW-PBS and one non-PBS school failed to meet the AYP goals
associated with Mathematics during the last 4 years.

125
• The range of attendance averages for the past 3 years for SW-PBS schools
was 94.1-96.2%, and for non-PBS schools was 94.6-96.1%
• The percentage range of students identified with a disability for SW-PBS
schools was 9.6-31.7, yielding an average of 17.5. The percentage range
for non-PBS schools was 8.4-32.2, yielding an average of 15.7.
• The percentage ranges associated with students qualifying for special
education with a diagnosis of E/BD ranged from 0-2.4 for SW-PBS
schools and 0-1.4 for non-PBS schools.
The information available from DESE associated with rates of referrals for major
discipline offenses was inconclusive in that schools only report the most major offenses
that result in removals of 10 or more days cumulative or consecutive. The overall
information associated with rates of discipline referrals directly available from the
schools either lacked uniformity and was not comparable, or was not available.
Summary of demographic characteristics related to schools sampled. Across the
eight demographic characteristics reported, the schools and student populations appear to
be relatively well-matched, with no outstanding categories of differences. Therefore, no
tests of statistical significance were calculated for any of the eight categories.
Demographic Characteristics of Sample Respondents
The demographic characteristics of respondents were disaggregated by PBS status
and by multiple demographic characteristics. The characteristics are reported in detail in
Appendix L (Tables B.xviii – B.xxiv). The following tables provide a summary of the
most salient results and demonstrate the two samples were well matched.

126
Table 20
Demographic Characteristics of Sample Respondents by Sex, Ethnicity, Current Position
and Highest Degree Earned
Characteristic SW-PBS Non-PBS
Male 09.2 7.5
Female 90.8 92.4
Caucasian 95.2 89.7
Non-Caucasian 04.8 10.3
General Education Teacher 65.8 68.0
Special Education Teacher 12.4 11.3
Principal 03.1 05.2
Other Certified Staff 18.6 15.5
Bachelor’s = Highest 26.7 39.7
Master’s = Highest 63.2 53.4
Above Master’s 10.1 06.9
Summary of demographics related to questionnaire respondents. There do not
appear to be any categories of demographic data related to questionnaire respondents that
would potentially influence the results of questionnaire data analyses. The respondents
appear to be well-matched across all categories of data collected. Therefore, no tests of
statistical significance were calculated.

127
Phase 4: Case Studies
Case Studies Results
Results related to SET and focus interviews. As previously stated in Chapter 2,
the leadership teams from the three SW-PBS elementary schools demonstrating the
highest overall ratings associated with principal leadership skills effectiveness were
invited to participate in follow-up interviews. The purposes of the interviews were to (a)
expand on information related to successful principal leadership found on the Principal
Leadership Skill Questionnaire, and (b) determine if team members shared any insights
that might further elucidate what outcomes related to leadership skills they associated
with SW-PBS implementation.
The SET results for the three schools confirmed they met criteria to be classified
as SW-PBS schools that were implementing with fidelity. The SET data for School 1
indicated a score of 80% on “Expectations Taught” and 100% on all other categories,
with an overall average of 97%. The SET data for School 2 indicated an 83% score for
“Response to Problem Behaviors” with an overall average of almost 100%. The SET
data for School 3 indicated an 88% rating associated with “Expectations Defined” and
100% ratings for all other categories, yielding an overall average of 98%.
The protocols for reviewing, recording and analyzing the focus interviews were
followed as reported in Chapter 2. Consistency, communication, and more positive
outcomes for students were the major categories that emerged across schools and
responses to the interview questions in relation to implementation of SW-PBS. Shared
leadership, vision guiding, principal supportiveness, and dedication of resources were

128
major themes that emerged regarding principal leadership as summarized in Tables 21-
26. No suggestions were given by any participants for Question 6, asking for other items
or questions to add to the focus interview.
Table 21
Focus Interview Question 1: Job Satisfaction
What, if any, factors related to implementing SW-PBS have increased teacher job
satisfaction in your school?
School 1 School 2 School 3 Primary Categories
Common language
and goals
Fewer behaviors
Consistent
expectations across
settings and in
classrooms
Paras and everyone
know SW-PBS
Common language
All trained together
as a staff so all
knew common goals
New teachers get a
mentor to teach
them about SW-
PBS
Same expectations
throughout whole
building
Lessons in staff
handbook encourage
us to be on same
goals at same time
Common language
Common Language
Everyone trained to
use SW-PBS
Common goals
across everyone and
every setting

129
Table 22
Focus Interview Question 2: Improved Student Behavior
What, if any, factors related to implementing SW-PBS have improved student behavior in
your school?
School 1 School 2 School 3 Primary Categories
They understand
what is expected
It is consistent
We highlight the
same skills in each
setting
We celebrate their
success
We’re teaching
them the same
things
We have a whole
system at beginning
of year to teach
them and then
throughout the year
to remind and
reinforce
We model them
Using a positive
approach
The incentives to do
the right thing
All the staff buys
into it now
Consistency in:
- Expectations
- Teaching
them
- Using a
positive
approach

130
Table 23
Focus Interview Question 3: Improved Behavior in Students At-risk for or Identified with
E/BD
Do you find these have also been associated with improved behavior in students who are
considered to be at-risk for or already have been identified through special education for
emotional or behavioral disorders?
School 1 School 2 School 3 Primary Categories
Yes. Better
communication with
parents and among
staff has helped
them.
Consistency and
common language
across settings do,
too.
Yes. We don’t have
a lot of serious
behavior problems.
We teach them all
day every day what
to do.
Using the positive
approach builds
relationships with
them.
Yes. We are all
consistent and the
principal gives
incentives to them
to do well.
We use the
universals, but also
have mentors for
them and small
groups as needed.
We want to be more
proactive.
Better
communication
among all
stakeholders.
Consistency and
common language
help them.
Incentives and
positive recognition.

131
Table 24 Focus Interview Question 4: Changes in Principal Leadership Style
What, if any, changes in your principal’s leadership style do you believe might be
associated with implementing SW-PBS?
School 1 School 2 School 3 Primary Categories
She initiated it and
has gradually turned
over leadership
responsibilities. She
is always in contact
with us informally
but lets us lead
decisions about what
we need now.
Maybe or maybe not
PBS. She’s good at
keeping the
communication
going and uses PBS
as part of guide for
her walk-through
observations in
classrooms.
Yes – very child-
centered and set
a tone for all that
is positive.
Think this
increased
because of PBS.
More of a team
member than
leader now.
More shared
leadership.
Leader gives vision
and guidance, but lets
team lead.
More effective
communication.
Didn’t so much
change principals as
enhanced positive
attributes.

132
Table 25
Focus Interview Question 5: Other Principal Changes
Are other changes in principal that might be associated with implementing SW-PBS?
School 1 School 2 School 3 Primary Categories
Better at dedicating
monies and time
now.
She gives helpful
feedback and is
supportive of the
process.
More supportive of
staff trainings and
time for committees.
Overall improved
supportiveness.
Better at dedicating
resources to PBS.
Table 26
Summary of Major Themes by School
School 1 School 2 School 3
Consistency and
communication
PBS is now second nature
Positive outcomes for all
kids
Continuum of supports
Principal supports, lets us
lead
Principal dedicates time &
resources for PBS
Consistency and
communication
Veteran PBS building & do
things as a matter of course
Like the positive outcomes
for all children it has
encouraged
Principal actions/behavior
Maybe or maybe not
associated with PBS
Consistency and
communication
Veteran building so just the
way we do things now
Leader guides vision but
allows teachers to lead
Dedicates resources.

133
Results related to office discipline referrals. School 1’s overall number of office
discipline referrals (ODR) per year has dropped from 378 during year 1 to 149 at the
close of the 05-06 school year, for a 61% reduction. School 2’s overall ODR has dropped
from 285 during year 1 to 103 at the end of the 05-06 school year, for a 64% reduction.
School 3’s total number of referrals has dropped from 760 during year 1 to 214 at the end
of the 05-06 school year, for a 72% reduction. As previously discussed in Chapter 2,
information from ODR may be viewed as one indicator to assess the adequacy and/or
impact of implementing procedures to improve behavior management. Because there
was a standard method of collecting and assessing ODR across these three schools
through the School-wide Information System (SWIS) (May, et al., 2000) this provided a
common metric of comparison.
Triangulation of results from case studies. The primary themes as summarized
below will be matched to questionnaire items identifying similar skills by item numbers
listed in parentheses. The results from the focus interviews supported the findings from
the questionnaire in their emphasis on consistency (12, 13, and 30), communication (15,
29, and 31), shared leadership (3, 11, 21, 22, and 24), principals’ providing access to
resources to support implementation of the SW-PBS process (9, 19, and 26), principals’
vision guiding (2, 22, and 25), and principals’ support of the team process(23 and 24).
The consensus across the teams appears to suggest that rather than SW-PBS changing
principals, it enhances characteristics and skills already in evidence.

134
Schools 1 and 2 are beginning their 5th year of SW-PBS and have had the same
principal throughout. School 3 is beginning its’ 6th year of SW-PBS, has had 2 principals
during the first 5 years, and is beginning the current school year with their 3rd principal.
Staff at each school commented that it is now integrated so well into the school’s
operating procedures that they regard it as “just the way we do business” and “its second
nature to us now.” The high scores on the SET assessments appear to support the
perceptions and comments of the staff members. The overall ODR rates have dropped
significantly at all three schools. The leadership team members did not address this
directly, but did report that there are positive outcomes for all students from
implementing SW-PBS.

135
CHAPTER IV
DISCUSSION
The purposes of this four-phase study were to (a) identify key principal leadership
skills associated with socially proactive school environments, in relation to principal
transformational, managerial, and behavior management skills, through a systematic
review of the professional literature and development of a questionnaire instrument to
assess the identified skills (Purpose 1, Phase 1): (b) examine the relationship between
SW-PBS implementation and increased evidence of those skills through the
administration of the questionnaire to certified staff and principals in 15 SW-PBS schools
and 15 non-PBS schools (Purpose 2, Phase 2): (c) examine the relationship between
evidence of those skills and improved certified staff job satisfaction through
questionnaire items analyses and examination of demographic variables associated with
the schools and respondents participating in the study (Purpose 3, Phase 3): and (d)
examine leadership skill variables associated with SW-PBS and recommendations from
the field that support increased certified staff job satisfaction, effective student behavior
management and principal leadership skill acquisition through the alignment of
questionnaire and case studies results (Purpose 4, Phase 4).
An overarching purpose of the study was to initiate a line of research associated
with principal leadership and SW-PBS. Principals’ need for appropriate training and
support associated with proactive behavior management, particularly in relation to
students at-risk for or identified with E/BD has been well documented in the literature
(Crockett, 2002; Goor & Schwenn, 1997; Marzano, et al. 2005; Patterson & Protheroe,

136
2000; Powell & Hyle, 1997; Sirotnik & Kimball, 1994; Taylor & Baker, 2002). SW-PBS
has demonstrated promise in addressing these needs (Horner, et al. 2005; Luiselli, et al.
2005; Stormont, et al. 2005; Taylor-Greene, et al.1997; Walker & Horner, 1996). If SW-
PBS is to be utilized in relation to pre-service and in-service training for principals in
leadership skills associated with establishing and maintaining proactive social/behavioral
school environments, it is imperative to identify which specific leadership skills are most
salient. Second, it is prudent to assess what knowledge and skills have already been
established as effective and to build from that base.
The literature across the three domains of transformational, managerial, and
behavior management presented in Chapter 2 and the results from the four phases of this
study are congruent. There are specific principal leadership skills that are supported by
the literature and valued by certified staff and principals. The principals’ implementation
of the skills as assessed in this study varied, with the largest variance associated with
behavior management effectiveness. This is also the set of skills most directly related to
increased certified staff job satisfaction. The literature has pointed to the need for more
and better training in this area, as have principals’ self-reports. When considering how to
bridge the research-to-practice gap that is often cited in the literature (Abbott, Walton,
Tapia, & Greenwood, 1999; Gottfredson & Gottfredson, 2001; Klinger, et al. 2001;
Marzano, et al. 2005; Sugai & Horner, 1999; Young, et al. 2002), it is imperative to
consider the results from studies such as this, albeit descriptive, that give information and
insight into the attitudes and needs of practitioners.

137
This was an exploratory study, designed to identify which principal leadership
skills associated with socially proactive school environments were upheld by the
literature and validated by practitioners in the field. It was also designed to assess what,
if any, impact SW-PBS training and implementation had in relation to the evidence of
increased principal leadership skills.
Three domains of principal leadership emerged as most closely aligned with those
of socially proactive school environments: transformational, managerial, and behavior
management. The domains of transformational and managerial leadership have
established bases of research and traditions of implementation to support their efficacy
(Cotton, 2003; Hallinger & Heck, 1998; Leithwood, et al. 2004; Marzano, et al. 2005;
Valentine, 2001). Principal leadership related to behavior management has been the
subject of fewer studies and lacks an agreed-upon set of skills to be researched in relation
to assessing their efficacy or their fidelity of implementation. School-wide PBS has
demonstrated promise in supporting principals to establish school environments that are
supportive of all staff and students. There are also specific principal leadership skills
recommended through SW-PBS literature and training that include (a) ones also
recommended through transformational and managerial sources, and (b) ones specifically
associated with behavior management (Colvin & Sprick, 1999; Horner, et al. 2005; Lewis
& Sugai,1999). However, the lack of empirical research associated with the
recommendations regarding leadership and SW-PBS is problematic. Studies such as this
are imperative if SW-PBS recommendations associated with principal leadership are to
be trustworthy. SW-PBS’s demonstrated promise in increasing principal behavior

138
management leadership skills is upheld by the results from this study, particularly related
to the higher rates of principal behavior management leadership skills effectiveness and
the increased rates of certified staff job satisfaction in SW-PBS schools as compared to
non-PBS schools.
Multiple steps were taken to: (a) identify key leadership variables, (b) assure
adequate sample sizes, (c) follow well-established procedures while conducting the study,
(d) develop an instrument based on validated skills, content and constructs, (e) report
results utilizing established statistical and descriptive procedures, and (f) report outcomes
based on effect sizes results and power when applicable. In this way, future researchers
may utilize the results for replication studies. The results are reported in relation to the
research questions asked and the phases and purposes of the study to adequately uphold
its’ social validity. Limitations of the study, implications for practice, and
recommendations for future research are presented in the final sections of the chapter.
Development and Psychometric Properties of the Principal Leadership Skill
Questionnaire
The evaluation of the importance and evidence of the 31 principal leadership
skills associated with the domains of transformational, managerial, and behavior
management in SW-PBS and non-PBS schools served as the foundation for the structure
and contents of the Principal Leadership Skill Questionnaire (Appendix A). These skills
are associated with the establishment of proactive school environments capable of
supporting all staff and all students (Copland, 2001; Horner, et al. 2005; Leithwood &
Jantzi, 1997; Lewis & Sugai, 1999a; Lucas & Valentine, 2002). Given that this

139
questionnaire was the first to examine these skills in tandem, and more specifically to
include skills directly associated with behavior management, it was important to examine
its validity if the results were to be accepted with confidence.
Prior research and survey results have examined the effects of various numbers
and combinations of these skills in relation to teacher/staff satisfaction, effective school
climates and cultures, student success, and establishment of safe and orderly school
environments (Gottfredson & Gottfredson, 2001; Heck, 1992; Leithwood & Jantzi, 2000;
Leithwood, et al. 2004; Newmann, Rutter, & Smith, 1989). The results of the surveys
indicated varying degrees of positive relationships between principal/administrator usage
of the skills and improved outcomes for staff and students.
The identification and cross-referencing of the 31 skills to those reported through
professional literature as being most representative of the three domains ensured a sound
basis for their selection. Guidelines for survey research in general and for questionnaires
assessing principal leadership skills were identified through (a) reviewing texts and
resources outlining steps in the survey research process and (b) reviewing questionnaire
instruments utilizing a similar Likert-scale format. Next, the proposed instrument was
reviewed by an expert in SW-PBS, an expert in principal leadership, and two survey
development experts. Their suggestions related to overall format, layout of sections, and
clarity of wording of items were incorporated. The statistical analysis of the six subscales
indicated a strong positive association among each set of subscales and that the two sets
of subscales were measuring different variables.

140
The overall content and construction of the questionnaire demonstrate its’
acceptability for the assessment purposes outlined in this study. The items were based on
a substantial body of literature from peer-reviewed sources across general education and
special education sources. It was important to review sources from both fields given that
(a) each are invested in successful outcomes for principals, staff and students and (b)
each have a unique perspective that can complement the other.
Questionnaire Distribution and Analysis Considerations
A series of steps were followed to identify schools to participate in the study. To
assure that schools implementing SW-PBS with fidelity were accurately identified, a set
of a priori decisions regarding what constituted implementation fidelity was established.
The 15 elementary SW-PBS schools selected met all indicators. Fifteen comparison
schools also met all indicators. This provided a sample that could be assessed with
confidence in terms of meeting the purposes of the study.
Considerations Related to Leadership Skill Importance
Leadership skill importance ratings for transformational skills indicate
respondents from SW-PBS schools ranked 7 of the items higher than did those from non-
PBS schools. The differences, however, were small (less than .1) per item. These
findings support those of multiple researchers within the field of principal leadership
(Hallinger & Heck, 1998; Leithwood & Jantzi, 1997; Lucas & Valentine, 2002), and
suggest that staff as well as principals value skills 1-11 as being important indicators of
principal leadership.

141
The respondents were in relative agreement across school status and position
regarding the importance of managerial leadership skills as well. Respondents from SW-
PBS schools ranked 6 of the 8 items higher than did those from non-PBS schools.
However, the responses for these items were across a very small range, with only .103
separating the highest from the lowest, indicating not only high levels of agreement but
highly congruent assessments of the importance of each item. These findings also
support previous research and indicate schools that are well-managed in relation to the
day-to-day operating procedures are highly valued by certified staff and principals
(Copland, 2001; Leithwood & Duke, 1999; Valentine, 2001).
Behavior management importance demonstrated differences across groups related
to SW-PBS status. Although the observed power for this test was .678, two trends within
the results bear consideration: (1) SW-PBS respondents assessed all 12 items at higher
rates than did those in non-PBS schools, and (2) the range of responses across items in
non-PBS schools was larger than in SW-PBS schools. The fact that respondents in SW-
PBS schools ranked all of these items more highly than did those in non-PBS schools
indicates a trend toward a higher valuing of these leadership skills, as does the smaller
range of scores within this group. This finding is logical in that SW-PBS personnel are
more likely to have been exposed to and systematically trained in principles of effective
behavior management. Additionally, these respondents are associated with schools
verified to have established working systems of SW-PBS through the initial selection
process for inclusion in this study.

142
These results may be useful in forming an overall assessment of the effects of
implementing SW-PBS rather than specifically pointing to a significant difference
between the groups. The overall average for the rating of scores for all respondents
associated with behavior management is closest to the response “strongly agree.” The
results of this subscale also support prior research which emphasizes the importance of a
safe, orderly, and socially proactive school environment (Lewis, et al.1998; Liapsun, et
al. 2004; Luiselli, et al. 2005; Scott, 2001; Sugai & Horner, 2001).
All item ratings associated with importance through the subsets of
transformational, managerial, and behavior management skills were high. The
respondents’ ratings indicate each of these skills truly is viewed as important. These
ratings substantiate the professional literature associated with the importance of these
principal leadership skills across the three domains. There does not appear to be a
research to practice gap across these three domains, but rather a strong agreed upon
foundation on which to move forward.
Considerations Related to Leadership Skill Effectiveness
When reviewing the results in relation to the descriptive statistics of SW-
PBS status by item for the transformational effectiveness subscale, SW-PBS school
principals received higher ratings for each item. Although the results for this test were
not statistically significant, they support the aforementioned trend of higher favorability
related to SW-PBS across questionnaire items, which bears consideration. When
reviewing the results in relation to the descriptive statistics of SW-PBS status by item for
the managerial effectiveness subscale, SW-PBS school principals received higher ratings

143
on 5 of the 8 items. This would indicate the overall results related to principal
managerial effectiveness are more mixed than those associated with transformational
effectiveness.
The principal behavior management effectiveness subscale demonstrated the most
significant statistical difference of the six subscales, and supports the premise of SW-PBS
literature that principal/administrative support is a key component of establishing socially
proactive school environments (Lewis & Sugai, 1999a; Scott & Hunter, 2001; Sugai, et
al. 2004). Given the observed power of the test was .811; the results can reasonably be
accepted as detecting a true relationship. These results establish that, in relation to this
study, there is a significant positive difference in the assessment of certified staff and
principals as to the overall effectiveness of principals in exhibiting skills related to
behavior management in SW-PBS schools. This is in keeping with previous descriptive
reports from SW-PBS schools (Colvin & Sprick, 1999; Horner, et al. 2000; Taylor-
Greene & Kartub, 2000). These results are also supported by individual item results
within the subscale. Principals in SW-PBS schools were assessed at higher rates on all
items. This is also in keeping with the results of the Principal Leadership Skill
Questionnaire in that (a) the 31 identified skills were highly rated in terms of importance
for staff and principals in SW-PBS and non-PBS schools and (b) ratings of skills related
to transformational and managerial effectiveness were relatively equal for SW-PBS and
non-PBS schools but differed significantly in terms of behavior management skills.
Summary of results related to skill importance and effectiveness. The results of
the three tests of subscales associated with principal leadership importance indicate those

144
skills associated with transformational and managerial leadership are assessed at
relatively equal levels across SW-PBS status and position. The small statistically
significant difference related to behavior management, while noteworthy, should be
viewed in context with its relatively low power.
The results of the three tests of subscales associated with principal leadership
effectiveness indicate that principals and staff assess the effectiveness of principals in
relation to transformational and managerial skills as relatively equal in SW-PBS and non-
PBS buildings, but that principals in SW-PBS buildings demonstrate greater effectiveness
in relation to skills associated with behavior management.
When considering the results of the six subscales in tandem, patterns of responses
are evident. First, items across the 3 importance subscales received very high ratings,
indicating that most respondents value these 31 leadership skills. Second, while the
responses across the same items in relation to principal effectiveness were not as high,
the lowest rating was 3.807. This indicates responses overall were most closely aligned
with the descriptor “is effective.” While this implies room for improvement, it also
implies that principals’ demonstration of leadership skills overall is satisfactory. Third,
the lowest rating on an individual item was within the behavior management
effectiveness subscale (“supports/recognizes staff who implement proactive behavior
management plans”). The item was rated lowest by SW-PBS and non-PBS respondents,
and is worthy of emphasis. This same item was rated substantially higher in terms of
importance by both groups. If certified staff members are to be supported in their efforts

145
to implement proactive behavior management plans and techniques, administrator
support is imperative.
Demographic Information
Information related to demographic characteristics associated with the schools,
student populations, and the respondents was collected and compared to rule out
potentially confounding variables associated with the results of this study and is aligned
with Purpose 3. The school and student demographics related to F/R lunch percentages,
percentages of minority students, size of student population, geographic location of
schools, percentages of students identified for special education services in general and
E/BD specifically, and AYP status for communication arts and mathematics
demonstrated no areas of outstanding differences that would potentially influence the
results of the analysis.
Information related to demographic characteristics of the respondents yielded no
areas of difference greater than 6% across the following categories: gender; race; highest
degree earned; percentage of staff currently employed as general education, special
education, and/or principal staff; and years of experience associated with general
education, special education, and/or principal positions. No demographic variables
associated with the schools, student populations or respondents appeared to confound the
results of the study. The groups are well-matched.
Certified Staff Members’ Job Satisfaction Rates
The SW-PBS respondents reported a statistically significant higher rate of
satisfaction compared with the non-PBS respondents. The literature from

146
transformational, managerial and SW-PBS sources has emphasized a direct positive
effect on teacher job satisfaction from the implementation of leadership skills associated
with these domains, and is substantiated by the results from this study (Day, 2000;
Guthrie, 2002; Hallinger & Heck, 1998; Lashley & Boscardin, 2003; Lucas & Valentine,
2002; Nelson, 1996; Netzel & Eber, 2003; Walker & Horner, 1996).
The value add of SW-PBS appears to account for the difference in the job
satisfaction rates as reported above. Given that concerns related to student behavior
management and establishment of safe and orderly school environments are associated
with teacher job satisfaction (Charles, 1999; Johnson & Birkeland, 2003; DiPaola &
Walther-Thomas, 2003), the direct training in establishing socially proactive school
environments and strategies to reduce problem behaviors provided through SW-PBS is a
logical connect-point to increased job satisfaction by certified staff. Other factors
associated with SW-PBS that are supported through the literature as increasing job
satisfaction are: (1) principals actively participating in professional development
initiatives (Cotton, 2003; Yoon & Gilchrist, 2003), (2) principals consistently
collaborating with staff on the implementation and assessment of school initiatives
(Lucas & Valentine, 2002; Marzano, et al., 2005), and (3) general principal support for
the day-to-day challenges staff members face (Horner, et al., 2005; Lewis & Sugai,
1999b; Waters, et al., 2003).
While it would be presumptive to hypothesize what specific factors associated
with SW-PBS account for the disparity in ratings of certified staff job satisfaction, the
statistically significant difference found through item 2_1, “I am satisfied with my job,”

147
as well as the information provided through sources as outlined above, appears to uphold
the identification of SW-PBS implementation as a factor in job satisfaction.
Job Satisfaction and Principal Effectiveness
The z-test of independent proportions utilized to analyze this question
demonstrated there was no statistically significant difference between the respondents in
SW-PBS or non-PBS schools. In fact, the results were very close with SW-PBS
respondents reporting a .7957 rating and non-PBS respondents reporting a .7903 rating.
While the majority of certified staff respondents across the samples did agree that
principal effectiveness increased their job satisfaction, SW-PBS status does not appear to
influence their assessments of principal effectiveness.
Job Satisfaction, Principal Behavior Management Effectiveness, and PBS Status
Research question 5 extends the exploration of research question 4 by directly focusing
on principal behavior management effectiveness. When job satisfaction was utilized as
the DV, and the behavior management effectiveness scale and SW-PBS status were used
simultaneously as the IV’s, the results indicated a statistically significant positive
relationship for principal behavior management effectiveness and a statistically
significant negative relationship for SW-PBS status. When SW-PBS status had been
analyzed previously in relation to certified staff job satisfaction, it demonstrated a
statistically significant greater proportion of SW- PBS respondents were satisfied with
their jobs. The results of these two findings taken together indicate that while SW-PBS
status increases job satisfaction, it is secondary to, and in fact decreases in relation to
effective principal behavior management’s influence on certified staff job satisfaction.

148
These results are in alignment with the literature that emphasizes the strong relationship
between teachers’ job satisfaction and their perceptions of administrative support
regarding student discipline and inclusion of students with diverse needs (Charles, 1999;
Johnson & Birkeland, 2003; Learning First Alliance, 2005; Noell & Witt, 1999; Richards,
2005; Walter-Thomas & Bryant, 1996; Yoon & Gilchrist, 2003). More specific and
targeted training for principals related to SW-PBS and leadership might increase their
demonstration of these skills, thereby making their influence more apparent.
Job and principal satisfaction in SW-PBS schools. The results of the two
questions associated with job and principal satisfaction for SW-PBS certified staff
members in questionnaire section 4 reinforce patterns of responses previously identified
in that: (a) certified staff reported significantly larger percentages associated with
increased job satisfaction than not and (b) there were larger percentages of responses
associated with increased principal satisfaction, but not to the same degree as those
reported for job satisfaction. The results are reported to potentially extend the findings
above. When asked these questions specifically within their assessment of the SW-PBS
process section of the questionnaire, respondents reaffirmed the patterns from
questionnaire section 2, thereby reinforcing the patterns of responses already identified.
Considerations of the results associated with principal effectiveness, job
satisfaction, and SW-PBS status. It is conceivable that SW-PBS certified staff do not
perceive as direct of a connection between SW-PBS implementation and principal
effectiveness because: (a) SW-PBS emphasizes a leadership team approach whereby the
principal is a member rather than the leader, (b) the empowerment of certified staff to

149
assume leadership roles associated with decision-making regarding student behavior
management issues may decrease the likelihood that staff would directly associate
increased principal behavior management effectiveness with SW-PBS, and (c) to date
there have not been targeted trainings for SW-PBS principals associated with increasing
their leadership effectiveness and role in behavior management.
Results Associated with Case Studies
The major themes from the interviews reinforced rather than expanded earlier
findings. Respondents identified the following: (a) factors associated with common goals
and language and school-wide training as increasing their job satisfaction, (b) factors
associated with consistency in school expectations and teaching them and using a positive
approach as improving behavior of all students, including those with more significant
needs, and (c) the principals now shared leadership more and provided resources more
readily, but overall it didn’t so much change principals as enhanced skills team members
already perceived as in evidence.
Taken together, the interview results and archival data support the high ratings of
the principals on the Principal Leadership Skill Questionnaire. These are schools in
which day-to-day operations appear to be running smoothly, rates of discipline referrals
have fallen dramatically, the team members are empowered to help lead the SW-PBS
process, and the principals actively support and participate in the process. These results
relate to questionnaire items included in the subscales and reinforce their value to school
personnel.

150
Limitations of the Study
This study was descriptive in nature in that no variables were directly manipulated
and the results are based on respondents’ self-reports. While this was appropriate to
begin the establishment of a line of research and to tentatively inform the field (Stichter
& Conroy, 2004; Thompson, et al. 2005), results should be viewed with some caution.
They can best be interpreted as establishing some tentative relationships between SW-
PBS and principal leadership skills.
A second limitation is associated with respondents’ characteristics. First, the
sample of respondents represented one geographic area (the state of Missouri). Second,
respondents from SW-PBS schools were trained through a set of modules sanctioned by
the state that might not match the training procedures of other areas or states. Third, the
criteria established to identify schools as implementing SW-PBS with fidelity might vary
from those deemed as indicative of fidelity in another sample. Finally, although the
demographic characteristics of the schools and respondents included were described in
detail, those within another sample might vary enough to confound the replicability of the
study.
Consideration should also be given to the large sample size in relation to the
statistical outcomes. This is a potential limitation when considering how much credence
should be given to those variables that yielded statistically significant results. Although
the pattern of results across research questions suggests the variables that demonstrated
statistical significance were reliable, the effects should still be viewed with appropriate
caution.

151
A reality and potential limitation of any research in applied settings such as
schools is the recognition that permission must be obtained to conduct the study. In this
study, the principals who granted permission were also cognizant they were the subjects
of inquiry. It is possible that the principals who agreed to allow their schools to
participate were also stronger principals in general who were more confident that their
staff members’ assessments would be favorable.
Another limitation applies to the questionnaire instrument developed for the
study. Given that the instrument was developed for this study, there are no prior studies
to support its efficacy. While content validity, internal reliability and construct validity
were addressed, the use of the instrument would require repeated applications before
these could be truly substantiated. The external validity of the instrument should be
addressed through replication of the study as well as assessment of the potential use of
the instrument in relation to principal leadership skills, certified job satisfaction, and
student behavior management by practitioners in applied settings (Simpson, 2004).
Implications for Practice
Several implications can be derived from this study for professionals associated
with principal leadership training. First, the results uphold the literature in that principal
leadership skills across the three domains of transformational, managerial, and behavior
management were all assessed at high rates of importance. Principal pre-service and
in-service programs should incorporate specific training across all three domains if
principals are to be adequately prepared to meet the challenges of their positions.
Second, principal behavior management skills were not only identified as important but

152
were definitive across the analyses within this study as being most significant. The
literature review provided multiple examples of the importance of these skills to
principals and to certified staff in relation to job satisfaction, student management, and as
an indirect link to student achievement. This is an area upheld by researchers and
practitioners as critical, and should be the focus of increased emphasis to provide
principals with not only training, but active support in the field.
Principals face challenges unique to each setting in which they lead. Ongoing
supports through SW-PBS are warranted to assist principals in assessing specific features
within their schools and what kinds of behavior management skills and interventions
would best fit specific environments. Principals have reported a need for more training
associated with students with diverse learning needs and social skills deficits, special
education law, and supporting effective interventions (DiPaola & Teschan-Moran, 2003;
Monteith, 2000; Patterson, et al. 2000; Praisner, 2003. It is incumbent upon both
principal leadership and special education training programs to provide these.
Implications for Future Research
The high level of agreement across all respondents in this study indicates the 31
leadership skills are highly valued and are worthy of continued research. If the skills
were more clearly operationalized in terms of specific actions principals exhibit it could
assist researchers and instructors in leading principals toward a more thorough
understanding of how best to utilize them. It could also help principals to self-reflect on
their progress. For instance, skill #1 states “Leads staff in establishing a school vision.”
This could be interpreted in multiple ways. More sophisticated research efforts focused

153
on identifying specific variables associated with each skill could more readily uphold the
usability of the skills, thus allowing for a more complete understanding of them.
Principals in SW-PBS schools demonstrated higher rates of effectiveness across
all three subscales, and most significantly in relation to behavior management. This
would imply that more research is needed to determine if these findings are consistent
across differing schools, populations of respondents and geographic areas. Determining
what features of SW-PBS training have supported improved leadership skills, and what
types of supports and training principals would identify as most necessary are two
possible lines of study related to this question.
Certified job satisfaction rates were statistically significant in favor of SW-PBS
schools. In future studies would this statistical significance be verified, and if so, what
practical significant would it imply beyond the advisability of schools being trained in
SW-PBS and implementing it with fidelity? What specific factors associated with job
satisfaction might SW-PBS support?
There was no statistical significance to the findings associated with principal
effectiveness and its’ relation to certified staff job satisfaction but practical significance
was apparent in that respondents in SW-PBS schools did report higher rates of
satisfaction in relation to principal effectiveness across two questionnaire items.
Extending this line of inquiry would be beneficial to the field in multiple ways: (1) what
specific factors of principal effectiveness do certified staffs value more highly, (2) of
those, which are or should be included in models of specialized principal trainings
associated with SW-PBS, and (3) does an assessment instrument such as the Principal

154
Leadership Skill Questionnaire potentially assist principals to self-reflect and identify
areas of training from which they would benefit?
When principal behavior management effectiveness and SW-PBS status related to
certified staff job satisfaction were simultaneously examined, behavior management
effectiveness was clearly more valued. Possible reasons for this outcome were
previously discussed in Chapter 4. Future research in relation to these findings would be
beneficial regarding each of the 12 skills within the behavior management skills subscale
and how they interact with SW-PBS training components and support through ongoing
coaching.
In summary, this study presented a broad-based exploratory set of information
designed to open the research of SW-PBS and principal leadership. The information
gained from this study could benefit from multiple replications utilizing the same or a
very similar format, and/or through more explicit research associated with specific
variables within it to uphold its’ content and construct validity and to increase its’
external validity. As Kern and Manz pointed out (2004), aspects of SW-PBS are still in
need of empirical research to corroborate its’ efficacy. This study is conducive to
replication in applied settings across a wide variety of schools and geographic areas
through partnerships with school staffs and researchers with minimal time investments on
the part of school personnel.
Conclusion
This study has extended the research associated with principal leadership skills
and SW-PBS in several ways. First, the set of specific leadership skills included in the

155
study have provided a basis grounded in peer-reviewed literature of skills that should be
actively addressed in school-wide PBS research. The information and results provided
through this study demonstrate that there is a trend of improved principal leadership skills
and certified job satisfaction associated with SW-PBS. This opens the doors to more
effectively identifying exactly how, when, and where SW-PBS should improve its efforts
in relation to principals’ training.
The study also demonstrates the necessity for collaborative research efforts across
the disciplines of principal leadership and special education, and the viability of SW-PBS
as a bridge between the two. Each of these disciplines is faced with similar challenges.
The alignment of NCLB and IDEA 2004 and their combined emphases on highly
qualified staff, utilizing research-based practices, and the necessity for ensuring improved
student achievement for all students necessitates the joining of efforts to best meet the
challenges ahead. Because the foundations of SW-PBS are grounded in general
education and special education research and issues, it is a logical link between the two.
Finally, the results demonstrate that there is a viable connection between the
research associated with principal leadership skills and practitioners in the field.
Practitioners have demonstrated they value information related to principal leadership
skills and they are seeking to become more knowledgeable about them. If we are to
continue to bridge the research-to-practice gap and bring effective strategies to bear in
schools regarding principal leadership skills and SW-PBS, it is prudent to establish lines
of research that are valued and relevant to all stakeholders.

156
Survey Code #_____________________
Appendix A: Principal Leadership Skill Questionnaire
The following survey will take approximately 20 minutes to complete.
The purpose of this questionnaire is to (1) determine the opinions of teachers and principals toward the importance and evidence of key leadership skills and (2) gather information about the types of training and experience teachers and principals have. There are no right or wrong answers and all information will be confidential. Participation is voluntary. Your input is important. Please answer each question with what you believe. Section I - Assessment of Principal Leadership Skills Directions: Please circle the response on the left of each statement that most closely matches your assessment of the importance of that skill for principals to possess. Please circle the response on the right of each statement that most closely matches your assessment of your principal’s overall skill level in that area. Importance of Skill Skill Principal Rating
Stro
ngly
D
isag
ree
Dis
agre
e
Neu
tral
Agr
ee
Stro
ngly
A
gree
Doe
s Not
Ex
hibi
t thi
s Sk
ill
Exhi
bits
Ski
ll bu
t is N
ot
Effe
ctiv
e
Is S
omew
hat
Effe
ctiv
e
Is E
ffec
tive
Is V
ery
Effe
ctiv
e
1 2 3 4 5 1. Leads staff in establishing a school vision
1 2 3 4 5
1 2 3 4 5 2. Leads staff in establishing a set of goals to implement vision
1 2 3 4 5
1 2 3 4 5 3. Actively encourages staff input and participation to prioritize goals
1 2 3 4 5
1 2 3 4 5 4. Works toward whole staff consensus on important school- wide issues and goals
1 2 3 4 5
1 2 3 4 5 5. Models and uses problem-solving skills to help staff reach consensus
1 2 3 4 5
1 2 3 4 5 6. Uses data to help staff prioritize goals
1 2 3 4 5
1 2 3 4 5 7. Maintains high performance expectations for all staff
1 2 3 4 5
1 2 3 4 5 8. Encourages and supports staff to self-evaluate progress in implementing school-wide goals
1 2 3 4 5

157
1 2 3 4 5 9. Provides professional development activities to support school-wide goals
1 2 3 4 5
1 2 3 4 5 10. Actively models skills that support school-wide goals
1 2 3 4 5
1 2 3 4 5 11. Establishes leadership teams to guide implementation of school- wide goals as needed
1 2 3 4 5
1 2 3 4 5 12. Provides and enforces clear school- wide systems
1 2 3 4 5
1 2 3 4 5 13. Provides and enforces clear school-wide practices
1 2 3 4 5
1 2 3 4 5 14. Consistently monitors and modifies school-wide systems and practices as needed
1 2 3 4 5
1 2 3 4 5 15. Keeps staff up-to-date on modifications to school-wide systems and practices
1 2 3 4 5
1 2 3 4 5 16. Anticipates predictable problems and effectively responds to them
1 2 3 4 5
1 2 3 4 5 17. Assures school compliance with district, state, and federal regulations
1 2 3 4 5
1 2 3 4 5 18. Promotes staff cohesion and cooperation
1 2 3 4 5
1 2 3 4 5 19. Provides staff with materials, resources, and shared planning times as needed to implement school-wide goals
1 2 3 4 5
1 2 3 4 5 20. Actively exposes staff to research and rationale that supports the effectiveness of school-wide behavioral management systems
1 2 3 4 5
1 2 3 4 5 21. Includes staff in decision-making Regarding behavioral management issues
1 2 3 4 5
1 2 3 4 5 22. Established a leadership team to guide implementation of school- wide behavior management system
1 2 3 4 5
1 2 3 4 5 23. Publicly supports this team’s efforts 1 2 3 4 5 1 2 3 4 5 24. Is an active participant on this
team
1 2 3 4 5

158
1 2 3 4 5 25. Supports this team’s efforts to formulate an action plan to implement school-wide behavioral management plan
1 2 3 4 5
1 2 3 4 5 26. Provides resources to implement school-wide behavioral management plan
1 2 3 4 5
1 2 3 4 5 27. Supports and recognizes staff who implement proactive behavioral management plan
1 2 3 4 5
1 2 3 4 5 28. Supports and recognizes students who display improved behavioral/social skills
1 2 3 4 5
1 2 3 4 5 29. Regularly informs students, staff, parents, and community about procedures and progress toward meeting behavioral management goals
1 2 3 4 5
1 2 3 4 5 30. Consistently maintains agreed upon school-wide behavioral management standards, systems, and practices
1 2 3 4 5
1 2 3 4 5 31. Ensures all staff know, understand, and follow agreed upon school-wide behavioral management standards, systems, and practices
1 2 3 4 5
Section II - Job Satisfaction
Directions: Please put an “x” in the space next to the selection that best fits your opinion:
1. I am satisfied with my job: ____ 1 (strongly disagree) ____ 2 (disagree) ____ 3 (agree) ____ 4 (strongly agree)
2. My principal’s leadership makes me more satisfied with my job: ____ 1 (strongly disagree) ____ 2 (disagree) ____ 3 (agree) ____ 4 (strongly
agree)

159
Section III – Demographic Information
Directions: Please put an “x” in the space next to the selection that best fits your status:
1. Gender:
____ Female ____ Male
2. Highest academic degree earned: ____Bachelor ____Masters _____ Specialist ____EdD ____PhD
3. I am currently employed as a: ____ General Education Teacher ____ Special Education Teacher ____ Principal ____ Assistant Principal ____Other: Please explain_________________________ 4. Ethnic Background: ____ Hispanic ____African American ____Caucasian ____ Asian ____ American Indian ____ Other: Please explain_________________________ 5. Areas of Educational Certification (put an “x” next to all that apply): ____ Early Childhood ____ Elementary ____Middle School ____High School ____ Cross-Categorical Special Education ____ Learning Disabilities ____ E/BD ____ Severely Developmentally Disabled ____ Mental Retardation ____ECSE ____ Elementary Administration ____ Secondary Administration
____ Special Education Administration
Directions: Please fill in the blanks below with the number of total years, including this school year; you have worked in the following categories. Put a “0” next to any category in which you have never worked. 6. Years of full-time general education teaching experience: ________ 7. Years of full-time general education teaching experience in this school: _______ 8. Years of full-time special education teaching experience: ________ 9. Years of full-time special education teaching experience in this school: _______ 10. Years as a principal: _________ 11. Years as a principal in this building: _______ 12. Years as an assistant principal: ________ 13. Years as an assistant principal in this building: _______

160
Section IV - Specialized Training Experience
Directions: Please put an “x” in the space that best fits your situation: 1. I have participated in at least one School-wide Positive Behavioral Support (SW-
PBS) training: ____ yes ____ no
If you marked “no”, do not answer the rest of Section 3. 2. I attended SW-PBS training for the first time during the __________ school year. 3. I have attended SW-PBS training during more than one school year:
____ yes ____ no
4. I have attended at least one SW-PBS training as a member of a school team: ____ yes ____ no
5. I am currently employed in the same building with which I attended SW-PBS training:
____ yes ____ no
6. My school currently uses school-wide PBS: ____ yes ____ no
7. I am more satisfied with my job since my school has been using PBS: ____ yes ____ no
8. I am more satisfied with my principal’s job performance since my school has been
using PBS: ____ yes ____ no
7. I am currently a member of a building SW- PBS leadership team: ____ yes ____ no
8. I was formerly a member of a building SW-PBS leadership team: ____ yes ____ no
9. I have taken coursework in PBS through a college or university: ____ yes ____ no
Thank you for taking the time to complete this survey. Your opinions are important. Please return the completed survey to the designated person in your building.

161
Appendix B: Principal Introductory Letter and Consent
March 22, 2006
Dear _____________________________;
Your school has been selected to participate in a project designed to gather information about effective
schools and Positive Behavior Support (PBS). The study has been approved by the University of Missouri-
Columbia Institutional Review Board. The purpose of the project is to identify leadership factors that
impact administrators and teachers on a day-to-day basis in schools and to investigate if PBS assists school
personnel in establishing the kind of educational environment they would like to have. To specifically
examine PBS, a balance of representative schools that do and do not currently implement PBS is needed.
Your school was selected based on the number of students enrolled, the percentage of students receiving
free/reduced lunch, and if the school does or does not actively participate in PBS at this time.
Should you agree to participate in the project, the following activities could be included:
• Teachers and administrators would complete a questionnaire that would take no longer than 20
minutes.
• Demographic data related to free/reduced lunch participants, numbers of students in special
education services, discipline reports, MAP results, and numbers of students, teachers, and
administrators assigned to the school would be collected from information available through the
Missouri Department of Elementary and Secondary Education (DESE).
• If you are a PBS school, an additional activity might be conducted in your school. Your PBS team
might be asked to participate in an interview (taking approximately 20 minutes) related to how
implementation of PBS has impacted your school.
• Personnel employed by your district conducted the SET 2.0 in your building earlier this year.
Access to the results of the SET would be requested.
Confidentiality is assured during all phases of the project. Names of participants or schools will not appear
on any collected data. In addition, you are free to request that data not be collected by University staff.
There are no anticipated risks associated with participating in the project. However, staff members,
students, and principals are free to withdraw from the study at any time without consequences in any
manner from any source. If you have questions related to the instruments to be used for data collection,
the survey, or the SET, or would like the opportunity to review them prior to their use in your building,
please contact Mary Richter at the email address or phone number listed below. The benefits of

162
participating include improving what we know about providing effective supports for school staff, and
making best practice research-based decisions about the strategies we use in our schools.
If you have any questions or would like further information please contact: Mary Richter, University of
Missouri-Columbia: [email protected], or by phone at 573-564-3760. You may also contact
the University of Missouri project supervisor, Dr. Tim Lewis, at [email protected] or by phone at
573-882-3742.
If you have questions concerning your rights as a research subject contact: Research Compliance Office,
University of Missouri-Columbia at [email protected] or by phone at (573-882-9585).
I give my permission for my school to participate in the above described project. I further
understand that allowing observation by University staff is voluntary and that I may request data
collection to cease at any time.
______________________________________ _________________________
(Signature) (Date)
Please keep a copy for your records and return the signed original to Mary Richter.

163
Appendix C: Superintendent Introductory Letter and Consent
March 5, 2006
Dear __________________________,
A school in your district, _____________________ Elementary School, has been selected to participate in
a project designed to gather information about effective schools and Positive Behavior Support (PBS). The
study has been approved by the University of Missouri-Columbia Institutional Review Board. The purpose
of the project is to identify factors that impact administrators and teachers on a day-to-day basis in schools,
and to investigate if PBS assists school personnel in establishing the kind of educational environment they
would like to have. To specifically examine PBS, a balance of representative schools that do and do not
currently implement PBS is needed. Your school was selected based on the number of students enrolled,
the percentage of students receiving free/reduced lunch, and if the school does or does not participate in
PBS at this time.
Should you agree to allow __________________ Elementary School to participate in the project, the
following activities would be included:
• Teachers and administrators would complete a survey that would take no longer than 30 minutes.
• Demographic data related to free/reduced lunch participants, numbers of students in special
education services, discipline reports, MAP results, and numbers of students, teachers, and
administrators assigned to the school would be collected.
• If it is a PBS school, two additional activities would be conducted. First, the PBS team would be
asked to participate in an interview (taking approximately 30 minutes) related to how PBS has
impacted your school. Second, observations in the school of factors associated with PBS would
be conducted by 1 – 3 University graduate students, using an instrument called the SET 2.0.
Classroom learning would not be disturbed. Adults and students within the school would be asked
to orally answer questions taking approximately 3-5 minutes to complete. Participation is
voluntary.
Confidentiality is assured during all phases of the project. Names of participants will not appear on and
collected data. In addition, you are free to request that data not be collected by University staff. There are
no anticipated risks associated with participating in project. However, staff members, students, and
principals are free to withdraw from the study at any time without consequences in any manner from any
source. If you have questions related to the instruments to be used for data collection, the survey, or the
SET, or would like the opportunity to review them prior to their use in your building, please contact Mary

164
Richter at the email address or phone number listed below. The benefits of participating include improving
what we know about providing effective supports for school staff, and making best practice research-based
decisions about strategies we use in our schools.
If you have any questions or would like further information please contact: Mary Richter, University of
Missouri-Columbia: [email protected], or by phone at 573-441-1870. You may also contact
the University of Missouri project supervisor, Dr. Tim Lewis, at [email protected] or by phone at
573-882-3742.
If you have questions concerning your rights as a research subject contact: Research Compliance Office,
University of Missouri-Columbia at [email protected] or by phone at (573-882-9585).
I give my permission for my school to participate in the above described project. I further
understand that allowing observation by University staff is voluntary and that I may request data
collection to cease at any time.
______________________________________ _________________________
(Signature) (Date)
Please keep a copy for your records and return the signed original to Mary Richter in the enclosed
envelope.

165
Appendix D: Teacher Written Consent Form March 5, 2006 Dear Teacher, You have been selected to participate in a project designed to gather information about effective schools and Positive Behavior Support (PBS). The study has been approved by the University of Missouri-Columbia Institutional Review Board. The primary purpose of the project is to identify factors that impact administrators and teachers on a day-to-day basis in schools and to investigate if PBS assists school personnel in establishing the kind of educational environment they would like to have. To specifically examine PBS, a balance of representative schools that do and do not currently implement PBS is needed. Should you agree to participate, you would be asked to complete the following activities:
• You would answer a questionnaire that would take approximately 20-30 minutes to complete. • If you are in a PBS school, you would be asked to answer a set of oral questions during non-
instructional time within the school day, taking approximately 3-5 minutes to complete. • If you are in a PBS school and are a member of the PBS leadership team, you will be asked to
participate in a focus group interview with your team members. The interview would take approximately 45 minutes and would take place at a special meeting called by the PBS team coordinator.
Confidentiality is assured during all phases of the project. Names of participants will not appear on any collected data. In addition, you are free to request that data not be collected by University staff. There are no anticipated risks associated with participating in the project. However, you are free to decide not to participate in the project or to withdraw at any time without consequence to you or your position from any source. The benefits of participating include having the opportunity to include your perspective on improving what we know about providing effective supports for school staff, and making best practice decisions about strategies we use in our schools. If you have any questions or would like further information please contact Mary Richter at [email protected] or by phone at 573-441-1870. You may also contact the University of Missouri project supervisor, Dr. Tim Lewis, at [email protected] or by phone at 573-882-3742. If you have questions concerning your rights as a research subject contact: Research Compliance Office, University of Missouri-Columbia at [email protected] or by phone at 573-882-9585. I give my permission to be included in this project as described above. I further understand that allowing observation by University staff is voluntary and that I may request to withdraw at any time. _______________________________ _______________________ (Signature) (Date) Please keep a copy of this letter for your records and return the signed original to Mary Richter in the enclosed envelope.

166
Appendix E: Principal Written Consent Form March 5, 2006 Dear Principal, You have been selected to participate in a project designed to gather information about effective schools and Positive Behavior Support (PBS). The study has been approved by the University of Missouri-Columbia Institutional Review Board. The primary purpose of the project is to identify factors that impact administrators and teachers on a day-to-day basis in schools and to investigate if PBS assists school personnel in establishing the kind of educational environment they would like to have. To specifically examine PBS, a balance of representative schools that do and do not currently implement PBS is needed. Should you agree to participate, you would be asked to complete the following activities:
• You would answer a questionnaire that would take approximately 20-30 minutes to complete. • If you are in a PBS school, you would be asked to answer a set of oral questions during non-
instructional time within the school day, taking approximately 15 minutes to complete. Confidentiality is assured during all phases of the project. Names of participants will not appear on any collected data. In addition, you are free to request that data not be collected by University staff. There are no anticipated risks associated with participating in the project. However, you are free to decide not to participate or to withdraw from the project at any time without consequence from any source. The benefits of participating include having the opportunity to include your perspective on improving what we know about providing effective supports for school staff, and making best practice research-based decisions about strategies we use in our schools. If you have any questions or would like further information please contact Mary Richter at [email protected] or by phone at 573-441-1870. You may also contact the University of Missouri project supervisor, Dr. Tim Lewis, at [email protected] or by phone at 573-882-3742. If you have questions concerning your rights as a research subject contact: Research Compliance Office, University of Missouri-Columbia at [email protected] or by phone at 573-882-9585. I give my permission to be included in this project as described above. I further understand that allowing observation by University staff is voluntary and that I may request to withdraw at any time. ___________________________________ _______________________ (Signature) (Date) Please keep a copy of this letter for your records and return the signed original to Mary Richter in the enclosed envelope.

167
Appendix F: Teacher Instructions Letter March 5, 2006 Dear Teacher, Thank you for taking the time to complete the attached information, particularly at such a busy time of year. I am requesting that you participate because I believe the information will be of real value. My hope is that it will help us develop better and more useful trainings for teachers and principals. There are 2 documents:
• A permission form - please sign and return to your school secretary. This form will be kept in a separate manila envelope.
• A questionnaire – please fill this out, fold, and seal in the white envelope. Then return to your school secretary. These will be kept in a separate box.
All individual and school information is confidential, and will only be reported by a number code. I am required to have separate signed permission forms on file for the University of Missouri Institutional Review Board to verify that the number of permission forms match the number of questionnaires collected. Mary Richter University of Missouri-Columbia

168
Appendix G - Focus Interview Questions
1. What, if any, factors related to implementing SW-PBS have increased teacher job satisfaction in your school? 2. What, if any, factors related to implementing SW-PBS have improved student behavior in your school? 3. Do you find these have also been associated with improved behavior in students who are considered to be at-risk for or already have been identified through special education for emotional or behavioral disorders? 4. What, if any, changes in your principal’s leadership style do you believe might be associated with implementing SW-PBS? 5. Are there other changes in your principal you believe might be associated with implementing SW-PBS? 6. Are there other questions you would suggest including in the questionnaire?

169
Appendix H
Table of Descriptive Statistics, All Participants Questionnaire A and B Scales

170
Table B.i
Descriptive Statistics for All Respondents Disaggregated by PBS Status and Position
Case Summaries "A" Items
PBS
CODEPOSITION
CODE N Mean SD Kurt. Skew.Item 01a Leads in establishing school vision. PBS_NOT PRINCIPAL 15 4.6667 0.4880
-1.6154
-0.7882
OTHER STAFF 274 4.6825 0.5785 7.2645
-2.2331
Total 289 4.6817 0.5735 7.0946-
2.1918
PBS PRINCIPAL 15 4.8667 0.3519 4.3491-
2.4048
OTHER STAFF 415 4.7325 0.5413
14.9392
-3.0255
Total 430 4.7372 0.5361 15.109
6-
3.0394
Total PRINCIPAL 30 4.7667 0.4302 -
0.2573-
1.3283
OTHER STAFF 689 4.7126 0.5565
11.3002
-2.6716
Total 719 4.7149 0.5517 11.257
2-
2.6563Item 02a Leads in establishing goals to implement vision. PBS_NOT PRINCIPAL 15 4.7333 0.4577
-0.7343
-1.1764
OTHER STAFF 274 4.6350 0.5852 5.1030
-1.8096
Total 289 4.6401 0.5791 5.0961-
1.8055
PBS PRINCIPAL 15 4.8667 0.3519 4.3491-
2.4048
OTHER STAFF 414 4.6667 0.5946
10.0445
-2.5081
Total 429 4.6737 0.5887 10.225
7-
2.5304
Total PRINCIPAL 30 4.8000 0.4068 0.5274-
1.5801

171
OTHER STAFF 688 4.6541 0.5906 8.0442
-2.2302
Total 718 4.6602 0.5846 8.1301-
2.2393Item 03a Encourages staff input/participation to prioritize goals. PBS_NOT PRINCIPAL 15 4.5333 0.5164
-2.3077
-0.1490
OTHER STAFF 273 4.6703 0.5699 7.2403
-2.1386
Total 288 4.6632 0.5672 6.8244-
2.0518
PBS PRINCIPAL 15 4.9333 0.2582 15.000
0-
3.8730
OTHER STAFF 416 4.6490 0.6107 8.3097
-2.3080
Total 431 4.6589 0.6040 8.5620-
2.3477
Total PRINCIPAL 30 4.7333 0.4498 -
0.8239-
1.1117
OTHER STAFF 689 4.6575 0.5945 7.9594
-2.2508
Total 719 4.6606 0.5891 7.9560-
2.2418Item 04a Works toward staff consensus on school-wide issues/goals. PBS_NOT PRINCIPAL 15 4.6667 0.4880
-1.6154
-0.7882
OTHER STAFF 273 4.5531 0.6899 4.7409
-1.8499
Total 288 4.5590 0.6807 4.8135-
1.8504
PBS PRINCIPAL 15 4.8000 0.4140 0.8974-
1.6721
OTHER STAFF 415 4.5614 0.6706 5.4388
-1.9158
Total 430 4.5698 0.6645 5.5518-
1.9342
Total PRINCIPAL 30 4.7333 0.4498 -
0.8239-
1.1117
OTHER STAFF 688 4.5581 0.6779 5.1037
-1.8850

172
Total 718 4.5655 0.6706 5.1986-
1.8959Item 05a Models/uses problem-solving to help staff reach consensus. PBS_NOT PRINCIPAL 15 4.6000 0.5071
-2.0940
-0.4551
OTHER STAFF 273 4.4945 0.6758 2.7751
-1.4196
Total 288 4.5000 0.6678 2.7996-
1.4136
PBS PRINCIPAL 15 4.6667 0.4880 -
1.6154-
0.7882
OTHER STAFF 413 4.5400 0.6584 4.9286
-1.7375
Total 428 4.5444 0.6531 4.9541-
1.7358
Total PRINCIPAL 30 4.6333 0.4901 -
1.7840-
0.5829
OTHER STAFF 686 4.5219 0.6653 3.9651
-1.6019
Total 716 4.5265 0.6590 3.9879-
1.5976Item 06a Uses data to help staff prioritize goals. PBS_NOT PRINCIPAL 15 4.6000 0.6325 1.2637
-1.4074
OTHER STAFF 273 4.3993 0.7109 1.5674
-1.1239
Total 288 4.4097 0.7075 1.5505-
1.1333
PBS PRINCIPAL 15 4.8667 0.3519 4.3491-
2.4048
OTHER STAFF 412 4.4393 0.7105 2.9873
-1.4000
Total 427 4.4543 0.7052 3.0830-
1.4311
Total PRINCIPAL 30 4.7333 0.5208 2.9337-
1.8665
OTHER STAFF 685 4.4234 0.7104 2.3783
-1.2858
Total 715 4.4364 0.7060 2.4159-
1.3063

173
Item 07a Maintains high performance expectations for all staff.
PBS_NOT PRINCIPAL 15 5.0000 0.0000 . .
OTHER STAFF 274 4.8321 0.4852
19.9392
-3.8864
Total 289 4.8408 0.4739 21.173
9-
4.0064
PBS PRINCIPAL 15 4.8667 0.3519 4.3491-
2.4048
OTHER STAFF 413 4.7942 0.5249
19.6659
-3.7329
Total 428 4.7967 0.5197 19.849
3-
3.7401
Total PRINCIPAL 30 4.9333 0.2537 12.206
6-
3.6600
OTHER STAFF 687 4.8093 0.5094
19.7425
-3.7867
Total 717 4.8145 0.5019 20.304
2-
3.8348Item 08a Encourages/supports staff to self-evaluate goals progress. PBS_NOT PRINCIPAL 15 4.6000 0.6325 1.2637
-1.4074
OTHER STAFF 273 4.5128 0.6423 2.5267
-1.3062
Total 288 4.5174 0.6410 2.4400-
1.3043
PBS PRINCIPAL 15 4.5333 0.6399 0.3975-
1.0846
OTHER STAFF 413 4.5061 0.6954 4.1327
-1.6754
Total 428 4.5070 0.6929 4.0518-
1.6594
Total PRINCIPAL 30 4.5667 0.6261 0.4307-
1.1717
OTHER STAFF 686 4.5087 0.6743 3.6270
-1.5505

174
Total 716 4.5112 0.6720 3.5384-
1.5380Item 09a Provides prof. dev. activities to support goals. PBS_NOT PRINCIPAL 14 4.6429 0.6333 2.2137
-1.6871
OTHER STAFF 271 4.6199 0.6663 5.4777
-2.1127
Total 285 4.6211 0.6636 5.3340-
2.0905
PBS PRINCIPAL 15 4.6667 0.6172 2.6250-
1.7916
OTHER STAFF 407 4.5897 0.6442 6.4864
-2.0324
Total 422 4.5924 0.6427 6.3630-
2.0210
Total PRINCIPAL 29 4.6552 0.6139 1.7651-
1.6408
OTHER STAFF 678 4.6018 0.6528 5.9881
-2.0587
Total 707 4.6040 0.6509 5.8585-
2.0434Item 10a Actively models skills that support school-wide goals. PBS_NOT PRINCIPAL 15 4.5333 0.5164
-2.3077
-0.1490
OTHER STAFF 273 4.5861 0.6480 4.3265
-1.7936
Total 288 4.5833 0.6412 4.2288-
1.7523
PBS PRINCIPAL 15 4.6667 0.4880 -
1.6154-
0.7882
OTHER STAFF 411 4.6131 0.6315 5.6656
-1.9804
Total 426 4.6150 0.6266 5.6575-
1.9697
Total PRINCIPAL 30 4.6000 0.4983 -
1.9500-
0.4301
OTHER STAFF 684 4.6023 0.6378 5.0521
-1.8990
Total 714 4.6022 0.6323 5.0007-
1.8748

175
Item 11a Establishes leadership teams to guide impl. goals.
PBS_NOT
PRINCIPAL 15 4.5333
0.7432 0.4706
-
1.3348
OTHER STAFF 273 4.4982 0.7025 3.4619
-1.5636
Total 288 4.5000 0.7034 3.2616-
1.5425
PBS PRINCIPAL 15 4.8667 0.3519 4.3491-
2.4048
OTHER STAFF 411 4.5718 0.6489 6.3601
-1.9910
Total 426 4.5822 0.6428 6.5099-
2.0182
Total PRINCIPAL 30 4.7000 0.5960 2.7461-
1.9060
OTHER STAFF 684 4.5424 0.6713 4.9544
-1.8008
Total 714 4.5490 0.6687 4.8988-
1.8028Item 12a Provides and enforces clear school-wide systems. PBS_NOT PRINCIPAL 15 4.6667 0.4880
-1.6154
-0.7882
OTHER STAFF 270 4.5481 0.6922 3.0261
-1.6308
Total 285 4.5544 0.6828 3.0962-
1.6349
PBS PRINCIPAL 15 4.9333 0.2582 15.000
0-
3.8730
OTHER STAFF 411 4.7105 0.5938 9.1764
-2.6165
Total 426 4.7183 0.5865 9.4826-
2.6590
Total PRINCIPAL 30 4.8000 0.4068 0.5274-
1.5801 OTHER 681 4.6461 0.6391 5.7803 -

176
STAFF 2.1360
Total 711 4.6526 0.6316 5.9147-
2.1534Item 13a Provides and enforces clear school-wide practices. PBS_NOT PRINCIPAL 15 4.4667 0.5164
-2.3077 0.1490
OTHER STAFF 273 4.6264 0.6239 5.5497
-1.9985
Total 288 4.6181 0.6191 5.2804-
1.9216
PBS PRINCIPAL 15 4.8000 0.4140 0.8974-
1.6721
OTHER STAFF 408 4.7206 0.5868 9.8513
-2.7081
Total 423 4.7234 0.5814 9.9291-
2.7102
Total PRINCIPAL 30 4.6333 0.4901 -
1.7840-
0.5829
OTHER STAFF 681 4.6828 0.6033 7.7122
-2.3831
Total 711 4.6807 0.5987 7.5670-
2.3431Item 14a Monitors/modifies systems and practices as needed. PBS_NOT PRINCIPAL 15 4.4000 0.6325
-0.3846
-0.5473
OTHER STAFF 273 4.5604 0.6621 3.2001
-1.6018
Total 288 4.5521 0.6605 2.9753-
1.5445
PBS PRINCIPAL 15 4.6667 0.4880 -
1.6154-
0.7882
OTHER STAFF 411 4.6326 0.6079 6.7489
-2.0903
Total 426 4.6338 0.6037 6.7030-
2.0734
Total PRINCIPAL 30 4.5333 0.5713 -
0.4294-
0.7325
OTHER STAFF 684 4.6038 0.6306 5.0162
-1.8712
Total 714 4.6008 0.6280 4.8471 -

177
1.8327Item 15a Keeps staff up-to-date on mods. to systems/practices. PBS_NOT PRINCIPAL 15 4.6667 0.4880
-1.6154
-0.7882
OTHER STAFF 273 4.6484 0.6191 5.3960
-2.0318
Total 288 4.6493 0.6122 5.3485-
2.0089
PBS PRINCIPAL 15 4.5333 0.6399 0.3975-
1.0846
OTHER STAFF 410 4.6902 0.5759 9.3883
-2.4791
Total 425 4.6847 0.5782 8.8635-
2.4101
Total PRINCIPAL 30 4.6000 0.5632 0.1762-
1.0421
OTHER STAFF 683 4.6735 0.5935 7.4878
-2.2794
Total 713 4.6704 0.5920 7.2095-
2.2314Item 16a Anticipates problems and effectively responds to them. PBS_NOT PRINCIPAL 15 4.5333 0.6399 0.3975
-1.0846
OTHER STAFF 272 4.6397 0.6215 5.1881
-1.9835
Total 287 4.6341 0.6218 4.8616-
1.9268
PBS PRINCIPAL 15 4.6000 0.6325 1.2637-
1.4074
OTHER STAFF 411 4.6569 0.6259
10.1091
-2.5896
Total 426 4.6549 0.6255 9.7732-
2.5443
Total PRINCIPAL 30 4.5667 0.6261 0.4307-
1.1717
OTHER STAFF 683 4.6501 0.6238 8.1043
-2.3457
Total 713 4.6466 0.6237 7.7451-
2.2928

178
Item 17a Assures school compliance with government regulations. PBS_NOT PRINCIPAL 15 4.7333 0.4577
-0.7343
-1.1764
OTHER STAFF 274 4.8102 0.4847
16.0421
-3.3580
Total 289 4.8062 0.4829 15.306
8-
3.2567
PBS PRINCIPAL 15 4.6667 0.6172 2.6250-
1.7916
OTHER STAFF 410 4.7268 0.6243
12.0909
-3.0598
Total 425 4.7247 0.6234 11.744
6-
3.0125
Total PRINCIPAL 30 4.7000 0.5350 1.9505-
1.6215
OTHER STAFF 684 4.7602 0.5735
13.7508
-3.2140
Total 714 4.7577 0.5718 13.345
0-
3.1561Item 18a Promotes staff cohesion and cooperation. PBS_NOT PRINCIPAL 15 4.7333 0.5936 4.7848
-2.2730
OTHER STAFF 274 4.7664 0.5711
15.4501
-3.4088
Total 289 4.7647 0.5713 14.755
7-
3.3354
PBS PRINCIPAL 15 4.7333 0.4577 -
0.7343-
1.1764
OTHER STAFF 408 4.7721 0.5425
14.4424
-3.2506
Total 423 4.7707 0.5393 14.224
7-
3.2089
Total PRINCIPAL 30 4.7333 0.5208 2.9337-
1.8665
OTHER STAFF 682 4.7698 0.5538
14.8235
-3.3162
Total 712 4.7683 0.5522 14.416
2-
3.2630
Item 19a Provides staff with PBS_NOT PRINCIPAL 15 4.8000 0.4140 0.8974
-1.6721

179
materials/resources/planning times.
OTHER STAFF 272 4.8162 0.4737
17.4020
-3.4546
Total 287 4.8153 0.4701 16.976
3-
3.3944
PBS PRINCIPAL 15 4.9333 0.2582 15.000
0-
3.8730
OTHER STAFF 411 4.7567 0.5403
12.9124
-2.9956
Total 426 4.7629 0.5337 13.265
2-
3.0360
Total PRINCIPAL 30 4.8667 0.3457 3.3860-
2.2725
OTHER STAFF 683 4.7804 0.5152
14.3272
-3.1551
Total 713 4.7840 0.5094 14.492
9-
3.1663Item 20a Exposes staff to research and rationale for beh. mgmt.. PBS_NOT PRINCIPAL 15 4.4000 0.8281
-0.7853
-0.9405
OTHER STAFF 273 4.4176 0.7386 2.4208
-1.3398
Total 288 4.4167 0.7420 2.1880-
1.3085
PBS PRINCIPAL 15 4.3333 0.7237 -
0.6542-
0.6280
OTHER STAFF 410 4.4293 0.7207 2.7195
-1.3653
Total 425 4.4259 0.7202 2.5878-
1.3373
Total PRINCIPAL 30 4.3667 0.7649 -
0.8365-
0.7548
OTHER STAFF 683 4.4246 0.7274 2.5692
-1.3523
Total 713 4.4222 0.7286 2.3949-
1.3231Item 21a Includes staff in decision-making about beh. PBS_NOT PRINCIPAL 15 4.4667 0.5164
-2.3077 0.1490

180
mgmt. issues.
OTHER STAFF 273 4.5495 0.7112 4.5181
-1.8744
Total 288 4.5451 0.7019 4.4707-
1.8354
PBS PRINCIPAL 15 4.7333 0.4577 -
0.7343-
1.1764
OTHER STAFF 410 4.6390 0.6458 7.6200
-2.3353
Total 425 4.6424 0.6399 7.6809-
2.3351
Total PRINCIPAL 30 4.6000 0.4983 -
1.9500-
0.4301
OTHER STAFF 683 4.6032 0.6736 6.0838
-2.1262
Total 713 4.6031 0.6669 6.0670-
2.1051Item 22a Established leadership team to guide beh. mgmt. system. PBS_NOT PRINCIPAL 15 4.0000 1.1952 1.1846
-1.1585
OTHER STAFF 270 4.3630 0.8675 1.9020
-1.4305
Total 285 4.3439 0.8887 1.9038-
1.4296
PBS PRINCIPAL 15 4.8000 0.4140 0.8974-
1.6721
OTHER STAFF 411 4.6764 0.6207
11.8137
-2.8464
Total 426 4.6808 0.6147 11.945
7-
2.8535
Total PRINCIPAL 30 4.4000 0.9685 3.9735-
1.8937
OTHER STAFF 681 4.5521 0.7440 5.3841
-2.0919
Total 711 4.5457 0.7546 5.3184-
2.0888Item 23a Publicly supports the leadership PBS_NOT PRINCIPAL 15 4.4000 0.6325
-0.3846
-0.5473

181
team’s efforts.
OTHER STAFF 271 4.5129 0.8067 3.7303
-1.8759
Total 286 4.5070 0.7980 3.6508-
1.8379
PBS PRINCIPAL 15 4.9333 0.2582 15.000
0-
3.8730
OTHER STAFF 412 4.6650 0.6614 8.8922
-2.6019
Total 427 4.6745 0.6532 9.2124-
2.6470
Total PRINCIPAL 30 4.6667 0.5467 1.2012-
1.4071
OTHER STAFF 683 4.6047 0.7258 6.1292
-2.2606
Total 713 4.6073 0.7190 6.1551-
2.2558Item 24a Is an active participant on the leadership team. PBS_NOT PRINCIPAL 15 4.4667 0.6399
-0.1267
-0.8023
OTHER STAFF 270 4.5556 0.7728 6.1590
-2.2562
Total 285 4.5509 0.7657 6.0087-
2.2102
PBS PRINCIPAL 15 4.7333 0.7037 4.3491-
2.4048
OTHER STAFF 412 4.6917 0.6797
10.5819
-2.9388
Total 427 4.6932 0.6797 10.302
3-
2.9106
Total PRINCIPAL 30 4.6000 0.6747 0.9574-
1.4726
OTHER STAFF 682 4.6378 0.7205 8.3008
-2.6161
Total 712 4.6362 0.7182 8.0575-
2.5750Item 25a Support leadership team formulating beh. PBS_NOT PRINCIPAL 15 4.2667 0.9612
-1.7761
-0.6155

182
mgmt. action plan.
OTHER STAFF 269 4.4684 0.8126 3.0243
-1.6836
Total 284 4.4577 0.8204 2.5891-
1.6034
PBS PRINCIPAL 15 4.6667 0.6172 2.6250-
1.7916
OTHER STAFF 409 4.6870 0.5815 9.0701
-2.4551
Total 424 4.6863 0.5820 8.7658-
2.4228
Total PRINCIPAL 30 4.4667 0.8193 -
0.5534-
1.0951
OTHER STAFF 678 4.6003 0.6904 5.7224
-2.1195
Total 708 4.5946 0.6962 5.2517-
2.0562Item 26a Provides resources to implement beh. mgmt. plan. PBS_NOT PRINCIPAL 15 4.0000 0.9258
-1.9744 0.0000
OTHER STAFF 269 4.4721 0.8035 4.1112
-1.8433
Total 284 4.4472 0.8155 3.3569-
1.6987
PBS PRINCIPAL 15 4.6667 0.4880 -
1.6154-
0.7882
OTHER STAFF 410 4.6000 0.6378 5.6843
-1.9701
Total 425 4.6024 0.6328 5.6851-
1.9610
Total PRINCIPAL 30 4.3333 0.8023 -
1.0621-
0.6995
OTHER STAFF 679 4.5493 0.7103 5.2083
-1.9702
Total 709 4.5402 0.7152 4.7446-
1.8959Item 27a Supports/recognizes staff who implement beh. PBS_NOT PRINCIPAL 15 4.2667 0.7988
-1.1317
-0.5548

183
mgmt. plan.
OTHER STAFF 271 4.4613 0.7682 4.7381
-1.8442
Total 286 4.4510 0.7696 4.3204-
1.7647
PBS PRINCIPAL 15 4.5333 0.6399 0.3975-
1.0846
OTHER STAFF 411 4.5280 0.7198 4.0024
-1.7742
Total 426 4.5282 0.7165 3.9377-
1.7577
Total PRINCIPAL 30 4.4000 0.7240 -
0.6049-
0.7945
OTHER STAFF 682 4.5015 0.7396 4.3471
-1.8071
Total 712 4.4972 0.7387 4.1310-
1.7642Item 28a Supports/recognizes students improved beh./social skills. PBS_NOT PRINCIPAL 15 4.6000 0.5071
-2.0940
-0.4551
OTHER STAFF 270 4.6963 0.6191
10.0893
-2.7230
Total 285 4.6912 0.6133 9.8050-
2.6538
PBS PRINCIPAL 15 4.8000 0.4140 0.8974-
1.6721
OTHER STAFF 412 4.6990 0.6330 9.4885
-2.7192
Total 427 4.7026 0.6265 9.6221-
2.7286
Total PRINCIPAL 30 4.7000 0.4661 -
1.2421-
0.9195
OTHER STAFF 682 4.6979 0.6271 9.6393
-2.7150
Total 712 4.6980 0.6209 9.6158-
2.6938

184
Item 29a Informs stakeholders about meeting beh. mgmt. goals. PBS_NOT PRINCIPAL 15 4.2000 0.8619
-1.5453
-0.4325
OTHER STAFF 273 4.4652 0.7668 3.5103
-1.6568
Total 288 4.4514 0.7726 3.0534-
1.5709
PBS PRINCIPAL 15 4.5333 0.6399 0.3975-
1.0846
OTHER STAFF 412 4.5388 0.6877 3.8823
-1.7190
Total 427 4.5386 0.6854 3.7949-
1.7002
Total PRINCIPAL 30 4.3667 0.7649 -
0.8365-
0.7548
OTHER STAFF 685 4.5095 0.7206 3.7641
-1.7025
Total 715 4.5035 0.7225 3.4958-
1.6543Item 30a Maintains beh. mgmt. standards/systems/practices. PBS_NOT PRINCIPAL 15 4.3333 0.8165
-1.0220
-0.7402
OTHER STAFF 272 4.5882 0.7029 5.2573
-2.0514
Total 287 4.5749 0.7099 4.6360-
1.9499
PBS PRINCIPAL 15 4.6667 0.4880 -
1.6154-
0.7882
OTHER STAFF 410 4.6902 0.5717 8.9196
-2.4016
Total 425 4.6894 0.5684 8.7698-
2.3689
Total PRINCIPAL 30 4.5000 0.6823 -
0.0341-
1.0469
OTHER STAFF 682 4.6496 0.6288 7.1465
-2.2665
Total 712 4.6433 0.6313 6.6849-
2.1994

185
Item 31a Ensures all staff know/follow beh. mgmt. practices. PBS_NOT PRINCIPAL 15 4.4000 0.7368
-0.4698
-0.8407
OTHER STAFF 272 4.6360 0.6898 8.1587
-2.5032
Total 287 4.6237 0.6930 7.4310-
2.3870
PBS PRINCIPAL 15 4.6667 0.4880 -
1.6154-
0.7882
OTHER STAFF 411 4.7178 0.5952 9.3321
-2.6704
Total 426 4.7160 0.5914 9.1990-
2.6358
Total PRINCIPAL 30 4.5333 0.6288 0.1134-
1.0250
OTHER STAFF 683 4.6852 0.6354 8.9209
-2.6126
Total 713 4.6788 0.6354 8.4705-
2.5389 Case Summaries - "B" Items
PBS
CODEPOSITION
CODE N Mean SD Kurt. Skew.Item 01b Leads in establishing school vision. PBS_NOT PRINCIPAL 15 4.0667 0.5936 0.5369 0.0035
OTHER STAFF 278 4.1223 0.9459 0.6353
-0.9686
Total 293 4.1195 0.9305 0.6919-
0.9592
PBS PRINCIPAL 15 4.2000 0.6761 -
0.5048-
0.2560
OTHER STAFF 414 4.2198 0.8650 1.3242
-1.1623
Total 429 4.2191 0.8584 1.3233-
1.1497
Total PRINCIPAL 30 4.1333 0.6288 -
0.3207-
0.0977 OTHER 692 4.1806 0.8990 1.0067 -

186
STAFF 1.0822
Total 722 4.1787 0.8891 1.0282-
1.0698Item 02b Leads in establishing goals to implement vision. PBS_NOT PRINCIPAL 15 4.2000 0.5606 0.3783 0.1123
OTHER STAFF 277 4.0289 0.9664 0.0341
-0.7616
Total 292 4.0377 0.9499 0.1302-
0.7778
PBS PRINCIPAL 15 4.2667 0.7037 -
0.6691-
0.4330
OTHER STAFF 412 4.1820 0.8787 1.1911
-1.0983
Total 427 4.1850 0.8726 1.1981-
1.0923
Total PRINCIPAL 30 4.2333 0.6261 -
0.4528-
0.2014
OTHER STAFF 689 4.1205 0.9174 0.6180
-0.9544
Total 719 4.1252 0.9071 0.6686-
0.9568Item 03b Encourages staff input/participation to prioritize goals. PBS_NOT PRINCIPAL 15 4.4000 0.6325
-0.3846
-0.5473
OTHER STAFF 274 4.0839 1.0183 0.4770
-1.0290
Total 289 4.1003 1.0036 0.5807-
1.0536
PBS PRINCIPAL 15 4.4000 0.6325 -
0.3846-
0.5473
OTHER STAFF 414 4.1135 0.9512 1.7709
-1.2634
Total 429 4.1235 0.9428 1.8392-
1.2739
Total PRINCIPAL 30 4.4000 0.6215 -
0.5343-
0.5172
OTHER STAFF 688 4.1017 0.9778 1.1718
-1.1605

187
Total 718 4.1142 0.9671 1.2556-
1.1763Item 04b Works toward staff consensus on school-wide issues/goals. PBS_NOT PRINCIPAL 15 4.3333 0.4880
-1.6154 0.7882
OTHER STAFF 278 3.8741 1.1218
-0.0808
-0.8005
Total 293 3.8976 1.1025 0.0567-
0.8457
PBS PRINCIPAL 15 4.2667 0.8837 1.8210-
1.3174
OTHER STAFF 414 3.9155 1.0275 0.2967
-0.8392
Total 429 3.9277 1.0240 0.3159-
0.8517
Total PRINCIPAL 30 4.3000 0.7022 2.5682-
1.1395
OTHER STAFF 692 3.8988 1.0658 0.1331
-0.8261
Total 722 3.9155 1.0559 0.2042-
0.8516Item 05b Models/uses problem-solving to help staff reach consensus. PBS_NOT PRINCIPAL 15 4.0667 0.9612
-2.0851
-0.1477
OTHER STAFF 276 3.7790 1.0643 0.0781
-0.6972
Total 291 3.7938 1.0597 0.0552-
0.6829
PBS PRINCIPAL 15 4.0667 0.7988 -
1.3477-
0.1279
OTHER STAFF 413 3.8620 1.0441 0.1579
-0.7885
Total 428 3.8692 1.0364 0.1807-
0.7883
Total PRINCIPAL 30 4.0667 0.8683 -
1.6920-
0.1344
OTHER STAFF 689 3.8287 1.0523 0.1117
-0.7496
Total 719 3.8387 1.0458 0.1151 -
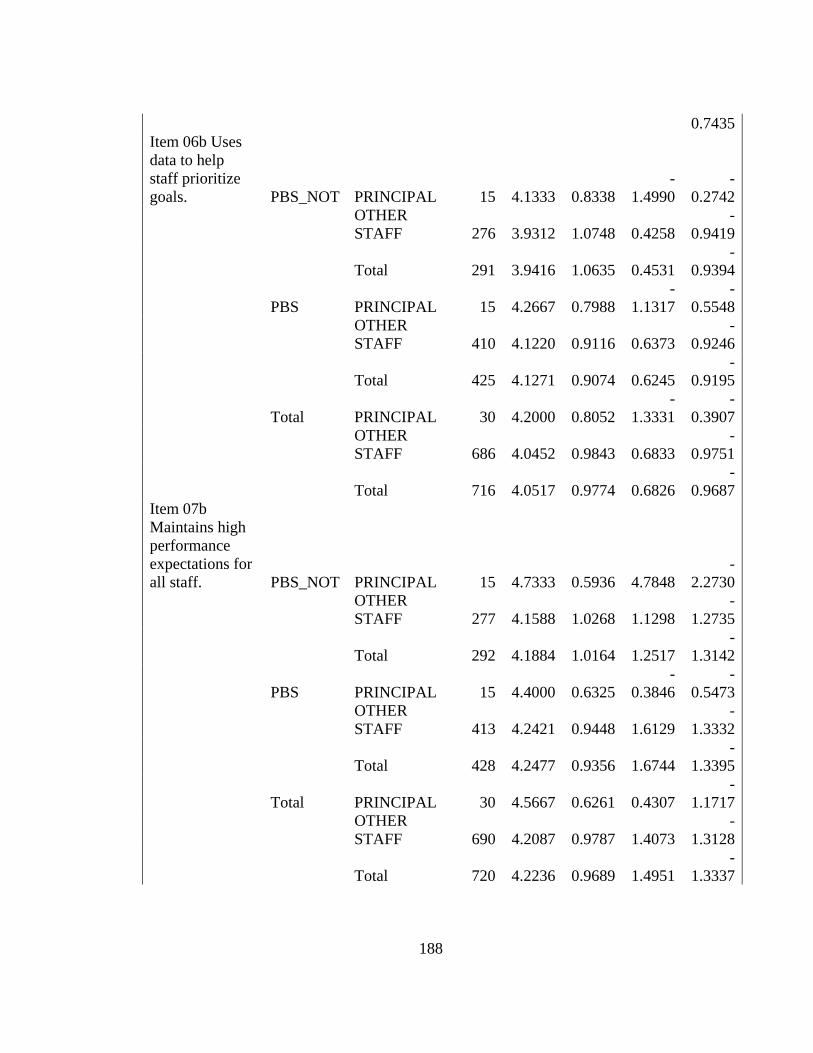
188
0.7435Item 06b Uses data to help staff prioritize goals. PBS_NOT PRINCIPAL 15 4.1333 0.8338
-1.4990
-0.2742
OTHER STAFF 276 3.9312 1.0748 0.4258
-0.9419
Total 291 3.9416 1.0635 0.4531-
0.9394
PBS PRINCIPAL 15 4.2667 0.7988 -
1.1317-
0.5548
OTHER STAFF 410 4.1220 0.9116 0.6373
-0.9246
Total 425 4.1271 0.9074 0.6245-
0.9195
Total PRINCIPAL 30 4.2000 0.8052 -
1.3331-
0.3907
OTHER STAFF 686 4.0452 0.9843 0.6833
-0.9751
Total 716 4.0517 0.9774 0.6826-
0.9687Item 07b Maintains high performance expectations for all staff. PBS_NOT PRINCIPAL 15 4.7333 0.5936 4.7848
-2.2730
OTHER STAFF 277 4.1588 1.0268 1.1298
-1.2735
Total 292 4.1884 1.0164 1.2517-
1.3142
PBS PRINCIPAL 15 4.4000 0.6325 -
0.3846-
0.5473
OTHER STAFF 413 4.2421 0.9448 1.6129
-1.3332
Total 428 4.2477 0.9356 1.6744-
1.3395
Total PRINCIPAL 30 4.5667 0.6261 0.4307-
1.1717
OTHER STAFF 690 4.2087 0.9787 1.4073
-1.3128
Total 720 4.2236 0.9689 1.4951-
1.3337

189
Item 08b Encourages/supports staff to self-evaluate goals progress. PBS_NOT PRINCIPAL 15 4.1333 0.7432
-0.9700
-0.2266
OTHER STAFF 277 3.9928 1.0286 0.4076
-0.9313
Total 292 4.0000 1.0153 0.4544-
0.9322
PBS PRINCIPAL 15 4.1333 0.8338 -
1.4990-
0.2742
OTHER STAFF 414 4.0435 0.9608 0.8436
-0.9925
Total 429 4.0466 0.9559 0.8242-
0.9803
Total PRINCIPAL 30 4.1333 0.7761 -
1.2608-
0.2417
OTHER STAFF 691 4.0232 0.9881 0.6488
-0.9686
Total 721 4.0277 0.9800 0.6577-
0.9613Item 09b Provides prof. dev. activities to support goals. PBS_NOT PRINCIPAL 15 4.3333 0.8165
-1.0220
-0.7402
OTHER STAFF 273 4.1319 1.0241 0.5604
-1.0948
Total 288 4.1424 1.0141 0.5831-
1.0963
PBS PRINCIPAL 15 4.4667 0.6399 -
0.1267-
0.8023
OTHER STAFF 406 4.1527 0.8700 0.9657
-0.9793
Total 421 4.1639 0.8642 1.0017-
0.9899
Total PRINCIPAL 30 4.4000 0.7240 -
0.6049-
0.7945
OTHER STAFF 679 4.1443 0.9343 0.8350
-1.0525
Total 709 4.1551 0.9274 0.8608-
1.0585
Item 10b Actively models skills that PBS_NOT PRINCIPAL 15 4.0667 0.7988
-1.3477
-0.1279

190
support school-wide goals.
OTHER STAFF 275 3.9636 0.9883 0.1466
-0.7494
Total 290 3.9690 0.9785 0.1540-
0.7409
PBS PRINCIPAL 14 4.5000 0.5189 -
2.3636 0.0000
OTHER STAFF 410 4.0073 0.9651 0.4966
-0.9001
Total 424 4.0236 0.9574 0.5708-
0.9240
Total PRINCIPAL 29 4.2759 0.7019 -
0.8016-
0.4464
OTHER STAFF 685 3.9898 0.9740 0.3345
-0.8364
Total 714 4.0014 0.9658 0.3758-
0.8460Item 11b Establishes leadership teams to guide implement. of goals. PBS_NOT PRINCIPAL 15 4.0667 0.7988 2.3229
-1.0981
OTHER STAFF 275 4.0836 1.0128 0.1623
-0.9543
Total 290 4.0828 1.0018 0.2083-
0.9572
PBS PRINCIPAL 15 4.4000 0.7368 -
0.4698-
0.8407
OTHER STAFF 409 4.2249 0.9173 1.1103
-1.1690
Total 424 4.2311 0.9114 1.1246-
1.1699
Total PRINCIPAL 30 4.2333 0.7739 0.9217-
0.9198
OTHER STAFF 684 4.1681 0.9586 0.6672
-1.0815
Total 714 4.1709 0.9512 0.6929-
1.0822Item 12b Provides and enforces clear PBS_NOT PRINCIPAL 15 4.2000 0.6761
-0.5048
-0.2560

191
school-wide systems.
OTHER STAFF 274 3.7993 1.0621
-0.2319
-0.6447
Total 289 3.8201 1.0485 -
0.1548-
0.6715
PBS PRINCIPAL 15 4.6667 0.4880 -
1.6154-
0.7882
OTHER STAFF 408 4.0833 1.0002 0.7042
-1.0562
Total 423 4.1040 0.9922 0.7948-
1.0875
Total PRINCIPAL 30 4.4333 0.6261 -
0.4528-
0.6350
OTHER STAFF 682 3.9692 1.0342 0.1986
-0.8731
Total 712 3.9888 1.0243 0.2744-
0.8989Item 13b Provides and enforces clear school-wide practices. PBS_NOT PRINCIPAL 15 4.2667 0.7037
-0.6691
-0.4330
OTHER STAFF 276 3.8297 1.0531
-0.2229
-0.6706
Total 291 3.8522 1.0416 -
0.1553-
0.6961
PBS PRINCIPAL 15 4.5333 0.6399 0.3975-
1.0846
OTHER STAFF 407 4.0467 0.9777 0.3359
-0.9041
Total 422 4.0640 0.9714 0.3883-
0.9252
Total PRINCIPAL 30 4.4000 0.6747 -
0.5167-
0.6930
OTHER STAFF 683 3.9590 1.0137 0.0644
-0.8071
Total 713 3.9776 1.0054 0.1210-
0.8282Item 14b Monitors/modifies systems and practices as needed. PBS_NOT PRINCIPAL 14 4.1429 0.7703
-1.1235
-0.2644

192
OTHER STAFF 275 3.8000 1.0533
-0.0157
-0.6682
Total 289 3.8166 1.0430 0.0290-
0.6807
PBS PRINCIPAL 15 4.2000 0.6761 -
0.5048-
0.2560
OTHER STAFF 408 3.9510 0.9827 0.1702
-0.7758
Total 423 3.9598 0.9740 0.2162-
0.7852
Total PRINCIPAL 29 4.1724 0.7106 -
0.8938-
0.2632
OTHER STAFF 683 3.8902 1.0137 0.0933
-0.7360
Total 712 3.9017 1.0043 0.1379-
0.7461Item 15b Keeps staff up-to-date on mods. to systems/practices. PBS_NOT PRINCIPAL 15 4.4000 0.6325
-0.3846
-0.5473
OTHER STAFF 276 3.8841 1.0926
-0.5109
-0.6442
Total 291 3.9107 1.0791 -
0.4259-
0.6833 PBS PRINCIPAL 15 4.2000 0.5606 0.3783 0.1123
OTHER STAFF 409 4.0807 1.0174 1.0549
-1.1587
Total 424 4.0849 1.0047 1.1424-
1.1689
Total PRINCIPAL 30 4.3000 0.5960 -
0.4821-
0.1885
OTHER STAFF 685 4.0015 1.0520 0.2588
-0.9323
Total 715 4.0140 1.0384 0.3496-
0.9538Item 16b Anticipates problems and effectively responds to them. PBS_NOT PRINCIPAL 15 4.1333 0.9155
-1.8607
-0.2931
OTHER STAFF 274 3.8212 1.1262
-0.3889
-0.6657

193
Total 289 3.8374 1.1170 -
0.3708-
0.6684
PBS PRINCIPAL 15 4.2000 0.8619 -
1.5453-
0.4325
OTHER STAFF 405 3.8889 1.0671 0.0586
-0.7967
Total 420 3.9000 1.0611 0.0726-
0.7989
Total PRINCIPAL 30 4.1667 0.8743 -
1.6362-
0.3440
OTHER STAFF 679 3.8616 1.0910
-0.1454
-0.7417
Total 709 3.8745 1.0839 -
0.1310-
0.7433Item 17b Assures school compliance with government regulations. PBS_NOT PRINCIPAL 15 4.4000 0.7368
-0.4698
-0.8407
OTHER STAFF 275 4.4655 0.8159 2.0635
-1.5326
Total 290 4.4621 0.8110 1.9711-
1.5030
PBS PRINCIPAL 14 4.2857 0.6112 -
0.2576-
0.1925
OTHER STAFF 408 4.4657 0.8016 3.2959
-1.7284
Total 422 4.4597 0.7961 3.2346-
1.6981
Total PRINCIPAL 29 4.3448 0.6695 -
0.6210-
0.5334
OTHER STAFF 683 4.4656 0.8068 2.7530
-1.6437
Total 712 4.4607 0.8016 2.6739-
1.6128Item 18b Promotes staff cohesion and cooperation. PBS_NOT PRINCIPAL 15 4.2667 0.7988
-1.1317
-0.5548
OTHER STAFF 275 4.0145 1.1525
-0.0060
-0.9940
Total 290 4.0276 1.1373 0.0588-
1.0066 PBS PRINCIPAL 15 4.2667 0.7988 3.8342 -

194
1.5249
OTHER STAFF 408 3.8946 1.1373 0.2468
-0.9802
Total 423 3.9078 1.1285 0.3086-
1.0007
Total PRINCIPAL 30 4.2667 0.7849 0.9033-
0.9827
OTHER STAFF 683 3.9429 1.1441 0.1272
-0.9779
Total 713 3.9565 1.1328 0.1922-
0.9958Item 19b Provides staff with materials/resources/planning times. PBS_NOT PRINCIPAL 15 4.6667 0.7237 2.5499
-1.9808
OTHER STAFF 276 4.2355 0.9866 0.7883
-1.2194
Total 291 4.2577 0.9785 0.8553-
1.2477
PBS PRINCIPAL 15 4.5333 0.6399 0.3975-
1.0846
OTHER STAFF 407 4.2162 0.8581 1.1529
-1.0891
Total 422 4.2275 0.8528 1.1880-
1.1003
Total PRINCIPAL 30 4.6000 0.6747 0.9574-
1.4726
OTHER STAFF 683 4.2240 0.9116 1.0018
-1.1562
Total 713 4.2398 0.9057 1.0442-
1.1737Item 20b Exposes staff to research and rationale for beh. mgmt.. PBS_NOT PRINCIPAL 15 4.0000 1.0000
-0.9121
-0.4945
OTHER STAFF 276 3.7210 1.1338
-0.2244
-0.6562
Total 291 3.7354 1.1274 -
0.2209-
0.6565
PBS PRINCIPAL 15 4.2000 0.8619 -
1.5453-
0.4325

195
OTHER STAFF 409 4.0171 0.9788 0.0426
-0.7908
Total 424 4.0236 0.9746 0.0342-
0.7863
Total PRINCIPAL 30 4.1000 0.9229 -
1.0164-
0.4907
OTHER STAFF 685 3.8978 1.0533 0.0074
-0.7662
Total 715 3.9063 1.0484 0.0029-
0.7628Item 21b Includes staff in decision-making about beh. mgmt. issues. PBS_NOT PRINCIPAL 15 4.1333 1.0601 5.0559
-1.9598
OTHER STAFF 276 3.7754 1.1186
-0.3379
-0.6465
Total 291 3.7938 1.1167 -
0.2509-
0.6926
PBS PRINCIPAL 14 4.5714 0.5136 -
2.2405-
0.3245
OTHER STAFF 411 3.8954 1.1137 0.0960
-0.8889
Total 425 3.9176 1.1054 0.1746-
0.9205
Total PRINCIPAL 29 4.3448 0.8567 7.4288-
2.2235
OTHER STAFF 687 3.8472 1.1164
-0.1112
-0.7866
Total 716 3.8673 1.1109 -
0.0319-
0.8226Item 22b Established leadership team to guide beh. mgmt. system. PBS_NOT PRINCIPAL 15 3.9333 1.2228 1.0129
-1.2085
OTHER STAFF 272 3.5588 1.2699
-0.7165
-0.4976
Total 287 3.5784 1.2682 -
0.6918-
0.5243
PBS PRINCIPAL 15 4.6000 0.7368 1.3201-
1.6320
OTHER STAFF 410 4.3390 0.9196 1.7955
-1.4620

196
Total 425 4.3482 0.9143 1.8200-
1.4702
Total PRINCIPAL 30 4.2667 1.0483 2.1262-
1.5416
OTHER STAFF 682 4.0279 1.1384 0.2680
-1.0431
Total 712 4.0379 1.1350 0.3062-
1.0584Item 23b Publicly supports the leadership team’s efforts. PBS_NOT PRINCIPAL 15 4.2667 0.7988
-1.1317
-0.5548
OTHER STAFF 273 3.8242 1.2827
-0.2344
-0.8992
Total 288 3.8472 1.2650 -
0.1433-
0.9264
PBS PRINCIPAL 15 4.6667 0.6172 2.6250-
1.7916
OTHER STAFF 411 4.2019 1.0196 1.2495
-1.3148
Total 426 4.2183 1.0113 1.3346-
1.3395
Total PRINCIPAL 30 4.4667 0.7303 -
0.3033-
1.0152
OTHER STAFF 684 4.0512 1.1461 0.5830
-1.1653
Total 714 4.0686 1.1345 0.6636-
1.1869Item 24b Is an active participant on the leadership team. PBS_NOT PRINCIPAL 15 4.2667 0.7988
-1.1317
-0.5548
OTHER STAFF 273 3.8388 1.2674
-0.1503
-0.9271
Total 288 3.8611 1.2500 -
0.0597-
0.9528
PBS PRINCIPAL 15 4.6000 0.7368 1.3201-
1.6320
OTHER STAFF 410 4.2122 1.0657 1.2676
-1.3816
Total 425 4.2259 1.0577 1.3305-
1.3986

197
Total PRINCIPAL 30 4.4333 0.7739 -
0.5923-
0.9581
OTHER STAFF 683 4.0630 1.1642 0.5744
-1.1910
Total 713 4.0785 1.1524 0.6455-
1.2084Item 25b Support leadership team formulating beh. mgmt. action plan. PBS_NOT PRINCIPAL 15 3.8667 1.1255 1.5758
-1.0910
OTHER STAFF 271 3.7159 1.2249
-0.3608
-0.7216
Total 286 3.7238 1.2185 -
0.3178-
0.7349
PBS PRINCIPAL 15 4.2000 0.7746 -
1.1172-
0.3830
OTHER STAFF 410 4.1927 0.9353 1.5415
-1.2575
Total 425 4.1929 0.9293 1.5218-
1.2430
Total PRINCIPAL 30 4.0333 0.9643 1.6786-
1.0588
OTHER STAFF 681 4.0029 1.0846 0.5957
-1.0669
Total 711 4.0042 1.0792 0.6212-
1.0668Item 26b Provides resources to implement beh. mgmt. plan. PBS_NOT PRINCIPAL 15 3.6667 1.1127 1.1375
-1.0237
OTHER STAFF 270 3.6037 1.2325
-0.6173
-0.5410
Total 285 3.6070 1.2247 -
0.5783-
0.5569
PBS PRINCIPAL 15 4.2667 0.7037 -
0.6691-
0.4330
OTHER STAFF 412 4.0485 0.9903 0.5350
-0.9738
Total 427 4.0562 0.9818 0.5775-
0.9801 Total PRINCIPAL 30 3.9667 0.9643 1.9141 -

198
1.1661
OTHER STAFF 682 3.8724 1.1132 0.0006
-0.8291
Total 712 3.8764 1.1069 0.0437-
0.8400Item 27b Supports/recognizes staff who implement beh. mgmt. plan. PBS_NOT PRINCIPAL 14 3.8571 1.0271
-1.2980
-0.1724
OTHER STAFF 269 3.7026 1.2342
-0.6424
-0.6174
Total 283 3.7102 1.2236 -
0.6291-
0.6122
PBS PRINCIPAL 15 4.0667 0.9612 -
0.3339-
0.7046
OTHER STAFF 412 3.8641 1.0901 0.2277
-0.8717
Total 427 3.8712 1.0855 0.2298-
0.8707
Total PRINCIPAL 29 3.9655 0.9814 -
0.9930-
0.4144
OTHER STAFF 681 3.8003 1.1510
-0.1806
-0.7708
Total 710 3.8070 1.1444 -
0.1770-
0.7666Item 28b Supports/recognizes students improved beh./social skills. PBS_NOT PRINCIPAL 15 4.0667 0.7988
-1.3477
-0.1279
OTHER STAFF 276 3.9819 1.0803 0.0092
-0.8704
Total 291 3.9863 1.0666 0.0391-
0.8652
PBS PRINCIPAL 15 4.4667 0.7432 -
0.1056-
1.0743
OTHER STAFF 413 4.0460 1.0241 0.6208
-1.0324
Total 428 4.0607 1.0179 0.6604-
1.0457
Total PRINCIPAL 30 4.2667 0.7849 -
1.1530-
0.5243

199
OTHER STAFF 689 4.0203 1.0467 0.3413
-0.9636
Total 719 4.0306 1.0378 0.3731-
0.9684Item 29b Informs stakeholders about meeting beh. mgmt. goals. PBS_NOT PRINCIPAL 15 3.4667 1.0601 0.8794
-0.7299
OTHER STAFF 276 3.5471 1.1853
-0.5783
-0.4759
Total 291 3.5430 1.1777 -
0.5469-
0.4798
PBS PRINCIPAL 15 4.0000 0.8452 0.9692-
0.8191
OTHER STAFF 412 3.8544 1.0640 0.0417
-0.7540
Total 427 3.8595 1.0566 0.0691-
0.7605
Total PRINCIPAL 30 3.7333 0.9803 0.8621-
0.8291
OTHER STAFF 688 3.7311 1.1236
-0.2567
-0.6485
Total 718 3.7312 1.1173 -
0.2306-
0.6529Item 30b Maintains beh. mgmt. standards/systems/practices. PBS_NOT PRINCIPAL 15 3.7333 0.7988 0.3796
-0.4154
OTHER STAFF 275 3.6145 1.2160
-0.4680
-0.6252
Total 290 3.6207 1.1973 -
0.4081-
0.6349
PBS PRINCIPAL 15 4.3333 0.6172 -
0.4038-
0.3116
OTHER STAFF 411 4.0341 1.0283 0.7031
-1.0557
Total 426 4.0446 1.0177 0.7811-
1.0720
Total PRINCIPAL 30 4.0333 0.7649 0.3532-
0.5530 OTHER 686 3.8659 1.1255 0.1141 -

200
STAFF 0.8866
Total 716 3.8729 1.1128 0.1692-
0.8955Item 31b Ensures all staff know/follow beh. mgmt. practices. PBS_NOT PRINCIPAL 15 3.8667 0.7432
-0.9700 0.2266
OTHER STAFF 274 3.6387 1.1724
-0.3825
-0.6259
Total 289 3.6505 1.1543 -
0.3120-
0.6375
PBS PRINCIPAL 15 4.1333 0.7432 -
0.9700-
0.2266
OTHER STAFF 412 4.0024 1.0288 0.7236
-1.0423
Total 427 4.0070 1.0197 0.7570-
1.0417
Total PRINCIPAL 30 4.0000 0.7428 -
1.1076 0.0000
OTHER STAFF 686 3.8571 1.1021 0.1506
-0.8700
Total 716 3.8631 1.0894 0.1978-
0.8718

201
Appendix I
Internal Consistency of Questionnaire Subscales Items Tables

202
Table B.ii
A1 Transformational Scale (Importance), Item Analysis If Item Deleted
Item
Scale
Mean if
Item
Deleted
Scale
Variance if
Item
Deleted
Corrected
Item-Total
Correlation
Alpha if
Item
Deleted
Item 01a Leads establishing school vision. 45.950 22.460 0.701 0.913
Item 02a Leads establishing goals to
implement vision. 46.010 21.984 0.752 0.910
Item 03a Encourages staff input 46.000 22.129 0.735 0.911
Item 04a Works toward staff consensus 46.090 22.074 0.635 0.916
Item 05a Models/uses problem-solving 46.140 21.652 0.719 0.911
Item 06a Uses data/ staff prioritize goals. 46.230 21.609 0.664 0.914
Item 07a Maintains high performance
expectations for all staff. 45.850 23.034 0.675 0.914
Item 08a Encourages/supports staff to
self-evaluate goals progress. 46.140 21.606 0.710 0.912
Item 09a Provides prof. dev. activities to
support goals. 46.050 22.154 0.646 0.915
Item 10a Actively models skills 46.060 22.022 0.682 0.913
Item 11a Establishes leadership teams 46.120 21.906 0.656 0.915

203
Table B.iii
A2 Managerial Scale (Importance), Item Analysis If Item Deleted
Item
Scale Mean
if Item
Deleted
Scale
Variance if
Item Deleted
Corrected
Item-Total
Correlation
Alpha if
Item
Deleted
Item 12a Provides and enforces
clear school-wide systems. 32.910 10.510 0.723 0.901
Item 13a Provides and enforces
clear school-wide practices. 32.880 10.513 0.768 0.896
Item 14a Monitors/modifies
systems and practices as needed. 32.960 10.388 0.758 0.897
Item 15a Keeps staff up-to-date on
mods. to systems/practices. 32.900 10.590 0.755 0.898
Item 16a Anticipates problems and
effectively responds to them. 32.920 10.613 0.705 0.902
Item 17a Assures school
compliance with government
regulations. 32.800 11.073 0.650 0.906
Item 18a Promotes staff cohesion
and cooperation. 32.800 11.006 0.694 0.903
Item 19a Provides staff with
materials/resources/planning 32.780 11.308 0.668 0.905

204
Table B.iv
A3 Behavior Management Scale (Importance), Item Analysis If Item Deleted
Item
Scale Mean
if Item
Deleted
Scale
Variance if
Item Deleted
Corrected
Item-Total
Correlation
Alpha if
Item
Deleted
Item 20a Exposes staff to
research/rationale for beh. mgmt.. 50.560 36.972 0.610 0.945
Item 21a Includes staff in
decisions about beh. mgmt. issues. 50.390 36.954 0.667 0.942
Item 22a Establish leadership team 50.440 35.314 0.777 0.939
Item 23a Publicly supports
leadership team’s efforts. 50.370 35.912 0.757 0.939
Item 24a Active participant on
leadership team. 50.340 36.295 0.714 0.941
Item 25a Support leadership team
beh. mgmt. action plan. 50.390 35.482 0.828 0.937
Item 26a Provides resources to
implement beh. mgmt. plan. 50.450 35.333 0.824 0.937
Item 27a Supports/recognizes staff
who implement beh. mgmt. plan. 50.480 35.934 0.724 0.941
Item 28a Supports/recognizes
students improved beh. skills. 50.280 37.230 0.713 0.941
Item 29a Informs all about
meeting beh. mgmt. goals. 50.480 35.779 0.756 0.939
Item 30a Maintains beh. mgmt.
standards/systems/practices. 50.340 36.396 0.796 0.938
Item 31a Ensures staff
know/follow beh. practices. 50.300 36.490 0.773 0.939

205
Table B.v
B1 Transformational Scale (Effectiveness), Item Analysis If Item Deleted
Item
Scale Mean
if Item
Deleted
Scale
Variance if
Item Deleted
Corrected
Item-Total
Correlation
Alpha if
Item
Deleted
Item 01b Leads establishing
school vision. 40.550 65.216 0.832 0.948
Item 02b Leads establishing goals 40.600 64.785 0.849 0.948
Item 03b Encourages staff input to
prioritize goals. 40.610 64.159 0.830 0.948
Item 04b Works toward staff
consensus 40.810 63.024 0.827 0.948
Item 05b Models and uses
problem-solving 40.900 63.206 0.828 0.948
Item 06b Uses data to help staff
prioritize goals. 40.690 65.171 0.747 0.951
Item 07b Maintains high
performance expectations for all
staff. 40.510 65.435 0.737 0.952
Item 08b Encourages/supports
staff to self-evaluate goals
progress. 40.690 64.324 0.813 0.949
Item 09b Provides prof. dev.
activities to support goals. 40.560 66.710 0.695 0.953
Item 10b Actively models skills
that support school-wide goals. 40.730 64.557 0.806 0.949
Item 11b Establishes leadership
teams to guide goals. 40.550 65.937 0.720 0.952

206
Table B.vi
B2 Managerial scale (Effectiveness), Item Analysis If Item Deleted
Item
Scale Mean
if Item
Deleted
Scale
Variance if
Item Deleted
Corrected
Item-Total
Correlation
Alpha if
Item
Deleted
Item 12b Provides and enforces
clear school-wide systems. 28.530 32.850 0.817 0.923
Item 13b Provides and enforces
clear school-wide practices. 28.540 32.832 0.836 0.921
Item 14b Monitors/modifies
systems and practices as needed. 28.620 32.744 0.845 0.921
Item 15b Keeps staff up-to-date on
mods. to systems/practices. 28.500 32.798 0.808 0.923
Item 16b Anticipates problems
and effectively responds to them. 28.640 32.350 0.800 0.924
Item 17b Assures school
compliance with government
regulations. 28.070 35.991 0.701 0.931
Item 18b Promotes staff cohesion
and cooperation. 28.550 32.469 0.763 0.927
Item 19b Provides staff with
materials/resources/planning
times. 28.280 36.115 0.613 0.936

207
Table B.vii
B3 Behavior Management Scale (Effectiveness), Item Analysis If Item Deleted
Item
Scale Mean
if Item
Deleted
Scale
Variance if
Item Deleted
Corrected
Item-Total
Correlation
Alpha if
Item
Deleted
Item 20b Exposes staff to beh.
mgmt. research and rationale 43.330 104.764 0.724 0.958
Item 21b Includes staff in
decisions about beh. mgmt. 43.360 102.889 0.769 0.957
Item 22b Establish team to guide
beh. mgmt. system. 43.200 102.736 0.756 0.957
Item 23b Publicly supports the
leadership team’s efforts. 43.160 101.564 0.813 0.955
Item 24b Active participant on
leadership team. 43.160 101.887 0.779 0.956
Item 25b Support leadership team 43.230 101.503 0.860 0.954
Item 26b Provides resources to
implement beh. mgmt. plan. 43.350 101.259 0.857 0.954
Item 27b Supports/recognizes staff
who use beh. mgmt. plan. 43.420 101.891 0.791 0.956
Item 28b Supports/recognizes
students improved beh. skills. 43.200 105.165 0.720 0.958
Item 29b Informs stakeholders
about beh. mgmt. goals. 43.500 101.970 0.813 0.955
Item 30b Maintains beh. mgmt.
standards/systems/practices. 43.350 101.414 0.846 0.954
Item 31b Ensures staff
know/follow beh. practices. 43.360 102.138 0.825 0.955

208
Appendix J
Descriptive Statistics for Reduced and Transformed Datasets

209
Table B.viii
Descriptive statistics for the reduced dataset
Dependent Variable N Min. Max. Mean SD Skew. Kurtosis
A1 Transformational
Scale (Importance) 200 1 5 4.5932 0.4808 -2.8199 * 15.4642
A2 Managerial Scale
(Importance) 200 1 5 4.6655 0.5050 * -3.1465 * 16.1654
A3 Behavior
Management Scale
(Importance)
200 1 5 4.5281 0.6165 -2.3380 * 8.5221
B1 Transformational
Scale (Effectiveness) 201 1.4545 5 4.0886 0.7610 -0.9142 0.9834
B2 Managerial scale
(Effectiveness) 201 1.3750 5 4.0845 0.7810 -0.7770 0.0823
B3 Behavior
Management Scale
(Effectiveness)
201 1.3636 5 3.9624 0.8493 -0.7798 0.2188
* Relatively large (>3.0000) skewness and kurtosis values

210
Table B.ix
Descriptive Statistics for the Reduced Dataset, by ANOVA Main Effects, PBS Status and
Position
Scale Main Effect N Skew. Kurt.Non-PBS 81 -1.2843 1.8024PBS 119 * -3.5704 * 21.5546Principal 30 -1.1430 0.2884
A1 Transformational
Scale (Importance) Cert. Staff 170 -2.8013 * 14.8414Non-PBS 81 -2.1290 * 7.8999PBS 119 * -3.6429 * 19.7931Principal 30 -0.6922 -1.0267
A2 Managerial Scale
(Importance) Cert. Staff 170 * -3.2047 * 15.8433Non-PBS 81 -1.5549 * 4.3208PBS 119 * -3.1722 * 14.7037Principal 30 -0.6695 -0.9113
A3 Behavior
Management Scale
(Importance) Cert. Staff 170 -2.5002 * 9.2117Non-PBS 83 -0.8017 0.7859PBS 118 -0.9937 1.2269Principal 30 0.1472 -0.9872
B1 Transformational
Scale (Effectiveness) Cert. Staff 171 -0.8765 0.7093Non-PBS 83 -0.6740 -0.3004PBS 118 -0.8581 0.4764Principal 30 -0.6123 0.0039
B2 Managerial scale
(Effectiveness) Cert. Staff 171 -0.7087 -0.1173Non-PBS 83 -0.4952 -0.1244PBS 118 -0.9980 0.8151Principal 30 -0.3834 -0.3027
B3 Behavior
Management Scale
(Effectiveness) Cert. Staff 171 -0.7521 0.0615• Relatively large (>3.0000) skewness and kurtosis values
Table B.x
Descriptive Statistics for the Reduced and Transformed Dataset
Dependent Variable N Min. Max. Mean SD Skew. KurtosisA1(RI)
Transformational
Scale (Importance)
200 0.2000 1 0.7703 0.1935 -0.3375 -0.8922
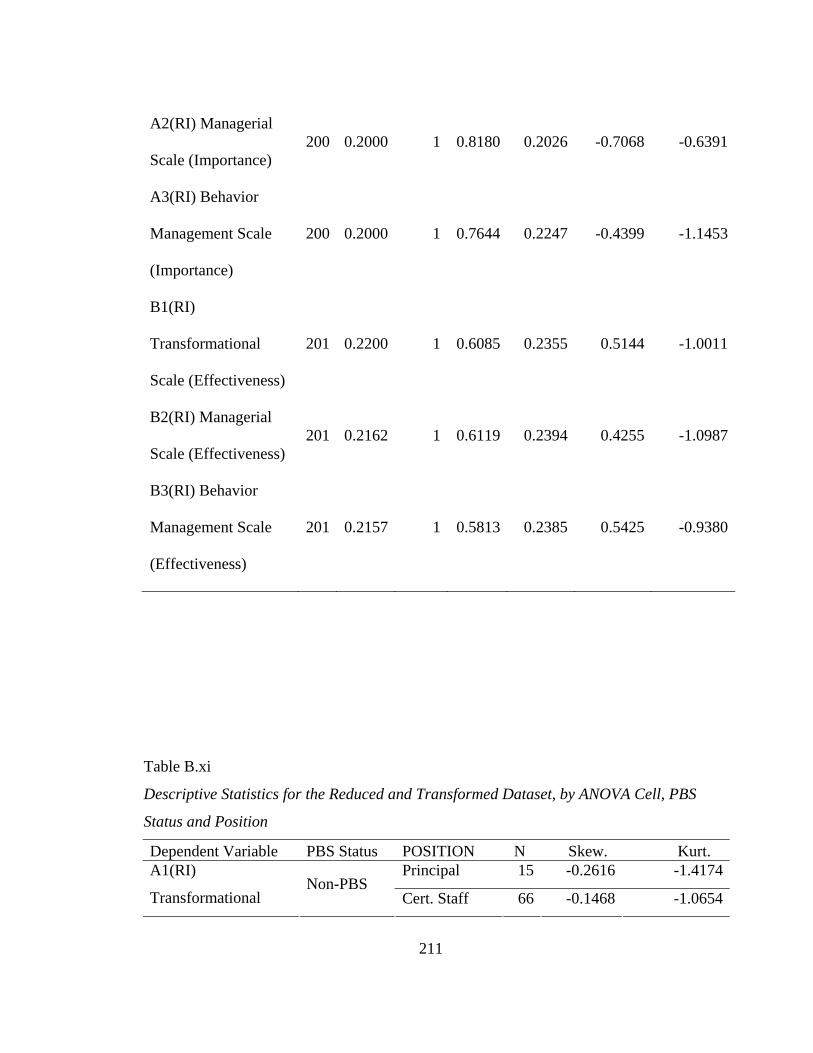
211
A2(RI) Managerial
Scale (Importance) 200 0.2000 1 0.8180 0.2026 -0.7068 -0.6391
A3(RI) Behavior
Management Scale
(Importance)
200 0.2000 1 0.7644 0.2247 -0.4399 -1.1453
B1(RI)
Transformational
Scale (Effectiveness)
201 0.2200 1 0.6085 0.2355 0.5144 -1.0011
B2(RI) Managerial
Scale (Effectiveness) 201 0.2162 1 0.6119 0.2394 0.4255 -1.0987
B3(RI) Behavior
Management Scale
(Effectiveness)
201 0.2157 1 0.5813 0.2385 0.5425 -0.9380
Table B.xi
Descriptive Statistics for the Reduced and Transformed Dataset, by ANOVA Cell, PBS
Status and Position
Dependent Variable PBS Status POSITION N Skew. Kurt. Principal 15 -0.2616 -1.4174A1(RI)
Transformational Non-PBS
Cert. Staff 66 -0.1468 -1.0654

212
Principal 15 -0.7260 0.2020Scale (Importance) PBS
Cert. Staff 104 -0.3918 -0.7750
Principal 15 -0.1128 -1.7516Non-PBS
Cert. Staff 66 -0.4170 -1.0405
Principal 15 -0.5890 -1.2743A2(RI) Managerial
Scale (Importance) PBS
Cert. Staff 104 -1.0173 0.0328
Principal 15 0.2931 -1.6821Non-PBS
Cert. Staff 66 -0.1335 -1.4059
Principal 15 -0.5361 -1.4819
A3(RI) Behavior
Management Scale
(Importance) PBS
Cert. Staff 104 -0.7429 -0.5453
Principal 15 0.9944 -0.6023Non-PBS
Cert. Staff 68 0.6351 -0.8803
Principal 15 0.7485 -0.8621
B1(RI)
Transformational
Scale (Effectiveness) PBS
Cert. Staff 103 0.4314 -1.0915
Principal 15 0.3301 -1.2705Non-PBS
Cert. Staff 68 0.6236 -0.8361
Principal 15 0.6524 -1.0036B2(RI) Managerial
Scale (Effectiveness) PBS
Cert. Staff 103 0.3585 -1.2043
Principal 15 1.3526 1.3781Non-PBS
Cert. Staff 68 0.9277 -0.2533
Principal 15 0.5929 -0.9294
B3(RI) Behavior
Management Scale
(Effectiveness) PBS
Cert. Staff 103 0.3189 -1.1952
Table B.xii
Levene’s Test for Homogeneity of Error Variances for Transformed Data
Dependent variable (scale) F df1 df2 Sig.
A1 Transformational Scale (Importance) 1.73825 3 196 0.16047

213
A2 Managerial Scale (Importance) 0.37200 3 196 0.77329
A3 Behavior Management Scale (Importance) 1.34259 3 196 0.26178
B1 Transformational Scale (Effectiveness) 0.41805 3 197 0.74024
B2 Managerial scale (Effectiveness) 0.26318 3 197 0.85187
B3 Behavior Management Scale (Effectiveness) 1.35295 3 197 0.25848
The design for each test was: Intercept + PBS Status + Position + PBS Status x Position
Appendix K
Tables Reporting Student and School Demographic Characteristics

214
Table B.xiii
Schools surveyed, F/R Lunch and Race/Ethnicity by PBS Status
PBS Non-PBS PBS Non-PBS
School F/R Lunch % F/R Lunch % Race % Race %

215
1 35 39 06 43
2 59 64 98 97
3 12 20 08 01
4 53 50 09 13
5 60 53 06 06
6 17 27 20 17
7 23 22 21 25
8 41 43 75 41
9 52 48 25 24
10 16 27 22 13
11 43 49 08 12
12 43 42 28 33
13 63 59 49 58
14 77 75 66 72
15 17 14 26 41
Table B.xiv
Schools Surveyed, Enrollment and Geographic Location by SW-PBS Status
PBS Non-PBS PBS Non-PBS

216
Obs.
# Students
Enrolled
# Students
Enrolled
Geographic
Location
Geographic
Location
1 522 296 Small town rural
2 431 666 city city
3 456 435 City/fringe City/fringe
4 115 239 rural Small town
5 135 198 rural rural
6 505 870 city City/fringe
7 432 417 city city
8 330 341 City/fringe rural
9 329 334 city Small town
10 420 462 city city
11 577 330 Small town Small town
12 656 1070 Mid-size city Small town
13 439 351 city rural
14 227 371 Mid-size city city
15 656 245 Mid-size city rural
Table B.xv
Schools Surveyed, Number of Certified Staff and Communication Arts AYP ‘Met’ Status by SW-PBS Status

217
PBS Non-PBS PBS Non-PBS
Obs.
# Certified
Staff
# Certified
Staff
# Last 4 Years
Met AYP in
CA
# Last 4 Years
Met AYP in
CA
1 50 22 4 4
2 37 45 3 0/1*
3 30 23 4 4
4 18 23 4 4
5 16 21 2 4
6 38 48 4 4
7 35 34 4 4
8 25 32 4 4
9 35 35 4 4
10 32 29 4 4
11 57 33 4 4
12 57 74 4 4
13 35 29 4 4
14 31 46 4 4
15 53 23 4 4
• School has been in existence two years
Table B.xvi
Schools Surveyed, Mathematics AYP ‘Met’ Status and Average Attendance by PBS Status
PBS Non-PBS PBS Non-PBS

218
Obs.
# Last 4 Years
Met AYP in
Math
# Last 4 Years
Met AYP in
Math
Attendance
Avg. 2002 to
2005
Attendance
Avg. 2002 to
2005
1 4 4 96.1 95.0
2 3 1/1* 95.0 94.7
3 4 4 96.1 95.2
4 4 4 94.1 96.1
5 4 4 94.3 95.3
6 4 4 95.3 94.6
7 4 4 95.9 95.6
8 4 4 95.7 95.0
9 4 4 95.4 95.3
10 4 4 95.6 94.9
11 4 4 95.5 95.7
12 4 4 94.3 95.1
13 4 4 95.3 95.7
14 4 4 94.3 94.5
15 4 4 96.2 95.4
* School has been in existence two years
Table B.xvii
Students by Disability and E/BD Status and by SW-PBS Status

219
SW-
PBS
School
Pct. Students
Identified with
Disability
Pct. Students
Identified with
E/BD
Non-
PBS
School
Pct. Students
Identified with
Disability
Pct. Students
Identified with
E/BD
1 20.3 1.0 1 20.8 .6
2 18.3 1.4 2 15.7 0
3 21.3 0 3 13.4 1.4
4 11.3 0 4 10.8 .9
5 9.6 0 5 22.4 .5
6 20.1 1.8 6 11.7 .2
7 17.1 0 7 13.1 0
8 11.5 .6 8 14.5 0
9 25.2 2.4 9 8.4 0
10 18.8 1.2 10 18.6 0
11 31.7 .7 11 32.2 .5
12 15.9 1.1 12 13.7 .7
13 12.8 .2 13 14.7 .4
14 15.4 2.2 14 15.9 1.2
15 12.8 0 15 10.1 .3
Average 17.5 .8 Average 15.7 .45

220
Appendix L
Tables of Demographics Related to Questionnaire Respondents
Table B.xviii
Item 3_1, Respondents by Sex and SW-PBS Status
PBS Descr. Sex Frequency Percent Valid Cumulative

221
STATUS Percent Percent Female 267 91.1 92.4 92.4
Male 22 7.5 7.6 100.0Valid
Total 289 98.6 100.0
Missing System 4 1.4
NON-PBS
Total 293 100.0
Female 385 89.1 90.8 90.8
Male 39 9.0 9.2 100.0Valid
Total 424 98.1 100.0
Missing System 8 1.9
SW-PBS
Total 432 100.0
Table B.xix
Item 3_2, Respondents by Highest Degree Attained and SW-PBS Status
PBS Descr. Highest Degree Frequency Percent Valid Cumulative

222
STATUS Attained Percent Percent Bachelor's 116 39.6 39.7 39.7
Master's 156 53.2 53.4 93.2
Specialist 18 6.1 6.2 99.3
Ed.D. 2 0.7 0.7 100.0
Valid
Total 292 99.7 100.0
Missing System 1 0.3
NON-PBS
Total 293 100.0
Bachelor's 113 26.2 26.7 26.7
Master's 268 62.0 63.2 89.9
Specialist 37 8.6 8.7 98.6
Ed.D. 5 1.2 1.2 99.8
Ph.D. 1 0.2 0.2 100.0
Valid
Total 424 98.1 100.0
Missing System 8 1.9
SW-PBS
Total 432 100.0
Table B.xx

223
Item 3_3, Respondents by Current Position and SW-PBS Status
PBS STATUS Descr. Current Position Frequency Percent
Valid Percent
Cumulative Percent
General Education
Teacher 198 67.6 68.0 68.0
Special Education
Teacher 33 11.3 11.3 79.4
Principal 15 5.1 5.2 84.5
Asst. principal 2 0.7 0.7 85.2
Other 43 14.7 14.8 100.0
Valid
Total 291 99.3 100.0
Missing System 2 0.7
NON-
PBS
Total 293 100.0
General Education
Teacher 275 63.7 65.8 65.8
Special Education
Teacher 52 12.0 12.4 78.2
Principal 13 3.0 3.1 81.3
Asst. principal 8 1.9 1.9 83.3
Other 70 16.2 16.7 100.0
Valid
Total 418 96.8 100.0
Missing System 14 3.2
SW-PBS
Total 432 100.0
Table B.xxi

224
Item 3_4, Respondents by Race and SW-PBS Status
PBS STATUS Descr. Race Frequency Percent
Valid Percent
Cumulative Percent
Hispanic 3 1.0 1.1 1.1
African American 19 6.5 6.7 7.8
Caucasian 253 86.3 89.7 97.5
Asian 3 1.0 1.1 98.6
American Indian 4 1.4 1.4 100.0
Valid
Total 282 96.2 100.0
Missing System 11 3.8
NON-PBS
Total 293 100.0
Hispanic 1 0.2 0.2 0.2
African American 12 2.8 2.9 3.1
Caucasian 399 92.4 95.2 98.3
Asian 5 1.2 1.2 99.5
American Indian 2 0.5 0.5 100.0
Valid
Total 419 97.0 100.0
Missing System 13 3.0
SW-PBS
Total 432 100.0
Table B.xxii

225
Item 3_6, Respondents by Years of General Education Teaching Experience and SW-PBS Status
PBS
STATUS
Years of General
Education Teaching
Experience Frequency Percent
Valid
Percent
Cumulative
Percent
0 Yrs. 33 11.3 11.3 11.3
1 - to 5 Yrs. 67 22.9 22.9 34.1
6 to 10 Yrs. 74 25.3 25.3 59.4
11 to 15 Yrs. 35 11.9 11.9 71.3
16 to 20 Yrs. 37 12.6 12.6 84.0
21 to 25 Yrs. 28 9.6 9.6 93.5
26+ Yrs. 19 6.5 6.5 100.0
NON-
PBS
Total 293 100.0 100.0
0 Yrs. 58 13.4 13.4 13.4
1 - to 5 Yrs. 106 24.5 24.5 38.0
6 to 10 Yrs. 88 20.4 20.4 58.3
11 to 15 Yrs. 54 12.5 12.5 70.8
16 to 20 Yrs. 47 10.9 10.9 81.7
21 to 25 Yrs. 31 7.2 7.2 88.9
26+ Yrs. 48 11.1 11.1 100.0
SW-PBS
Total 432 100.0 100.0
Table B.xxiii

226
Item 3_8, Respondents by Years of Special Education Teaching Experience and SW-PBS Status
PBS
STATUS
Years of Special
Education Teaching
Experience Frequency Percent
Valid
Percent
Cumulative
Percent
0 Yrs. 226 77.1 77.1 77.1
1 - to 5 Yrs. 31 10.6 10.6 87.7
6 to 10 Yrs. 12 4.1 4.1 91.8
11 to 15 Yrs. 8 2.7 2.7 94.5
16 to 20 Yrs. 6 2.0 2.0 96.6
21 to 25 Yrs. 6 2.0 2.0 98.6
26+ Yrs. 4 1.4 1.4 100.0
NON-
PBS
Total 293 100.0 100.0
0 Yrs. 333 77.1 77.1 77.1
1 - to 5 Yrs. 44 10.2 10.2 87.3
6 to 10 Yrs. 19 4.4 4.4 91.7
11 to 15 Yrs. 10 2.3 2.3 94.0
16 to 20 Yrs. 12 2.8 2.8 96.8
21 to 25 Yrs. 9 2.1 2.1 98.8
26+ Yrs. 5 1.2 1.2 100.0
SW-PBS
Total 432 100.0 100.0
Table B.xxiv

227
Item 3_10, Respondents by Years Experience as a Principal and SW-PBS Status
PBS
STATUS
Years Experience as
a Principal Frequency Percent
Valid
Percent
Cumulative
Percent
0 Yrs. 278 94.9 94.9 94.9
1 - to 5 Yrs. 6 2.0 2.0 96.9
6 to 10 Yrs. 4 1.4 1.4 98.3
11 to 15 Yrs. 4 1.4 1.4 99.7
21 to 25 Yrs. 1 0.3 0.3 100.0
NON-
PBS
Total 293 100.0 100.0
0 Yrs. 416 96.3 96.3 96.3
1 - to 5 Yrs. 5 1.2 1.2 97.5
6 to 10 Yrs. 7 1.6 1.6 99.1
11 to 15 Yrs. 2 0.5 0.5 99.5
21 to 25 Yrs. 2 0.5 0.5 100.0
SW-PBS
Total 432 100.0 100.0

228
References
Abbey, D.E., & Esposito, J.P. (2001). Social supports and principal leadership style: A
means to reduce teacher stress. Education, 105, 327-332.
Abbott, M., Walton, C., Tapia, Y., & Greenwood, C.R. (1999). Research to practice: A
blueprint for closing the gap in local schools. Exceptional Children, 65, 339-352.
Alberto, P. A., & Troutman, A. C. (2003). Applied behavior analysis for teachers (6th
ed.). Upper Saddle River, NJ, Columbus, OH: Merrill Prentice Hall.
Alreck, P. L., & Settle, R. B. (2004). The survey research handbook (3rd ed.). New York,
NY: McGraw-Hill/Irwin: The McGraw-Hill Companies, Inc.
Babbie, E. R. (1990). Survey research methods (2nd ed.). Belmont, CA: Wadsworth, Inc.
Barnette, J. J. (2001, October). Practical measurement issues associated with data from
Likert Scales. Statistics (Sponsor), Methodological issues in health surveys.
Symposium conducted at the meeting of the American Public Health Association,
Atlanta, GA.
Bays, D. A. (2004). Science in the schoolhouse: The critical role of the school leader.
Journal of Learning Disabilities, 37, 256-261.
Bentley, R. R., & Rempel, A. M. (1970). Purdue teacher opinionnaire. In P. E. Lester &
L. K. Bishop (Volume Eds.) Handbook of tests and measurement in education
and the social sciences. (1997). Lancaster, PA: Technomic Publishing Co.
Blasé, J., & Blasé, J. (2000). Effective instructional leadership: Teachers’ perspectives on
how principals promote teaching and learning in schools. Journal of Educational
Administration, 38, 130-141.

229
Bogler, R. (2001). The influence of leadership style on teacher job satisfaction.
Educational Administration Quarterly, 37, 662-683.
Borg, W. R., & Gall, M. D. (1989). Educational research: An introduction (5th ed.).
White Plains, NY: Longman, Inc.
Boscardin, M. L. (2004). Transforming administration to support science in the
schoolhouse for students with disabilities. Journal of Learning Disabilities, 37,
262-269.
Boudah, D. J., Logan, K. R., & Greenwood, C. R. (2001). The research to practice
projects: Lessons learned about changing teacher practice. Teacher Education and
Special Education, 24, 290-303.
Brotherson, M. J., Sheriff, G., Milburn, P., & Schertz, M. (2001). Elementary school
principals and their needs and issues for inclusive early childhood programs.
Topics in Early Childhood Education, 21, 31-145.
Byrnes, M. A. (2000). Accommodations for students with disabilities: Removing barriers
to learning. Principal Leadership, (84), 613, 21-27.
Charles, C. M. (1999). Building classroom discipline (6th ed.). New York, NY:
Addison Wesley Longman, Inc.
Charting the Changes. (2004, November 26). The Special Educator, 20(9), 3-5.
Colvin, G., & Sprick, R. (1999). Providing administrative leadership for effective
behavior support: Ten strategies for principals. Effective School Practices,
(17), 65-71.
Colvin, G., Wilbanks, D., Borg, J., Dickey, C., Duncan, M., Gilmore, M., Henery, J.,

230
& Shaw, S. (1996). Establishing an effective school-wide discipline plan: Getting
all staff on board. (The Oregon Conference Monograph, Vol. 8). Eugene, Oregon:
University of Oregon College of Education.
Cook, B. G., Semmel, M. I., & Gerber, M. M. (1999). Attitudes of principals and
Special education teachers toward the inclusion of students with mild disabilities.
Remedial and Special Education, 20, 199-207.
Copland, M. A. (2001). The myth of the superprincipal. Phi Delta Kappan, 82, 528-533.
Cotton, K. (2003). Principals and student achievement: What the research says.
Alexandria, VA: Association for Supervision and Curriculum Development.
Council of Chief State School Officers (CCSSO). (1996). Interstate School
Leaders Licensure Consortium Standards for School Leaders. Retrieved
September
11, 2004 from: http://www.ccsso.org/content/pdfs/isllcstd.pdf
Council for Exceptional Children. (2002). No child left behind act of 2001. Implications
For special education in policy and practice: Title I improving the academic
achievement of the disadvantaged. Washington, D.C.: Author.
Council for Exceptional Children. (2004). The new IDEA. CEC’s summary of significant
issues. Arlington, VA: Author. Retrieved December 13, 2004 from:
http://www.cec.sped.org/pp/IDEA_120204.pdf
Coyne, M. D., Kame’enui, E. J., & Simmons, D. C. (2004). Improving beginning reading
instruction and intervention for students with LD: Reconciling “all” with “each”.
Journal of Learning Disabilities, 37, 231-239.

231
Creswell, J. W. (1998). Qualitative inquiry and research design: Choosing among five
traditions. Thousand Oaks, CA: Sage Publications.
Creswell, J. W. (2003). Research design: Qualitative, quantitative, and mixed methods
approaches. (2nd ed.). Thousand Oaks, CA: Sage Publications, Inc.
Crockett, J. B. (2002). Special education’s role in preparing responsive leaders for
inclusive schools. Remedial and Special Education, (23), 157-168.
Curtis, M.J., & Stollar, S.A. (1996). Applying principles and practices of organizational
change to school reform. School Psychology Review, 25, 409-417.
Czaja, R., & Blair, J. (2005). Designing surveys: A guide to decisions and procedures
(2nd ed.). Thousand Oaks, CA: Pine Forge Press, A Sage Publications Company.
Davis, S., Darling-Hammond, L., LaPointe, M. A., & Meyerson, D. (2005). School
leadership study: Preparing successful principals. Review of Research. Stanford,
CA: Stanford University.
Day, C. (2000). Beyond transformational leadership. Educational Leadership,
(57), 7, 56-59.
DiPaola, M. F., & Tschannen-Moran, M. (2003). The principalship at a crossroads: A
study of the conditions and concerns of principals. NASSP Bulletin, 87(634), 43-
65.
DiPaola, M. F., & Walther-Thomas, C. (2003). Principals and special education: The
critical role of school leaders (ED/OSERS Report No. COPSSE-IB-7). National
Clearinghouse for Professions in Special Education, Arlington, VA; Florida
University, Gainesville. Center on Personnel Studies in Special Education.

232
Dunlap, G., Hieneman, M., Knoster, T., Fox, L., Anderson, J., & Albin, R.W. (2000).
Essential elements of inservice training in positive behavior support. Journal of
Positive Behavior Interventions, 2, 22-32.
Embich, J. L. (2001). The relationship of secondary special education teachers’ roles and
factors that lead to professional burnout. Teacher Education and Special
Education, 24, 58-69.
Epstein, M. H., Nordness, P. D., Gallagher, K., Nelson, J. R., Lewis, L., & Schrepf, S.
(2005). School as the entry point: Assessing adherence to the basic tenets of the
wraparound approach. Behavioral Disorders, 30, 85-93.
Ferguson, F., & Takane, Y. (1989). Statistical analysis in psychology and education (4th
ed.). New York, NY: McGraw-Hill.
Gay, L. R., & Airasian, P. (2003). Educational research: Competencies for analysis and
applications (7th ed.). Upper Saddle River, NJ: Merrill Prentice Hall.
George, N. L., & George, M. P. (1995). To leave or to stay? An exploratory study of
teachers of students with emotional and behavioral disorders. Remedial and
Special Education, 16, 227-236.
Gersten, R., Fuchs, L. S., Compton, D., Coyne, M., Greenwood, C., & Innocenti, M. S.
(2005). Quality indicators for group experimental and quasi-experimental
research in special education. Exceptional Children, 71, 149-164.
Goor, M. B., & Schwenn, J. O. (1997). Preparing principals for leadership in special
education. Intervention in School & Clinic, 32, 133-141.
Gottfredson, G. D., & Gottfredson, D. C. (2001). What schools do to prevent problem

233
behavior and promote safe environments. Journal of Educational and
Psychological Consultation, 12, 313-344.
Gresham, F. M. (1998). Social skills training: Should we raze, remodel, or rebuild?
Behavioral Disorders, 24, 19-25.
Guthrie, P. (2002). School-based Practices and Programs that Promote Safe and
Drug-free Schools (Vol. Ed.). In J. Chapple, L. M. Bullock, and R. A. Gable
(Series Eds.) CASE/CCBD mini-library series on safe, drug-free, and effective
schools. Reston, VA: Council for Children with Behavioral Disorders and the
Council of Administrators of Special Education, Division of the Council for
Exceptional Children.
Hale, E. L. & Moorman, H. N. (2003). Preparing school principals: A national
perspective on policy and program innovations. Institute for Educational
Leadership, Washington, DC and Illinois Education Research Council,
Edwardsville, IL.
Hallinger, P., & Heck, R. H. (1998). Exploring the principal’s contribution to school
effectiveness: 1980-1995. School Effectiveness and School Improvement, 9,157-
191.
Heck, R. H. & Hallinger, P. (1999). Next generation methods for the study of leadership
and school improvement. In J. Murphy and K. S. Louis (Eds.) Handbook of
Research on Education Administration (2nd ed.), 141-162. San Francisco, CA:
Jossey-Bass, Inc.

234
Hoachlander, G., Alt, M. & Beltranena, R. (2001). Leading school improvement: What
research says, A review of the literature. Southern Regional Education Board,
Retrieved October 7, 2002 from, http://www.sreb.org
Hodgson, P. (2003). Usability test data. Retrieved July 5, 2004 from:
http://www.userfocus.co.uk./articles/datathink.html
Horner, R. H. & Sugai, G. (2000). School-wide positive behavior support: An emerging
initiative. Journal of Positive Behavior Interventions, (2), 231-232.
Horner, R. H., Sugai, G., & Horner, H. F. (2000). A school-wide approach to student
discipline. The School Administrator, 57(2), 20-23.
Horner, R. H., Sugai, G., Todd, A. W. & Lewis-Palmer, T. (2005). School-wide positive
behavior support. In L. Bambara & L. Kern (Eds.) Individualized supports for
students with problem behaviors: Designing positive behavior plans. (pp. 359-
390). New York: Guilford Press.
Horner, R. H., Todd, A.W., Lewis-Palmer, T., Irvin, L.K., Sugai, G.,& Boland, J.B.
(2004). The school-wide evaluation tool (SET): A research instrument for
assessing school-wide positive behavior support. Journal of Positive Behavior
Interventions, 6, 3-12.
Irvin, L. K., Tobin, T. J., Sprague, J. R., Sugai, G., & Vincent, C. G. (2004). Validity of
office discipline referral measures as indices of school-wide behavioral status and
effects of school-wide behavioral interventions. Journal of Positive Behavior
Interventions, 6, 131-147.

235
Irvin, L. K., Horner, R. H., Ingram, K., Todd, A. W., Sugai, G., Sampson, N. K., &
Boland, J. B. (2006). Using office discipline referral data for decision making
about student behavior in elementary and middle schools: An empirical evaluation
of validity. Journal of Positive Behavior Interventions, 8, 10-23.
Jackson, R., Harper, K., Jackson, J. (2002). Effective teaching practices and the barriers
limiting their use in accessing the curriculum: A review of recent literature.
Retrieved September 16, 2002, from: http://www.cast.org/ncac/index
Jackson, B. L. & Kelley, C. (2002). Exceptional and innovative programs in educational
leadership. Educational Administration Quarterly, 38, 192-212.
Jantzi, D. & Leithwood, K. (1996). Toward an explanation of variations in teachers’
perceptions of transformational school leadership. Educational Administration
Quarterly, 32, 512-538.
Johnson, S. M., & Birkeland, S. E. (2003). Pursuing a “sense of success”: New teachers
explain their career decisions. American Educational Research Journal, 40, 581-
617.
Kamps, D., Kravits, T., Stolze, J., & Swaggart, B. (1999). Prevention strategies for at-risk
students and students with EBD in urban elementary schools. Journal of
Emotional and Behavioral Disorders, 7, 178-188.
Kauffman, J. M. (1999). How we prevent the prevention of emotional and behavioral
disorders. Exceptional Children, 65, 448-468.
Kazdin, A. E. (1982). Single-case research designs: Methods for clinical and applied
settings. New York: Oxford University Press.

236
Keppel, G., & Wickens, T. D. (2004). Design and analysis: A researcher’s handbook
(4th ed.). Upper Saddle River, NJ: Pearson Education, Inc.
Kern, L., & Manz, P. (2004). A look at current validity issues of school-wide behavior
support. Behavioral Disorders, 30(1), 47-59.
Klinger, J. K., Ahwee, S., Pilonieta, P., & Menendez, R. (2003). Barriers and facilitators
in scaling up research-based practices. Exceptional Children, 69, 411-429.
Klinger, J.K., Arguelles, M.E., Hughes, M.T., & Vaughn, S. (2001). Examining the
school-wide “spread” of research-based practices. Learning Disability Quarterly,
24, 221-234.
Landrum, T. J., & Tankersley, M. (1999). Emotional and behavioral disorders in the new
millennium: The future is now. Behavioral Disorders, 24, 319-330.
Lane, K. L., Wehby, J., Menzies, H. M., Doukas, G. L., Munton, S. M., & Gregg, R. M.
(2003). Social skills instruction for students at risk for antisocial behavior: The
effects of small-group instruction. Behavioral Disorders, 28, 229-248.
Lashley, C., & Boscardin, M. L. (2003). Special education administration at a
crossroads: Availability, licensure, and preparation of special education
administrators (Report No. ED477116). National Clearinghouse for Professions
in Special Education, Arlington, VA.: Florida University, Gainesville. Retrieved
September 1, 2005 from: http://www.ericfacility.org
Learning First Alliance. (2005, May). A shared responsibility: Staffing all high-poverty,
low-performing schools with effective teachers and administrators: A framework

237
for action. Retrieved September 6, 2005 from:
http://www.learningfirst.org/publications/staffing
Learning First Alliance. (2001, November). Every Child Learning: Safe and Supportive
Schools. Baltimore, MD: Association for Supervision and Curriculum
Development.
Leithwood, K. A. (1992). The move toward transformational leadership. Educational
Leadership, 49(5), 8-12.
Leithwood, K., & Duke, D. L. (1999). A century’s quest to understanding school
leadership. In J. Murphy & K. S. Louis (Eds.) Handbook of Research on
Educational Administration (2nd ed.), 45-72. San Francisco, CA: Jossey-Bass, Inc.
Leithwood, K., & Jantzi, D. (1997). Explaining variation in teachers’ perceptions of
principals’ leadership: A replication. Journal of Educational Administration, 35,
312-331.
Leithwood, K., & Jantzi, D. (2000). The effects of transformational leadership on
organizational conditions and student engagement with school. Journal of
Educational Administration, 38, 112-129.
Leithwood, K., Louis, K. S., Anderson, S., & Wahlstrom, K. (2004). Executive summary:
How leadership influences student learning. University of Minnesota, Center for
Applied Research and Educational Improvement, Minneapolis, MN; University of
Toronto, Ontario Institute for Studies in Education, Toronto, Ontario, Canada;
The Wallace Foundation, New York, NY.

238
Lester, P. E., & Bishop, L. K. (1997). Handbook of tests and measurement in education
and the social sciences. Lancaster, PA: Technomic Publishing Company.
Levine, D.U., & Lezotte, L.W. (March, 1990). Unusually effective schools: A review and
analysis of research and practice. (Monograph). National Center for Effective
Schools Research & Development. Madison, WI: University of Wisconsin
System.
Lewis, T. J.,& Garrison-Harrell, L. (1999). Designing setting-specific interventions
within school systems of effective behavioral support. Effective School Practices,
17, 38-46.
Lewis, T. J., Newcomer, L. L., Trussell, R., & Richter, M. (2006). Schoolwide positive
behavior support: Building systems to develop and maintain appropriate social
behavior. In C. M. Everston & C. S. Weinstein (Eds.) Handbook of classroom
management: Research, practice, and contemporary issues (pp. 833-854).
Mahwah, NJ: Lawrence Erlbaum Associates.
Lewis, T. J., Powers, L. J., Kelk, M. J., & Newcomer, L. (2002). Reducing problem
behaviors on the playground: An investigation of the application of school-wide
positive behavior supports. Psychology in the Schools, 39, 181-190.
Lewis, T. J., & Sugai, G. (1999a). Effective behavior support: A systems approach to
Proactive schoolwide management. Focus on Exceptional Children, (31)6, 1-17.
Lewis, T. J., & Sugai, G. (1999b). Safe Schools: School-wide Discipline Practices (Vol.
Eds.). In L. M. Bullock & R. A. Gable (Series Eds.) The third CCBD mini-library
Series: What works for children and youth with E/BD: Linking yesterday and

239
today with tomorrow. Reston, Virginia: The Council for Children with Behavioral
Disorders.
Lewis, T .J., Sugai, G., & Colvin, G. (1998). Reducing problem behavior through a
school-wide system of effective behavioral support: Investigation of a school-
wide social skills training program and contextual interventions. School
Psychology Review, 27, 446-459.
Lewis-Palmer, T. (1999). Developing positive school-wide discipline systems. In L.M.
Bullock & R.A. Gable (Series Eds.) & T. J. Lewis & G. Sugai (Vol. Eds.), Safe
schools: School-wide discipline practices: The third CCBD mini-library series:
What works for children and youth with E/BD: Linking yesterday and today with
tomorrow (pp. 5-11). Reston, VA: The Council for Children with Behavioral
Disorders.
Lewis-Palmer, T., Flannery, B., Sugai, G., & Eber, L. (2002). Applying a systems
approach to school-wide discipline in secondary schools: What we are learning
and need to learn. In J. Chapple, L. M. Bullock, & R. A. Gable (Series Eds.), The
sixth CCBD mini-library series: Safe, drug-free, and effective schools. Reston,
VA: The Council for Children with Behavioral Disorders and the Council of
Administrators of Special Education.
Liapsun, C. J., Jolivette, K., & Scott, T. M. (2004). Schoolwide systems of behavior
support: Maximizing student success in school. In R.B. Rutherford, Jr., M.M.
Magee, & S. R. Mathur (Eds.), Handbook of research in emotional and behavioral
disorders (pp. 487-501). New York, NY: The Guilford Press.

240
Lucas, S. E., & Valentine, J. W. (2002). Transformational leadership: Principals,
leadership teams, and school culture (Report No. ED468519). American
Educational Research Association (New Orleans, LA, April 1-5, 2002). Retrieved
10-30-05 from: http://www.ericfacility.org
Luiselli, J. K., Putnam, R. F., Handler, M. W., & Feinberg, A .B. (2005). Whole-school
positive behavior support: Effects on student discipline problems and academic
performance. Educational Psychology, 25, 183-198.
Luiselli, J. K., Putnam, R. F., & Sunderland, M. (2002). Longitudinal evaluation of
behavior support intervention in a public middle school. Journal of Positive
Behavior Interventions, 4, 182-188.
Maag, J. W., & Katsiyannis, A. (2000). Recent legal and policy developments in special
education. Principal Leadership (84)613, 1-8.
Marzano, R. J. (2000). A new era of school reform: Going where the research takes us.
Aurora, CO: Mid-continent Research for Education and Leadership.
Marzano, R. J., Waters, T., & McNulty, B. A. (205). School leadership that works: From
research to results. Aurora, CO: Mid-continent Research for Education and
Learning (McREL).
May, S., Ard, W. III, Todd, A.W., Horner, R. H., Glasgow, A., Sugai, G., & Sprague,
J. R. (2000). /School-wide Information System./ Educational and Community
Supports, University of Oregon, Eugene, Oregon.
Mayer, G. R. (1995). Preventing antisocial behavior in schools. Journal of Applied
Behavior Analysis, 28, 467-478.

241
McCarthy, M. M. (1999). The evolution of educational leadership preparation programs.
In J. Murphy & K. S. Louis (Eds.) Handbook of Research on Educational
Administration (2nd ed.), 119-140. San Francisco, CA: Jossey-Bass, Inc.
McLaughlin, M. J. (2001). Access to the general education curriculum: Paperwork and
procedure. Journal of Special Education Leadership, (3), 121-128.
Michaels, C. A., Brown, F., & Mirabella, N. (2005). Personal paradigm shifts in PBS
experts: Perceptions of treatment acceptability of decelerative consequence-based
behavioral procedures. Journal of Positive Behavior Interventions, 7, 93-108.
Mid-continent Research for Education and Learning (McREL). (2001). Leadership for
School Improvement (rev. ed.). Aurora, CO: Author.
Miller, D. M., Brownell, M. T., & Smith, S. W. (1999). Factors that predict teachers
staying in, leaving, or transferring from the special education classroom.
Exceptional Children, 65, 201-218.
Miller, K. (2003). School, teacher, and leadership impacts on student achievement
[policy brief]. Aurora, CO: Mid-continent Research for Education and Learning.
Minarik, M. M., Thornton, B., & Perreault, G. (2003). Systems thinking can improve
teacher retention. Clearing House, 76, 230-234.
Monteith, D. S. (2000). Professional development for administrators in special education:
Evaluation of a program for underrepresented personnel. Teacher Education and
Special Education, 23, 281-289.
Murphy, J., & Louis, K. S. (1999). Framing the project. In J. Murphy & K. S. Louis
(Eds.) Handbook of Research on Educational Administration (2nd ed.), xxi-xxvii.

242
San Francisco, CA: Jossey-Bass, Inc.
National Association of Elementary School Principals in partnership with Collaborative
Communications Group. (2002). Leading Learning Communities: Standards for
What Principals Should Know and Be Able To Do. Alexandria, VA: Author.
National Commission on Teaching and America’s Future (NCTAF). (August, 2002).
Unraveling the “teacher shortage” problem: Teacher retention is the key. A
Symposium of The National Commission on Teaching and America’s Future and
NCTAF State Partners. Washington, D.C.
National Policy Board for Educational Administration. (2002). Standards for Advanced
Programs in Educational Leadership for Principals, Superintendents, Curriculum
Directors, and Supervisors. Retrieved January 4, 2003 from:
http://www.sl.edu/graded/AL/pdf/ELCC_Standards.pdf
National Technical Assistance Center on PBIS (2004). School-wide PBS. Retrieved
December 30, 2004 from: http://www.pbis.org/schoolwide.htm
Nelson, C. M. (2000). Educating students with emotional and behavioral disabilities in
the 21st Century: Looking through windows, opening doors. Education and
Treatment of Children, 23, 204-222.
Nelson, C. M., Scott, T. M., & Polsgrove, L. (1999). Perspectives on Emotional/
Behavioral Disorders: Assumptions and Their Implications for Education and
Treatment (Vol. Eds.). In L. M. Bullock & R. A. Gable (Series Eds.) The third

243
CCBD mini-library series: What works for children and youth with E/BD: Linking
yesterday and today with tomorrow. Reston, VA: The Council for Children with
Behavioral Disorders.
Nelson, J. R. (1996). Designing schools to meet the needs of students who exhibit
disruptive behavior. Journal of Emotional and Behavioral Disorders, 4, 147-161.
Nelson, J. R., Benner, G. J., Lane, K., & Smith, B.W. (2004). Academic achievement of
K-12 students with emotional and behavioral disorders. Exceptional Children, 71,
59-73.
Nelson, J. R., Benner, G. J., Reid, R. C., Epstein, M. H., & Currin, D. (2002). The
convergent validity of office discipline referrals with CBCL-TRF. Journal of
Emotional and Behavioral Disorders, 10, 181-188.
Nelson, J. R., Gonzalez, J. E., Epstein, M. H., & Benner, G. J. (2003). Administrative
discipline contacts: A review of the literature. Behavioral Disorders, 28, 249-281.
Nelson, J. R., Martella, R., Galand, B. (1998). The effects of teaching school expectations
and establishing a consistent consequence on formal office disciplinary actions.
Journal of Emotional and Behavioral Disorders, 6, 153-161).
Nersesian, M., Todd, A. W., Lehmann, J., & Watson, J. (2000). School-wide behavior
support through district-level system change. Journal of Positive Behavior
Interventions, 2, 244-247.
Netzel, D. W., & Eber, L. (2003). Shifting from reactive to proactive discipline in an
urban school district: A change of focus through PBIS implementation. Journal of
Positive Behavior Interventions, 5, 71-79.

244
Newcomer, L., & Lewis, T. (2004). Functional behavioral assessment: An investigation
of assessment reliability and effectiveness of function-based interventions.
Journal of Emotional and Behavioral Disorders, 12(3), 168-181.
Newcomer, L.L., Lewis, T.J., & Powers, L.J. (2002). Policies and procedures to develop
effective school-wide discipline practices at the elementary school level (Vol.
Eds.). In J. Chapple, L. M. Bullock, & R. A. Gable (Series Eds.), The sixth CCBD
mini-library series: Safe, drug-free, and effective schools. Reston, VA: The
Council for Children with Behavioral Disorders and the Council of
Administrators of Special Education.
Newcomer, L., & Powers, L. (2002, February). A Team Approach to Functional
Behavioral Assessment-Based Positive Behavioral Support Plans. Paper presented
at Midwest Symposium for Leadership in Behavioral Disorders, Kansas City,
MO.
Newmann, F. M., Rutter, R. A., & Smith, M. S. (1989). Organizational factors that affect
school sense of efficacy, community, and expectations. Sociology of Education,
62, 221-238.
Noell, G. H., & Witt, J. C. (1999). When does consultation lead to intervention
implementation? The Journal of Special Education, 33, 29-35.
Odom, S. L., Brantlinger, E., Gersten, R., Horner, R. H., Thompson, B., & Harris, K R.
(2005). Research in special education: Scientific methods and evidence-based
practices. Exceptional Children, 71, 137-148.

245
O’Neill, R. E., Johnson, J. W., O’Donnell, R. K., & McDonnell, J. J. (2001). Preparing
teachers and consultants for the challenge of severe problem behavior. Journal of
Positive Behavior Interventions, 3, 101-108, 119.
O’Rourke, S. L., Knoster, T., Sabatine, K., Smith, D., Horvath, B., & Llewellyn, G.
(2000). School-wide application of PBS in the Bangor area school district.
Journal of Positive Behavior Interventions, 4, 238-240.
OSEP Center on Positive Behavioral Interventions and Supports. (2004). School-wide
positive behavior support: Implementers’ blueprint and self-assessment.
University of Oregon. Eugene, OR.
Patterson, J., Marshall, C., & Bowling, D. (2000). Are principals prepared to manage
special education dilemmas? Principal Leadership, (84), 613, 9-20.
Patterson, J., & Protheroe, N. (2000) Essential for principals: The school leader’s guide
to special education. Educational Research Service for the National Association
of Elementary School Principals. Arlington, VA: Educational Research Service.
Peterson, K. (2002). The professional development of principals: Innovations and
Opportunities. National Commission for the Advancement of Educational
Leadership Preparation. University Council for Educational Administration.
Columbia, MO. Retrieved September 11, 2004 from: http://www.ncaelp.org/
Peterson, K. D., & Deal, T. E. (1998). How leaders influence the culture of schools.
Educational Leadership, 56(1), 28-30.
Porch, S., & Protheroe, N. (2002). Essentials for principals: Creating physical and
emotional security in schools. Arlington, VA: Educational Research Service.

246
Powell, D., & Hyle, A.E. (1997). Principals and school reform: Barriers to inclusion in
three secondary schools. Journal of School Leadership, (7), 301-326.
Praisner, C. (2003). Attitudes of elementary school principals toward the inclusion of
students with disabilities. Exceptional Children, 69, 135-145.
Protz, B. M. (2005). Administrators’ understanding of special education law in the
schoolhouse. Journal of Special Education Leadership, 18(2), 15-23.
Purkey, S. C., & Smith, M. S. (1983). Effective schools: A review. The Elementary
School Journal, 83, 427-451.
Rea, L. M., & Parker, R. A. (2005). Designing and conducting survey research (3rd ed.).
San Francisco, CA: Jossey-Bass, John Wiley & Sons, Inc.
Richards, J. (2003). Principal behaviors that encourage teachers to stay in the
profession: Perceptions of K-8 teachers in their second to fifth year of teaching.
American Educational Research Association, Chicago, IL, April 21-21, 2003.
(ERIC Document Reproduction Service No. ED477523).
Rose, L. C., & Gallup, A. M. (2006). The 38th annual Phi Delta Kappa/Gallup poll of the
public’s attitudes toward the public schools. Phi Delta Kappan, 88, 41-56.
Rubin, R. (2004). Building a comprehensive discipline system and strengthening school
climate. Reclaiming Children and Youth, 13, 162-169.
Sable, J., Thomas, J., & Shen, Q. (2006). Documentation to the NCES common core of
data public elementary/secondary school universe survey: School year 2003-
2004, (NCES 2006-324). U.S. Department of Education, Washington, DC:
National Center for Education Statistics.

247
Safran, S. P., & Oswald, K. (2003). Positive behavior supports: Can schools reshape
disciplinary practices? Exceptional Children, (69), 361-373.
Salisbury, C. L., & McGregor, G. (2002). The administrative climate and context of
inclusive elementary schools. Exceptional Children, (68), 259-274.
Scott, T. M. (2001). A schoolwide example of positive behavior support. Journal of
Positive Behavior Interventions, 3, 88-94.
Scott, T. M., & Barrett, S. B. (2004). Using staff and student time engaged in disciplinary
procedures to evaluate the impact of school-wide PBS. Journal of Positive
Behavior Interventions, 6, 21-27.
Scott, T. M., McIntyre, J., Liapsun, C., Nelson, C. M., Conroy, M., & Payne, L. D.
(2005). An examination of the relation between functional behavior assessment
and selected intervention strategies with school-based teams. Journal of Positive
Behavior Interventions, 7, 205-215.
Scott, T. M., & Nelson, C. M. (1999). Universal school discipline strategies: Facilitating
positive learning environments. Effective School Practices, 17, 54-64.
Scott, T., & Hunter, J. (2001). Initiating schoolwide support systems: An administrator’s
guide to the process. Beyond Behavior, 11, 13-15.
Shannon, D. M., & Davenport, M. A. (2001). Using SPSS to solve statistical problems: A
self-instruction guide. Upper Saddle River, NJ: Prentice-Hall, Inc.
Shen, J., Cooley, V. E., & Wegenke, G. L. (2004). Perspectives on factors influencing
application for the principalship: a comparative study of teachers, principals and
superintendents. International Journal of Leadership in Education, 7, 57-70.

248
Simpson, R. L. (2004). Inclusion of students with behavior disorders in general education
settings: Research and measurement issues. Behavioral Disorders, 30, 19-31.
Singer, G. (2000). Special education research agenda in the United States: Sources of
influence. Exceptionality, 8, 235-246.
Sirotnik, K. A., & Kimball, K. (1994). The unspecial place of special education in
programs that prepare school administrators. Journal of School Leadership, 4,
598-630.
Smith, C. R., & Katsiyannis, A. (2004). Behavior, discipline, and students with emotional
or behavioral disorders: Promises to keep…miles to go. Behavioral Disorders, 29,
289-299.
Sprague, J., Walker, H., Golly, A., White, K., Myers, D. R., & Shannon, T. (2001).
Translating research into effective practice: The effects of a universal staff and
student intervention on indicators of discipline and school safety. Education and
Treatment of Children, 24, 495-511.
SPSS Inc. (2004). SPSS Base 8.0 for Window’s User’s Guide. SPSS Inc., Chicago, IL.
Stichter, J. P., & Conroy, M. A. (2004).A critical analysis of the role of measurement on
the validity of emotional and behavioral disorders. Behavioral Disorders, 30, 7-
18.
Stormont, M., Lewis, T.J., & Covington Smith, S. (2005). Behavior support strategies in
early childhood settings: Teacher’s importance and feasibility ratings. Journal of
Positive Behavior Interventions, 7, 131-139.

249
Sugai, G., Hagan-Burke, S., & Lewis-Palmer, T. (2004). School-wide discipline and
instructional classroom management: A systems approach. In C. B. Darch & E. J.
Kame’enui (Eds.), Instructional classroom management (2nd ed.). Upper Saddle
River, NJ, Columbus, OH: Pearson Merrill Prentice Hall.
Sugai, G., & Horner, R. (1999). Discipline and behavioral support: Practices, pitfalls, and
promises. Effective School Practices, 17(4), 10-22.
Sugai, G., & Horner, R. (2001). School Climate and Discipline: Going to Scale: A
Framing Paper for the National Summit on the Shared Implementation of IDEA.
Center on Positive Behavioral Interventions and Supports, University of Oregon,
Eugene, OR. Retrieved February 2, 2004 from:
http://www.ideainfo.org/Summit/School_Climate.pdf
Sugai, G., & Horner, R. (2002). The evolution of discipline practices: School-wide
positive behavior supports. In J.K. Luiselli & C. Diament (Eds.), Behavior
psychology in the schools: Innovations in evaluation, support, and consultation.
New York, NY: The Haworth Press, Inc.
Sugai, G., Horner, R. H., Dunlap, G., Hieneman, M., Lewis, T. J., Nelson, C. M., Scott,
T., & Liaupsin, C. (2004). Applying positive behavior support and functional
behavioral assessments in schools. Technical assistance guide 1, version 2. OSEP
Center on Positive Behavioral Interventions and Supports: Washington, DC.
Sugai, G., Horner, R., Sailor, W., Dunlap, G., Eber, L., Lewis, T., et al. (2006). School-

250
wide positive behavior support: Implementers’ blueprint and self-assessment.
OSEP Center on Positive Behavioral Interventions and Supports: Washington,
D.C.
Sugai, G., & Lewis, T. J. (1996). Preferred and promising practices for social skills
instruction. Focus on Exceptional Children, (29) 4, 11-26.
Sugai, G., & Lewis, T. J. (1999). Developing Positive Behavioral Support for Students
with Challenging Behaviors (Vol. Eds.). In L.M. Bullock and R.A. Gable (Series
Eds.) The third CCBD mini-library series: What works for children and youth
with E/BD: Linking yesterday and today with tomorrow. Reston, VA: Council for
Children with Behavioral Disorders, a division of The Council for Exceptional
Children.
Sugai, G., & Lewis, T. J. (2004). Social skills instruction in the classroom. In C. B. Darch
and E. J. Kame’enui (Eds.) Instructional Classroom Management (2nd ed.). Upper
Saddle River, NJ: Pearson Education, Inc.
Sugai, G., Lewis-Palmer, T., Todd, A., & Horner, R. H. (2001). School-wide evaluation
tool. Eugene: University of Oregon.
Suskie, L. A. (1992). Questionnaire survey research: What works. Tallahassee, FL:
Association for Institutional Research.
Tabachnick, B. G., & Fidell, L. S. (2001). Using multivariate statistics (4th ed.).
Needham Heights, MA: Allyn & Bacon.
Taylor, J. A., & Baker, Jr., R. A. (2002). Discipline and the special education student.
Educational Leadership, 59(4), 28-30.

251
Taylor-Greene, S., Brown, D., Nelson, L., Longton, J., Gassman, T., Cohen, J. et al.
(1997) School-wide behavioral support: Starting the year off right. Journal of
Behavioral Education, 7, 99-112.
Taylor-Greene, S., & Kartub, D. T. (2000). Durable implementation of school-wide
behavioral support: The high five program. Journal of Positive Behavior
Interventions, 2(4), 233-235.
Thompson, B., Diamond, K. E., McWilliam, R., Snyder, P., & Snyder, S. W. (2005).
Evaluating the quality of evidence from correlational research for evidence-based
practice. Exceptional Children, 71, 181-194.
Todd, A. W., Horner, R. H., Sugai, G., & Colvin, G. (1999). Individualizing school-wide
Discipline for students with chronic behavior problems: A team approach.
Effective School Practices, 17, 72-82.
Tull, D. S., & Albaum, G. S. (1973). Survey research: A decisional approach.
New York, NY: Intext Educational Publishers.
Turnbull, A., Edmonson, H., Griggs, P., Wickham, D., Sailor, W., Freeman, R., et al.
(2002). A blueprint for schoolwide positive behavior support: Implementation of
three components. Exceptional Children, 68, 377-402.
Turnbull III, H. R., Wilcox, B. L., Stowe, M., Raper, C., & Hedges, L. P. (2000).
Public policy foundations for positive behavioral interventions, strategies, and
supports. Journal of Positive Behavior Interventions, 2, 218-230.
Usdan, M., McCloud, B., & Podmostko, M. (2000). Leadership for student learning:
Reinventing the principalship. Institute for Educational Leadership, Inc.

252
Washington, D.C. Retrieved April 23, 2004 from:
http://www.iel.org/programs/21st/reports/principal.pdf
U. S. Department of Education. (2001). No Child Left Behind Executive Summary.
Washington, D.C.: Author. Retrieved March 1, 2003, from:
http://www.whitehouse.gov/news/reports/no-child-left-behind.html
U. S. Department of Education, Office of Special Education Programs (OSEP). (1999)
Prevention strategies that work: What administrators can do to promote positive
student behavior. Retrieved February 7, 2004, from:
http://www.ideapractices.org/resources/detail.php?id=20911
U. S. Department of Education, Office of Special Education and Rehabilitative Services
(OSERS) and the Office of Special Education Programs (OSEP). (2000).
Prevention research & the IDEA Discipline Provisions: A guide for school
administrators. Retrieved December 7, 2005, from:
http://www.ed.gov/offices/OSERS/OSEP/Products/adminbeh.web.pdf
U. S. Office of Special Education and Rehabilitative Services. (2003). IDEA Final
Regulations: An Overview. Retrieved January 7, 2004, from:
http://www.ed.gov/offices/OSERS/Policy/IDEA/OVERVIEW.DOC
Valentine, J. W. (2001). Frameworks for Continuous School Improvement: A Synthesis of
Essential Concepts. (University of Missouri-Columbia College of Education
Middle Level Leadership Center). Retrieved October 14, 2005
from:http://www.mllc.org/
Valentine, J. W., & Bowman, M. L. (1988a). Audit of principal effectiveness. In P. E.

253
Lester & L. K. Bishop (Eds.), Handbook of tests and measurement in education
and the social sciences (p. 213). Lancaster, PA: Technomic Publishing Co., Inc.
Valentine, J. W., & Bowman, M. L. (1988b). Audit of principal effectiveness: A method
for self-improvement. NASSP Bulletin, 72(508), 18-26.
Viggiano, M. A. (1990). Communication effectiveness questionnaire. In P. E. Lester &
L. K. Bishop (Volume Eds.) Handbook of tests and measurement in education
and the social sciences. (1997). Lancaster, PA: Technomic Publishing Co.
Vogt, W. P. (1999). Dictionary of statistics & methodology: A nontechnical guide for the
social sciences (2nd ed.). Thousand Oaks, CA: Sage Publications, Inc.
Walker, H. M., Colvin, G., & Ramsey, E. (1995). Antisocial behavior in schools:
Strategies and best practices. Pacific Grove, CA: Brooks/Cole Publishing Co.
Walker, H. M., & Eaton-Walker, J. (2000). Key questions about school safety: Critical
issues and recommended solutions. Principal Leadership, (84)614, 46-55.
Walker, H. M., & Horner, R. H. (1996). Integrated approaches to preventing antisocial
behavior patterns among school-age children and youth. Journal of Emotional
and Behavioral Disorders (4), 194-209.
Walker, H. M., Zeller, R. W., Close, D. W., Webber, J., & Gresham, F. (1999). The
present unwrapped: Change and challenges in the field of behavioral disorders.
Behavioral Disorders, 24, 293-304.
Walter, J. E. (2003). About ISLLC. Retrieved February 5, 2005, from University of
Missouri-St. Louis, Missouri Professors of Education Administration, Web site:
http://www.umsl.edu/~mpea/Pages/AboutISLLC/AboutISLLC.html

254
Walther-Thomas, C., Bryant, M., & Land, S. (1996). Planning for effective co-teaching.
Remedial and Special Education, 17, 255-265.
Waters, T., Marzano, R. J., & McNulty, B. (2003). Balanced leadership: What 30 years
of research tells us about the effect of leadership on student achievement.
Retrieved April 24, 2004 from: http://www.mcrel.org/topics/product ID=144
Wehby, J. H., Lane, K. L., & Falk, K. B. (2005). An inclusive approach to improving
early literacy skills of students with emotional and behavioral disorders.
Behavioral Disorders, 30, 155-169.
Weisberg, H. F., Krosnick, J. A. & Bowen, B. D. (1996). An introduction to survey
research and data analysis (3rd ed.). San Francisco, CA: W. H. Freeman and
Company.
Weiss, K. (1989). Principal performance rating scale. In P. E. Lester & L. K. Bishop
(Volume Eds.) Handbook of tests and measurement in education and the social
sciences. (1997). Lancaster, PA: Technomic Publications Company.
Witt, J. C., VanDerHeyden, A. M., & Gilbertson, D. (2004). Instruction and classroom
Management: Prevention and intervention research. In R. B. Rutherford, Jr., M.
M. Magee, & S.R. Mathur (Eds.), Handbook of research in emotional and
behavioral disorders (pp. 426-445). New York, NY: The Guilford Press.
Yell, M. L., Katsiyannis, A., & Bradley, R. (2003). A special role. Principal
Leadership (Middle School Edition), (4)2, 22-28.

255
Yoon, J. S., & Gilchrist, J. (2003). Elementary teachers’ perceptions of administrative
support in working with disruptive and aggressive students. Education, 123, 564-
569.
Young, M. D., Petersen, G. J., & Short, P. M. (2002). The complexity of substantive
reform: A call for interdependence among key stakeholders. Educational
Administration Quarterly, 38, 137-175.
Youngs, P., & King, M. B. (2002). Principal leadership for professional development to
build school capacity. Educational Administration Quarterly, 38, 643-670.
Ysseldke, J., Nelson, J. R., Christenson, S., Johnson, D. R., Dennison, A., Triezenberg,
H., et al. (2004). What we know and need to know about the consequences of
high-stakes testing for students with disabilities. Exceptional Children, 71, 75-94.

256
VITA
Mary M. Richter has been a general education and special education teacher, as well as a
director of special services for students at-risk for and identified with disabilities, in three
states. She is also a certified trainer in school-wide positive behavior supports (SW-PBS)
and an adjunct instructor for the University of Missouri-Columbia. Her research interests
include students with and at-risk for emotional/behavioral disorders, school-wide PBS,
special education law, and school administration.