research report 047 - health and safety executive · executive summary offshore accident and...
TRANSCRIPT
HSE Health & Safety
Executive
Analysis of accident statistics for floating monohull and fixed installations
Prepared by Martin Muncer for the Health and Safety Executive 2003
RESEARCH REPORT 047
HSE Health & Safety
Executive
Analysis of accident statistics for floating monohull and fixed installations
Martin Muncer Health and Safety Executive
Lord Cullen House Fraser Place
Aberdeen AB25 3UB
Offshore accident and incident statistics (1996-2002) have been examined to compare FPSO records with those of other fixed installations in the UKCS. Particular attention was given to accidents and incidents attributable to adverse weather and vessel motions, to assess FPSO susceptibility to these hazards.
It was found that ‘FPSO specific’ incidents account for about 20% of the total incidents on FPSOs. The results show that, broadly, 33% were attributed to risers / swivels or turrets, 22% arise from offloading systems, 15% relate to adverse weather including wave loading incidents and motion related incidents, 11% arise from collision, potential collision and stability incidents, 10% arise from marine systems, and 9% arise from mooring and station keeping incidents.
The total population engaged in offshore operations has decreased from over 30,000 people in the early 1990s to around 23,000 in 2002. In contrast, the FPSO/FSU population has increased to represent about 5% of the total.
In recent years (1999-2002) the incident rate shows a downward trend for both FPSOs and all installation types, and now broadly the same incident rate. In earlier years the rate of dangerous occurrences on FPSOs was higher than other installation types.
This report and the work it describes were funded by the Health and Safety Executive. Its contents, including any opinions and/or conclusions expressed, are those of the author alone and do not necessarily reflect HSE policy.
HSE BOOKS

© Crown copyright 2003
First published 2003
ISBN 0 7176 2610 5
All rights reserved. No part of this publication may bereproduced, stored in a retrieval system, or transmitted inany form or by any means (electronic, mechanical,photocopying, recording or otherwise) without the priorwritten permission of the copyright owner.
Applications for reproduction should be made in writing to: Licensing Division, Her Majesty's Stationery Office, St Clements House, 2-16 Colegate, Norwich NR3 1BQ or by e-mail to [email protected]
ii

CONTENTS
LIST OF TABLES........................................................................................................ iv
LIST OF FIGURES ...................................................................................................... iv
EXECUTIVE SUMMARY .............................................................................................. v
1 INTRODUCTION ................................................................................................... 1
1.1 BACKGROUND.............................................................................................. 1
1.2 SOURCES OF DATA ..................................................................................... 1
1.3 INCIDENT STATISTICS ................................................................................. 1
1.4 DEFINITIONS................................................................................................. 2
2 OFFSHORE STATISTICS REPORTS ................................................................... 3
3 FPSO INCIDENT STATISTICS.............................................................................. 9
3.1 DATA SOURCES ........................................................................................... 9
3.2 RIDDOR DATABASE ..................................................................................... 9
3.3 WEATHER RELATED INCIDENTS .............................................................. 12
3.4 WAVE INCIDENT ANALYSIS....................................................................... 13
3.5 STRUCTURAL OFFSHORE INCIDENTS..................................................... 14
3.6 MOTION RELATED INCIDENTS.................................................................. 14
4 POPULATION ESTIMATES ................................................................................ 15
4.1 TOTAL OFFSHORE WORKFORCE POPULATION (1996-2002) ................ 15
4.2 FPSO/FSU WORKFORCE POPULATION (1996-2002) ............................... 15
5 COMPARISON OF FPSO AND TOTAL INCIDENT STATISTICS ....................... 17
5.1 COMPARISON OF ACCIDENT AND INCIDENT RATES ............................. 17
5.2 COMPARISON OF TYPE 77 DANGEROUS OCCURRENCES.................... 21
6 CONCLUSIONS .................................................................................................. 23
7 REFERENCES .................................................................................................... 25
iii

LIST OF TABLES
Table 2.1 Categorisation Of Dangerous Occurrences ................................................ 4
Table 2.2 Summary Of Injuries And Dangerous Occurrences ................................... 5
Table 2.3 Summary Of Dangerous Occurrence By Type ............................................ 6
Table 3.1 FPSO Accident / Incident Statistics 1996-2002 .......................................... 9
Table 3.2 FPSO Dangerous Occurrences 1996-2002............................................... 10
Table 3.3 Analysis Of FPSO/FSU Incident Data 1996-2002 ..................................... 12
Table 3.4 FPSO/FSU Weather Related Incidents 1996-2000 ................................... 13
Table 4.1 Total Offshore Workforce Population......................................................... 15
Table 4.2 Offshore Workforce Population Of FPSOs in the UK Sector..................... 16
Table 4.3 Total Offshore and FPSO Workforce Population Data .............................. 16
Table 5.1 Incident Rates per 100,000 Workers (Floating Production)....................... 17
Table 5.2 Incident Rates per 100,000 Workers (Total Offshore Population) ............. 17
Table 5.3 Incident Rates per Installation (10 Years Operation)................................ 19
Table 5.4 All Installation Type 77 Dangerous Occurrences....................................... 21
Table 5.5 FPSO Type 77 Dangerous Occurrences................................................... 21
LIST OF FIGURES
Figure 2.1 Total Offshore Accident / Incident Statistics 1993-2002(p) ........................ 7
Figure 2.2 Breakdown of Dangerous Occurrences for 2000-2001(p) .......................... 7
Figure 3.1 Floating Production Accident / Incident Statistics 1996-2002 ................... 10
Figure 3.2 Dangerous Occurrences for Floating Production 1996-2002................... 11
Figure 3.3 Green Water and Wave Slam Incidents 1995-2000................................. 13
Figure 5.1 Comparison of FPSO Incident Rates per 100,000 workers...................... 18
Figure 5.2 FPSO Incident rate per 10 years operation.............................................. 20
Figure 5.3 All Installations Incident rate per 10 years operation................................ 20
iv

EXECUTIVE SUMMARY
Offshore accident and incident statistics (1996-2002) have been examined to compare FPSO records with those of other fixed installations in the UKCS. Particular attention was given to accidents and incidents attributable to adverse weather and vessel motions, to assess FPSO susceptibility to these hazards.
Unfortunately, the categories / types of accident and incident data contained in the general statistics of offshore activities provide little information specific to FPSOs. For example, the second highest category is ‘Type 77’. This category includes incidents due to station-keeping failures, dropped objects and adverse weather. Thus identification of weather related incidents is obscured by their classification in the same category as these other incident types. However, in 2000/01, dropped objects represented 95% of ‘Type 77’ Dangerous Occurrences
The raw incident data was therefore sighted, and FPSO/FSU incidents reclassified to reflect specific systems only found on floaters. It was found that ‘FPSO specific’ incidents account for about 20% of the total incidents on FPSOs. The results show that, broadly, 33% were attributed to risers / swivels or turrets, 22% arise from offloading systems, 15% relate to adverse weather including wave loading incidents and motion related incidents, 11% arise from collision, potential collision and stability incidents, 10% arise from marine systems, and 9% arise from mooring and station keeping incidents.
Recent accident studies relating to the period (1996-2000) were also reviewed. These studies attribute only two events over this period to vessel motions and another 17 events to green water and wave slam. Other referenced work suggested that, at least in the earlier years of operation, structural incidents on FPSOs were nearly five times greater than for fixed steel installations. However when adjustments are made for incidents of green water/wave slam, shuttle tanker offloading and other incidents on which effective action has been taken, the structural incident rate of FPSOs is similar to that of other installations.
The increasing FPSO/FSU workforce represents in 2002 about 5% of the total offshore workforce that has slowly decreased over the last 10 years.
Over the six years (1996-2002) FPSOs have approximately twice rate of dangerous occurrences compared with the statistics for all offshore installations. However the figures may not be directly comparable due to differences in calculation methods. Nevertheless it is clear that over the years 1996-2002 there has been a downward trend in dangerous occurrences on both FPSOs and all installation types.
An alternative presentation of the data based on incidents per installation shows that FPSOs have in 2002 the same dangerous occurrence rate as for all installations. This figure has reduced from 50% in excess of other installation types in 1998/99
v

vi
1 INTRODUCTION
1.1 BACKGROUND
The objectives of this report are to present accident / incident statistics for floating monohulls (i.e. FPSO/FSUs) and for other ‘fixed’ installations, to make appropriate comparisons where possible and to ascertain for monohulls the accident / incident risk attributable to vessel motions alone.
The work follows on from previous studies that determined limited statistics of FPSO/FSU incidents (References 1 and 2). In this report additional data is provided for the years 2000 to 2002. Accident / incident statistics for all offshore activities have been examined to compare FPSO/FSU incidents with those of other fixed installations. The particular incidents associated with monohull vessel motions are examined. Related information from complementary studies is also included to supplement the findings.
This section lists the sources of information and defines the offshore installations included in the study. Section 2 describes the general offshore accident / incident statistics, and Section 3 gives specific data for FPSO/FSUs. Reference is also made in Section 3 to other related work. The workforce populations of all offshore installations are given in Section 4 with estimates for FPSO/FSUs (in the UK Sector) over the period 1996-2002. Comparisons of data are given in Section 5, with Conclusions in Section 6.
1.2 SOURCES OF DATA
Records of accidents and incidents for all offshore activities are part of HSE’s continuous monitoring process under RIDDOR introduced on 1st April 1996, and also under DCR (References 3 and 4). Annual RIDDOR reports have been produced by HSE to provide statistics of offshore injury, ill health and incidents (References 5 to 10) for the years 1996 onward. A summary of accident rates and population data up to 1998 is contained in Reference 11.
Incident statistics for floating systems were provided by HSE for the years 1996/7, 1997/8 and 1998/9 for a previous study in 2000 (Ref 1). This data consists of reported Floating Production System (FPS) incidents together with descriptions from the RIDDOR database (Refs 12 to 16). Other available incident data came from recent studies of weather related incidents post 1996 for UK floaters (Ref 17); a study of green water and wave slam incidents for FPSO/FSUs (Ref 18); and a review of structural integrity incidents, including FPSOs (Ref 19).
1.3 INCIDENT STATISTICS
RIDDOR data for offshore accidents and incidents (as given in Refs 5 to 11) are broken down into fatalities, major injuries (involving hospitalisation), injuries implying ‘over-three-days’ off work (O3D), and dangerous occurrences (DO). The data includes all offshore operations and all types of installations. Specific information on, for example, FPSOs is determined by searching the database. (Refs 12 to 16)
1

1.4 DEFINITIONS
For the purpose of this study, the definitions of fixed and floating offshore installations are as follows:
Fixed Offshore Installations
These installations are defined as ‘permanently’ located, and include the following:
o Steel fixed jacket structures o Concrete gravity structures o FPSOs (monohulls), (Floating Production Storage and Offloading) o FSUs (monohulls), (Floating Storage Units) o Jack-up fixed structures o TLPs (Tension Leg Platform) o FPS (semi-submersibles), (Floating Production Systems)
Floating Offshore Installations
These are buoyant surface (as opposed to bottom-founded) vessels that may or may not be ‘permanent’, and include the following:
o FPSOs (monohulls) o FSUs (monohulls) o FPS (semi-submersibles) o Jack-ups in transit o TLPs o Drilling semi-submersibles o Drillships (monohulls) o Diving and support vessels
FPSO/FSUs are therefore a subset of both fixed and floating installations.
2

2 OFFSHORE STATISTICS REPORTS
HSE report annually on offshore accidents and incidents recorded in RIDDOR (Refs 5 to 10). The data are categorised by incident consequence (i.e. degrees of harm to people), incident type and operations at the time of the incident, as follows:
Incident Consequence
o Fatalities o Major injuries o Over-three-day injuries o Dangerous occurrences
Incident Types
o Loss of containment o Fire / explosion o Air transport o Sea transport o Slips / trips / falls o Falling objects o Handling goods / materials o Lifting / crane operations o Use of hand tools o Use of machinery o Exposure / contact with harmful substances o Diving related o Electrical o Structural / foundation o Mooring * o Radiation o Other o Not recorded
(* only incident type specifically associated with floaters)
Breakdown by Operations
o Production o Drilling / workover o Maintenance o Diving o Construction / commissioning o Deck operations o Domestic / catering o Modification of plant / structure o Transport o Other
Dangerous occurrences are categorised into a number of defined types in Table 2.1.
3

Table 2.1 Categorisation Of Dangerous Occurrences
Type Description 01 Failure of lifting machinery etc 02 Failure of pressure systems 03 Failure of a freight container 05 Electrical short circuit or overload 06 Certain incidents involving explosives 07 Release or escape of a biological agent 08 Malfunction of radiation generators etc 09 Malfunction of breathing apparatus 10 Certain incidents in relation to a diving operation 11 Collapse of scaffolding 13 Certain incidents in relation to a well 14 Certain incidents in respect of a pipeline or pipeline works 73 Release of petroleum hydrocarbon on or from an offshore installation 74 Fire or explosion other than Type 73 75 Release or escape of a dangerous substance other than petroleum hydrocarbon 76 Collapse of offshore installation or its plant 77 Failure of equipment required to maintain a floating installation on station; object
dropped on an installation, attendant vessel or into water; or damage to an installation from adverse weather conditions
78 Collision between a vessel or aircraft and an installation 79 Occurrences with potential for collision between a vessel and an installation 80 Subsidence or local collapse of seabed near installation 81 Loss of stability of buoyancy of an installation 82 Evacuation of an installation 83 Persons falling more than 2 metres into water
It is noted that the categories for recording offshore incidents are general and, apart from the mooring / station keeping and stability categories; provide little information specifically related to floaters.
Incidents for the period from April 1993 to March 2002 categorised according to consequence are shown in Table 2.2 and in Figure 2.1
4
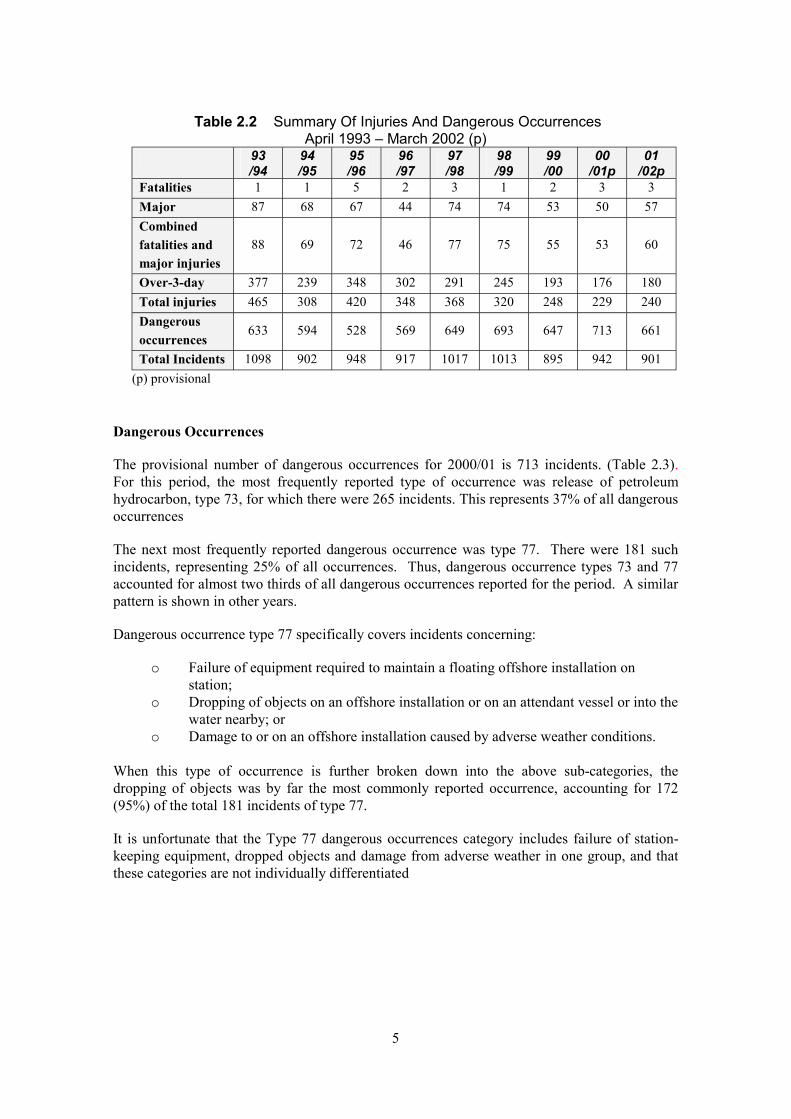
Table 2.2 Summary Of Injuries And Dangerous Occurrences April 1993 – March 2002 (p)
93 94 95 96 97 98 99 00 01 /94 /95 /96 /97 /98 /99 /00 /01p /02p
Fatalities 1 1 5 2 3 1 2 3 3 Major 87 68 67 44 74 74 53 50 57 Combined fatalities and 88 69 72 46 77 75 55 53 60 major injuries Over-3-day 377 239 348 302 291 245 193 176 180 Total injuries 465 308 420 348 368 320 248 229 240 Dangerous occurrences
633 594 528 569 649 693 647 713 661
Total Incidents 1098 902 948 917 1017 1013 895 942 901 (p) provisional
Dangerous Occurrences
The provisional number of dangerous occurrences for 2000/01 is 713 incidents. (Table 2.3). For this period, the most frequently reported type of occurrence was release of petroleum hydrocarbon, type 73, for which there were 265 incidents. This represents 37% of all dangerous occurrences
The next most frequently reported dangerous occurrence was type 77. There were 181 such incidents, representing 25% of all occurrences. Thus, dangerous occurrence types 73 and 77 accounted for almost two thirds of all dangerous occurrences reported for the period. A similar pattern is shown in other years.
Dangerous occurrence type 77 specifically covers incidents concerning:
o Failure of equipment required to maintain a floating offshore installation on station;
o Dropping of objects on an offshore installation or on an attendant vessel or into the water nearby; or
o Damage to or on an offshore installation caused by adverse weather conditions.
When this type of occurrence is further broken down into the above sub-categories, the dropping of objects was by far the most commonly reported occurrence, accounting for 172 (95%) of the total 181 incidents of type 77.
It is unfortunate that the Type 77 dangerous occurrences category includes failure of stationkeeping equipment, dropped objects and damage from adverse weather in one group, and that these categories are not individually differentiated
5

Table 2.3 Summary Of Dangerous Occurrence By Type April 2000 – March 2001(p)
TYPE DESCRIPTION NUMBER 01 Failure of lifting machinery etc. 57 02 Failure of pressure systems 9 03 Failure of freight container 0 05 Electrical short circuit or overload 22 06 Certain incidents involving explosives 0 07 Release or escape of a biological agent 0 08 Malfunction of radiation generators etc. 0 09 Malfunction of breathing apparatus 5 10 Certain incidents in relation to a diving operation 14 11 Collapse of scaffolding 0 13 Certain incidents in relation to a well 65 14 Certain incidents in respect of a pipeline or pipeline works 14 73 Release of petroleum hydrocarbon on or from an offshore installation 265 74 Fire or explosion other than type 73 48 75 Release or escape of a dangerous substance other than petroleum
hydrocarbon 16
76 Collapse of an offshore installation or its plant 1 77 Failure of equipment required to maintain a floating installation on
station; objects dropped on an installation, attendant vessel or into water; or damage to an installation from adverse weather conditions
181
78 Collision between a vessel or aircraft and an installation 9 79 Occurrence with the potential for collision between a vessel and an
installation 1
80 Subsidence or collapse of seabed near installation 0 81 Loss of stability or buoyancy of an installation 1 82 Evacuation of an installation 5 83 Persons falling more than 2 metres into water 0
TOTAL 713
6

Over-3-day Major Fatalities
0 50
100 150 200 250 300 350 400 450 500
Num
ber o
f inj
urie
s
1993
/94
1994
/95
1995
/96
1996
/97
1997
/98
1998
/99
1999
/00
2000
/01(p)
2001
/02(p)
Figure 2.1 Total Offshore Accident / Incident Statistics 1993-2002(p)
(p) = provisional
Other Collision 1.0%
Lifting machinery 1.4% 8.0%
i
D
on
Electrical / Pressure 1.3% Positioning/Dropped iving + BA
object/Adverse weather 3.1% 25.4%
Well incidents 9.1%
Pipelines 2.0%
Dangerous substance2.2%
Fire or explos6.7%
Hydrocarbon release 37.2%
Figure 2.2 Breakdown of Dangerous Occurrences for 2000-2001(p)
7

8

3 FPSO INCIDENT STATISTICS
3.1 DATA SOURCES
Incident statistics for all floating installations for the years 1996-2002 from the RIDDOR database were examined (Refs 12 to 16). The data contained descriptions of each incident that enabled the data for FPSOs to be extracted.
Other supplementary incident information given in this Section comes from recent studies of weather related incidents (Ref 17), a study of green water and wave slam incidents for FPSOs (Ref 18), and a review of structural integrity incidents, including FPSOs (Ref 19).
3.2 RIDDOR DATABASE
Data provided from Refs 12 to 16 are summarised in Table 3.1
Table 3.1 FPSO Accident / Incident Statistics 1996-2002
96/97 97/98 98/99 99/00 00/01 01/02(p) Totals Category 1 – Fatalities 0 0 0 0 0 0 0
Category 2 - Major 0 7 4 2 4 4 21 Category 3 - O3D 18 16 17 11 14 9 85 Category 4 – DO 28 55 57 64 63 49 317 Totals 46 78 78 77 81 62 423
Over the six-year period, 1996-2002, there were no fatalities involving floating production operations, 21 accidents involving hospitalisation, 85 lesser accidents leading to three-days off work, and 317 incidents classed as dangerous occurrences.
The results last year (01/02) show approximately a 25% reduction in incidents compared with the level that had remained constant over the previous four years. This data however is provisional.
A breakdown of the dangerous occurrences according to type (as defined in Section 2) is shown in Table 3.2 and Figure 3.2.
9

0
10
20
30
40
50
60
70
80
90
96/97 97/98 98/99 99/00 00/01 '01/02
Category 4 - DO Category 3 - O3D Category 2 - Major Category 1 - Fatalities
Figure 3.1 Floating Production Accident / Incident Statistics 1996-2002
Table 3.2 FPSO Dangerous Occurrences 1996-2002
DO Type 1996/7 1997/8 1998/9 1999/00 00/01 01/02 Totals
1 2 4 5 9 1 4 25
2 6 2 5 2 0 0 15
5 0 0 5 2 2 3 12
7 0 2 0 0 0 0 2
10 0 0 0 0 0 2 2
13 0 1 0 0 0 0 1
14 2 1 3 3 2 1 12
73 10 29 24 34 37 23 157
74 2 4 5 5 4 7 27
75 1 1 1 1 5 0 9
76 0 0 0 2 0 0 2
77 5 4 6 3 12 4 34
78 0 4 2 1 0 0 7
79 0 2 1 2 0 3 8
81 0 1 0 0 0 0 1
82 0 0 0 0 0 2 2
Totals 28 55 57 64 63 49 316
10

EvacuationPotential Collision
5% El i4%
Bi i0%
Pi4%
0%
i1%
2% 8%0%
1%3% iti
obj /
12%
Fi / explosi8%
3%
1%
Pressure ectr cal olog cal
peline
Wells
Div ng
Collision Lifting machinery Stability
Pos oning/Dropped ect Adverse weather
re on
Substance
Collapse
Hydrocarbon release 48%
Figure 3.2 Dangerous Occurrences for Floating Production 1996-2002
By comparison of Figure 3.2 with Figure 2.2 it can be seen that the distribution of dangerous occurrences is broadly the same for FPSOs as it is for all installation types. The most common dangerous occurrence is Type 73 – hydrocarbon release. It is noted that the hydrocarbon release rate is a greater proportion of the total for FPSOs (at around 48%) compared with all installation types at 37% in 2000/01. The next largest category for both FPSOs and all installation types is Type 77
Dangerous Occurrence Type 77 relates to:
o failures of equipment to maintain a floating installation on station o objects dropped on an installation, attendant vessel or into water o damage to an installation from adverse weather conditions
Dropped objects form by far the majority of Type 77 occurrences.
The risk of loss of position, collision, and stability loss (type 77,78,79 & 81) are dangerous occurrences that are particularly relevant to FPSOs. Another important consideration is where the vessel motion is a contributory factor to an incident
11

The general conclusion from this analysis is that FPSOs have no distinctive pattern of incidents that is different to other installation types; although the consequences of the Dangerous Occurrence Type defined incidents are not quantified. The categorisations of dangerous occurrences are insufficient to identify FPSO specific incidents without recourse to the raw data.
In order to investigate incidents specific to FPSOs, the raw data (in Excel spreadsheet format)) was re-examined using six categories defined specifically for this work as shown in Table 3.3. These six categories represent incidents that can be regarded as specific to FPSOs. ‘FPSO specific’ incidents account for about 20% of the total. The results show that, broadly, for the specific FPSO incidents:
o 33% were attributed to risers / swivels or turrets, o 22% arise from offloading systems, o 15% relate to adverse weather including wave loading incidents and motion related
incidents o 11% arise from collision, potential collision and stability incidents o 10% arise from marine SW systems, COW, and tank vent systems o 9% arise from mooring and DP incidents
Table 3.3 Analysis Of FPSO/FSU Incident Data 1996-2002
96/97 97/98 98/99 99/00 00/01 01/02 Total %
Riser/Turret/Swivel 5 3 4 7 6 1 26 33
Vessel SW/COW/Vent
2 1 0 2 1 2 8 10
Offloading System 2 1 4 4 2 4 17 22
Moorings / DP 0 0 1 2 1 3 7 9
Collision / Stability 0 5 2 2 0 0 9 11
Motion related incident
2 0 4 5 0 1 12 15
FPSO/FSU specific 11 10 15 22 10 11 79
Total all incidents 46 78 78 77 81 62 422
% FPSO incidents 24 13 19 29 12 18 19
3.3 WEATHER RELATED INCIDENTS
HSE commissioned a particular study on weather related incidents between 1996-2000 (Ref 17) that mostly concerned drilling vessels. The FPSO/FSU incidents included within this weather incident data are shown in Table 3.4
Only two incidents in Table 3.4 were specifically related to vessel motions.
12
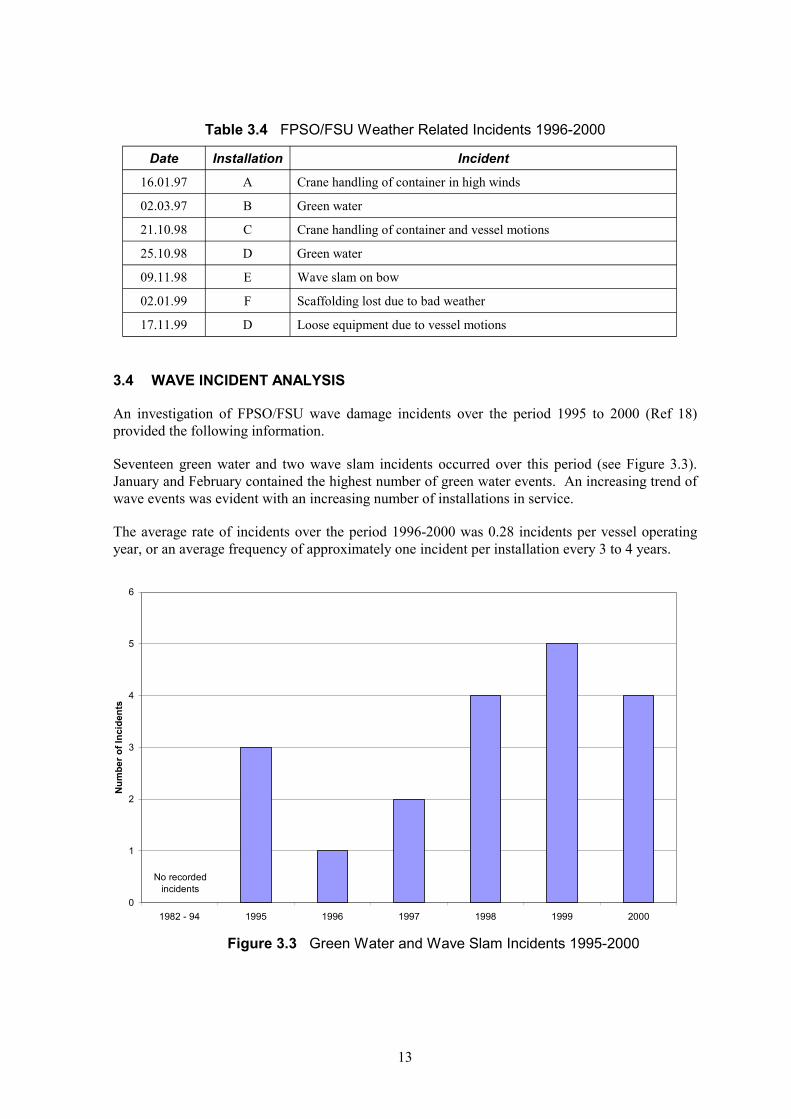
Table 3.4 FPSO/FSU Weather Related Incidents 1996-2000
Date Installation Incident
16.01.97 A Crane handling of container in high winds
02.03.97 B Green water
21.10.98 C Crane handling of container and vessel motions
25.10.98 D Green water
09.11.98 E Wave slam on bow
02.01.99 F Scaffolding lost due to bad weather
17.11.99 D Loose equipment due to vessel motions
3.4 WAVE INCIDENT ANALYSIS
An investigation of FPSO/FSU wave damage incidents over the period 1995 to 2000 (Ref 18) provided the following information.
Seventeen green water and two wave slam incidents occurred over this period (see Figure 3.3). January and February contained the highest number of green water events. An increasing trend of wave events was evident with an increasing number of installations in service.
The average rate of incidents over the period 1996-2000 was 0.28 incidents per vessel operating year, or an average frequency of approximately one incident per installation every 3 to 4 years.
Num
ber o
f Inc
iden
ts
6
5
4
3
2
1
0
No recorded incidents
1982 - 94 1995 1996 1997 1998 1999 2000
Figure 3.3 Green Water and Wave Slam Incidents 1995-2000
13

3.5 STRUCTURAL OFFSHORE INCIDENTS
A recent review (Ref 19) of structural integrity incidents reported under the RIDDOR and DCR regulations covered fixed steel, concrete gravity, TLP, FPSO, FSU, FPS, semi and jack-up installations. Details of 93 UK incidents were provided, of which 22 (35%) were classed as having the potential to cause a major accident.
Of the incidents reviewed:
o 38 were associated with fixed steel structures, o 3 related to concrete gravity structures, o 4 related to a TLP, o 15 related to FPSOs, FSUs and FPVs (semis), and o 33 to MODUs (24 semis and 9 jack-ups).
It is noted that there is a significantly larger number of fixed steel structures than other installation types, from which it might be concluded that there is a higher structural incident rate per installation for FPSO/FSUs and semi-submersibles than for other installation types.
Approximate calculations indicate that at least in the earlier years of FPSO operation, FPSOs have a structural incident rate per installation that is almost 5 times greater than for fixed steel installations (14 incidents experienced by 16 FPSOs compared with 38 incidents experienced by approximately 200 fixed steel installations during 5 years of operation).
However of the 14 incidents, one is double counted, 5 are associated with green water or wave slam and one involves a shuttle tanker collision,, Another two relate to vessel motion (now improved on this FPSO), one relates to cargo tank over pressurisation, and one to the failure of turret swivel bolts. When adjustments are made for these specific incidents, on which effective action has been taken, it can be seen that the structural incident rate for FPSOs is broadly similar to other installation types.
3.6 MOTION RELATED INCIDENTS
From the information presented above there is little to suggest that motion-related incidents on FPSO/FSUs are prominent compared with other causes of damage / injury or incidents. However, RIDDOR does not record whether or not motion was relevant to the event but only implies a connection through ‘weather-related’ Type 77 Dangerous Occurrences.
Inspection of the raw incident data for FPSOs (Table 3.3) suggests that a figure of about 15% of FPSO-specific incidents relate in some way to adverse weather. Vessel motions were a major contributory factor in two incidents in the period 1996-2002. Wave incidents (as the other major adverse weather component) can be defined as motion related and, as such, are viewed as significant.
14

4 POPULATION ESTIMATES
4.1 TOTAL OFFSHORE WORKFORCE POPULATION (1996-2002)
The total offshore population for each year is defined in HSE statistics reports (Refs 5 to 10) thus:
“Where injury rates are used, they have been calculated using data from the annual population surveys conducted by the Inland Revenue (IR). Although IR have increased the frequency of these surveys, HSE have continued to use the figures from the survey conducted around August / September for consistency. Their base survey figure is multiplied by an employment factor of 1.9 to take account of those employees who were not offshore at the time of the survey.”
Table 4.1 Total Offshore Workforce Population
Year Total Offshore Population
1996/97 26,853
1997/98 23,000
1998/99 25,500
1999/00 19,000
2000/01 23,330
2001/02 23,206
The offshore population has generally decreased over the years from over 30,000 in the early 1990s.
4.2 FPSO/FSU WORKFORCE POPULATION (1996-2002)
The population of FPSO/FSU personnel for the years 1996 to 2002 has been estimated based on HSE records for maximum and operational personnel on board. Table 4.2 lists all FPSO/FSUs in production over this period in the UK Sector with the number of people on board (POB).
The relative size of the FPSO/FSU workforce population is compared with the total offshore workforce population in Table 4.3.
It can be seen that over this period, the total offshore population has fallen while the FPSO/FSU population has risen. Nevertheless, the FPSO/FSU population represents in 2001/02 about 5% of the total offshore workforce population.
15

Table 4.2 Offshore Workforce Population Of FPSOs in the UK Sector
FPSO POB On/Off Station
1995 1996 1997 1998 1999 2000 2001
Max Ops On Off A 70 46 1986 2001 46 46 46 46 46 46 46 B 70 50 1988 1997 50 50 50 C 30 25 1992 1996 25 25 D 104 43 1993 43 43 43 43 43 43 43 E 56 22 1994 22 22 22 22 22 22 22 F 30 25 1994 1997 25 25 25 G 87 46 1995 46 46 46 46 46 46 46 H 30 25 1996 25 25 25 25 25 25 I 55 32 1996 32 32 32 32 32 32 J 50 35 1997 35 35 35 35 35 K 70 45 1997 45 45 45 45 45 L 70 32 1997 32 32 32 32 32 M 96 43 1997 2000 43 43 43 N 60 30 1997 30 30 30 30 30 O 75 50 1998 50 50 50 50 P 59 32 1999 6 m
00/01 32 28 28
Q 90 38 1999 38 38 38 R 55 36 1999 36 36 36 S 80 45 2000 45 45 T 90 45 2001 45 Total POB 257 314 474 449 555 553 598
Total FPSO Workforce1 488 597 901 853 1,055 1,051 1,136 No. of FPSOs 7 9 13 12 15 15 16
Table 4.3 Total Offshore and FPSO Workforce Population Data
Year FPSO Population Total Offshore Population %
1996/97 597 26,853 2.2
199798 901 23,000 3.9
1998/99 853 25,500 3.4
1999/00 1,055 19,000 5.6
2000/01 1,051 23,330 4.5
2001/02 1,136 23,206 4.9
1 Offshore Workforce Population = 1.90 x POB (HSE Statistics Reports)
16

5 COMPARISON OF FPSO AND TOTAL INCIDENT STATISTICS
5.1 COMPARISON OF ACCIDENT AND INCIDENT RATES
It is the convention to report accident statistics as a rate, using a figure of 100,000 workers as a basis. Since the workforce population is known approximately the FPSO/FSU accident rate can be compared with the rate for all installation types on the UKCS. Although not an established convention, the same basis is used below to compare Dangerous Occurrences. This data is presented in Tables 5.1 and 5.2 below. The same information is presented graphically in Figure 5.1
Table 5.1 Incident Rates per 100,000 Workers (Floating Production)
1996/97 1997/98 1998/99 1999/00 2000/01 2001/02 Average
Fatalities 0 0 0 0 0 0 0
Major 0 777 469 190 381 352 362
O3D 3015 1776 1993 1043 1332 792 1659
Total Injuries 3015 2553 2462 1233 1713 1144 2021
DO 4690 6104 6682 6066 5994 5458 5832
All Incidents 7705 8657 9144 7299 7707 6602 7853
Table 5.2 Incident Rates per 100,000 Workers (Total Offshore Population)
1996/97 1997/98 1998/99 1999/00 2000/01 2001/02 Average
Fatalities 7 13 4 11 13 13 10
Major 164 322 290 279 214 246 253
O3D 1125 1265 961 1016 754 777 983
Total Injuries 1296 1600 1255 1306 981 1036 1246
DO 2119 2822 2718 3405 3056 2848 2828
All Incidents 3415 3422 3973 4711 4037 3884 4074
17

8000
7000
6000
5000
4000
3000
2000
1000
0
FPSO Injuries FPSO Dangerous Occurrences All Injuries All Dangerous Occurrences
1996/97 1997/98 1998/99 1999/00 2000/01 2001/02
Figure 5.1 Comparison of FPSO Incident Rates per 100,000 workers
Although there were no fatalities in the floating production population, indications are that the rates for injuries on FPSOs were approximately twice the rate of the total offshore population, and have reduced in 2002 to approximately the same rate. Similarly normalised rates of dangerous occurrences for FPSO/FSUs are approximately twice those of the total offshore population. The difference may be due to the methods used for the calculation of population data. Inland Revenue surveys are the source of data for all installations. A significant proportion of this data includes people at work on offshore support vessels (Ref 11). The FPSO population data was estimated directly from a POB count.
It can be noted that FPSOs show the same downward trend in incidents as for all installations.
As an alternative method of comparison, an incident rate count per installation is proposed. For simplicity this can be defined as the number of incidents (dangerous occurrences and all injuries) expected in ten years of operation.
For FPSOs this is obtained by dividing the number of incidents by the number of operational FPSOs (Table 4.2). The RIDDOR data for all installation types does not readily give a total of the number of installations in operation. A review of the raw data shows that 218 installations reported on incidents in 2000/01 and 2001/02. This figure is used as a reasonable approximation for all years from 1996/97. Incident rates expressed as ‘number of incidents in ten years’ are then obtained as given in Table 5.3. A comparison on this basis gives an average personnel count of 37 for an FPSO and 56 for all installation types, based on the offshore population data from Table 4.3
18
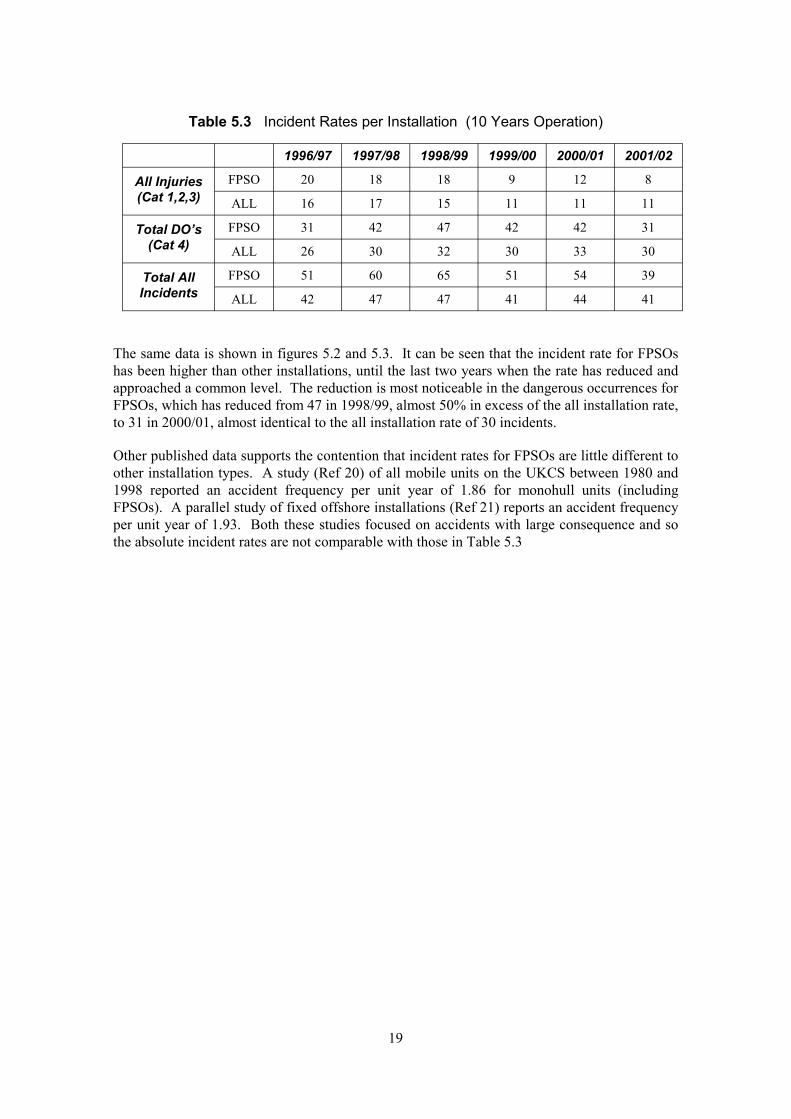
Table 5.3 Incident Rates per Installation (10 Years Operation)
1996/97 1997/98 1998/99 1999/00 2000/01 2001/02
All Injuries (Cat 1,2,3)
FPSO 20 18 18 9 12 8
ALL 16 17 15 11 11 11
Total DO’s (Cat 4)
FPSO 31 42 47 42 42 31
ALL 26 30 32 30 33 30
Total All Incidents
FPSO 51 60 65 51 54 39
ALL 42 47 47 41 44 41
The same data is shown in figures 5.2 and 5.3. It can be seen that the incident rate for FPSOs has been higher than other installations, until the last two years when the rate has reduced and approached a common level. The reduction is most noticeable in the dangerous occurrences for FPSOs, which has reduced from 47 in 1998/99, almost 50% in excess of the all installation rate, to 31 in 2000/01, almost identical to the all installation rate of 30 incidents.
Other published data supports the contention that incident rates for FPSOs are little different to other installation types. A study (Ref 20) of all mobile units on the UKCS between 1980 and 1998 reported an accident frequency per unit year of 1.86 for monohull units (including FPSOs). A parallel study of fixed offshore installations (Ref 21) reports an accident frequency per unit year of 1.93. Both these studies focused on accidents with large consequence and so the absolute incident rates are not comparable with those in Table 5.3
19

0 10 20 30 40 50 60 70 80
1996/97 1998/99 2000/01
Inj i
idents
Inj i idents
ur es DO's
Inc
ur es DO's Inc
Figure 5.2 FPSO Incident rate per 10 years operation
0 10 20 30 40 50 60 70 80
1996/97 1998/99 2000/01
Inj i
idents
Inj i idents
ur es DO's
Inc
ur es DO's Inc
Figure 5.3 All Installations Incident rate per 10 years operation
20

5.2 COMPARISON OF TYPE 77 DANGEROUS OCCURRENCES
Type 77 dangerous occurrences are those associated with: failure of equipment required to maintain a floating installation on station; objects dropped on an installation, attendant vessel or into water; or damage to an installation from adverse weather conditions.
It is unfortunate that this type of dangerous occurrence groups three types of cause together when ideally events due to adverse weather could be separately identified. However, Reference 17 states that in 2000/01, 95% of Type 77 dangerous occurrences were from dropped objects for all offshore activities. The data on adverse weather incidents is therefore somewhat limited.
The statistics of Type 77 dangerous occurrences for the years 1999/00 to 2001/02 were available, thus:
Table 5.4 All Installation Type 77 Dangerous Occurrences
1998/99 1999/00 2000/01 2001/02
Type 77 DO 157 (23%) 163 (26%) 177 (24%) 169 (25%)
Total DO 693 633 727 661
Table 5.5 FPSO Type 77 Dangerous Occurrences
1998/99 1999/00 2000/01 2001/02
Type 77 DO 7 (12%) 4 (6%) 12 (19%) 4 (8%)
Total DO 57 64 63 49
It can be seen that Type 77 dangerous occurrences for FPSOs represent a much lower proportion of the total of dangerous occurrences than for all installation types. This is most likely due to the elimination of drilling and well workover activities on the FPSO and the associated risk of dropped objects.
21

22

6 CONCLUSIONS
This study investigated the accident and incident statistics of FPSO monohull vessels in the UK Sector over the period 1996 to 2002 compared with fixed offshore installations of all types. Particular attention was given to incidents related to adverse weather and vessel motion responses.
General accident / incident information for all offshore activities was available from HSE annual statistics from RIDDOR, and specific data for floating production systems were available on request. This included the raw data for floating production systems as a result of a search of the RIDDOR Database.
The categories / types of accident and incident data contained in the RIDDOR statistics of offshore activities provided little information specific to floaters or indeed FPSO/FSUs. Only one category of dangerous occurrence (out of 23 types) referred to weather related damage, which could include incidents due to vessel motion; this dangerous occurrence (Type 77) also includes failure of station-keeping equipment and dropped objects – the latter forms by far the largest category of type 77 incidents
In 2000/01, the highest number of reported dangerous occurrence incidents for all installation types was the release of petroleum hydrocarbon (37% of all dangerous occurrences). For FPSOs a higher proportion (48%) of hydrocarbon releases has been reported. The next most frequently reported dangerous occurrence was Type 77 (25%), of these 95% were dropped objects.
Reviewing the types of dangerous occurrences, for specific FPSO/FSU data 1996 to 2002, showed that about 20% of incidents were related to FPSO/FSU systems “not present on other fixed installations”. Of these:
o 33% were attributed to risers / swivels or turrets, o 22% arise from offloading systems, o 15% relate to adverse weather including wave loading incidents and motion
related incidents, and o 11% arise from collision, potential collision and stability incidents o 10% arise from marine SW systems, COW, and tank vent systems o 9% arise from mooring and DP incidents
It was found from other work that vessel motions were a major contributory factor in only two incidents. However, it could be argued that green water and wave slam incidents are a function of vessel motions. In this case, the 17 green water and two wave slam incidents over the period 1995 to 2000 should be included.
Other referenced work suggested that, at least in the earlier years of operation, structural incidents on FPSOs were nearly five times greater than for fixed steel installations. However when adjustments are made for incidents of wave/wave slam, shuttle tanker offloading and other incidents on which effective action has been taken, the structural incident rate of FPSOs is similar to that of other installations.
23

The total population engaged in offshore operations has decreased from over 30,000 people in the early 1990s to around 23,000 in 2002. In contrast, the FPSO/FSU population has increased to represent about 5% of the total offshore population in year 2002.
Over the six years (1996-2002) FPSOs have approximately twice rate of dangerous occurrences compared with the statistics for all offshore installations. However the figures may not be directly comparable due to differences in calculation methods. Nevertheless it is clear that over the years 1996-2002 there has been a downward trend in dangerous occurrences on both FPSOs and all installation types.
An alternative presentation of the data based on incidents per installation shows that FPSOs have in 2002 the same dangerous occurrence rate as for all installations. This figure has reduced from 50% in excess of other installation types in 1998/99.
In RIDDOR, the Type 77 category is the only place where weather-related events can be accommodated. Dropped objects dominate this category. For floating Installations, it may be better that Type 77 Dangerous Occurrence data are analysed with more categories. Type 77 dangerous occurrences for FPSOs represent a much lower proportion of the total of dangerous occurrences for all installation types. This is most likely due to the elimination of drilling and well workover activities on the FPSO and the associated risk of dropped objects.
24

7 REFERENCES
1. Successful Regulatory Practices and Experiences, Mills P. J., FPSOs – Present and Future Conference, Houston, June 2000.
2. Analysis of Accident Statistics for floating Monohull and Fixed Installations - HSE Task ID BOM/0025: BOMEL Report C958\\02\007R May 2001
3. The Reporting of Injuries, Diseases and Dangerous Occurrences Regulations (SI 1995/3163) RIDDOR. 1995
4. The Offshore Installations and Wells (Design and Construction, etc) Regulations (SI 1996/913) DCR. 1996
5. Offshore Accident and Incident Statistics Report, 1996 (Provisional Data). Offshore Technology Report. OTO 96 955, October 1996.
6. Offshore Accident and Incident Statistics Report, 1997 (Provisional Data. Offshore Technology Report. OTO 97 951, November 1997.
7. Offshore Accident and Incident Statistics Report, 1998 (Provisional Data). Offshore Technology Report. OTO 98 952, November 1998.
8. Offshore Accident and Incident Statistics Report, 1998/1999 (Provisional Data). Offshore Technology Report. OTO 1999 077, October 1999.
9. Offshore Accident and Incident Statistics Report, 1999/2000 (Provisional Data). Offshore Technology Report. OTO 2000 011, October 2000.
10. HSR 2001 001 - Offshore Injury, Ill Health and Incident Statistics 2000/2001
11. Offshore Accident Rates for April 1996 to March 1998 OTO 2000 012
12. Monohull Incidents - 1996/7 (RIDDOR) internal HSE correspondence
13. Monohull Incidents - 1997/8 (RIDDOR) internal HSE correspondence
14. Monohull Incidents - 1998/9 (RIDDOR) internal HSE correspondence
15. Monohull Incidents - 1999/00 and 01.04.00 to 08.03.01 - internal HSE correspondence
16. ‘FPSO Accident Statistics update’ from HID CD4C dated 21/08/02 HSE internal email
17. Weather-Sensitive Offshore Operations and Metocean Data. PAFA. Final Report, C061-127-R, Rev 1, March 2001.
18. FPSO/FSUs Green Water and Wave Slam Incident Analysis. BOMEL Limited on Behalf of the BOMEL Consortium. Report C902\01\012R, Rev B, January 2001.
19. Review of Reported Structural Integrity Incidents. BOMEL Limited on Behalf of the BOMEL Consortium. Report C898\01\015R, Rev O, December 2000.
20. Accident statistics for mobile offshore units on the UK continental shelf OTO 2000 091
21. Accident statistics for fixed offshore units on the UK Continental Shelf 1991-1999 OTO 2002 012
25

Printed and published by the Health and Safety ExecutiveC30 1/98
Printed and published by the Health and Safety Executive C1.25 02/03
ISBN 0-7176-2610-5
RR 047
780717626106£20.00 9