research report globalisation and fish utilisation … · anne nyapendi research assistant richard...
TRANSCRIPT

RESEARCH REPORT
GLOBALISATION AND FISH UTILISATION AND MARKETING STUDY
SELECTED LANDING SITES ON LAKES KYOGA AND ALBERT
SOCIO-ECONOMICS SECTION
FISHERIES RESOURCES RESEARCH INSTITUTE
Jinja, Uganda
Submitted to Mike Dillon Associates Limited: July, 2002

i
THE RESEARCH TEAM
Konstantine Odongkara Team Leader
Jonnah Wegoye Researcher
Mercy Kyangwa Researcher
Anne Nyapendi Research Assistant
Richard Jawoko Driver
CONTACT ADDRESS
Fisheries Resources Research Institute
National Agricultural Research Organisation
P.O. Box 343, JINJA Uganda
Fax: 256-43-120192
Tel. 256-43-120484
e-mail: [email protected]

ii
ACCRONYMS
AFO Assistant Fisheries Officer
DFID Department for International Development
DFO District Fisheries Officer
DFR Department for Fisheries Resources
DRC Democratic Republic of Congo
EPRC Economic Policy Research Centre
FIRRI Fisheries Resources Research Institute
MFPED Ministry of Finance, Planning and Economic Development
PAF Poverty Action Fund

iii
DEFINITIONS
Basket trap A traditional basket-like fishing gear made out of natural fibre or wires and set in papyrus shoreline waters.
Boat seine A large encircling active net fitted with ropes at it’s ends to haul it, fished from a boat.
Congo barque A local word used to mean a big boat manually propelled
Kabalega A local word used on Lake Albert to describe a very large outboard powered boat.
Kaganga A fishing method used in the shoreline waters of Lake Albert and uses perforated troughs as fishing gear to trap Alestes nurse.
Mukene A small pelagic fish caught using light and scientifically called Rastreneobola argentea
Parachute A term used to refer to a three-planked small boat with a flat bottom manually propelled
Scoop net A net fitted with a metallic ring and a rod used for catching mukene.
Ssesse A local word widely used to mean a V-shaped boat with definite angles and a keel.
iv
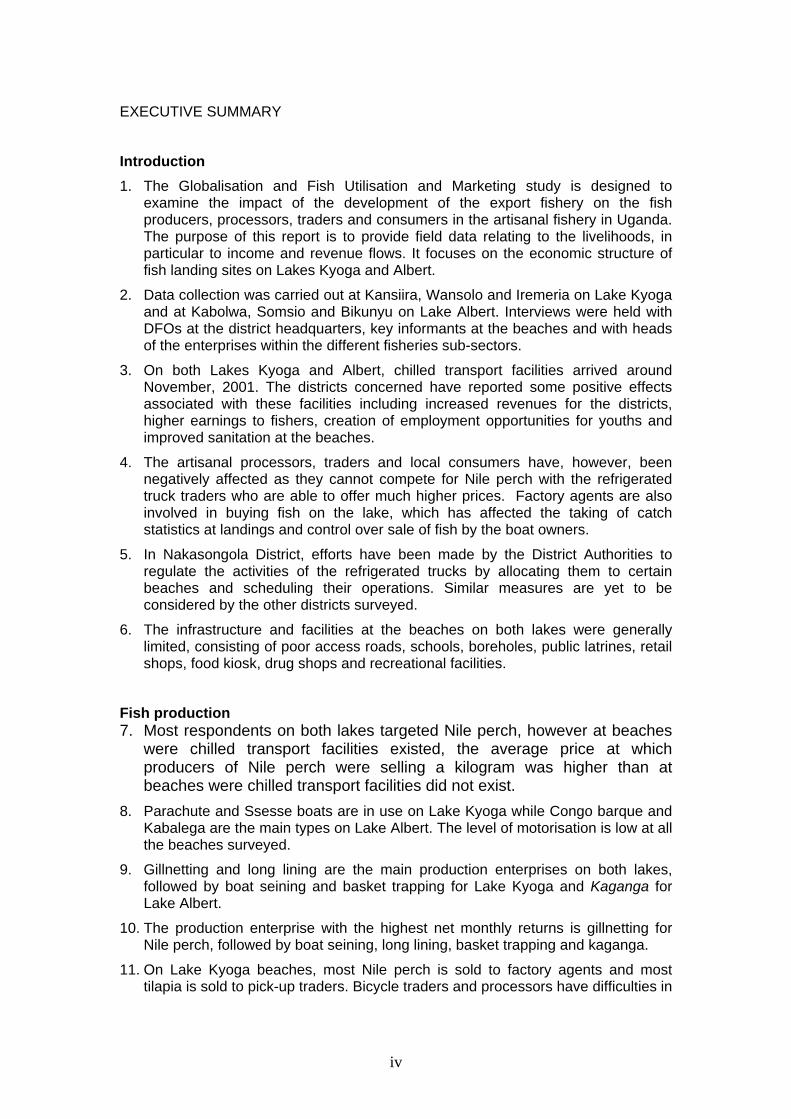
EXECUTIVE SUMMARY
Introduction 1. The Globalisation and Fish Utilisation and Marketing study is designed to
examine the impact of the development of the export fishery on the fish producers, processors, traders and consumers in the artisanal fishery in Uganda. The purpose of this report is to provide field data relating to the livelihoods, in particular to income and revenue flows. It focuses on the economic structure of fish landing sites on Lakes Kyoga and Albert.
2. Data collection was carried out at Kansiira, Wansolo and Iremeria on Lake Kyoga and at Kabolwa, Somsio and Bikunyu on Lake Albert. Interviews were held with DFOs at the district headquarters, key informants at the beaches and with heads of the enterprises within the different fisheries sub-sectors.
3. On both Lakes Kyoga and Albert, chilled transport facilities arrived around November, 2001. The districts concerned have reported some positive effects associated with these facilities including increased revenues for the districts, higher earnings to fishers, creation of employment opportunities for youths and improved sanitation at the beaches.
4. The artisanal processors, traders and local consumers have, however, been negatively affected as they cannot compete for Nile perch with the refrigerated truck traders who are able to offer much higher prices. Factory agents are also involved in buying fish on the lake, which has affected the taking of catch statistics at landings and control over sale of fish by the boat owners.
5. In Nakasongola District, efforts have been made by the District Authorities to regulate the activities of the refrigerated trucks by allocating them to certain beaches and scheduling their operations. Similar measures are yet to be considered by the other districts surveyed.
6. The infrastructure and facilities at the beaches on both lakes were generally limited, consisting of poor access roads, schools, boreholes, public latrines, retail shops, food kiosk, drug shops and recreational facilities.
Fish production 7. Most respondents on both lakes targeted Nile perch, however at beaches
were chilled transport facilities existed, the average price at which producers of Nile perch were selling a kilogram was higher than at beaches were chilled transport facilities did not exist.
8. Parachute and Ssesse boats are in use on Lake Kyoga while Congo barque and Kabalega are the main types on Lake Albert. The level of motorisation is low at all the beaches surveyed.
9. Gillnetting and long lining are the main production enterprises on both lakes, followed by boat seining and basket trapping for Lake Kyoga and Kaganga for Lake Albert.
10. The production enterprise with the highest net monthly returns is gillnetting for Nile perch, followed by boat seining, long lining, basket trapping and kaganga.
11. On Lake Kyoga beaches, most Nile perch is sold to factory agents and most tilapia is sold to pick-up traders. Bicycle traders and processors have difficulties in

v
obtaining fish supplies. On Lake Albert, most Nile perch is sold to factory agents while tilapia is sold to truck traders and processors in similar proportions.
Fish processing 12. The most processed fish species was Nile Tilapia, followed by Hydrocynus
and Nile perch, however, at beaches were chilled transport facilities existed, the price of a kilogram of Nile perch destined for processing was much lower than that of Nile Tilapia meaning that processors were buying rejected Nile perch from the factory trucks.
13. Fish smoking is the main processing techniques at the beaches, with salting/sun drying being more significant on Lake Albert.
14. There is greater investment in smoking, involving construction of smoking kilns made of mud, bricks and wire mesh, than in salting/ sun drying, where often communal drying grounds are used.
15. Smoked fish is marketed within the urban areas in Uganda while salted/sun dried fish is sold in the DRC.
16. Returns on salting/sun drying are higher than those on fish smoking. Fish marketing 17. The main types of fish traders on Lake Kyoga are boat traders (also
factory agents), pick-up traders and bicycle traders. On Lake Albert, the main traders are processor/traders and factory agents.
18. Factory agents/boat traders mainly deal in Nile perch while other traders (processor/trader, bicycle and pick-up trader) deal in other species.
19. Factory agents/boat traders realise the highest net returns, followed by pick-up traders.
Fish consumption 20. Consumers can be distinguished between those who engage in fishery activities
and those who do not, with the former hardly buying the fish they consume. Both consumers not involved in fishery activities and those involved commonly consumed Nile Tilapia, even at beaches were Nile perch was the most landed species. This could be attributed to preference or the fact that Nile perch fetches better prices and therefore put for sale other than consumption.
21. The average daily quantity of fish consumed by the beachside communities is 2.5 kg for Lake Kyoga and 3.0 kg for Lake Albert.
22. Most consumers believe that the quantities of fish and the frequency of consumption have decreased over the last one year.
23. Most consumers reported that the prices of fish for consumption had increased over the last one year.
24. The size of fish for consumption was also reported to have decreased over the last one year.
25. The most common substitute for fish reported was beans, followed by vegetables.

vi
TABLE OF CONTENTS
Page
ACCRONYMS ii
DEFINITIONS iii
EXECUTIVE SUMMARY iv
1. INTRODUCTION 1
1.1 Objectives 1
1.2 Conceptual Framework 1
1.2.1 Livelihoods analysis 1
1.2.2 Food security 3
1.2.3 Impact on income 3
1.2.4 Model Specification 4
1.3 Methodology 4
1.3.1 Study Area 4
1.3.2 Economic Sub-sectors 5
1.3.3 Sample Selection 6
1.3.4 Data Collection 6
1.3.5 Data Analysis 7
2. KANSIIRA LANDING SITE 9

vii
2.1 Background 9
2.1.1 Infrastructure and Facilities 11
2.2 Fish Production Sub-sector 11
2.2.1 Overview 11
2.2.2 Fishers’ Characteristics 12
2.2.3 Fishing Inputs and Costs 13
2.2.4 Earnings of the Production Enterprises 16
2.3 Fish Processing Sub-sector 17
2.3.1 Overview 17
2.3.2 Fish Processors’ Characteristics 17
2.3.3 Fish Processing Inputs and Costs 18
2.3.4 Processors’ Outputs and Incomes 19
2.4 Fish Marketing 20
2.4.1 Overview 20
2.4.2 Fish Traders’ Characteristics 21
2.4.3 Inputs and Costs 22
2.4.4 Output and Incomes 22
2.5 Fish Consumption 23
2.5.1 Consumers’ characteristics 23
2.5.2 Consumption Levels and Trends 23
2.5.3 Pricing Levels and Trends 25
2.6 Community Perceptions towards Chilled Transport Facilities 26
3. WANSOLO LANDING SITE 27
3.1 Background 27
3.1.1 Infrastructure and Facilities 28
3.2 Fish Production 28
3.2.1 Overview 28
3.2.2 Fishers’ Characteristics 29
3.2.3 Fishing Inputs and Costs 30
3.2.4 Perceptions to the Resource 31
3.2.5 Enterprise Earnings 32
3.3 Fish Processing 33
3.3.1 Overview 33
3.3.2 Fish Processing Inputs and Costs 33
3.3.3 Processing Outputs and Income 35
3.4 Fish Marketing 35

viii
3.4.1 Overview 35
3.4.2 Fish Traders’ Characteristics 36
3.4.3 Fish Marketing Inputs and Costs 36
3.4.4 Marketing Outputs and Income 37
3.5 Fish Consumption 38
3.5.1 Consumers’ characteristics 38
3.5.2 Consumption Levels and Trends 38
3.5.3 Price Levels and Trends 41
3.6 Community Perceptions towards Chilled Transport Facilities 41
4. IREMERIA LANDING SITE 42
4.1 Background 42
4.1.1 Infrastructure and Facilities 43
4.2 Fish Production 43
4.2.1 Overview 43
4.2.2 Fishers’ Characteristics 44
4.2.3 Fishing Inputs and Costs 44
4.2.4 Earnings of Production Enterprises 45
4.3 Fish Processing 46
4.3.1 Overview 46
4.4 Fish Marketing 46
4.4.1 Overview 46
4.5 Fish Consumption 47
4.5.1 Consumers’ characteristics 47
4.5.2 Consumption Levels and Trends 47
4.5.3 Price Levels and Trends 49
4.6 Community Perceptions towards Chilled Transport Facilities 50
5. KABOLWA LANDING SITE 51
5.1 Background 51
5.1.1 Infrastructure and Facilities at Kabolwa 52
5.2 Fish Production Sub-sector 52
5.2.1 Overview 52
5.2.2 Fishers’ characteristics 53
5.2.3 Fishing inputs and Costs 54
5.2.4 Earnings of the Production Enterprises 58
5.3 Fish Processing Sub-sector 59
5.3.1 Overview 59

ix
5.3.2 Fish Processors characteristics 59
5.3.3 Fish Processing Inputs and Costs 59
5.3.4 Processors’ Outputs and Incomes 60
5.4 Fish Marketing Sub-sector 61
5.4.1 Overview 61
5.4.2 Fish Traders Characteristics 62
5.4.3 Inputs and Costs 63
5.4.4 Outputs and Incomes 63
5.5 Fish Consumption 64
5.5.1 Consumers’ characteristics 64
5.5.2 Consumption Levels and Trends 64
5.5.3 Price Levels and Trends 67
5.5.4 Community Perceptions Towards Chilled Transport Facilities 67
6. SOMSIO LANDING SITE 68
6.1 Background 68
6.1.1 Infrastructure and Facilities 68
6.2 Fish Production Sub-sector 68
6.2.1 Overview 68
6.2.2 Fishers’ Characteristics 69
6.2.3 Inputs and Costs 70
6.2.4 Earnings of the Production Enterprises 74
6.3 Fish Processing Sub-sector 75
6.3.1 Overview 75
6.3.2 Fish Processors Characteristics 75
6.3.3 Fish Processing Inputs and Costs 75
6.3.4 Processors’ Outputs and Incomes 76
6.4 Fish Marketing Sub-sectors 77
6.4.1 Overview 77
6.5 Fish Consumption 78
6.5.1 Consumers’ characteristics 78
6.5.2 Consumption Levels and Trends 78
6.5.3 Price Levels and Trends 81
6.6 Community Perceptions towards Chilled Transport Facilities 81
7 BIKUNYU LANDING SITE 82
7.1 Background 82
7.1.1 Infrastructure and Facilities at Bikunyu 83

x
7.2 Fish Production Sub-sector 83
7.2.1 Overview 83
7.2.2 Fishers’ characteristics 84
7.2.3 Fishing Inputs and Costs 85
7.2.4 Earnings of the Production Enterprises 89
7.3 Fish Processing Sub-sector 91
7.3.1 Overview 91
7.4 Fish Marketing Sub-sector 91
7.4.1 Overview 91
7.4.2 Fish Traders’ Characteristics 92
7.4.3 Inputs and Costs 92
7.4.4 Outputs and Incomes 93
7.5 Fish Consumption 94
7.5.1 Consumers’ characteristics 94
7.5.2 Consumption Levels and Trends 94
7.5.3 Pricing Levels and Trends 97
7.6 Community Perceptions Towards Chilled Transport Facilities 97
BIBILIOGRAPHY 98
Appendix 1: Principal Persons Met 100
Appendix 2a: Information From the District Fisheries Officers 101
Appendix 2b: Key Informant Interviews 102
Appendix 2c: Unit Questionnaires for Production Sub-Sector Enterprise 108
Appendix 2d: Unit Questionnaire for fish Processors 113
Appendix 2e: Unit Questionnaires For Fish Marketing Sub-Sector 118
Appendix 2f: Unit Questionnaires For Fish Consumers 121
Appendix 3: Extract from the Fishing (amendments) Rules, 2001 for Lakes Albert, Kyoga and kwania
123

xi
LIST OF TABLES
Page
Table 1.1: Selected Landing Sites 5
Table 1.2: Fishery Enterprises by Sub-sector 5
Table 1.3: Aggregate Level Data 6
Table 1.4: Unit level Data 7
Table 2.1: Estimated Fish Catch for Nakasongola District by Species, Weight and Value for 2001
9
Table 2.2: Current Rates Charged by Nakasongola District for the Various Fishery Activities and Fishing Vessels.
10
Table 2.3: Infrastructure and Facilities 11
Table 2.4: Ranking of Production Enterprises by Number at Kansiira 11
Table 2.5: Fish species most targeted by respondents at Kansiira Beach
12
Table 2.6: Alternative sources of income 12
Table 2.7: Information on the Boats Owned 13
Table 2.8: Information of outboard engine 13
Table 2.9 Main gear Types Used 13
Table 2.10: Information on Gear Types Used 14
Table 2.11: Source of Initial Capital 14
Table 2.12: Payments to Production Labour 15
Table 2.13: Valuation of Entrepreneurship by Type of Enterprise 15
Table 2.14: Other Operational Costs in Production (Shs/month) 15
Table 2.15 Summary of Monthly Production Costs 16
Table 2.16: Average catches and incomes of fishers by species. 16
Table 2.17: Age Structure, Household Size and Years Spent at Landing
17
Table 2.18: Distribution of Fish Processors by Type of Processing Facility and their Ownership Status
18
Table 2.19: Monthly Input Costs of Fish Processing Units by Method of Processing
19
Table 2.20: Costs of Raw Fish and Revenues from Processed Fish by Species
20
Table 2.21. Fresh Fish Prices by Species 21
Table 2.22: Distribution of Fish Traders in the Sample by Means of Transport
21
Table 2.23: Mean Input Costs of Fish Trading Units by Type of Trader 22
Table 2.24: Average Cost of Raw Fish and Revenues of Fish Traders 23

xii
by Species and Type of Trader
Table 2.25: Commonly Consumed Fish Species at Kansiira by Category of Consumer
24
Table 2.26. Average Daily Weight of Fish Consumed at Kansiira by Type of Consumer (in kg)
24
Table 2.27: Average Number of Times Fish is Consumed in a Week at Kansiira by Type of Consumer
25
Table 2.28: Respondents Reporting Reduction in Sizes of Fish for Consumption at Kansiira
25
Table 2.29: Prices of Fish Species for Consumption at Kansiira (in Shs)
26
Table 3.1: Estimated Fish Catches by Weight and Value for Apac District, 2001
27
Table 3.2: Rates on Various Fishery Activities and Fishing Vessels. 27
Table 3.3: General Facilities and Infrastructure Available at Wansolo 28
Table 3.4: Rank and Number of Production Enterprises by Category at Wansolo
29
Table 3.5: Alternative Sources of Livelihood 30
Table 3.6: Selected Information on Boats Owned by Respondents 30
Table 3.7: Summary Information on Outboard Engines at Wansolo 30
Table 3.8: Information on Gear Types 31
Table 3.9: Summary of Monthly Production Costs by Enterprise 32
Table 3.10: Summary Monthly Revenues for the Enterprises by Species
32
Table 3.11: Distribution of Fish Processors by Type of Processing Facility and Ownership
33
Table 3.12: Input Costs of Fish Processing Units by Method of Processing
34
Table 3.13: Cost of Raw Fish and Revenues from Processed Fish by Species
35
Table 3.14: Prices of Fresh Fish by Species 36
Table 3.15: Distribution of Fish Traders by Means of Transport 36
Table 3.16: Input Costs of Fish Trading Units by Type of Trader 37
Table 3.17: Cost of Inputs and Revenues for Fish Marketing 37
Table 3.18: Commonly Consumed Fish Species at Wansolo by Type of Consumer
38
Table 3.19: Average Quantities of Fish Consumed at Wansolo by Type of Consumer (kg/day)
39
Table 3.20: Average Number of Times Fish is Consumed in a Week at Wansolo by Type of Consumer
39
Table 3.21: Respondents Reporting Reduction in Sizes of Fish for 40

xiii
Consumption at Wansolo
Table 3.22: Main Substitutes to Fish at Wansolo 40
Table 3.23: Prices of Fish Species in Shs for Consumption at Wansolo 41
Table 4.1: Previous Revenue Rates Charged at Iremeria Landing Site 42
Table 4.2: Number and Description of Facilities and Infrastructure at Iremeria
43
Table 4.3: Rank and Number per Category of Fishers at Iremeria 43
Table 4.4: Information on Fishing Boats 44
Table 4.5: Information on Gear Types Used 44
Table 4.6: Monthly Summary of Production Costs 45
Table 4.7: Summary of Monthly Revenues by Type of Enterprise 45
Table 4.8: Main Destinations of Fish Species and Product Forms from Iremeria
46
Table 4.9: Average Fish Prices at Iremeria 47
Table 4.10: Commonly Consumed Fish Species at Iremeria by Category of Consumer
47
Table 4.11: Average Quantity of Fish Consumed at Iremeria by Type of Consumer (kg/day)
48
Table 4.12: Average Number of Times Fish is Consumed in a Week at Iremeria by Type of Consumer
48
Table 4.13: Respondents Reporting Reduction in Sizes of Fish for Consumption at Iremeria
49
Table 4.14: Main Substitute to Fish at Iremeria 49
Table 4.15: Prices of Fish Species in Shs for Consumption at Iremeria 49
Table 5.1: Rates Charged on Fishery Activities and Fishing Vessels. 51
Table 5.2. Facilities and Infrastructure at Kabolwa 52
Table 5.3. Ranking of Production Enterprises by Number at Kabolwa 53
Table 5.4: Information on Boats Owned at Kabolwa. 55
Table 5.5: Information on Outboard Engine at Kabolwa 55
Table 5.6: Gear Types Used by Respondents 55
Table 5.7: Information on Gear Owned. 56
Table 5.8: Sources of Initial Capital for Fishing 56
Table 5.9: Monthly Summary of Production Costs 57
Table 5.10: Average catches and incomes of fishers by species 58
Table 5.11: Distribution of Fish Processors by Type of Processing Facility and Ownership
59
Table 5.12: Monthly Input Costs of Fish Processing Units by Method of Processing
60

xiv
Table 5.13: Costs of Raw Fish and Revenues from Processed Fish by Species
61
Table 5.14. Main destinations of fish species and product forms 62
Table 5.15. Fresh Fish Prices per kg by Species 62
Table 5.16: Distributions of Fish Traders by Means of Transport 62
Table 5.17: Monthly Input Costs of Fish Trading Units by Type of Trader
63
Table 5.18: Cost of Fish and Revenues of Fish Traders by Species and Type of Trader
63
Table 5.19: Commonly Consumed Fish Species at Kabolwa by Type of Consumer
64
Table 5.20: Quantities of Fish Consumed at Kabolwa by Type of Consumer (kg/day)
65
Table 5.21: Average Number of Times Fish is Consumed in a Week at Kabolwa by Type of Consumer
65
Table 5.22: Respondents Reporting Reduction in Sizes of Fish for Consumption at Kabolwa
66
Table 5.23: Main Substitutes to Fish at Kabolwa 66
Table 5.24: Prices of Fish for Consumption at Kabolwa (Shs/kg) 67
Table 6.1: Infrastructure and Facilities at Somsio Landing Site. 68
Table 6.2. Ranking of Production Enterprises by Number at Somsio 68
Table 6.3. Ranking of Species Landed at Somsio 69
Table 6.4: Information on Boat Types Owned at Somsio 70
Table 6.5: Information on Gear Types Owned 71
Table 6.6: Number of Respondents Reporting the Different Sources of Initial Capital
71
Table 6.7: Number of Crews, Modes of Payment and Days Worked per Week
72
Table 6.8: Assessment of the Resource Base at Somsio 73
Table 6.9: Monthly Summary of Production Costs 73
Table 6.10: Average Catches and Incomes of Fishers by Species 74
Table 6.11: Distribution of Fish Processors by Type of Processing Facility and their Ownership Status
75
Table 6.12: Monthly Input Costs of Fish Processing Units by Method of Processing
76
Table 6.13: Costs and Revenues of Processors by Species 77
Table 6.14. Main Destinations of Fish Species and Product Forms 77
Table 6.15. Fresh Fish Prices by Species 78
Table 6.16: Commonly Consumed Fish Species at Somsio by Type of Consumer
78

xv
Table 6.17: Quantities of Fish Consumed at Somsio by Type of Consumer (kg/day)
79
Table 6.18: Average Number of Times Fish is Consumed in a Week at Somsio by Type of Consumer
79
Table 6.19: Respondents Reporting Reduction in Sizes of Fish for Consumption at Somsio
80
Table 6.20: Main Substitutes to Fish at Somsio 80
Table 6.21: Prices of Fish Species for Consumption at Somsio (Shs) 81
Table 7.1: Rates Charged on Fishery Activities and Fishing Vessels. 82
Table 7.2. Infrastructure and Facilities at Bikunyu 83
Table 7.3: Ranking of Production Enterprises by Number at Bikunyu Landing Site
83
Table 7.4: Information on Boats Owned at Bikunyu 85
Table 7.5: Summary Information on Gear Types 86
Table 7.6: Number of Respondents Reporting the Different Sources of Initial Capital
86
Table 7.7: Information on the Crew and Modes of Payment 87
Table 7.8: Valuation of Entrepreneurship by Type of Enterprise 87
Table 7.9: Other Operational Costs in a Fishing Enterprise at Bikunyu (Shs/month)
88
Table 7.10: Assessment of the Resource Base at Bikunyu 88
Table 7.11: Monthly Summary of Production Costs 89
Table 7.12: Average Catches and Incomes of Fishers by Species 90
Table 7.13: Main Destinations of Fish Species and Product Forms 91
Table 7.14. Prices of Fish by Species 92
Table 7.15: Distributions of Fish Traders by Means of Transport 92
Table 7.16: Mean Input Costs of Fish Trading Units by Type of Trader 93
Table 7.17: Average Cost of Raw Fish and Revenues of Fish Traders by Species and Type of Trader
93
Table 7.18: Commonly Consumed Fish Species at Bikunyu by Type of Consumer
94
Table 7.19: Quantities of Fish Consumed at Bikunyu by Type of Consumer (kg/day
95
Table 7.20: Average Number of Times Fish is consumed in a Week at Bikunyu by Type of Consumer
95
Table 7.21: Respondents Reporting Reduction in Sizes of Fish for Consumption at Bikunyu
96
Table 7.22: Main Substitutes to Fish at Bikunyu 96
Table 7.23: Prices of Fish Species for Consumption at Bikunyu (Shs) 97

xvi
LIST OF FIGURES
Page
Figure 1.1; The Pentagon of Livelihood Assets 2
Figure 1.2: Fish Value Flow Model for Lakes Kyoga and Albert 4
Figure 5.1: Main Species Targeted by Producers at Kabolwa
Figure 6.1: Main Fish Species Targeted by Fish Producers at Somsio
Figure 7.1: Main Fish Species Targeted by Fish Producers at Bikunyu

xvii
MAP 1: RESEARCH SITES ON LAKE KYOGA

xviii
MAP 2: RESEARCH SITES ON LAKE ALBERT

1
REPORT OF THE GLOBALISATION AND UTILISATION AND FISH MARKETING STUDY ON LAKES KYOGA AND ALBERT
1. INTRODUCTION
The Globalisation and Fish Utilisation and Marketing Study is a collaboration between the Fisheries Resources Research Institute (FIRRI) and the Mike Dillon Associates Limited, with funding from the Department for International Development (DFID) of the Government of the United Kingdom. The study is designed to examine the impact of the development of the export fishery on the fish producers, processors, traders and consumers in the artisanal fishery in Uganda. FIRRI’s role is to collect field data relating to the livelihoods of artisanal fish producers, processors, traders and consumers, in particular data relating to income and revenue flow. The initial focus is on the economic structure of fish landing sites.
During the first quarter, namely April to June, 2002, work was carried out on Lakes Kyoga and Albert and the focus was on the economic structure of fish landings.
1.1 Objectives The objectives for this quarter will be to develop a sector-wide model and detailed models of selected landing sites on Lakes Kyoga and Albert. The specific objectives are as follows:
i) Identify three landing sites on Lake Kyoga and three on Lake Albert using the given criteria.
ii) Determine dates for field visits.
iii) Identify discrete economic sub-sectors within the artisanal sector for analysis.
iv) Collect data on individual or household incomes and costs and revenues of economic units, both aggregate and individual, for the landing sites sampled.
v) Prepare a research report on each landing site.
vi) Plan the continuation of the data collection process into the next quarter.
vii) Prepare a budget for the next quarter.
The purpose of this document is to provide research reports on each of the landing sites at which the research was conducted.
1.2 Conceptual Framework Globalisation of the fisheries involves opening up of the nation’s fisheries to the international market as well as to foreign investments. This transformation has the potential of creating new activities and bringing in new players on the scene. The fishery would evolve into new structures with new products and higher levels of production. It would also create new demands in terms of skills, facilities and services. All this would have implications for the livelihoods of the local communities.
1.2.1 Livelihoods analysis A definition of livelihood includes capabilities, assets and activities that contribute to local living. Desired livelihood outcomes of a community include food security, improved incomes and higher quality of life, reflected in high levels of educational and health achievements. Apart from improving the livelihood of a community, there

2
is need to ensure its sustainability. A livelihood is said to be sustainable “when it can cope with and recover from stresses and shocks and maintain or enhance its capabilities and assets both now and in the future, while not undermining the national resource base” (Carney 1998). Reduced vulnerability and more sustainable use of the natural resource base are, therefore, other important livelihood outcomes.
Globalisation could enhance livelihoods in the fisheries by influencing the different elements of the pentagon of livelihood assets of the communities, as illustrated in Figure 1.1
Figure 1.1: The Pentagon of Livelihood Assets
Human capital
Financial capital Social capital
Natural capital Physical capital
Source: Carney 1998
The various livelihood assets of the fishing communities and how they are affected by globalisation are outlined below:
a) Human capital refers to the skills, knowledge, ability to work and to pursue different livelihood strategies as well as health. Through globalisation and the demands it creates, these qualities would be stimulated and considerable achievements made in human development in fisheries.
b) Financial capital includes financial resources available through earnings, savings and credit that could be channeled into livelihood activities. Fish exports would increase earnings among the fishery communities.
c) Physical capital refers to infrastructure, namely transport, water, electricity and communication, as well as production and processing equipment needed in pursuing livelihoods. Globalisation could create demand for infrastructure, stimulating response by the relevant state ministries and district authorities. Considerable improvement would also occur with respect to private fishing and fish processing equipment.
d) Natural capital concerns natural resource stocks from which resource flows that are useful for livelihoods are derived. Globalisation might exert strain on the fisheries resources, especially in the face of poor resource management by a weak fisheries institution. However, with globalisation, the lakes would attract greater official support, expertise and resources into the management of fisheries resources.
e) Social capital includes the support from social groups upon which people draw in pursuit of livelihoods. Fisherfolk organizations are needed to render different types of services to fishers, processors and traders, men and women. Through globalisation, fishers would have greater access to
3
knowledge, skills and resources for improved management of their community institutions.
Globalisation could, therefore, be important for fisheries by stimulating development of all the elements within the pentagon of livelihood assets.
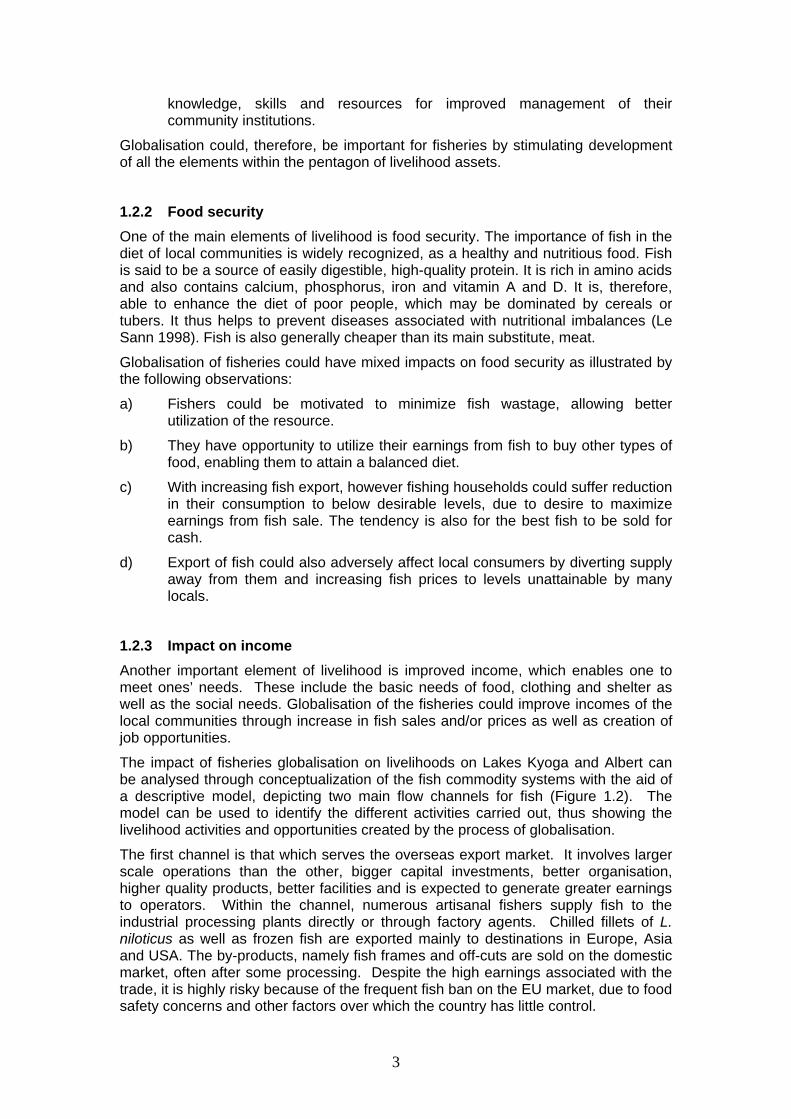
1.2.2 Food security One of the main elements of livelihood is food security. The importance of fish in the diet of local communities is widely recognized, as a healthy and nutritious food. Fish is said to be a source of easily digestible, high-quality protein. It is rich in amino acids and also contains calcium, phosphorus, iron and vitamin A and D. It is, therefore, able to enhance the diet of poor people, which may be dominated by cereals or tubers. It thus helps to prevent diseases associated with nutritional imbalances (Le Sann 1998). Fish is also generally cheaper than its main substitute, meat.
Globalisation of fisheries could have mixed impacts on food security as illustrated by the following observations:
a) Fishers could be motivated to minimize fish wastage, allowing better utilization of the resource.
b) They have opportunity to utilize their earnings from fish to buy other types of food, enabling them to attain a balanced diet.
c) With increasing fish export, however fishing households could suffer reduction in their consumption to below desirable levels, due to desire to maximize earnings from fish sale. The tendency is also for the best fish to be sold for cash.
d) Export of fish could also adversely affect local consumers by diverting supply away from them and increasing fish prices to levels unattainable by many locals.
1.2.3 Impact on income Another important element of livelihood is improved income, which enables one to meet ones’ needs. These include the basic needs of food, clothing and shelter as well as the social needs. Globalisation of the fisheries could improve incomes of the local communities through increase in fish sales and/or prices as well as creation of job opportunities.
The impact of fisheries globalisation on livelihoods on Lakes Kyoga and Albert can be analysed through conceptualization of the fish commodity systems with the aid of a descriptive model, depicting two main flow channels for fish (Figure 1.2). The model can be used to identify the different activities carried out, thus showing the livelihood activities and opportunities created by the process of globalisation.
The first channel is that which serves the overseas export market. It involves larger scale operations than the other, bigger capital investments, better organisation, higher quality products, better facilities and is expected to generate greater earnings to operators. Within the channel, numerous artisanal fishers supply fish to the industrial processing plants directly or through factory agents. Chilled fillets of L. niloticus as well as frozen fish are exported mainly to destinations in Europe, Asia and USA. The by-products, namely fish frames and off-cuts are sold on the domestic market, often after some processing. Despite the high earnings associated with the trade, it is highly risky because of the frequent fish ban on the EU market, due to food safety concerns and other factors over which the country has little control.

4
The second channel is the domestic and regional marketing system for fish. Although it offers greater employment and supplies fish for domestic and regional consumers, it is said to be constrained by low returns, widespread unsustainable fishing practices, poor infrastructure and services and low purchasing power among consumers.
Figure 1.2: Fish Value Flow Model for Lakes Kyoga and Albert
Key:
Prd = Producers Agt = Factory Agenst Prc = Traditional Processors
Fct = Fish Factories Trd = Trader Con = Consumers Exp = Exports
1.2.4 Model Specification This study seeks to develop an input-output model to relate income, the dependent variable to key independent variables, namely boat, gear, labour costs and other factors. Income is itself derived from quantities of fish produced and prices at which they are sold.
Availability of chilled transport facilities would affect income through the relevant variables, namely fish prices, availability of capital equipment, infrastructure and others to be established by the research.
A relationship between availability of chilled transport facilities and earnings would be established from the data. This is done by comparing earnings between the different categories of landing sites as well as the perceptions of the enterprise operators towards the chilled transport facilities.
1.3 Methodology 1.3.1 Study Area The study was carried out on Lakes Kyoga and Albert. Three landing sites were selected on each lake on the basis of the following criteria:-
a) One landing site where chilled transport facilities already operate,
b) One where they are not available and probably will not be during the project’s life of 18 months and
Prd
Agt
Prc Con
Fct
Trd
Exp
5
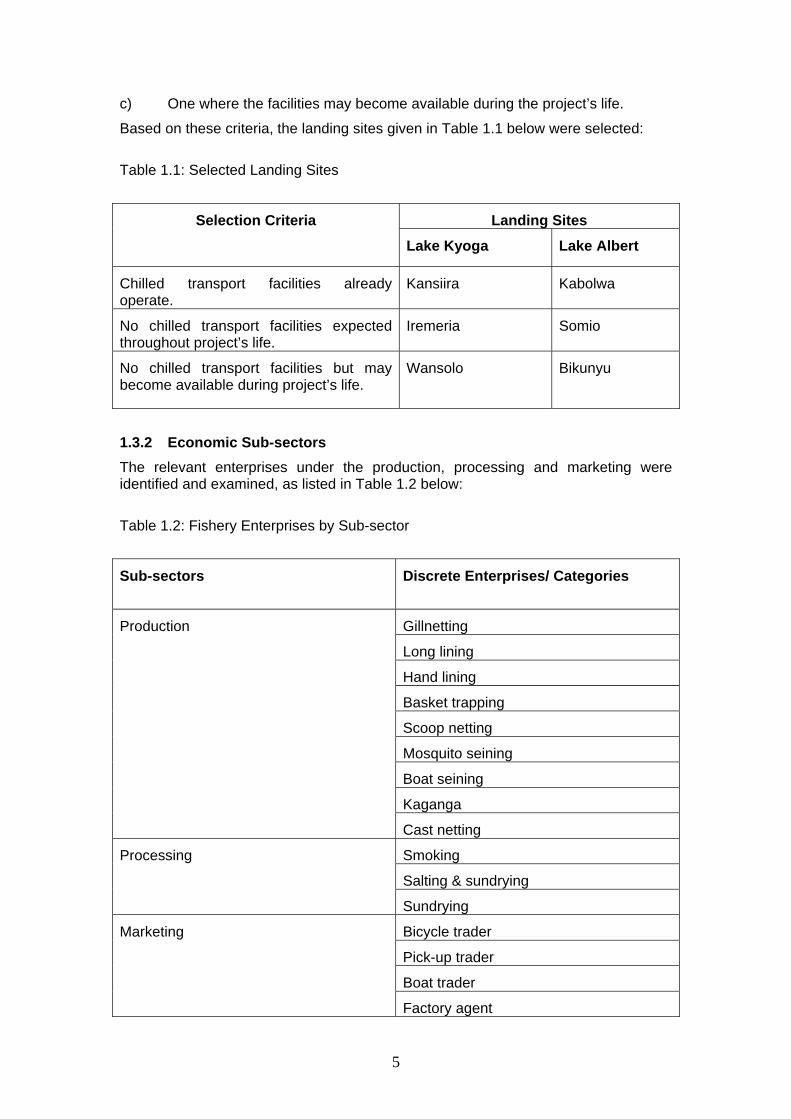
c) One where the facilities may become available during the project’s life.
Based on these criteria, the landing sites given in Table 1.1 below were selected:
Table 1.1: Selected Landing Sites
Landing Sites Selection Criteria
Lake Kyoga Lake Albert
Chilled transport facilities already operate.
Kansiira Kabolwa
No chilled transport facilities expected throughout project’s life.
Iremeria Somio
No chilled transport facilities but may become available during project’s life.
Wansolo Bikunyu
1.3.2 Economic Sub-sectors The relevant enterprises under the production, processing and marketing were identified and examined, as listed in Table 1.2 below:
Table 1.2: Fishery Enterprises by Sub-sector
Sub-sectors
Discrete Enterprises/ Categories
Gillnetting
Long lining
Hand lining
Basket trapping
Scoop netting
Mosquito seining
Boat seining
Kaganga
Production
Cast netting
Smoking
Salting & sundrying
Processing
Sundrying
Bicycle trader
Pick-up trader
Boat trader
Marketing
Factory agent

6
Sub-sectors
Discrete Enterprises/ Categories
Processor / trader
Consumers not engaged in fishery activity
Consumers engaged in fish production
Consumers engaged in fish processing
Consumption
Consumers engaged in fish trading
1.3.3 Sample Selection The relevant fisheries sub-sectors were identified. Within each sub-sector, the available owners/ renters of fish production, fish processing and fish marketing units were interviewed.
1.3.4 Data Collection Data collection involved the following activities:
i) Literature and reports related to the study were reviewed.
ii) Relevant records and reports at the district headquarters of Kamuli, Nakasongola and Apac for Lake Kyoga and Masindi and Hoima for Lake Albert were examined.
iii) Key informant interviews were carried out with Department for Fisheries Resources staff and beach leaders.
iv) Interviews were carried out with persons representing the enterprise units and categories within the identified sub-sectors by means of unit questionnaires.
The team spent one day at each of the relevant District headquarters meeting with district officials and reviewing records and reports. Thereafter, it proceeded to the beaches and spent 4 days on data collection at each of the large beaches served with chilled facilities and 3 days at the other beaches.
The variables covered under data collection at the aggregate and individual levels are given in Tables 1.3 and 1.4 below:
Table 1.3: Aggregate Level Data
Sub-sector
Information
Production Infrastructure and facilities Production facilities Categories of fishers Number of persons employed Boat types and numbers Engine types and numbers Gear types and numbers Catch statistics

7
Processing Infrastructure and facilities Types of fish processors Species processed Processing assets
Marketing Infrastructure and facilities Fish handling facilities Weighing scales Transport services Water supply Iceboxes Availability of latrines Numbers of traders by type Species traded Main destinations
Table 1.4: Unit Level Data
Sub-sector Enterprises
Variables
Production Personal characteristics Capital inputs and costs Labour inputs and costs Entrepreneurship costs Other costs Resource perceptions Catches and prices Sales data
Processing Personal data Capital inputs and costs Labour inputs and costs Other inputs and costs Entrepreneurship costs Species, quantities and prices of fish processed and sold Sales data
Marketing Personal data Capital inputs and costs Labour inputs and costs Transportation costs Ice/storage costs Entrepreneurship costs Species, quantities and prices of fish bought and sold Other sales data
Consumption Fish species commonly eaten Frequency of consumption Prices and quantities Substitutes for fish.
1.3.5 Data Analysis Both qualitative and quantitative data were collected. The qualitative data were analyzed using frequencies whereas the quantitative data was first transformed to

8
derive the target variables, which were analyzed using descriptive statistics particularly the mean. The SPSS Version 10.0 program was used in the data analysis.

9
2. KANSIIRA LANDING SITE 2.1 Background Kansiira Landing Site, located in Lwabyata Sub-county in Nakasongola District was selected as the beach where chilled transport facilities already operate on Lake Kyoga. The population of the beach is approximately 600 people. The main economic activities at the beach are fishing, livestock keeping, crop farming and trading. Animals kept include cows, pigs, goats and sheep while the main crops grown are matooke (green banana), cassava, maize, potatoes and beans.
Nakasongola District is located on the South-western shores of Lake Kyoga. (see map) There are approximately 25 beaches in the district. In total, there are 1,265 fishermen and 702 boats in the district. The catch statistics for fish landed in 2001 and estimated value by fish species are given in Table 2.1 below:
Table 2.1: Estimated Fish Catch for Nakasongola District by Species, Weight and
Value for 2001
Species
Weight (kgs)
Value (Shs)
Nile perch 21,326 26,739,600
Tilapia 82,264 114,863,700
Protopterus 636 508,800
Clarias 1,111 1,163,400
Momyrus 43 34,400
Barbus 6,190 8,020,800
Bagrus 68 68,000
Total 111,638 151,398,700
Source: Nakasongola District records
Fisheries provide a major source of economic activities for Nakasongola District, second only to livestock. The district generates public revenues from the fisheries annually, through licensing fees, tender of landing sites and graduated tax paid by fishers. The rates below have been charged for the various fishery activities and vessels. However, with the next financial year beginning on 1st July 2002, new rates will be charged, in accordance with the new legal instrument, The fishing (Amendment) Rules, 2001. In the new instrument, the rates are different depending on the lake, size of fishing vessel and tonnage of the truck. The collection of the specific licence fees on trucks trading in fish has also been decentralised to the district as a new source of revenue.
Existing rates are given in Table 2.2 while the new rates are given in Appendix 3.

10
Table 2.2: Current Rates Charged by Nakasongola District for the Various Fishery Activities and Fishing Vessels.
Type of Licence
Rate (Shs)
Fishing vessel 12,000
Fishing 3,000
Fish monger operating within district 10,000
Fish monger operating outside district 10,000
Processing permit 20,000
Source: Nakasongola District records
Chilled transport facilities arrived in Nakasongola District in November 2001 and at around the same time also arrived in Kansiira. There are 14 trucks operating in the district. Ten trucks buy Nile perch for fish factories while four trucks buy tilapia for the Rwandan market. Two trucks, namely from the Uganda Fish Packers Ltd. and Gomba Fish Processing Company, operate at Kansiira once a week. The chilled transport facilities exist at other beaches within the district namely; Kikalaganya, Lwampanga, Zengebe, Kibuye and Kikoiro.
Before the arrival of chilled transport facilities, the price of a kilogram of Nile perch was Shs 500, however, this increased tremendously to the present rate, which is Shs 1,500 per kg. As a result of the higher prices, there was resistance from the operators of small pick-ups who in addition thought that the refrigerated trucks would affect their supplies. However, arrangements were done where the trucks were allocated specific beaches and time schedules for the different companies.
The district has reported a number of positive impacts associated with the chilled facilities. Generally, the incomes of fishers in the district are said to have increased. There are also increased employment opportunities for many youths who used to be idle before the arrival of chilled transport facilities. A good number of them are now employed as crews, bait suppliers and casual fish labourers. There is also relatively improved sanitation and fish handling at beaches where these trucks are found. The district has benefited from the revenues that are promptly paid by the tenderers of beach markets and also expects to benefit from the specific licences that are to be paid by the factory trucks following the new legal instrument.
The artisanal processors, traders and local consumers, however, have been affected by this new development in that they cannot compete for Nile perch with the truck traders who are able to offer much higher prices. Factory agents are also involved in buying fish on the lake, which has affected the taking of catch statistics at landings.
The district authorities have responded to some of these problems by encouraging truck traders to form an association. This has helped to ensure that new ones are not allowed to come to Nakasongola. The communities have also been encouraged to formulate by-laws to deal with factory agents who buy fish at sea.
11
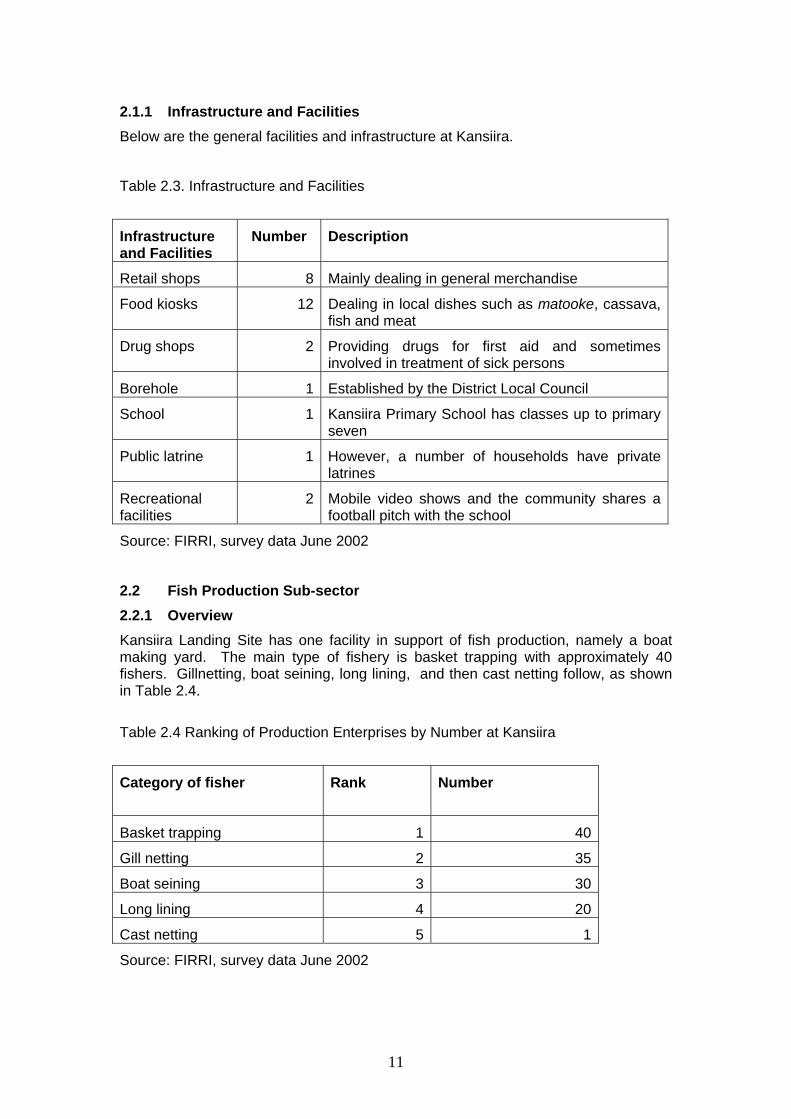
2.1.1 Infrastructure and Facilities Below are the general facilities and infrastructure at Kansiira.
Table 2.3. Infrastructure and Facilities
Infrastructure and Facilities
Number Description
Retail shops 8 Mainly dealing in general merchandise
Food kiosks 12 Dealing in local dishes such as matooke, cassava, fish and meat
Drug shops 2 Providing drugs for first aid and sometimes involved in treatment of sick persons
Borehole 1 Established by the District Local Council
School 1 Kansiira Primary School has classes up to primary seven
Public latrine 1 However, a number of households have private latrines
Recreational facilities
2 Mobile video shows and the community shares a football pitch with the school
Source: FIRRI, survey data June 2002
2.2 Fish Production Sub-sector 2.2.1 Overview Kansiira Landing Site has one facility in support of fish production, namely a boat making yard. The main type of fishery is basket trapping with approximately 40 fishers. Gillnetting, boat seining, long lining, and then cast netting follow, as shown in Table 2.4.
Table 2.4 Ranking of Production Enterprises by Number at Kansiira
Category of fisher Rank Number
Basket trapping 1 40
Gill netting 2 35
Boat seining 3 30
Long lining 4 20
Cast netting 5 1
Source: FIRRI, survey data June 2002

12
There are approximately 50 fishing unit owners, 20 fishing unit renters and 100 crew. There are 40 parachute 9 Ssesse and 1 dug-out canoe at Kansiira. There are 5 fishing boats with outboard motor engines of horsepower ranging from 2 to 15.
The main fish species landed is Nile perch with approximately 2500 kgs landed per week. This is followed by tilapia (1000 kgs), Protopterus (600 kgs), Momyrus (400 kgs), Bagrus (250 kgs), Clarias (100 kgs), and Synodontis (50 kgs).
2.2.2 Fishers’ Characteristics The sample in the production study at Kansiira consisted of 27 respondents, of whom one was female and their mean age was 37 years. The majority were of the Baruli tribe (51.9%) followed by Baganda (11.1%), Basoga (11.1%), Acholi (11.1%) and a number of other smaller tribes (14.8%). The majority were married with an average family size of 7 members. About 75% of fishers in the sample had attained primary education, 12.5% secondary and the remaining 12.5% had not gone to school at all. The mean number of years in fishing was 12 while number of years the respondent lived at Kansiira Beach was 10.
The most targeted fish species is Nile perch, followed by others as indicated in Table 2.5 below:
Table 2.5: Fish species most targeted by respondents at Kansiira Beach
Species
Count Percentage
Nile perch 15 55.6
Tilapia 10 37.0
Protopterus 1 3.7
Others 1 3.7
Total 27 100.0
Source: FIRRI, survey data June 2002
The main alternative source of income for the respondents was farming, but many respondents reported having no such alternatives, as indicated in Table 2.6 below:
Table 2.6 Alternative sources of income
Income source
Count Percentage
Trading 4 14.8
Farming 11 40.7
Live stock- keeping 4 14.8
None 8 29.7
Total 27 100.0
Source: FIRRI, survey data June 2002

13
2.2.3 Fishing Inputs and Costs Boats and engines 55.6% of the fishers’ own boats while 44.4% hire from individuals who own boats. The mean cost for hiring a boat is shillings 20,000 per month. The most common type of boat used is “parachute” and information on the boats used is given in the table below.
Table 2.7: Information on the Boats Owned
Type of boat
Number of boats
Average period used (years)
Mean cost price (Shs)
Average useful life (Years)
Mean salvage value (Shs)
Parachute 20 2.0 137,200 7.1 23,000
Ssesse 7 4.6 243,300 7.8 38,000
Source: FIRRI, survey data June 2002
Only one respondent reported that he owned an outboard engine. Information on the engine owned is given below.
Table 2.8: Information of outboard engine
Horse power
Number of years
Cost price (Shs)
Useful life (Years)
Salvage value (Shs)
2 0.5 1,460,000 15 637,500
Source: FIRRI, survey data June 2002
Fishing gear The main types of gear used as reported by respondents are shown in Table 2.9 below.
Table 2.9 Main gear Types Used
Gear types Count
Percentage
Hand lines 1 3.7
Long lines 6 22.2
Gillnets 17 63.0
Basket traps 3 11.1
Total 27 100.0
Source: FIRRI, survey data June 2002

14
Table 2.10: Information on Gear Types Used
Gear types Mean number (Units)
Average size
Period used (Years)
Cost price (Shs)
Useful life (Months)
Salvage value (Shs)
Hand lines 60 7.0 0.5 100 -- 00
Long lines 53 4.8 0.5 8,500 4.8 00
Gillnets 20 6.6 0.4 169,000 6.7 3,100
Basket traps 9 -- 0.7 24,700 4.0 00
Source: FIRRI, survey data June 2002
The main source of initial capital for production enterprises is farming, as indicated in Table 2.11 below:
Table 2.11: Source of Initial Capital
Enterprise Source of Initial Capital Total
Fishing Farming Credit
Hand lines 1 -- -- 1
Long lines 1 5 -- 6
Gillnets 5 9 2 16
Basket traps 2 1 -- 3
Total 9 15 2 26
Source: FIRRI, survey data June 2002
Labour costs The data on average number of crew members per boat, modes of payment and number of days fished per week are provided in Table 2.12 below:

15
Table 2.12: Payments to Production Labour
Enterprise Average number of crew
Respondents employing % of revenue payment system
Amount paid (% of revenue)
Mean number of days worked per week
Hand lines 1 1 40% 4.0
Long lines 1 3 43% 4.2
Gillnets 2 16 41% 4.5
Basket traps 1 1 25% 5.0
Source: FIRRI, survey data June 2002
Entrepreneurship A few producers were able to value their entrepreneurship functions as indicated in Table 2.13 below:
Table 2.13: Valuation of Entrepreneurship by Type of Enterprise
Enterprise Value for entrepreneurship (Shs/month)
Hand lines --
Long lines 40,000
Gillnets 96,500
Basket traps 40,000
Source: FIRRI, survey data June 2002
Other costs Other operational costs were identified in fish production and the information is summarized in Table 2.14. Boat and gear maintenance, particularly among gillnet fishers, were the main ones.
Table 2.14: Other Operational Costs in Production (Shs/month)
Enterprise Boat maintenance
Gear maintenance
Engine maintenance
Hand lines -- -- --
Long lines -- 2,000 --
Gillnets 36,670 32,500 10,000
Basket traps 7,500 -- --
Source: FIRRI, survey data June 2002

16
Based on the production data presented above, the monthly operating costs are computed as given by Table 2.15 below:
Table 2. 15 Summary of Monthly Production Costs
Hand lines Long lines Gillnets Basket traps
Capital Investment
6,000 450,500 821,088 175,500
Boat maintenance
-- -- 6,470 2,500
Gear maintenance
-- 333 7,647 --
Engine maintenance
-- -- 588 --
Other costs -- -- 882 --
Labour cost 43,200 186,490 196,832 27,125
Fuel cost -- 32,000 120,000 --
Bait cost 28,800 43,000 -- --
Operating cost 72,000 127,578 196,322 16,062
Depreciation 100 22,712 13,258 3,406
Total monthly cost
72,100 150,290 209,580 19,469
Source: FIRRI, survey data June 2002
2.2.4 Earnings of the Production Enterprises The fishers primarily target Nile perch and Nile tilapia with a few catching other species such as Protopterus, Synodontis and Clarias. Fish prices, monthly catches and revenues for the various enterprises and species are summarized in Table 2.16. Net revenues are derived by deducting monthly costs from gross revenues.
Table 2.16: Average catches and incomes of fishers by species.
Hand lines Long lines Gillnets Basket traps
. 325.03 477.82
. 1,200 1,170
. 388,342 500,245
Nile Perch Catch (kgs/month)
Price (Shs/kg
Gross revenue (Shs)
Net revenue (Shs) . 238,051 248,473

17
. . 442.67 345.00
. . 733 750
. . 317,217 268,250
Nile Tilapia Catch (kgs/month)
Price (Shs/kg)
Gross revenue (Shs)
Net revenue (Shs) . . 203,310 331,881
360.00 . 424.00 .
300 . 500 .
108,000 . 212,000 .
Other species Catch (kgs/month)
Price (Shs/kg)
Gross revenue (Shs)
Net revenue (Shs) 35,900 . 147,358 .
Nearly 94.7% of the Nile perch fishers sell their catch to factory agents whereas only 5.3% sell to beach processors. All Tilapia fishers interviewed sold their fish to pick-up traders. About 96.3% of the respondents interviewed sold their fish only at the beach. Those who sold their fish elsewhere gave reasons that such places offered better prices or were near their fishing ground. Most respondents (97.2%) had no other arrangements with their buyers such credit in terms of money and fishing inputs.
2.3 Fish Processing Sub-sector 2.3.1 Overview There are no publicly owned fish processing facilities at Kansiira. There are approximately 25 privately owned smoking kilns and 3 drying racks. Fish smoking is the main fish processing method with approximately 25 people involved in it. Salting and sun-drying are the other methods, involving about 10 people who are mainly stationed on the suds close to the beach. Tilapia, followed by Nile perch is the most processed fish species. Other species such as Momyrus, Clarias and Bagrus are also smoked.
2.3.2 Fish Processors’ Characteristics A total of 22 fish processors who either smoked or sun dried/ salted fish were interviewed. Table 2.17 presents average age, household size and years spent at landing.
Table 2.17: Age Structure, Household Size and Years Spent at Landing
Age (Years)
Household Size
Years spent at landing
Mean 36.7 6.9 6.3
Minimum 17.0 1.0 1.0
Maximum 80.0 19.0 20.0
Source: FIRRI, survey data June 2002

18
Nearly 50% of the fish processors interviewed had attained some level of primary education. However, only 27.3%% had advanced to the secondary school level. The remainder (22.7%) did not go to school at all.
In the sample, the Acholi tribe represented 40.9%, Langi (13.6%) and Baruli (13.6%). Other tribes included the Baganda (4.5%) and Basoga (9.1%). Over 81.8% of the respondents were married. The rest were single (9.1%), widowed (4.5%) or separated (4.5%). Almost 45.5% of the respondents were females.
2.3.3 Fish Processing Inputs and Costs In the sample, 81.8% of the fish processors smoked fish while 18.8% salted/ sun dried it. Among the fish smokers, nearly 94.5% used low-technology ovens (smoking kilns) while some used smoking pits. For those who used smoking kilns and pits, 66.7% privately owned them, 27.8% hired them while 5.5% communally owned them. Those who salted and sun dried fish, on the other hand, entirely spread their salted fish on drying ground, which they neither owned nor rented but were communal.
Table 2.18: Distribution of Fish Processors by Type of Processing Facility and
their Ownership Status
Facility Ownership Smoking Sun drying and Salting
Privately owned 66.7% --
Rented 27.8% --
Smoking kiln/pit
Communally owned 5.5% --
Privately owned -- --
Rented -- --
Drying ground
Communally owned -- 100.0%
Total 100.0% 100.0%
Source: FIRRI, survey data June 2002
Capital The capital costs of the fish processors are generally low because of the simple technology in use. For owners of smoking kilns, the initial investment in construction of smoking kilns (made from mud, bricks and wire mesh) with an expected useful life of 5 years averaged Shs 74,583. Alternatively, smokers hired smoking kilns at about Shs 4,000 per month. In the case of processors who salt/ sun dry, given that they neither own nor rent the drying ground on which they spread their fish, their initial capital investment is insignificant. The processors obtained their ‘start-up’ capital from farming (59.1%), fishing (22.7%) and family sources.
Labour Three sources of processing labour were identified, namely own-labour, hired and family labour. Nearly 63.6% of the fish processing units were owner-operated while
19
the rest were either family-run (18.4%) or operated by hired labour (18.4%). In the case of own and family labour, the opportunity cost of labour was derived on the basis of information on what the fish processors would have paid if the units were operated by hired labour. The number of labourers per fish processing unit was more or less the same (1-2) although large variations in the monthly labour costs by method of fish processing exist. Specifically, owners of salting/ sun drying units on the average spend Shs. 71,200 each month on labour or about 1.7 times higher than for fish smokers indicating that salting/ sun drying is relatively more labour intensive.
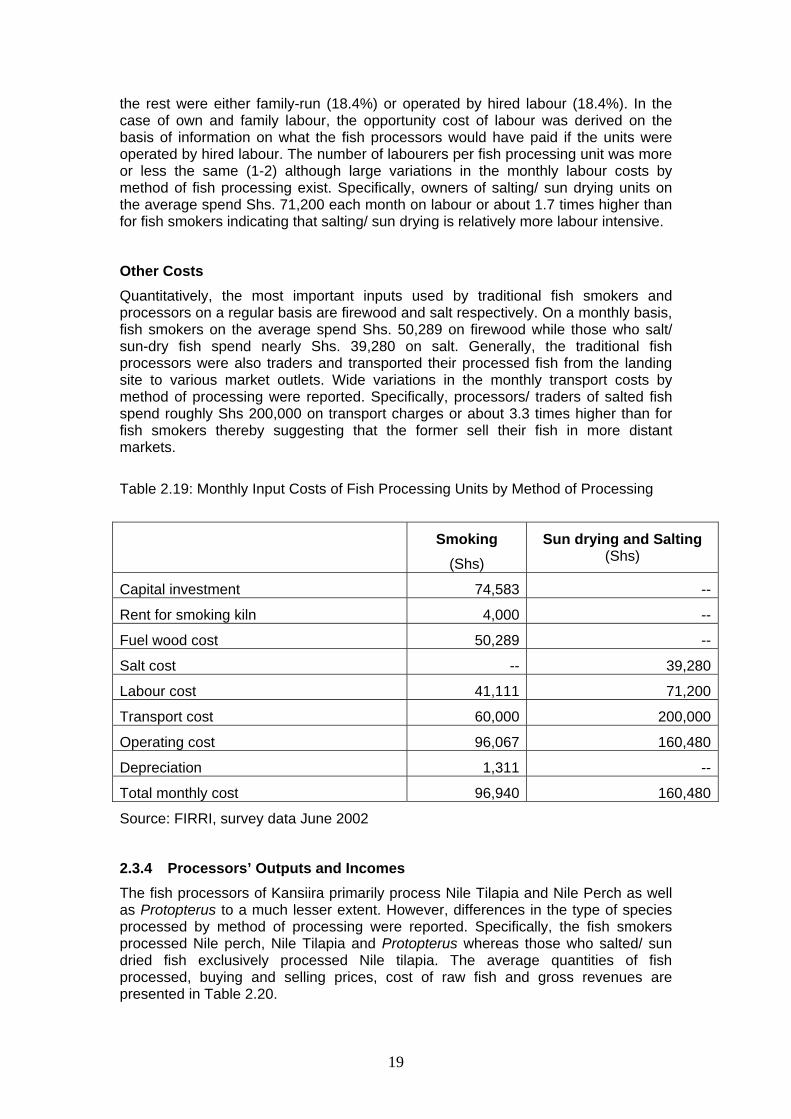
Other Costs Quantitatively, the most important inputs used by traditional fish smokers and processors on a regular basis are firewood and salt respectively. On a monthly basis, fish smokers on the average spend Shs. 50,289 on firewood while those who salt/ sun-dry fish spend nearly Shs. 39,280 on salt. Generally, the traditional fish processors were also traders and transported their processed fish from the landing site to various market outlets. Wide variations in the monthly transport costs by method of processing were reported. Specifically, processors/ traders of salted fish spend roughly Shs 200,000 on transport charges or about 3.3 times higher than for fish smokers thereby suggesting that the former sell their fish in more distant markets.
Table 2.19: Monthly Input Costs of Fish Processing Units by Method of Processing
Smoking (Shs)
Sun drying and Salting (Shs)
Capital investment 74,583 --
Rent for smoking kiln 4,000 --
Fuel wood cost 50,289 --
Salt cost -- 39,280
Labour cost 41,111 71,200
Transport cost 60,000 200,000
Operating cost 96,067 160,480
Depreciation 1,311 --
Total monthly cost 96,940 160,480
Source: FIRRI, survey data June 2002
2.3.4 Processors’ Outputs and Incomes
The fish processors of Kansiira primarily process Nile Tilapia and Nile Perch as well as Protopterus to a much lesser extent. However, differences in the type of species processed by method of processing were reported. Specifically, the fish smokers processed Nile perch, Nile Tilapia and Protopterus whereas those who salted/ sun dried fish exclusively processed Nile tilapia. The average quantities of fish processed, buying and selling prices, cost of raw fish and gross revenues are presented in Table 2.20.

20
Table 2.20: Costs of Raw Fish and Revenues from Processed Fish by Species
Smoking Sundrying and salting
528.00 . 620 .
1,120 . 307,000 . 523,600 .
Nile perch Quantity processed (kgs/ month)Buying price/ kg Selling price/ kg Cost of raw fish (shs/ month) Gross revenue (Shs/ month) Net revenue (Shs/ month) 105,588 .
591.43 1,507.00
843 675 1,514 1,400
406,857 850,200 841,714 2,060,300
Nile Tilapia Quantity processed (kgs/ month)Buying price/ kg Selling price/ kg Cost of raw fish (shs/ month) Gross revenue (Shs/ month) Net revenue (Shs/ month) 360,288 1,049,620
120.00 .
400 . 1,000 .
48,000 . 120,000 .
Protopterus Quantity processed (kgs/ month)Buying price/ kg Selling price/ kg Cost of raw fish (shs/ month) Gross revenue (Shs/ month) Net revenue (Shs/ month) -40,824 .
Source: FIRRI, survey data June 2002
The fish processors of Kansiira largely sold their fish in two market outlets. Some 81.8% of the respondents, mostly engaged in fish smoking, sold to domestic urban markets in Gulu, Lira, Apac and Kampala. The others mainly involved in sun drying and salting, sold on the regional markets in Congo. Limited quantities of fish were sold to consumers at the beach or nearby rural markets. A close relationship exists between type of processed fish (smoked vs sun dried/ salted) and market outlets. Almost 87.2% of the fish smokers sell their fish locally while dealers in salted/sun dried fish sold in regional markets in Congo. This reflects differences in consumer preferences in the two market outlets.
2.5 Fish Marketing 2.4.1 Overview Fish marketing at Kansiira is facilitated by the presence of three access roads, which are relatively in good condition and partly explain why chilled transport facilities easily access the beach. The roads go through the towns of Migyera, Lwampanga and Namasa. Kansiira can also be accessed by water from the neighbouring district of Apac. Blockades by mobile suds are not very frequent and whenever they occur, a way is created using dredging equipment provided under an Egyptian Government grant aid to Uganda.
There are approximately 25 beach-side retailers/processors, 3 bicycle traders, 2 pick-up traders and 2 truck traders. The two truck traders come from Uganda Fish Packers in Kampala and Gomba Fish Processing Industry in Jinja. There are 2 factory agents contracted by the truck traders to buy fish on their behalf. Truck

21
traders buy approximately 5.5 tons per week of Nile perch. The beach processors buy approximately 1 ton composed mainly of species other than Nile perch while bicycle traders buy approximately 300 kgs per week main composed of tilapia.
The main destinations of fresh Nile perch are the processing factories in Kampala and Jinja, while fresh tilapia is sold in Kampala City. Much of the processed fish is sold in Gulu, however a substantial amount of salted and sun-dried tilapia is sold in the Democratic Republic of Congo (DRC).
The average prices of fresh fish per kg for the various fish species landed at Kansiira are given below (Table 2.21).
Table 2.21. Fresh Fish Prices by Species
Fish species
Prices (Shs/kg)
Nile perch 1,500
Tilapia 1,000
Clarias 400
Protopterus 400
Synodontis 300
Source: FIRRI, survey data June 2002
2.4.2 Fish Traders’ Characteristics Eight traders were interviewed in the sample, all males, of average age of 33. Most had secondary education (62.5%) while others had primary schooling (37.5%). Fish traders were classified on the basis of the means of transport they use to transport their fish, and their distribution is given in Table 2.22. The relatively small number of fish traders interviewed is mainly attributed to the fact that most of them are non-resident at the landing site and were not, therefore, easily available.
Table 2.22: Distribution of Fish Traders in the Sample by Means of Transport Frequency Percentage
Bicycle trader 1 12.5
Pickup trader 5 62.5
Boat trader 2 25.0
Total 8 100.0
Source: FIRRI, survey data June 2002

22
2.4.3 Inputs and Costs Assets of individual fish traders consisted of bicycles, fish baskets and boats. The fish traders reported wide variations in the capital investment with boat traders approximately investing Shs 300,000 or nearly 4 times higher than that of bicycle traders. On the contrary, all the pick-up traders hired the services of the pick-ups either directly from the owners or from those who hired them. On average, they spent Shs. 564,000 for the hire of pick-ups per month. For those traders who directly hired the pick-ups, their monthly expenditures on fuel averaged Shs. 1,605,200.
Generally, pick-up traders had the highest labour costs (Shs 112,600) almost doubling that of the bicycle and boat traders. While all fish traders used own-labour, pick-up traders in addition used hired labour and, therefore, incurred higher labour costs as compared to the other traders. The costs and revenues associated with the fish trading enterprises are presented in Table 2.23
Table 2.23: Mean Input Costs of Fish Trading Units by Type of Trader
Mean Monthly Input Costs
Bicycle trader (Shs)
Pickup trader (Shs)
Boat trader (Shs)
Capital Investment 80,000 --. 300,000
Hire of pick-up --. 564,000 --.
Fuel cost --. 1,605,200 --.
Labour cost 50,000 112,600 63,000
Operating costs 50,000 2,281,800 63,000
Depreciation 3,125 . 2,976
Total monthly costs 53,125 2,281,800 64,488
Source: FIRRI, survey data June 2002
2.4.4 Output and Incomes The processors of Kansira mainly trade in Nile perch and Nile tilapia. The bicycle and pick-up traders are essentially Nile tilapia dealers whereas boat traders specialize in the Nile perch. The boat traders buy and assemble Nile perch from individual fishermen on the lake and sell it in bulk to factory agents who operate at the landing. The boat trader business is mostly financed by the factory agents in a bid to secure regular supplies of fish. Table 2.26 presents the quantities of fish traded, buying and selling prices, cost of raw fish and gross revenues.

23
Table 2.24: Average Cost of Raw Fish and Revenues of Fish Traders by Species and Type of Trader
Bicycle trader
Pick-up trader
Boat trader
. . 9,600
. . 1,300
. . 1,450
. . 12,960,000
14,160,000
Nile Perch Quantities traded (kg/month)
Buying price (Shs/kg
Selling price (Shs/kg
Cost of raw fish (Shs/month)
Gross revenue (Shs/month)
Net revenue (Shs/month) . . 1,135,512
160 35,104 .
1,000 840 .
2,200 1,480 .
160,000 34,340,800 .
352,000 52,328,000
Tilapia Quantities traded (kg/month)
Buying price (Shs/kg
Selling price (Shs/kg
Cost of raw fish (Shs/month)
Gross revenue (Shs/month)
Net revenue (Shs/month) 138,875 1,545,400 .
Source: FIRRI, survey data June 2002
2.5 Fish Consumption
2.5.1 Consumers’ characteristics There were 69 fish consumers interviewed at Kansiira. They were of average age of 36 years and 74% were male while 26% were females. They were predominantly of the Baruli tribe (41%), followed by Acholi (20%), Baganda (15%), Soga (12%), and other tribes (12%). Most (84%) were married and had attained primary level education (61%) followed by those who had secondary level education (23%). The average household size of fish consumers at Kasiira was 7 family members and the respondent had lived at Kansiira for an average of 7 years.
2.5.2 Consumption Levels and Trends Most respondents at Kansiira (83%) consumed tilapia, followed by Nile perch (14%) and other species (3%).

24
Table 2.25: Commonly Consumed Fish Species at Kansiira by Category of Consumer
Sub-sectors
Nile perch
Tilapia Other Total
Consumers not engaged in fishery activity
- 91.7% 8.3% 100%
Consumers engaged in fish production 7.4% 88.9% 3.7% 100%
Consumers engaged in fish processing 22.7% 77.3% - 100%
Consumers engaged in fish trading 37.4% 62.5% - 100%
All respondents 14% 83% 3% 100%
Source: FIRRI, survey data June 2002
Quantities of fish consumed The average daily quantity consumed by Kansiira respondents was 2.7 kgs and this ranged between 0.25 to 9 kgs. However, this varied between sub-sectors. Consumers not engaged in fishery activity ate on average 2.3 kgs of fish. Table 2.26 provides the results of consumption by sub-sector of consumers.
Table 2.26. Average Daily Weight of Fish Consumed at Kansiira by Type of
Consumer (in kg)
Sub-sectors Maximum Minimum Mean
Consumers not engaged in fishery activity 6 0.40 2.3
Consumers engaged in fish production 9 0.25 3.0
Consumers engaged in fish processing 6 0.50 2.4
Consumers engaged in fish trading 5 0.25 2.9
All respondents 9 0.25 2.7
Source: FIRRI, survey data June 2002
Respondents were asked whether or not there had been a change over the years in the quantities of fish eaten. Most of them (71%) agreed that there was a change, while only (29%) did not agree. Most of those who agreed that there was a change (81%) said that the quantities consumed by their families had decreased. Only 19% said that the quantities had increased.
Frequency of fish consumption On average consumers at Kansiira ate fish 4.2 times a week and this ranged between 1 to 7 times. However, this varied between sub-sectors, as given in Table 2.27.

25
Table 2.27: Average Number of Times Fish is Consumed in a Week at Kansiira by
Type of Consumer
Sub-sectors Maximum Minimum Mean
Consumers not engaged in fishery activity 6 2 3.1
Consumers engaged in fish production 7 2 4.4
Consumers engaged in fish processing 7 1 4.6
Consumers engaged in fish trading 7 2 4.3
All respondents 7 1 4.2
Source: FIRRI, survey data June 2002
Consumers were asked whether or not the frequency of fish consumption had changed over the past year. Most consumers (62%) agreed that there had been a change in the frequency of fish consumption at Kansiira. For those who agreed that consumption frequency had changed, 91% said it had reduced. A few (9%), however, said it had increased.
Size of fish for consumption Respondents were asked whether or not the sizes of fish they ate with their families had changed over the past year. Most (73%) agreed to this and (74%) of these said that the sizes had decreased and 26% said the sizes had increased.
Table 2.28: Respondents Reporting Reduction in Sizes of Fish for Consumption at
Kansiira
Fish species Yes No Total
Nile perch 80% 20% 100%
Tilapia 72% 28% 100%
Others 50% 50% 100%
Source: FIRRI, survey data June 2002
Substitutes for fish A majority of respondents at Kansiira (73%) mentioned beans as the main substitute to fish followed by vegetables (13%), meat (12%) and other substitutes.
2.5.3 Pricing Levels and Trends Most respondents at Kansiira (66%) usually bought the fish they ate with their families while 34% did not. Unlike most consumers engaged in fish production (76%)

26
who did not buy the fish they ate, most consumers not engaged in fishery activity (75%), most consumers engaged in fish processing (96%) as well as all consumers engaged in fish trading usually bought the fish they ate with their families. For those who bought fish, the average price mentioned was Shs 763 and it ranged between Shs 300 – 1,000. The average price mentioned by consumers of Nile perch was Shs 800 while that for Tilapia was Shs 762.
Table 2.29: Prices of Fish Species for Consumption at Kansiira (in Shs)
Fish species Maximum Minimum
Mean
Nile perch 1,000 300 800
Tilapia 1,000 500 762
Others 500 500 500
All respondents 1,000 300 763
Source: FIRRI, survey data June 2002
Respondents were asked whether or not the prices of fish for consumption had changed over the past year. Most of them (69%) agreed that the prices had increased and most of these (93%) said it had increased.
2.6 Community Perceptions towards Chilled Transport Facilities Consumers associated the coming of factory trucks to Kansiira with some positive changes to their community. Most respondents (49%) said it led to the increase in incomes of fishers, followed by ready market for fish (13%), beach development (12%) and employment opportunities for beach community (9%).
However, the major negative impacts mentioned by a large proportion of respondents were the high cost of fresh fish (37%) followed by reduced fish supplies to local traders/ processors and consumers (22%), processing of juvenile fish (7%) and selling of fish on the lake (4%). Some consumers (30%) did not associate any negative impact with factory trucks.

27
3. WANSOLO LANDING SITE 3.1 Background Wansolo Landing Site is located in Alaro Parish, Akokoro Sub-county of Apac District (see map). It was selected as the landing site where chilled facilities had not reached but were expected during the lifetime of the project. The population of the beach is approximately 1,300 people. The main economic activities at and around the beach are fishing, animal keeping, crop farming and trading.
Apac District lies on the Northern side of Lake Kwania, which is connected to L.Kyoga. There are approximately 38 beaches in the district. In total there are 1,039 fishermen and 518 boats in the district. The catch statistics for fish landed in 2001 and estimated value by fish species are given in Table3.1 below:
Table 3.1: Estimated Fish Catches by Weight and Value for Apac District, 2001
Fish species Weight (kg)
Value (Shs)
Nile perch 62,700,684 379,852,360
Tilapia 4,664,125 15,706,536
Protopterus 671,165 709,974
Momyrus 2,664,779 921,411,568
Bagrus 98,259 13,619,436
Total 70,119,102 1,331,299,874
Source: Apac District records
The rates given in Table 3.2 below have been charged for the various fishery activities and vessels. However, with the new financial year beginning 1st July 2002, the rates in the new statutory instrument, The Fishing (Amendment) Rules, 2001, will be charged (Appendix 3).
Table 3.2: Rates on Various Fishery Activities and Fishing Vessels.
Item Existing Rates (Shs)
Fishing vessel licence 12,000
Fishing licence No charge
Fish monger’s licence operating within district 10,000
Fish monger’s licence operating outside district 10,000
Processing permit (per smoking kiln) 2,500
Source: Apac District records

28
Perceptions on chilled transport facilities Chilled transport facilities arrived at Apac District in October 2001. There are 3 trucks operating in the district. All the trucks are buy Nile perch for fish factories in Kampala, Entebbe and JinJa namely Greenfields Ltd, Ngege Ltd and Marine and Agro Fish Processing Company. There are no trucks at Wansolo because of the poor access road, however, they do operate at Kayei and Wigweng. At the moment boat traders buy Nile perch from Wansolo and ferry it to beaches either in Nakasongola or Apac that have factory trucks.
Before the arrival of boat traders, the price of a Kilogram of Nile perch at Wansolo was Shs 300 , however, this increased tremendously to the present rate which is Shs 1,200 per kg.
Generally, the fishers have ready market for their fish and as such their incomes have increased with better prices. Some fishers have also adopted the use of gillnets of big mesh sizes to catch Nile perch and as such abandoning the use of illegal gears. There are also plans by the district to gazette some beaches in order to improve fish handling
As expected, the artisanal processors, traders and local consumers, however, are not happy with the boat traders who offer better prices for all the Nile perch. The fishing unit owners are also not happy with the practice of selling fish at sea.
The District Fisheries Officer called for detailed study of this new development to understand its socio-economic impacts and it’s likely impacts on the fish stocks of Lakes Kyoga and Kwania.
3.1.1 Infrastructure and Facilities
The general facilities and infrastructure available at Wansolo Beach are given in table 3.3 below:
Table 3.3. General Facilities and Infrastructure Available at Wansolo
Facilities and Infrastructure
Number Description
Retail shops 8 Mainly dealing in general merchandise
Food kiosks 6 Dealing in local dishes such as Cassava and fish, millet bread and meat
Drug shops 2 Dealing in drugs for first aid
School 1 Primary school with classes up to primary two
Recreational facilities
2 One video hall and one football pitch
Source: FIRRI, survey data June 2002
3.2 Fish Production 3.2.1 Overview There are no public facilities related to fish production such as boat yard and fish handling facilities found at Wansolo. The main type of fishery at Wansolo is

29
gillnetting with approximately 25 fishers. Boat seining (12 people) and then basket trapping (3 person) follow this (Table 3.2).
Table 3.4 Rank and Number of Production Enterprises by Category at Wansolo
Enterprises Rank Number
Gillnetting 1 25
Boat seining 2 12
Basket trapping 3 3
Source: FIRRI, survey data June 2002
There are approximately 40 fishing unit owners, 10 fishing unit renters and 102 crewmembers. There are 43 Ssesse and 5 parachute boats at Wansolo. There are 4 boats with outboard engines of 2-15 Hp engaged in fishing and water transport.
The main fish species landed is Nile perch with approximately 560 Kgs landed per week. This is followed by tilapia and Clarias.
3.2.2 Fishers’ Characteristics A sample of 26 production operators were interviewed at Wansolo Landing Site, most were males (96%), of average age of 34 years and married. The majority were of the Langi tribe (88%), with 46.2% of the respondents reporting having attained only primary level of education while 46.2% having reached secondary. The main targeted fish species is Nile perch (68.0% of respondents), followed by tilapia 28%. On average fishers interviewed had fished for 7 years, lived at the Wansolo Landing Site for 13 years and had average household size of 7 family members. Their main alternative source of livelihood was in trading, as indicated in table 3.5.

30
Table 3.5 Alternative Sources of Livelihood
Frequency Percentage
Trading 3 12.5
Farming 7 29.2
Livestock keeping 2 8.3
Salaried 2 8.3
None 9 37.5
Others 1 4.2
Total 24 100.0
Source: FIRRI, survey data June 2002
3.2.4 Fishing Inputs and Costs Boats and Engines The majority of Wansolo fishers (92.0%) own the boats they use. However, some 8.0% hire them from other individuals, spending an average of Shs 20,000 for boat hire per month. The main types of boats encountered are Ssesse (60%) and parachute (40%). Information on boats owned is given in Table 3.6.
Table 3.6: Selected Information on Boats Owned by Respondents
Boat Type Number in sample
Years old Average cost price (Shs)
Useful life (Years)
Salvage value (Shs)
Parachute 10 3.9 158,330 3.9 0.0
Ssesse 16 2.8 193,330 6.9 54,660
Source: FIRRI, survey data June 2002
Only 3 of the 26 respondents own out board engines while the rest use oars for boat propulsion. Information on the engines is provided in table 3.7
Table 3.7: Summary Information on Outboard Engines at Wansolo
Horse power Years taken Cost price (Shs)
Useful life Salvage value (Shs)
10 5 1,400,000 14 516,666
Source: FIRRI, survey data June 2002

31
The mean cost of fuel per working day is shillings 20,000 for those using engines.
Different types of gear are used at the beach. In the sample, 84.6% of the fishers use gillnets, 11.5% boat seines and 3.8% fish with long lines. Information on the gear types is provided in Table 3.8
Table 3.8: Information on Gear Types
Number Mean number
Average size
Years taken
Average cost price (Shs)
Useful life (Years)
Salvage value (Shs)
Long lines (Hooks)
100 8.0 .5 10,000 6.0 0.0
Gillnets 22 6.5 1.0 18,630 3.6 0.0
Boat seines 1 3.0 1.0 250,000 6.3 0.0
Source: FIRRI, survey data June 2002
Most fishers reported that capital for starting business was got from farming (42.3%), followed by fishing (30.8%), credits and family capital (7.7%) and lastly, other sources 11.5%.
Labour On average there are 2 crew members per boat. Different systems of labour payments exist including percentage of revenue (76.0%) and percentage of net revenue, where all the costs are deducted before sharing (20.0%).
Entrepreneurship The production enterprises are self managed. In order to get an estimate of the value of entrepreneurship, respondents were asked how much they would be prepared to receive for managing the enterprises. They reported an average of Shs 56,400 per month.
3.2.4 Perceptions to the Resource Most respondents reported that the catch levels were poor (69.2%) while others said it was fair (23.1%) or good (7.7%). The reasons why it was said to be poor were because of changes in seasons (34.8%), too many competitors (17.4%) and suds washing away the nets (17.4%).

32
A summary of the monthly costs is presented in Table 3.9 below:
Table 3.9: Summary of Monthly Production Costs by Enterprise
Long lines Gillnets Boat seines
Capital Investment 1,150,000 666,762 343,333
Boat maintenance -- 2,667 6,667
Gear maintenance -- 2,190 1,000
Engine maintenance
-- 3,571 --
Other costs -- -- --
Labour cost -- 148,339 105,741
Fuel cost -- 322,667 --
Bait cost -- -- --
Operating cost -- 202,863 113,407
Depreciation 15,278 16,761 7,060
Total monthly cost 15,278 219,625 120,467
Source: FIRRI, survey data June 2002
3.2.5 Enterprise Earnings Fish prices, monthly catches and revenues for the various enterprises and species are summarized in Table 3.10. Net revenues are derived by deducting monthly costs from gross revenues.
Table 3.10: Summary Monthly Revenues for the Enterprises by Species
Long lines Gillnets Boat Seines
. 277.20 812.70
. 1,173 1,300
. 326,292 1,056,510
Nile perch Catch (kg/month)
Price (Shs/kg
Gross revenue (Shs)
Net revenue (Shs) . 128,199 840,485
. 338.67 268.00
. 767 700
Nile tilapia Catch (kg/month)
Price (Shs/kg)
Gross revenue (Shs) . 289,900 200,000

33
Net revenue (Shs) . 107,584 127,310
115.20 . .
500 . .
57,600 . .
Other species Catch (kgs/month)
Price (Shs/kg)
Gross revenue (Shs)
Net revenue (Shs) 42,322 . .
Source: FIRRI, survey data June 2002
Of the 17 Nile perch fishers interviewed, all sold their catch by weight to boat traders and 80.8% sold only at Wansolo Landing Site. Some 16.0% of the respondents had arrangements with their buyers to provide fishing inputs to them while the majority 84.05 had no arrangements at all. 62.5% of tilapia fishers reported that they sold their catch by weight, (12.5%) in bundles and (25.0%) sold per head. The other species were sold per head. 3.5 Fish Processing 3.3.1 Overview There are no publicly owned fish processing facilities at Wansolo. There are approximately 35 privately owned smoking kilns. Fish smoking is the main fish processing method with approximately 60 people involved in it followed by salting and sun-drying with 4 people. Nile perch, followed by tilapia are the most processed fish species.
3.3.2 Fish Processing Inputs and Costs There were 12 respondents in the sample of processors, of average age of 36. Males formed 75% and females 25%. Most were Langi (83.3%), married with household average of 7 persons. They had lived at Wansolo for 8 years on average. Most had primary education (58.3%) while others had secondary schooling (33.3%). Fish smoking and salting/ sun drying are the main methods of fish processing at Wansolo. In the sample of 12 respondents, 75% of the fish processors smoked fish while 25% salted/ sun dried fish. The type of facilities used are given in Table 3.11 below:
Table 3.11: Distribution of Fish Processors by Type of Processing Facility and
Ownership
Facility Ownership Smoking Sun drying and Salting
Privately owned 66.7 --
Rented 22.2 --
Smoking kiln/pit
Communally owned 11.1 --
Privately owned -- --
Rented -- --
Drying ground
Communally owned -- 100.0
Total 100.0 100.0
Source: FIRRI, survey data June 2002

34
Capital Owners of smoking kilns on the average invest Shs 94,800 in the construction of the low-technology ovens made from local materials. On the contrary, smokers who hire smoking kilns spend about Shs 2,700 on a monthly basis. Since processors who salt/ dry fish spread it on ‘communal land’, for which they don’t pay rent, their initial capital outlay is rather insignificant. The majority of the fish processors obtained their ‘start-up’ capital from farming (58.3%), fishing (16.7%) and other sources (25%).
Labour Three sources of labour, namely own-labour, hired and family labour operate the fish processing units. Nearly 63.6% of the fish processing units were owner-operated while the remainder were either family-run (18.2%) or operated by hired labour (18.2%). Fish smoking units are largely owner-operated whereas unit owners together with hired labour jointly operate salting/ sun drying processing units. Owners of salting/ sun drying units on the average spend Shs 101,300 each month on labour or about 2.6 times higher than for fish smokers indicating that salting/ sun drying is relatively more labour intensive.
Other Costs Firewood and salt are basically the most important inputs used by fish smokers and salters/ sun driers on a regular basis. Nonetheless, the cost of firewood and salt are very small. Fish smokers on the average spend Shs 19,700 each month on day-to-day purchase of fuel wood while salters/ sun driers spend roughly Shs 21,200 on salt. The traditional fish processors are to a large extent also traders and transport their processed fish from the landing site to various market outlets. Processors/ traders of salted fish spend roughly Shs 192,000 on transport charges or about 4.8 times higher than for fish smokers. This is because the former sell their fish in more distant markets.
Table 3.12: Input Costs of Fish Processing Units by Method of Processing
Smoking (Shs) Sun drying and salting (Shs)
Capital investment 94,833 --
Hire of smoking kiln 2,667 --
Fuel wood 19,778 --
Salt -- 21,200
Labour 39,111 101,333
Transport 40,000 192,000
Monthly operating costs 64,222 179,467
Monthly depreciation 1,021 --
Monthly total costs 64,903 179,467
Source: FIRRI, survey data June 2002

35
3.3.3 Processing Outputs and Income The main species processed at Wansolo are Nile tilapia and Nile Perch. In the sample, 66.7% of the respondents were primarily Nile tilapia processors whereas 33.3% mainly processed Nile perch. Individual Nile perch processors on the average processed about 360 kgs while Nile tilapia processors handled up to 1,595 kg each month. The average price at which Nile tilapia processors purchased their fish from the fishermen approximated Shs 625 per kg whereas that of Nile perch averaged Shs 600. The corresponding monthly cost of raw fish for Nile perch and Tilapia processors was Shs. 203,000 and Shs 984,500 respectively. The average price at which Nile perch processors sold their processed fish in the various market outlets averaged Shs 1,050 per kg while that of Nile tilapia processors amounted to Shs 1,025 per kg. The corresponding monthly gross incomes of Nile perch and Nile tilapia processors averaged Shs 400,000 and Shs 1,658,250 respectively.
Table 3.13: Cost of Raw Fish and Revenues from Processed Fish by Species Smoking Sun drying
and salting
360.00 . 600 .
1,050 . 203,000 . 400,000 .
Nile perch Quantity processed (kgs/ month) Buying price/ kg Selling price/ kg Cost of raw fish (shs/ month) Gross revenue (Shs/ month) Net revenue 116,593 .
608.00 3240.00
620 633 990 1,083
392,000 1,972,000 667,200 3,310,000
Nile tilapia Quantity processed (kgs/ month) Buying price/ kg Selling price/ kg Cost of raw fish (shs/ month) Gross revenue (Shs/ month) Net revenue 222,701 1,158,533
The fish processors of Wansolo largely sell their fish at urban (66.7%), regional (25%) and neighbouring rural markets (8.3%). Variations in the fish distribution channels by form of processed fish exist with smoked fish mainly ending up in urban markets whereas salted/ sun dried fish is exclusively destined for regional markets in Congo.
3.6 Fish Marketing 3.4.1 Overview Wansolo can be accessed by water from the neighbouring districts, although once in a while they are faced with the problem of beach blockage by suds. There are two access roads to Wansolo that are in a poor state.
There are approximately 60 beach-side retailers/processors, 4 bicycle traders and 2 boat traders. The main destinations of fresh Nile perch are the processing factories in Kampala and Jinja, while fresh tilapia is sold in Apac Town. Most of the processed fish is sold in Gulu.

36
The average prices of fresh fish per kg for the various fish species landed at Wansolo are given below (Table 3.14).
Table 3.14: Prices of Fresh Fish by Species
Fish species
Prices (Shs/kg)
Nile perch 1,200
Tilapia 700
Source: FIRRI, survey data June 2002
3.4.2 Fish Traders’ Characteristics
A total of 5 fish traders, all male, with mean age of 33 were interviewed at Wansolo. Three of them had primary education while the remaining two had secondary and university education. Three were bicycle traders while 2 were pick-up traders. Their average household was 7 persons and they had been at the beach for 7 years, on average. Unlike fish producers and processors, fish traders are usually non-resident and operate only for a limited time. They are, therefore, less easily accessed, thus explaining their small numbers in the sample.
Table 3.15: Distribution of Fish Traders by Means of Transport
Frequency Percentage
Bicycle trader 3 60.0
Pickup trader 2 40.0
Total 5 100.0
Source: FIRRI, survey data June 2002
3.4.3 Fish Marketing Inputs and Costs
Table 3.18 summarizes the input costs associated with bicycle and pick-up trading fish enterprises. The pick-up traders essentially hire pick-ups either directly (hires pick-up) or indirectly (pays those who hire pick-ups) and therefore do not spend on capital inputs. For those who hire pick-ups directly, they incur considerable hiring (Shs. 150,000) and fuel costs (Shs. 720,000) whereas those who hire pick-ups indirectly pay about Shs. 100,000 each month as transport costs. Overall, pick-up traders incurred monthly expenses amounting to Shs. 540,000 or about 8.6 times higher than bicycle traders.

37
Table 3.16: Input Costs of Fish Trading Units by Type of Trader
Bicycle trader (Shs)
Pick-up trader (Shs)
Capital Investment 86,000 --.
Transport costs --. 100,000
Hire of pick-up --. 150,000
Fuel cost --. 720,000
Labour cost 62,333 55,000
Operating cost 62,333 540,000
Depreciation 576 --.
Total monthly cost 62,909 540,000
Source: FIRRI, survey data June 2002 3.4.4 Marketing Outputs and Income The fish traders mainly trade in Nile Tilapia with a few dealing in Protopterus. Table 3.17 presents the quantities of fish traded, buying and selling prices, cost of raw fish and gross revenues. Overall, pick-up traders traded in larger quantities of fish and enjoyed wider price margins. The pick-up traders mainly sold their fish in urban markets (2) while the bicycle traders (3) mostly sold their fish in rural markets. Table 3.17: Cost of Inputs and Revenues for Fish Marketing
Bicycle trader Pick-up trader
1,100 7,200
750 800
1,250 1,500
840,000 5,760,000
1,450,000 10,800,000
Nile Tilapia
Quantity traded (kgs/ month)
Buying price (Shs/kg
Selling price (Shs/kg
Cost of raw fish (Shs/month)
Gross revenue (Shs/month)
Net revenue (Shs/month) 525,878 4,110,000
320 120
650 500
1,000 600
208,000 60,000
320,000 72,000
Protopterus Quantity traded (kgs/month)
Buying price (Shs/kg
Selling price (Shs/kg
Cost of raw fish (Shs/month)
Gross revenue (Shs/month)
Net revenue (Shs/month) 91,517 -138,000
Source: FIRRI, survey data June 2002

38
3.5 Fish Consumption
3.5.1 Consumers’ characteristics There were 55 fish consumers interviewed at Wansolo. They had an average age of 33 years and 86% were male while 15% were females. They were dominantly Langi (46%), followed by Baganda (8%) and other tribes comprised 46%. Most consumers (86%) were married and most (55%) had attained primary level education followed by those who had secondary level education (36%). The average household size of fish consumers at Wansolo was 7 family members and the respondent had lived at Wansolo for an average of 9 years.
3.5.2 Consumption Levels and Trends Most fish respondents at Wansolo (72%) commonly ate tilapia, followed by Nile perch (22%), Mukene (2%), Protopterus (2%) and other species (2%).
Table 3.18: Commonly Consumed Fish Species at Wansolo by Type of Consumer
Sub-sectors
Nile perch
Tilapia Mukene Protopterus Other Total
Consumers not engaged in fishery activity
33.3% 66.7% - - - 100%
Consumers engaged in fish production
26.9% 69.2% 3.8% - - 100%
Consumers engaged in fish processing
- 100% - - - 100%
Consumers engaged in fish trading
20% 40% - 20% 20% 100%
All respondents 22% 72% 2% 2% 2% 100%
Source: FIRRI, survey data June 2002
Quantities consumed
The average daily quantity consumed by Wansolo respondents was 2.4 kgs and this ranged between 0.5 to 6 kgs. However, this varied between sub-sector consumers as given in Table 3.19.

39
Table 3.19: Average Quantities of Fish Consumed at Wansolo by Type of Consumer (kg/day)
Sub-sectors Maximum Minimum Mean
Consumers not engaged in fishery activity
4 0.5 2
Consumers engaged in fish production
6 1 2.4
Consumers engaged in fish processing
6 0.5 2.6
Consumers engaged in fish trading
4 2 3
All respondents 6 0.5 2.4
Source: FIRRI, survey data June 2002
Consumers were asked whether or not there had been a change over the years in the quantities of fish eaten. Most respondents (72%) agreed that there was a change, while only (28%) did not agree. Most of those who recognised the change (84%) said that the quantities consumed by their families had decreased. Only 16% said that the quantities had increased.
Frequency of fish consumption On average respondents at Wansolo ate fish 3.6 times a week and this ranged between 1 to 7 times. However, this varied between sub-sector respondents as given in Table 3.20
Table 3.20: Average Number of Times Fish is Consumed in a Week at Wansolo
by Type of Consumer
Sub-sectors Maximum Minimum Mean
Consumers not engaged in fishery activity 7 1 3.33
Consumers engaged in fish production 7 1 3.54
Consumers engaged in fish processing 7 2 4.17
Consumers engaged in fish trading 7 1 3.60
All respondents 7 1 3.64
Source: FIRRI, survey data June 2002
Consumers were asked whether or not the frequency of fish consumption had changed over the past year. Most respondents (60%) agreed that there had been a change in the frequency of fish consumption at Wansolo. For those who agreed that

40
frequency in consumption had changed, 87% said it had reduced. A few (13%), however, said it had increased.
Size of fish for consumption Consumers were asked whether or not the sizes of fish they ate with their families had changed over the past year. Most respondents (73%) agreed to this and 71% (of those who agreed) said that the sizes had decreased and 29% said the sizes had increased. Table 3.21: Respondents Reporting Reduction in Sizes of Fish for Consumption at
Wansolo
Fish species Yes No
Total
Nile perch 75% 25% 100%
Tilapia 75% 25% 100%
Mukene - 100% 100%
Protopterus - 100% 100%
Others 100% - 100%
Total 73% 27% 100%
Source: FIRRI, survey data 2002
Substitutes for fish A majority of respondents (86%) mentioned beans as the main substitute to fish, followed by vegetables and meat (Table 3.22).
Table 3.22: Main Substitutes to Fish at Wansolo
Substitutes Count Percentage
Beans 47 86
Meat 1 2
Vegetables 7 12
Chicken - -
Total 55 100
Source: FIRRI, survey data 2002

41
3.5.4 Price Levels and Trends
Most respondents at Wansolo (51%) usually did not buy the fish they ate with their families while 49% did. Unlike most consumers engaged in fish production (83%) who did not buy the fish they ate, most consumers not engaged in fishery activity (83%), most consumers engaged in fish processing (80%) as well as most consumers engaged in fish trading (60%) usually bought the fish they ate with their families. For those who bought fish, the average price mentioned was Shs 672 as given in Table 3.23.
Table 3.23: Prices of Fish Species in Shs for Consumption at Wansolo
Fish species Maximum Minimum
Mean
Nile perch 900 500 700
Tilapia 1,000 300 665
All species 1,000 300 672
Source: FIRRI, survey data June 2002
Consumers were asked whether or not the prices of fish for consumption had changed over the past year. Most respondents (61%) said it changed and all of them said it had increased.
3.6 Community Perceptions towards Chilled Transport Facilities Although there were no factory trucks at Wansolo, consumers where able to associate factory trucks with some positive changes to any beach community where they existed. Most fishers (57%) said it could lead to increased incomes of fishers, followed by beach development (17%), ready market for fish (10%). Some consumers (11%) did not know of any positive change they would associate with factory trucks. However, the major negative impacts mentioned by a large proportion of consumers were the high cost of fresh fish (47%) followed by reduced fish supplies to local traders/ processors and consumers (11%), selling of fish on the lake (9%) and processing of juvenile fish (2%). Some consumers (31%) did not associate any negative impact with factory trucks.

42
4. IREMERIA LANDING SITE 4.1 Background Iremeria Landing Site is located on the southern side of Lake Kyoga in Kamuli District. It was selected as a beach where no chilled transport facilities are expected throughout project’s life. There are approximately 29 beaches in the district. The total catch landed for all fish species in 2001 was about 2,582 tonnes, valued at Shs. one billion.
The rates below in Table 4.1 below, decided by Kamuli District Administration, have been charged for the various fishery activities and vessels. However, with the new financial year beginning 1st July 2002, the new rates in the recently introduced legal new instrument, The fishing (Amendment) Rules, 2001, will be charged (Appendix).
Table 4.1 Previous Revenue Rates Charged at Iremeria Landing Site
Items
Rates (Shs)
Fishing vessel licence 10,000
Fishing licence Nil
Fish monger’s licence operating 10,000
Processing permit 20,000
Source: Kamuli District records
Chilled transport facilities arrived in Kamuli District in March 2001. There are 14 trucks operating in the district. Twelve trucks buy Nile perch for fish factories in JinJa and two buy tilapia for the market in Rwanda. Some trucks are found at trading centres near beaches such as Ndolwa while other reach accessible beaches such as Iyingo, Kiribarya, Bukungu and Nawampiti. There are no trucks at Iremeria because of the poor access road.
Before the arrival of trucks, the price of a Kilogram of Nile perch at the beaches was Shs 300. However, this increased tremendously to Shs 1,000 per Kg.
The fishers have ready market for their fish and as such their incomes have increased with better prices. There is also a reduction in the use of illegal gears due to the demand for big sized Nile perch by factory agents. The taking of catch statistics has greatly improved because truck traders have provided the necessary facilities such as weighing shades and scales. The truck traders have also provided fishing gear on credit. There are plans to train some fisheries inspectors to be deployed in the field and to mobilise LMCs to fight sale of fish at sea.
Iremeria Fish Landing is located in Wesunire Parish, Buyende Sub-county in Kamuli District. The population of the beach is approximately 40 people. The main economic activities are fishing, animal keeping, crop farming and trading.

43
4.1.1 Infrastructure and Facilities
There are very limited infrastructure and facilities at Iremeria as indicated in Table 4.2 below:
Table 4.2: Number and Description of Facilities and Infrastructure at Iremeria
Facilities and Infrastructure
Number Description
Retail shops 1 Mainly dealing in general merchandise
Schools 1 Primary school with classes up to primary seven
Source: FIRRI, survey data June 2002
4.3 Fish Production 4.2.1 Overview There are no public facilities related to fish production at Iremeria. The main type of fishery at Iremeria is mosquito netting with approximately 6 fishers involved in it. Gillnetting (4 fishers), long lining (3 fishers), basket trapping (2 people), boat seining (2 people) and then cast netting (1 person) (Table 4.3).
Table 4.3: Rank and Number per Category of Fishers at Iremeria
Category of Fisher Rank Number
Mosquito netting 1 6
Gillnetting 2 4
Long lining 3 3
Basket trapping 4 2
Boat seining 5 2
Cast netting 6 1
Total -- 18
Source: FIRRI, survey data June 2002
There are approximately 14 fishing unit owners and 26 crewmembers. There are 7 parachute boats at Iremeria. There is no use of the outboard engine for fishing or transportation here.
The main fish species landed is mukene with approximately 5,000 kgs landed per month, followed by Nile perch (3,600 kgs), tilapia 600 kgs and Protopterus (270 kg).

44
4.2.2 Fishers’ Characteristics The sample had only 6 fishers of average age of 44-years and only 1 of them female. The main tribe was the Bakenye (3 persons) followed by the Basoga (2). Three out of the 6 interviewed had attained primary education while the rest had no schooling at all. The most targeted species is mukene (5 respondents) followed by Nile perch (1). On average the fishers had fished for 8 years, lived at the landing for 21 years and had family size of 10 people. The majority (3 of the respondents) had no alternative source of income while 2 reported practicing subsistence farming. All the fishers interviewed owned boats.
4.2.3 Fishing Inputs and Costs Boats and Engines Five of the boats used in production here are ‘parachute’ type and only one is ‘Ssesse’. Each boat has an average of 2 crewmembers.
Table 4.4: Information on Fishing Boats
Type Years taken Cost price (Shs)
Useful life (Years)
Salvage value (Shs)
Parachute 1.2 117,600 4.2 20,000
Ssesse 1.0 200,000 4.0 0
Source: FIRRI, survey data June 2002 Mosquito nets are the main type of fishing gear, used by 4 of the boats, followed by long lines and boat seines. Information on the gear types is provided in Table 4.5:
Table 4.5: Information on Gear Types Used
Gear Type Number Size Years used
Cost price (Shs)
Useful life (Years)
Salvage value (Shs)
Long lines 20.0 6.0 0.0 5,000 1.0 0.0
Mosquito nets
1.0 -- 0.3 190,000 3.1 0.0
Boat seines 1.0 -- 0.0 300,0000 1.0 0.0
Source: FIRRI, survey data June 2002
Labour 20% of crewmembers are paid a percentage of gross revenue while 80% are paid a percentage of net revenue. The proportion is 50% for crew and 50% for unit owner. The average number of working days is 5 per week.
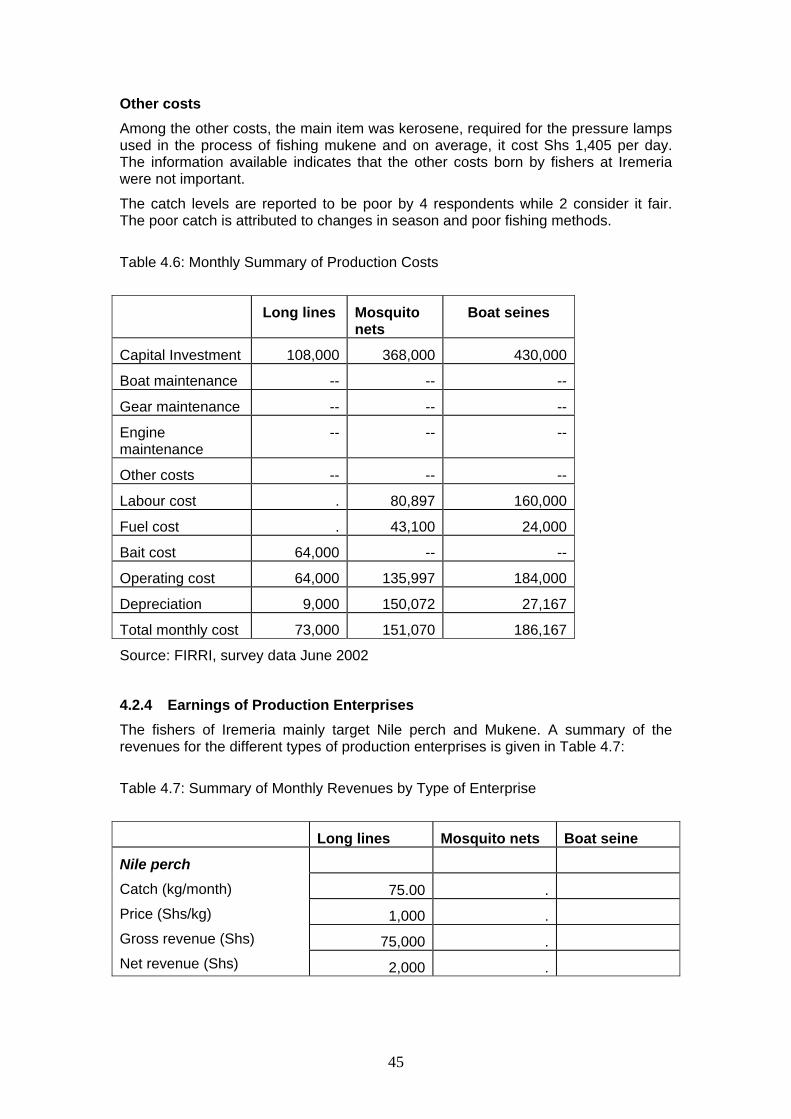
45
Other costs Among the other costs, the main item was kerosene, required for the pressure lamps used in the process of fishing mukene and on average, it cost Shs 1,405 per day. The information available indicates that the other costs born by fishers at Iremeria were not important.
The catch levels are reported to be poor by 4 respondents while 2 consider it fair. The poor catch is attributed to changes in season and poor fishing methods.
Table 4.6: Monthly Summary of Production Costs
Long lines Mosquito nets
Boat seines
Capital Investment 108,000 368,000 430,000
Boat maintenance -- -- --
Gear maintenance -- -- --
Engine maintenance
-- -- --
Other costs -- -- --
Labour cost . 80,897 160,000
Fuel cost . 43,100 24,000
Bait cost 64,000 -- --
Operating cost 64,000 135,997 184,000
Depreciation 9,000 150,072 27,167
Total monthly cost 73,000 151,070 186,167
Source: FIRRI, survey data June 2002
4.2.4 Earnings of Production Enterprises The fishers of Iremeria mainly target Nile perch and Mukene. A summary of the revenues for the different types of production enterprises is given in Table 4.7:
Table 4.7: Summary of Monthly Revenues by Type of Enterprise
Long lines Mosquito nets Boat seine
75.00 .
1,000 .
75,000 .
Nile perch Catch (kg/month)
Price (Shs/kg)
Gross revenue (Shs)
Net revenue (Shs) 2,000 .

46
. 280.90
. 630
. 183,435
Mukene Catch (kg/month)
Price (Shs/kg)
Gross revenue (Shs)
Net revenue (Shs) . 42,365
. 200.00
. 250
. 50,000
Other species Catch (kg/month)
Price (Shs/kg)
Gross revenue (Shs)
Net revenue (Shs) . 136,167
Source: FIRRI, survey data June 2002
Nile perch is weighed in kilograms before sale while mukene is measured in troughs /basins of about 4kg for sale. All the fish is sold to bicycle traders who collect it from the beach. The results indicate that 5 of the respondents reported that they had no arrangements with the buyers, while 1 said that the buyers provided fishing inputs.
4.3 Fish Processing 4.3.1 Overview There are no publicly owned fish processing facilities at Iremeria. Sun-drying is the only fish processing method with approximately 6 people involved in it. Mukene is the only processed fish species. Processors of other fish species were not interviewed because they operate for only limited hours and are basically non-resident at the landing.
4.4 Fish Marketing 4.4.1 Overview There is one poor access road to Iremeria. There are 2 bicycle traders at Iremeria. The main destination of fresh Nile perch is Ndolwa Trading Centre, where the bicycle traders take the fish. Approximately 300 kgs per week are bought from Iremeria. Fresh tilapia is also taken to Ndolwa Trading Centre for the local market while processed mukene is taken by whole sale traders to Palisa. (Table 4.8). Table 4.8: Main Destinations of Fish Species and Product Forms from Iremeria
Fish species Main destinations
Fresh Processed
Nile perch Ndolwa Trading Centre None
Tilapia and Protopterus Ndolwa Trading Centre None
Mukene None Palisa
Source: FIRRI, survey data June 2002

47
The average prices of fresh fish per kg for the various fish species landed at Iremeria are given below (Table 4.9).
Table 4.9: Average Fish Prices at Iremeria
Fish species Prices (Shs/kg)
Nile perch 1,000
Tilapia 800
Protopterus 500
Mukene 250
Source: FIRRI, survey data June 2002
4.5 Fish Consumption
4.5.1 Consumers’ characteristics There were 15 fish consumers interviewed at Iremeria. They had an average age of 35 years and 87% were male while 13% were females. They were dominantly Soga (73%) followed by Bakenye (20%) and Langi (7%). Most respondents (87%) were married and (53%) had attained primary level education followed by those who had no schooling (27%). The average household size of fish consumers at Iremeria was 8 family members and the respondent had lived at Iremeria for an average of 17 years.
4.5.2 Consumption Levels and Trends The most commonly consumed species was Tilapia, followed by Nile perch as shown in Table 4.10.
Table 4.10: Commonly Consumed Fish Species at Iremeria by Category of
Consumer
Sub-sectors Nile perch Tilapia Total
Consumers not engaged in fishery activity 22.2% 77.8% 100%
Consumers engaged in fish production - 100% 100%
All respondents 13% 87% 100%
Source: FIRRI, survey data June 2002
Quantities consumed The average daily quantity consumed by Iremeria respondents was 2 kgs and this ranged between 1 to 3 kgs. However, this varied between sub-sectors, as given in Table 4.11.
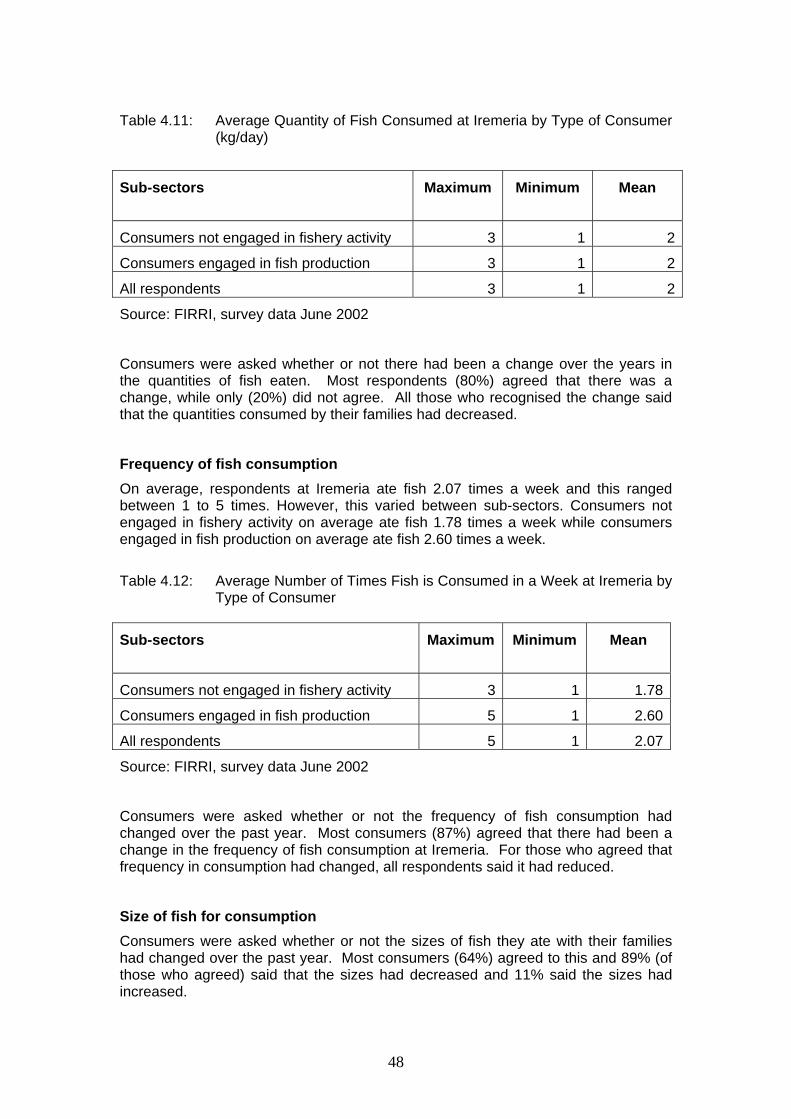
48
Table 4.11: Average Quantity of Fish Consumed at Iremeria by Type of Consumer
(kg/day)
Sub-sectors Maximum Minimum Mean
Consumers not engaged in fishery activity 3 1 2
Consumers engaged in fish production 3 1 2
All respondents 3 1 2
Source: FIRRI, survey data June 2002
Consumers were asked whether or not there had been a change over the years in the quantities of fish eaten. Most respondents (80%) agreed that there was a change, while only (20%) did not agree. All those who recognised the change said that the quantities consumed by their families had decreased.
Frequency of fish consumption On average, respondents at Iremeria ate fish 2.07 times a week and this ranged between 1 to 5 times. However, this varied between sub-sectors. Consumers not engaged in fishery activity on average ate fish 1.78 times a week while consumers engaged in fish production on average ate fish 2.60 times a week.
Table 4.12: Average Number of Times Fish is Consumed in a Week at Iremeria by
Type of Consumer
Sub-sectors Maximum Minimum Mean
Consumers not engaged in fishery activity 3 1 1.78
Consumers engaged in fish production 5 1 2.60
All respondents 5 1 2.07
Source: FIRRI, survey data June 2002
Consumers were asked whether or not the frequency of fish consumption had changed over the past year. Most consumers (87%) agreed that there had been a change in the frequency of fish consumption at Iremeria. For those who agreed that frequency in consumption had changed, all respondents said it had reduced.
Size of fish for consumption Consumers were asked whether or not the sizes of fish they ate with their families had changed over the past year. Most consumers (64%) agreed to this and 89% (of those who agreed) said that the sizes had decreased and 11% said the sizes had increased.

49
Table 4.13: Respondents Reporting Reduction in Sizes of Fish for Consumption at
Iremeria
Fish species Yes No
Total
Nile perch 50% 50% 1005
Tilapia 67% 33% 100%
Total 64% 36% 100%
Source: FIRRI, survey data June 2002
Substitutes for fish A majority of respondents at Iremeria (53%) mentioned vegetables as the main substitute to fish, followed by beans, meat and other substitutes (Table 4.17).
Table 4.14: Main Substitute to Fish at Iremeria
Substitutes Count Percentage
Beans 5 33
Meat 1 7
Vegetables 8 53
Chicken - -
Other 1 7
Total 15 100
Source: FIRRI, survey data June 2002
4.5.3 Price Levels and Trends
All consumers at Iremeria usually bought the fish they ate with their families. The average price mentioned was Shs 693 and it ranged between Shs 500 – 1,000. The average price mentioned by consumers of Nile perch was Shs 750 while that for Tilapia was Shs 684. Table 4.15: Prices of Fish Species in Shs for Consumption at Iremeria
Fish species Maximum Minimum Mean
Nile perch 1,000 500 750
Tilapia 1,000 500 684
All species 1,000 500 693
Source: FIRRI, survey data June 2002

50
Consumers were asked whether or not the prices of fish for consumption had changed over the past year. Most consumers (93%) at Iremeria and most of them (93%) said it had increased.
4.6 Community Perceptions towards Chilled Transport Facilities A proportion (36%) of respondents at Iremeria did not associate any positive change with factory trucks. Although there were no factory trucks at Iremeria, consumers where able to associate factory trucks with some changes to any beach community where they existed such as increased incomes of fishers (29% of the respondents), followed by ready market for fish (21%) and beach development (7%).
However, the major negative impacts mentioned by a large proportion of consumers were the high cost of fresh fish (55%) followed by reduced fish supplies to local traders/ processors and consumers (18%) and selling of fish on the lake (9%). Some consumers (18%) did not associate any negative impact with factory trucks.

51
5. KABOLWA LANDING SITE
5.1 Background Kabolwa Landing Site, located in Kisyabi Parish in Buliisa Sub-county in Masindi District was selected as a beach where chilled transport facilities already operate. The population of the beach is approximately 1430 people. The main economic activities at the beach are fishing, Livestock keeping, crop farming and trading. Animals kept include cows, pigs, goats and sheep while the main crops grown are cassava, maize, potatoes and beans.
Masindi District is located on the western side of Lake Albert (see map). There are approximately 18 beaches in the district. In total there are 2655 fishermen and 885 boats in the district. The estimated annual catch (2001) was estimated at 18,295 tonnes
The rates below have been charged for the various fishery activities and vessels (Table 1.1). The specific licence for trucks in the new instrument (The fishing (Amendment) Rules, 2001) is already being implemented. The specific licence varies according the tonnage of the truck. In total there are 8 factory trucks operating in Masindi. On average, each truck takes 5 tonnes per week. The district has benefited from specific licences charged on the trucks as a new source of revenue.
Table 5.1: Rates Charged on Fishery Activities and Fishing Vessels.
Item Old Rates (Shs)
Fishing vessel licence 10,000
Fishing licence No charge
Fish monger’s licence operating 20,000
Processing permit No charge
Source: FIRRI, survey data June 2002
Chilled transport facilities arrived in Masindi District in August 2001 and begun operating at Kabolwa by October 2001. Two trucks operate at each of these beaches; Kabolwa, Butiaba and Bugoigo while one truck operate at each of these beaches; Wanseko and Songa Lendu. The trucks come from Ngege Ltd, Hwan Sung Fishing Industry, Marine and Agro, Byansi Fish Processors and Uganda Fish Packers Ltd.
Before the arrival of chilled transport facilities, the price of a kilogram of Nile perch was Shs 500, however, this increased tremendously to the present rate, which is Shs. 1,200 per kg. This has tremendously raised the incomes of fishers
New toilets have been constructed at Bugoigo, Butiaba and Kabolwa as a way of improving sanitation at the beaches were chilled transport facilities operate. The district has also graded roads to Butiaba and Bugoigo beaches. There are plans to gazette the beaches where these trucks are operating.
The local processors, traders and consumers have raised complaints to the District Fisheries Officers that much of the fish is being taken away by the truck traders leaving them unemployed and with little supplies of Nile perch. There has also been

52
an increase in the use of illegal gears such as beach seines that catch juveniles that have ready market from the local processors, traders and local consumers.
The district authorities have responded to some of the problems above by sensitising the fishers against the use of illegal gears and also increasing the number of operations to arrest illegal gear users.
5.1.1 Infrastructure and Facilities at Kabolwa
Table 5.2 below gives the general facilities and infrastructure at Kabolwa.
Table 5.2. Facilities and Infrastructure at Kabolwa
Infrastructure/facilities No. Description
Retail shops 15 Dealing in general merchandise
Food kiosks 3 Dealing in local dishes such as Matooke, Cassava, fish and meat
Drug shops 1 Dealing in drugs for first aid and sometimes involved in treatment of sick persons
Borehole 1 Established by the District Local Council
Schools 1 There is Kabolwa Primary school with classes up to primary four
Latrines 1 There is one unfinished public latrine, however a number of households have private ones
Recreational facilities 2 One video hall and the community shares a football pitch with the school
Source: FIRRI, survey data June 2002
5.2 Fish Production Sub-sector 5.2.1 Overview There are no support facilities for fish production at Kabolwa. The main type of fishery is gillnetting with approximately 100 fishers. Kaganga (70 people) and then Long lining (25 fishers) follow as shown in Table 1.3.

53
Table 5.3. Ranking of Production Enterprises by Number at Kabolwa
Category of fishers Rank Number
Gill netting 1 100
Kaganga 2 70
Longlining 3 25
Source: FIRRI, survey data June 2002
There are approximately 70 fishing unit owners, 30 fishing unit renters and 140 crew. There are 70 ‘Congo Barque’ boats at Kabolwa. There are 4 transport boats with outboard motor engines of horsepower ranging from 4 to 15.
The main fish species landed is Hydrocynus Spp. This is followed by Nile perch, Alestes nurse, Alestes baremose and tilapia.
5.2.2 Fishers’ Characteristics
There were 31 fish producers interviewed at Kabolwa. They had an average age of 35 years and 84% were male while 16% were females. They were dominantly of the Alur tribe (51%), followed by Bagungu (32%), Banyoro (7%), Baganda (7%) and other tribes (3%). Most fishers (90%) were married and most (48%) had attained primary level education followed by those who had secondary level education (31%). A large proportion of fishers (45%) targeted Nile perch, followed by those who targeted Hydrocynus (32%). Other species targeted included Alestes nurse (10%), Tilapia (7%) and Bagrus spp (6%). Respondents had fished for an average of 9 years and had stayed at Kabolwa for an average of 11 years. The average household size of fishers was 10 people. Their main alternative sources of income were trading (26%) and crop farming (13%). Most fishers (61%) had no alternative source of income.
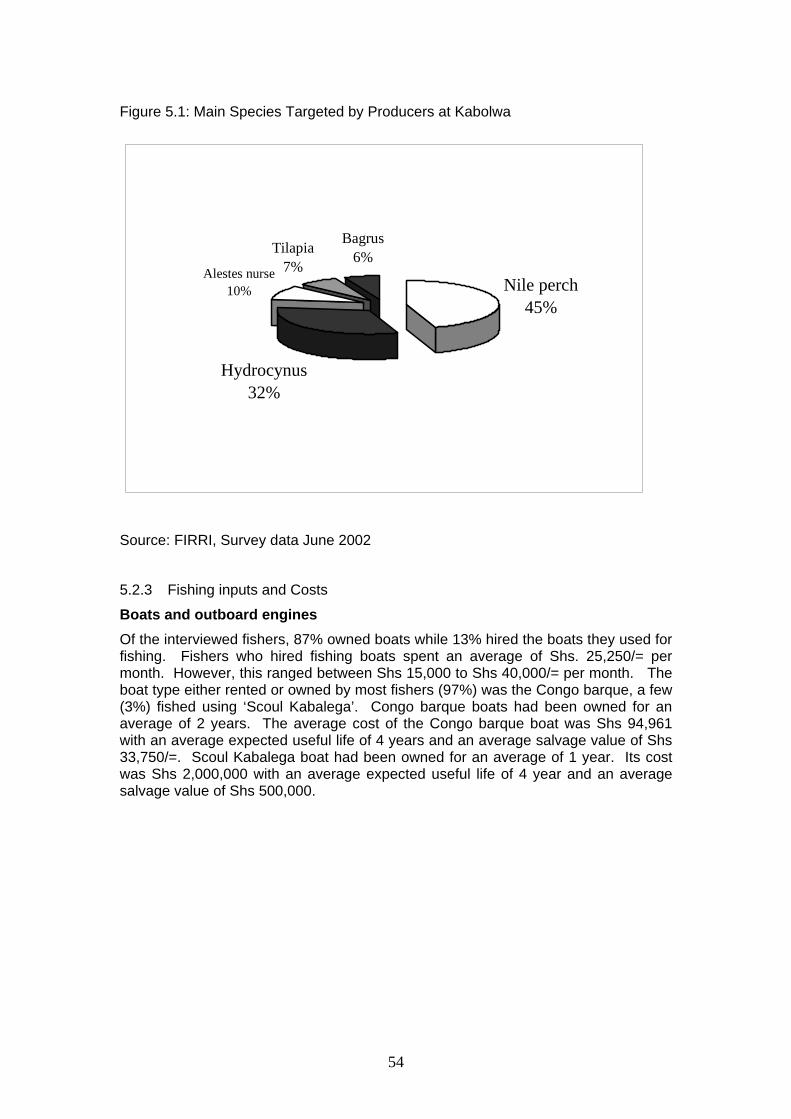
54
Figure 5.1: Main Species Targeted by Producers at Kabolwa
Source: FIRRI, Survey data June 2002
5.2.3 Fishing inputs and Costs
Boats and outboard engines Of the interviewed fishers, 87% owned boats while 13% hired the boats they used for fishing. Fishers who hired fishing boats spent an average of Shs. 25,250/= per month. However, this ranged between Shs 15,000 to Shs 40,000/= per month. The boat type either rented or owned by most fishers (97%) was the Congo barque, a few (3%) fished using ‘Scoul Kabalega’. Congo barque boats had been owned for an average of 2 years. The average cost of the Congo barque boat was Shs 94,961 with an average expected useful life of 4 years and an average salvage value of Shs 33,750/=. Scoul Kabalega boat had been owned for an average of 1 year. Its cost was Shs 2,000,000 with an average expected useful life of 4 year and an average salvage value of Shs 500,000.
Nile perch 45%
Hydrocynus32%
Alestes nurse10%
Bagrus6%Tilapia
7%

55
Table 5.4: Information on Boats Owned at Kabolwa.
Type Number in sample
Ownership period (Years)
Cost price (Shs)
Useful life (Years)
Salvage value (Shs)
School Kabalega
1 1 2,000,000 4 500,000
Congo barque
26 2 94,961 4 26,600
Source: FIRRI, survey data 2002
One of the interviewed fishers at Kabolwa owned an outboard motor engine and none of the fishers hired an outboard motor engine. The outboard motor engine had a Horse power of 15. It had been owned for 1.5 years and had cost Shs 2,200,000. The expected useful life was 10 years and a salvage value of Shs 1,000,000.
Table 5.5: Information on Outboard Engine at Kabolwa
Horse power
Period of ownership (Years)
Cost price (Shs)
Expected useful life (Years)
Salvage value (Shs)
15 1.5
2,200,000 10 1,000,000
Source: FIRRI, survey data 2002
Fishing gear Respondents used the gear types shown in Table 5.6 below:
Table 5.6: Gear Types Used by Respondents
Gear types used Frequency Percentage
Long line 8 25.8
Gilnets 20 64.5
Kaganga 3 9.7
Total 31 100.0
Source: FIRRI, survey data June 2002
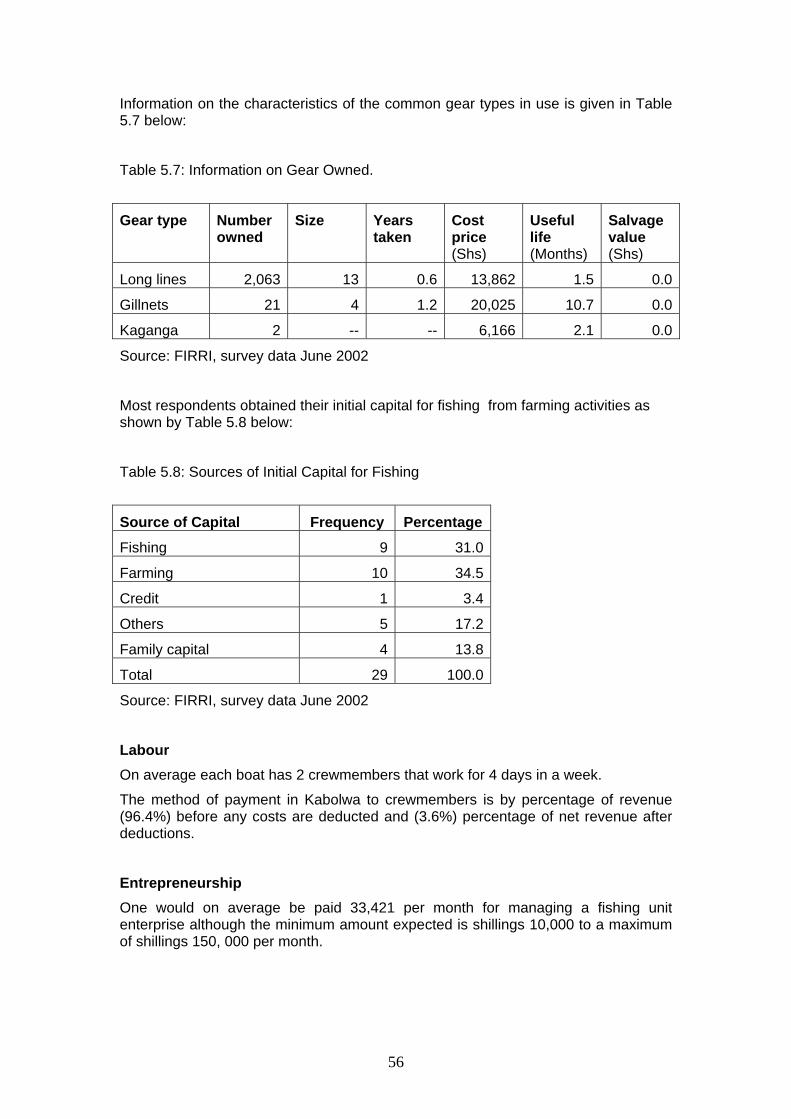
56
Information on the characteristics of the common gear types in use is given in Table 5.7 below:
Table 5.7: Information on Gear Owned.
Gear type Number owned
Size Years taken
Cost price (Shs)
Useful life (Months)
Salvage value (Shs)
Long lines 2,063 13 0.6 13,862 1.5 0.0
Gillnets 21 4 1.2 20,025 10.7 0.0
Kaganga 2 -- -- 6,166 2.1 0.0
Source: FIRRI, survey data June 2002
Most respondents obtained their initial capital for fishing from farming activities as shown by Table 5.8 below:
Table 5.8: Sources of Initial Capital for Fishing
Source of Capital Frequency Percentage
Fishing 9 31.0
Farming 10 34.5
Credit 1 3.4
Others 5 17.2
Family capital 4 13.8
Total 29 100.0
Source: FIRRI, survey data June 2002
Labour On average each boat has 2 crewmembers that work for 4 days in a week.
The method of payment in Kabolwa to crewmembers is by percentage of revenue (96.4%) before any costs are deducted and (3.6%) percentage of net revenue after deductions.
Entrepreneurship One would on average be paid 33,421 per month for managing a fishing unit enterprise although the minimum amount expected is shillings 10,000 to a maximum of shillings 150, 000 per month.

57
Other costs
The fishing unit owner at kabolwa reported other operating cost including maintenance of outboard engine, boats, gear as well as baits as given in table 5. 9.
Resource base Some 12.9% of the respondents said that the catches are good while 48.4% said it was fair only and 38.7% reported that the catches are poor. The reasons attributed to the poor catches are changes in seasons (62.5%), not enough fish available at the lake (33.3%) and lack of capital (4.2%).
The monthly summary of production costs is given in Table 5.9:
Table 5.9: Monthly Summary of Production Costs
Long lines Gillnets Kaganga
Capital Investment 632,375 555,175 14,500
Boat maintenance 3,250 4,400 --
Gear maintenance 5,500 6,230 --
Engine maintenance -- -- --
Other costs -- -- 1,500
Labour cost 154,516 141,526 141,000
Fuel cost . 420,000 .
Bait cost 40,800 . .
Operating cost 180,016 162,526 141,000
Depreciation 20,947 12,065 942
Total monthly cost 195,259 185,220 49,442
Source: FIRRI, survey data June 2002

58
5.2.4 Earnings of the Production Enterprises Calculations based on costs and revenue data show that gillnet enterprises fishing Nile perch realised the highest net revenues, followed by long liners also catching Nile perch, as shown in Table 5.10.
Table 5.10: Average catches and incomes of fishers by species
Long lines Gillnets Kaganga
343.87 863.25 --
1,086 950 --
382,460 834,750 --
Nile perch
Catch (kg/month)
Price/ kg
Gross revenue
Net revenue 150,978 350,975 --
-- 119.25 --
-- 475 --
-- 57,825 --
Nile tilapia
Catch (kg/month)
Price (Shs/kg)
Gross revenue (Shs)
Net revenue (Shs) -- 15,257 --
-- 216 --
-- 500 --
-- 108,000 --
Bagrus bayad
Catch (kg/month)
Price (Shs/kg)
Gross revenue (Shs)
Net revenue (Shs) -- 33,227 --
132.40 258.48 --
700 435 --
92,680 104,671 --
Hydrocynus
Catch (kg/month)
Price (Shs/kg
Gross revenue (Shs)
Net revenue (Shs) 52,483 47,961 --
-- -- 1,430.00
-- -- 250
-- -- 470,000
Other species
Catch (kg/month)
Price (Shs/kg
Gross revenue (Shs)
Net revenue (Shs) -- -- 326,500
Source: FIRRI survey data June 2002
All respondents reported selling Nile perch in kilograms; tilapia both in kilograms (50%) and per head (50%). Bagrus is sold in bundles and per head for the big ones

59
while the remaining species are sold per head. Most respondents (61.5%) reported that Nile perch is sold to factory agents, 30.8% to truck traders and 7.7% are sold to bicycle traders. Tilapia is mainly sold to bicycle traders (50%) and beach processors (50%). The same applies to the remaining species. Some 60% of the respondents who caught Hydrocynus fish sold to beach processors, 20% sold to beach consumers and truck traders took the rest. All the fish is sold at the beach. Most fishers (96.3%) have no arrangements with their buyers other than buying and selling fish.
5.3 Fish Processing Sub-sector 5.3.1 Overview There are no publicly owned facilities to support fish processing at Kabolwa. There are approximately 30 privately owned smoking kilns and 20 drying racks. Sun-drying is the main fish processing method. This is followed by smoking and then salting and sun-drying. Alestes nurse, Hydrocynus, tilapia, Nile perch and Alestes baremose are the most processed fish species. Alestes nurse is sun-dried while the other species are either smoked or salted and sun-dried.
5.3.2 Fish Processors characteristics There were 11 respondents in the sample of processors. They were mostly Alur (72.7%) and mostly females (90.9%) of average age 32. Most had primary education (45.5%) but some 27.3% had no schooling. Their average household size was 6 persons and they had been at the beach for 11 years on average.
5.3.3 Fish Processing Inputs and Costs In the sample, 63.6% of the fish processors smoked fish while 36.4% salted/ sun dried fish. Almost all the fish smokers used smoking kilns to process their fish, which are either privately (71.4%) or communally (28.6%) owned. Among the processors who salt/ sun dry fish, 66.7% used privately owned drying racks whilst 33.3% spread their fish on ‘communally’ owned bare land for which they do not pay rent. Table 5.11: Distribution of Fish Processors by Type of Processing Facility and
Ownership
Smoking Sun drying and Salting
Privately owned 71.4% --
Rented -- --
Smoking kiln/pit
Communally owned 28.6% --
Privately owned -- 66.7%
Rented -- --
Drying racks
Communally owned -- --
Privately owned -- --
Rented -- --
Drying ground
Communally owned -- 33.3%
Total 100.0% 100.0%
Source: FIRRI, survey data June 2002
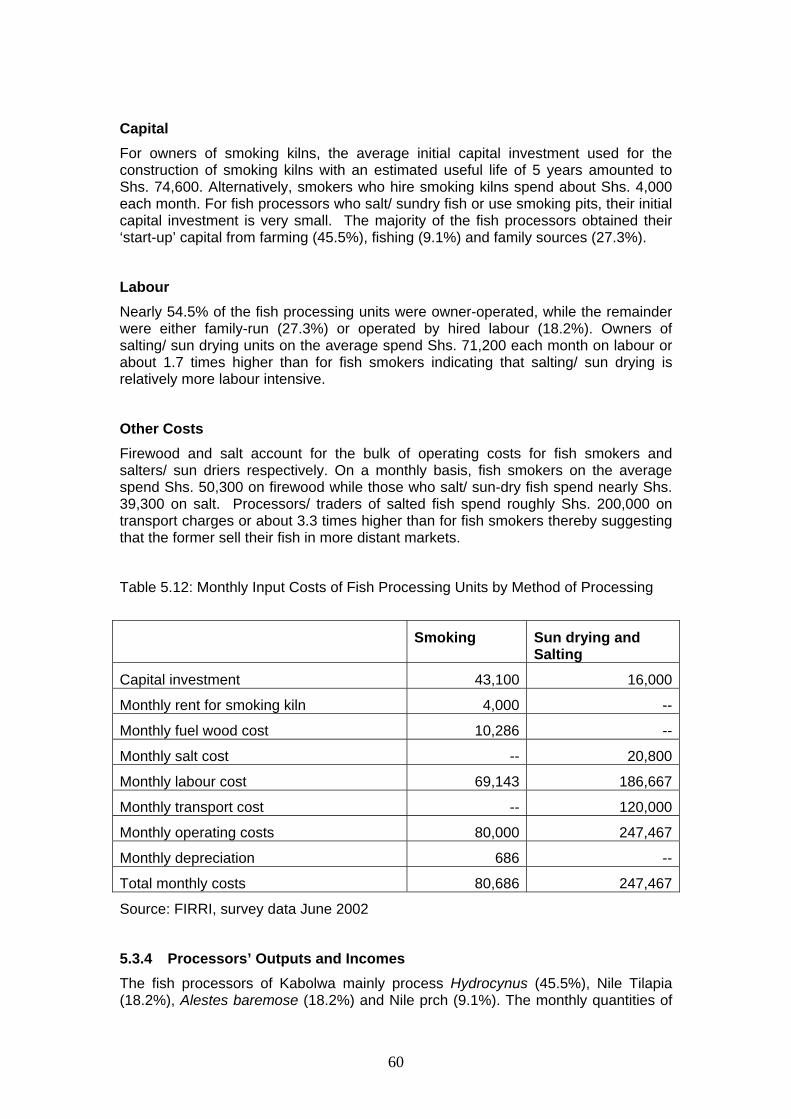
60
Capital For owners of smoking kilns, the average initial capital investment used for the construction of smoking kilns with an estimated useful life of 5 years amounted to Shs. 74,600. Alternatively, smokers who hire smoking kilns spend about Shs. 4,000 each month. For fish processors who salt/ sundry fish or use smoking pits, their initial capital investment is very small. The majority of the fish processors obtained their ‘start-up’ capital from farming (45.5%), fishing (9.1%) and family sources (27.3%).
Labour Nearly 54.5% of the fish processing units were owner-operated, while the remainder were either family-run (27.3%) or operated by hired labour (18.2%). Owners of salting/ sun drying units on the average spend Shs. 71,200 each month on labour or about 1.7 times higher than for fish smokers indicating that salting/ sun drying is relatively more labour intensive.
Other Costs Firewood and salt account for the bulk of operating costs for fish smokers and salters/ sun driers respectively. On a monthly basis, fish smokers on the average spend Shs. 50,300 on firewood while those who salt/ sun-dry fish spend nearly Shs. 39,300 on salt. Processors/ traders of salted fish spend roughly Shs. 200,000 on transport charges or about 3.3 times higher than for fish smokers thereby suggesting that the former sell their fish in more distant markets.
Table 5.12: Monthly Input Costs of Fish Processing Units by Method of Processing
Smoking Sun drying and Salting
Capital investment 43,100 16,000
Monthly rent for smoking kiln 4,000 --
Monthly fuel wood cost 10,286 --
Monthly salt cost -- 20,800
Monthly labour cost 69,143 186,667
Monthly transport cost -- 120,000
Monthly operating costs 80,000 247,467
Monthly depreciation 686 --
Total monthly costs 80,686 247,467
Source: FIRRI, survey data June 2002
5.3.4 Processors’ Outputs and Incomes The fish processors of Kabolwa mainly process Hydrocynus (45.5%), Nile Tilapia (18.2%), Alestes baremose (18.2%) and Nile prch (9.1%). The monthly quantities of

61
fish processed, buying and selling prices, costs and revenues are presented in Table 10. The processed fish that is either transported by the processors themselves (72.7%) or traders who operate at the beach (27.3%) usually ends up in urban markets in the neighbouring districts such as Nebbi, Pakwach and Arua.
Table 5.13: Costs of Raw Fish and Revenues from Processed Fish by Species
N. perch Tilapia Hydrocynus Alestes baremose
Alestes nurse
Quantity processed (kg/month)
440 500 560 300 400
Buying price (Shs/kg)
1,000 750 380 450 600
Selling price (Shs/kg)
2,000 1,650 880 800 1,000
Monthly cost of raw fish (Shs)
440,000 330,000 217,600 140,000 240,000
Monthly gross revenue (Shs)
880,000 780,000 504,000 240,000 400,000
Source: FIRRI, survey data June 2002
5.4 Fish Marketing Sub-sector 5.4.1 Overview Fish marketing at Kabolwa is facilitated by a relatively good access road. This explains why chilled transport facilities can easily get access to the beach. Kabolwa can also be accessed by water from the neighbouring beaches such as Butiaba and Bugoigo.
There are approximately 13 beachside retailers/processors, 4 factory agents and 3 bicycle traders. The factory agents buy fish for the truck traders coming fish processing plants. Truck traders buy approximately 5 tonnes per week of Nile perch followed by beach processors and then bicycle traders.
The main destinations for fresh Nile perch are the processing factories in Kampala and Jinja, while fresh tilapia, Alestes baremose and Hydrocynus are mainly sold at the beach. Processed Alestes nurse is sold to wholesale buyers from Kampala. Processed forms of the other species are mainly sold in Arua
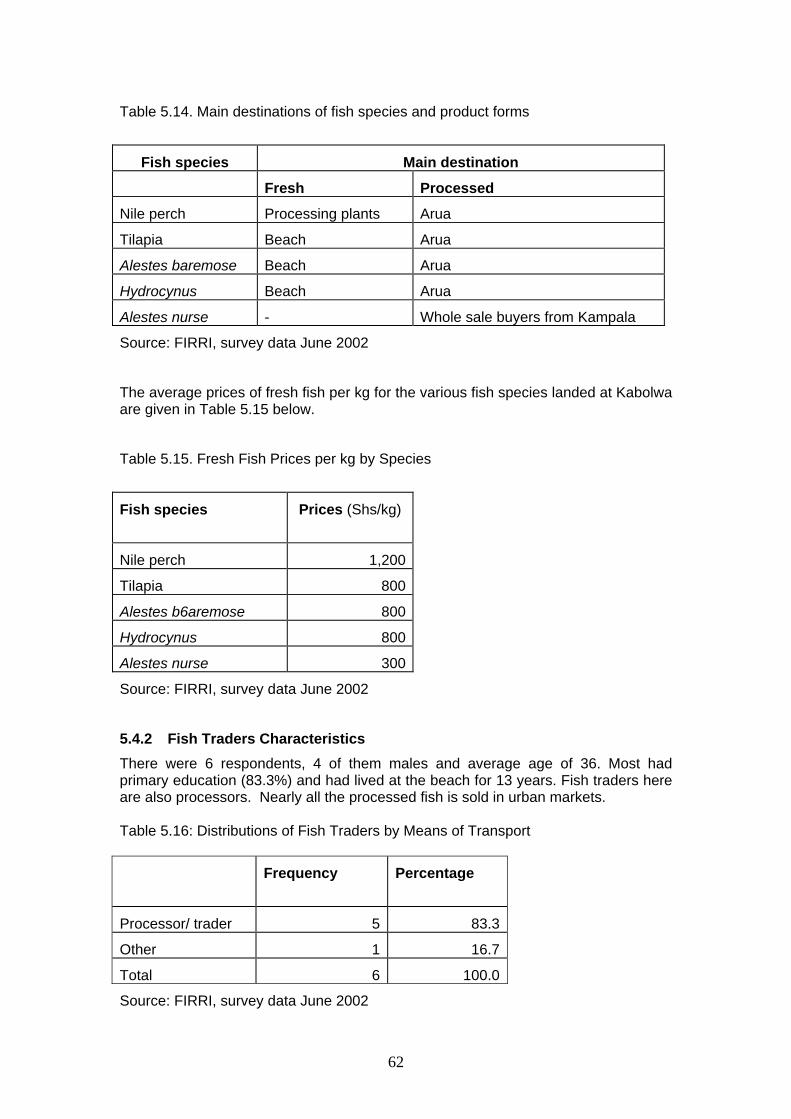
62
Table 5.14. Main destinations of fish species and product forms
Fish species Main destination
Fresh Processed
Nile perch Processing plants Arua
Tilapia Beach Arua
Alestes baremose Beach Arua
Hydrocynus Beach Arua
Alestes nurse - Whole sale buyers from Kampala
Source: FIRRI, survey data June 2002
The average prices of fresh fish per kg for the various fish species landed at Kabolwa are given in Table 5.15 below.
Table 5.15. Fresh Fish Prices per kg by Species
Fish species Prices (Shs/kg)
Nile perch 1,200
Tilapia 800
Alestes b6aremose 800
Hydrocynus 800
Alestes nurse 300
Source: FIRRI, survey data June 2002
5.4.2 Fish Traders Characteristics There were 6 respondents, 4 of them males and average age of 36. Most had primary education (83.3%) and had lived at the beach for 13 years. Fish traders here are also processors. Nearly all the processed fish is sold in urban markets. Table 5.16: Distributions of Fish Traders by Means of Transport
Frequency Percentage
Processor/ trader 5 83.3
Other 1 16.7
Total 6 100.0
Source: FIRRI, survey data June 2002
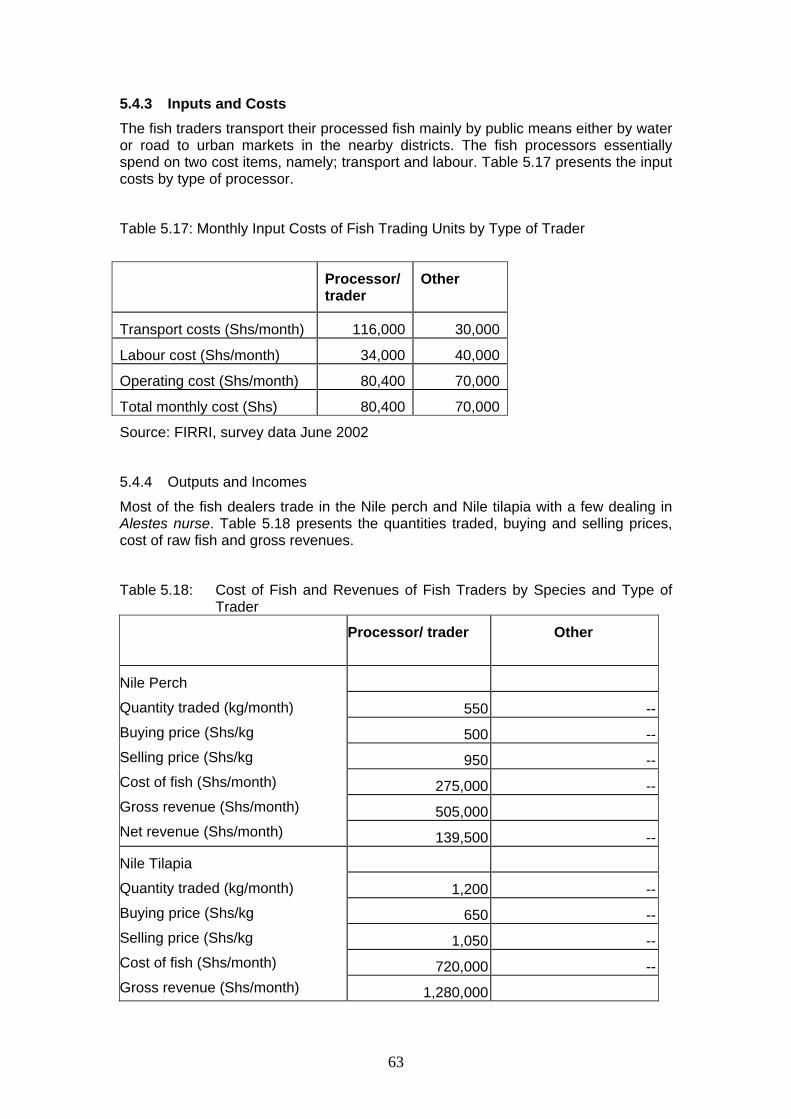
63
5.4.3 Inputs and Costs The fish traders transport their processed fish mainly by public means either by water or road to urban markets in the nearby districts. The fish processors essentially spend on two cost items, namely; transport and labour. Table 5.17 presents the input costs by type of processor.
Table 5.17: Monthly Input Costs of Fish Trading Units by Type of Trader
Processor/ trader
Other
Transport costs (Shs/month) 116,000 30,000
Labour cost (Shs/month) 34,000 40,000
Operating cost (Shs/month) 80,400 70,000
Total monthly cost (Shs) 80,400 70,000
Source: FIRRI, survey data June 2002
5.4.4 Outputs and Incomes
Most of the fish dealers trade in the Nile perch and Nile tilapia with a few dealing in Alestes nurse. Table 5.18 presents the quantities traded, buying and selling prices, cost of raw fish and gross revenues.
Table 5.18: Cost of Fish and Revenues of Fish Traders by Species and Type of Trader
Processor/ trader Other
550 --
500 --
950 --
275,000 --
505,000
Nile Perch
Quantity traded (kg/month)
Buying price (Shs/kg
Selling price (Shs/kg
Cost of fish (Shs/month)
Gross revenue (Shs/month)
Net revenue (Shs/month) 139,500 --
1,200 --
650 --
1,050 --
720,000 --
Nile Tilapia
Quantity traded (kg/month)
Buying price (Shs/kg
Selling price (Shs/kg
Cost of fish (Shs/month)
Gross revenue (Shs/month) 1,280,000

64
Net revenue (Shs/month) 409,000 --
1,200 1,000
600 250
1,000 400
720,000 250,000
1,200,000 400,000
Alestes nurse
Quantity traded (kg/ month)
Buying price (Shs/kg
Selling price (Shs/kg
Cost of fish (Shs/month)
Gross revenue (Shs/month)
440,000 80,000
Source: FIRRI, survey data June 2002
5.5 Fish Consumption
5.5.1 Consumers’ characteristics
There were 59 fish consumers interviewed at Kabolwa. They had an average age of 34 years and 63% were male while 37% were females. They were predominantly Alur (63%), followed by Bagungu (22%), Banyoro (5%), Baganda (3%) and other tribes (7%). Most consumers (83%) were married and a large proportion (42%) had attained primary level education followed by those who had no schooling (25%) and secondary level education (25%). The average household size of fish consumers at Kabolwa was 6 family members and the respondent had lived at Kabolwa for an average of 9 years. 5.5.2 Consumption Levels and Trends A large proportion of respondents at Kabolwa (46%) commonly ate Tilapia, followed by Hydrocynus (28%), Nile perch (14%), Alestes baremose (7%), Bagrus spp (3%) and Alestes nurse (2%).
Table 5.19: Commonly Consumed Fish Species at Kabolwa by Type of Consumer
Sub sectors
Nile perch
Tilapia Hydrocynus Alestes baremose
Bagrus Spp
Alestes nurse
Total
Consumers engaged in fishery activity
- 63.6% 18.2% 18.2% - - 100%
Consumers engaged in fish production
19.4% 32.3% 36% 3.2% 6.5% 3.2% 100%
Consumers engaged in fish processing
9.1% 55% 27.3% 9.1% - - 100%
Consumers engaged in fish trading
16.7% 67% 17% - - - 100%
All respondents 14% 46% 28% 7% 3% 2% 100%
Source: FIRRI, survey data June 2002

66
Quantities consumed The average daily quantity consumed by Kabolwa respondents was 3.03 kgs and this ranged between 0.5 to 16 kgs. However, this varied between sub-sectors as given in Table 5.20.
Table 5.20: Quantities of Fish Consumed at Kabolwa by Type of Consumer (kg/day)
Sub sectors Maximum Minimum Mean
Consumers not engaged in fishery activity
4 0.5 2.1
Consumers engaged in fish production 16 1 3.7
Consumers engaged in fish processing 3 1 2.3
Consumers engaged in fish trading 3 2 2.7
All respondents 16 0.5 3.0
Source: FIRRI, survey data June 2002
Consumers were asked whether or not there had been a change over the years in the quantities of fish eaten. Most respondents (60%) agreed that there was a change, while only (40%) did not agree. Most of those who recognised the change (92%) said that the quantities consumed by their families had decreased. Only 8% said that the quantities had increased.
Frequency of fish consumption
On average consumers at Kabolwa ate fish 4.31 times a week and this ranged between 2 to 7 times. However, this varied between sub-sectors as given in Table 5.21.
Table 5.21: Average Number of Times Fish is Consumed in a Week at Kabolwa by Type of Consumer
Sub sectors Maximum Minimum Mean
Consumers not engaged in fishery activity 7 2 4.1
Consumers engaged in fish production 7 2 4.5
Consumers engaged in fish processing 7 2 3.7
Consumers engaged in fish trading 7 2 5.0
Total of whole beach 7 2 4.3
Source: FIRRI, survey data June 2002

67
Consumers were asked whether or not the frequency of fish consumption had changed over the past year. Most respondents (51%) disagreed that there had been a change in the frequency of fish consumption at Kabolwa. However, for those who agreed that frequency in consumption had changed, all respondents said it had reduced.
Size of Fish for Consumption
Consumers were asked whether or not the sizes of fish they ate with their families had changed over the past year. Most respondents (56%) agreed to this and 88% (of those who agreed) said that the sizes had decreased and 12% said the sizes had increased.
Table 5.22: Respondents Reporting Reduction in Sizes of Fish for Consumption at Kabolwa
Fish species Yes No
Total
Nile perch 87% 13% 100%
Tilapia 44% 56% 100%
Hydrocynus 59% 41% 100%
Alestes baremose 25% 75% 100%
Bagrus spp 100% - 100%
Alestes nurse 100% - 100%
All species 56 44
Source: FIRRI, survey data June 2002
Substitutes for Fish
A majority of respondents (88%) mentioned beans as the main substitute to fish, followed by vegetables, meat and other substitutes (5.22).
Table 5.23: Main Substitutes to Fish at Kabolwa
Substitutes Count Percentage
Beans 52 88
Meat 1 2
Vegetables 5 8
Chicken 1 2
Total 59 100
Source: FIRRI, survey data June 2002
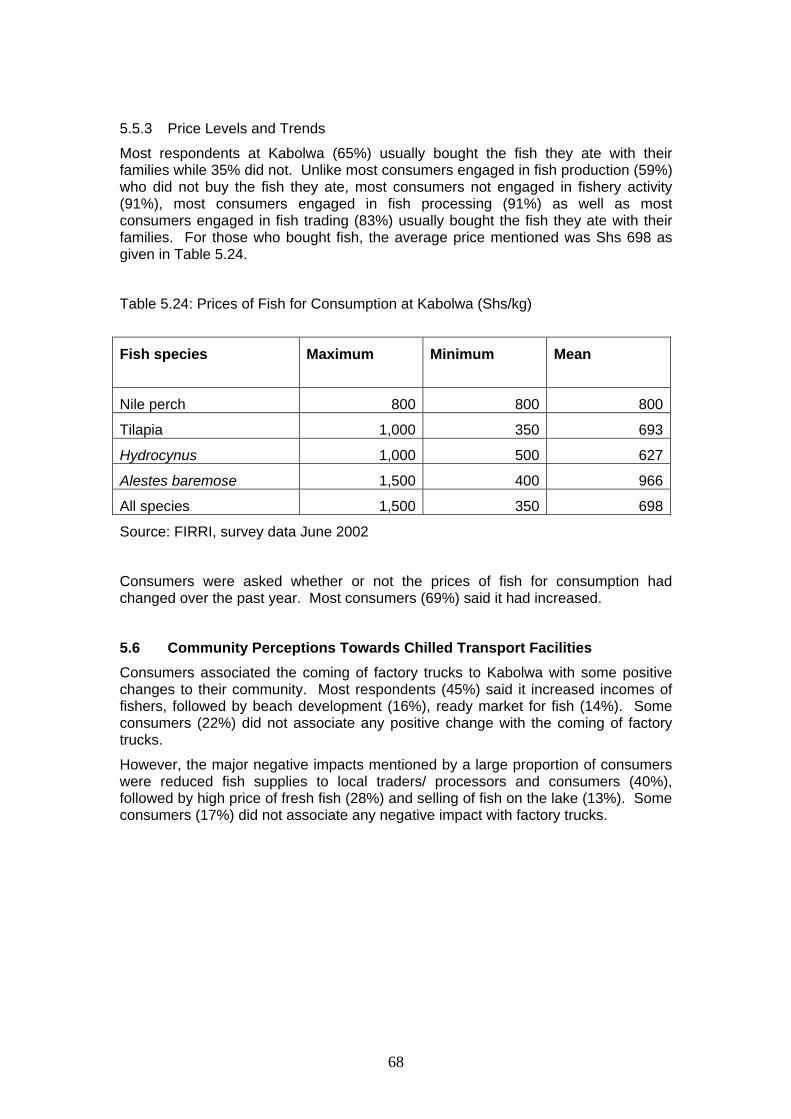
68
5.5.3 Price Levels and Trends Most respondents at Kabolwa (65%) usually bought the fish they ate with their families while 35% did not. Unlike most consumers engaged in fish production (59%) who did not buy the fish they ate, most consumers not engaged in fishery activity (91%), most consumers engaged in fish processing (91%) as well as most consumers engaged in fish trading (83%) usually bought the fish they ate with their families. For those who bought fish, the average price mentioned was Shs 698 as given in Table 5.24.
Table 5.24: Prices of Fish for Consumption at Kabolwa (Shs/kg)
Fish species Maximum Minimum Mean
Nile perch 800 800 800
Tilapia 1,000 350 693
Hydrocynus 1,000 500 627
Alestes baremose 1,500 400 966
All species 1,500 350 698
Source: FIRRI, survey data June 2002
Consumers were asked whether or not the prices of fish for consumption had changed over the past year. Most consumers (69%) said it had increased.
5.6 Community Perceptions Towards Chilled Transport Facilities Consumers associated the coming of factory trucks to Kabolwa with some positive changes to their community. Most respondents (45%) said it increased incomes of fishers, followed by beach development (16%), ready market for fish (14%). Some consumers (22%) did not associate any positive change with the coming of factory trucks. However, the major negative impacts mentioned by a large proportion of consumers were reduced fish supplies to local traders/ processors and consumers (40%), followed by high price of fresh fish (28%) and selling of fish on the lake (13%). Some consumers (17%) did not associate any negative impact with factory trucks.

69
6. SOMSIO LANDING SITE 6.1 Background
Somsio Landing Site, located in Butiaba Parish, Biso Sub-county in Masindi District was selected as a beach were no chilled transport facilities are expected throughout project’s life. The population of the beach is approximately 150 people. The main economic activities at the beach are fishing, animal keeping and trading.
6.1.1 Infrastructure and Facilities Table 6.1 below shows that very limited facilities and infrastructure are available at Somsio.
Table 6.1. Infrastructure and Facilities at Somsio Landing Site.
Infrastructure and Facilities
Number Description
Retail shops 3 Mainly dealing in general merchandise
Borehole 1 One borehole as the main source of drinking water
School 1 Primary school with classes up to primary seven
Source: FIRRI, survey data June 2002
6.2 Fish Production Sub-sector 6.2.1 Overview There are no facilities to support fish production such as boat yards, racks, weighing shades at Somsio. The main type of enterprise at Somsio is gillnetting with approximately 22 fishers involved in it. Kaganga (7 fishers) and boat seining (2 people) follow this (Table 6.2).
Table 6.2. Ranking of Production Enterprises by Number at Somsio
Category of fishers
Rank Number
Gillnetting 1 22
Kaganga 2 7
Boat seining 3 2
Source: FIRRI, survey data June 2002

70
There are approximately 27 fishing unit owners and 60 crewmembers. There are 27 Congo Barque boats at Somsio. There are no outboard motor engines used in fishing or transporting of people.
The main fish species landed is Alestes nurse with approximately 4,000 kgs landed per week, followed by Alestes baremose (3200 kgs), Hydrocynus (800 kgs) and then Nile perch (200 kgs) as shown in Table 6.3.
Table 6.3. Ranking of Species Landed at Somsio
Fish species Rank Qty. Landed per week (kg)
Alestes nurse 1 4,000
Alestes baremose 2 3,200
Hyrocynus 3 800
Nile perch 4 200
Source: FIRRI, survey data June 2002
6.2.2 Fishers’ Characteristics
Eleven fishers were interviewed at Somsio. All of them were males of ages between 24 and 50 years and had an average age of 38 years. Fishers were dominantly of the Alur tribe (91%), followed by Acholi (9%). All the interviewed fishers were married and most (82%) had primary level education followed by those who had no schooling (9%) and secondary level education (9%). Most fishers (55%) targeted Nile perch, followed by those who targeted Alestes baremose (36%) and tilapia (9%). Respondents had fished for an average of 12 years and had lived at Somsio for an average of 21 years. The average household size of fishers was 11 people. Most fishers (64%) had no alternative source of income. For those who had alternative sources of income, farming crops (18%) and trading (18%) were mentioned.

71
Figure 6.1: Main Fish Species Targeted by Fish Producers at Somsio
Source: FIRRI, Survey data June 2002
6.2.3 Inputs and Costs
Boat and outboard engines All fishers interviewed owned fishing boat. The boat type owned was the ‘Congo barque’ type. Boats had been owned for an average of 2 years. The average cost of the boat was Shs 155,100/=, with an average expected useful life of 3.6 years and having no salvage value at all.
Table 6.4: Information on Boat Types Owned at Somsio
Type Average period owned (Years)
Average cost price (Shs)
Average useful life (Years)
Congo barque 2 155,100 3.6
Source: FIRRI, survey data June 2002
None of the interviewed fishers at Somsio used an outboard motor engine to fish.
Fishing Gear Most fishers (82%) use gillnets followed by those who used boat seines (9%) and long lines (9%). Gillnets used at Somsio had an average mesh size 4.5 inches while
Tilapia9%
Alestes baremose
36%
Nile perch 55%

72
hooks used on long lines had an average size of 13.5 inches. The gillnets and hooks had been used for an average of 12 months, while boat seine and scoop nets had been used for 6 months. The average cost of gillnets was Shs. 7800, that of hooks on long lines was Shs 43, scoop net was Shs 2560 and boat seine was Shs 143,000. The average expected useful life for gillnets was reported to be 7 months, long lines was reported to be 12 scoop nets 6 and boat seine 14 months. There was no salvage value given for any gear.
Table 6.5: Information on Gear Types Owned
Type Percentage
No. Size Period used (Years)
Cost price (Shs)
Expected useful life (Months)
Salvage value (Shs)
Gillnets 82 16 3.5 4 9,200 16 0
Boat seines
9 1 - 7 880,000
15 0
Hooks on Long lines
9 600 12 12 50 24 0
Source: FIRRI, survey data June 2002
The majority of the gillnet fishers obtained their initial capital from fishing (67%) and farming (33%). All the boat seine fishers obtained their initial capital from farming while all the longline fishers obtained their initial capital from fishing. None of the fishers obtained the initial capital from credit.
Table 6.6: Number of Respondents Reporting the Different Sources of Initial Capital
Enterprise Source of initial capital Total
Fishing Farming Credit
Gillnets 6 (67%) 3 (33%) - 9 (100%)
Boat seines - 1 (100%) - 1 (100%)
Long lines 1 (100%) - - 1 (100%)
Source: FIRRI, survey data June 2002
Labour costs
All the interviewed fishers at Somsio employ crew on their fishing boats. The gill net fishers employed an average of 3 crew per fishing boat. The boat seine net fishers employed an average of 4 crew while the longline fishers employed an average of 3 crew. All fishers at Somsio paid their crew a percentage of revenue. Gillnets fishers worked for an average of 5 days per week and paid their crew an average of 40% of

73
daily revenue. Boat seine net fishers worked for an average of 5 days per week and paid their crew an average of 50% of daily revenue. The longline fishers operated for an average of 3 days per week and paid their crew an average of 45% of daily revenue.
Table 6.7: Number of Crews, Modes of Payment and Days Worked per Week
Enterprise Average no. of crew
Respondents employing % of revenue payment system
Average number of days worked (per week)
Amount paid (% of revenue)
Gillnets 3 9 (100%) 5 40%
Boat seines
4 1 (100%) 5 50%
Long lines 3 1 (100%) 3 45%
Source: FIRRI, survey data June 2002
Entrepreneurship
Fishers were asked to mention a minimum amount of money they would wish to ask for per month for managing their fishing enterprises. Only 8-gill net fishers were able to evaluate their entrepreneurship functions at Somsio. They mentioned an average valuation of Shs. 45,000 per month.
Other costs
Some of the costs met by fishers at Somsio include; baits bought by those who use long lines and maintenance of boats and gear. The boat seine net fishers did not have any other operational cost. The average cost spent on baits by longline fishers was Shs. 12,000 for the days fished in a month while gillnet fishers spent an average of Shs 2,500 and Shs 3,300 on maintenance of boats and gear per month respectively.
Perception of the resource base Most fishers (54%) assessed the level of catch as not good while the rest (36%) described it as good. Most fishers (50%) mentioned changes in seasons as the main reason as to why their level of catches were not good. Other mentioned ‘not enough fish in the lake (33%) and lack of capital (17%) as the reasons to why the levels of catch were not good.

74
Table 6.8: Assessment of the Resource Base at Somsio
Assessment Frequency Percentage
Good 4 36
Not good 7 54
Total 11 100
Source: FIRRI, survey data June 2002
The monthly production costs are summarised in Table 6.9:
Table 6.9: Monthly Summary of Production Costs
Long lines Gillnets Boat seines
Capital Investment 110,000 309,911 1,030,000
Boat maintenance -- 278 --
Gear maintenance -- 1,111 --
Engine maintenance -- -- --
Other costs -- -- --
Labour cost 56,781 377,366 93,700
Fuel cost -- -- --
Bait cost 12,000 -- --
Operating cost 68,781 378,755 93,700
Depreciation 2,722 4,995 7,667
Total monthly cost 71,503 383,749 101,367
Source: FIRRI, survey data June 2002

75
6.2.4 Earnings of the Production Enterprises The data on fish catches and prices were used to compute earnings for the different types of enterprises by species. The results show that gillnetters realized the highest net revenues in fishing Nile perch, followed by Alestes baremose and then tilapia. Net earnings of boat seiners and long liners were rather less (Table 6.10)
Table 6.10: Average Catches and Incomes of Fishers by Species
Long lines Gillnets Boat Seines
210.30 1,434.28 468.50
600 800 400
126,180 1,518,883 187,400
Nile perch
Catch (kg/month)
Price (Shs/kg)
Gross revenue (Shs)
Net revenue (Shs) 54,676 904,287 86,033
. 285.00 .
. 800 .
. 228,000 .
Nile tilapia
Catch (kg/month)
Price (Shs/kg)
Gross revenue (Shs)
Net revenue (Shs) . 126,875 .
. 427.00 .
. 1,225 .
. 546,800 .
Alestes baremose
Catch (kg/month)
Price (Shs/kg)
Gross revenue (Shs)
Net revenue (Shs) . 323,240 .
Source: FIRRI, survey data June 2002
Nile perch fishers sell their catch per head (50%), weighed in kilograms (33%) and in bundles (17%) and all tilapia fishers sell their catch by weighing it in kilograms. Other species such as Hydrocynus and Alestes baremose are sold in bundles (75%) or per head (25%). Most Nile perch fishers (83%) sell their catch to beach retailers and the rest (17%) sell it to bicycle traders. All tilapia fishers sell their catch to mostly to pick up traders. Other species such as Hydrocynus and Alestes baremose are sold mostly to beach consumers (75%) or pick-up traders (25%). All fishers interviewed at Somsio sell their catch at their beach. All fishers did not have any arrangement with the buyers.

76
6.3 Fish Processing Sub-sector 6.3.1 Overview There are no publicly owned facilities to support fish processing at Somsio . Sun-drying is the main fish processing method and followed by fish smoking. The main processed fish species is Alestes nurse, followed by Hydrocynus and Alestes baremose. There are approximately 7 smoking kilns and several drying grounds at Somsio.
6.3.2 Fish Processors Characteristics Eight processors were interviewed, most of whom were females (87.5%) and average age of 33. Majority were Alur (87.5%), and had primary education (75%). Their mean household size was 6 persons and they had lived at the beach for 17 years on average. Fish smoking and salting/ sun drying are the main methods of processing at Somsio and appear to be of equal importance as indicated by the equal representation of fish smokers and salters/ sun driers in the sample.
6.3.3 Fish Processing Inputs and Costs
The fish smokers entirely use low-technology ovens (smoking kilns), which are either privately owned (75%) or hired (25%). On the other hand, those who salt and sun dry fish spread their fish on privately owned drying racks.
Table 6.11: Distribution of Fish Processors by Type of Processing Facility and their Ownership Status
Facility Ownership Smoking Sun drying and Salting
Privately owned 75% --
Rented 25% --
Smoking kiln
Communally owned -- --
Privately owned -- 100%
Rented -- --
Drying racks
Communally owned --
Total 100.0% 100.0%
Source: FIRRI, survey data June 2002
Capital Owners of smoking kilns on the average invest Shs. 26,800 in the construction of the low-technology ovens. On the contrary, smokers who hire smoking kilns spend about Shs 4,000 each month. In comparison, owners of fish drying racks spend about Shs 17,500 towards the construction of each unit using local materials such as rids,

77
wooden poles and fibre. The majority of the fish processors obtained their ‘start-up’ capital from farming (59.1%), fishing (22.7%) and informal loans (4.5%).
Labour All the fish processing units were owner-operated. Owners of salting/ sun drying units on the average spend Shs 70,000 each month on labour or about 1.8 times higher than for fish smokers.
Other costs Fish smokers on the average spend Shs 17,500 each month on day-to-day purchase of fuel wood while salters/ sun driers spend roughly Shs 16,650 on salt
Table 6.12: Monthly Input Costs of Fish Processing Units by Method of Processing
Smoking Sun drying and Salting
Capital investment 26,833 4,750
Monthly rent for smoking kiln 4,000 --
Monthly fuel wood cost 17,500 --
Monthly salt cost -- 16,650
Monthly labour cost 42,000 70,000
Monthly transport cost -- --
Monthly operating costs 60,500 86,650
Monthly depreciation 298 --
Total monthly costs 60,798 86,650
Source: FIRRI, survey data June 2002
6.3.4 Processors’ Outputs and Incomes The fish processors of Somsio mainly process Hydrocynus (37.5%), Nile Tilapia (37.5%), Alestes barimose (12.5%) and Nile Perch (12.5%). The monthly quantities of fish processed, buying and selling prices, costs and revenues are presented in Table 13. The majority of the fish processors also sell their processed fish at various urban (25%) and rural markets (37.5%) while the remainder (37.5%) sell their fish to fish traders who operate at the landing.

78
Table 6.13: Costs and Revenues of Processors by Species
Nile perch
Tilapia Hydrocynus Alestes baremose
Quantities processed (kg/month) 353 204 267 140
Buying price (Shs/kg) 667 1,400 1,000 1,000
Selling price (Shs/kg) 1,000 1,900 1,500 1,500
Monthly cost of raw fish (Shs) 200,667 146,400 166,667 140,000
Monthly gross revenue (Shs) 320,000 192,000 250,000 210,000
Source: FIRRI, survey data June 2002
The fish processors of Somsio largely sell their fish at urban (66.7%), regional (25%) and neighbouring rural markets (8.3%). The fish smokers entirely sold their fish in urban markets whereas the salters/ sun driers exclusively sold their fish in regional markets in Congo.
6.4 Fish Marketing Sub-sectors 6.4.1 Overview Fish marketing at Somsio is facilitated by a relatively good access road. Somsio can also be accessed by water from the neighbouring beaches such as Butiaba, Nyamukuta, Kobolwa and Bugoigo.
There are approximately 13 beach-side retailers/processors and 2 bicycle traders. Fresh Nile perch is bought by bicycle traders who ferry it to the factory agents at the beaches of Bugoigo and Kabolwa while fresh tilapia, Alestes baremose and Hydrocynus are mainly sold at the beach to processors although some is taken away by bicycle traders. Processed Alestes nurse and other species are sold in Panyimur in Nebbi District.
Table 6.14. Main Destinations of Fish Species and Product Forms
Fish species Main destinations
Fresh Processed
Nile perch To factory trucks at Bugoigo and Kabolwa
Panyimur
Tilapia Beach Panyimur
Alestes baremose Beach Panyimur
Hydrocynus Beach Panyimur
Alestes nurse Panyimur
Source: FIRRI, survey data June 2002

79
The average prices of fresh fish per kg for the various fish species landed at Somsio are given below.
Table 6.15. Fresh Fish Prices by Species
Fish species Prices (Shs/kg)
Nile perch 800
Alestes baremose 500
Hydrocynus 500
Alestes nurse 250
Source: FIRRI, survey data June 2002
6.5 Fish Consumption
6.5.1 Consumers’ characteristics
There were 24 fish consumers interviewed at Somsio. They had an average age of 35 years and 71% were male while 29% were females. They were dominantly Alur (88%), followed by Acholi (8%) and other tribes (4%). Most consumers (88%) were married and most (75%) had attained primary level education followed by those who had no schooling (12.5%) and secondary level education (12.5%). The average household size of fish consumers at Somsio was 6 family members and the respondent had lived at Somsio for an average of 18 years.
6.5.2 Consumption Levels and Trends A large proportion of fish consumers (42%) at Somsio commonly ate Alestes baremose followed by Nile perch (33%), Tilapia (21%) and Hydrocynus (4%).
Table 6.16: Commonly Consumed Fish Species at Somsio by Type of Consumer
Sub-sectors
Nile perch Tilapia Hydrocynus Alestes Baremose
Total
Consumers not engaged in fishery activity
40% 40% - 20% 100%
Consumers engaged in fish production
36.4% 9.1% - 54.5% 100%
Consumers engaged in fish processing
25% 25% 12.5% 37.5% 100%
All respondents 33% 21% 4% 42% 100%
Source: FIRRI, survey data June 2002

80
Quantities consumed
The average daily quantity consumed by Somsio respondents was 2.38 kgs and this ranged between 0.5 to 5 kgs. However, this varied between sub-sectors as given in Table 6.17.
Table 6.17: Quantities of Fish Consumed at Somsio by Type of Consumer (kg/day)
Sub-sectors Maximum Minimum Mean
Consumers not engaged in fishery activity
3 0.5 1.2
Consumers engaged in fish production
5 1 2.9
Consumers engaged in fish processing
5 0.7 2.4
Total of whole beach 5 0.5 2.4
Source: FIRRI, survey data 2002
Consumers were asked whether or not there had been a change over the years in the quantities of fish eaten. Most consumers (63%) agreed that there was a change, while only (37%) did not agree. Most of those who recognised the change (87%) said that the quantities consumed by their families had decreased. Only 13% said that the quantities had increased.
Frequency of fish consumption
On average consumers at Somsio ate fish 3.83 times a week and this ranged between 2 to 7 times. However, this varied between sub-sectors as given in Table 6.18.
Table 6.18: Average Number of Times Fish is Consumed in a Week at Somsio by Type of Consumer
Sub-sectors Maximum Minimum Mean
Consumers not engaged in fishery activity 7 2 4.4
Consumers engaged in fish production 7 2 3.8
Consumers engaged in fish processing 7 1 3.5
All respondents 7 1 3.8
Source: FIRRI, survey data June 2002

81
Consumers were asked whether or not the frequency of fish consumption had changed over the past year. 50% of the respondent agreed that there had been a change in the frequency of fish consumption at Somsio and an equal proportion did not agree. For those who agreed that frequency in consumption had changed, all of them said it had reduced.
Size of fish for consumption
Consumers were asked whether or not the sizes of fish they ate with their families had changed over the past year. 50% of the respondents agreed to this and an equal proportion did not agreed. Most respondents (83%) said that the sizes had decreased but 16% said the sizes had increased.
Table 6.19: Respondents Reporting Reduction in Sizes of Fish for Consumption at Somsio
Fish species Yes No Total
Nile perch 63% 37% 100%
Tilapia 60% 40% 100%
Hydrocynus - 100% 100%
Alestes baremose 40% 60% 100%
All species 50% 50% 100%
Source: FIRRI, survey data June 2002
Substitutes for fish
A majority of respondents (88%) mentioned beans as the main substitute to fish, followed by vegetables and then other food items (Table 6.20)
Table 6.20: Main Substitutes to Fish at Somsio
Substitutes Count Percentage
Beans 21 88
Meat - -
Vegetables 2 8
Chicken - -
Other 1 4
Total 24 100
Source: FIRRI, survey data June 2002

82
6.5.3 Price Levels and Trends
Most respondents (57%) did not usually buy the fish they ate with their families while 43% did. Unlike all respondents engaged in fish production who did not buy the fish they ate, most consumers not engaged in fishery activity (60%) and all consumers engaged in fish processing usually bought the fish they ate with their families. For those who bought fish, the average price mentioned was Shs 972 and it ranged between Shs. 800 – 1,200. The average prices are given in Table 6.21.
Table 6.21: Prices of Fish Species for Consumption at Somsio (Shs)
Fish species Maximum Minimum Mean
Nile perch 1,000 800 900
Tilapia 1,200 800 975
Hydrocynus 1,000 1,000 1,000
Alestes baremose 1,000 1,000 1,000
All species 1,200 800 972
Source: FIRRI, survey data 2002
Consumers were asked whether or not the prices of fish for consumption had changed over the past year. Most respondents (83%) said it did and most of these (93%) said it had increased.
6.6 Community Perceptions towards Chilled Transport Facilities Although there were no factory trucks at Somsui, consumers where able to associate factory trucks with some positive changes to any beach community where they existed. Most fishers (57%) said it could lead to increased incomes of fishers, followed by ready market for fish (4%) and increased employment opportunities (4%). Some consumers (35%) did not know any positive change they would associate with factory trucks.
A large proportion of consumers (46%) did not associate any negative impact with factory trucks. However, some negative impacts mentioned were reduced fish supplies to local traders/ processors and consumers (27%) and high price of fresh fish (27%).

83
7 BIKUNYU LANDING SITE 7.1 Background Bikunyu Landing Site, located in Kiganja Parish, Kigorobya Sub-county in Hoima District was selected as a beach were no chilled transport facilities operate but may become available during the project’s life. The population of the beach is approximately 300 people. The main economic activities at the beach and around are fishing and animal keeping.
Hoima District lies on the Western side of Lake Albert, covering approximately 75% of the shoreline on the Ugandan side. There are approximately 2,652 fishermen and 1400 boats in the district. Approximately 17,399.1 metric tonnes were landed at beaches in Hoima in 2001.
The rates below have been charged for the various fishery activities and vessels (Table 3.1). The specific licence for trucks in the new instrument (The fishing (Amendment) Rules, 2001) is not being implemented because of the impediment by the escarpment to access beaches directly.
Table 7.1: Rates Charged on Fishery Activities and Fishing Vessels.
Item Old rates (Shs)
Fishing vessel licence 10,000
Fishing licence No charge
Fish monger’s licence operating No charge
Processing permit No charge
Source: FIRRI, survey data June 2002
Chilled transport facilities arrived in Hoima District in August 2001 and begun operating at Kabolwa by October 2001. The trucks are parked at trading centres nearest to the beaches. These towns are Buseruka (2 trucks), Kaseta (one truck) and Kyangwali (2 trucks). Three trucks are also parked at the nearest accessible point to Runga Landing Site. In total there are seven trucks operating in Hoima District coming from Ngege Ltd, Hwan Sung Fishing Industry and Uganda Fish Packers. On average each truck buys approximately 3 tons per week.
Before the arrival of chilled transport facilities, the price of a Kilogram of Nile perch was Shs 250, however, this increased tremendously to the present rate which is Shs 1,100 per Kg. This has tremendously raised the incomes of fishers, increased employment opportunities at beaches. The Factory truck traders also offer fishing inputs to fishers.
In light of the new development that had come to the District, the DFO called a conference of fishers and other stakeholders in March 2001 to sensitise them on improved fish handling and use of good gear to target Nile perch. Kigorobya Sub-county has graded the road up to the nearest accessible point to Runga Landing Site. There are plans to grade the road up to Runga and eventually to other beaches such as Bikunyu and Kibiro. Shs 4.6 million under the Poverty Action Fund (PAF)

84
funds have been set aside to construct fish handling facilities at three beaches that are yet to be identified.
The local processors, traders and consumers have raised complaints because of the raise in prices of Nile perch and subsequently other species of fish. There has been an increase in the targeting of juvenile fish that has ready market from the local processors, traders and local consumers.
The district authorities have responded to some of the problems above by sensitising the fishers against the use of illegal gears and encouraging local traders and producers to deal in other species. Under the Poverty Action Funds, there are plans to assist farmers to invest in aquaculture.
7.1.1 Infrastructure and Facilities at Bikunyu Very limited facilities are available at Bikunyu, as indicated by Table 7.2:
Table 7.2. Infrastructure and Facilities at Bikunyu
Infrastructure and facilities
Number Description
Retail shops 2 Mainly dealing in general merchandise
Food kiosks 3 Dealing in local dishes such as Cassava and fish, millet bread and meat
Source: FIRRI, survey data June 2002
7.2 Fish Production Sub-sector 7.2.1 Overview There are no public facilities to support fish production such as boat yards and fish handling facilities found at Bikunyu. The main type of fishery at Bikunyu is gillnetting with approximately 40 fishers. Kaganga (20 people) and then long lining (5 persons) follow as shown in Table 7.3
Table 7.3. Ranking of Production Enterprises by Number at Bikunyu Landing Site
Category of fisher Rank Number
Gill nets 1 40
Kaganga 2 20
Long lining 3 5
Source: Survey data June 2002

85
There are approximately 32 fishing unit owners and 60 crew. There are 32 Congo barque boats at Bikunyu. There are neither fishing nor transport boats with outboard motor engines at Bikunyu.
The main fish species landed is tilapia with approximately 1400 Kgs landed per week. This is followed by N. bredoi (1000 kgs), Nile perch (200 kgs), Hydrocynus (140 kgs)
7.2.2 Fishers’ Characteristics
Twenty-five fish producers were interviewed at Bikunyu. All of them were males of ages between 17 and 62 years and had an average age of 40 years. They were dominantly of the Alur tribe (36%), followed by Banyoro (32%), and the Bagungu (28%). Most fishers (92%) were married and most (64%) had attained primary level education followed by those who had secondary level education (32%). A large proportion of fishers (36%) targeted Nile perch, followed by those who targeted tilapia (28%) and N. bredoi (20%). Other species targeted included Alestes baremose (8%), Hydrocynus (4%) and Bagrus spp (4%). Respondents had fished for an average of 12 years and had stayed at Bikunyu for an average of 7 years. The average household size of fishers was 8 people. Their main alternative sources of income were crop farming (68%) and livestock keeping (8%). Some fishers (24%) had no alternative source of income. Figure 7.1: Main Fish Species Targeted by Fish Producers at Bikunyu
Source: FIRRI, survey data 2002
Nile perch 36%
Tilapia28%
Other16%
N. Bredoi20%

86
7.2.3 Fishing Inputs and Costs
Boats and outboard engines Of the interviewed fishers, 52% owned boats while 48% hired the boats they used for fishing. Fishers who hired fishing boats spent an average of Shs. 18,000/= per month. However, this ranged between Shs 15,000 to Shs 40,000/= per month. The boat type either rented or owned was the Congo barque type. Boats had been owned for an average of 4 years. The average cost of the boat was U. Shs 87,000/=, with an average expected useful life of 4 years and an average salvage value of Shs 4200/=. The salvage value ranged between 0 to Shs 25,000/=.
Table 7.4: Information on Boats Owned at Bikunyu
Boat type
Average no. of years of ownership
Average cost price (Shs)
Average expected useful life (Years)
Average salvage value (Shs)
Congo barque
4
87,000 4 4,200
Source: FIRRI, survey data 2002
None of the interviewed fishers at Bikunyu used an outboard motor engine to fish.
Fishing gears Most fishers (68%) used gillnets followed by those who used boat seines (12%), scoop nets (12%) and long lines (8%). Gillnets used at Bikunyu had an average mesh size 4.5 inches while hooks used on long lines had an average size of 13.5 inches. The gillnets and hooks had been used for an average of 12 months, while boat seine and scoop nets had been used for 6 months. The average cost of gillnets was Shs. 7800, that of hooks on long lines was Shs 43, scoop net was Shs 2560 and boat seine was Shs 143,000. The average expected useful life for gillnets was reported to be 7 months, long lines was reported to be 12 scoop nets 6 and boat seine 14 months. There was no salvage value given for any gear.

87
Table 7.5: Summary Information on Gear Types
Gear type Percentage No. Size Period used (Years)
Cost price (Shs)
Expected useful life (Months)
Salvage value (Shs)
Gillnets 68 19 4.5 12 7800 7 0.0
Boat seines
12 1 6 143,000 14 0.0
Scoop nets
12 1 6 2560 6 0.0
Hooks on Long lines
8 1700 13.5 12 43 12 0.0
Source: FIRRI, survey data 2002
The majority of the gillnet fishers obtained their initial capital from farming (65%) and fishing (35%). The majority of the boat seine fishers obtained their initial capital from fishing (67%). and credit (33%). The majority of the scoop net fishers obtained their initial capital from farming (67%) and credit (33%) while the longline fishers obtained their initial capital from farming (50%) and fishing (50%).
Table 7.6: Number of Respondents Reporting the Different Sources of Initial Capital
Enterprise Source of initial capital Total
Fishing Farming Credit
Gillnets 6 (35%) 11 (65%) - 17 (100%)
Boat seines 2 (67%) - 1 (33%) 3 (100%)
Scoop nets - 2 (67%) 1 (33%) 3 (100%)
Long lines 1 (50%) 1 (50%) - 2 (100%)
Source: FIRRI, survey data 2002 Labour costs
Twenty-four of the twenty-five fishers at Bikunyu employ crew on their fishing boats. The gill net fishers employed an average of 2 crewmembers per fishing boat. The boat seine net fishers employed an average of 3 crewmembers. The scoop net fishers employed an average of 1 crew per fishing while the longline fishers employed an average of 4 crew. Most gill net fishers (94%) paid their crew a percentage of revenue and the remaining (6%) paid a percentage of net revenue. Most boat seine net fishers (67%) paid a percentage of net revenue and the rest (6%) paid a percentage of revenue. All Scoop net fishers paid a percentage of net while all longline fishers paid their crew a percentage of revenue. Gillnets fishers worked for an average of 5 days per week and paid their crew an average of 33.5%

88
of either revenue or net revenue. Boat seine net fishers worked for an average of 4 days per week and paid their crew an average of 43% of either revenue or net revenue. The scoop net and longline fishers operated for an average of 6 and 4 days per week respectively. Scoop net fishers paid their crew an average 40 percent of net revenue while longline fishers paid their crew an average of 41% of their revenue.
Table 7.7: Information on the Crew and Modes of Payment
Enterprise Average no. of crew
Crew payment as percentage of revenue
Average number of days worked per week
Amount paid (% of revenue or net revenue)
Total
Gillnets 2 15 (94%) 5 33.5% 16 (100%)
Boat seines 3 1 (33%) 4 43% 3 (100%)
Scoop nets 1 - 6 40% 3 (100%)
Long lines 4 2 (100%) 4 41% 2 (100%)
Source: FIRRI, survey data 2002
Entrepreneurship
Fishers were asked to mention a minimum amount of money they would wish to ask for per month for managing their fishing enterprises. Seventeen fishers out of the twenty-five were able to evaluate their entrepreneurship functions at Bikunyu. Gillnet fishers gave an average valuation of Shs. 23,000. Boat seine fishers gave an average valuation of Shs. 13,000. Scoop net fishers mentioned an average valuation of Shs. 41,600 while longline fishers mentioned Shs. 10,000.
Table 7.8: Valuation of Entrepreneurship by Type of Enterprise
Enterprise Average monthly value (Shs)
Gillnets 23,000
Boat seines 13,300
Scoop nets 41,600
Long lines 10,000
Source: FIRRI, survey data 2002
Other costs
Fish producers at Bikunyu were also able to mention other operational costs they met and these included; fuel used in lamps when targeting N. bredoi at night, baits bought by those who use long lines and maintenance of boats and gear. Maintenance of boats is Shs 7,750 and maintenance of gear is Shs 9,500 per month.

89
Table 7.9: Other Operational Costs in a Fishing Enterprise at Bikunyu (Shs/month)
Enterprise Maintenance of boat Maintenance of gear
Gillnets 6,500 11,000
Boat seines 10,000 5,000
Scoop nets - -
Long lines 8,000 8,000
Source: FIRRI, survey data 2002 Perception of the resource base
Most fishers (92%) at Bikunyu assessed the level of catch as not good while the rest (8%) perceived it as good. Most fishers (50%) mentioned changes in seasons as the main reason as to why their level of catch was not good. Others mentioned ‘not enough fish in the lake (23%), lack of capital (23%) and ‘too many competitors’ (6%) among others.
Table 7.10: Assessment of the Resource Base at Bikunyu
Assessment
Frequency Percentage
Good 2 8
Not good 23 92
Total 25 100
Source: FIRRI, survey data June 2002

90
A summary of the monthly production costs is given in table 7.11:
Table 7.11: Monthly Summary of Production Costs
Long lines Gillnets Boat seines Scoop nets
Capital Investment 162,400 166,741 160,000 6,833
Boat maintenance 4,000 765 3,333 --
Gear maintenance 4,000 2,588 1,667 --
Engine maintenance
-- -- -- --
Other costs -- -- -- --
Labour cost 94,502 79,109 99,082 .
Fuel cost . . . 40,000
Bait cost 35,000 . . .
Operating cost 151,072 77,808 82,093 13,333
Depreciation 5,867 5,296 1,182 250
Total monthly cost 81,403 83,105 83,276 13,583
Source: FIRRI, survey data June 2002
7.24 Earnings of the Production Enterprises
Net earnings of the different enterprises were calculated. The results showed that boat seining for tilapia yielded the highest net revenues, followed by gillnetting for Nile perch and long lining for the Nile perch. The information is provided in table 7.12.

91
Table 7.12: Average Catches and Incomes of Fishers by Species
Long lines Gillnets
Boat Seines
363.55 393.08 --
650 692 --
236,685 288,144 --
Nile perch
Catch (kg/month)
Price (Shs/kg)
Gross revenue (Shs)
Net revenue (Shs) 155,282 181,098 --
-- 385.71 826.00
-- 629 700
-- 228,829 578,200
Nile tilapia
Catch (kg/month)
Price (Shs)/kg
Gross revenue (Shs)
Net revenue (Shs) -- 135,005 330,803
-- 116.50 --
-- 575 --
-- 68,700 --
Bagrus bayad
Catch (kg/month)
Price (Shs/kg)
Gross revenue (Shs)
Net revenue (Shs) -- 77,387 --
-- 146.80 --
-- 600 --
-- 88,080 --
Hydrocynus
Catch (kg/month)
Price (Shs/kg
Gross revenue (Shs)
Net revenue (Shs) -- 52,403 --
-- 118.00 --
-- 525 --
-- 70,000 --
Alestes baremose
Catch (kg/month)
Price (Shs/kg
Gross revenue (Shs)
Net revenue (Shs) -- 37,926 --
Source: FIRRI, survey data June 2002
Nile perch fishers sell their catch in kilograms (33.3%), in bundles (33.3%) and per head (33.3%). All tilapia is sold in bundles and N. bredoi in troughs/basins. Other species such as Hydrocynus and Alestes baremose are sold in bundles (50%) or per head (50%). Fifty percent of the fishers sell their Nile perch catch to bicycle traders and an equal percentage sell it to beach retailers. All fishers interviewed at Bikunyu sell their catch at their beach. Most fishers (92%) did not have any arrangement with

92
the buyers. Only a few fisher (8%) had any arrangement such as ‘buyer provides money’ (4%) or buyer provides fishing inputs (4%).
7.3 Fish Processing Sub-sector 7.3.1 Overview There are no publicly owned facilities to support fish processing at Bikunyu. There are 3 privately owned smoking kilns and several drying grounds for N. bredoi. Sun-drying is the main fish processing method with approximately 20 people involved in it, followed by smoking, with 5 people involved. N. bredoi, followed by tilapia are the main processed fish species. N. bredoi is sun-dried while tilapia is smoked.
7.4 Fish Marketing Sub-sector 7.4.1 Overview Bikunyu can be easily accessed by water from the neighbouring beaches such as Runga. Bikunya is approximately 4 kms from Runga. However, the path is poor and most traders use bicycles from Runga while some from Kigorobya access the landing site on foot down the escarpment. There are plans to grade a road up to Bukunyu through Runga.
There are 10 traders who operate at Bikunyu sometimes on foot or using bicycles. The main destination of fresh and processed tilapia, Nile perch, Hydrocynus and Alestes baremose is Kigorobya Trading Centre while processed N. bredoi goes to Kampala (Table 7.13).
Table 7.13: Main Destinations of Fish Species and Product Forms
Fish species Main destinations
Fresh Processed
N. bredoi -- Kampala
Tilapia Kigorobya Trading centre Kigorobya Trading Centre
Alestes Baremose Kigorobya Trading centre Kigorobya Trading Centre
Nile perch Kigorobya Trading centre Kigorobya Trading Centre
Hydrocynus Kigorobya Trading centre Kigorobya Trading Centre
Source: FIRRI, survey data June 2002
The average prices of fresh fish per kg for the various fish species landed at Bikunyu are given below (Table 7.14).
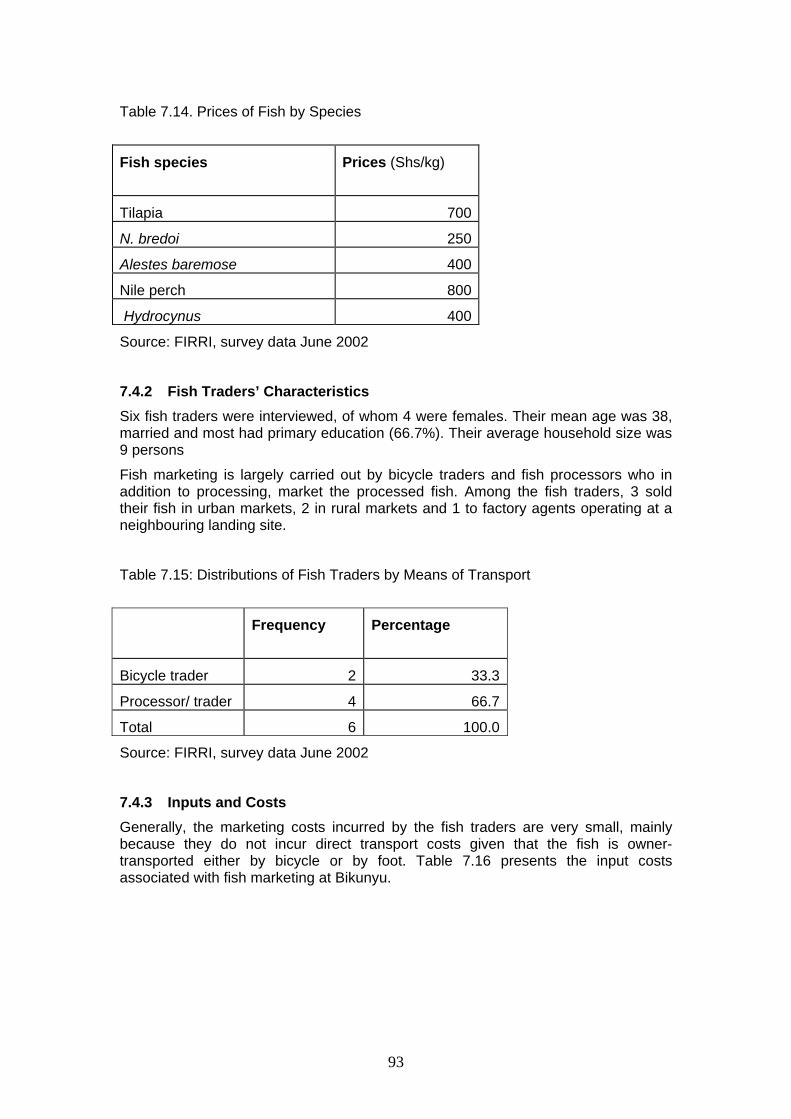
93
Table 7.14. Prices of Fish by Species
Fish species Prices (Shs/kg)
Tilapia 700
N. bredoi 250
Alestes baremose 400
Nile perch 800
Hydrocynus 400
Source: FIRRI, survey data June 2002
7.4.2 Fish Traders’ Characteristics Six fish traders were interviewed, of whom 4 were females. Their mean age was 38, married and most had primary education (66.7%). Their average household size was 9 persons
Fish marketing is largely carried out by bicycle traders and fish processors who in addition to processing, market the processed fish. Among the fish traders, 3 sold their fish in urban markets, 2 in rural markets and 1 to factory agents operating at a neighbouring landing site.
Table 7.15: Distributions of Fish Traders by Means of Transport
Frequency Percentage
Bicycle trader 2 33.3
Processor/ trader 4 66.7
Total 6 100.0
Source: FIRRI, survey data June 2002
7.4.3 Inputs and Costs Generally, the marketing costs incurred by the fish traders are very small, mainly because they do not incur direct transport costs given that the fish is owner-transported either by bicycle or by foot. Table 7.16 presents the input costs associated with fish marketing at Bikunyu.

94
Table 7.16: Mean Input Costs of Fish Trading Units by Type of Trader
Bicycle trader
Processor/ trade
Capital Investment 76,000 .
Labour cost (Shs/month) 23,000 34,000
Operating cost (Shs/month) 23,000 34,000
Depreciation 778 .
Total monthly cost 23,778 34,000
Source: FIRRI, survey data June 2002
7.4.4 Outputs and Incomes
Respondents reported trading mostly in Nile tilapia (3) and Nile perch (3. Table 7.18 presents the quantities traded, buying and selling prices, cost of raw fish and gross revenues.
Table 7.17: Average Cost of Raw Fish and Revenues of Fish Traders by Species and Type of Trader
Bicycle trader Processor/ trader
1,260 1,200
550 1,000
1,250 2,000
750,000 1,200,000
1,290,000 2,400,000
Nile Perch
Quantity traded (kg/ month)
Buying price (Shs/kg
Selling price (Shs/kg
Cost of fish (Shs/month)
Gross revenue (Shs/month)
Net revenue (Shs/month) 516,222 1,140,000
160 1,600
500 500
1,500 1,000
80,000 800,000
240,000 1,600,000
Nile Tilapia
Quantity traded (kg/ month)
Buying price (Shs/kg
Selling price (Shs/kg
Cost of fish (Shs/month)
Gross revenue (Shs/month)
Net revenue (Shs/month) 143,111 790,000
3,100
Other species Quantity traded (kg/ month)
Buying price (Shs/kg 215

95
265
579,000
784,000
Selling price (Shs/kg
Cost of fish (Shs/month)
Gross revenue (Shs/month)
Net revenue (Shs/month) 172,000
Source: FIRRI, survey data June 2002
7.5 Fish Consumption
7.5.1 Consumers’ characteristics
There were 38 fish consumers interviewed at Bikunyu. They had an average age of 40 years and 87% were male while 13% were females. They were dominantly Alur (37%), followed by Banyoro (34%), Bagungu (24%) and other tribes (5%). Most consumers (76%) were married and most (63%) had attained primary level education followed by those who had secondary level education (29%). The average household size of fish consumers at Bikunyu was 6 family members and the respondent had lived at Bikunyu for an average of 6 years. 7.5.2 Consumption Levels and Trends A large proportion of fish consumers (55%) at Bikunyu commonly ate Tilapia, followed by Nile perch (32%), Hydrocynus (5%),Alestes baremose (5%) and Bagrus spp (3%).
Table 7.18: Commonly Consumed Fish Species at Bikunyu by Type of Consumer
Sub sectors
Nile perch
Tilapia Hydrocynus Alestes Baremose
Bagrus Spp
Total
Consumers not engaged in fishery activity
33.3% 66.7% - - - 100%
Consumers engaged in fish production
32% 48% 8% 8% 4% 100%
Consumers engaged in fish processing
100% - - - - 100%
Consumers engaged in fish trading
16.7% 83.3% - - - 100%
All respondents 32% 55% 5% 5% 3% 100%
Source: FIRRI, survey data 2002
Quantities consumed The average daily quantity consumed by Bikunyu respondents was 2.35 kgs and this ranged between 0.25 to 6 kgs. However, this varied between sub-sectors as given in Table 7.19

96
Table 7.19: Quantities of Fish Consumed at Bikunyu by Type of Consumer (kg/day
Sub-sectors Maximum Minimum Mean
Consumers not engaged in fishery activity
3 0.5 1.4
Consumers engaged in fish production
6 0.3 2.5
Consumers engaged in fish processing
2 2.0 2.0
Consumers engaged in fish trading 4 2.0 2.7
All respondents 6 0.3 2.4
Source: FIRRI, survey data 2002
Consumers were asked whether or not there had been a change over the years in the quantities of fish eaten. 50% of the consumers agreed that there was a change and an equal proportion (50%) disagreed. Most of those who recognised the change (83%) said that the quantities consumed by their families had decreased. Only 17% said that the quantities had increased.
Frequency of fish consumption
On average consumers at Bikunyu ate fish 5.13 times a week and this ranged between 2 to 7 times. However, this varied between sub-sectors as given in Table 7.20.
Table 7.20: Average Number of Times Fish is consumed in a Week at Bikunyu by Type of Consumer
Sub-sectors Maximum Minimum Mean
Consumers not engaged in fishery activity 7 3 6
Consumers engaged in fish production 7 2 5
Consumers engaged in fish processing 2 2 2
Consumers engaged in fish trading 7 2 5
All respondents 7 2 5
Source: FIRRI, survey data June 2002
Consumers were asked whether or not the frequency of fish consumption had changed over the past year. Most consumers (69%) did not agree that there had been a change in the frequency of fish consumption at Bikunyu. The few (31%) who

97
agreed that frequency in consumption had changed, 91% said it had reduced. Some (9%), however, said it had increased.
Size of fish for consumption
Consumers were asked whether or not the sizes of fish they ate with their families had changed over the past year. 50% of the respondents agreed to this and an equal proportion did not agreed. Most consumers (79%) said that the sizes had decreased but 21% said they had increased (Table 7.21).
Table 7.21: Respondents Reporting Reduction in Sizes of Fish for Consumption at Bikunyu
Fish species Yes No Total
Nile perch 67 33 100%
Tilapia 38 62 100%
Hydrocynus 50 50 100%
Alestes baremose 50 50 100%
Bagrus spp 100 - 100%
All species 50 50 100%
Source: FIRRI, survey data June 2002
Substitutes for fish
A majority of respondents (84%) mentioned beans as the main substitute to fish, followed by vegetables and meat (Table 7.22).
Table 7.22: Main Substitute to Fish at Bikunyu
Substitutes Count Percentage
Beans 32 84
Meat 1 3
Vegetables 1 3
Chicken - -
Other 4 10
Total 28 100
Source: FIRRI, survey data June 2002

98
7.5.3 Pricing Levels and Trends Most respondents (52%) did not usually buy the fish they ate with their families while 48% did. Unlike most respondents engaged in fish production (58%) who did not buy the fish they ate, 50% of consumers not engaged in fishery activity, all consumers engaged in fish processing as well as most consumers engaged in fish trading (67%) usually bought the fish they ate with their families. For those who bought fish, the average price mentioned was Shs 777 and it ranged between Shs. 300 – 1,500, as given in Table 7.23.
Table 7.23: Prices of Fish Species for Consumption at Bikunyu (Shs)
Fish species Maximum Minimum Mean
Nile perch 900 700 750
Tilapia 1,500 500 841
Hydrocynus 600 600 600
Alestes baremose 300 300 300
All species 1,500 300 777
Source: FIRRI, survey data June 2002
Consumers were asked whether or not the prices of fish for consumption had changed over the past year. Most respondents (68%) said it had increased.
7.6 Community Perceptions Towards Chilled Transport Facilities Although there were no factory trucks at Bikunyu, consumers where able to associate factory trucks with some positive changes to a beach community where they existed. Most fishers (57%) said it could lead to increased incomes of fishers, followed by ready market for fish (25%). Some respondents (14%), however, did not know any positive change they would associate with factory trucks. However, the major negative impacts mentioned by a large proportion of consumers were reduced fish supplies to local traders/ processors and consumers (30%), and high price of fresh fish (25%). A proportion of consumers (45%) did not associate any negative impact with factory trucks.

99
BIBLIOGRAPHY
Abila, R.O. and E.G. Jansen, 1997: From local to global markets: the fish processing and exporting industry on the Kenyan part of Lake Victoria - its structure, strategies and socio-economic impacts; Imprint: Centre for Development and the Environment. University of Oslo, Oslo.
Amann, V.F., D.G.R. Belshaw and J.P.Stanfield. 1972: Nutrition and food in an African economy. Department of Rural Economy, Makerere University, Kampala. Uganda.
Cadwallar; D. A and J. Stoneman. 1966. Review of the Fisheries of the Uganda Waters of Lake Albert. Supplementary publication No. 3. East African Fresh water Fisheries Research Organisation.
Carney D, 1998: Implementing the sustainable rural livelihood approach. In Carney D. Sustainable rural livelihoods. What contribution can we make? Papers presented at the Department for International Development’s Natural Resources Advisors’ Conference, July 1998. DFID.
Chambers, R. 1983: Rural development: Putting the last first, Harlow: Longman.
Coenen; E.J. 1991.Operational visit to the project fisheries regions of Lakes Edward/George and Albert 14-19 January 1991: Account of activities and observations. FISHING Project UGA/87/007, BIOSTAT RPT 17, January 1991.
EPRC, 1999: Environmental impacts of trade liberalization and policies for the sustainable management of natural resources: a case study on Uganda’s fisheries sector. UNEP. United Nations. New York and Geneva.
Le Sann, A, 1998: A livelihood from fishing: Globalization and sustainable fisheries policies. Intermediate Technology Publications.
LVEMP, 1995: Lake Victoria Environmental Management Project . Proposal for Review. Script.
LVEMP, 2000a: “Ending Fishermen’s Poverty”: Report of the Stakeholders’ Workshop for Kalangala, Masaka and Rakai Districts: Ssese Island Beach Hotel, Kalangala 2-3 May, 2000: Socio-Economics Sub-Component, Lake Victoria Environment Management Project: NARO – FIRRI.
MFPED, 2000: Uganda participatory poverty assessment process: Kalangala District Report.
MFPED, 2001: Background to the Budget, 2001/02. (Enhancing Economic Growth and Structural Transformation).
Namisi; P. W. 2000. Socio-economic Implication of the fish export trade on the fishers and fisheries of Lake Victoria in Uganda. Unpublished Masters Degree Thesis submitted to National University of Ireland, Cork.
Odongkara, K. O. 2001. Poverty in the fisheries: A framework for analysis and intervention for Lake Victoria, Uganda. Unpublished Ph.D thesis. University of Hull, UK.
Odongkara, O.K., 1999: Commercialisation of the fisheries of Lake Victoria; opportunity for greater food security. In: Proceedings of the IUCN Workshop on ‘The Lake Victoria Fisheries and Food Security; Consequences for Security and Sustainability.’ IUCN Eastern Africa Regional Programme, IUCN. Nairobi.

100
SEDAWOG (Socio-Economic Data Working Group) 1999: Report of the marketing study. LVFRP Technical Document No. 2. LVFRP/TECH/99/02 (1999).
SEDAWOG, 1999: Marketing study. LVFRP Technical Document No. 2. LVFRP.TECH/99/02.
World Bank, 2001: World development report 2000/2001. Attacking poverty: Oxford University Press.

101
Appendix 1: PRINCIPAL PERSONS MET
Name Designation
Mr. Nsamba David DFO, Nakasongola
Mr. Ogwang D. C DFO, Apac
Mr. Musenero Richard DFO, Kamuli
Mr. Baguma Richard DFO, Masindi
Mr. Rugadya Richard DFO, Hoima
Mr. Twesigye Bosco AFO, Kansiira
Mr. Adoko Jimmy AFO, Wansolo
Mr. Owori George AFO, Irimeria
Mr. Sande Samuel Centre Master, Bikunyu landing site
Mr. Adubango Festo Chairman LC1, Kabolwa landing site
Mr. Azaria Weli Centre Master, Somsui landing site

102
Appendix 2a: INFORMATION FROM THE DISTRICT FISHERIES OFFICERS
A. Statistics for the District for the Last One Year
Species Tonnes Values
1) Nile perch
2) Tilapia
3) Mukene
4) Hyrocynus-
5) Alestes-baremose
6) Alestes nurse
7) Bagrus
8) Protopterus
9) Others
B. Statistics for the Selected Beach for the Last One Year
Species Tones Values
10) Nile perch
11) Tilapia
12) Mukene
13) Hyrocynus-
14) Alestes-baremose
15) Alestee nurse
16) Bagrus
17) Protopterus
18) Others
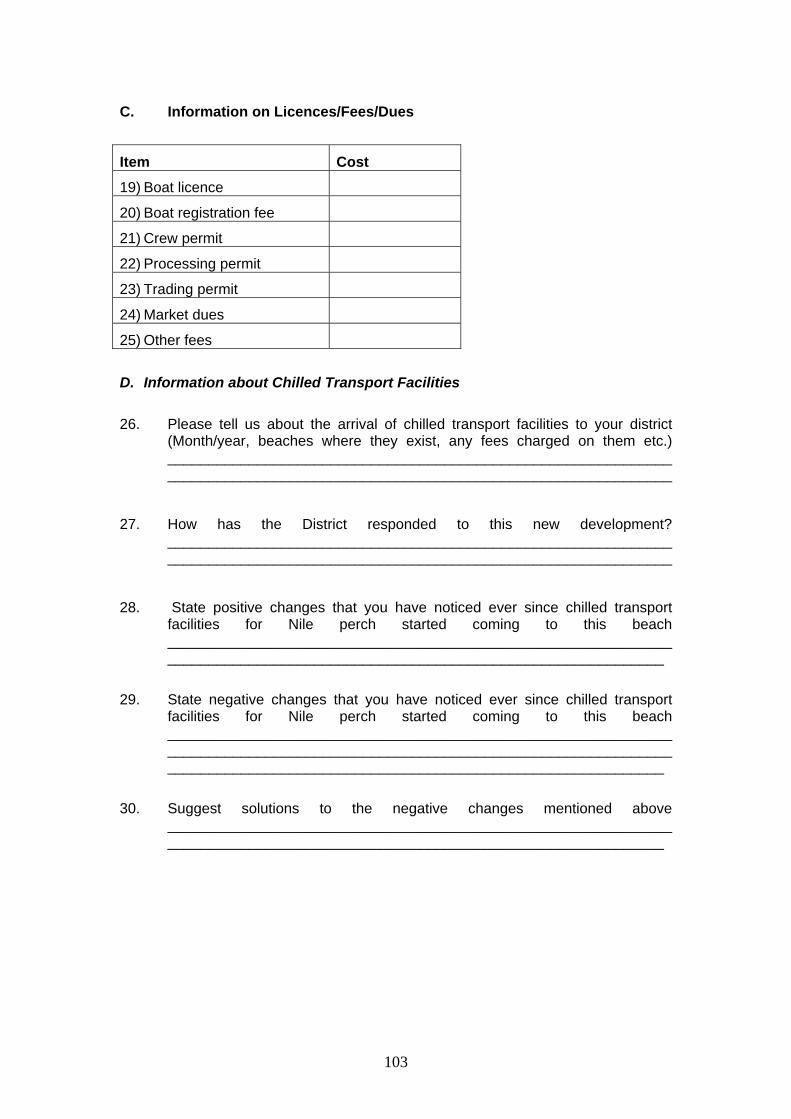
103
C. Information on Licences/Fees/Dues
Item Cost
19) Boat licence
20) Boat registration fee
21) Crew permit
22) Processing permit
23) Trading permit
24) Market dues
25) Other fees
D. Information about Chilled Transport Facilities
26. Please tell us about the arrival of chilled transport facilities to your district (Month/year, beaches where they exist, any fees charged on them etc.) ____________________________________________________________________________________________________________________________
27. How has the District responded to this new development? ____________________________________________________________________________________________________________________________
28. State positive changes that you have noticed ever since chilled transport facilities for Nile perch started coming to this beach ___________________________________________________________________________________________________________________________
29. State negative changes that you have noticed ever since chilled transport facilities for Nile perch started coming to this beach _________________________________________________________________________________________________________________________________________________________________________________________
30. Suggest solutions to the negative changes mentioned above ___________________________________________________________________________________________________________________________
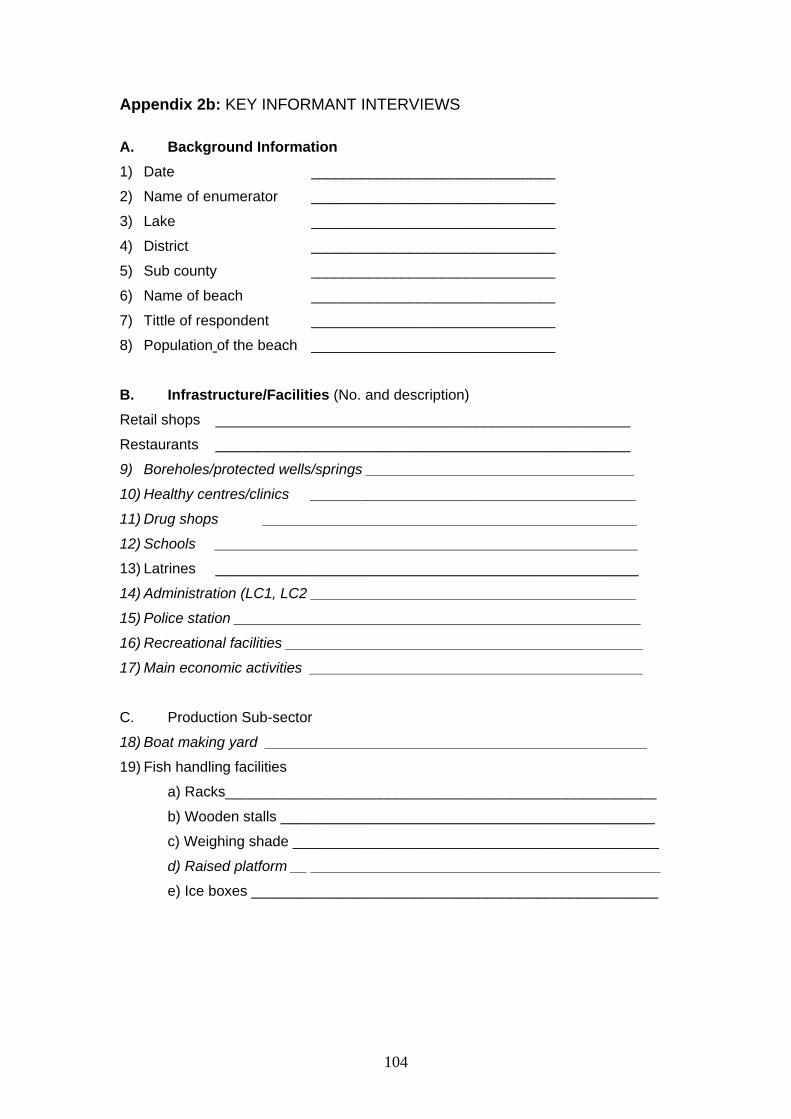
104
Appendix 2b: KEY INFORMANT INTERVIEWS
A. Background Information 1) Date ______________________________
2) Name of enumerator ______________________________
3) Lake ______________________________
4) District ______________________________
5) Sub county ______________________________
6) Name of beach ______________________________
7) Tittle of respondent ______________________________
8) Population of the beach ______________________________
B. Infrastructure/Facilities (No. and description) Retail shops ___________________________________________________
Restaurants ___________________________________________________
9) Boreholes/protected wells/springs _________________________________
10) Healthy centres/clinics ________________________________________
11) Drug shops ______________________________________________
12) Schools ____________________________________________________
13) Latrines ____________________________________________________
14) Administration (LC1, LC2 ________________________________________
15) Police station __________________________________________________
16) Recreational facilities ____________________________________________
17) Main economic activities _________________________________________
C. Production Sub-sector
18) Boat making yard _______________________________________________
19) Fish handling facilities
a) Racks_____________________________________________________
b) Wooden stalls ______________________________________________
c) Weighing shade _____________________________________________
d) Raised platform __ ___________________________________________
e) Ice boxes __________________________________________________

105
Fill in the information below about rank and number per category of fishers at this beach
Category of fisher Rank Number 20) Gill nets 21) Handline 22) Longline 23) Basket traps 24) Boat seine 25) Beach seine 26) Cast nets 27) Mosquito nets 28) Kaganga (perforated troughs) 29) Scoop nets 30) Other Fill in the information below about rank and number per category of fishery related employment at this beach Category of employment Rank Number 31) Crews 32) Fishing unit owners 33) Fishing unit renters 34) Bait suppliers 35) Carrying fish 36) Other Fill in the information below about type, rank and number of boats at this beach Type of boat Rank No. 37) Parachute 38) Ssesse 39) Congo barike 40) Dugout canoe 41) Other Fill in the information below about category and number of out board engines at this beach Category of engine Horse power No. 42) Fishing 43) Transport 44) Other

106
Fill in the information below about category, number and rank of fishing gears at this beach Category of gears Rank No. 45) Gill nets 46) Handline 47) Longline 48) Basket traps 49) Beach seines 50) Cast nets 51) Mosquito nets 52) Pressure lamps 53) Kaganga (troughs) 54) Scoop nets 55) Other Fill in the information below about fish species, rank and quantities landed per week Fish species Rank Qty. Landed per week 56) Nile perch 57) Tilapia 58) Mukene 59) Hyrocynus 60) Alestes baromous (angara) 61) Alestes nurse 62) Bagrus 63) Protopterus 64) Other D. Processing Sub-sector Publicly owned processing facilities _______________________________________ Fill in the information below about number by category of fish processing method Types of fish processors by method Rank No 65) Smoking 66) Sun-drying and salting 67) Sun-drying 68) Other Fill in the information below about number by category and rank of fish species processed Types of fish processors by species Rank No 69) Nile perch 70) Tilapia 71) Mukene 72) Hyrocynus 73) Alestes baremose (angara) 74) Alestes nurse 75) Bagrus 76) Protopterus 77) Other

107
Fill in information below about number of processing assets Processing assets No 78) Smoking kiln 79) Drying rack 80) Drying grounds 81) Smoking pits 82) Other E. Marketing Sub-sector 83) Description of access roads _______________________________________ Fill in the information below about number by category, assets and rank of fish trader Type of trader Rank No Type of equipment No. 84) Bicycle trader [1] Bicycle 85) Truck trader [2] Truck 86) Boat trader [3] Trading Boats 87) Factory agent [4] engines 88) Beach side retailer [5] Stalls 89) Other [7] Other
Fill in the information below about quantity of fish taken by category and rank of fish trader Type of trader Rank Qty of fish taken weekly 90) Bicycle trader 91) Truck trader 92) Boat trader 93) Factory agent 94) Beach side retailer 95) Other Fill in the information below about main destinations of processed fish species Fish species Main destination Fresh Processed 96) Nile perch 97) Tilapia 98) Mukene 99) Hyrocynus 100) Alestes baremose (angara) 101) Alestes nurse 102) Bagrus 103) Protopterus 104) Other
G. For beaches where chilled transport facilities already exist
105) When did chilled transport facilities first come to your beach? ____Month/year
106) Which fish processing company (ies) do they come from? ______________
107) Have you seen them at other beaches? [1] Yes [2] No

108
108) If yes, mention them ____________________________________________
109) State positive changes that you have noticed ever since chilled transport facilities for Nile perch started coming to this beach __________________________
110) State negative changes that you have noticed ever since chilled transport facilities for Nile perch started coming to this beach ___________________________ 111) Suggest solutions to the negative change mentioned above ______________________________________________________________________________________________________________________________________
H. For beaches where chilled transport facilities do not exist 112) What positive changes do you associate with chilled transport facilities? ___________________________________________________________________ 113) What negative changes do you associate with chilled transport facilities? ___________________________________________________________________

109
Appendix 2c: UNIT QUESTIONNAIRE FOR PRODUCTION SUB-SECTOR ENTERPRISES
A. BACKGROUND INFORMATION
1) Date ___________________________________________________
2) Name of enumerator ______________________________________
3) Lake ___________________________________________________
4) District _________________________________________________
5) Sub county ______________________________________________
6) Name of beach ___________________________________________
B. PERSONAL DATA
7) Name of respondent ___________________________________
8) Age _____ years
9) Sex [1] Male [2] Female 10) Tribe: [1] Ganda [2] Soga [3] Mugungu [4] Munyoro [5] Teso [6] Mukenye [7] Acholi [8] Adhola [9] Alur [10] Other ____ 11) Marital Status: [1] Married [2] Single [3] Divorced [4] Separated [5] Widowed [6] Other ___
12) What is your level of education? [1] No schooling [2] Primary [3] Secondary [4] Tertiary [5] University [6] Other ________ 13) What is the main fish species that you target? [1] Nile perch [2]Tilapia [3] Mukene [4]Hyrocynus [5]Alestes (angara) [6] Alestes nurse [7] Bagrus [8] Protopterus [9] Other ____________
14) For how long have you fished? ____________________________ years 15) How long have you been at this landing? _______________ years 16) Household size ________________________ 17) What is your main alternative source of income? [1] Trading [2] Farming [3] Livestock keeping [4] Salaried employment [5] None [6] Other (Specify) __________________________________ C. INPUT/COST
Capital 18) Do you own a boat? [1] Yes [2] No . 19) If no, do you rent a boat? [1] Yes [2] No
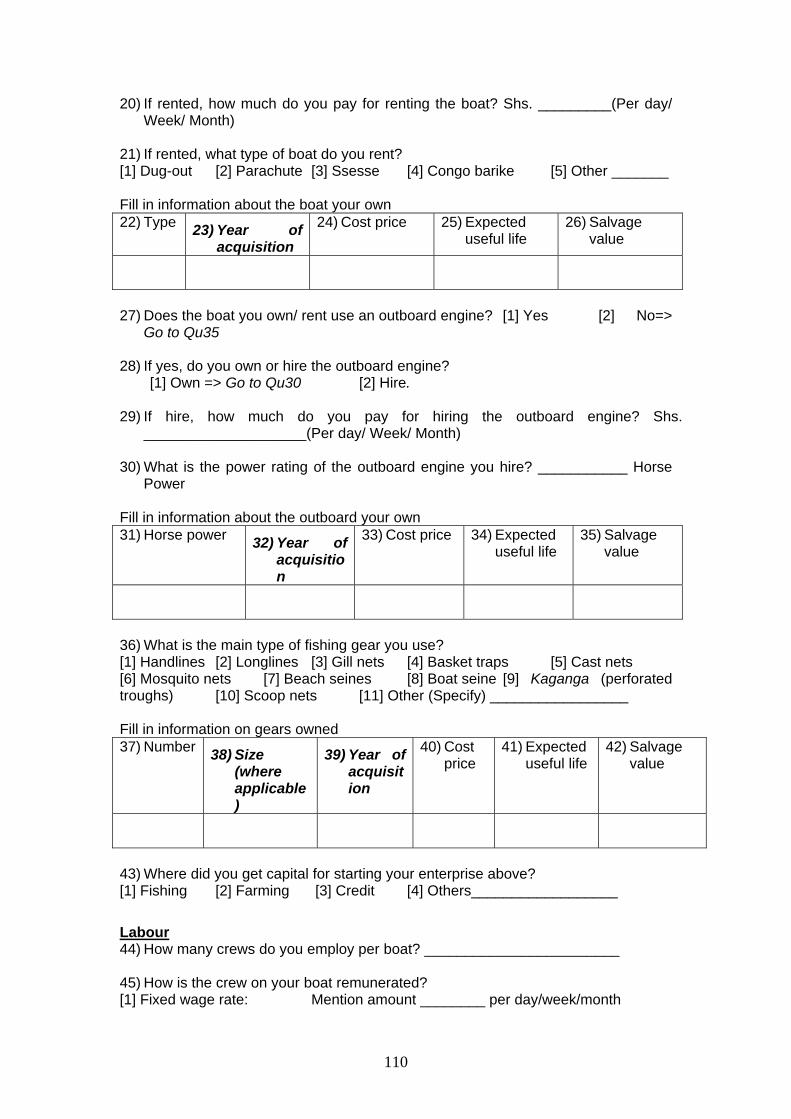
110
20) If rented, how much do you pay for renting the boat? Shs. _________(Per day/ Week/ Month)
21) If rented, what type of boat do you rent? [1] Dug-out [2] Parachute [3] Ssesse [4] Congo barike [5] Other _______ Fill in information about the boat your own 22) Type 23) Year of
acquisition 24) Cost price 25) Expected
useful life 26) Salvage
value
27) Does the boat you own/ rent use an outboard engine? [1] Yes [2] No=>
Go to Qu35
28) If yes, do you own or hire the outboard engine? [1] Own => Go to Qu30 [2] Hire.
29) If hire, how much do you pay for hiring the outboard engine? Shs. ____________________(Per day/ Week/ Month)
30) What is the power rating of the outboard engine you hire? ___________ Horse Power
Fill in information about the outboard your own 31) Horse power 32) Year of
acquisition
33) Cost price 34) Expected useful life
35) Salvage value
36) What is the main type of fishing gear you use? [1] Handlines [2] Longlines [3] Gill nets [4] Basket traps [5] Cast nets [6] Mosquito nets [7] Beach seines [8] Boat seine [9] Kaganga (perforated troughs) [10] Scoop nets [11] Other (Specify) _________________ Fill in information on gears owned 37) Number 38) Size
(where applicable)
39) Year of acquisition
40) Cost price
41) Expected useful life
42) Salvage value
43) Where did you get capital for starting your enterprise above? [1] Fishing [2] Farming [3] Credit [4] Others__________________
Labour 44) How many crews do you employ per boat? ________________________ 45) How is the crew on your boat remunerated? [1] Fixed wage rate: Mention amount ________ per day/week/month

111
[2] %age of revenue: %age _________________________________ [3] %age of net revenue: %age _________________________________ [4] Other ______________________________________________________
46) How many days in a week do your crews work? _________________ days
Entrepreneurship
47) (If owner of enterprise), if you are to be paid for managing the enterprise, what is the minimum you would ask for ____________________________ per month
48) (If manager of enterprise), how much are you paid for managing the enterprise ______________ per month
Other costs Fill in information on other costs involved Item Cost per fishing
day/week/month 49) Fuel 50) Baits 51) Maintenance of boat 52) Maintenance of gear 53) Maintenance of engine 54) Ice 55) Other
Resource base
56) Assess you level of catch? [1] Good => Go to Qu57 [2] Fair [3] Poor 57) If not good, give reasons? [1] No enough fish available in lake [2] Too many competitors of my kind [3] Lack of capital [4] Others (specify)_________________ D. OUTPUT/INCOME Fill in information in table below Species Average daily Quantity sold (in Kgs)
Selling price (in Kgs)
Good day Bad day Yesterday Today Good day Bad day Yesterday today 58) Nile perch 59) Tilapia 60) Mukene 61) Hyrocynus- 62) Alestes-
baremose
63) Alestes nurse
64) Bagrus 65) Protopterus 66) Other 67) How do you sell your fish?

112
[1] Weighed in Kgs [2] Bundle [3] Per head [4] Troughs/basins [5] Other ________________ 68) To whom do you usually sell your catch? [1] Factory agent [2] Bicycle trader [3] Beach retailer [4] Truck trader [5] Boat trader [6] Beach consumer [7] Beach processor [8] Other _______________ 69) Do you sell your catch at [1] Only at this beach [2] Sometimes at another beach [3] Always at another beach [4] Other _________________________________ 70) If sometimes at another beach, give one main reason [1] Better prices offered [2] Near to my fishing grounds [3] Other ________________ 71) Do you have any of the following arrangements with your buyers? [1] Buyer provides money [2] Buyer provides fishing inputs [3] Other__________________[4] No arrangement D. CONSUMPTION 71) What fish species do you most commonly eat at home? [1] Nile perch (pete) [2] Tilapia [3] Mukene [4] Hyrocynus F (tiger) [5] Alestes- baremose (angara) [6] Bagrus bayad (lanya) [7] Alestes nurse [8] Protopterus [9] Others (specify)________________ 72) How much fish does your family eat each day? ______ Kgs 73) Over the past year, has there been any change in the quantity of fish eaten by your family? [1] Yes [2] No=> Go to Qu75 74) If yes, what change? [1] Increased [2] Decreased 75) How often does your family eat fish per week? ____________________________ 76) Over the past year, has there been any change in the frequency of fish eaten by your family? [1] Yes [2] No=> Go to Qu78 77) If yes, what change? [1] Increased [2] Decreased 78) Do you buy the fish you eat? [1] Yes [2] No=> Go to Qu82 79) If yes, at what price per kg? Shs. _______________ 80) Over the past year, has there been any change in the price at which you buy fish for home consumption? [1] Yes [2] No 81) If yes, what change? [1] Increased [2] Decreased

113
82) Over the past year, have the sizes of fish eaten by your family changed? [1] Yes [2] No=> Go to Qu84 83) If yes, what change? [1] Increased [2] Decreased 84) What is your substitute for fish? [1] Beans [2] Meat [3] Vegetables [4] Chicken [5] Others (specify) ____________________
E. PERCEPTIONS TOWARDS CHILLED TRANSPORT FACILITIES
For beaches where chilled transport facilities already exist
85) State one major positive change that you have noticed ever since chilled transport facilities for Nile perch started coming to this beach ___________________________________________________________________
86) State one major negative change that you have noticed ever since chilled transport facilities for Nile perch started coming to this beach ___________________________________________________________________ Suggest one main solution to the negative change mentioned above ___________________________________________________________________
For beaches where chilled transport facilities do not exist 87) What is the major positive change you associate with chilled transport facilities? ___________________________________________________________________ 88) What is the major negative change you associate with chilled transport facilities?

114
Appendix 2d: UNIT QUESTIONNAIRE FOR FISH PROCESSORS
Name of enumerator _____________________
Date _____________________
1. Lake _____________________
2. District _____________________
3. Sub county _____________________
4. Landing ______________________
A. PERSONAL DATA
5. Name of respondent ____________________________
6. Age _____ years
7. Sex [1] Male
[2] Female 8. Tribe
[1] Ganda [2] Soga [3] Mugungu [4] Munyoro [5] Teso [6] Mukenye [7] Acholi [8] Adhola [9] Alur [10] Other (Specify) _______________
9. Marital Status:
[1] Married [2] Single [3] Divorced [4] Separated [5] Widowed [6] Other (Specify) _______________
10. What is your level of education? [1] No schooling [2] Primary [3] Secondary [4] Tertiary [5] University [6] Other (Specify) _______________
11. Household size _________ 12. How long have you been at this landing? _____________ Years B. INPUT /COST Capital 13. What method of fish processing do you employ?
[1] Smoking [2] Sun drying and salting [3] Sun drying [4] Other (Specify) _______________
14. What fish processing facilities do you use?
[1] Smoking kiln [2] Smoking pit [3] Drying rack [4] Other (Specify) _______________
15. What is the status of ownership of the fish processing unit?
[1] Privately owned [2] Communally owned

115
[3] Hired [4] Other (Specify) _______________ 16. If privately owned, provide the following information:
Asset Qty Year of acquisition
Cost price (Shs)
Expected useful life
(Years)
Salvage value
1. Smoking kiln 2. Drying rack 3. Wire mesh 4. 5.
17. If hired/ communal, how much do pay? Shs.______________ per day/ week/
month 18. Where did you get capital for starting your business?
[1] Fishing [2] Farming [3] Family-capital (inherited) [4] Loan [5] Other (Specify) ___________________
19. What other inputs do you use and how much do you pay? ITEM QTY UNIT COST
(Shs) Firewood Salt Storage fee (Specify period) Packaging material Maintenance of processing equipment
Other
Labour
20. What sources of labour do you use? [1] Self-employment [2] Family labour [3] Hired labour [4] Other (Specify) _______________
21. Provide the information below: SOURCE OF LABOUR
NUMBER
UNIT COST/ DAY/WK/MONTH
[1] Self-employment [2] Family labour [3] Hired labour [4] Other
Entrepreneurship

116
22. If you are to pay someone for managing the fish processing unit, how much would you pay?
Shs. _______________per month 23. Assess the supply of raw fish?
[1] Good [2] Fair [3] Poor 24. If poor, give reason for score?
[1] Low catches [2] Too many local competitors [3] Demand by factory agents [4] Transport problems [5] Other (Specify) _______________
C. OUTPUT/ INCOME 25. What is the most common fish species you process?
[1] Nile perch [2] Tilapia [3] Mukene [4] Hyrocynus [5] Alestes baromous [6] Bagrus bayad [7] Alestes nurse [8] Protopterus [9] Other (Specify) _________________________
26. Provide the information
Species Average Weekly Quantity Processed (kgs)
Buying Prices (Shs/kg)
Selling Prices (Shs/kg)
[1] Nile perch [2] Tilapia [3] Mukene [4] Hyrocynus- [5]Alestes-baromous
[6]Aleste nurse [7] Bagrus bayad [8] Protopterus 27. To whom do you usually sell your processed fish?
[1] Fish meal factory agent [2] Bicycle trader [3] Wholesale traders [4] Consumers in outside markets [5] Consumers at landing [6] Other (Specify) _______________
28. Where do you sell your products?
[1] Beach [2] Rural Markets [3] Urban Markets [4] Regional markets [5] Other (Specify) _____________________
29. What is your main alternative source of income?
[1] Trading [2] Farming [3] Livestock keeping [4] Salaried employment [5] None [6] Other (Specify) _______________________________________
D. CONSUMPTION 26. What fish species do you most commonly eat at home?

117
[1] Nile perch (pete) [2] Tilapia [3] Mukene [4] Hyrocynus F (tiger) [5] Alestes- baromous(angara) [6] Bagrus bayad(lanya) [7] Alestes nurse [8] Proteptorus [9] Others (specify)________________
27. How much fish does your family eat each day? ______ Kgs 28. Over the past year, has there been any change in the quantity of fish eaten by
your family? [1] Yes [2] No
29. If yes, what change?
[1] Increased [2] Decreased 30. How often does your family eat fish per week? ___________________________ 31. Over the past year, has there been any change in the frequency of fish eaten by
your family? [1] Yes [2] No
32. If yes, what change?
[1] Increased [2] Decreased 33. Do you buy the fish you eat?
[1] Yes [2] No 34. If yes, at what price per kg? Shs. _______________ 35. Over the past year, has there been any change in the price at which you buy fish
for home consumption? [1] Yes [2] No
36. If yes, what change?
[1] Increased [2] Decreased 37. Over the past year, have the sizes of fish eaten by your family changed?
[1] Yes [2] No 38. If yes, what change?
[1] Increased [2] Decreased 39. What is your substitute for fish?
[1] Beans [2] Meat [3] Vegetables [4] Chicken [5] Others (specify) ____________________
E. PERCEPTIONS IN RELATION TO CHILLED TRANSPORT FACILITIES For Beaches where Chilled Transport Facilities Operate
40. State one major positive change that you have noticed ever since chilled transport facilities for Nile perch started coming to this beach
______________________________________________________________________________________________________________________________________

118
41. State one major negative change that you have noticed ever since chilled transport facilities for Nile perch started coming to this beach
___________________________________________________________________ 42. Suggest one main solution to the negative change mentioned above ___________________________________________________________________
For beaches where chilled transport facilities do not exist 43. What is the major positive change you associate with chilled transport facilities? ___________________________________________________________________ 44. What is the major negative change you associate with chilled transport facilities? ___________________________________________________________________

119
Appendix 2e: UNIT QUESTIONNAIRE FOR FISH MARKETING SUB-SECTOR
Name of enumerator _____________________
Date _____________________
1. Lake _____________________
2. District _____________________
3. Sub county _____________________
4. Landing _____________________
A. PERSONAL DATA
5. Name of respondent ___________________________________________
6. Age _____ years
7. Sex [1] Male
[2] Female 8. Tribe
[1] Ganda [2] Soga [3] Mugungu [4] Munyoro [5] Teso [6] Mukenye [7] Acholi [8] Adhola [9] Alur [10] Other (Specify) __________
9. Marital Status:
[1] Married [2] Single [3] Divorced [4] Separated [5] Widowed [6] Other (Specify) _______________________
10. What is your level of education? [1] No schooling [2] Primary [3] Secondary [4] Tertiary [5] University [6] Other (Specify) _______________________
11. How long have you been at this landing? _____________________ Years B. INPUTS/ COSTS
Capital
12. What type of trader are you?
[1] Bicycle trader [2] pick-up trader [3] Boat trader [4] Factory agent [5] Beach side retailer [6] Other (Specify) _____
13. What fish trading assets do you own?
Asset Year Of Acquisition
Cost Price Expected Useful Life
Salvage Value
[1] Bicycle [2] Basket [3] Ice boxes [4] Truck [5] Boat
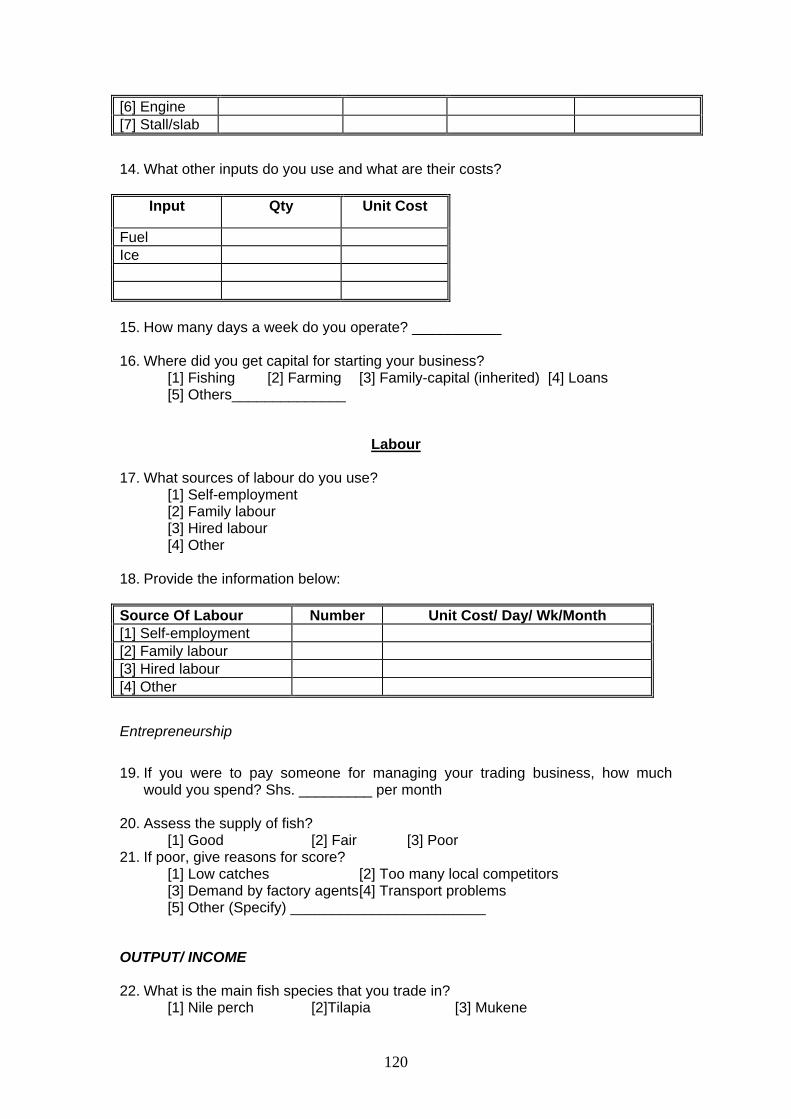
120
[6] Engine [7] Stall/slab
14. What other inputs do you use and what are their costs?
Input Qty Unit Cost
Fuel Ice 15. How many days a week do you operate? ___________ 16. Where did you get capital for starting your business?
[1] Fishing [2] Farming [3] Family-capital (inherited) [4] Loans [5] Others______________
Labour
17. What sources of labour do you use?
[1] Self-employment [2] Family labour [3] Hired labour [4] Other
18. Provide the information below: Source Of Labour Number Unit Cost/ Day/ Wk/Month [1] Self-employment [2] Family labour [3] Hired labour [4] Other
Entrepreneurship
19. If you were to pay someone for managing your trading business, how much would you spend? Shs. _________ per month
20. Assess the supply of fish?
[1] Good [2] Fair [3] Poor 21. If poor, give reasons for score?
[1] Low catches [2] Too many local competitors [3] Demand by factory agents [4] Transport problems [5] Other (Specify) ________________________
OUTPUT/ INCOME 22. What is the main fish species that you trade in?
[1] Nile perch [2]Tilapia [3] Mukene

121
[4]Hyrocynus [5]Alestes baromous [6] Alestes nurse [7] Bagrus bayad [8] Protopterus [9] Other (Specify) ________________________
23. Provide the information below:
Species Average Weekly Quantity Traded (kg)
Buying Prices (Shs/kg)
Selling Prices (Shs/kg)
[1] Nile perch [2] Tilapia [3] Mukene [4] Hyrocynus- [5]Alestes-baromous [6]Aleste nurse [7] Bagrus bayad [8] Protopterus [7] Other 24. Where do you sell your fish?
[1] Beach consumers [2] Rural markets [3] Urban markets [4] Regional markets [5] Other (Specify) _____________________-
Thank you

122
Appendix 2f: UNIT QUESTIONNAIRE FOR FISH CONSUMERS
Name of enumerator _____________________
Date _____________________
5. Lake _____________________
6. District _____________________
7. Sub county _____________________
8. Landing ___-__________________
A. PERSONAL DATA
8. Name of respondent ________________
9. Age _____ years
10. Sex [1] Male
[2] Female 10. Tribe
[1] Ganda [2] Soga [3] Mugungu [4] Munyoro [5] Teso [6] Mukenye [7] Acholi [8] Adhola [9] Alur [10] Other (Specify) _______________
11. Marital Status:
[1] Married [2] Single [3] Divorced [4] Separated [5] Widowed [6] Other (Specify) ______________
19. What is your level of education? [1] No schooling [2] Primary [3] Secondary [4] Tertiary [5] University [6] Other (Specify) ___________
20. Household size _________ 21. How long have you been at this landing? _____________ Years B. CONSUMPTION 29. What fish species do you most commonly eat at home?
[1] Nile perch (pete) [2] Tilapia [3] Mukene [4] Hyrocynus F (tiger) [5] Alestes- baremose (angara) [6] Bagrus bayad (lanya) [7] Alestes nurse [8] Proteptorus [9] Others (specify)________________
30. How much fish does your family eat each day? ______ Kgs 31. Over the past year, has there been any change in the quantity of fish eaten by
your family? [1] Yes [2] No
32. If yes, what change?
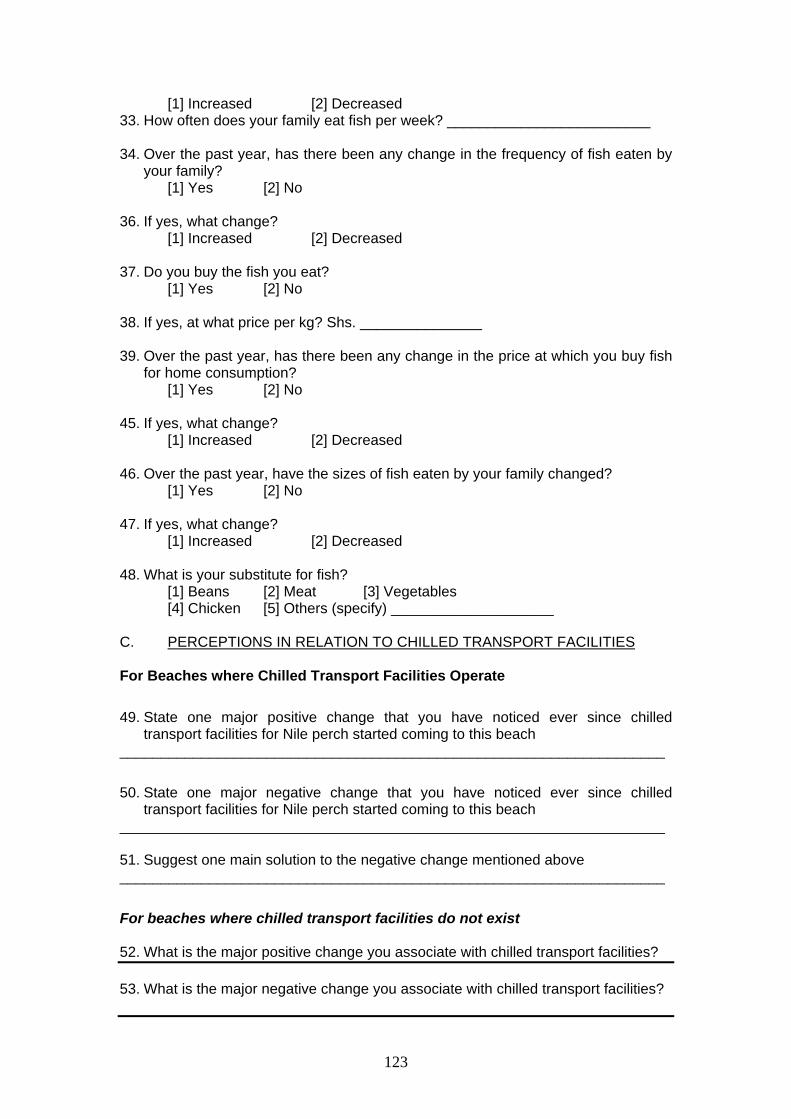
123
[1] Increased [2] Decreased 33. How often does your family eat fish per week? _________________________ 34. Over the past year, has there been any change in the frequency of fish eaten by
your family? [1] Yes [2] No
36. If yes, what change?
[1] Increased [2] Decreased 37. Do you buy the fish you eat?
[1] Yes [2] No 38. If yes, at what price per kg? Shs. _______________ 39. Over the past year, has there been any change in the price at which you buy fish
for home consumption? [1] Yes [2] No
45. If yes, what change?
[1] Increased [2] Decreased 46. Over the past year, have the sizes of fish eaten by your family changed?
[1] Yes [2] No 47. If yes, what change?
[1] Increased [2] Decreased 48. What is your substitute for fish?
[1] Beans [2] Meat [3] Vegetables [4] Chicken [5] Others (specify) ____________________
C. PERCEPTIONS IN RELATION TO CHILLED TRANSPORT FACILITIES For Beaches where Chilled Transport Facilities Operate
49. State one major positive change that you have noticed ever since chilled transport facilities for Nile perch started coming to this beach
___________________________________________________________________
50. State one major negative change that you have noticed ever since chilled transport facilities for Nile perch started coming to this beach
___________________________________________________________________ 51. Suggest one main solution to the negative change mentioned above ___________________________________________________________________
For beaches where chilled transport facilities do not exist 52. What is the major positive change you associate with chilled transport facilities? 53. What is the major negative change you associate with chilled transport facilities?
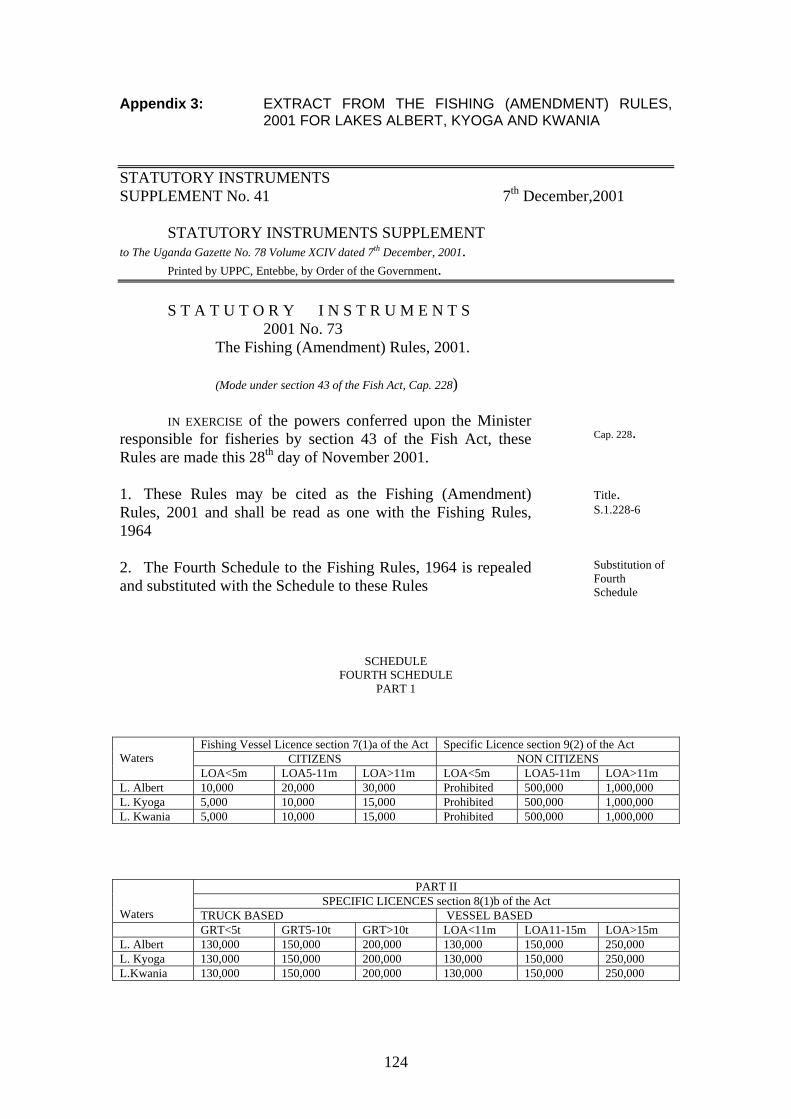
124
Appendix 3: EXTRACT FROM THE FISHING (AMENDMENT) RULES, 2001 FOR LAKES ALBERT, KYOGA AND KWANIA
STATUTORY INSTRUMENTS SUPPLEMENT No. 41 7th December,2001 STATUTORY INSTRUMENTS SUPPLEMENT to The Uganda Gazette No. 78 Volume XCIV dated 7th December, 2001. Printed by UPPC, Entebbe, by Order of the Government. S T A T U T O R Y I N S T R U M E N T S
2001 No. 73 The Fishing (Amendment) Rules, 2001. (Mode under section 43 of the Fish Act, Cap. 228) IN EXERCISE of the powers conferred upon the Minister responsible for fisheries by section 43 of the Fish Act, these Rules are made this 28th day of November 2001.
Cap. 228.
1. These Rules may be cited as the Fishing (Amendment) Rules, 2001 and shall be read as one with the Fishing Rules, 1964
Title. S.1.228-6
2. The Fourth Schedule to the Fishing Rules, 1964 is repealed and substituted with the Schedule to these Rules
Substitution of Fourth Schedule
SCHEDULE FOURTH SCHEDULE
PART 1
Fishing Vessel Licence section 7(1)a of the Act Specific Licence section 9(2) of the Act CITIZENS NON CITIZENS
Waters
LOA<5m LOA5-11m LOA>11m LOA<5m LOA5-11m LOA>11m L. Albert 10,000 20,000 30,000 Prohibited 500,000 1,000,000 L. Kyoga 5,000 10,000 15,000 Prohibited 500,000 1,000,000 L. Kwania 5,000 10,000 15,000 Prohibited 500,000 1,000,000
PART II SPECIFIC LICENCES section 8(1)b of the Act
Waters TRUCK BASED VESSEL BASED GRT<5t GRT5-10t GRT>10t LOA<11m LOA11-15m LOA>15m L. Albert 130,000 150,000 200,000 130,000 150,000 250,000 L. Kyoga 130,000 150,000 200,000 130,000 150,000 250,000 L.Kwania 130,000 150,000 200,000 130,000 150,000 250,000