research report no. 2009-6 a comparison of college ... · a comparison of college performance of...
TRANSCRIPT

www.collegeboard.com
Research Report No. 2009-6
A Comparison of College Performance of Matched AP® and Non-AP Student Groups
Daniel Murphy and Barbara Dodd

The College Board, New York, 2009
Daniel Murphy and Barbara Dodd
A Comparison of
College Performance of
Matched AP ® and
Non-AP Student Groups
College Board Research Report No. 2009-6
Daniel Murphy is an associate research scientist at Person.
Barbara E. Dodd is a professor of educational psychology at the University of Texas at Austin.
The College Board
The College Board is a not-for-profit membership association whose mission is to connect students to college success and opportunity. Founded in 1900, the College Board is composed of more than 5,700 schools, colleges, universities and other educational organizations. Each year, the College Board serves seven million students and their parents, 23,000 high schools, and 3,800 colleges through major programs and services in college readiness, college admission, guidance, assessment, financial aid, enrollment, and teaching and learning. Among its best-known programs are the SAT®, the PSAT/NMSQT® and the Advanced Placement Program® (AP®). The College Board is committed to the principles of excellence and equity, and that commitment is embodied in all of its programs, services, activities and concerns.
© 2009 The College Board. College Board, Advanced Placement Program, AP, SAT and the acorn logo are registered trademarks of the College Board. inspiring minds is a trademark owned by the College Board. PSAT/NMSQT is a registered trademark of the College Board and National Merit Scholarship Corporation. All other products and services may be trademarks of their respective owners. Visit the College Board on the Web: www.collegeboard.com
Printed in the United States of America.

Contents
Abstract . . . . . . . . . . . . . . . . . . . . . . . . . . . . . . . . . . . . . 1
Introduction . . . . . . . . . . . . . . . . . . . . . . . . . . . . . . . . . 1
Research Questions . . . . . . . . . . . . . . . . . . . . . . . . 2
AP Versus Non-AP Groups . . . . . . . . . . . . . . . 2
AP Versus Concurrent Groups . . . . . . . . . . . . 2
Method . . . . . . . . . . . . . . . . . . . . . . . . . . . . . . . . . . . . . 2
Data Source . . . . . . . . . . . . . . . . . . . . . . . . . . . . . . 2
AP and Non-AP Groups . . . . . . . . . . . . . . . . . . . . . 2
AP and Concurrent Groups . . . . . . . . . . . . . . . . . 3
Data Analysis Procedure . . . . . . . . . . . . . . . . . . . . 3
Results . . . . . . . . . . . . . . . . . . . . . . . . . . . . . . . . . . . . . . 5
AP Versus Non-AP Groups . . . . . . . . . . . . . . . . . 5
AP Versus Concurrent Groups . . . . . . . . . . . . . . 8
Discussion . . . . . . . . . . . . . . . . . . . . . . . . . . . . . . . . . . . 9
AP Versus Non-AP Groups . . . . . . . . . . . . . . . . . . 9
AP Versus Concurrent Groups . . . . . . . . . . . . . . . 9
References . . . . . . . . . . . . . . . . . . . . . . . . . . . . . . . . . . 10
Tables
1. MANOVA Results — Factorial Analysis for AP vs. Non-AP Students . . . . . . . . . . . . . . . . . . . . . . 12
2. Descriptive Statistics and Planned Comparison Results for AP vs. Non-AP Biology . . . . . . . . . 15
3. Descriptive Statistics and Planned Comparison Results for AP vs. Non-AP Calculus AB . . . . . 17
4. Descriptive Statistics and Planned Comparison Results for AP vs. Non-AP Calculus BC . . . . . 20
5. Descriptive Statistics and Planned Comparison Results for AP vs. Non-AP Chemistry . . . . . . . 22
6. Descriptive Statistics and Planned Comparison Results for AP vs. Non-AP Macroeconomics . 24
7. Descriptive Statistics and Planned Comparison Results for AP vs. Non-AP English Language and Composition . . . . . . . . . . . . . . . . . . . . . . . . . 26
8. Descriptive Statistics and Planned Comparison Results for AP vs. Non-AP English Literature and Composition . . . . . . . . . . . . . . . . . . . . . . . . . 28
9. Descriptive Statistics and Planned Comparison Results for AP vs. Non-AP Government and Politics: United States . . . . . . . . . . . . . . . . . . . . . 30
10. Descriptive Statistics and Planned Comparison Results for AP vs. Non-AP U.S. History . . . . . 32
11. Descriptive Statistics and Planned Comparison Results for AP vs. Non-AP Spanish Language 34
12. MANOVA Results — Factorial Analysis for AP vs. Concurrent Students . . . . . . . . . . . . . . . . . . . 36
13. Descriptive Statistics and Planned Comparison Results for AP vs. Concurrent Macroeconomics 37
14. Descriptive Statistics and Planned Comparison Results for AP vs. Concurrent English Language and Composition . . . . . . . . . . . . . . . . . . . . . . . . . 39
15. Descriptive Statistics and Planned Comparison Results for AP vs. Concurrent Government and Politics: United States . . . . . . . . . . . . . . . . . . . . . 41
16. Descriptive Statistics and Planned Comparison Results for AP vs. Concurrent History: United States . . . . . . . . . . . . . . . . . . . . . . . . . . . . . . . . . . . 43
17. Summary of Primary Trends Observed Across Subjects for AP vs. Non-AP Comparisons . . . 45
18. Summary of Primary Trends Observed Across Subjects for AP vs. Concurrent Comparisons 46

1
AbstractThe purpose of the present research was to compare the college performance of three groups of Advanced Placement Program® (AP®) students who took the AP Exam and either earned course credit, did not earn course credit, or earned course credit but elected to take the entry-level college course to three groups of Non-AP student groups matched on SAT scores and high school rank in 10 AP subject areas. In addition, the performance of the AP groups was also compared to matched groups of students who were concurrently enrolled in a college course in the same subject area as the AP students. Students’ records for four entering classes (1998–2001) at the University of Texas at Austin were analyzed. The college outcome measures included first and overall credit hours taken, first and overall GPAs, and subject area credit hours and GPAs. In addition, sequent course grades were analyzed in those subject areas where there was a required sequent course. The results showed AP students who earn course credit consistently outperform their matched Non-AP group on most of the college outcome measures. The findings also revealed AP students take significantly more credit hours their first year than the concurrently enrolled students. The results of this study support the generalization of previous research to the much expanded AP Program.
IntroductionThe College Board’s Advanced Placement Program offers college-level courses and exams to students while they are still in high school. For the 2006-07 academic year, AP courses and exams were offered in 37 different subject areas in 22 disciplines. With the exception of AP Studio Art Exams, all AP Exams include both multiple-choice and free-response sections. A weighted composite score based on the scores received on the two sections is then transformed to a 1 to 5 score for reporting. The American Council for Education recommends students who earn an AP Exam grade of 3 or higher be allowed to place out of the entry-level college course or be granted credit-by-examination for the entry-level college course in the AP subject area. Because each college and university establishes its own AP placement and credit-by-examination policy, the policies vary across institutions. In general, however, students who earn an AP score of 3 or higher place out of or earn credit-by-examination for one or more entry-level college courses.
Previous research has found that students who take AP Exams tend to earn more credit hours in the AP subject area than students who do not take the exam (Dodd, Fitzpatrick, De Ayala, & Jennings, 2002; Keng
& Dodd, 2007; Koch, Fitzpatrick, Triscari, Mahoney, & Cope, 1988; Morgan & Maneckshana, 2000; Willingham & Morris, 1986). Students who take the AP Exams also tend to major in the AP subject area or a related area (Morgan & Maneckshana, 2000). Dodd et al. (2002) and Keng and Dodd (2007) found students who earn credit-by-examination via their AP grade also earn higher GPAs in the subject area. The Keng and Dodd (2007) study also found AP students who earned credit-by-examination also consistently outperformed Non-AP student groups in terms of first year and overall GPAs and credit hours earned. Other studies (Casslery, 1986, Dodd et al., 2002; Keng & Dodd, 2007; Koch, et al., 1988; Morgan & Crone, 1993; Morgan & Ramist, 1998) have shown students who earn grades high enough on the AP Exam to place out of the introductory course perform as well if not better than students who take the introductory course. Morgan and Maneckshana (2000) and Dougherty, Mellor and Jian (2005) found that students who earned high grades on the AP Exams graduated at a higher rate than AP students who earned lower grades. The Dougherty et al. (2005) study also found that AP students who earned AP grades of 1 or 2, or did not take the exam graduated at a higher rate than Non-AP groups.
According to the College Board’s website, in the last 10 years, the number of students taking the exam has increased 8 to 11 percent each year, and the number of exams has increased 9 to 12 percent each year. Clearly, the program has been growing at a rapid rate. As a consequence, some researchers (Hurwitz & Hurwitz, 2003; Klopfenstein, 2004; Lichten, 2000) question if the results found in earlier studies still generalize to the expanded AP Program. The results of the Keng and Dodd (2007) research supported the generalization of earlier research to the expanded AP Program.
Unfortunately, the Keng and Dodd (2007) only studied one group of Non-AP students who were matched to the AP students who earned credit-by-examination. The comparison group of Non-AP students was not matched to the other two AP groups — AP students who did not earn credit-by-examination and AP students who elected to take the course rather than accept the credit-by-examination in the course. The inclusion of additional Non-AP groups will provide a better comparison group for each of the AP groups, respectively. In addition, similar matching was done to compare the performance of the various AP groups with the performance of students who were concurrently enrolled in college-level courses while still in high school. Thus a total of nine possible groups are included in the current study: three AP groups, three matched Non-AP groups and three matched Concurrent groups.

2
Research Questions
AP Versus Non-AP Groups 1. Are there differences in college outcome measures
among students who took an AP Exam relative to students who did not take an AP Exam regardless of their credit status?
2. Are there differences in college outcome measures among students’ credit status regardless of their AP status?
3. Are there differences in college outcome measures among students as a function of their level of their AP status and credit status?
AP Versus Concurrent Groups 4. Are there differences in college outcome measures
among students who took an AP Exam relative to students who participated in concurrent enrollment regardless of their credit status?
5. Are there differences in college outcome measures among students’ credit status regardless of the AP/concurrent enrollment status?
6. Are there differences in college outcome measures among students as a function of their level of their AP status and credit status?
Method
Data SourceWe reanalyzed the Keng and Dodd (2007) data to further study the effect of AP in the following 10 subjects: Biology, Calculus AB, Calculus BC, Chemistry, Macroeconomics, English Language and Composition, English Literature and Composition, Government and Politics: United States, United States History, and Spanish Language. These 10 AP Exams are among the most frequently taken AP Exams in the state and in the U.S. Each of the 10 AP Exams allows students to earn credit-by-examination in at least one college-level course in the related subject. The number of courses students may place out of and the minimum AP Exam grade needed to place out of the courses vary for each subject and across academic years.
The data were originally obtained from the student-records database for the 1998–2001 entering classes at the University of Texas at Austin. Using four entering classes allowed us to determine whether the results are replicable across years. The entering freshman class sizes were 5,910, 6,345, 6,467 and 6,219 for the 1998, 1999, 2000 and 2001 academic years, respectively. These
are the same entering classes that were studied in the Keng and Dodd (2007) investigation. Variables obtained from the university’s database include grades on all AP Exams, grades and dates of all college courses, overall college grade-point averages (GPAs), high-school ranks and admission test scores (SAT® and ACT). Transfer credits, date of first semester in college and high school graduation date were also obtained in order to identify students who were concurrently enrolled in a college class in each subject that corresponded to an AP Exam while still in high school. From these data, we determined first-year credit hours, credit hours in subjects corresponding to the AP Exams, and cumulative credit hours in college. We also determined first-year GPAs, GPAs in subjects corresponding to the AP Exams, and cumulative college GPAs. Where possible, we also analyzed grades in the sequent course in those subjects where a sequent course was mandated.
AP and Non-AP GroupsThe research questions 1–3 were addressed by
identifying and forming groups of students for each analysis in each of 10 AP Exam subjects for each of the four entering classes (1998–2001). Six possible groups could be formed based on matching the three AP groups to Non-AP students. Each of these six groups is described below. • AP Credit Group (AP+). This group consisted of
students who earned credit by exam based on their AP Exam grade.
• AP No Credit Group (AP–). This group included students who took the AP Exam but did not earn credit by exam. They also needed to have credit hours for at least one college course in the corresponding subject to be included in the group.
• AP Did Not Claim CBE Group. The AP students in this group scored well enough to earn credit on an AP Exam, but they elected not to accept the credit by exam and took the corresponding introductory subject course at the university. With the exception of the AP Calculus AB Exam, the AP Did Not Claim CBE groups were deemed too small to warrant inclusion as a separate comparison group. As a result, the AP Did Not Claim CBE group was only included in the analyses for the AP Calculus AB Exam.
• Non-AP Students Matched to the AP Credit Group (Non-AP+). This group included students who did not take the AP Exam and did not concurrently enroll in any of the corresponding college courses while still in high school. They were matched by high school rank and SAT or ACT score to the students who earned credit on an AP Exam. They also had

3
credit hours for at least one college course in the related subject.
• Non-AP Students Matched to the AP No Credit Group (Non-AP–). This group comes from the same pool of students who were matched to the AP+ students; however, they were matched by high school rank and SAT or ACT score to the students who took an AP class in high school but did not earn credit on an AP Exam.
• Non-AP Students Matched to the AP No CBE Group. This group comes from the same pool of students as the previously matched Non-AP students. This group was matched by high school rank and SAT or ACT score to the students who earned credit on an AP Exam but elected not to accept the credit.
AP and Concurrent Groups
Research questions 4–6 concerned comparison of students who were concurrently enrolled in a college course while still in high school to a matched AP group. Each of the three concurrent groups is described below. • Concurrent Group Matched to AP Credit (C+). This
group consisted of students who did not take the AP Exam and, while still in high school, concurrently enrolled in one of the corresponding college courses for which students can receive credit via AP Exam. The students in this group were matched by high school rank and SAT or ACT score to the students who earned credit on the AP Exam.
• Concurrent Group Matched to AP No Credit (C–). This group comes from the same pool of students as the previously matched concurrent enrollment students; however, the students in this group were matched by high school rank and SAT or ACT score to the students who took an AP class in high school but did not earn credit on the AP Exam.
• Concurrent Group Matched to AP No CBE Group. This group was not included in the present study due to an insufficient number of students available for matching and analysis.
Data Analysis ProcedureBecause we were not interested in comparisons between Concurrent and Non-AP groups, we conducted two separate sets of analyses. The first set of analyses compared the students in the AP groups with the correspondingly matched Non-AP groups. The second set of analyses compared the AP groups with the correspondingly matched Concurrent groups.
AP Versus Non-AP Groups. The analyses for the comparison of the AP versus Non-AP students, for each
AP Exam and within each entering class, included up to seven dependent measures. Because the sample size for the Non-AP group was generally much larger than the AP groups, it was matched to the AP groups in terms of SAT total scores (or ACT scores, if SAT scores were unavailable) and high school ranks. The dependent measures included total college credit hours taken, cumulative college GPA, first-year credit hours taken, first-year GPA, credit hours taken in the AP Exam subject, cumulative GPA in the AP Exam subject, and grades in any sequent courses. Of the 10 AP Exam subjects analyzed, only four had mandatory sequent courses at the university. They were AP Biology (BIO 303) in 1998 and 1999, AP Calculus AB (M 408D), AP Calculus BC (M 408D), and AP English Language and Composition (E 316K).
Students in all AP groups were initially combined into one group in order to match the AP and the Non-AP groups. The students in each of the two groups were then classified by high-school rank and either SAT or ACT score in order to facilitate matching. The high-school ranks were divided into five equal percentile-rank categories. The range of SAT total scores was divided into 11 equal 100-point increments from 400 to 1,600. The range of ACT scores was also divided into 11 intervals that corresponded to the SAT increments. A student’s ACT score was used only if his/her SAT score was unavailable. The first step in the matching process assigned the students in each of the two groups to one of the cells based on the 5 x 11 classification of high school rank by test score categories.
The second step of the matching process involved randomly sampling the AP and the Non-AP students in the same categories in an attempt to provide one-to-one matching. Students in Non-AP groups were then assigned to their matched AP subgroups by the one-to-one matching. In several instances, an insufficient number of Non-AP students were available to be selected into certain cells. Thus, in some cases the matched Non-AP groups had smaller sample sizes than the intact AP groups. Overall, the matching procedure worked very well. For all 10 subject across all four years, 88 percent of the AP and Non-AP matched groups differed by less than 60 points on their SAT Total scores. Only five of the 40 matched samples had mean SAT Total scores that differed by 70 to 90 points. Listwise deletion of students with missing data further reduced the sample sizes in most instances. The pre- and post-deletion means were very similar for all dependent measures. The GPA mean differences were .02 or less, while the credit hour differences tended to be .5 or less. The largest number of cases deleted ranged from 100 to 200 for the subject credit hours dependent measure.
The matched AP and Non-AP subgroups were then compared using a two-way (AP status x Credit status) factorial multivariate analysis of variance (MANOVA)

to detect overall differences in the multivariate means of the dependent variables for each AP Exam subject within each entering class. If the MANOVA yielded a statistically significant result, univariate ANOVAs followed by planned comparisons using Bonferroni adjustments were performed on the least-square means (LS-means) to determine which groups differed significantly on the dependent variable.
The comparisons of interest were the main effects of AP status (i.e., AP versus Non-AP), Credit status (i.e., Credit, No Credit, No CBE), and the interaction of AP x Credit factors. The comparisons of interest for the interaction were AP+ group versus Non-AP+ group, AP- group versus Non-AP- group, and AP No CBE vs. matched Non-AP group (Calculus AB only). LS-means were used because the sample sizes across the comparison groups were unbalanced. LS-means are predicted population margins; that is, they are estimates of marginal means over a balanced population (SAS OnlineDoc, 2003), which provides fairer comparisons than would comparisons of the raw means.
When analyzing LS-means among the dependent variables across years, effects were considered consistently statistically significant when at least three of the four incoming classes had statistically significant differences. If the LS-mean differences were not consistently statistically significant, no inferences were made regarding the effects of group membership. As a measure of practical significance, effect sizes were calculated using
η2 = SSeffect
SSeffect + SSerror
. The effect size was considered to
to be small if .01 ≤ η² ≤ .06, moderate if .06 < η² ≤.14, and large if η² < .14 (Cohen, 1988). This method of calculating is used to estimate effect sizes independent of other effects included in the model. Because effect size estimates can sum to values greater than 1, the estimates cannot be interpreted as percentages of total variance.
It should be noted that only six of the seven dependent measures — first-year, subject-area, and cumulative credit hours taken, and first-year, subject-area and cumulative GPA — were included in the MANOVAs. Sequent course grades were not included because a substantially smaller subset of students within each AP Exam usually had such grades. Inclusion of sequent course grades as a variable in the MANOVAs would therefore have greatly reduced the sample sizes for the analyses due to the listwise deletion of students without sequent course grades. Thus, a separate two-way factorial ANOVA was performed to compare sequent course grades across the groups and, if necessary, planned comparisons of the LS-means. The significance level used in all MANOVAs, ANOVAs and planned comparisons was α = 0.01 to help control the experiment-wise error rate.
AP Versus Concurrent Enrollment Groups. For the second set of analyses, the Concurrent groups were matched with the AP groups using a method similar to the one described above. The procedures followed for matching were identical to those described above with one important difference. When matching the two groups of students, the larger group is matched to the smaller group. For the AP—Non-AP matching process, the Non-AP students — being the larger group — were matched as best as possible to the AP students. Thus, Non-AP students who could not be matched to the AP students were excluded from the analysis. In contrast, under the concurrent enrollment matching process, the AP students were matched as best as possible to the concurrent enrollment group because the concurrent enrollment group was substantially smaller than the AP group. Therefore, AP students who could not be matched to concurrent enrollment students were excluded from the analysis, which contrasts with the use of all AP students in the first study. Otherwise, the subcategories used to categorize the students remained the same. As with the AP versus Non-AP groups, reductions in sample sizes for the various analyses were the result of listwise deletion of students due to missing data.
Because the Concurrent group was often small prior to matching, splitting it resulted in sample sizes too small to be used in MANOVAs for six of the AP Exam subjects. The four subjects with sufficient sample sizes after matching and splitting the Concurrent group were Macroeconomics, English Language and Composition, Government and Politics: U.S., and U. S. History. Since no Calculus AB students had earned credit through concurrent enrollment in high school, it was not possible to compare the AP No CBE group with a matched Concurrent group. Additionally, the number of students with missing data for the subject-area GPA dependent variable would have substantially reduced the sample sizes of the analyses through listwise deletion; therefore it was not included as a dependent variable in the analyses.
The resulting design compared the two AP Credit groups (i.e., Credit and No Credit) with matched Concurrent groups on five dependent variables: first-year, subject-area, and cumulative credit hours taken, and first-year and subject-area GPA. The data analysis procedures, beginning with the two-way factorial MANOVAs, were the same as with the AP versus matched Non-AP groups. An additional two-way factorial ANOVA was conducted to compare sequent course grades across groups for the English Language and Composition subject. Planned comparisons were carried out as necessary, as done with the AP and Non-AP comparison groups.
4

5
Results
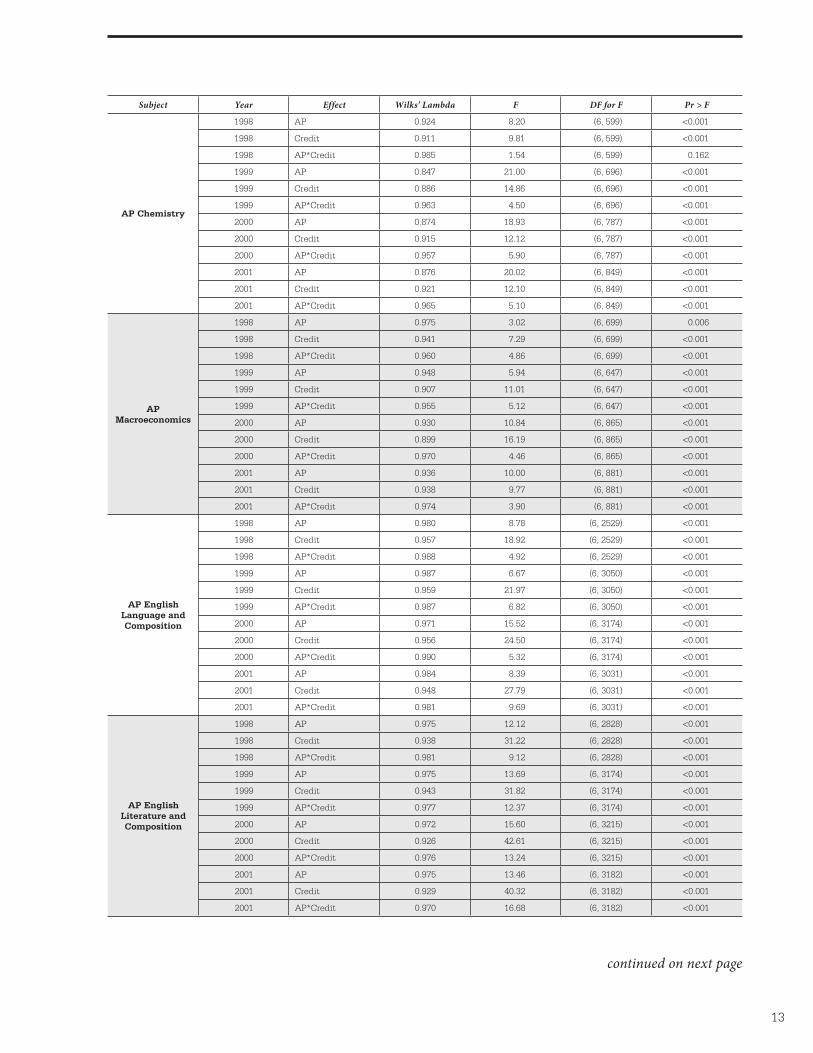
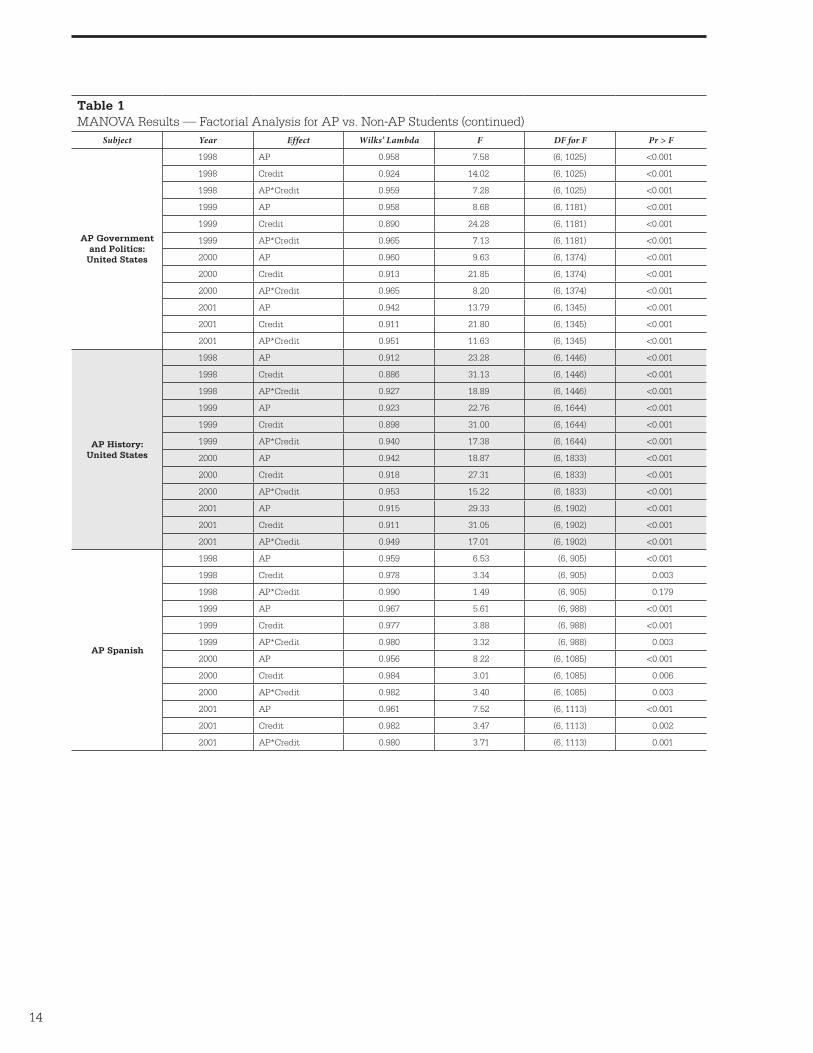
AP Versus Non-AP GroupsMANOVA. Table 1 summarizes the two-way MANOVA results for comparisons of the AP and Non-AP groups. The table includes the Wilks’ Lambda, F-statistic and p-value for the main effects and interactions of the two-way MANOVAs conducted across the 10 AP Exam subjects for each of four entering classes.
The main effects of AP status and Credit status for all MANOVAs were statistically significant at α = 0.01. Additionally, the interaction between AP status and Credit status was statistically significant for almost all AP subjects across all years, the exceptions being Calculus AB, Chemistry and Spanish for 1998, Biology for 1999, and Calculus BC for 2000. The statistically significant MANOVAs were each followed up with a set of planned comparisons. For nine of the 10 subjects, the LS-means of the three credit hour and three GPA outcome measures were compared for the main effects of AP versus Non-AP and Credit versus No Credit, as well as for the AP+ group versus the Non-AP+ group, and the AP- group versus the Non-AP- group. For Calculus AB, there was a third level to the Credit main effect, AP No CBE, and additional planned comparison between the No CBE group and the matched Non-AP group. In addition, separate univariate ANOVAs were run on sequent course grades for the four AP Exam subjects that had mandatory sequent courses at the university. The same set of planned comparisons used after statistically significant MANOVAs was used after statistically significant ANOVAs. A Boneferroni adjustment was included in all analyses to control the comparison-wise error rate.
The sample sizes and LS-means for the 10 AP Exams included in the analyses are given in Tables 2-11, respectively. Statistically significant planned comparisons are also identified in each table. The following sections summarize the results for each of the 10 individual AP Exams.
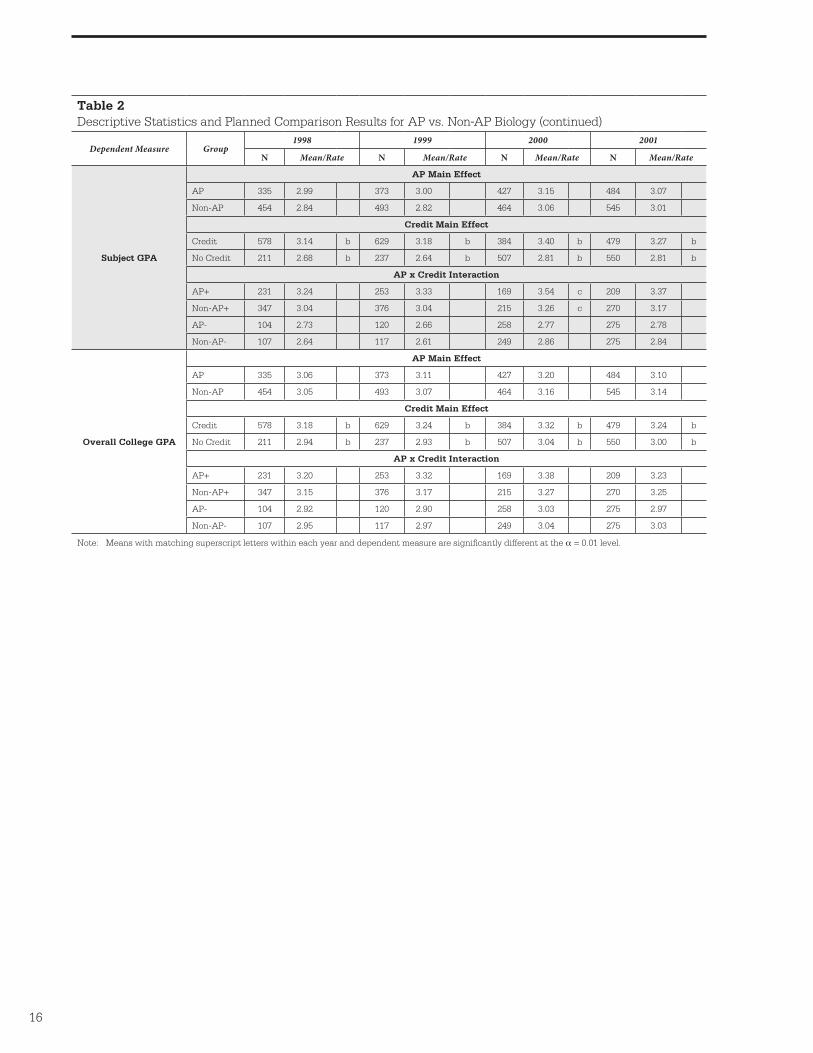
AP Biology. Table 2 presents the sample sizes, LS-means and planned comparison results for the AP Biology groups. Although there was a sequent biology course (BIO 303) for the 1998 and 1999 entering classes, sample sizes were deemed too small to be of use in the analysis. Thus, sequent course grade was not included as a dependent measure for Biology.
As presented in Table 2, the main effect of AP status (i.e., all AP students compared with all Non-AP students matched on high school rank and SAT Total scores) was statistically significant across at least three years for the first-year, subject (biology) and overall college credit hours dependent variables. The LS-means comparisons indicate that the students who took the AP
Exam completed more hours in their first year in college, in biology and in college overall. Effect sizes were in the small range (η² < .03) for the first-year and overall college credit hours dependent variables, and they were in the small-to-moderate range for biology credit hours (.02 < η² < .07) across the four entering classes. The LS-means across the other dependent variables were generally larger for the AP students than for the Non-AP students; however, the results were not consistently statistically significant across the four entering class years.
The main effect of Credit status was statistically significant for at least three of the four entering classes for each dependent variable. The LS-means comparisons indicate that the AP+ students and the Non-AP+ students took more hours in their first semester, in biology and overall in college. They also had higher GPAs in their first year, in biology and overall in college than did the AP- and Non-AP- students. Effect sizes were in the small range for first-year and biology credit hours, and overall GPA (η² < .05); they were in the small to moderate range for overall college credit hours, and also for first-year and biology GPAs (.02 < η² < .10).
Within the Credit categories, the AP+ students outperformed the Non-AP+ students in at least three of the four classes with respect to biology and overall college hours taken. Effect sizes were in the small range for overall college hours taken (η² < .04), and they were in the small to moderate range for biology hours taken (.05 < η² < .07).
Although there were isolated instances where the AP- students outperformed the Non-AP- students, the results were not consistent across the entering class years.
AP Calculus AB . Table 3 gives the sample sizes, LS-means and planned comparisons results for the AP Calculus AB groups. AP Calculus AB was the only AP Exam that had a significant number of students in the AP Did Not Claim CBE group. This group and its matched Non-AP counterpart were included in the analysis; consequently, AP Calculus AB had six comparison groups.
The main effect of AP status was consistently statistically significant with respect to first-year hours, hours taken in mathematics, cumulative hours taken in college and cumulative mathematics GPA. Inspection of the LS-means suggests that as a group, students who take AP Calculus AB take more hours in their first year, in mathematics and in college overall than do their Non-AP counterparts; they also have higher GPAs in mathematics courses overall. Effect sizes with regard to the four dependent variables were small (η² < .03).
The main effect of Credit status was statistically significant across every incoming class for every dependent variable. The students associated with the AP+ and Non-AP+ groups outperformed the students associated with the AP- and Non-AP- groups across the dependent variables. In addition, the groups associated
6
with AP+ earned higher first-year and mathematics GPAs than did the groups associated with AP No CBE. Furthermore, the groups associated with AP No CBE outperformed the groups associated with AP- with regard to mathematics credit hours and first-year and mathematics GPA. Effect sizes regarding Credit status were in the small range for most dependent variables (η² < .06), though for mathematics GPA effect sizes fell in the small to moderate range (.04 < η² < .07) with regard to the contrast between the AP+ and AP- groups.
Within the Credit status categories, the AP+ students consistently outperformed the Non-AP+ students with respect to hours taken in mathematics and overall, first-year GPA and mathematics GPA. Also, the AP No CBE students and the AP- students took more mathematics subject hours than did their Non-AP counterparts. Effect sizes were small across all conditions (η² < .04).
AP Calculus BC . Table 4 presents the sample sizes, LS-means and planned comparison results of the AP Calculus BC groups.
The main effect of AP status was consistently statistically significant with respect to hours taken in the first year, in mathematics, in college overall, and also with respect to mathematics GPA. AP students as a group took more hours in the first year, in mathematics, and in college overall than did Non-AP students. The AP students also had higher mathematics GPAs than the Non-AP students. Effect sizes were small for hours taken in the first semester, in college overall, and mathematics GPA (η² < .03). Effect sizes were small to moderate for hours taken in mathematics (.03 < η² < .09).
The main effect of Credit status was consistently statistically significant for mathematics and cumulative hours taken in college, GPA in the first year, GPA in Mathematics 408D, GPA in mathematics classes in general and GPA overall. The AP+ and Non-AP+ students took more hours in mathematics and college overall, and they earned higher grades in their first year, in Mathematics 408D, in their mathematics courses in general, and in college overall. Effect sizes were in the small range (η² < .06).
Within the Credit categories, the AP+ students outperformed the Non-AP+ students across every dependent variable except first-year credit hours. The AP+ students took more hours in mathematics courses, and in college overall. They also earned higher grades in their first-year, in mathematics courses, in college overall and in Mathematics 408D. Effect sizes across most dependent variables were in the small range (η² < .05). However, effect sizes were in the small to moderate range for number of hours taken in mathematics (.02 < η² < .07).
AP Chemistry . Table 5 presents the descriptive statistics and planned comparison results for the AP Chemistry groups. Students are required to score at least 4 on the AP Chemistry Exam to receive credit by exam
for two introductory chemistry courses (CH 301 and 302). This credit by exam requirement is one point higher than most other AP Exams, which typically have a minimum AP Exam score of 3. This likely explains the smaller AP+ group sizes across all entering classes for AP Chemistry.
The main effects of AP status were statistically significant across at least three entering classes with respect to hours taken first year, in chemistry, overall, and GPA in chemistry classes. The main effects of Credit status were significant with respect to every dependent variable. The AP students consistently outperformed the Non-AP students, and the AP+ and Non-AP+ groups consistently outperformed the corresponding AP- groups. The effect sizes for both main effects were generally in the small range (η² < .06); however, the effect sizes crossed into the moderate range with respect to the effects of AP status on chemistry hours taken (.04 < η² < .09), and also with respect to the effects of Credit status on cumulative college hours taken, first-year GPA and chemistry GPA (.03 < η² < .08).
Within the Credit status categories, the students in the AP+ group consistently outperformed the Non-AP+ students in the number of chemistry hours taken, the number of college hours taken overall, and in GPAs earned in chemistry courses. Effect sizes were in the small range with respect to the number of college hours taken and chemistry GPA (η² < .05), and they were in the small-to-moderate range for number of chemistry hours taken (.03 < η² < .08).
AP Macroeconomics . Table 6 presents the descriptive statistics and planned comparison results for the AP Macroeconomics groups. AP students in 1998–2000 were required to score at least 4 on the AP Macroeconomics exam to receive credit by exam for the introductory Macroeconomics course (ECO 304L). This credit by exam requirement is one point higher than most other AP Exams. This, in part, explains the smaller AP+ group sizes across all entering classes for AP Macroeconomics. In addition, starting with the 2001 entering class, students were required to score a 5 on the AP Macroeconomics exam to receive credit by exam for ECO 304L. This new requirement decreased the size of the AP+ group further for 2001 while substantially increasing the size of the AP- group.
The main effects of AP and Credit status were consistently statistically significant for hours taken in economics, as well as for first-year GPA and GPA in economics classes. The Credit status main effect was also significant for cumulative college hours taken. Consistent with previous results, the AP group and the AP+ group had significantly higher LS-means than did the Non-AP+ and AP- groups. Within the Credit status group, the AP+ students also outperformed their Non-AP+ counterparts with respect to economics hours taken, first-year GPA, and economics GPA. The effect sizes across groups and

7
variables were generally in the small range (η² < .05), although the effect sizes were small to moderate for the main effect of Credit status on GPA in the first semester and GPA in economics courses (.02 < η² < .08).
AP English Language and Composition . Table 7 presents the descriptive statistics and planned comparison results of the AP English Language and Composition groups.
The main effects of AP and Credit status and the results of the planned comparison of AP+ versus Non-AP+ were consistently statistically significant for almost every dependent variable. The exceptions were for the main effect of AP on cumulative college GPA and grades in the sequent English class, English 316K. In addition, the planned comparison of AP+ versus Non-AP+ was not consistently statistically significant with respect to grades in English 316K. As with the previous comparisons, the AP students as a group consistently outperformed the Non-AP students, the AP+ and Non-AP+ groups consistently outperformed the corresponding AP- groups, and the AP+ group outperformed its Non-AP+ counterpart. Effect sizes for all significant effects were in the small range (η² < .05).
AP English Literature and Composition . Table 8 gives the sample sizes, LS-means and planned comparison results for the AP English Literature and Composition groups.
The trends observed for this AP Exam subject are similar to those of AP English Language and Composition. The results are statistically significant across all four years for every dependent variable for the main effects of AP status and Credit status, as well as for the planned comparison of the AP+ and Non-AP+ groups. The exception was for the cumulative college GPA dependent variable, where the AP main effect was not consistently significant. As with the previous subjects, the better performance across dependent variables was associated with the AP main effect, the Credit main effect, and the AP+ cell. No clear pattern of statistical significance was associated with the AP- versus Non-AP- contrast. Effect sizes for most significant effects were in the small range (η² < .05); however, the Credit main effect was in the small to moderate range (.04 < η² < .07) with respect to mathematics GPA.
AP Government and Politics: United States . Table 9 presents the sample sizes, LS-means and planned comparison results for the AP Government and Politics: United States groups. Note that in order to earn credit by exam for the introductory government course (GOV 310L), students must also take a placement test administered by the university assessing the student’s knowledge of Texas government. Eligibility for credit is based on the grades on both the AP Exam and the placement test.
The pattern of significant effects was repeated for the AP Government and Politics: United States incoming classes. The main effects of AP and Credit status and
the AP+ versus Non-AP+ planned comparisons were consistently significant across classes for many of the dependent variables. The AP students, the students associated with Credit main effect, and the AP+ students took more hours in their first year and in college overall, and they had higher GPAs in their first-year and in their government classes than did the students from the corresponding Non-AP+ and AP- groups. The students associated with the Credit main effect and the students associated with the AP+ cell also had higher cumulative college GPAs than the respectively matched No Credit and Non-AP students. There were no clear patterns with respect to the planned comparisons between the AP- group and the Non-AP- group. Effect sizes were generally in the small range (η² < .06). However, the Credit main effect sizes were in the small to moderate range with respect to cumulative hours taken in college and first-year GPA (.03 < η² < .07). The effect sizes were also in the small to moderate range for the Credit main effect and the AP+ cell for cumulative government GPA (.04 < η² < .10).
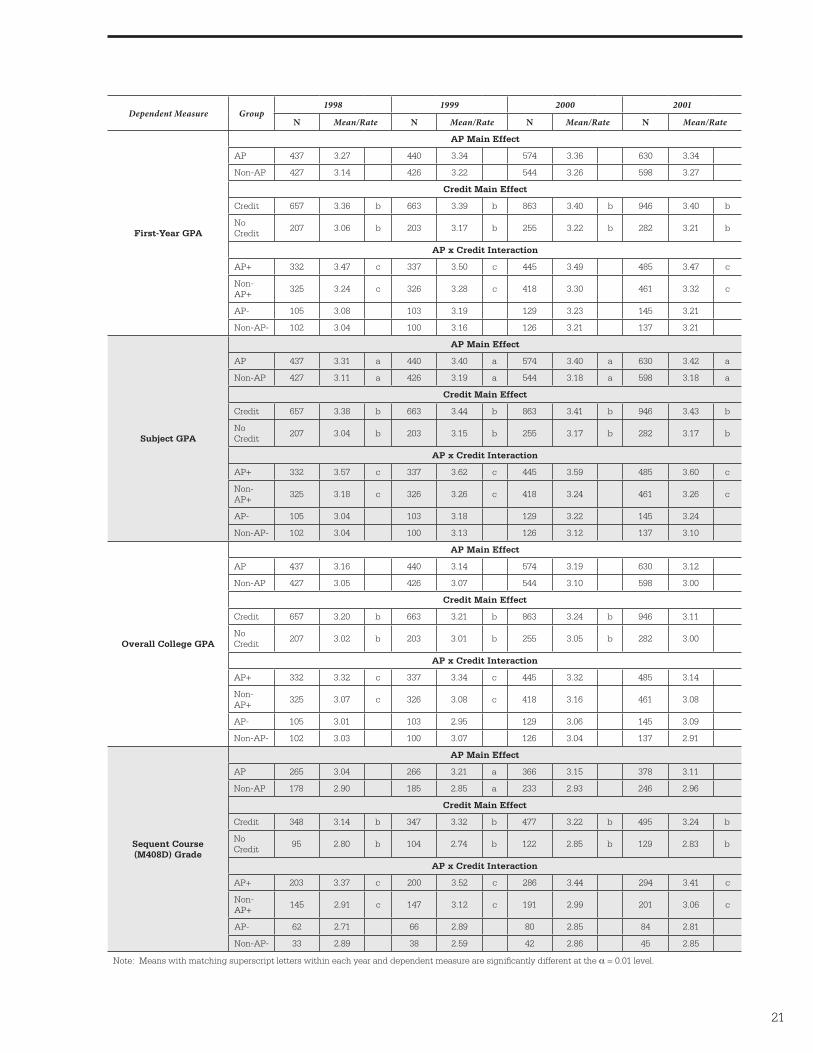
AP U .S . History . Table 10 gives the descriptive statistics and planned comparison results for the AP U.S. History groups.
The pattern of consistent superior performance by students in the AP group, the Credit group and the AP+ group continued across almost every measure with regard to the subject of AP U.S. History. Across every incoming class, the AP students, the students associated with the Credit main effect, and the students who accepted AP Credit took more hours in their first semester, in history and in college overall. They also had higher GPAs in their first semester and in their history classes. Additionally, the Credit main effect was statistically significant for cumulative GPA. Effect sizes were in the small range (η² < .06), except for the Credit main effect and the effect of AP+ versus Non-AP+ on history hours taken, which were in the small to moderate range (.03 < η² < .07).
AP Spanish Language . Table 11 presents the sample sizes, LS-means and planned comparison results for the AP Spanish Language groups. Students who score a minimum of 2 on the AP Spanish Language exam are eligible to receive credit by exam for at least two of the many introductory Spanish courses. This requirement is one point lower than most other AP Exams, which typically have a minimum AP Exam score of 3. This explains why the AP- groups were substantially smaller than the AP+ and Non-AP groups for AP Spanish Language across all four entering classes.
The small AP-groups, in combination with listwise deletion, resulted in group sizes that were too small to conduct the analyses with respect to the sequent Spanish course, Spanish 312L.
The main effects of AP status and Credit status were consistently statistically significant with regard to

8
Spanish hours taken and cumulative Spanish GPA. The AP students and the students in the Credit category took more hours in Spanish and had higher GPAs in their Spanish classes than did the corresponding Non-AP and No Credit students. Likewise, the students in the Credit category (i.e., AP+ and Non-AP+ students) also took more Spanish hours and had higher Spanish GPAs than did the corresponding students in the AP- category. Effect sizes were in the small range (η² < .04).
The AP+ students also took more Spanish hours and had higher Spanish GPAs than did the Non-AP+ students. In addition, they took more hours in their first year, in college overall, and they had higher first-year GPAs. Effect sizes relating to hours taken in the first year, overall in college, and first-year GPAs were in the small range (η² < .06). However, effect sizes relating to hours taken in Spanish and cumulative Spanish GPA were in the moderate to large range (.13 < η² < .20).
AP Versus Concurrent GroupsMANOVA . Table 12 summarizes the two-way MANOVA results for comparisons of the AP and Concurrent groups. The table includes the Wilks’ Lambda, F-statistic and p-value for each of the main effects and interactions for the two-way MANOVAs conducted across the ten AP Exam subjects for each of four entering classes.
The table shows that all of the main effects except the AP status main effect for Macroeconomics in 1998 yielded statistically significant differences in the multivariate means of the comparison groups at α = 0.01. However, the AP x Credit interactions were not significant for Macroeconomics and English Language and Composition. In addition, the AP x Credit interactions for Government and Politics: United States were not significant except for the year 2001. The statistically significant MANOVAs were each followed up with a set the same set of planned comparisons as in the first study.
The LS-means of the three credit hour and two GPA outcome measures were compared for each planned contrast. Students who took classes on a credit-no credit basis were considered to have missing grades in the study. Because of this, the number of students considered to have data for the subject GPA measure was substantially smaller than for the other measures across the Concurrent groups. Inclusion of the measure would have resulted in sample sizes that were too small for the analysis due to listwise deletion. Therefore, the subject GPA measure was dropped from this portion of the study. Separate univariate ANOVAs were run on sequent course grades for the appropriate AP Exam subjects. The same set of planned comparisons used after statistically significant MANOVAs was used after statistically significant ANOVAs. A Boneferroni adjustment was included in all analyses to control the comparison-wise error rate.
The sample sizes and LS-means for the four AP Exams included in the analyses are given in Tables 13–16. Statistically significant planned comparisons are also identified in each table. The following sections summarize the results for each of the four individual AP Exams.
AP Macroeconomics . Table 13 presents the sample sizes, LS-means, and planned comparison results for the AP Macroeconomics and matched Concurrent groups.
The main effect of Credit status was consistently statistically significant with regard to first-year GPA. The AP+ and C+ students earned higher GPAs in their first-year at college than did the students from the corresponding AP- groups. Effect sizes were in the small to moderate range across incoming classes (.03 < η² < .07).
AP English Language and Composition . Table 14 presents the sample sizes, LS-means and planned comparison results for the AP English Language and Composition and matched Concurrent groups.
The main effect of AP status was consistently statistically significant with respect to first-year hours and cumulative English hours taken. The AP students as a group took more hours in their first year than did the Concurrent students. However, the Concurrent students took more hours in English than did the AP students. Effect sizes were in the small range (η² < .05).
The main effect of Credit status was consistently statistically significant for first-year credit hours, cumulative English hours, first-year GPA, overall GPA and grades in the sequent English course (i.e., E316K). The AP+ and C+ students took more hours in their first year and in English, and earned better grades in their first year, overall in college and in E316K than did the corresponding AP- groups. Effect sizes were in the small range (η² < .04).
AP Government and Politics: United States . Table 15 presents the sample sizes, LS-means, and planned comparison results for the AP Government and Politics: United States and matched Concurrent groups.
The main effect of AP status was statistically significant across incoming classes for the number of hours taken in the first year and in government. As a group, the AP students took more hours in their first year at college, and they also took more government hours overall than did the Concurrent students. Effect sizes were in the small range (η² < .05).
The main effect of Credit status was consistently statistically significant with respect to cumulative hours taken in college, first-year GPA and cumulative GPA. The AP+ and C+ students took more hours in college and had higher GPAs in their first year and overall than did their AP- counterparts. Effect sizes were in the small range with regard to hours taken in college and cumulative GPA (η² < .05). Effect sizes were in the small to moderate range with respect to first-year GPA (.04 < η² < .08).

9
AP U .S . History . Table 16 presents the sample sizes, LS-means and planned comparison results for the AP U.S. History and matched Concurrent groups.
The main effect of AP status was consistently statistically significant with regard to first-year hours and history hours taken. As a group, the AP students took more credit hours in their first year, and they took more history hours while in college. Effect sizes were in the small to moderate range (.02 < η² < .08).
The main effect of Credit status was statistically significant with respect to history hours and cumulative hours taken while in college, and first-year GPA. The students associated with the AP+ main effect consistently took more history hours and more hours overall while at the university than did the students associated with the AP- main effect. They also consistently had higher first-year GPAs. Effect sizes were in the small range (η² < .04).
Within the Credit status categories, the AP+ students consistently took more hours in their first year and in history than did C+ students. Effect sizes were in the small range with respect to first-year hours taken (η² < .04), and they were in the small to moderate range (.03 < η² < .10) with respect to history hours taken. The planned comparison of the AP- and C- groups did not yield consistent statistically significant effects. However, for first-year credit hours the LS-means of the AP- group were significantly higher than those of the C- group for two of the four incoming classes at p < .01. Although the contrasts for the other two classes did not meet the strict definition of statistical significance at our set alpha level of .01, the p-values for both contrasts were less than .05, and the effect sizes across all incoming classes for that particular contrast were greater than .01 (.01 < η² < .04).
Discussion
AP Versus Non-AP Groups
Three straightforward findings were observed across the 10 AP Exams with respect to comparisons of the AP and Non-AP groups. Table 17 summarizes how the three primary findings were observed across the six (or seven) dependent variables.
The first finding shows that AP students as a group consistently outperformed Non-AP students. Across the 10 subject areas, students who had taken an AP Exam consistently took more hours in their first year, in the related subject area, and in college overall than did Non-AP students. They also consistently had higher GPAs in the subject area related to the AP Exam. For five of the 10 AP Exam subject areas, the AP students also had significantly higher first-year GPAs. The AP effects were
greatest with respect to the cumulative related-subject credit hours taken by the students, where effect sizes were moderate for three of the 10 subjects.
The second finding shows that the students in the Credit category (i.e., the AP+ and Non-AP+ students) consistently significantly outperformed the students in the No Credit category (i.e., the AP- and Non-AP- students). The students in the Credit group outperformed the students in the No Credit group across every dependent variable, including the three analyses that used sequent course grades as a measure. Effect sizes were in the moderate range across multiple subjects for cumulative college credit hours taken and first-year GPA. The Credit effects were greatest with respect to the cumulative AP-subject area GPAs of the students, where effect sizes were moderate for five of the 10 subjects.
The third finding shows that the AP+ students consistently outperformed their Non-AP+ counterparts. AP+ students took significantly more first-year, subject-area and overall hours in college than did Non-AP+ students. They had significantly higher first-year and related-subject GPAs as well. Additionally, their cumulative GPAs were higher in three out of the 10 subject areas. The related effect sizes were greatest with respect to related-subject credit hours taken, where effect sizes were in the moderate range for four of the 10 subjects and large for another.
AP Versus Concurrent GroupsTwo straightforward findings were observed across
the four AP Exams with respect to comparisons of the AP and Concurrent groups. The trends were narrower in scope than the trends in the previous set of analyses of the AP versus Non-AP comparisons. Table 18 summarizes how the two primary trends were observed across the five (or six) dependent variables.
The first trend indicates that that as a group, the AP students took significantly more hours in their first year of college than did the Concurrent students. The second trend indicates that the students in the Credit category (i.e., the AP+ and C+ students) earned higher GPAs in their first year of college than did the students in the No Credit category (i.e., the AP- and C- students). The AP main effects were moderate for one of the four subjects with regard to first-year credit hours, and the Credit main effects were moderate for two of the four subjects with regard to first-year GPA.
The relatively muted results for the AP group compared to the Concurrently enrolled group could be due to the matching paradigm that was used. Since the AP students were matched to the smaller concurrently enrolled students, many of the high ability AP students were not included in the analyses. More research is needed to determine the differences between these two

10
groups. We need more information about how students decide whether to take college classes while still in high school or an AP course.
Collectively, the findings of both sets of analyses support previous research that showed that AP students performed as well as — and in many instances significantly better than — their peers on most college outcome measures. This is particularly true of those students who earn credit on the AP Exam. Thus, the results imply that the findings of previous studies still apply despite the rapid expansion of the AP Program.
ReferencesCasslery, P. C. (1986). Advanced Placement Revised (College
Board Report No. 86-6). New York: The College Board.Cohen, J. (1988). Statistical power analysis for the behavior
sciences (2nd ed.). Hillsdale, NJ.: Lawrence Erlbaum Associates.
College Board (1997). National Summary Reports. Retrieved June 26, 2006, from http://www.collegeboard.com/prod_downloads/student/testing/ap/sumrpts/1997/national 1997.pdf
College Board (2000). National Summary Reports. Retrieved June 26, 2006, from http://www.collegeboard.com/prod_downloads/student/test ing/ap/sumrpts/2000/national_2000.pdf
College Board (2001). National Summary Reports. Retrieved June 26, 2006, from http://www.collegeboard.com/prod_downloads/student/testing/ap/sumrpts/2001/pdf/national_2001.pdf
College Board (2002). National Summary Reports. Retrieved June 26, 2006, from http://www.collegeboard.com/prod_downloads/student/testing/ap/sumrpts/2002/pdf/national_2002.pdf
College Board (2003). National Summary Reports. Retrieved June 26, 2006, from http://www.collegeboard.com/prod_downloads/student/testing/ap/sumrpts/2003/pdf/national_2003.pdf
College Board (2004). National Summary Reports. Retrieved June 26, 2006, from http://www.collegeboard.com/prod_downloads/student/testing/ap/sumrpts/2004/pdf/national_2004.pdf
Dodd, B. G., Fitzpatrick, S. J., De Ayala, R. J., & Jennings, J. A. (2002). An investigation of the validity of AP exam grades of 3 and a comparison of AP and non-AP student groups . College Board Research Report No. 2002-9. New York: The College Board.
Dougherty, C., Mellor, L., Jian, S. (2005). The relationship between advanced placement and college graduation (2005 AP Series, Report 1). Austin, TX: The National Center for Accountability.
Hurwitz, N., & Hurwitz, S. (2003). Is the shine off the A.P. apple? American School Board Journal, 190(3).
Keng, L. & Dodd, B. G. (2007, April). An investigation of college performance of AP and non-AP student groups. Paper presented at the annual meeting of the American Educational Research Association. Chicago.
Klopfenstein, K. (2004, December 12). The advanced placement expansion of the 1990s: How did traditionally underserved students fare? Education Policy Analysis Archives, 12(68). Retrieved January 9, 2006, from http://epaa.asu.edu/epaa/v12n68/.
Koch, W. R., Fitzpatrick, S. J., Triscari, R. S., Mahoney, S. S., & Cope, J. E. (1988). The Advanced Placement Program: Student attitudes, academic performance, and institutional policies . Austin: The University of Texas at Austin, Measurement and Evaluation Center.

11
Lichten, W. (2000, June 24). Whither Advanced Placement? Education Policy Analysis Archives, 8(29). Retrieved January 9, 2006, from http://epaa.asu.edu/epaa/v8n29.html.
Morgan, R. & Crone, C. (1993). Advanced Placement at the University of California: An examination of the freshman year courses and grades of examinees in biology, calculus, and chemistry. Statistical Report 93-21. Princeton, NJ: Educational Testing Service.
Morgan, R., & Maneckshana, B. (2000). AP students in college: An investigation of their course-taking patterns and college majors . ETS Statistical Report 2000-09. Princeton, NJ: Educational Testing Service.
Morgan, R., & Ramist, L. (1998). Advanced Placement students in college: An investigation of course grades at 21 colleges . Statistical Report No. 98-13. Princeton, NJ: Educational Testing Service.
SAS OnlineDoc 9.1. (2003). Cary, NC: SAS Institute Inc.Willingham, W. W., & Morris, M. (1986). Four years later: A
longitudinal study of Advanced Placement students in college (College Board Report No. 86-2, ETS RR No. 85-46). New York: The College Board.

12
TablesTable 1 MANOVA Results — Factorial Analysis for AP vs. Non-AP Students
Subject Year Effect Wilks’ Lambda F DF for F Pr > F
AP Biology
1998 AP 0.945 7.75 (6, 803) <0.001
1998 Credit 0.906 13.88 (6, 803) <0.001
1998 AP*Credit 0.978 3.08 (6, 803) 0.006
1999 AP 0.934 10.29 (6, 872) <0.001
1999 Credit 0.897 16.78 (6, 872) <0.001
1999 AP*Credit 0.983 2.57 (6, 872) 0.018
2000 AP 0.920 12.91 (6, 886) <0.001
2000 Credit 0.851 25.79 (6, 886) <0.001
2000 AP*Credit 0.972 4.18 (6, 886) <0.001
2001 AP 0.919 15.19 (6, 1028) <0.001
2001 Credit 0.918 15.35 (6, 1028) <0.001
2001 AP*Credit 0.973 4.69 (6, 1028) <0.001
AP Calculus AB
1998 AP 0.972 9.18 (6, 1944) <0.001
1998 Credit 0.920 13.74 (12, 3888) <0.001
1998 AP*Credit 0.990 1.56 (12, 3888) 0.097
1999 AP 0.993 2.84 (6, 2288) 0.009
1999 Credit 0.917 16.97 (12, 4576) <0.001
1999 AP*Credit 0.963 7.18 (12, 4576) <0.001
2000 AP 0.955 20.18 (6, 2565) <0.001
2000 Credit 0.933 15.20 (12, 5130) <0.001
2000 AP*Credit 0.986 3.10 (12, 5130) <0.001
2001 AP 0.978 11.23 (6, 3001) <0.001
2001 Credit 0.915 22.68 (12, 6002) <0.001
2001 AP*Credit 0.984 3.97 (12, 6002) <0.001
AP Calculus BC
1998 AP 0.940 9.30 (6, 868) <0.001
1998 Credit 0.952 7.33 (6, 868) <0.001
1998 AP*Credit 0.979 3.03 (6, 868) 0.006
1999 AP 0.923 12.05 (6, 870) <0.001
1999 Credit 0.953 7.23 (6, 870) <0.001
1999 AP*Credit 0.977 3.39 (6, 870) 0.003
2000 AP 0.876 26.76 (6, 1130) <0.001
2000 Credit 0.968 6.19 (6, 1130) <0.001
2000 AP*Credit 0.995 0.95 (6, 1130) 0.459
2001 AP 0.920 18.13 (6, 1247) <0.001
2001 Credit 0.947 11.71 (6, 1247) <0.001
2001 AP*Credit 0.985 3.25 (6, 1247) 0.004
continued on next page
13
Subject Year Effect Wilks’ Lambda F DF for F Pr > F
AP Chemistry
1998 AP 0.924 8.20 (6, 599) <0.001
1998 Credit 0.911 9.81 (6, 599) <0.001
1998 AP*Credit 0.985 1.54 (6, 599) 0.162
1999 AP 0.847 21.00 (6, 696) <0.001
1999 Credit 0.886 14.86 (6, 696) <0.001
1999 AP*Credit 0.963 4.50 (6, 696) <0.001
2000 AP 0.874 18.93 (6, 787) <0.001
2000 Credit 0.915 12.12 (6, 787) <0.001
2000 AP*Credit 0.957 5.90 (6, 787) <0.001
2001 AP 0.876 20.02 (6, 849) <0.001
2001 Credit 0.921 12.10 (6, 849) <0.001
2001 AP*Credit 0.965 5.10 (6, 849) <0.001
AP Macroeconomics
1998 AP 0.975 3.02 (6, 699) 0.006
1998 Credit 0.941 7.29 (6, 699) <0.001
1998 AP*Credit 0.960 4.86 (6, 699) <0.001
1999 AP 0.948 5.94 (6, 647) <0.001
1999 Credit 0.907 11.01 (6, 647) <0.001
1999 AP*Credit 0.955 5.12 (6, 647) <0.001
2000 AP 0.930 10.84 (6, 865) <0.001
2000 Credit 0.899 16.19 (6, 865) <0.001
2000 AP*Credit 0.970 4.46 (6, 865) <0.001
2001 AP 0.936 10.00 (6, 881) <0.001
2001 Credit 0.938 9.77 (6, 881) <0.001
2001 AP*Credit 0.974 3.90 (6, 881) <0.001
AP English Language and Composition
1998 AP 0.980 8.78 (6, 2529) <0.001
1998 Credit 0.957 18.92 (6, 2529) <0.001
1998 AP*Credit 0.988 4.92 (6, 2529) <0.001
1999 AP 0.987 6.67 (6, 3050) <0.001
1999 Credit 0.959 21.97 (6, 3050) <0.001
1999 AP*Credit 0.987 6.82 (6, 3050) <0.001
2000 AP 0.971 15.52 (6, 3174) <0.001
2000 Credit 0.956 24.50 (6, 3174) <0.001
2000 AP*Credit 0.990 5.32 (6, 3174) <0.001
2001 AP 0.984 8.39 (6, 3031) <0.001
2001 Credit 0.948 27.79 (6, 3031) <0.001
2001 AP*Credit 0.981 9.69 (6, 3031) <0.001
AP English Literature and Composition
1998 AP 0.975 12.12 (6, 2828) <0.001
1998 Credit 0.938 31.22 (6, 2828) <0.001
1998 AP*Credit 0.981 9.12 (6, 2828) <0.001
1999 AP 0.975 13.69 (6, 3174) <0.001
1999 Credit 0.943 31.82 (6, 3174) <0.001
1999 AP*Credit 0.977 12.37 (6, 3174) <0.001
2000 AP 0.972 15.60 (6, 3215) <0.001
2000 Credit 0.926 42.61 (6, 3215) <0.001
2000 AP*Credit 0.976 13.24 (6, 3215) <0.001
2001 AP 0.975 13.46 (6, 3182) <0.001
2001 Credit 0.929 40.32 (6, 3182) <0.001
2001 AP*Credit 0.970 16.68 (6, 3182) <0.001
continued on next page
14
Table 1 MANOVA Results — Factorial Analysis for AP vs. Non-AP Students (continued)
Subject Year Effect Wilks’ Lambda F DF for F Pr > F
AP Government and Politics:
United States
1998 AP 0.958 7.58 (6, 1025) <0.001
1998 Credit 0.924 14.02 (6, 1025) <0.001
1998 AP*Credit 0.959 7.28 (6, 1025) <0.001
1999 AP 0.958 8.68 (6, 1181) <0.001
1999 Credit 0.890 24.28 (6, 1181) <0.001
1999 AP*Credit 0.965 7.13 (6, 1181) <0.001
2000 AP 0.960 9.63 (6, 1374) <0.001
2000 Credit 0.913 21.85 (6, 1374) <0.001
2000 AP*Credit 0.965 8.20 (6, 1374) <0.001
2001 AP 0.942 13.79 (6, 1345) <0.001
2001 Credit 0.911 21.80 (6, 1345) <0.001
2001 AP*Credit 0.951 11.63 (6, 1345) <0.001
AP History: United States
1998 AP 0.912 23.28 (6, 1446) <0.001
1998 Credit 0.886 31.13 (6, 1446) <0.001
1998 AP*Credit 0.927 18.89 (6, 1446) <0.001
1999 AP 0.923 22.76 (6, 1644) <0.001
1999 Credit 0.898 31.00 (6, 1644) <0.001
1999 AP*Credit 0.940 17.38 (6, 1644) <0.001
2000 AP 0.942 18.87 (6, 1833) <0.001
2000 Credit 0.918 27.31 (6, 1833) <0.001
2000 AP*Credit 0.953 15.22 (6, 1833) <0.001
2001 AP 0.915 29.33 (6, 1902) <0.001
2001 Credit 0.911 31.05 (6, 1902) <0.001
2001 AP*Credit 0.949 17.01 (6, 1902) <0.001
AP Spanish
1998 AP 0.959 6.53 (6, 905) <0.001
1998 Credit 0.978 3.34 (6, 905) 0.003
1998 AP*Credit 0.990 1.49 (6, 905) 0.179
1999 AP 0.967 5.61 (6, 988) <0.001
1999 Credit 0.977 3.88 (6, 988) <0.001
1999 AP*Credit 0.980 3.32 (6, 988) 0.003
2000 AP 0.956 8.22 (6, 1085) <0.001
2000 Credit 0.984 3.01 (6, 1085) 0.006
2000 AP*Credit 0.982 3.40 (6, 1085) 0.003
2001 AP 0.961 7.52 (6, 1113) <0.001
2001 Credit 0.982 3.47 (6, 1113) 0.002
2001 AP*Credit 0.980 3.71 (6, 1113) 0.001

15
Table 2 Descriptive Statistics and Planned Comparison Results for AP vs. Non-AP Biology
Dependent Measure Group1998 1999 2000 2001
N Mean/Rate N Mean/Rate N Mean/Rate N Mean/Rate
First-Year Credit Hours
AP Main Effect
AP 335 37.27 a 373 37.72 a 427 36.89 484 37.37 a
Non-AP 454 34.97 a 493 33.97 a 464 35.79 545 34.69 a
Credit Main Effect
Credit 578 38.63 b 629 37.48 b 384 37.94 b 479 36.74
No Credit 211 33.61 b 237 34.21 b 507 34.74 b 550 35.31
AP x Credit Interaction
AP+ 231 40.32 c 253 39.67 169 38.72 209 37.76
Non-AP+ 347 36.95 c 376 35.29 215 37.16 270 35.73
AP- 104 34.23 120 35.78 258 35.05 275 36.97 d
Non-AP- 107 32.99 117 32.64 249 34.42 275 33.65 d
Subject Credit Hours
AP Main Effect
AP 335 15.48 a 373 17.48 a 427 20.53 a 484 17.21 a
Non-AP 454 10.70 a 493 11.64 a 464 12.17 a 545 11.25 a
Credit Main Effect
Credit 578 14.09 629 16.42 b 384 18.60 b 479 16.04 b
No Credit 211 12.08 237 12.70 b 507 14.10 b 550 12.42 b
AP x Credit Interaction
AP+ 231 18.21 c 253 20.92 169 24.68 c 209 20.67 c
Non-AP+ 347 9.96 c 376 11.92 215 12.51 c 270 11.42 c
AP- 104 12.74 120 14.04 258 16.37 d 275 13.74
Non-AP- 107 11.43 117 11.36 249 11.84 d 275 11.09
Overall College Credit Hours
AP Main Effect
AP 335 146.60 373 146.98 a 427 147.14 a 484 125.28 a
Non-AP 454 139.90 493 137.72 a 464 137.45 a 545 118.34 a
Credit Main Effect
Credit 578 152.51 b 629 150.55 b 384 153.31 b 479 129.64 b
No Credit 211 133.99 b 237 134.15 b 507 131.28 b 550 113.99 b
AP x Credit Interaction
AP+ 231 159.12 c 253 158.24 169 161.21 c 209 135.46 c
Non-AP+ 347 145.90 c 376 142.86 215 145.41 c 270 123.82 c
AP- 104 134.09 120 135.72 258 133.07 275 115.11
Non-AP- 107 133.89 117 132.58 249 129.49 275 112.87
First-Year GPA
AP Main Effect
AP 335 3.13 373 3.18 427 3.32 484 3.21
Non-AP 454 3.15 493 3.11 464 3.28 545 3.25
Credit Main Effect
Credit 578 3.31 b 629 3.35 b 384 3.50 b 479 3.39 b
No Credit 211 2.97 b 237 2.94 b 507 3.10 b 550 3.06 b
AP x Credit Interaction
AP+ 231 3.30 253 3.41 169 3.56 209 3.40
Non-AP+ 347 3.32 376 3.29 215 3.44 270 3.39
AP- 104 2.96 120 2.95 258 3.08 275 3.02
Non-AP- 107 2.98 117 2.93 249 3.12 275 3.10
continued on next page
16
Table 2 Descriptive Statistics and Planned Comparison Results for AP vs. Non-AP Biology (continued)
Dependent Measure Group1998 1999 2000 2001
N Mean/Rate N Mean/Rate N Mean/Rate N Mean/Rate
Subject GPA
AP Main Effect
AP 335 2.99 373 3.00 427 3.15 484 3.07
Non-AP 454 2.84 493 2.82 464 3.06 545 3.01
Credit Main Effect
Credit 578 3.14 b 629 3.18 b 384 3.40 b 479 3.27 b
No Credit 211 2.68 b 237 2.64 b 507 2.81 b 550 2.81 b
AP x Credit Interaction
AP+ 231 3.24 253 3.33 169 3.54 c 209 3.37
Non-AP+ 347 3.04 376 3.04 215 3.26 c 270 3.17
AP- 104 2.73 120 2.66 258 2.77 275 2.78
Non-AP- 107 2.64 117 2.61 249 2.86 275 2.84
Overall College GPA
AP Main Effect
AP 335 3.06 373 3.11 427 3.20 484 3.10
Non-AP 454 3.05 493 3.07 464 3.16 545 3.14
Credit Main Effect
Credit 578 3.18 b 629 3.24 b 384 3.32 b 479 3.24 b
No Credit 211 2.94 b 237 2.93 b 507 3.04 b 550 3.00 b
AP x Credit Interaction
AP+ 231 3.20 253 3.32 169 3.38 209 3.23
Non-AP+ 347 3.15 376 3.17 215 3.27 270 3.25
AP- 104 2.92 120 2.90 258 3.03 275 2.97
Non-AP- 107 2.95 117 2.97 249 3.04 275 3.03
Note: Means with matching superscript letters within each year and dependent measure are significantly different at the α = 0.01 level.

17
Table 3
Descriptive Statistics and Planned Comparison Results for AP vs. Non-AP Calculus AB
Dependent Measure Group1998 1999 2000 2001
N Mean/Rate N Mean/Rate N Mean/Rate N Mean/Rate
First-Year Credit Hours
AP Main Effect
AP 991 36.35 a 1186 36.20 a 1326 35.98 a 1552 35.76
Non-AP 967 34.35 a 1115 33.90 a 1255 34.02 a 1469 34.75
Credit Main Effect
Credit 1196 36.90 b 1369 35.71 b 1470 35.82 b 1680 35.85 b
No Credit 548 33.81 b 664 33.89 b 814 34.32 b 986 34.31 b
Did Not Claim CBE
214 35.35 268 35.55 297 34.87 355 35.61
AP x Credit Interaction
AP+ 604 38.09 702 36.39 752 36.32 858 36.57 d
Non-AP+ 592 35.70 667 35.04 718 35.32 822 35.13 d
AP- 277 34.59 344 34.94 e 419 35.20 e 511 34.77
Non-AP- 271 33.03 320 32.84 e 395 33.44 e 475 33.85
AP Did Not Claim CBE
110 36.37 140 37.28 f 155 36.44 f 183 35.96
Matched Non-AP (Did Not Claim CBE)
104 34.32 128 33.82 142 33.30 172 35.27
Subject Credit Hours
AP Main Effect
AP 991 14.44 a 1186 14.40 a 1326 13.84 a 1552 13.12 a
Non-AP 967 12.35 a 1125 11.26 a 1255 10.87 a 1469 10.89 a
Credit Main Effect
Credit 1196 13.86 b 1369 13.28 b 1470 12.89 b 1680 12.32 b
No Credit 548 11.66 bc 671 11.74 bc 814 11.12 bc 986 10.50 bc
Did Not Claim CBE
214 14.67 c 271 13.46 c 297 13.07 c 355 13.19 c
AP x Credit Interaction
AP+ 604 15.09 702 14.21 d 752 13.85 d 858 13.07 d
Non-AP+ 592 12.63 667 12.36 d 718 11.93 d 822 11.56 d
AP- 277 11.98 344 12.61 e 419 12.13 e 511 11.17 e
Non-AP- 271 11.34 327 10.87 e 395 10.10 e 475 9.82 e
AP Did Not Claim CBE
110 16.25 140 16.38 f 155 15.55 f 183 15.11 f
Matched Non-AP (Did Not Claim CBE)
104 13.09 131 10.55 f 142 10.58 f 172 11.27 f
continued on next page

18
Table 3
Descriptive Statistics and Planned Comparison Results for AP vs. Non-AP Calculus AB (continued)
Dependent Measure Group1998 1999 2000 2001
N Mean/Rate N Mean/Rate N Mean/Rate N Mean/Rate
Overall College Credit Hours
AP Main Effect
AP 991 142.89 a 1186 137.99 a 1326 134.62 a 1552 112.86
Non-AP 967 133.48 a 1125 129.37 a 1255 129.45 a 1469 110.51
Credit Main Effect
Credit 1196 142.94 b 1369 140.23 bc 1470 136.80 b 1680 118.46 b
No Credit 548 132.84 b 671 128.17 b 814 127.34 b 986 104.89 b
Did Not Claim CBE
214 138.76 271 132.64 c 297 131.97 355 111.71 b
AP x Credit Interaction
AP+ 604 148.07 702 144.87 d 752 140.08 d 858 121.70 d
Non-AP+ 592 137.81 667 135.58 d 718 133.52 d 822 115.21 d
AP- 277 134.91 344 132.04 e 419 126.88 511 103.76
Non-AP- 271 130.77 327 124.29 e 395 127.80 475 106.03
AP Did Not Claim CBE
110 145.68 140 137.05 155 136.90 183 113.13
Matched Non-AP (Did Not Claim CBE)
104 131.84 131 128.23 142 127.04 172 110.30
First-Year GPA
AP Main Effect
AP 991 3.16 1186 3.14 a 1326 3.21 a 1552 3.17
Non-AP 967 3.09 1125 3.04 a 1255 3.09 a 1469 3.10
Credit Main Effect
Credit 1196 3.27 b 1369 3.26 b 1470 3.28 b 1680 3.29 b
No Credit 548 2.95 bc 671 2.91 b 814 3.02 b 986 2.98 b
Did Not Claim CBE
214 3.16 c 271 3.10 b 297 3.14 b 355 3.15 b
AP x Credit Interaction
AP+ 604 3.33 702 3.35 d 752 3.35 d 858 3.36 d
Non-AP+ 592 3.21 667 3.17 d 718 3.21 d 822 3.21 d
AP- 277 2.92 344 2.95 419 3.02 511 2.97
Non-AP- 271 2.98 327 2.87 395 3.02 475 2.98
AP Did Not Claim CBE
110 3.24 140 3.11 155 3.26 f 183 3.18
Matched Non-AP (Did Not Claim CBE)
104 3.09 131 3.09 142 3.02 f 172 3.12
Subject GPA
AP Main Effect
AP 991 3.12 a 1186 3.09 a 1326 3.22 a 1552 3.10 a
Non-AP 967 2.93 a 1125 2.89 a 1255 2.98 a 1469 2.98 a
Credit Main Effect
Credit 1196 3.26 b 1369 3.28 b 1470 3.33 b 1680 3.31 b
No Credit 548 2.79 b 671 2.72 b 814 2.89 b 986 2.80 b
Did Not Claim CBE
214 3.03 b 271 2.98 b 297 3.08 b 355 3.02 b
AP x Credit Interaction
AP+ 604 3.41 702 3.49 d 752 3.49 d 858 3.46 d
Non-AP+ 592 3.11 667 3.07 d 718 3.17 d 822 3.15 d
AP- 277 2.82 344 2.79 419 2.91 511 2.76
Non-AP- 271 2.77 327 2.64 395 2.87 475 2.85
AP Did Not Claim CBE
110 3.13 140 3.00 155 3.26 f 183 3.09
Matched Non-AP (Did Not Claim CBE)
104 2.93 131 2.96 142 2.91 f 172 2.94
continued on next page

19
Dependent Measure Group1998 1999 2000 2001
N Mean/Rate N Mean/Rate N Mean/Rate N Mean/Rate
Overall College GPA
AP Main Effect
AP 991 3.02 1186 3.02 1326 3.09 a 1552 2.97
Non-AP 967 3.01 1125 2.99 1255 2.98 a 1469 2.98
Credit Main Effect
Credit 1196 3.14 b 1369 3.14 b 1470 3.15 b 1680 3.06 b
No Credit 548 2.91 b 671 2.87 b 814 2.91 bc 986 2.88 b
Did Not Claim CBE
214 3.01 271 3.01 297 3.05 c 355 2.98
AP x Credit Interaction
AP+ 604 3.18 702 3.21 d 752 3.24 d 858 3.08
Non-AP+ 592 3.09 667 3.07 d 718 3.06 d 822 3.03
AP- 277 2.88 344 2.88 419 2.88 511 2.86
Non-AP- 271 2.94 327 2.85 395 2.93 475 2.91
AP Did Not Claim CBE
110 3.01 140 2.96 155 3.16 183 2.97
Matched Non-AP (Did Not Claim CBE)
104 3.01 131 3.05 142 2.94 172 2.99
Sequent Course (M408D) Grade
AP Main Effect
AP 566 2.87 671 2.85 722 2.94 829 2.82
Non-AP 340 2.99 340 2.83 406 2.85 447 2.95
Credit Main Effect
Credit 604 3.06 b 636 3.14 bc 693 3.13 bc 763 3.02 b
No Credit 176 2.73 b 224 2.53 b 264 2.69 b 319 2.67 bc
Did Not Claim CBE
126 3.00 151 2.85 c 171 2.87 c 194 2.96 c
AP x Credit Interaction
AP+ 380 3.04 410 3.26 d 430 3.19 d 489 3.05
Non-AP+ 224 3.08 226 3.02 d 263 3.08 d 274 3.00
AP- 98 2.54 144 2.45 165 2.56 196 2.45 e
Non-AP- 78 2.91 80 2.61 99 2.82 123 2.89 e
AP Did Not Claim CBE
88 3.02 117 2.84 127 3.08 144 2.96
Matched Non-AP (Did Not Claim CBE)
38 2.97 34 2.85 44 2.66 50 2.96
Note: Means with matching superscript letters within each year and dependent measure are significantly different at the α = 0.01 level.

20
Table 4 Descriptive Statistics and Planned Comparison Results for AP vs. Non-AP Calculus BC
Dependent Measure Group1998 1999 2000 2001
N Mean/Rate N Mean/Rate N Mean/Rate N Mean/Rate
First-Year Credit Hours
AP Main Effect
AP 437 39.87 a 440 37.90 574 38.04 a 630 37.38 a
Non-AP 427 36.08 a 426 35.66 544 34.81 a 598 34.86 a
Credit Main Effect
Credit 657 38.39 663 37.98 b 863 37.05 946 36.49
No Credit
207 37.56 203 35.57 b 255 35.80 282 35.75
AP x Credit Interaction
AP+ 332 39.88 c 337 40.34 c 445 38.95 485 37.17
Non-AP+
325 36.91 c 326 35.63 c 418 35.15 461 35.82
AP- 105 39.86 d 103 35.47 129 37.13 145 37.59 d
Non-AP- 102 35.26 d 100 35.68 126 34.47 137 33.91 d
Subject Credit Hours
AP Main Effect
AP 437 16.36 a 440 16.18 a 574 17.27 a 630 14.70 a
Non-AP 427 12.61 a 426 11.80 a 544 11.09 a 598 10.92 a
Credit Main Effect
Credit 657 15.30 663 15.13 b 863 14.98 b 946 14.27 b
No Credit
207 13.67 203 12.85 b 255 13.38 b 282 11.35 b
AP x Credit Interaction
AP+ 332 17.79 c 337 17.88 c 445 17.99 485 16.64 c
Non-AP+
325 12.82 c 326 12.38 c 418 11.97 461 11.90 c
AP- 105 14.94 103 14.48 d 129 16.55 145 12.75 d
Non-AP- 102 12.40 100 11.22 d 126 10.20 137 9.94 d
Overall College Credit Hours
AP Main Effect
AP 437 150.49 a 440 149.25 a 574 145.10 a 630 124.75 a
Non-AP 427 140.62 a 426 135.11 a 544 132.65 a 598 113.83 a
Credit Main Effect
Credit 657 150.26 b 663 145.79 863 142.78 b 946 125.14 b
No Credit
207 140.85 b 203 138.57 255 134.97 b 282 113.44 b
AP x Credit Interaction
AP+ 332 157.30 c 337 154.58 c 445 150.13 485 132.26 c
Non-AP+
325 143.23 c 326 136.99 c 418 135.44 461 118.02 c
AP- 105 143.69 103 143.92 129 140.08 145 117.24
Non-AP- 102 138.02 100 133.22 126 129.86 137 109.63
continued on next page
21
Dependent Measure Group1998 1999 2000 2001
N Mean/Rate N Mean/Rate N Mean/Rate N Mean/Rate
First-Year GPA
AP Main Effect
AP 437 3.27 440 3.34 574 3.36 630 3.34
Non-AP 427 3.14 426 3.22 544 3.26 598 3.27
Credit Main Effect
Credit 657 3.36 b 663 3.39 b 863 3.40 b 946 3.40 b
No Credit
207 3.06 b 203 3.17 b 255 3.22 b 282 3.21 b
AP x Credit Interaction
AP+ 332 3.47 c 337 3.50 c 445 3.49 485 3.47 c
Non-AP+
325 3.24 c 326 3.28 c 418 3.30 461 3.32 c
AP- 105 3.08 103 3.19 129 3.23 145 3.21
Non-AP- 102 3.04 100 3.16 126 3.21 137 3.21
Subject GPA
AP Main Effect
AP 437 3.31 a 440 3.40 a 574 3.40 a 630 3.42 a
Non-AP 427 3.11 a 426 3.19 a 544 3.18 a 598 3.18 a
Credit Main Effect
Credit 657 3.38 b 663 3.44 b 863 3.41 b 946 3.43 b
No Credit
207 3.04 b 203 3.15 b 255 3.17 b 282 3.17 b
AP x Credit Interaction
AP+ 332 3.57 c 337 3.62 c 445 3.59 485 3.60 c
Non-AP+
325 3.18 c 326 3.26 c 418 3.24 461 3.26 c
AP- 105 3.04 103 3.18 129 3.22 145 3.24
Non-AP- 102 3.04 100 3.13 126 3.12 137 3.10
Overall College GPA
AP Main Effect
AP 437 3.16 440 3.14 574 3.19 630 3.12
Non-AP 427 3.05 426 3.07 544 3.10 598 3.00
Credit Main Effect
Credit 657 3.20 b 663 3.21 b 863 3.24 b 946 3.11
No Credit
207 3.02 b 203 3.01 b 255 3.05 b 282 3.00
AP x Credit Interaction
AP+ 332 3.32 c 337 3.34 c 445 3.32 485 3.14
Non-AP+
325 3.07 c 326 3.08 c 418 3.16 461 3.08
AP- 105 3.01 103 2.95 129 3.06 145 3.09
Non-AP- 102 3.03 100 3.07 126 3.04 137 2.91
Sequent Course (M408D) Grade
AP Main Effect
AP 265 3.04 266 3.21 a 366 3.15 378 3.11
Non-AP 178 2.90 185 2.85 a 233 2.93 246 2.96
Credit Main Effect
Credit 348 3.14 b 347 3.32 b 477 3.22 b 495 3.24 b
No Credit
95 2.80 b 104 2.74 b 122 2.85 b 129 2.83 b
AP x Credit Interaction
AP+ 203 3.37 c 200 3.52 c 286 3.44 294 3.41 c
Non-AP+
145 2.91 c 147 3.12 c 191 2.99 201 3.06 c
AP- 62 2.71 66 2.89 80 2.85 84 2.81
Non-AP- 33 2.89 38 2.59 42 2.86 45 2.85
Note: Means with matching superscript letters within each year and dependent measure are significantly different at the α = 0.01 level.

22
Table 5 Descriptive Statistics and Planned Comparison Results for AP vs. Non-AP Chemistry
Dependent Measure Group1998 1999 2000 2001
N Mean/Rate N Mean/Rate N Mean/Rate N Mean/Rate
First-Year Credit Hours
AP Main Effect
AP 287 38.34 332 38.89 a 371 38.22 a 307 38.19 a
Non-AP 317 36.31 366 35.40 a 418 35.19 a 543 36.01 a
Credit Main Effect
Credit 245 38.23 254 39.20 b 279 37.75 b 400 38.18 b
No Credit 359 36.42 444 35.10 b 510 35.66 b 450 36.03 b
AP x Credit Interaction
AP+ 108 39.36 113 42.16 c 117 39.67 c 129 39.54
Non-AP+ 137 37.10 141 36.25 c 162 35.83 c 178 36.81
AP- 179 37.32 219 35.63 254 36.77 d 271 36.84
Non-AP- 180 35.52 225 34.56 256 34.56 d 272 35.21
Subject Credit Hours
AP Main Effect
AP 287 17.51 a 332 17.74 a 371 17.64 a 307 16.91 a
Non-AP 317 11.71 a 366 10.08 a 418 11.59 a 543 9.64 a
Credit Main Effect
Credit 245 16.37 b 254 15.52 b 279 16.28 b 400 14.72 b
No Credit 359 12.85 b 444 12.30 b 510 12.95 b 450 11.82 b
AP x Credit Interaction
AP+ 108 20.32 113 21.29 c 117 21.21 c 129 20.08 c
Non-AP+ 137 12.42 141 9.74 c 162 11.36 c 178 9.37 c
AP- 179 14.70 219 14.19 d 254 14.08 271 13.73 d
Non-AP- 180 11.00 225 10.41 d 256 11.83 272 9.91 d
Overall College Credit Hours
AP Main Effect
AP 287 153.65 332 155.79 a 371 149.72 a 307 130.56 a
Non-AP 317 146.38 366 138.63 a 418 137.75 a 543 116.59 a
Credit Main Effect
Credit 245 157.01 b 254 157.55 b 279 152.39 b 400 132.26 b
No Credit 359 143.03 b 444 136.87 b 510 135.08 b 450 114.89 b
AP x Credit Interaction
AP+ 108 163.15 113 169.21 c 117 164.87 c 129 144.76 c
Non-AP+ 137 150.87 141 145.88 c 162 139.91 c 178 119.77 c
AP- 179 144.16 219 142.36 d 254 134.56 271 116.36
Non-AP- 180 141.90 225 131.38 d 256 135.59 272 113.41
First-Year GPA
AP Main Effect
AP 287 3.34 332 3.38 371 3.39 a 307 3.39 a
Non-AP 317 3.22 366 3.25 418 3.20 a 543 3.24 a
Credit Main Effect
Credit 245 3.46 b 254 3.50 b 279 3.43 b 400 3.44 b
No Credit 359 3.10 b 444 3.13 b 510 3.15 b 450 3.19 b
AP x Credit Interaction
AP+ 108 3.57 113 3.60 117 3.57 c 129 3.54 c
Non-AP+ 137 3.36 141 3.40 162 3.29 c 178 3.34 c
AP- 179 3.11 219 3.16 254 3.21 271 3.24
Non-AP- 180 3.09 225 3.10 256 3.10 272 3.14
continued on next page
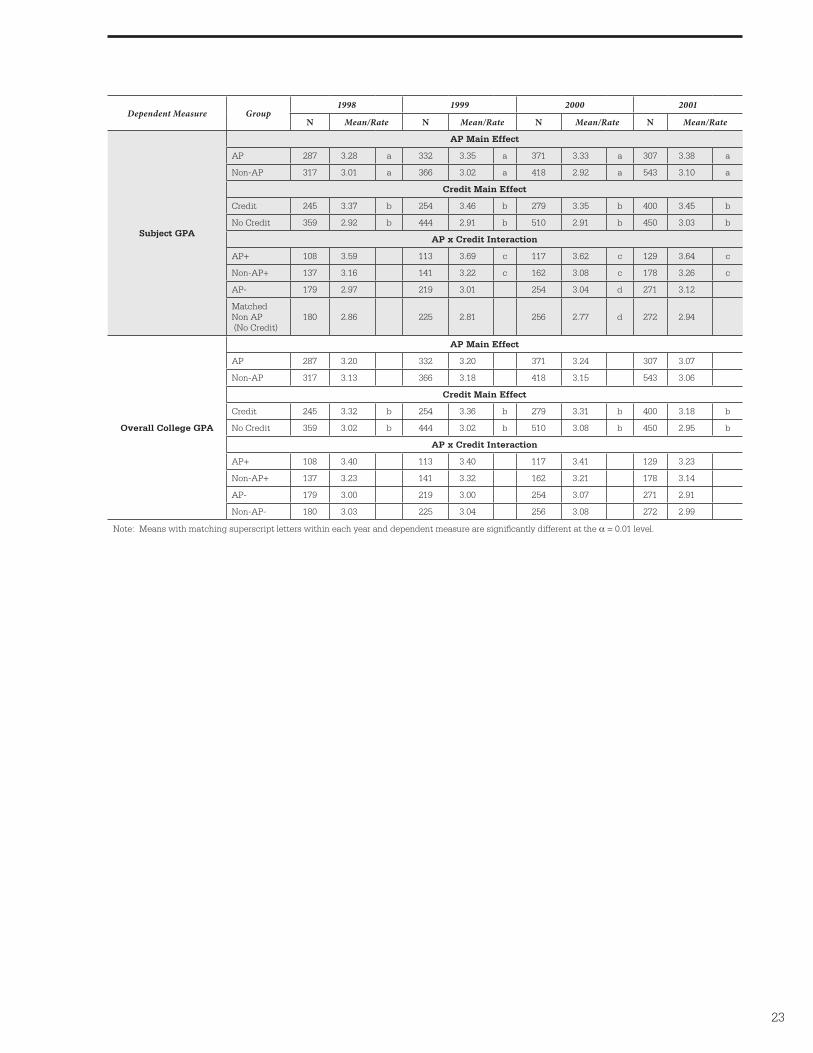
23
Dependent Measure Group1998 1999 2000 2001
N Mean/Rate N Mean/Rate N Mean/Rate N Mean/Rate
Subject GPA
AP Main Effect
AP 287 3.28 a 332 3.35 a 371 3.33 a 307 3.38 a
Non-AP 317 3.01 a 366 3.02 a 418 2.92 a 543 3.10 a
Credit Main Effect
Credit 245 3.37 b 254 3.46 b 279 3.35 b 400 3.45 b
No Credit 359 2.92 b 444 2.91 b 510 2.91 b 450 3.03 b
AP x Credit Interaction
AP+ 108 3.59 113 3.69 c 117 3.62 c 129 3.64 c
Non-AP+ 137 3.16 141 3.22 c 162 3.08 c 178 3.26 c
AP- 179 2.97 219 3.01 254 3.04 d 271 3.12
Matched Non AP (No Credit)
180 2.86 225 2.81 256 2.77 d 272 2.94
Overall College GPA
AP Main Effect
AP 287 3.20 332 3.20 371 3.24 307 3.07
Non-AP 317 3.13 366 3.18 418 3.15 543 3.06
Credit Main Effect
Credit 245 3.32 b 254 3.36 b 279 3.31 b 400 3.18 b
No Credit 359 3.02 b 444 3.02 b 510 3.08 b 450 2.95 b
AP x Credit Interaction
AP+ 108 3.40 113 3.40 117 3.41 129 3.23
Non-AP+ 137 3.23 141 3.32 162 3.21 178 3.14
AP- 179 3.00 219 3.00 254 3.07 271 2.91
Non-AP- 180 3.03 225 3.04 256 3.08 272 2.99
Note: Means with matching superscript letters within each year and dependent measure are significantly different at the α = 0.01 level.

24
Table 6 Descriptive Statistics and Planned Comparison Results for AP vs. Non-AP Macroeconomics
Dependent Measure Group1998 1999 2000 2001
N Mean/Rate N Mean/Rate N Mean/Rate N Mean/Rate
First-Year Credit Hours
AP Main Effect
AP 275 37.40 249 37.59 340 37.25 a 372 36.76
Non-AP 432 35.66 406 35.48 533 34.62 a 518 35.72
Credit Main Effect
Credit 403 37.53 348 37.50 447 36.66 139 36.36
No Credit
304 35.53 307 35.57 426 35.20 751 36.12
AP x Credit Interaction
AP+ 122 38.02 98 38.86 131 38.07 c 52 36.79
Non-AP+
281 37.04 250 36.14 316 35.25 c 87 35.93
AP- 153 36.77 151 36.32 209 36.43 320 36.73
Non-AP- 151 34.28 156 34.82 217 33.98 431 35.50
Subject Credit Hours
AP Main Effect
AP 275 8.74 a 249 8.16 a 340 8.97 a 372 8.73 a
Non-AP 432 6.94 a 406 6.32 a 533 6.41 a 518 5.54 a
Credit Main Effect
Credit 403 8.60 b 348 8.01 b 447 8.64 b 139 7.94 b
No Credit
304 7.08 b 307 6.47 b 426 6.73 b 751 6.33 b
AP x Credit Interaction
AP+ 122 10.58 c 98 10.22 c 131 10.89 c 52 10.48 c
Non-AP+
281 6.62 c 250 5.80 c 316 6.40 c 87 5.40 c
AP- 153 6.90 151 6.10 209 7.05 320 6.99 d
Non-AP- 151 7.26 156 6.84 217 6.41 431 5.67 d
Overall College Credit Hours
AP Main Effect
AP 275 142.24 249 145.72 a 340 139.18 372 129.86 a
Non-AP 432 137.25 406 136.56 a 533 134.65 518 118.55 a
Credit Main Effect
Credit 403 142.54 348 145.23 b 447 141.83 b 139 131.57 b
No Credit
304 136.95 307 137.05 b 426 131.99 b 751 116.84 b
AP x Credit Interaction
AP+ 122 145.66 98 149.39 131 144.11 52 139.81 c
Non-AP+
281 139.42 250 141.07 316 139.56 87 123.33 c
AP- 153 138.82 151 142.06 d 209 134.25 320 119.90
Non-AP- 151 135.08 156 132.04 d 217 129.74 431 113.77
continued on next page

25
Dependent Measure Group1998 1999 2000 2001
N Mean/Rate N Mean/Rate N Mean/Rate N Mean/Rate
First-Year GPA
AP Main Effect
AP 275 3.24 249 3.34 a 340 3.35 a 372 3.49 a
Non-AP 432 3.21 406 3.18 a 533 3.12 a 518 3.33 a
Credit Main Effect
Credit 403 3.34 b 348 3.42 b 447 3.42 b 139 3.58 b
No Credit
304 3.11 b 307 3.10 b 426 3.05 b 751 3.23 b
AP x Credit Interaction
AP+ 122 3.43 98 3.53 c 131 3.59 c 52 3.72 c
Non-AP+
281 3.25 250 3.30 c 316 3.26 c 87 3.44 c
AP- 153 3.06 151 3.15 209 3.12 320 3.25
Non-AP- 151 3.17 156 3.05 217 2.98 431 3.21
Subject GPA
AP Main Effect
AP 275 3.04 249 3.17 a 340 3.07 a 372 3.40 a
Non-AP 432 2.95 406 2.89 a 533 2.79 a 518 3.04 a
Credit Main Effect
Credit 403 3.18 b 348 3.27 b 447 3.20 b 139 3.45 b
No Credit
304 2.81 b 307 2.80 b 426 2.67 b 751 2.98 b
AP x Credit Interaction
AP+ 122 3.29 98 3.46 c 131 3.42 c 52 3.74 c
Non-AP+
281 3.07 250 3.08 c 316 2.97 c 87 3.17 c
AP- 153 2.79 151 2.88 209 2.72 320 3.05
Non-AP- 151 2.82 156 2.71 217 2.61 431 2.92
Overall GPA
AP Main Effect
AP 275 3.05 249 3.18 340 3.16 372 2.94
Non-AP 432 3.06 406 3.09 533 3.02 518 2.94
Credit Main Effect
Credit 403 3.08 348 3.25 b 447 3.18 b 139 3.00
No Credit
304 3.04 307 3.02 b 426 3.00 b 751 2.87
AP x Credit Interaction
AP+ 122 3.12 98 3.32 131 3.25 52 2.99
Non-AP+
281 3.04 250 3.18 316 3.12 87 3.02
AP- 153 2.99 151 3.04 209 3.08 320 2.88
Non-AP- 151 3.09 156 2.99 217 2.92 431 2.86
Note: Means with matching superscript letters within each year and dependent measure are significantly different at the α = 0.01 level.

26
Table 7 Descriptive Statistics and Planned Comparison Results for AP vs. Non-AP English Language and Composition
Dependent Measure Group1998 1999 2000 2001
N Mean/Rate N Mean/Rate N Mean/Rate N Mean/Rate
First-Year Credit Hours
AP Main Effect
AP 1195 36.35 a 1498 35.12 a 1579 35.29 a 1616 34.74 a
Non-AP 1306 33.71 a 1557 33.28 a 1594 32.72 a 1416 33.43 a
Credit Main Effect
Credit 1945 36.28 b 2372 34.77 b 2406 34.80 b 2312 34.75 b
No Credit
556 33.79 b 683 33.63 b 767 33.21 b 720 33.42 b
AP x Credit Interaction
AP+ 924 38.12 c 1159 35.81 c 1204 36.19 c 1246 35.69 c
Non-AP+
1021 34.44 c 1213 33.72 c 1202 33.42 c 1066 33.81 c
AP- 271 34.59 339 34.43 375 34.39 d 370 33.79
Non-AP- 285 32.99 344 32.83 392 32.03 d 350 33.06
Subject Credit Hours
AP Main Effect
AP 1195 9.57 a 1498 9.19 a 1579 9.00 a 1616 8.29 a
Non-AP 1306 8.60 a 1557 8.18 a 1594 7.79 a 1416 7.41 a
Credit Main Effect
Credit 1945 9.84 b 2372 9.44 b 2406 9.17 b 2312 8.57 b
No Credit
556 8.32 b 683 7.92 b 767 7.61 b 720 7.13 b
AP x Credit Interaction
AP+ 924 11.06 c 1159 10.56 c 1204 10.39 c 1246 9.51 c
Non-AP+
1021 8.62 c 1213 8.31 c 1202 7.96 c 1066 7.64 c
AP- 271 8.07 339 7.81 375 7.61 370 7.08
Non-AP- 285 8.58 344 8.04 392 7.61 350 7.19
Overall College Credit Hours
AP Main Effect
AP 1195 139.19 a 1498 136.17 a 1579 133.73 a 1616 114.22 a
Non-AP 1306 132.17 a 1557 129.67 a 1594 123.00 a 1416 105.27 a
Credit Main Effect
Credit 1945 138.58 b 2372 135.85 b 2406 132.13 b 2312 115.54 b
No Credit
556 132.79 b 683 129.99 b 767 124.60 b 720 103.95 b
AP x Credit Interaction
AP+ 924 142.28 c 1159 139.46 c 1204 139.16 c 1246 123.81 c
Non-AP+
1021 134.87 c 1213 132.24 c 1202 125.10 c 1066 107.27 c
AP- 271 136.10 339 132.88 375 128.31 d 370 104.63
Non-AP- 285 129.47 344 127.10 392 120.89 d 350 103.28
continued on next page
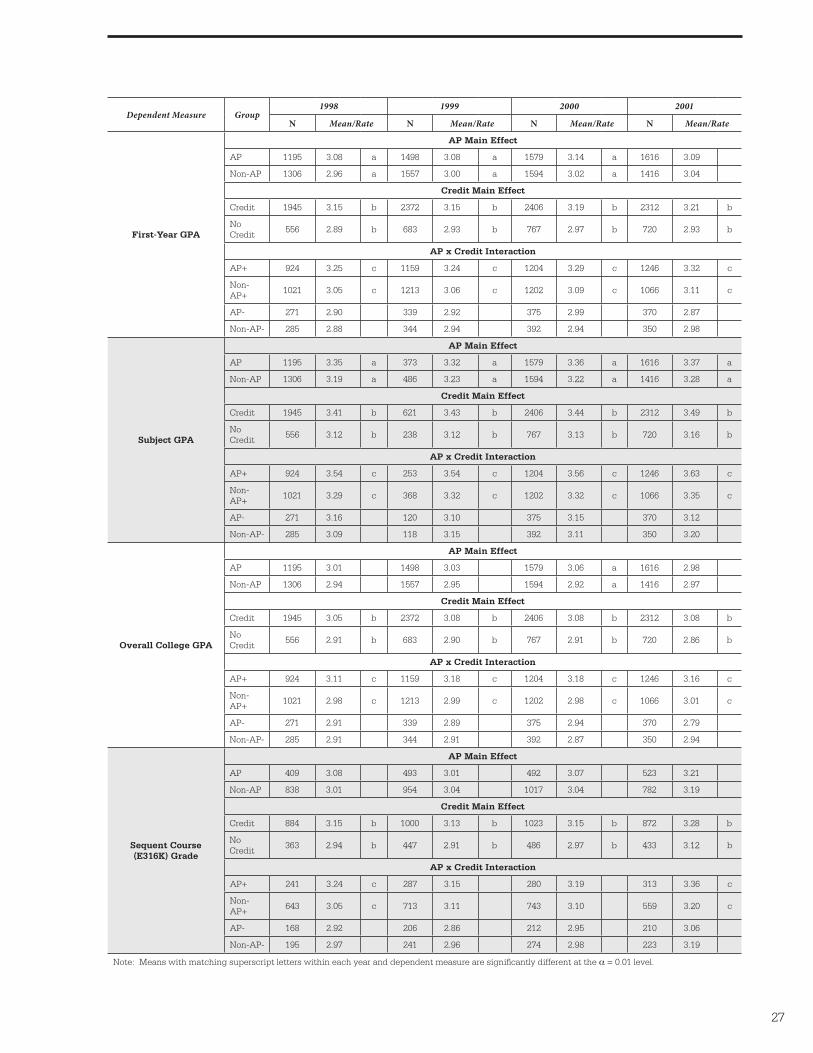
27
Dependent Measure Group1998 1999 2000 2001
N Mean/Rate N Mean/Rate N Mean/Rate N Mean/Rate
First-Year GPA
AP Main Effect
AP 1195 3.08 a 1498 3.08 a 1579 3.14 a 1616 3.09
Non-AP 1306 2.96 a 1557 3.00 a 1594 3.02 a 1416 3.04
Credit Main Effect
Credit 1945 3.15 b 2372 3.15 b 2406 3.19 b 2312 3.21 b
No Credit
556 2.89 b 683 2.93 b 767 2.97 b 720 2.93 b
AP x Credit Interaction
AP+ 924 3.25 c 1159 3.24 c 1204 3.29 c 1246 3.32 c
Non-AP+
1021 3.05 c 1213 3.06 c 1202 3.09 c 1066 3.11 c
AP- 271 2.90 339 2.92 375 2.99 370 2.87
Non-AP- 285 2.88 344 2.94 392 2.94 350 2.98
Subject GPA
AP Main Effect
AP 1195 3.35 a 373 3.32 a 1579 3.36 a 1616 3.37 a
Non-AP 1306 3.19 a 486 3.23 a 1594 3.22 a 1416 3.28 a
Credit Main Effect
Credit 1945 3.41 b 621 3.43 b 2406 3.44 b 2312 3.49 b
No Credit
556 3.12 b 238 3.12 b 767 3.13 b 720 3.16 b
AP x Credit Interaction
AP+ 924 3.54 c 253 3.54 c 1204 3.56 c 1246 3.63 c
Non-AP+
1021 3.29 c 368 3.32 c 1202 3.32 c 1066 3.35 c
AP- 271 3.16 120 3.10 375 3.15 370 3.12
Non-AP- 285 3.09 118 3.15 392 3.11 350 3.20
Overall College GPA
AP Main Effect
AP 1195 3.01 1498 3.03 1579 3.06 a 1616 2.98
Non-AP 1306 2.94 1557 2.95 1594 2.92 a 1416 2.97
Credit Main Effect
Credit 1945 3.05 b 2372 3.08 b 2406 3.08 b 2312 3.08 b
No Credit
556 2.91 b 683 2.90 b 767 2.91 b 720 2.86 b
AP x Credit Interaction
AP+ 924 3.11 c 1159 3.18 c 1204 3.18 c 1246 3.16 c
Non-AP+
1021 2.98 c 1213 2.99 c 1202 2.98 c 1066 3.01 c
AP- 271 2.91 339 2.89 375 2.94 370 2.79
Non-AP- 285 2.91 344 2.91 392 2.87 350 2.94
Sequent Course (E316K) Grade
AP Main Effect
AP 409 3.08 493 3.01 492 3.07 523 3.21
Non-AP 838 3.01 954 3.04 1017 3.04 782 3.19
Credit Main Effect
Credit 884 3.15 b 1000 3.13 b 1023 3.15 b 872 3.28 b
No Credit
363 2.94 b 447 2.91 b 486 2.97 b 433 3.12 b
AP x Credit Interaction
AP+ 241 3.24 c 287 3.15 280 3.19 313 3.36 c
Non-AP+
643 3.05 c 713 3.11 743 3.10 559 3.20 c
AP- 168 2.92 206 2.86 212 2.95 210 3.06
Non-AP- 195 2.97 241 2.96 274 2.98 223 3.19
Note: Means with matching superscript letters within each year and dependent measure are significantly different at the α = 0.01 level.

28
Table 8 Descriptive Statistics and Planned Comparison Results for AP vs. Non-AP English Literature and Composition
Dependent Measure Group1998 1999 2000 2001
N Mean/Rate N Mean/Rate N Mean/Rate N Mean/Rate
First-Year Credit Hours
AP Main Effect
AP 1373 35.52 a 1609 34.91 a 1603 35.37 a 1640 34.95 a
Non-AP 1453 33.50 a 1563 32.81 a 1612 32.60 a 1542 33.12 a
Credit Main Effect
Credit 2126 35.93 b 2425 34.87 b 2465 34.91 b 2168 34.79 b
No Credit
700 33.09 b 747 32.86 b 750 33.06 b 1014 33.27 b
AP x Credit Interaction
AP+ 1019 37.59 c 1232 36.35 c 1215 36.30 c 1122 35.74 c
Non-AP+
1107 34.26 c 1193 33.38 c 1250 33.51 c 1046 33.85 c
AP- 354 33.45 377 33.47 388 34.43 d 518 34.16 d
Non-AP- 346 32.73 370 32.25 362 31.69 d 496 32.38 d
Subject Credit Hours
AP Main Effect
AP 1373 9.68 a 1609 9.36 a 1603 9.26 a 1640 8.74 a
Non-AP 1453 8.63 a 1563 8.17 a 1612 8.17 a 1542 7.69 a
Credit Main Effect
Credit 2126 9.97 b 2425 9.62 b 2465 9.40 b 2168 9.02 b
No Credit
700 8.34 b 747 7.91 b 750 8.02 b 1014 7.42 b
AP x Credit Interaction
AP+ 1019 11.08 c 1232 10.95 c 1215 10.76 c 1122 10.36 c
Non-AP+
1107 8.85 c 1193 8.28 c 1250 8.05 c 1046 7.68 c
AP- 354 8.28 377 7.77 388 7.76 518 7.13
Non-AP- 346 8.40 370 8.06 362 8.29 496 7.71
Overall College Credit Hours
AP Main Effect
AP 1373 137.77 a 1609 135.01 a 1603 132.24 a 1640 116.48 a
Non-AP 1453 133.08 a 1563 128.84 a 1612 125.45 a 1542 107.82 a
Credit Main Effect
Credit 2126 138.92 b 2425 136.10 b 2465 133.46 b 2168 117.63 b
No Credit
700 131.92 b 747 127.75 b 750 124.24 b 1014 106.66 b
AP x Credit Interaction
AP+ 1019 142.81 c 1232 140.67 c 1215 138.73 c 1122 125.18 c
Non-AP+
1107 135.04 c 1193 131.52 c 1250 128.18 c 1046 110.08 c
AP- 354 132.72 377 129.34 388 125.75 518 107.77
Non-AP- 346 131.12 370 126.15 362 122.72 496 105.55
continued on next page

29
Dependent Measure Group1998 1999 2000 2001
N Mean/Rate N Mean/Rate N Mean/Rate N Mean/Rate
First-Year GPA
AP Main Effect
AP 1373 3.06 a 1609 3.10 a 1603 3.11 a 1640 3.14 a
Non-AP 1453 2.97 a 1563 2.97 a 1612 2.99 a 1542 3.05 a
Credit Main Effect
Credit 2126 3.15 b 2425 3.17 b 2465 3.20 b 2168 3.23 b
No Credit
700 2.87 b 747 2.90 b 750 2.90 b 1014 2.95 b
AP x Credit Interaction
AP+ 1019 3.25 c 1232 3.29 c 1215 3.31 c 1122 3.34 c
Non-AP+
1107 3.05 c 1193 3.05 c 1250 3.09 c 1046 3.13 c
AP- 354 2.86 377 2.90 388 2.92 518 2.93
Non-AP- 346 2.88 370 2.89 362 2.88 496 2.98
Subject GPA
AP Main Effect
AP 1373 3.37 a 1609 3.37 a 1603 3.32 a 1640 3.40 a
Non-AP 1453 3.15 a 1563 3.17 a 1612 3.13 a 1542 3.25 a
Credit Main Effect
Credit 2126 3.43 b 2425 3.44 b 2465 3.45 b 2168 3.51 b
No Credit
700 3.09 b 747 3.10 b 750 3.00 b 1014 3.13 b
AP x Credit Interaction
AP+ 1019 3.63 c 1232 3.63 c 1215 3.64 c 1122 3.69 c
Non-AP+
1107 3.23 c 1193 3.24 c 1250 3.26 c 1046 3.34 c
AP- 354 3.10 377 3.10 388 3.00 518 3.12
Non-AP- 346 3.08 370 3.10 362 3.01 496 3.15
Overall College GPA
AP Main Effect
AP 1373 3.01 1609 3.06 a 1603 3.02 1640 3.03
Non-AP 1453 2.93 1563 2.92 a 1612 2.93 1542 2.97
Credit Main Effect
Credit 2126 3.05 b 2425 3.10 b 2465 3.10 b 2168 3.10 b
No Credit
700 2.89 b 747 2.88 b 750 2.85 b 1014 2.90 b
AP x Credit Interaction
AP+ 1019 3.11 c 1232 3.21 c 1215 3.20 c 1122 3.19 c
Non-AP+
1107 2.98 c 1193 2.99 c 1250 3.01 c 1046 3.02 c
AP- 354 2.90 377 2.91 388 2.83 518 2.88
Non-AP- 346 2.88 370 2.85 362 2.86 496 2.92
Note: Means with matching superscript letters within each year and dependent measure are significantly different at the α = 0.01 level.

30
Table 9 Descriptive Statistics and Planned Comparison Results for AP vs. Non-AP Government and Politics: United States
Dependent Measure Group1998 1999 2000 2001
N Mean/Rate N Mean/Rate N Mean/Rate N Mean/Rate
First-Year Credit Hours
AP Main Effect
AP 565 36.90 a 664 35.88 a 779 36.57 a 773 36.02 a
Non-AP 470 34.56 a 526 33.56 a 604 34.03 a 583 33.70 a
Credit Main Effect
Credit 568 36.86 b 713 35.78 b 718 36.63 b 628 36.00 b
No Credit
467 34.59 b 477 33.65 b 665 33.97 b 728 33.72 b
AP x Credit Interaction
AP+ 309 38.62 c 401 36.93 c 402 38.91 c 356 38.36 c
Non-AP+
259 35.11 c 312 34.63 c 316 34.34 c 272 33.64 c
AP- 256 35.18 263 34.83 d 377 34.23 417 33.68
Non-AP- 211 34.01 214 32.48 d 288 33.71 311 33.77
Subject Credit Hours
AP Main Effect
AP 565 8.35 664 8.10 779 8.41 773 8.46 a
Non-AP 470 7.46 526 7.61 604 7.53 583 7.30 a
Credit Main Effect
Credit 568 7.78 713 7.90 718 7.94 628 8.29
No Credit
467 8.03 477 7.82 665 8.00 728 7.48
AP x Credit Interaction
AP+ 309 8.30 401 8.40 402 8.29 356 9.09 c
Non-AP+
259 7.25 312 7.40 316 7.60 272 7.49 c
AP- 256 8.39 263 7.80 377 8.54 417 7.84
Non-AP- 211 7.67 214 7.83 288 7.46 311 7.12
Overall College Credit Hours
AP Main Effect
AP 565 145.06 664 142.62 a 779 141.76 a 773 127.96 a
Non-AP 470 141.86 526 134.83 a 604 133.97 a 583 115.51 a
Credit Main Effect
Credit 568 148.87 b 713 144.11 b 718 143.65 b 628 130.21 b
No Credit
467 138.05 b 477 133.34 b 665 132.09 b 728 113.27 b
AP x Credit Interaction
AP+ 309 152.63 c 401 148.91 c 402 150.70 c 356 141.06 c
Non-AP+
259 145.10 c 312 139.32 c 316 136.60 c 272 119.36 c
AP- 256 137.49 263 136.34 377 132.83 417 114.86
Non-AP- 211 138.61 214 130.35 288 131.35 311 111.67
continued on next page

31
Dependent Measure Group1998 1999 2000 2001
N Mean/Rate N Mean/Rate N Mean/Rate N Mean/Rate
First-Year GPA
AP Main Effect
AP 565 3.22 664 3.24 a 779 3.30 a 773 3.31 a
Non-AP 470 3.17 526 3.13 a 604 3.22 a 583 3.16 a
Credit Main Effect
Credit 568 3.33 b 713 3.34 b 718 3.41 b 628 3.38 b
No Credit
467 3.05 b 477 3.03 b 665 3.11 b 728 3.09 b
AP x Credit Interaction
AP+ 309 3.44 c 401 3.46 c 402 3.52 c 356 3.56 c
Non-AP+
259 3.22 c 312 3.22 c 316 3.30 c 272 3.20 c
AP- 256 2.99 263 3.01 377 3.08 417 3.05
Non-AP- 211 3.11 214 3.04 288 3.13 311 3.12
Subject GPA
AP Main Effect
AP 565 3.21 a 664 3.17 a 779 3.25 a 773 3.29 a
Non-AP 470 2.97 a 526 2.88 a 604 3.00 a 583 2.97 a
Credit Main Effect
Credit 568 3.29 b 713 3.30 b 718 3.35 b 628 3.32 b
No Credit
467 2.89 b 477 2.75 b 665 2.91 b 728 2.94 b
AP x Credit Interaction
AP+ 309 3.58 c 401 3.60 c 402 3.61 c 356 3.64 c
Non-AP+
259 3.00 c 312 3.00 c 316 3.08 c 272 3.01 c
AP- 256 2.84 263 2.74 377 2.89 417 2.95
Non-AP- 211 2.93 214 2.76 288 2.92 311 2.93
Overall College GPA
AP Main Effect
AP 565 3.05 664 3.13 779 3.17 773 3.09 a
Non-AP 470 3.02 526 3.04 604 3.06 583 2.94 a
Credit Main Effect
Credit 568 3.13 b 713 3.23 b 718 3.20 b 628 3.10 b
No Credit
467 2.94 b 477 2.94 b 665 3.03 b 728 2.92 b
AP x Credit Interaction
AP+ 309 3.23 c 401 3.32 c 402 3.31 c 356 3.26 c
Non-AP+
259 3.03 c 312 3.14 c 316 3.09 c 272 2.95 c
AP- 256 2.87 263 2.94 377 3.03 417 2.91
Non-AP- 211 3.01 214 2.93 288 3.03 311 2.93
Note: Means with matching superscript letters within each year and dependent measure are significantly different at the α = 0.01 level.

32
Table 10 Descriptive Statistics and Planned Comparison Results for AP vs. Non-AP U.S. History
Dependent Measure Group1998 1999 2000 2001
N Mean/Rate N Mean/Rate N Mean/Rate N Mean/Rate
First-Year Credit Hours
AP Main Effect
AP 723 38.21 a 813 36.30 a 912 36.39 a 956 35.74 a
Non-AP 735 35.30 a 844 34.45 a 930 34.11 a 952 33.46 a
Credit Main Effect
Credit 539 38.82 b 517 36.86 b 616 36.70 b 642 35.28 b
No Credit
919 34.69 b 1140 33.89 b 1226 33.80 b 1266 33.92 b
AP x Credit Interaction
AP+ 257 40.92 c 238 38.11 c 291 38.33 c 310 36.80 c
Non-AP+
282 36.71 c 279 35.62 c 325 35.07 c 332 33.76 c
AP- 466 35.50 575 34.49 621 34.45 646 34.68 d
Non-AP- 453 33.88 565 33.29 605 33.15 620 33.17 d
Subject Credit Hours
AP Main Effect
AP 723 10.76 a 813 11.14 a 912 10.54 a 956 9.71 a
Non-AP 735 8.09 a 844 7.99 a 930 8.08 a 952 7.06 a
Credit Main Effect
Credit 539 11.10 b 517 11.20 b 616 10.62 b 642 9.80 b
No Credit
919 7.75 b 1140 7.94 b 1226 8.01 b 1266 6.97 b
AP x Credit Interaction
AP+ 257 13.98 c 238 14.23 c 291 13.12 c 310 12.22 c
Non-AP+
282 8.21 c 279 8.16 c 325 8.11 c 332 7.37 c
AP- 466 7.54 575 8.06 621 7.97 646 7.19
Non-AP- 453 7.97 565 7.82 605 8.05 620 6.74
Overall College Credit Hours
AP Main Effect
AP 723 146.18 a 813 143.80 a 912 139.55 a 956 124.64 a
Non-AP 735 139.76 a 844 137.07 a 930 133.22 a 952 112.77 a
Credit Main Effect
Credit 539 147.86 b 517 145.65 b 616 142.34 b 642 125.41 b
No Credit
919 138.08 b 1140 135.22 b 1226 130.44 b 1266 112.00 b
AP x Credit Interaction
AP+ 257 153.62 c 238 151.03 c 291 146.42 c 310 135.41 c
Non-AP+
282 142.09 c 279 140.27 c 325 138.26 c 332 115.41 c
AP- 466 138.74 575 136.57 621 132.69 646 113.87
Non-AP- 453 137.42 565 133.87 605 128.19 620 110.13
continued on next page

33
Dependent Measure Group1998 1999 2000 2001
N Mean/Rate N Mean/Rate N Mean/Rate N Mean/Rate
First-Year GPA
AP Main Effect
AP 723 3.22 a 813 3.24 a 912 3.25 a 956 3.28 a
Non-AP 735 3.12 a 844 3.11 a 930 3.16 a 952 3.16 a
Credit Main Effect
Credit 539 3.30 b 517 3.29 b 616 3.33 b 642 3.33 b
No Credit
919 3.04 b 1140 3.06 b 1226 3.09 b 1266 3.10 b
AP x Credit Interaction
AP+ 257 3.40 c 238 3.43 c 291 3.37 310 3.44 c
Non-AP+
282 3.20 c 279 3.16 c 325 3.28 332 3.22 c
AP- 466 3.04 575 3.06 621 3.14 646 3.11
Non-AP- 453 3.03 565 3.05 605 3.05 620 3.09
Subject GPA
AP Main Effect
AP 723 3.20 a 813 3.20 a 912 3.21 a 956 3.31 a
Non-AP 735 2.85 a 844 2.89 a 930 2.93 a 952 2.99 a
Credit Main Effect
Credit 539 3.19 b 517 3.23 b 616 3.26 b 642 3.32 b
No Credit
919 2.86 b 1140 2.86 b 1226 2.88 b 1266 2.98 b
AP x Credit Interaction
AP+ 257 3.50 c 238 3.52 c 291 3.50 c 310 3.61 c
Non-AP+
282 2.88 c 279 2.95 c 325 3.02 c 332 3.03 c
AP- 466 2.90 575 2.88 621 2.93 646 3.01
Non-AP- 453 2.82 565 2.83 605 2.83 620 2.95
Overall College GPA
AP Main Effect
AP 723 3.08 813 3.14 a 912 3.10 956 3.07
Non-AP 735 2.99 844 3.03 a 930 3.02 952 3.04
Credit Main Effect
Credit 539 3.10 b 517 3.16 b 616 3.15 b 642 3.10
No Credit
919 2.96 b 1140 3.01 b 1226 2.97 b 1266 3.00
AP x Credit Interaction
AP+ 257 3.16 238 3.24 291 3.17 310 3.14
Non-AP+
282 3.04 279 3.07 325 3.13 332 3.06
AP- 466 2.99 575 3.04 621 3.03 d 646 3.00
Non-AP- 453 2.93 565 2.99 605 2.91 d 620 3.01
Note: Means with matching superscript letters within each year and dependent measure are significantly different at the α = 0.01 level.

34
Table 11 Descriptive Statistics and Planned Comparison Results for AP vs. Non-AP Spanish Language
Dependent Measure Group1998 1999 2000 2001
N Mean/Rate N Mean/Rate N Mean/Rate N Mean/Rate
First-Year Credit Hours
AP Main Effect
AP 483 36.96 523 36.54 573 35.49 591 35.84
Non-AP 432 34.51 476 33.64 525 33.23 532 35.01
Credit Main Effect
Credit 869 37.30 950 36.20 1042 35.71 1046 36.14
No Credit 46 34.17 49 33.98 56 33.00 77 34.70
AP x Credit Interaction
AP+ 457 39.19 499 38.32 c 545 37.66 c 551 37.25 c
Non-AP+ 412 35.42 451 34.09 c 497 33.77 c 495 35.04 c
AP- 26 34.73 24 34.75 28 33.32 40 34.43
Non-AP- 20 33.60 25 33.20 28 32.68 37 34.97
Subject Credit Hours
AP Main Effect
AP 483 20.33 a 523 19.03 573 19.77 a 591 18.53 a
Non-AP 432 16.22 a 476 16.58 525 15.69 a 532 14.94 a
Credit Main Effect
Credit 869 19.56 950 20.04 b 1042 19.52 b 1046 18.24 b
No Credit 46 16.99 49 15.57 b 56 15.95 b 77 15.23 b
AP x Credit Interaction
AP+ 457 23.13 499 23.73 c 545 23.69 c 551 21.92 c
Non-AP+ 412 16.00 451 16.35 c 497 15.34 c 495 14.56 c
AP- 26 17.54 24 14.33 28 15.86 40 15.15
Non-AP- 20 16.45 25 16.80 28 16.04 37 15.32
Overall College Credit Hours
AP Main Effect
AP 483 140.13 523 140.63 573 142.76 591 122.18
Non-AP 432 134.55 476 132.79 525 132.56 532 114.05
Credit Main Effect
Credit 869 144.10 950 142.20 1042 140.66 1046 123.71 b
No Credit 46 130.58 49 131.22 56 134.66 77 112.52 b
AP x Credit Interaction
AP+ 457 149.45 499 149.30 c 545 147.45 c 551 132.05 c
Non-AP+ 412 138.75 451 135.10 c 497 133.87 c 495 115.36 c
AP- 26 130.81 24 131.96 28 138.07 40 112.30
Non-AP- 20 130.35 25 130.48 28 131.25 37 112.74
First-Year GPA
AP Main Effect
AP 483 3.13 523 3.10 573 3.30 a 591 3.15
Non-AP 432 2.98 476 2.94 525 3.06 a 532 3.15
Credit Main Effect
Credit 869 3.14 950 3.17 b 1042 3.19 1046 3.22
No Credit 46 2.96 49 2.86 b 56 3.17 77 3.08
AP x Credit Interaction
AP+ 457 3.23 499 3.26 c 545 3.25 c 551 3.29 c
Non-AP+ 412 3.05 451 3.08 c 497 3.12 c 495 3.15 c
AP- 26 3.02 24 2.94 28 3.34 40 3.01
Non-AP- 20 2.90 25 2.79 28 3.00 37 3.16
continued on next page

35
Dependent Measure Group1998 1999 2000 2001
N Mean/Rate N Mean/Rate N Mean/Rate N Mean/Rate
Subject GPA
AP Main Effect
AP 483 3.67 a 523 3.75 a 573 3.83 a 591 3.75 a
Non-AP 432 3.23 a 476 3.38 a 525 3.40 a 532 3.49 a
Credit Main Effect
Credit 869 3.62 b 950 3.66 b 1042 3.68 1046 3.71 b
No Credit 46 3.28 b 49 3.47 b 56 3.55 77 3.53 b
AP x Credit Interaction
AP+ 457 3.89 499 3.91 c 545 3.91 c 551 3.91 c
Non-AP+ 412 3.36 451 3.42 c 497 3.45 c 495 3.50 c
AP- 26 3.46 24 3.60 28 3.76 d 40 3.59
Non-AP- 20 3.10 25 3.35 28 3.35 d 37 3.47
Overall College GPA
AP Main Effect
AP 483 3.01 523 2.99 573 3.21 591 3.04
Non-AP 432 3.09 476 2.96 525 2.99 532 3.12
Credit Main Effect
Credit 869 3.09 950 3.08 1042 3.15 1046 3.10
No Credit 46 3.01 49 2.87 56 3.05 77 3.06
AP x Credit Interaction
AP+ 457 3.13 499 3.17 c 545 3.24 c 551 3.15
Non-AP+ 412 3.05 451 3.00 c 497 3.05 c 495 3.06
AP- 26 2.88 24 2.82 28 3.17 40 2.94
Non-AP- 20 3.14 25 2.92 28 2.94 37 3.19
Note: Means with matching superscript letters within each year and dependent measure are significantly different at the α = 0.01 level.

36
Table 12 MANOVA Results —Factorial Analysis for AP vs. Concurrent Students
Subject Year Effect Wilks’ Lambda F DF for F Pr > F
AP Macroeconomics
1998 AP 0.958 2.37 (5, 272) 0.039
1998 Credit 0.926 4.37 (5, 272) <0.001
1998 AP*Credit 0.986 0.78 (5, 272) 0.566
1999 AP 0.907 5.99 (5, 294) <0.001
1999 Credit 0.938 3.91 (5, 294) 0.002
1999 AP*Credit 0.978 1.33 (5, 294) 0.251
2000 AP 0.936 5.96 (5, 435) <0.001
2000 Credit 0.945 5.09 (5, 435) <0.001
2000 AP*Credit 0.975 2.27 (5, 435) 0.046
2001 AP 0.971 3.03 (5, 509) 0.01
2001 Credit 0.959 4.37 (5, 509) <0.001
2001 AP*Credit 0.987 1.35 (5, 509) 0.244
AP English Language and Composition
1998 AP 0.943 16.85 (5, 1397) <0.001
1998 Credit 0.977 6.66 (5, 1397) <0.001
1998 AP*Credit 0.990 2.86 (5, 1397) 0.014
1999 AP 0.950 16.48 (5, 1579) <0.001
1999 Credit 0.969 9.95 (5, 1579) <0.001
1999 AP*Credit 0.992 2.39 (5, 1579) 0.036
2000 AP 0.952 19.32 (5, 1927) <0.001
2000 Credit 0.967 13.31 (5, 1927) <0.001
2000 AP*Credit 0.996 1.43 (5, 1927) 0.209
2001 AP 0.951 20.58 (5, 1998) <0.001
2001 Credit 0.951 20.48 (5, 1998) <0.001
2001 AP*Credit 0.997 1.26 (5, 1998) 0.279
AP Government and Politics: United States
1998 AP 0.951 4.90 (5, 479) <0.001
1998 Credit 0.955 4.48 (5, 479) <0.001
1998 AP*Credit 0.979 2.04 (5, 479) 0.072
1999 AP 0.964 4.28 (5, 576) <0.001
1999 Credit 0.916 10.54 (5, 576) <0.001
1999 AP*Credit 0.992 0.93 (5, 576) 0.463
2000 AP 0.957 6.41 (5, 717) <0.001
2000 Credit 0.947 7.96 (5, 717) <0.001
2000 AP*Credit 0.993 1.00 (5, 717) 0.414
2001 AP 0.932 11.32 (5, 781) <0.001
2001 Credit 0.933 11.21 (5, 781) <0.001
2001 AP*Credit 0.962 6.22 (5, 781) <0.001
AP History: United States
1998 AP 0.861 18.04 (5, 557) <0.001
1998 Credit 0.906 11.60 (5, 557) <0.001
1998 AP*Credit 0.931 8.28 (5, 557) <0.001
1999 AP 0.921 10.26 (5, 601) <0.001
1999 Credit 0.940 7.71 (5, 601) <0.001
1999 AP*Credit 0.957 5.39 (5, 601) <0.001
2000 AP 0.945 11.23 (5, 962) <0.001
2000 Credit 0.952 9.60 (5, 962) <0.001
2000 AP*Credit 0.984 3.21 (5, 962) 0.007
2001 AP 0.940 11.81 (5, 930) <0.001
2001 Credit 0.929 14.23 (5, 930) <0.001
2001 AP*Credit 0.961 7.51 (5, 930) <0.001
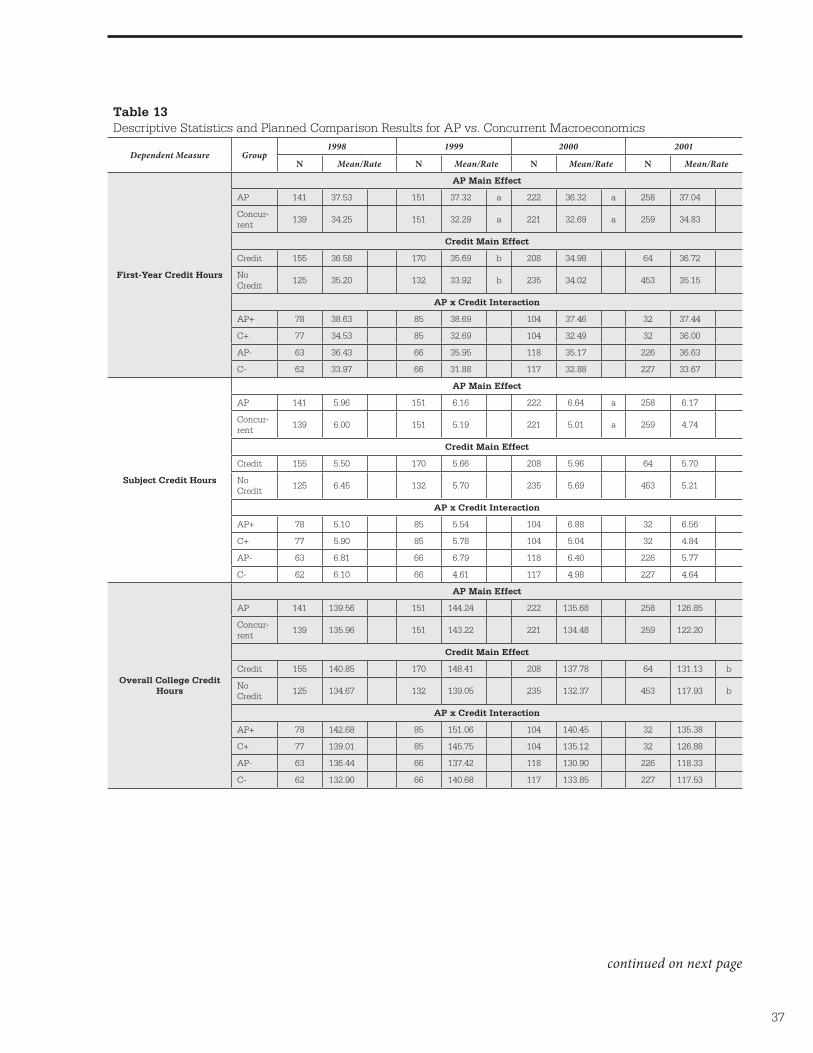
37
Table 13 Descriptive Statistics and Planned Comparison Results for AP vs. Concurrent Macroeconomics
Dependent Measure Group1998 1999 2000 2001
N Mean/Rate N Mean/Rate N Mean/Rate N Mean/Rate
First-Year Credit Hours
AP Main Effect
AP 141 37.53 151 37.32 a 222 36.32 a 258 37.04
Concur-rent
139 34.25 151 32.29 a 221 32.69 a 259 34.83
Credit Main Effect
Credit 155 36.58 170 35.69 b 208 34.98 64 36.72
No Credit
125 35.20 132 33.92 b 235 34.02 453 35.15
AP x Credit Interaction
AP+ 78 38.63 85 38.69 104 37.46 32 37.44
C+ 77 34.53 85 32.69 104 32.49 32 36.00
AP- 63 36.43 66 35.95 118 35.17 226 36.63
C- 62 33.97 66 31.88 117 32.88 227 33.67
Subject Credit Hours
AP Main Effect
AP 141 5.96 151 6.16 222 6.64 a 258 6.17
Concur-rent
139 6.00 151 5.19 221 5.01 a 259 4.74
Credit Main Effect
Credit 155 5.50 170 5.66 208 5.96 64 5.70
No Credit
125 6.45 132 5.70 235 5.69 453 5.21
AP x Credit Interaction
AP+ 78 5.10 85 5.54 104 6.88 32 6.56
C+ 77 5.90 85 5.78 104 5.04 32 4.84
AP- 63 6.81 66 6.79 118 6.40 226 5.77
C- 62 6.10 66 4.61 117 4.98 227 4.64
Overall College Credit Hours
AP Main Effect
AP 141 139.56 151 144.24 222 135.68 258 126.85
Concur-rent
139 135.96 151 143.22 221 134.48 259 122.20
Credit Main Effect
Credit 155 140.85 170 148.41 208 137.78 64 131.13 b
No Credit
125 134.67 132 139.05 235 132.37 453 117.93 b
AP x Credit Interaction
AP+ 78 142.68 85 151.06 104 140.45 32 135.38
C+ 77 139.01 85 145.75 104 135.12 32 126.88
AP- 63 136.44 66 137.42 118 130.90 226 118.33
C- 62 132.90 66 140.68 117 133.85 227 117.53
continued on next page

38
Table 13 Descriptive Statistics and Planned Comparison Results for AP vs. Concurrent Macroeconomics (continued)
Dependent Measure Group1998 1999 2000 2001
N Mean/Rate N Mean/Rate N Mean/Rate N Mean/Rate
First-Year GPA
AP Main Effect
AP 141 3.12 151 3.31 222 3.24 258 3.49 a
Concur-rent
139 3.06 151 3.21 221 3.15 259 3.26 a
Credit Main Effect
Credit 155 3.26 b 170 3.41 b 208 3.35 b 64 3.56 b
No Credit
125 2.92 b 132 3.11 b 235 3.04 b 453 3.20 b
AP x Credit Interaction
AP+ 78 3.30 85 3.47 104 3.50 32 3.76
C+ 77 3.22 85 3.34 104 3.21 32 3.35
AP- 63 2.95 66 3.15 118 2.97 226 3.22
C- 62 2.90 66 3.07 117 3.10 227 3.18
Overall College GPA
AP Main Effect
AP 141 3.06 151 3.15 222 3.11 258 3.12
Concur-rent
139 2.90 151 3.09 221 3.08 259 3.03
Credit Main Effect
Credit 155 3.09 170 3.23 208 3.21 b 64 3.13
No Credit
125 2.88 132 3.02 235 2.98 b 453 3.02
AP x Credit Interaction
AP+ 78 3.13 85 3.31 104 3.27 32 3.21
C+ 77 3.05 85 3.15 104 3.15 32 3.05
AP- 63 3.00 66 3.00 118 2.95 226 3.03
C- 62 2.76 66 3.03 117 3.01 227 3.02
Note: Means with matching superscript letters within each year and dependent measure are significantly different at the α = 0.01 level.

39
Table 14 Descriptive Statistics and Planned Comparison Results for AP vs. Concurrent English Language and Composition
Dependent Measure Group1998 1999 2000 2001
N Mean/Rate N Mean/Rate N Mean/Rate N Mean/Rate
First-Year Credit Hours
AP Main Effect
AP 703 35.62 a 793 34.98 a 970 34.50 a 1003 34.79 a
Concur-rent
703 31.57 a 794 31.65 a 966 32.02 a 1003 32.47 a
Credit Main Effect
Credit 978 34.51 b 1076 33.81 1284 33.73 b 1411 34.65 b
No Credit 428 32.68 b 511 32.82 652 32.79 b 595 32.61 b
AP x Credit Interaction
AP+ 489 36.91 538 35.52 644 34.81 706 35.99
C+ 489 32.10 538 32.09 640 32.64 705 33.31
AP- 214 34.34 255 34.43 326 34.19 297 33.59
C- 214 31.03 256 31.21 326 31.39 298 31.63
Subject Credit Hours
AP Main Effect
AP 703 8.61 a 793 8.76 a 970 8.27 a 1003 7.56 a
Concur-rent
703 10.38 a 794 10.34 a 966 9.86 a 1003 9.53 a
Credit Main Effect
Credit 978 9.87 1076 10.12 b 1284 9.62 b 1411 8.94 b
No Credit 428 9.12 511 8.97 b 652 8.51 b 595 8.15 b
AP x Credit Interaction
AP+ 489 9.50 538 9.81 644 9.09 706 8.05
C+ 489 10.24 538 10.44 640 10.15 705 9.84
AP- 214 7.72 255 7.71 326 7.45 297 7.06
C- 214 10.51 256 10.24 326 9.56 298 9.23
Overall College Credit Hours
AP Main Effect
AP 703 135.45 793 133.14 970 128.68 1003 110.01
Concur-rent
703 130.46 794 131.95 966 129.06 1003 110.42
Credit Main Effect
Credit 978 135.05 1076 134.44 1284 132.94 b 1411 117.10 b
No Credit 428 130.85 511 130.65 652 124.79 b 595 103.33 b
AP x Credit Interaction
AP+ 489 136.69 538 134.90 644 132.23 706 118.12
C+ 489 133.42 538 133.98 640 133.66 705 116.09
AP- 214 134.20 255 131.37 326 125.13 297 101.90
C- 214 127.50 256 129.93 326 124.45 298 104.76
First-Year GPA
AP Main Effect
AP 703 3.06 a 793 3.01 970 3.08 a 1003 3.03
Concur-rent
703 2.94 a 794 2.95 966 2.97 a 1003 3.00
Credit Main Effect
Credit 978 3.10 b 1076 3.09 b 1284 3.13 b 1411 3.17 b
No Credit 428 2.90 b 511 2.87 b 652 2.92 b 595 2.86 b
AP x Credit Interaction
AP+ 489 3.19 538 3.14 644 3.18 706 3.21
C+ 489 3.01 538 3.04 640 3.07 705 3.12
AP- 214 2.93 255 2.88 326 2.97 297 2.85
C- 214 2.86 256 2.86 326 2.86 298 2.87
continued on next page

40
Table 14 Descriptive Statistics and Planned Comparison Results for AP vs. Concurrent English Language and Composition (continued)
Dependent Measure Group1998 1999 2000 2001
N Mean/Rate N Mean/Rate N Mean/Rate N Mean/Rate
Overall College GPA
AP Main Effect
AP 703 3.00 793 2.99 970 3.05 a 1003 2.96
Concur-rent
703 2.92 794 2.91 966 2.93 a 1003 2.92
Credit Main Effect
Credit 978 3.03 b 1076 3.05 b 1284 3.08 b 1411 3.06 b
No Credit 428 2.89 b 511 2.85 b 652 2.89 b 595 2.82 b
AP x Credit Interaction
AP+ 489 3.08 538 3.12 644 3.16 706 3.13
C+ 489 2.98 538 2.98 640 3.01 705 2.99
AP- 214 2.92 255 2.85 326 2.93 297 2.79
C- 214 2.85 256 2.85 326 2.84 298 2.84
Sequent Course (E316K) Grade
AP Main Effect
AP 214 3.13 263 3.03 291 3.03 288 3.20
Concur-rent
313 2.99 382 3.07 435 3.01 381 3.17
Credit Main Effect
Credit 312 3.18 a 383 3.16 a 403 3.07 403 3.31 a
No Credit 215 2.94 a 262 2.95 a 323 2.97 266 3.06 a
AP x Credit Interaction
AP+ 103 3.34 b 125 3.19 126 3.08 150 3.38
C+ 209 3.03 b 258 3.12 277 3.06 253 3.24
AP- 111 2.93 138 2.88 165 2.99 138 3.02
C- 104 2.94 124 3.02 158 2.96 128 3.09
Note: Means with matching superscript letters within each year and dependent measure are significantly different at the α = 0.01 level.

41
Table 15 Descriptive Statistics and Planned Comparison Results for AP vs. Concurrent Government and Politics: United States
Dependent Measure Group1998 1999 2000 2001
N Mean/Rate N Mean/Rate N Mean/Rate N Mean/Rate
First-Year Credit Hours
AP Main Effect
AP 244 37.71 a 293 35.43 a 363 36.65 a 395 36.75 a
Concurrent 243 34.07 a 292 33.06 a 363 33.82 a 394 32.83 a
Credit Main Effect
Credit 266 36.58 293 35.00 318 36.48 b 521 35.82 b
No Credit 221 35.20 292 33.49 408 33.98 b 268 33.75 b
AP x Credit Interaction
AP+ 133 39.46 147 36.46 159 37.99 261 39.01 c
C+ 133 33.71 146 33.53 159 34.97 260 32.63 c
AP- 111 35.97 146 34.40 204 35.30 134 34.48
Concurrent (AP- Matched)
110 34.44 146 32.58 204 32.66 134 33.02
Subject Credit Hours
AP Main Effect
AP 244 8.19 293 7.83 a 363 8.30 a 395 8.23 a
Concurrent 243 7.03 292 6.56 a 363 6.96 a 394 6.96 a
Credit Main Effect
Credit 266 7.57 293 7.13 318 7.25 521 8.02
No Credit 221 7.65 292 7.25 408 8.01 268 7.16
AP x Credit Interaction
AP+ 133 8.06 147 7.78 159 7.58 261 9.01 c
C+ 133 7.07 146 6.49 159 6.91 260 7.03 c
AP- 111 8.32 146 7.88 204 9.01 134 7.45
C- 110 6.98 146 6.62 204 7.00 134 6.88
Overall College Credit Hours
AP Main Effect
AP 244 140.32 293 140.51 363 139.38 a 395 124.06 a
Concurrent 243 138.87 292 136.89 363 132.92 a 394 117.16 a
Credit Main Effect
Credit 266 141.74 293 144.03 b 318 139.76 b 521 127.50 b
No Credit 221 137.44 292 133.37 b 408 132.55 b 268 113.72 b
AP x Credit Interaction
AP+ 133 144.83 147 146.68 159 143.06 261 135.23 c
C+ 133 138.65 146 141.38 159 136.46 260 119.76 c
AP- 111 135.80 146 134.34 204 135.71 134 112.88
C- 110 139.08 146 132.40 204 129.39 134 114.55
First-Year GPA
AP Main Effect
AP 244 3.19 293 3.15 363 3.32 a 395 3.26
Concurrent 243 3.15 292 3.09 363 3.18 a 394 3.15
Credit Main Effect
Credit 266 3.30 b 293 3.29 b 318 3.39 b 521 3.36 b
No Credit 221 3.04 b 292 2.95 b 408 3.12 b 268 3.06 b
AP x Credit Interaction
AP+ 133 3.39 147 3.37 159 3.49 261 3.48 c
C+ 133 3.21 146 3.21 159 3.28 260 3.23 c
AP- 111 2.99 146 2.92 204 3.15 134 3.04
C- 110 3.09 146 2.97 204 3.09 134 3.07
continued on next page

42
Table 15 Descriptive Statistics and Planned Comparison Results for AP vs. Concurrent Government and Politics: United States (continued)
Dependent Measure Group1998 1999 2000 2001
N Mean/Rate N Mean/Rate N Mean/Rate N Mean/Rate
Overall College GPA
AP Main Effect
AP 244 3.06 293 3.07 363 3.20 395 3.11 a
Concurrent 243 2.97 292 3.05 363 3.11 394 2.87 a
Credit Main Effect
Credit 266 3.13 b 293 3.21 b 318 3.27 b 521 3.05
No Credit 221 2.90 b 292 2.91 b 408 3.04 b 268 2.93
AP x Credit Interaction
AP+ 133 3.24 147 3.27 159 3.33 261 3.30 c
C+ 133 3.01 146 3.16 159 3.20 260 2.80 c
AP- 111 2.87 146 2.88 204 3.07 134 2.92
C- 110 2.94 146 2.93 204 3.02 134 2.93
Note: Means with matching superscript letters within each year and dependent measure are significantly different at the α = 0.01 level.

43
Table 16 Descriptive Statistics and Planned Comparison Results for AP vs. Concurrent History: United States
Dependent Measure Group1998 1999 2000 2001
N Mean/Rate N Mean/Rate N Mean/Rate N Mean/Rate
First-Year Credit Hours
AP Main Effect
AP 283 37.87 a 304 35.94 a 488 37.22 a 469 36.33 a
Concurrent 282 32.38 a 305 32.76 a 482 33.26 a 469 33.44 a
Credit Main Effect
Credit 170 36.07 168 34.21 275 36.93 b 235 35.65 b
No Credit 395 34.17 441 34.49 695 33.55 b 703 34.13 b
AP x Credit Interaction
AP+ 85 39.42 c 84 36.35 c 138 39.53 c 118 37.28 c
C+ 85 32.72 c 84 32.08 c 137 34.33 c 117 34.02 c
AP- 198 36.31 d 220 35.54 350 34.90 d 351 35.38
C- 197 32.04 d 221 33.44 345 32.19 d 352 32.87
Subject Credit Hours
AP Main Effect
AP 283 9.79 a 304 9.55 a 488 8.29 469 8.34 a
Concurrent 282 6.59 a 305 6.99 a 482 7.79 469 6.68 a
Credit Main Effect
Credit 170 9.72 b 168 9.27 b 275 8.67 b 235 8.48 b
No Credit 395 6.65 b 441 7.28 b 695 7.40 b 703 6.54 b
AP x Credit Interaction
AP+ 85 12.74 c 84 11.61 c 138 9.52 118 10.19 c
C+ 85 6.71 c 84 6.93 c 137 7.82 117 6.77 c
AP- 198 6.83 220 7.50 350 7.05 351 6.48
C- 197 6.47 221 7.06 345 7.76 352 6.60
Overall College Credit Hours
AP Main Effect
AP 283 138.79 304 142.26 488 135.68 469 121.99
Concurrent 282 139.15 305 140.80 482 135.72 469 121.47
Credit Main Effect
Credit 170 141.10 168 145.19 b 275 139.81 b 235 128.91 b
No Credit 395 136.83 441 137.87 b 695 131.59 b 703 114.55 b
AP x Credit Interaction
AP+ 85 140.34 84 146.14 138 140.47 118 130.34
C+ 85 141.86 84 144.24 137 139.15 117 127.48
AP- 198 137.23 220 138.37 350 130.90 351 113.64
C- 197 136.44 221 137.37 345 132.29 352 115.47
First-Year GPA
AP Main Effect
AP 283 3.18 151 3.22 488 3.28 a 469 3.27
Concurrent 282 3.13 151 3.16 482 3.13 a 469 3.15
Credit Main Effect
Credit 170 3.26 b 170 3.32 b 275 3.30 b 235 3.33 b
No Credit 395 3.05 b 132 3.06 b 695 3.11 b 703 3.09 b
AP x Credit Interaction
AP+ 85 3.31 85 3.41 138 3.42 c 118 3.45 c
C+ 85 3.22 85 3.22 137 3.19 c 117 3.20 c
AP- 198 3.05 66 3.03 350 3.14 351 3.08
C- 197 3.04 66 3.09 345 3.08 352 3.09
continued on next page

44
Table 16 Descriptive Statistics and Planned Comparison Results for AP vs. Concurrent History: United States (continued)
Dependent Measure Group1998 1999 2000 2001
N Mean/Rate N Mean/Rate N Mean/Rate N Mean/Rate
Overall College GPA
AP Main Effect
AP 283 3.11 304 3.10 488 3.16 469 3.11
Concurrent 282 3.15 305 3.06 482 3.04 469 3.05
Credit Main Effect
Credit 170 3.19 168 3.13 275 3.16 235 3.16
No Credit 395 3.06 441 3.03 695 3.05 703 3.00
AP x Credit Interaction
AP+ 85 3.16 84 3.17 138 3.24 118 3.23
C+ 85 3.23 84 3.09 137 3.08 117 3.09
AP- 198 3.06 220 3.03 350 3.08 351 3.00
C- 197 3.07 221 3.03 345 3.01 352 3.01
Note: Means with matching superscript letters within each year and dependent measure are significantly different at the α = 0.01 level.

45
Table 17 Summary of Primary Trends Observed Across Subjects for AP vs. Non-AP Comparisons
Dependent Measure Planned Comparison Bio Calc AB Calc BC Chem Macro Eng LA Eng Lit Govt Hist Span
Overall College Credit Hours
AP vs. Non AP x x x x x x x x
Credit vs. No Credit X x x X x x x X x
AP+ vs. Non AP+ x x x x x x x x x
Overall College GPA
AP vs. Non AP
Credit vs. No Credit x x x x x x x x
AP+ vs. Non AP+ x x x
First-Year Credit Hours
AP vs. Non AP x x x x x x x x
Credit vs. No Credit x x x x x x x
AP+ vs. Non AP x x x x x
First-Year GPA
AP vs. Non AP x x x x x
Credit vs. No Credit X x x X X x x X x
AP+ vs. Non AP+ x x x x x x x x
Subject Credit Hours
AP vs. Non AP X x X X x x x x x
Credit vs. No Credit x x x x x x x X x
AP+ vs. Non AP+ X x X X x x x X X
Subject GPA
AP vs. Non AP x x x x x x x x x
Credit vs. No Credit X X x X X x x X x x
AP+ vs. Non AP+ x x x x x x X x X
Sequent Course Grade
AP vs. Non AP
Credit vs. No Credit x X x
AP+ vs. Non AP+ x
Note: An X indicates moderate or large effect sizes, while x indicates small effect sizes.

46
Table 18 Summary of Primary Trends Observed Across Subjects for AP vs. Concurrent Comparisons
Dependent Measure Planned ComparisonSubject Area
Macroeconomics English Language and Composition Government History
Overall College Credit Hours
AP vs. Concurrent
Credit vs. No Credit x x
Overall College GPAAP vs. Concurrent
Credit vs. No Credit x x
First-Year Credit Hours
AP vs. Concurrent x x X
Credit vs. No Credit x
First-Year GPAAP vs. Concurrent
Credit vs. No Credit X x X x
Subject Credit HoursAP vs. Concurrent √ x x
Credit vs. No Credit x x
Sequent Course Grade
AP vs. Concurrent
Credit vs. No Credit x
Note: An x indicates superior performance by AP students; a √ indicates superior performance by Concurrent students. X indicates that moderate effect sizes were present.

www.collegeboard.com 09b-644