research report on corruption in the south african private ... report_kd_13feb07... · will get a...
TRANSCRIPT
Commissioned by:
and
Conducted by: 14 February 2007
Research Report on Corruption
in the South African Private Sector
- 2006 -
2
Table of Contents: 1. Introduction .................................................................................................................... 3 2. Objectives of the study ................................................................................................. 4 3. Methodology summary.................................................................................................. 5 4. Overview......................................................................................................................... 5 5. Background information on respondents ................................................................... 7 6. Research findings........................................................................................................ 11
6.1. How much corruption occurs?...............................................................................11 6.2. Who is involved in corruption?...............................................................................13
6.2.1. The demand side of corruption – Who demanded / accepted bribes? ..........................................13 6.2.2. The supply side of corruption – Who offered / gave bribes? .........................................................15
6.3. In which provinces is corruption the most problematic? ........................................17 6.4. Risk areas .............................................................................................................18
6.4.1. Most prevalent forms of unethical conduct and bribery .................................................................18 6.5. What kinds of gratification are given / received?...................................................23
6.5.1. General forms of gratifications ......................................................................................................23 6.5.2. Extortion, blackmail, threats and protection fees...........................................................................24
6.6. Value of bribes ......................................................................................................24 6.7. Corruption Control .................................................................................................25
6.7.1. Cost of Corruption .........................................................................................................................25 6.7.2. Why does corruption occur?..........................................................................................................26 6.7.3. Successful prevention methods ....................................................................................................28 6.7.4. Detection of corruption ..................................................................................................................29 6.7.5. Investigation of corruption .............................................................................................................30 6.7.6. Reporting Corruption to the SAPS or other authorities..................................................................31 6.7.7. Perceptions regarding corruption ..................................................................................................32 6.7.8. What would make a real difference? .............................................................................................34
7. Conclusion ................................................................................................................... 35 8. References: .................................................................................................................. 37 9. Thank you:.................................................................................................................... 37
This report was compiled by: The Centre for Business and Professional Ethics, University of Pretoria.
3
1. Introduction Measuring corruption is intrinsically difficult and any attempt to do so is bound to face certain challenges. The main obstacle derives from trying to measure that which is hidden. Some international studies, such as Transparency International’s Corruption Perception Index, attempt to measure people’s perceptions of how much corruption occurs, or how big a problem it is. There are however well-founded concerns about how accurately these perceptions reflect reality. Most of the international studies also give a very limited view of the corruption landscape within a specific country. They do not attempt to obtain in-depth information about why corruption occurs, where it occurs, who the role-players are, and other information which could actually assist in the combating of corruption.
There is a very real need for more accurate information on the actual occurrences of corruption. The purpose of this is twofold. Firstly, knowing more about the problem can assist in devising strategies to combat it, and secondly, being able to track trends over time allows one to see whether the current combative strategies are effective.
Most international instruments for corruption measurement focus on the private sector’s perception on corruption in the public sector, neglecting to recognise that the private sector plays a significant role on the supply side of corruption (e.g. paying bribes for government contracts), and that there are incidences of corruption within the private sector itself. The organisational or business culture of all players contribute to the levels of corruption in a country. The South African National Anti-Corruption Forum (NACF), which was established in 2001, recognises that corruption reaches across all sectors of society, and to eradicate it would require the combined effort of all sectors. As such the NACF brings together the commitment and expertise of government, business and civil society. As part of business’ contribution to the NACF, Business Against Crime (BAC) and the German Technical Co-operation Agency (GTZ) commissioned this survey. The questionnaire was developed in wide consultation with various industry bodies in order to define all possible corrupt interactions that occur in business, or between business and the public sector. There was also an attempt to go beyond mere perception questions and to get information on actual occurrences of corruption. While the survey has produced many new findings on corruption, it by no means gives a complete picture of the South African corruption landscape. What it does give is a significantly enhanced picture of corruption from the perspective of South African businesses, but only from that perspective. There are large parts of the corruption landscape which fall outside this study. The Department of Public Service and Administration (DPSA) will however be conducting research into the experiences of corruption from these other perspectives during 2007. In combination with this study one will get a clearer picture of ‘that which is hidden’ in South Africa. We hope that the outcomes of this study prove useful for individual businesses, industry bodies, and South African business as a whole, to organise themselves in the fight against corruption.
4
2. Objectives of the study The main objectives are to give a clearer picture of the South African corruption landscape as experienced by the South African private sector within the coutry’s borders, and to be able to monitor it over time. The survey was required to:
a) Assess the nature and frequency of corruption within the private sector (objectively and subjectively) including the following: • Information about where corruption occurs (for example, particular private sector
activities or at the public/private sector interface)? • What types of corruption are occurring in industry sectors? • What level of employees or management is involved in corrupt activity? • Who initiates the corrupt activity? • What advantages, material benefits or gratifications are exchanged? • Information about the costs and effects of corruption (direct economic costs and
indirect or intangible human costs). • Factors that contribute to or are associated with corruption (for example, socio-
economic status, organised crime or structural factors). • The subjective perception of corruption by those involved or affected by corruption
within the private sector.
b) Assess the prevention, detection and resolution of corruption by the private sector including the following: • What instruments and mechanisms are in use for preventing, detecting and
responding to corruption? (For example, systems and controls, audits, training, blacklisting, four eye-procedures).
• How efficient are these mechanisms? • Information about internal investigations. • Is there protection for whistle blowers within organisations? • Has an ethical culture been entrenched in organisations?
5
3. Methodology summary The survey was conducted between 6 September and 10 November 2006. Sample = 760
• 550 Web based Interviews • 130 Telephonic Interviews • 80 Face-to-Face Interviews
Representation Criteria:
• South African based businesses • 14 Industry sectors • 9 Provinces • Large Enterprises & SME’s
Sample significance:
• Statistical significance of 95% • Maximum random error of 3.5%
4. Overview Companies’ experience of corruption From the perspective of private sector respondents: (See background information on respondents and their organisations under section 5) How much corruption occurs? • 11.5% of companies had bribes offered to them (not accepted) • 7.3% of companies had individuals who accepted bribes • 16% of companies had bribes demanded from them (not paid) • 5.5% of companies had individuals who paid bribes It seems that bribery is not the standard practice in South African business. People who demanded / accepted the bribes / gratification from companies were from: • Another company – 26.3% • Third parties / intermediaries - 22.5% • Local government – 19.6% • Provincial / National Government – 10% People who offered / gave the bribes / gratification were from: • Another company – 48.1% • Third parties / intermediaries - 17.5% Most prevalent form of corruption: • Corruption in the private sector is most prevalent in the obtaining of business
(competing for and awarding of quotes and tenders)
6
Value of bribes: • The majority (61%) of ‘bribes experienced’ were between R1 – R10 000, but go into
the higher figures. There were 4 mentions in excess of R1 million. The most common forms of gratification • Monetary bribes, kickbacks and gifts. Cost of corruption: • 14.1% of respondents said their company had lost contracts due to bribery. • 1.7% of respondents said their companies had declined from making further
investments due to corruption fears. Why do companies get involved in corruption? • 87.9% agree with the statement “To get approvals to which they are not entitled” • 87.7% agree with the statement: “To bypass difficult / arduous regulatory
requirements” Control of Corruption Most successful measures for preventing corruption: • Internal audit function (Success rating – 69.1) • IT Controls (Success rating – 67.9) • Strict contracting and procurement procedures (Success rating – 67.6) What preventative measures do companies have in place? • Over 75% of companies report having the above three most successful measures in
place. • The majority of large enterprises have general governance functions in place, but
22.3% do not have an anti-corruption strategy / policy / response plan. Corruption detection • Corruption is most often discovered by an employee • 48.9% of companies have some form of hotline in place. • 67.6% of large enterprises have some form of hotline in place. Actions once corruption is discovered: Of companies surveyed: • 88.9% say they will always conduct an internal investigation • 45.2% say they will permit the individual to resign • 45.1% say they will always warn other industry players about the employee • 38.4% say they will always report it to the SAPS / Scorpions • 17.8% say they will NEVER report corruption to the SAPS/Scorpions • 79% are not aware of a legal requirement to report corruption to the SAPS Main reasons for not reporting to SAPS / Scorpions: • Lack of confidence in the police – 75.7% • Lack of confidence in the justice system – 74.3%
7
Perception statements reflecting company culture • The majority of respondents are positive about their company culture, However, • 20.3% disagreed with the statement, “Offenders get punished”. • 22.1% disagreed with the statement, “I know what the rules are when it comes to
facilitation payments”. • 26.8% disagreed with the statement, “Top management has a zero tolerance
approach to corruption”. Other perceptions: • Corruption is a deterrent to doing business in South Africa - Agreement score = 75 • Current levels of corruption make it difficult to operate ethically in our industry sector - Agreement score = 48 Perception levels differ significantly from actual experience of corruption.
5. Background information on respondents Designation of Respondents Since the aim was to get information on actual occurrences of corruption, as well as knowledge of prevention, detection and investigation mechanisms in place in organisations, people from the following designations were targeted.
- Owner, Chief Executive Officer, Chief Financial Officer / Financial director, Chief Operating Officer / Managing director, Company secretary, Compliance officer, Chairman of audit committee, Head of Internal Audit, Head of security / investigations, Financial manager, General Manager.
Due to a coding problem in the web-based questionnaire the breakdown of representation from these designations were unfortunately lost. Only 13% percent of respondents however indicated designations other than the above, and we can deduce that the majority of respondents were in these categories.
8
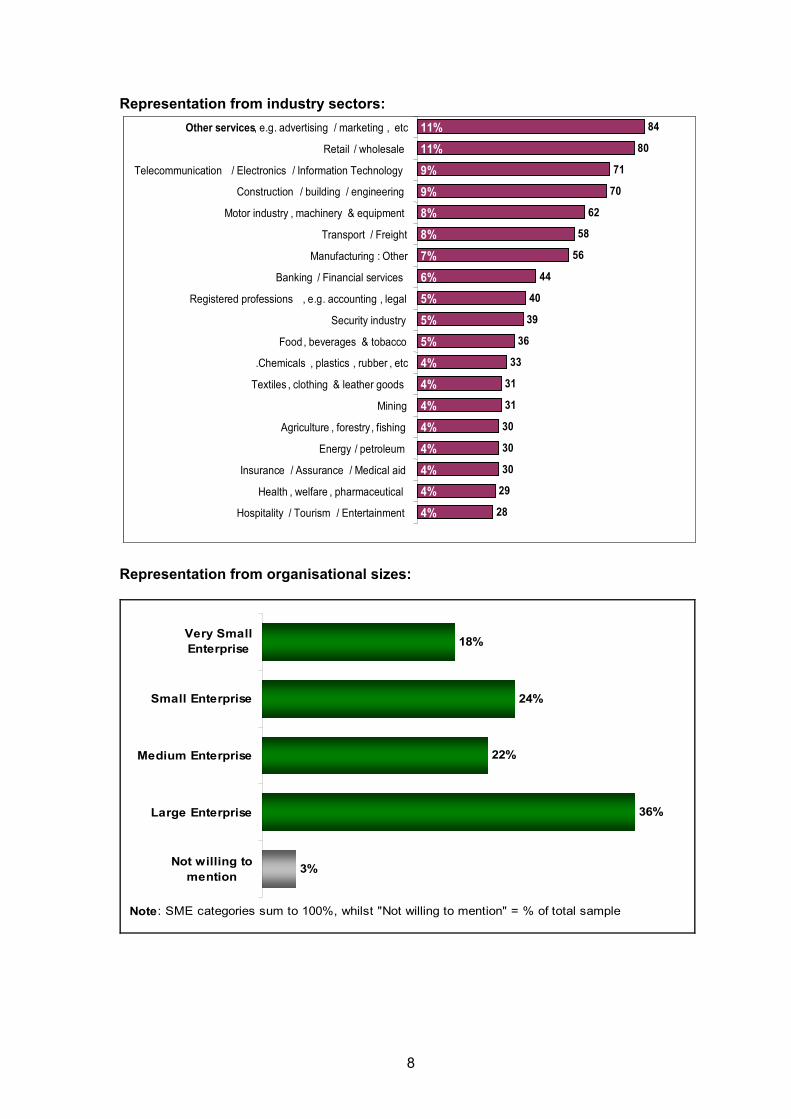
Representation from industry sectors: 11%11%9%9%8%8%7%6%5%5%5%
4%4%4%4%4%4%4%
84
80
71
70
62
58
56
44
40
39
36
33
31
31
30
30
30
29
28
4%
Other services, e.g. advertising / marketing , etc
Retail / wholesale
Telecommunication / Electronics / Information Technology
Construction / building / engineering
Motor industry , machinery & equipment
Transport / Freight
Manufacturing : Other
Banking / Financial services
Registered professions , e.g. accounting , legal
Security industry
Food, beverages & tobacco
.Chemicals , plastics , rubber , etc
Textiles , clothing & leather goods
Mining
Agriculture , forestry , fishing
Energy / petroleum
Insurance / Assurance / Medical aid
Health , welfare , pharmaceutical
Hospitality / Tourism / Entertainment
11%11%9%9%8%8%7%6%5%5%5%
4%4%4%4%4%4%4%
84
80
71
70
62
58
56
44
40
39
36
33
31
31
30
30
30
29
28
4%
Other services, e.g. advertising / marketing , etc
Retail / wholesale
Telecommunication / Electronics / Information Technology
Construction / building / engineering
Motor industry , machinery & equipment
Transport / Freight
Manufacturing : Other
Banking / Financial services
Registered professions , e.g. accounting , legal
Security industry
Food, beverages & tobacco
.Chemicals , plastics , rubber , etc
Textiles , clothing & leather goods
Mining
Agriculture , forestry , fishing
Energy / petroleum
Insurance / Assurance / Medical aid
Health , welfare , pharmaceutical
Hospitality / Tourism / Entertainment
Representation from organisational sizes:
18%
24%
22%
36%
3%
Very SmallEnterprise
Small Enterprise
Medium Enterprise
Large Enterprise
Not willing tomention
Note: SME categories sum to 100%, whilst "Not willing to mention" = % of total sample
9
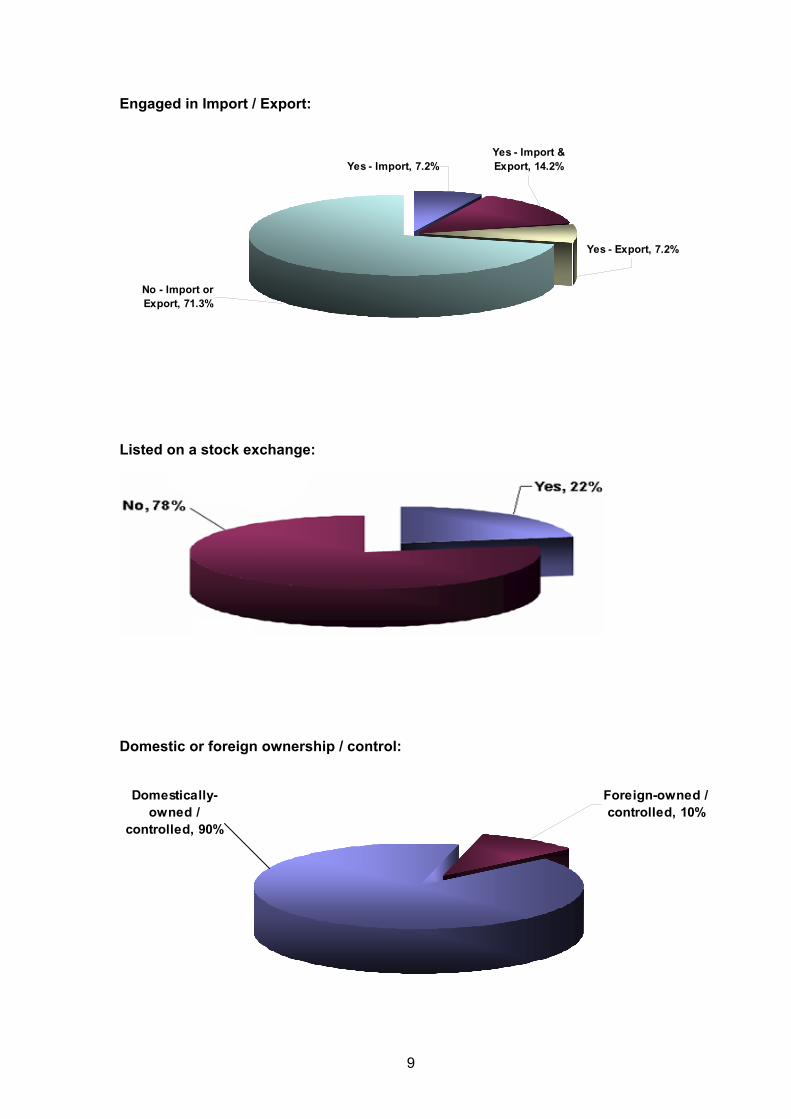
Engaged in Import / Export:
No - Import or Export, 71.3%
Yes - Import, 7.2%Yes - Import & Export, 14.2%
Yes - Export, 7.2%
Listed on a stock exchange:
Domestic or foreign ownership / control:
Domestically-owned /
controlled, 90%
Foreign-owned / controlled, 10%

10
Company Turnover:
Number of full time employees:
Provinces in which business is conducted: Respondents were asked to mark all the provinces where they conduct business
55%
43%34% 37%
47%
72%
38% 36%43%
0%10%20%30%40%50%60%70%80%90%
100%
Wes
tern
Cap
e
East
ern
Cap
e
Nor
th C
ape
Free
Sta
te
Kw
aZul
uN
atal
Gau
teng
Nor
th-W
est
Lim
popo
Mpu
mal
anga
19%
26%
10%
9%
9%
6%
13%
8%
4%
1 - 10
11 - 50
51 - 100
101 - 250
251 - 500
501 - 1000
1001 - 5000
5001 -
Not willing to mention
Note: Employee categories sum to 100%, whilst "Not willing to mention" = % of total sample
5%
6%
9%
7%
8%
8%
9%
14%
7%
27%
18%
R 1 – R 500,000
R 500,001 – R 1,000,000
R 1,000,001 – R 2,500,000
R 2,500,001 – R 5,000,000
R 5,000,001 – R 10,000,000
R 10,000,001 – R 25,000,000
R 25,000,001 – R 50,000,000
R 50,000,001 – R 250,000,000
R 250,000,001 – R 500,000,000
R 500,000,001 –
Not willing to mention
Note: Turnover categories sum to 100%, whilst "Not willing to mention" = % of total sample
11
6. Research findings
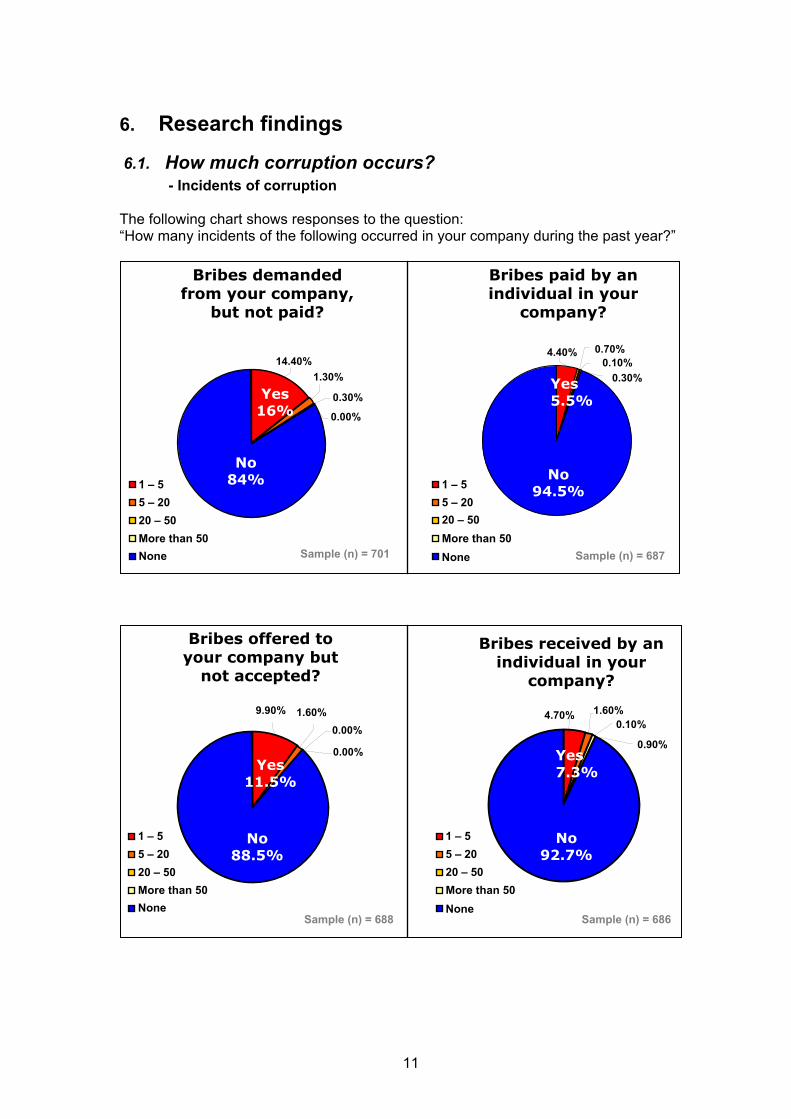
6.1. How much corruption occurs? - Incidents of corruption
The following chart shows responses to the question: “How many incidents of the following occurred in your company during the past year?”
Bribes demanded from your company,
but not paid?
Bribes paid by an individual in your
company?
No 84%
14.40%
0.00%
0.30%
1.30%
1 – 55 – 2020 – 50More than 50None
Yes 16%
0.30% 0.10%
0.70% 4.40%
1 – 55 – 2020 – 50 More than 50None
No 94.5%
Yes 5.5%
Sample (n) = 701 Sample (n) = 687
Bribes offered to your company but
not accepted?
0.00%
0.00%
9.90% 1.60%
No 88.5%
4.70% 1.60%0.10%
0.90%
No 92.7%
Bribes received by an individual in your
company?
Yes 7.3% Yes
11.5%
1 – 55 – 2020 – 50More than 50 None
1 – 55 – 2020 – 50More than 50None
Sample (n) = 688 Sample (n) = 686
12
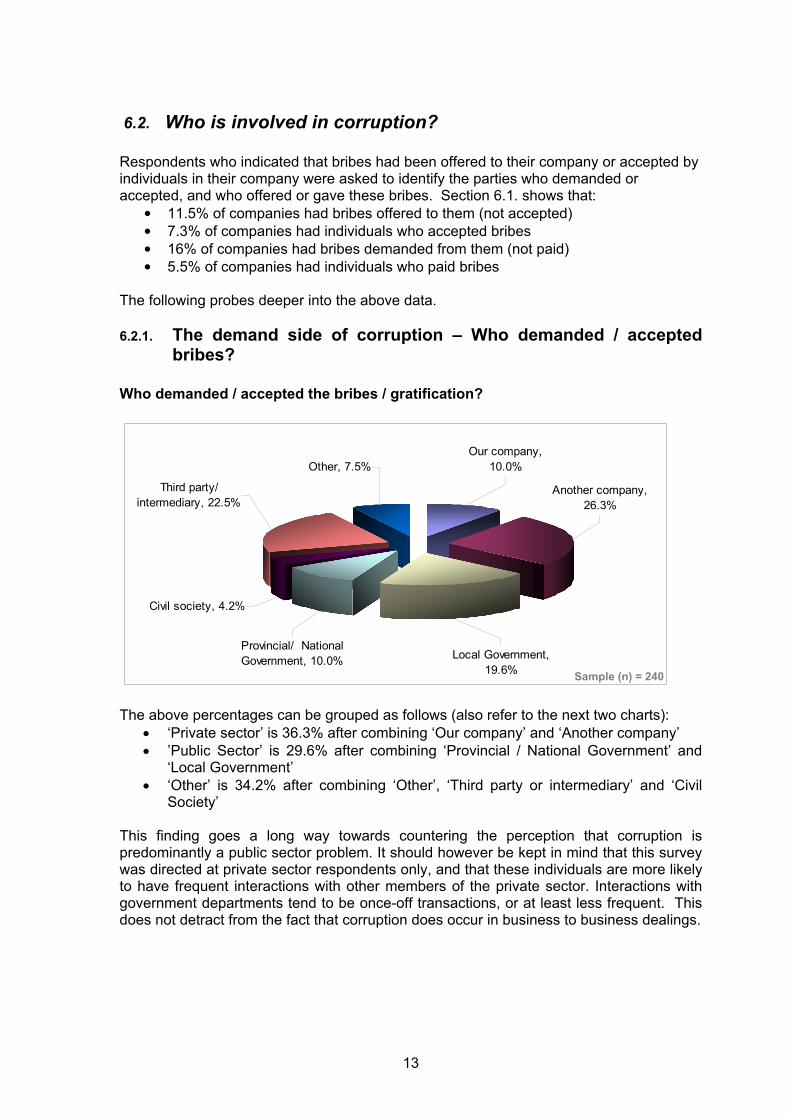
The highest corruption figure in the above charts shows that bribes were demanded from 16% of companies. During 2002 the Department for Public Service and Administration (DPSA) commissioned a study into some aspects of corruption in the private sector. Their study found that 15% of companies surveyed had bribes demanded from them, which correlates closely with these findings.1 The incidence of bribes paid by an individual in the company is slightly down from the 7% of the 2002 survey, to 5.5% reflected in this survey.
This survey for the first time measures not only whether bribes were paid by individuals from the private sector, but also whether they accepted bribes. 7.3% of respondents indicated that individuals in their company had received bribes. This is higher than the incidence of bribes paid. Traditional perceptions are that the private sector is predominantly involved on the supply side of corruption (paying bribes) to the public sector. This figure however indicates that the private sector also plays a significant role on the demand side of corruption (receiving bribes). There seems to be evidence of company-to-company corruption. The majority of companies who experienced some form of bribery stated that they experienced relatively few (between 1 and 5) incidents during the past year.
1 The DPSA study required respondents to be in the following positions: MD’s and CEO’s, Financial management, Reporting and compliance managers, Risk managers, Heads of internal audit departments, Group accountants, Heads of forensic audit departments. This corresponds with the ‘Designation of Respondents’ for this study as outlined on page 7.
Comparison between 2002 and 2006 surveys
5.5%
16.0%
7%
15%
0.0% 2.0% 4.0% 6.0% 8.0%
10.0%
12.0%
14.0%
16.0%
18.0%
Having to pay a bribe Being approached to pay abribe
BAC/GTZ study (November 2006) DPSA study (June 2002)
2006
2006
2002
2002
13
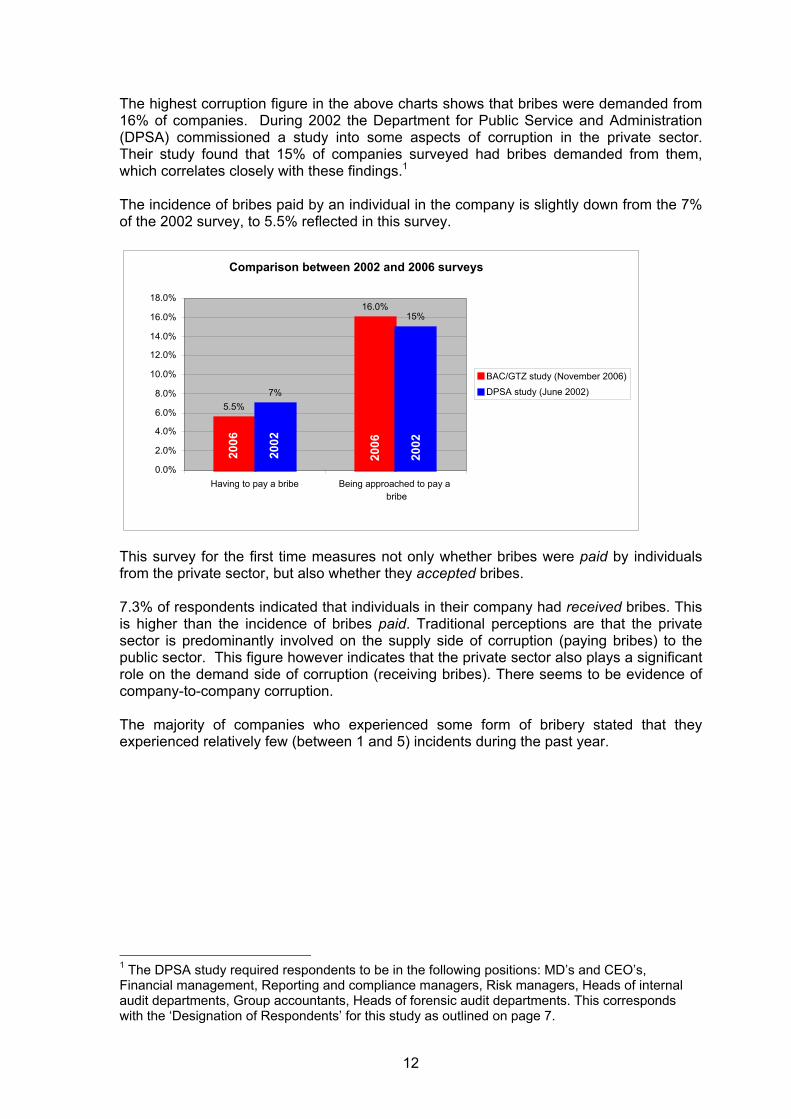
6.2. Who is involved in corruption? Respondents who indicated that bribes had been offered to their company or accepted by individuals in their company were asked to identify the parties who demanded or accepted, and who offered or gave these bribes. Section 6.1. shows that:
• 11.5% of companies had bribes offered to them (not accepted) • 7.3% of companies had individuals who accepted bribes • 16% of companies had bribes demanded from them (not paid) • 5.5% of companies had individuals who paid bribes
The following probes deeper into the above data.
6.2.1. The demand side of corruption – Who demanded / accepted bribes?
Who demanded / accepted the bribes / gratification?
Civil society, 4.2%
Provincial/ National Government, 10.0% Local Government,
19.6%
Another company, 26.3%
Our company, 10.0%Other, 7.5%
Third party/ intermediary, 22.5%
The above percentages can be grouped as follows (also refer to the next two charts):
• ‘Private sector’ is 36.3% after combining ‘Our company’ and ‘Another company’ • ’Public Sector’ is 29.6% after combining ‘Provincial / National Government’ and
‘Local Government’ • ‘Other’ is 34.2% after combining ‘Other’, ‘Third party or intermediary’ and ‘Civil
Society’ This finding goes a long way towards countering the perception that corruption is predominantly a public sector problem. It should however be kept in mind that this survey was directed at private sector respondents only, and that these individuals are more likely to have frequent interactions with other members of the private sector. Interactions with government departments tend to be once-off transactions, or at least less frequent. This does not detract from the fact that corruption does occur in business to business dealings.
Sample (n) = 240
14
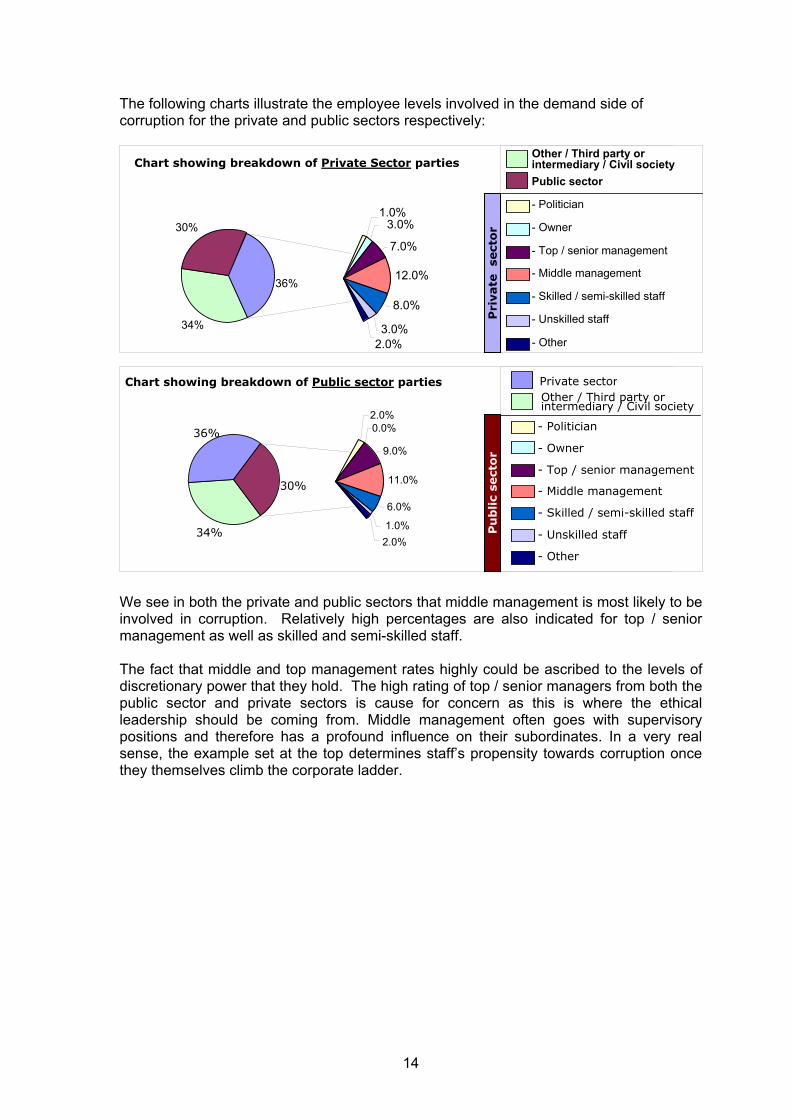
The following charts illustrate the employee levels involved in the demand side of corruption for the private and public sectors respectively:
We see in both the private and public sectors that middle management is most likely to be involved in corruption. Relatively high percentages are also indicated for top / senior management as well as skilled and semi-skilled staff. The fact that middle and top management rates highly could be ascribed to the levels of discretionary power that they hold. The high rating of top / senior managers from both the public sector and private sectors is cause for concern as this is where the ethical leadership should be coming from. Middle management often goes with supervisory positions and therefore has a profound influence on their subordinates. In a very real sense, the example set at the top determines staff’s propensity towards corruption once they themselves climb the corporate ladder.
Chart showing breakdown of Public sector parties
34%
30%
36%
Other / Third party orintermediary / Civil society
- Politician
- Owner
- Top / senior management
- Middle management
- Skilled / semi-skilled staff
- Unskilled staff
- Other
Public sector
Private sector
Chart showing breakdown of Private Sector parties
34%
30%
36%
Other / Third party or intermediary / Civil societyPublic sector
- Politician
- Owner
- Top / senior management
- Middle management
- Skilled / semi-skilled staff
- Unskilled staff
- Other
Private sector
Public sector
Other
Pu
blic
sect
or
Pri
vate
se
cto
r
1.0%3.0%
7.0%
12.0%
8.0%
3.0%2.0%
2.0%0.0%
9.0%
11.0%
6.0%
1.0%2.0%
15
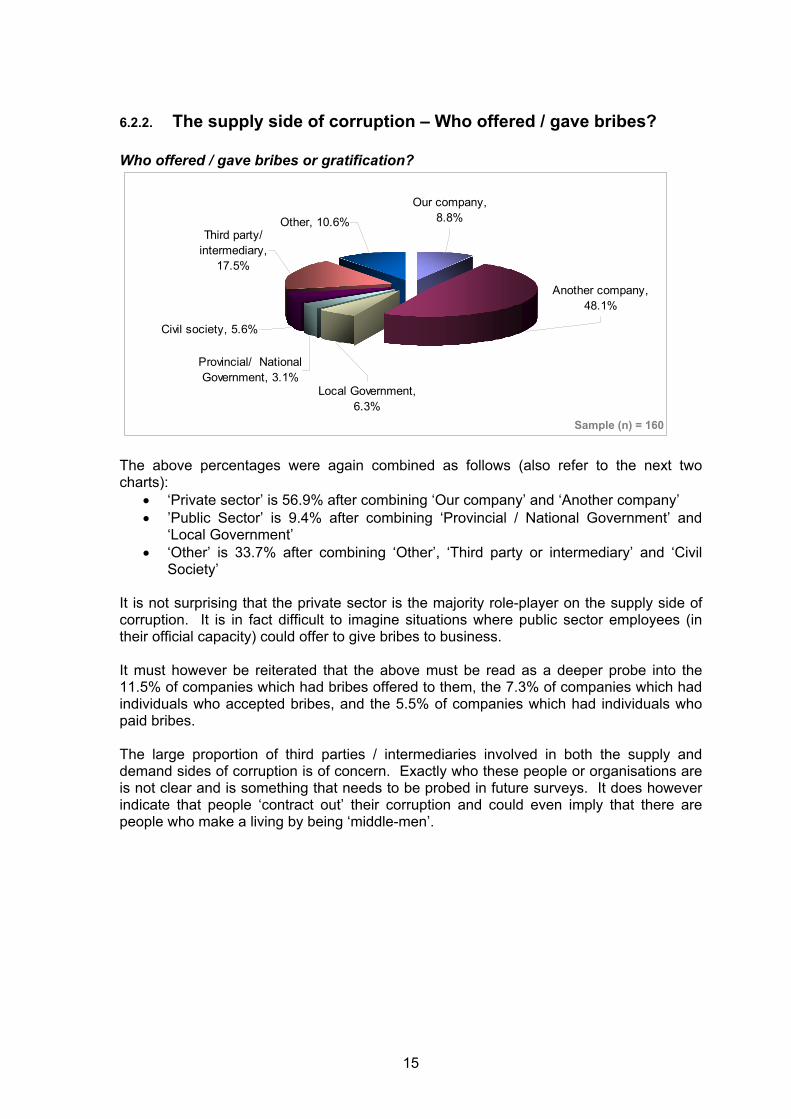
6.2.2. The supply side of corruption – Who offered / gave bribes? Who offered / gave bribes or gratification?
Civil society, 5.6%
Third party/ intermediary,
17.5%
Our company, 8.8%
Another company, 48.1%
Local Government, 6.3%
Provincial/ National Government, 3.1%
Other, 10.6%
The above percentages were again combined as follows (also refer to the next two charts):
• ‘Private sector’ is 56.9% after combining ‘Our company’ and ‘Another company’ • ’Public Sector’ is 9.4% after combining ‘Provincial / National Government’ and
‘Local Government’ • ‘Other’ is 33.7% after combining ‘Other’, ‘Third party or intermediary’ and ‘Civil
Society’ It is not surprising that the private sector is the majority role-player on the supply side of corruption. It is in fact difficult to imagine situations where public sector employees (in their official capacity) could offer to give bribes to business. It must however be reiterated that the above must be read as a deeper probe into the 11.5% of companies which had bribes offered to them, the 7.3% of companies which had individuals who accepted bribes, and the 5.5% of companies which had individuals who paid bribes. The large proportion of third parties / intermediaries involved in both the supply and demand sides of corruption is of concern. Exactly who these people or organisations are is not clear and is something that needs to be probed in future surveys. It does however indicate that people ‘contract out’ their corruption and could even imply that there are people who make a living by being ‘middle-men’.
Sample (n) = 160
16
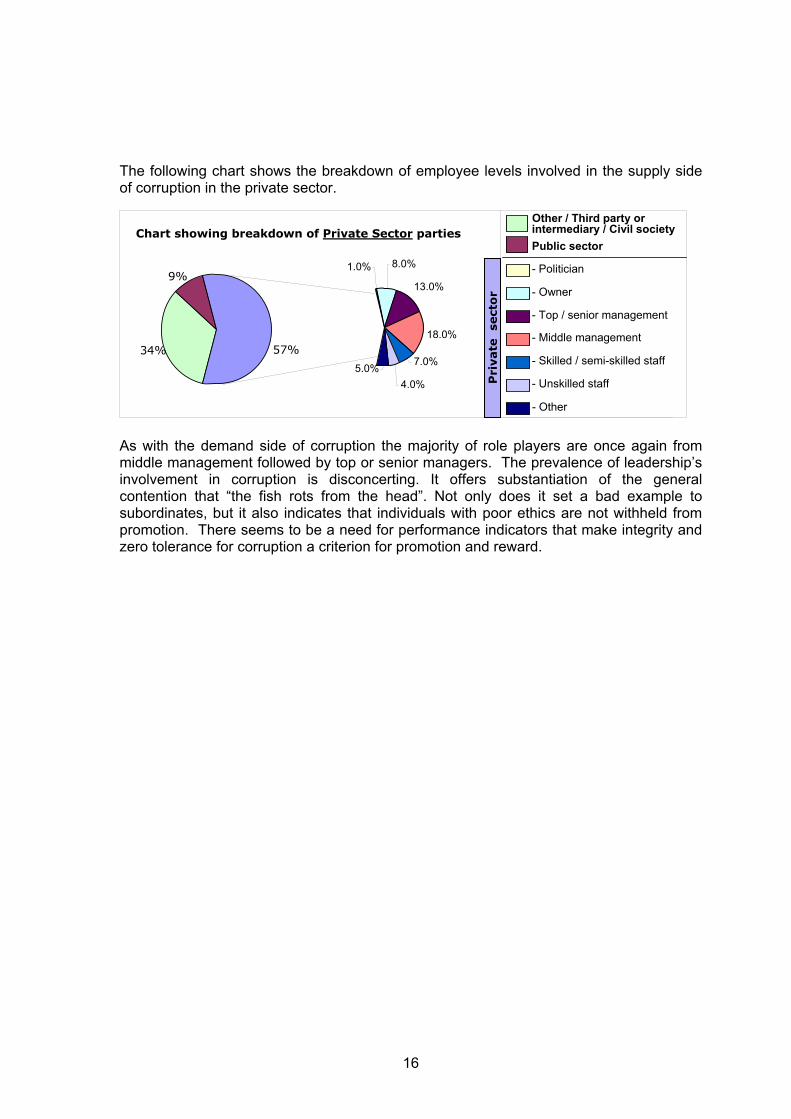
The following chart shows the breakdown of employee levels involved in the supply side of corruption in the private sector.
As with the demand side of corruption the majority of role players are once again from middle management followed by top or senior managers. The prevalence of leadership’s involvement in corruption is disconcerting. It offers substantiation of the general contention that “the fish rots from the head”. Not only does it set a bad example to subordinates, but it also indicates that individuals with poor ethics are not withheld from promotion. There seems to be a need for performance indicators that make integrity and zero tolerance for corruption a criterion for promotion and reward.
4.0%
1.0% 8.0%
13.0%
18.0%
7.0%5.0%
Other / Third party or intermediary / Civil societyPublic sector
- Politician
- Owner
- Top / senior management
- Middle management
- Skilled / semi-skilled staff
- Unskilled staff
- Other
Public sector
Pri
vate
se
cto
r
Chart showing breakdown of Private Sector parties
9%
57%34%
17
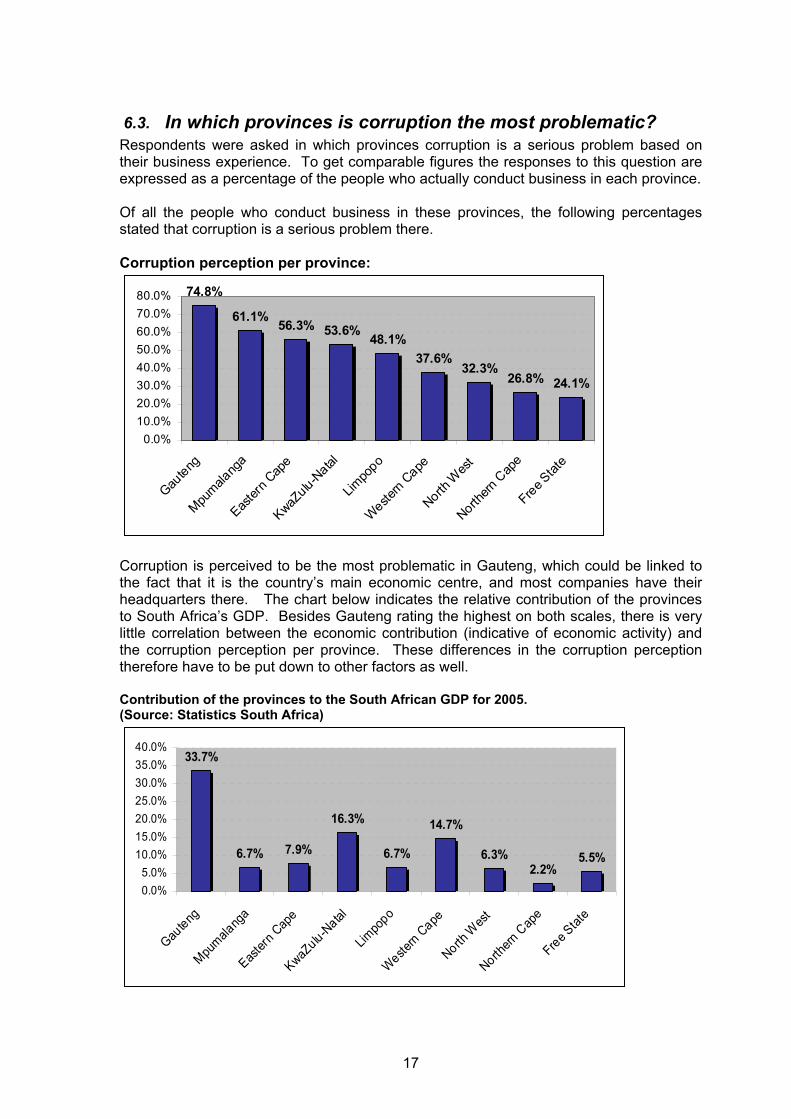
6.3. In which provinces is corruption the most problematic? Respondents were asked in which provinces corruption is a serious problem based on their business experience. To get comparable figures the responses to this question are expressed as a percentage of the people who actually conduct business in each province. Of all the people who conduct business in these provinces, the following percentages stated that corruption is a serious problem there. Corruption perception per province:
74.8%
61.1% 56.3% 53.6% 48.1%37.6%
32.3%26.8% 24.1%
0.0%10.0%20.0%30.0%40.0%50.0%60.0%70.0%80.0%
Gauteng
Mpumala
nga
Easter
n Cap
e
KwaZulu-N
atal
Limpo
po
Western
Cape
North W
est
Northern
Cap
e
Free Stat
e
Corruption is perceived to be the most problematic in Gauteng, which could be linked to the fact that it is the country’s main economic centre, and most companies have their headquarters there. The chart below indicates the relative contribution of the provinces to South Africa’s GDP. Besides Gauteng rating the highest on both scales, there is very little correlation between the economic contribution (indicative of economic activity) and the corruption perception per province. These differences in the corruption perception therefore have to be put down to other factors as well. Contribution of the provinces to the South African GDP for 2005. (Source: Statistics South Africa)
33.7%
6.7% 7.9%
16.3%
6.7%
14.7%
6.3%2.2%
5.5%
0.0%5.0%
10.0%15.0%20.0%25.0%30.0%35.0%40.0%
Gauteng
Mpumala
nga
Easter
n Cap
e
KwaZulu-N
atal
Limpo
po
Western
Cape
North W
est
Northern
Cap
e
Free Stat
e
18
6.4. Risk areas
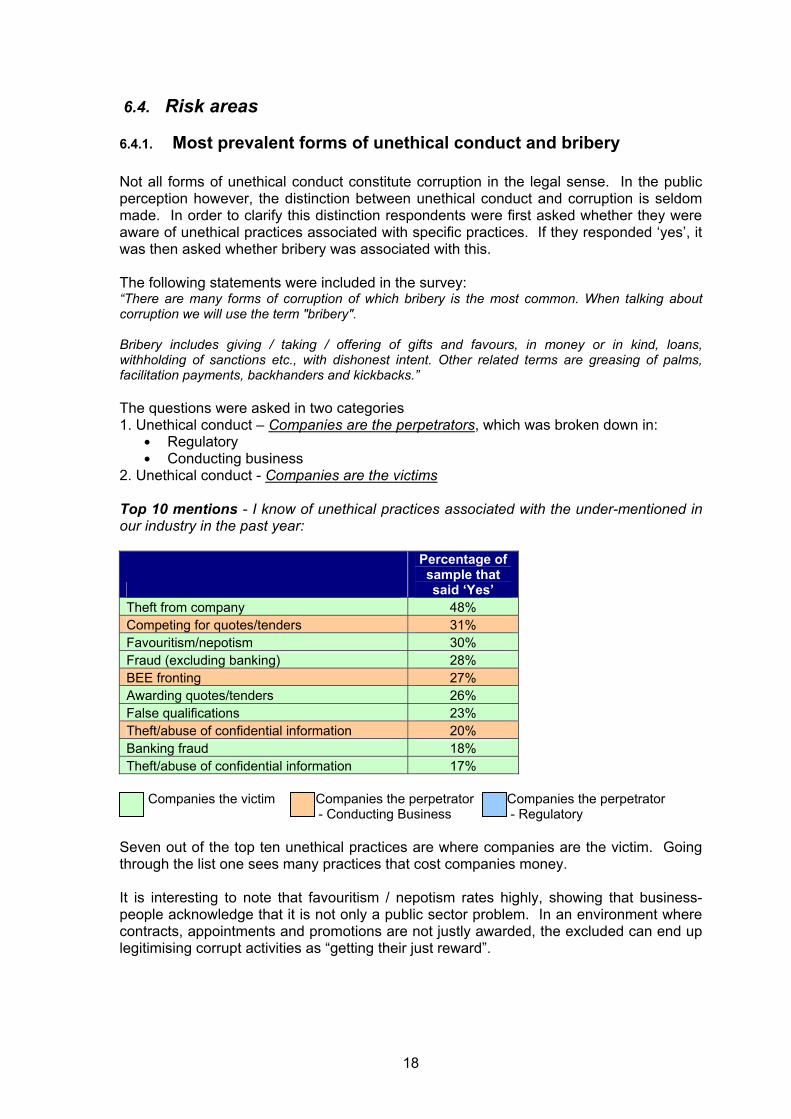
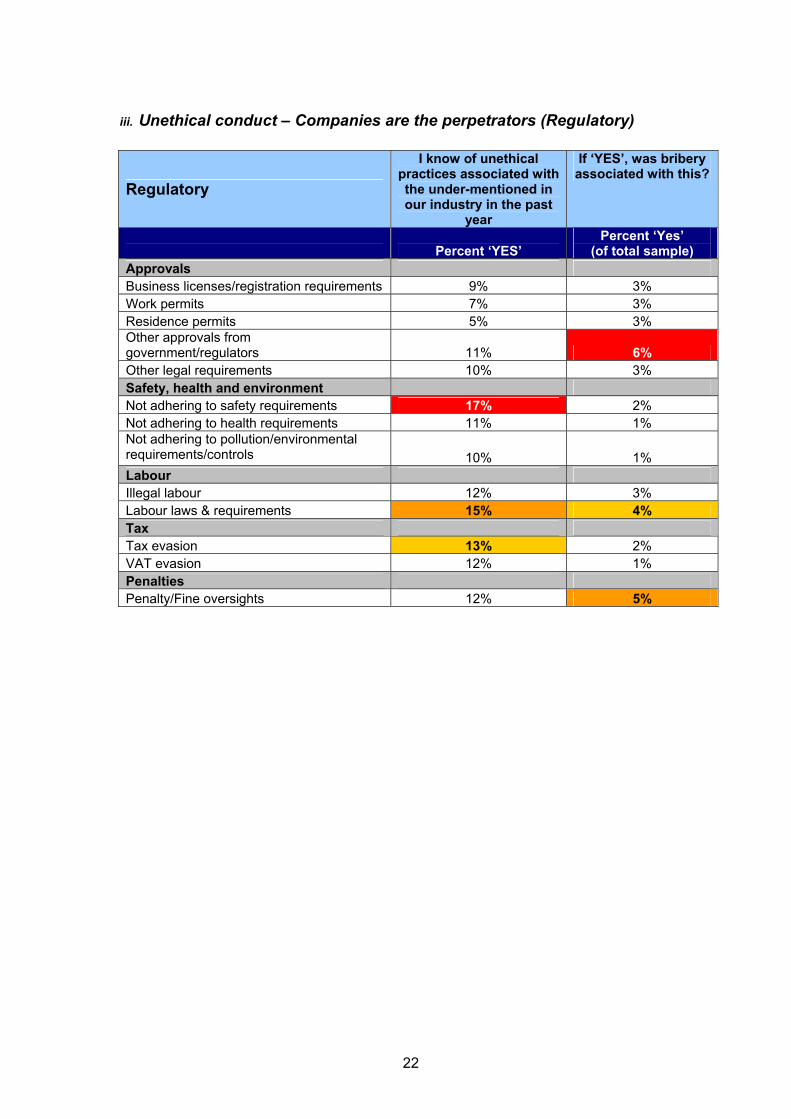
6.4.1. Most prevalent forms of unethical conduct and bribery Not all forms of unethical conduct constitute corruption in the legal sense. In the public perception however, the distinction between unethical conduct and corruption is seldom made. In order to clarify this distinction respondents were first asked whether they were aware of unethical practices associated with specific practices. If they responded ‘yes’, it was then asked whether bribery was associated with this. The following statements were included in the survey: “There are many forms of corruption of which bribery is the most common. When talking about corruption we will use the term "bribery". Bribery includes giving / taking / offering of gifts and favours, in money or in kind, loans, withholding of sanctions etc., with dishonest intent. Other related terms are greasing of palms, facilitation payments, backhanders and kickbacks.” The questions were asked in two categories 1. Unethical conduct – Companies are the perpetrators, which was broken down in:
• Regulatory • Conducting business
2. Unethical conduct - Companies are the victims Top 10 mentions - I know of unethical practices associated with the under-mentioned in our industry in the past year:
Percentage of sample that said ‘Yes’
Theft from company 48% Competing for quotes/tenders 31% Favouritism/nepotism 30% Fraud (excluding banking) 28% BEE fronting 27% Awarding quotes/tenders 26% False qualifications 23% Theft/abuse of confidential information 20% Banking fraud 18% Theft/abuse of confidential information 17%
Companies the victim Companies the perpetrator Companies the perpetrator - Conducting Business - Regulatory Seven out of the top ten unethical practices are where companies are the victim. Going through the list one sees many practices that cost companies money. It is interesting to note that favouritism / nepotism rates highly, showing that business-people acknowledge that it is not only a public sector problem. In an environment where contracts, appointments and promotions are not justly awarded, the excluded can end up legitimising corrupt activities as “getting their just reward”.
19
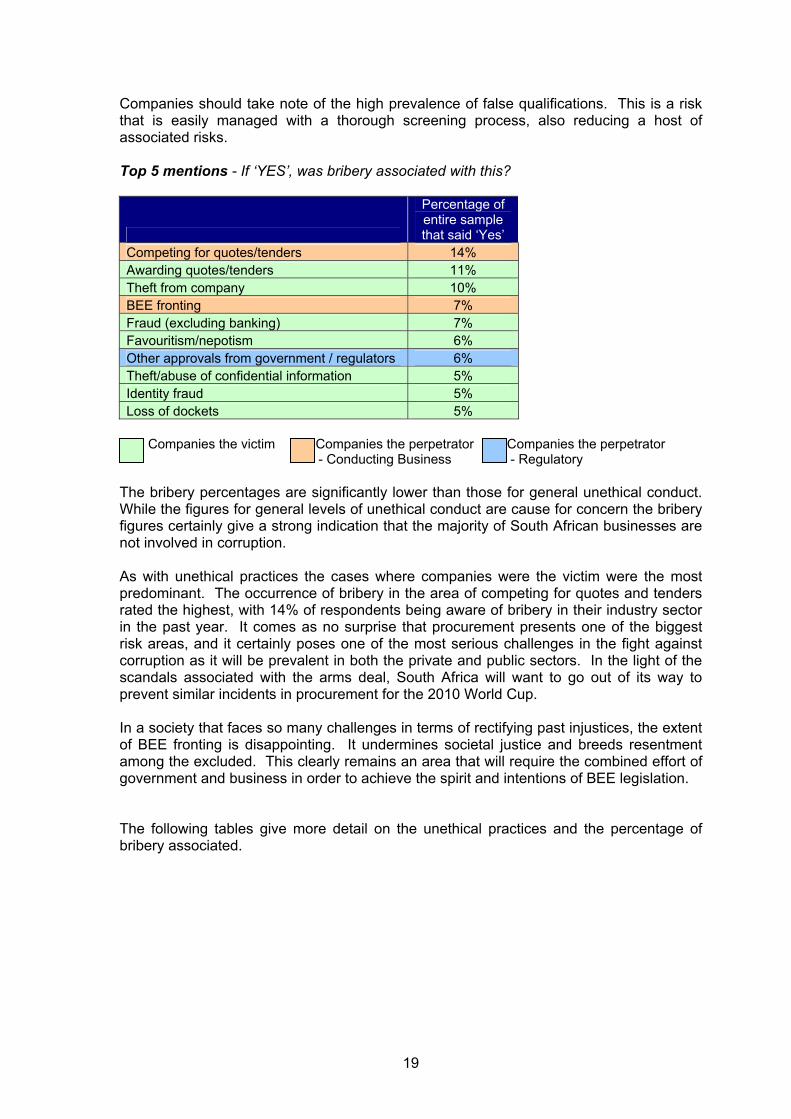
Companies should take note of the high prevalence of false qualifications. This is a risk that is easily managed with a thorough screening process, also reducing a host of associated risks. Top 5 mentions - If ‘YES’, was bribery associated with this?
Percentage of entire sample that said ‘Yes’
Competing for quotes/tenders 14% Awarding quotes/tenders 11% Theft from company 10% BEE fronting 7% Fraud (excluding banking) 7% Favouritism/nepotism 6% Other approvals from government / regulators 6% Theft/abuse of confidential information 5% Identity fraud 5% Loss of dockets 5%
Companies the victim Companies the perpetrator Companies the perpetrator - Conducting Business - Regulatory The bribery percentages are significantly lower than those for general unethical conduct. While the figures for general levels of unethical conduct are cause for concern the bribery figures certainly give a strong indication that the majority of South African businesses are not involved in corruption. As with unethical practices the cases where companies were the victim were the most predominant. The occurrence of bribery in the area of competing for quotes and tenders rated the highest, with 14% of respondents being aware of bribery in their industry sector in the past year. It comes as no surprise that procurement presents one of the biggest risk areas, and it certainly poses one of the most serious challenges in the fight against corruption as it will be prevalent in both the private and public sectors. In the light of the scandals associated with the arms deal, South Africa will want to go out of its way to prevent similar incidents in procurement for the 2010 World Cup. In a society that faces so many challenges in terms of rectifying past injustices, the extent of BEE fronting is disappointing. It undermines societal justice and breeds resentment among the excluded. This clearly remains an area that will require the combined effort of government and business in order to achieve the spirit and intentions of BEE legislation. The following tables give more detail on the unethical practices and the percentage of bribery associated.
20
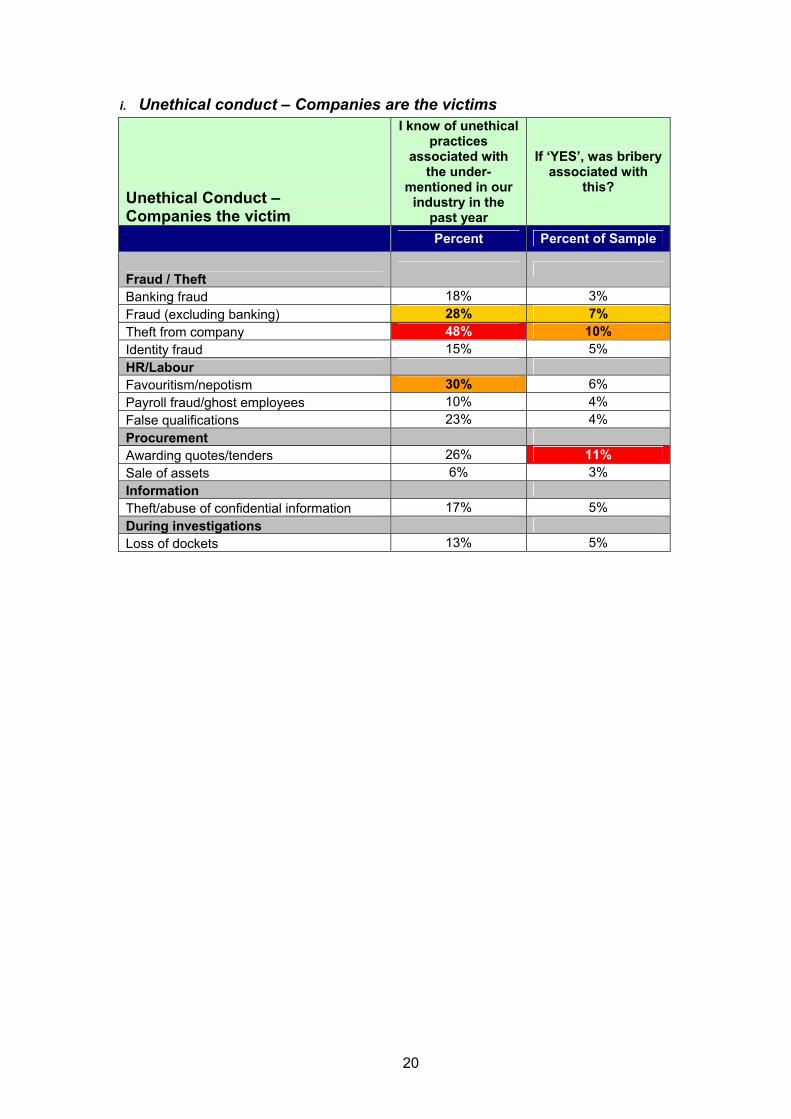
i. Unethical conduct – Companies are the victims
Unethical Conduct – Companies the victim
I know of unethical practices
associated with the under-
mentioned in our industry in the
past year
If ‘YES’, was bribery associated with
this?
Percent Percent of Sample
Fraud / Theft
Banking fraud 18% 3% Fraud (excluding banking) 28% 7% Theft from company 48% 10% Identity fraud 15% 5% HR/Labour Favouritism/nepotism 30% 6% Payroll fraud/ghost employees 10% 4% False qualifications 23% 4% Procurement Awarding quotes/tenders 26% 11% Sale of assets 6% 3% Information Theft/abuse of confidential information 17% 5% During investigations Loss of dockets 13% 5%
21
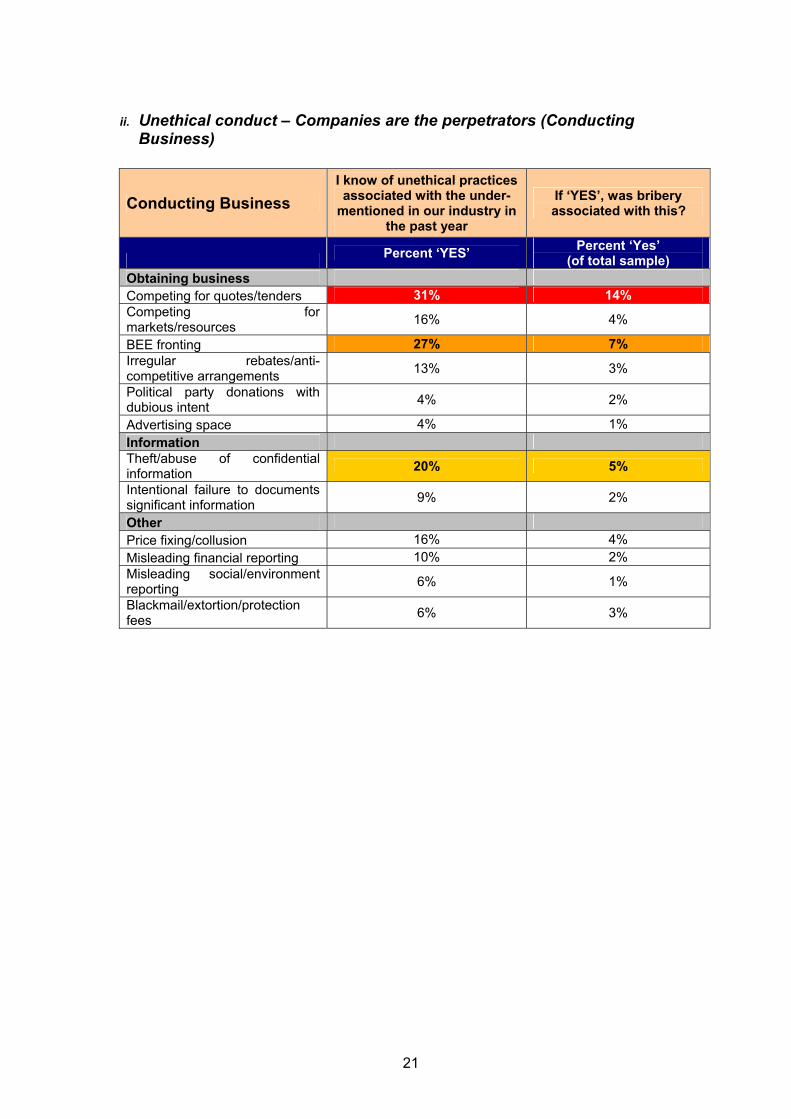
ii. Unethical conduct – Companies are the perpetrators (Conducting Business)
Conducting Business I know of unethical practices associated with the under-
mentioned in our industry in the past year
If ‘YES’, was bribery associated with this?
Percent ‘YES’ Percent ‘Yes’ (of total sample)
Obtaining business Competing for quotes/tenders 31% 14% Competing for markets/resources 16% 4%
BEE fronting 27% 7% Irregular rebates/anti-competitive arrangements 13% 3%
Political party donations with dubious intent 4% 2%
Advertising space 4% 1% Information Theft/abuse of confidential information 20% 5%
Intentional failure to documents significant information 9% 2%
Other Price fixing/collusion 16% 4% Misleading financial reporting 10% 2% Misleading social/environment reporting 6% 1%
Blackmail/extortion/protection fees 6% 3%
22
iii. Unethical conduct – Companies are the perpetrators (Regulatory)
Regulatory
I know of unethical practices associated with the under-mentioned in our industry in the past
year
If ‘YES’, was bribery associated with this?
Percent ‘YES’ Percent ‘Yes’
(of total sample) Approvals Business licenses/registration requirements 9% 3% Work permits 7% 3% Residence permits 5% 3% Other approvals from government/regulators 11% 6% Other legal requirements 10% 3% Safety, health and environment Not adhering to safety requirements 17% 2% Not adhering to health requirements 11% 1% Not adhering to pollution/environmental requirements/controls 10% 1% Labour Illegal labour 12% 3% Labour laws & requirements 15% 4% Tax Tax evasion 13% 2% VAT evasion 12% 1% Penalties Penalty/Fine oversights 12% 5%
23
6.5. What kinds of gratification are given / received?
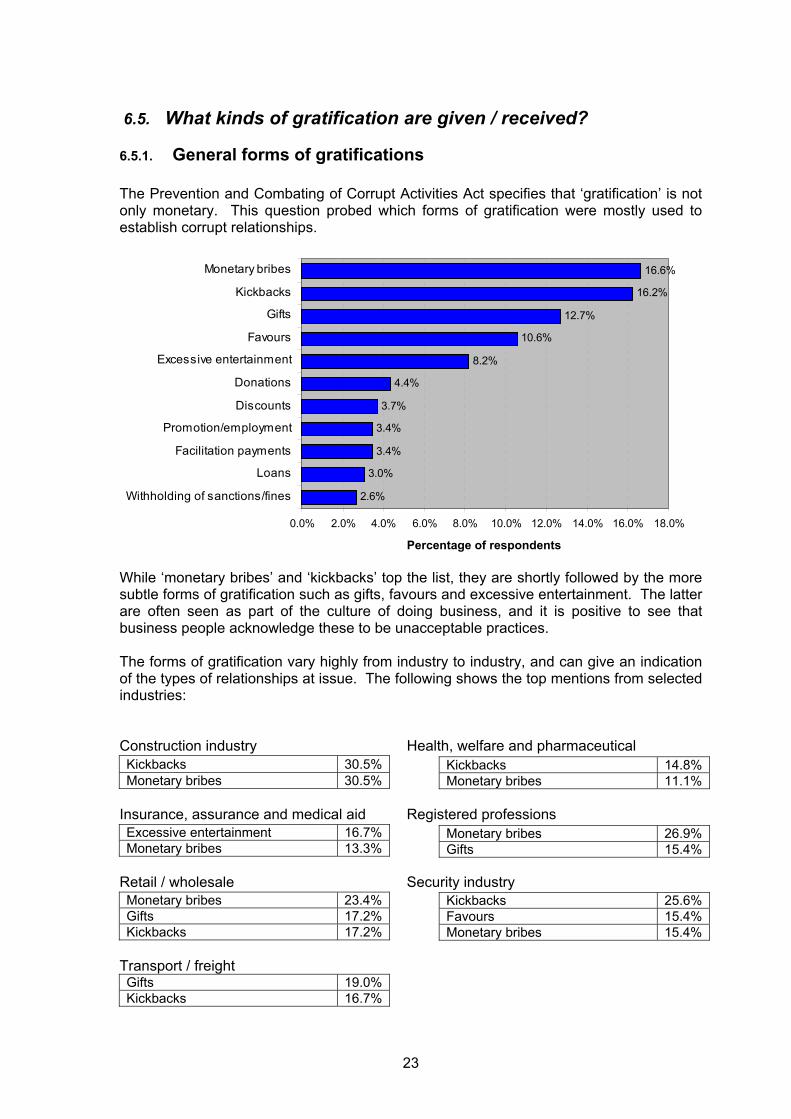
6.5.1. General forms of gratifications The Prevention and Combating of Corrupt Activities Act specifies that ‘gratification’ is not only monetary. This question probed which forms of gratification were mostly used to establish corrupt relationships.
2.6%
3.0%
3.4%
3.4%
3.7%
4.4%
8.2%
10.6%
12.7%
16.2%
16.6%
0.0% 2.0% 4.0% 6.0% 8.0% 10.0% 12.0% 14.0% 16.0% 18.0%
Withholding of sanctions/fines
Loans
Facilitation payments
Promotion/employment
Discounts
Donations
Excessive entertainment
Favours
Gifts
Kickbacks
Monetary bribes
Percentage of respondents While ‘monetary bribes’ and ‘kickbacks’ top the list, they are shortly followed by the more subtle forms of gratification such as gifts, favours and excessive entertainment. The latter are often seen as part of the culture of doing business, and it is positive to see that business people acknowledge these to be unacceptable practices. The forms of gratification vary highly from industry to industry, and can give an indication of the types of relationships at issue. The following shows the top mentions from selected industries: Construction industry Health, welfare and pharmaceutical
Kickbacks 30.5%Monetary bribes 30.5%
Insurance, assurance and medical aid Registered professions
Excessive entertainment 16.7%Monetary bribes 13.3%
Retail / wholesale Security industry
Monetary bribes 23.4%Gifts 17.2%Kickbacks 17.2%
Transport / freight Gifts 19.0%Kickbacks 16.7%
Kickbacks 14.8%Monetary bribes 11.1%
Monetary bribes 26.9%Gifts 15.4%
Kickbacks 25.6%Favours 15.4%Monetary bribes 15.4%
24
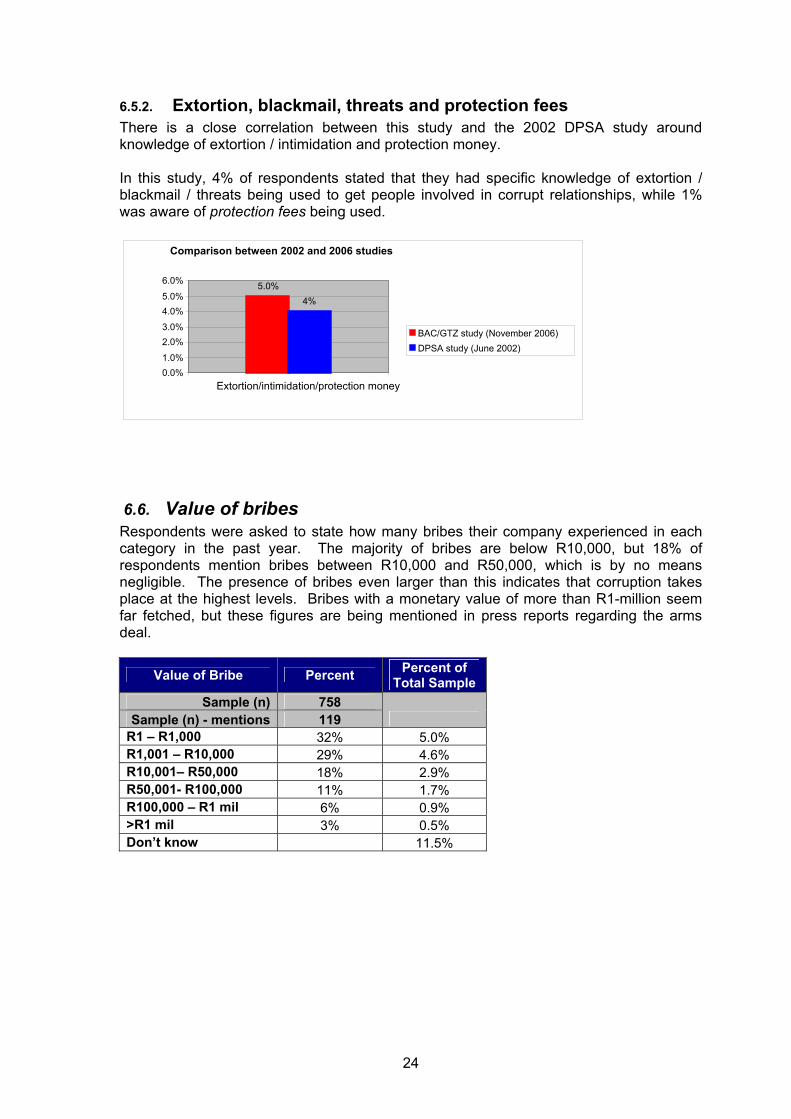
6.5.2. Extortion, blackmail, threats and protection fees There is a close correlation between this study and the 2002 DPSA study around knowledge of extortion / intimidation and protection money. In this study, 4% of respondents stated that they had specific knowledge of extortion / blackmail / threats being used to get people involved in corrupt relationships, while 1% was aware of protection fees being used.
6.6. Value of bribes Respondents were asked to state how many bribes their company experienced in each category in the past year. The majority of bribes are below R10,000, but 18% of respondents mention bribes between R10,000 and R50,000, which is by no means negligible. The presence of bribes even larger than this indicates that corruption takes place at the highest levels. Bribes with a monetary value of more than R1-million seem far fetched, but these figures are being mentioned in press reports regarding the arms deal.
Value of Bribe Percent Percent of Total Sample
Sample (n) 758 Sample (n) - mentions 119
R1 – R1,000 32% 5.0% R1,001 – R10,000 29% 4.6% R10,001– R50,000 18% 2.9% R50,001- R100,000 11% 1.7% R100,000 – R1 mil 6% 0.9% >R1 mil 3% 0.5% Don’t know 11.5%
Comparison between 2002 and 2006 studies
5.0% 4%
0.0% 1.0% 2.0% 3.0% 4.0% 5.0% 6.0%
Extortion/intimidation/protection money
BAC/GTZ study (November 2006)DPSA study (June 2002)
25
6.7. Corruption Control
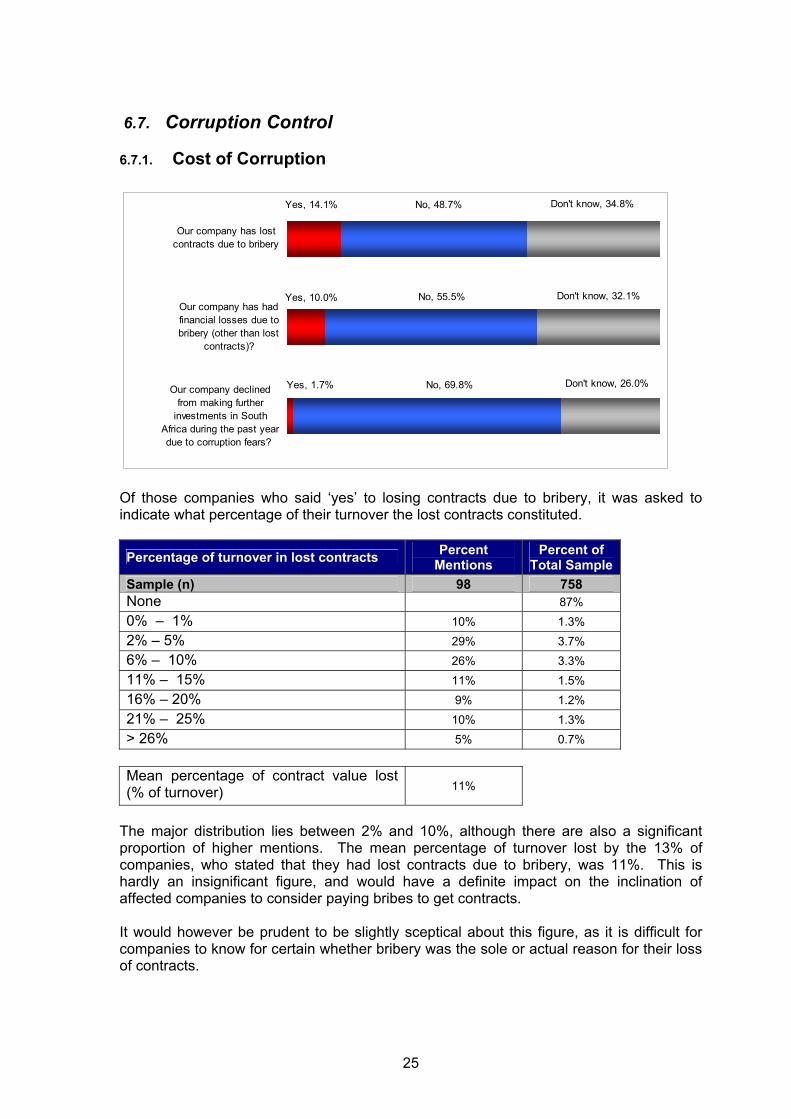
6.7.1. Cost of Corruption
Yes, 14.1%
Yes, 10.0%
Yes, 1.7% No, 69.8%
No, 55.5%
No, 48.7% Don't know, 34.8%
Don't know, 32.1%
Don't know, 26.0%
Our company has lostcontracts due to bribery
Our company has hadfinancial losses due tobribery (other than lost
contracts)?
Our company declinedfrom making further
investments in SouthAfrica during the past yeardue to corruption fears?
Of those companies who said ‘yes’ to losing contracts due to bribery, it was asked to indicate what percentage of their turnover the lost contracts constituted.
Percentage of turnover in lost contracts Percent Mentions
Percent of Total Sample
Sample (n) 98 758 None 87% 0% – 1% 10% 1.3% 2% – 5% 29% 3.7% 6% – 10% 26% 3.3% 11% – 15% 11% 1.5% 16% – 20% 9% 1.2% 21% – 25% 10% 1.3% > 26% 5% 0.7% Mean percentage of contract value lost (% of turnover) 11%
The major distribution lies between 2% and 10%, although there are also a significant proportion of higher mentions. The mean percentage of turnover lost by the 13% of companies, who stated that they had lost contracts due to bribery, was 11%. This is hardly an insignificant figure, and would have a definite impact on the inclination of affected companies to consider paying bribes to get contracts. It would however be prudent to be slightly sceptical about this figure, as it is difficult for companies to know for certain whether bribery was the sole or actual reason for their loss of contracts.
26
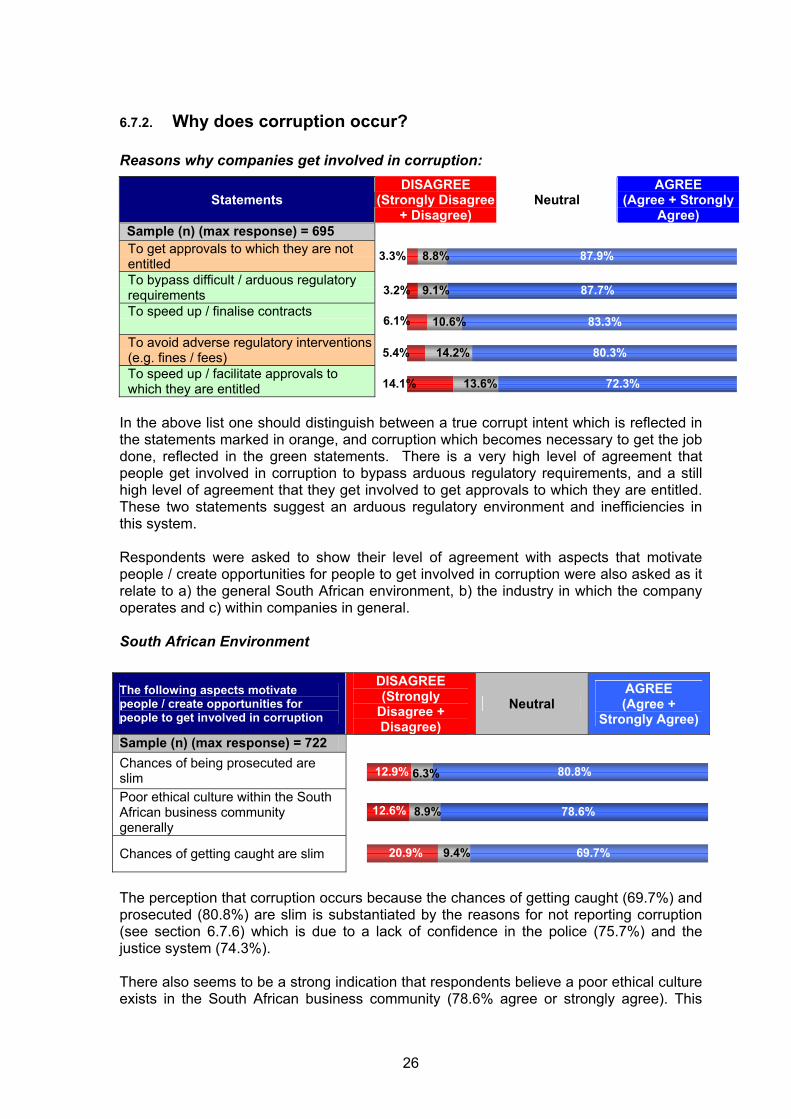
6.7.2. Why does corruption occur? Reasons why companies get involved in corruption:
Statements DISAGREE
(Strongly Disagree + Disagree)
Neutral AGREE
(Agree + Strongly Agree)
Sample (n) (max response) = 695 To get approvals to which they are not entitled To bypass difficult / arduous regulatory requirements To speed up / finalise contracts To avoid adverse regulatory interventions (e.g. fines / fees) To speed up / facilitate approvals to which they are entitled
In the above list one should distinguish between a true corrupt intent which is reflected in the statements marked in orange, and corruption which becomes necessary to get the job done, reflected in the green statements. There is a very high level of agreement that people get involved in corruption to bypass arduous regulatory requirements, and a still high level of agreement that they get involved to get approvals to which they are entitled. These two statements suggest an arduous regulatory environment and inefficiencies in this system. Respondents were asked to show their level of agreement with aspects that motivate people / create opportunities for people to get involved in corruption were also asked as it relate to a) the general South African environment, b) the industry in which the company operates and c) within companies in general. South African Environment
The following aspects motivate people / create opportunities for people to get involved in corruption
DISAGREE (Strongly
Disagree + Disagree)
Neutral AGREE (Agree +
Strongly Agree)
Sample (n) (max response) = 722 Chances of being prosecuted are slim Poor ethical culture within the South African business community generally
Chances of getting caught are slim
The perception that corruption occurs because the chances of getting caught (69.7%) and prosecuted (80.8%) are slim is substantiated by the reasons for not reporting corruption (see section 6.7.6) which is due to a lack of confidence in the police (75.7%) and the justice system (74.3%). There also seems to be a strong indication that respondents believe a poor ethical culture exists in the South African business community (78.6% agree or strongly agree). This
8.8%
9.1%
10.6%
14.2%
13.6%
87.9%
87.7%
83.3%
80.3%
72.3%
3.3%
3.2%
6.1%
5.4%
14.1%
8.9%
9.4%
80.8%
78.6%
69.7%
12.9%
12.6%
20.9%
6.3%
27
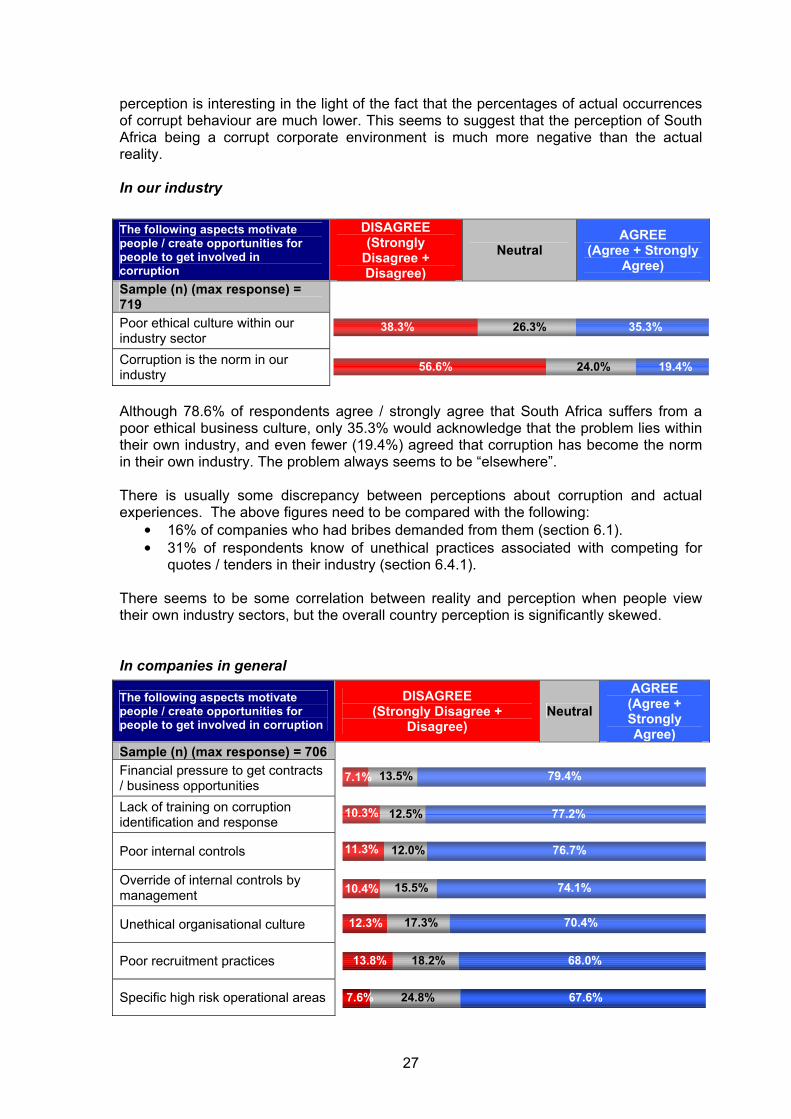
perception is interesting in the light of the fact that the percentages of actual occurrences of corrupt behaviour are much lower. This seems to suggest that the perception of South Africa being a corrupt corporate environment is much more negative than the actual reality. In our industry
The following aspects motivate people / create opportunities for people to get involved in corruption
DISAGREE (Strongly
Disagree + Disagree)
Neutral AGREE
(Agree + Strongly Agree)
Sample (n) (max response) = 719 Poor ethical culture within our industry sector Corruption is the norm in our industry Although 78.6% of respondents agree / strongly agree that South Africa suffers from a poor ethical business culture, only 35.3% would acknowledge that the problem lies within their own industry, and even fewer (19.4%) agreed that corruption has become the norm in their own industry. The problem always seems to be “elsewhere”. There is usually some discrepancy between perceptions about corruption and actual experiences. The above figures need to be compared with the following:
• 16% of companies who had bribes demanded from them (section 6.1). • 31% of respondents know of unethical practices associated with competing for
quotes / tenders in their industry (section 6.4.1). There seems to be some correlation between reality and perception when people view their own industry sectors, but the overall country perception is significantly skewed. In companies in general
The following aspects motivate people / create opportunities for people to get involved in corruption
DISAGREE (Strongly Disagree +
Disagree) Neutral
AGREE (Agree + Strongly Agree)
Sample (n) (max response) = 706 Financial pressure to get contracts / business opportunities Lack of training on corruption identification and response
Poor internal controls
Override of internal controls by management
Unethical organisational culture
Poor recruitment practices
Specific high risk operational areas
26.3%
24.0%
35.3%
19.4%56.6%
38.3%
13.5%
12.5%
12.0%
15.5%
17.3%
18.2%
24.8%
79.4%
77.2%
76.7%
74.1%
70.4%
68.0%
67.6% 7.6%
13.8%
12.3%
10.4%
11.3%
10.3%
7.1%
28
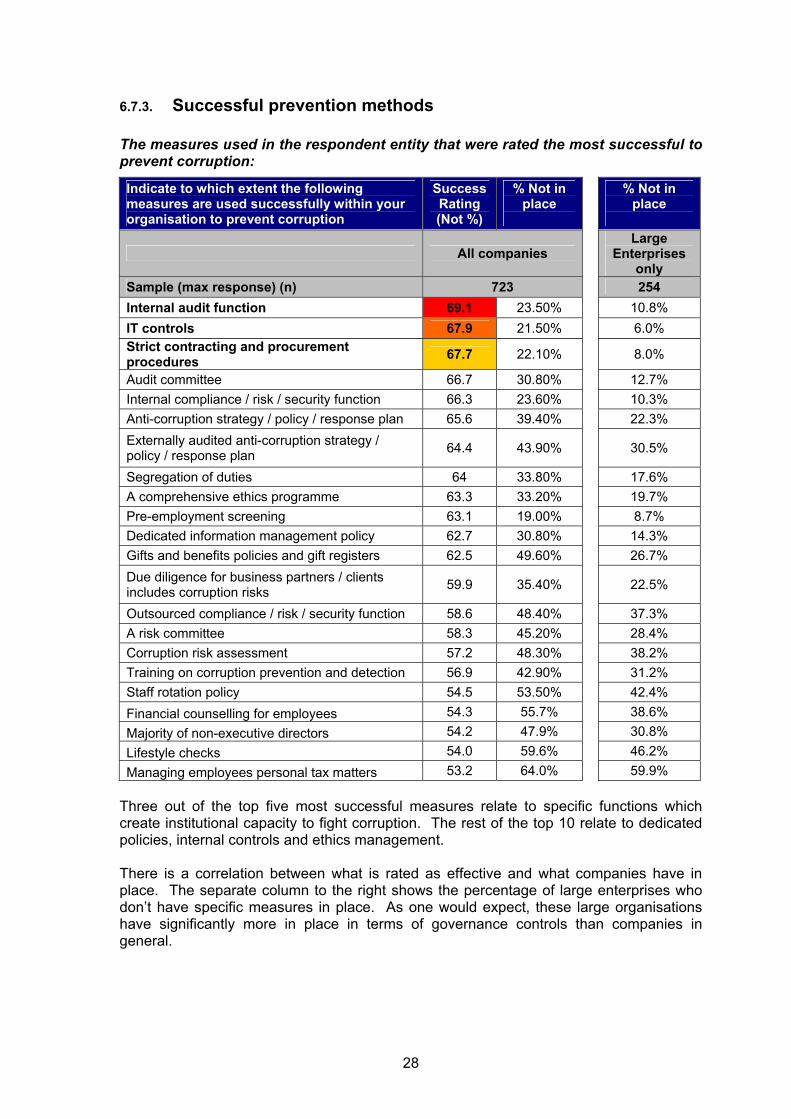
6.7.3. Successful prevention methods The measures used in the respondent entity that were rated the most successful to prevent corruption:
Indicate to which extent the following measures are used successfully within your organisation to prevent corruption
Success Rating (Not %)
% Not in place
% Not in place
All companies Large
Enterprises only
Sample (max response) (n) 723 254 Internal audit function 69.1 23.50% 10.8% IT controls 67.9 21.50% 6.0% Strict contracting and procurement procedures 67.7 22.10% 8.0%
Audit committee 66.7 30.80% 12.7% Internal compliance / risk / security function 66.3 23.60% 10.3% Anti-corruption strategy / policy / response plan 65.6 39.40% 22.3% Externally audited anti-corruption strategy / policy / response plan 64.4 43.90% 30.5%
Segregation of duties 64 33.80% 17.6% A comprehensive ethics programme 63.3 33.20% 19.7% Pre-employment screening 63.1 19.00% 8.7% Dedicated information management policy 62.7 30.80% 14.3% Gifts and benefits policies and gift registers 62.5 49.60% 26.7% Due diligence for business partners / clients includes corruption risks 59.9 35.40% 22.5%
Outsourced compliance / risk / security function 58.6 48.40% 37.3% A risk committee 58.3 45.20% 28.4% Corruption risk assessment 57.2 48.30% 38.2% Training on corruption prevention and detection 56.9 42.90% 31.2% Staff rotation policy 54.5 53.50% 42.4% Financial counselling for employees 54.3 55.7% 38.6% Majority of non-executive directors 54.2 47.9% 30.8% Lifestyle checks 54.0 59.6% 46.2% Managing employees personal tax matters 53.2 64.0% 59.9%
Three out of the top five most successful measures relate to specific functions which create institutional capacity to fight corruption. The rest of the top 10 relate to dedicated policies, internal controls and ethics management. There is a correlation between what is rated as effective and what companies have in place. The separate column to the right shows the percentage of large enterprises who don’t have specific measures in place. As one would expect, these large organisations have significantly more in place in terms of governance controls than companies in general.
29
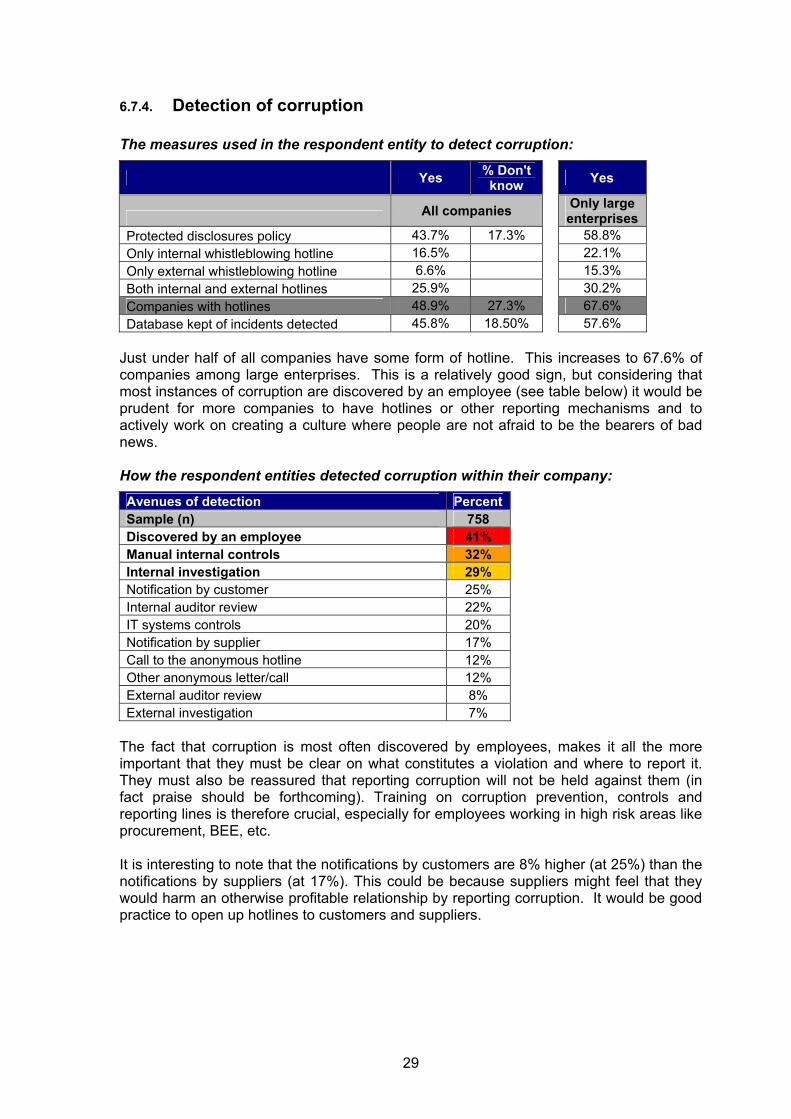
6.7.4. Detection of corruption The measures used in the respondent entity to detect corruption:
Yes % Don't know Yes
All companies Only large enterprises
Protected disclosures policy 43.7% 17.3% 58.8% Only internal whistleblowing hotline 16.5% 22.1% Only external whistleblowing hotline 6.6% 15.3% Both internal and external hotlines 25.9% 30.2% Companies with hotlines 48.9% 27.3% 67.6% Database kept of incidents detected 45.8% 18.50% 57.6%
Just under half of all companies have some form of hotline. This increases to 67.6% of companies among large enterprises. This is a relatively good sign, but considering that most instances of corruption are discovered by an employee (see table below) it would be prudent for more companies to have hotlines or other reporting mechanisms and to actively work on creating a culture where people are not afraid to be the bearers of bad news. How the respondent entities detected corruption within their company:
Avenues of detection Percent Sample (n) 758 Discovered by an employee 41% Manual internal controls 32% Internal investigation 29% Notification by customer 25% Internal auditor review 22% IT systems controls 20% Notification by supplier 17% Call to the anonymous hotline 12% Other anonymous letter/call 12% External auditor review 8% External investigation 7%
The fact that corruption is most often discovered by employees, makes it all the more important that they must be clear on what constitutes a violation and where to report it. They must also be reassured that reporting corruption will not be held against them (in fact praise should be forthcoming). Training on corruption prevention, controls and reporting lines is therefore crucial, especially for employees working in high risk areas like procurement, BEE, etc. It is interesting to note that the notifications by customers are 8% higher (at 25%) than the notifications by suppliers (at 17%). This could be because suppliers might feel that they would harm an otherwise profitable relationship by reporting corruption. It would be good practice to open up hotlines to customers and suppliers.
30
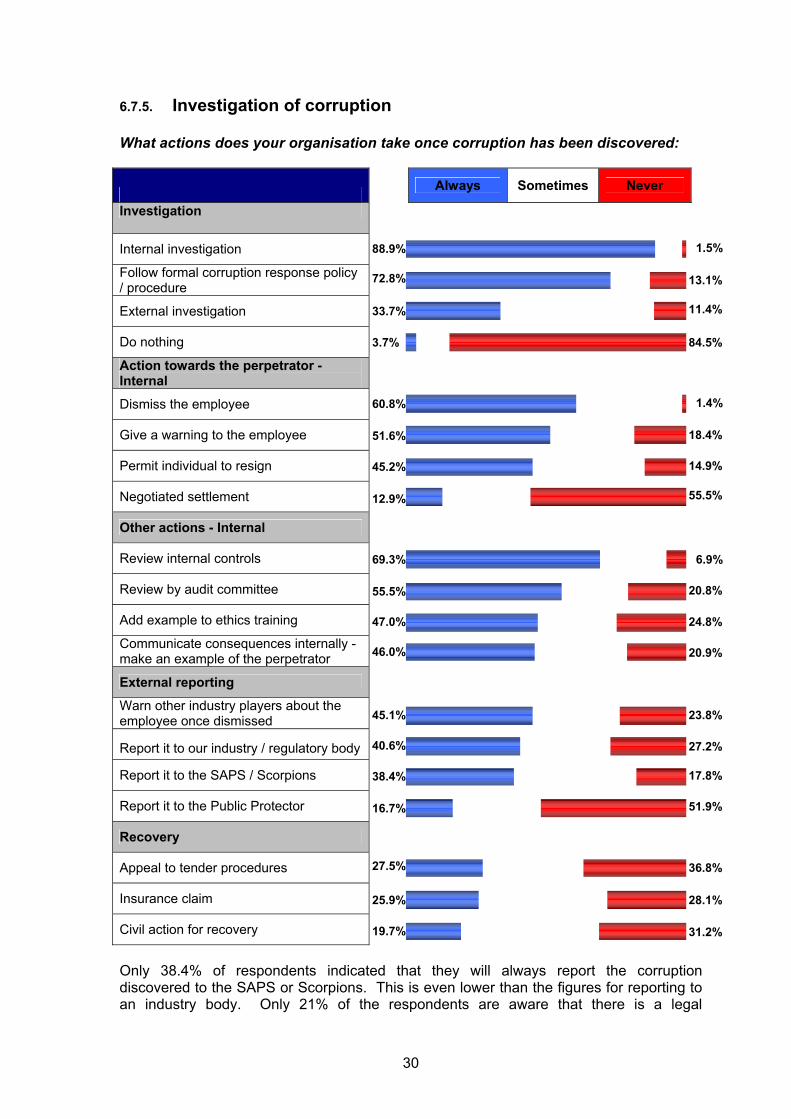
6.7.5. Investigation of corruption What actions does your organisation take once corruption has been discovered:
Always Sometimes Never
Investigation
Internal investigation Follow formal corruption response policy / procedure
External investigation
Do nothing Action towards the perpetrator - Internal
Dismiss the employee
Give a warning to the employee
Permit individual to resign
Negotiated settlement
Other actions - Internal
Review internal controls
Review by audit committee
Add example to ethics training
Communicate consequences internally - make an example of the perpetrator
External reporting
Warn other industry players about the employee once dismissed
Report it to our industry / regulatory body
Report it to the SAPS / Scorpions
Report it to the Public Protector
Recovery
Appeal to tender procedures
Insurance claim
Civil action for recovery
Only 38.4% of respondents indicated that they will always report the corruption discovered to the SAPS or Scorpions. This is even lower than the figures for reporting to an industry body. Only 21% of the respondents are aware that there is a legal
25.9%
19.7%
16.7%
38.4%
40.6%
27.5%
47.0%
69.3%
55.5%
45.1%
46.0%
60.8%
12.9%
45.2%
51.6%
72.8%
33.7%
88.9%
3.7%
28.1%
31.2%
51.9%
17.8%
27.2%
36.8%
24.8%
6.9%
20.8%
23.8%
20.9%
1.4%
55.5%
14.9%
18.4%
13.1%
11.4%
1.5%
84.5%
31
Yes21%
No79%
requirement to report incidents of corruption to the South African Police Service (SAPS) (see section 6.7.6). Section 34 of the Prevention and Combating of Corrupt Activities Act requires people in senior positions in an organisation to report any cases of corruption involving R100 000 or more to the SAPS. Failure to do so is a criminal offence. Permitting the individual to resign seems to be a prevalent response to corruption (45%). One may want to question the effectiveness of this strategy for long-term corruption prevention. This would allow the corrupt individual to seek other employment and perpetrate the same crimes elsewhere. Only 45% of respondents indicated that the industry is made aware of this dismissal, and this would only be effective in highly organised or very small industries. 21% of respondents indicate that the consequences of corrupt behaviour are never communicated internally to make an example of the punishment for corruption. This seems to be a missed opportunity to send a zero tolerance message. The publishing of names (“name and shame”) is a contentious issue and could have legal implications. Companies could however send a strong message by communicating numbers and types of cases concluded.
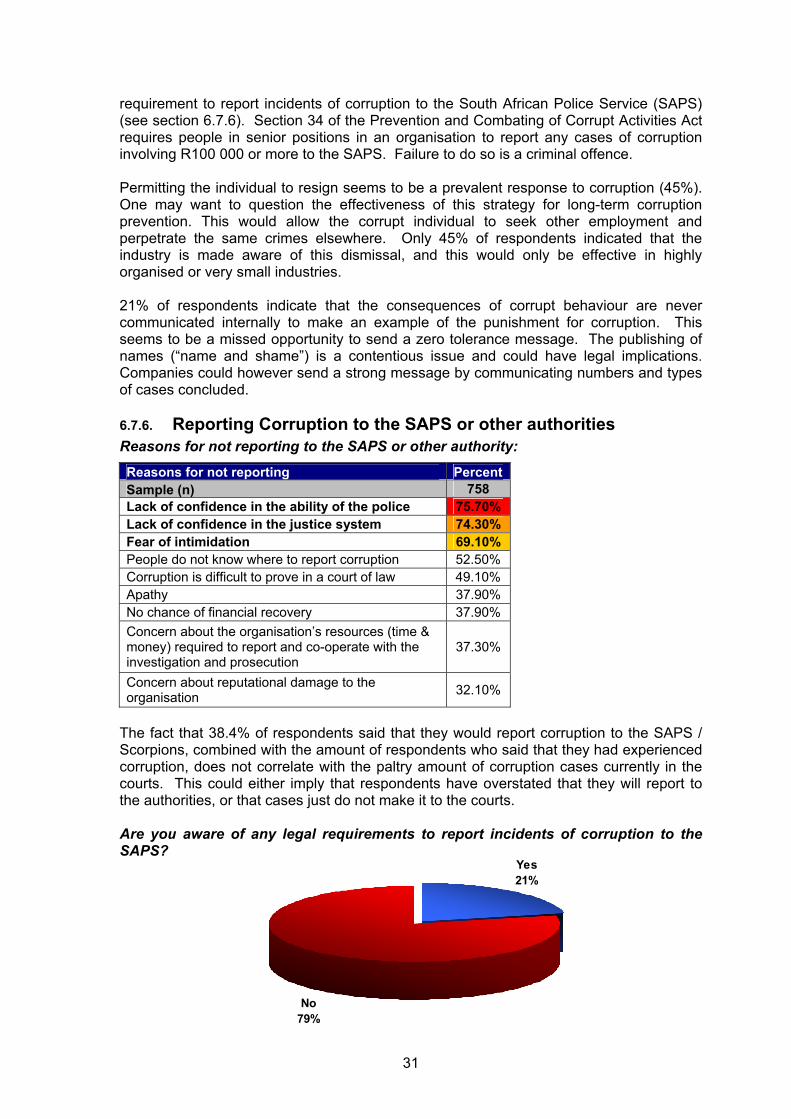
6.7.6. Reporting Corruption to the SAPS or other authorities Reasons for not reporting to the SAPS or other authority:
Reasons for not reporting Percent Sample (n) 758 Lack of confidence in the ability of the police 75.70% Lack of confidence in the justice system 74.30% Fear of intimidation 69.10% People do not know where to report corruption 52.50% Corruption is difficult to prove in a court of law 49.10% Apathy 37.90% No chance of financial recovery 37.90% Concern about the organisation’s resources (time & money) required to report and co-operate with the investigation and prosecution
37.30%
Concern about reputational damage to the organisation 32.10%
The fact that 38.4% of respondents said that they would report corruption to the SAPS / Scorpions, combined with the amount of respondents who said that they had experienced corruption, does not correlate with the paltry amount of corruption cases currently in the courts. This could either imply that respondents have overstated that they will report to the authorities, or that cases just do not make it to the courts. Are you aware of any legal requirements to report incidents of corruption to the SAPS?
32
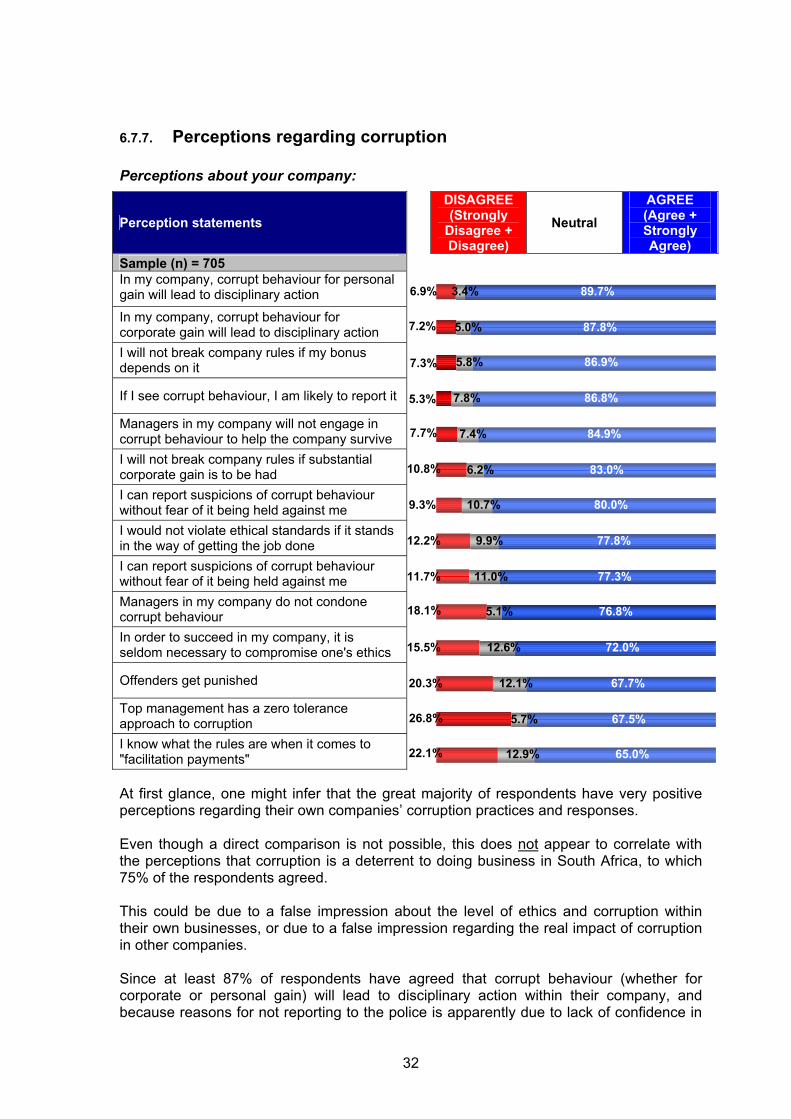
6.7.7. Perceptions regarding corruption Perceptions about your company:
Perception statements
DISAGREE (Strongly
Disagree + Disagree)
Neutral AGREE (Agree + Strongly Agree)
Sample (n) = 705 In my company, corrupt behaviour for personal gain will lead to disciplinary action
In my company, corrupt behaviour for corporate gain will lead to disciplinary action I will not break company rules if my bonus depends on it
If I see corrupt behaviour, I am likely to report it
Managers in my company will not engage in corrupt behaviour to help the company survive I will not break company rules if substantial corporate gain is to be had I can report suspicions of corrupt behaviour without fear of it being held against me I would not violate ethical standards if it stands in the way of getting the job done I can report suspicions of corrupt behaviour without fear of it being held against me Managers in my company do not condone corrupt behaviour In order to succeed in my company, it is seldom necessary to compromise one's ethics
Offenders get punished
Top management has a zero tolerance approach to corruption I know what the rules are when it comes to "facilitation payments" At first glance, one might infer that the great majority of respondents have very positive perceptions regarding their own companies’ corruption practices and responses. Even though a direct comparison is not possible, this does not appear to correlate with the perceptions that corruption is a deterrent to doing business in South Africa, to which 75% of the respondents agreed. This could be due to a false impression about the level of ethics and corruption within their own businesses, or due to a false impression regarding the real impact of corruption in other companies. Since at least 87% of respondents have agreed that corrupt behaviour (whether for corporate or personal gain) will lead to disciplinary action within their company, and because reasons for not reporting to the police is apparently due to lack of confidence in
3.4%
5.0%
5.8%
7.8%
7.4%
6.2%
10.7%
9.9%
11.0%
5.1%
12.6%
12.1%
5.7%
12.9%
89.7%
87.8%
86.9%
86.8%
84.9%
83.0%
80.0%
77.8%
77.3%
76.8%
72.0%
67.7%
67.5%
65.0% 22.1%
26.8%
20.3%
15.5%
18.1%
11.7%
12.2%
9.3%
10.8%
7.7%
5.3%
7.3%
7.2%
6.9%
33
the ability of both the police (75.7%) and the justice system (74.3%), it could be argued that corruption should at least be reported to the other entity involved (whether private sector or public sector) so that the perpetrators could be punished internally. This ‘internal punishment’ seems to take the form of dismissal in at least 60.8% of the cases. 11.7% of respondents disagreed or strongly disagreed with the statement that it is possible to report corruption without fear of it being held against him/her. This means that more than one out of ten respondents do not feel that it is safe to report corruption. With the amount of press reports on whistleblowers being victimised, it is surprising that this figure is not higher. In terms of respondents’ perception of management’s zero tolerance attitude towards corruption, as well as their experience of leadership example, there is also much cause for concern. 76.8% of respondents agreed that managers do not condone corrupt behaviour. This may is a positive result in the majority of cases, but there are also 18.1% of respondents who believed that managers DO condone corrupt behaviour. This is a significant percentage. Add to this that 26.8% of respondents who strongly disagreed that top management has a zero tolerance approach to corruption, and it becomes clear that leadership example and behaviour may be a significant factor in the instances of corruption that do exist. 22.1% of respondents indicated that they didn’t know what the rules are when it comes to "facilitation payments". 20.3% of respondents disagreed with the statement that offenders are punished. These figures indicate that a significant percentage of respondents do not really believe that corruption is disincentiveised. 15.5% of respondents strongly disagreed with the statement that it is never necessary to compromise one’s ethics to succeed in their company. 12.2% of respondents disagreed with the statement that he/she would not violate ethical standards if it stands in the way of getting the job done. 10.8% of respondents indicate that they will break the rules if significant corporate gain is to be had, and 7.3% said they will break the rules if their bonus depends on it. This represents a significant percentage of respondents who are indicating that corruption is a “necessary evil” in certain cases. Perceptions about the cost of corruption:
Agreement
score Corruption is a deterrent to doing business in South Africa 75 Current levels of corruption are harmful to further investment in South Africa 74 Current levels of corruption are harmful to further investment in our industry sector 59 Current levels of corruption make it difficult to operate ethically in our industry sector 48
There is a discrepancy between what people believe goes on in their own company as discussed above, and how they view the rest of their industry and even more so with how they view South Africa. Once again we see that people perceive that things get worse the further it is removed from them.
34
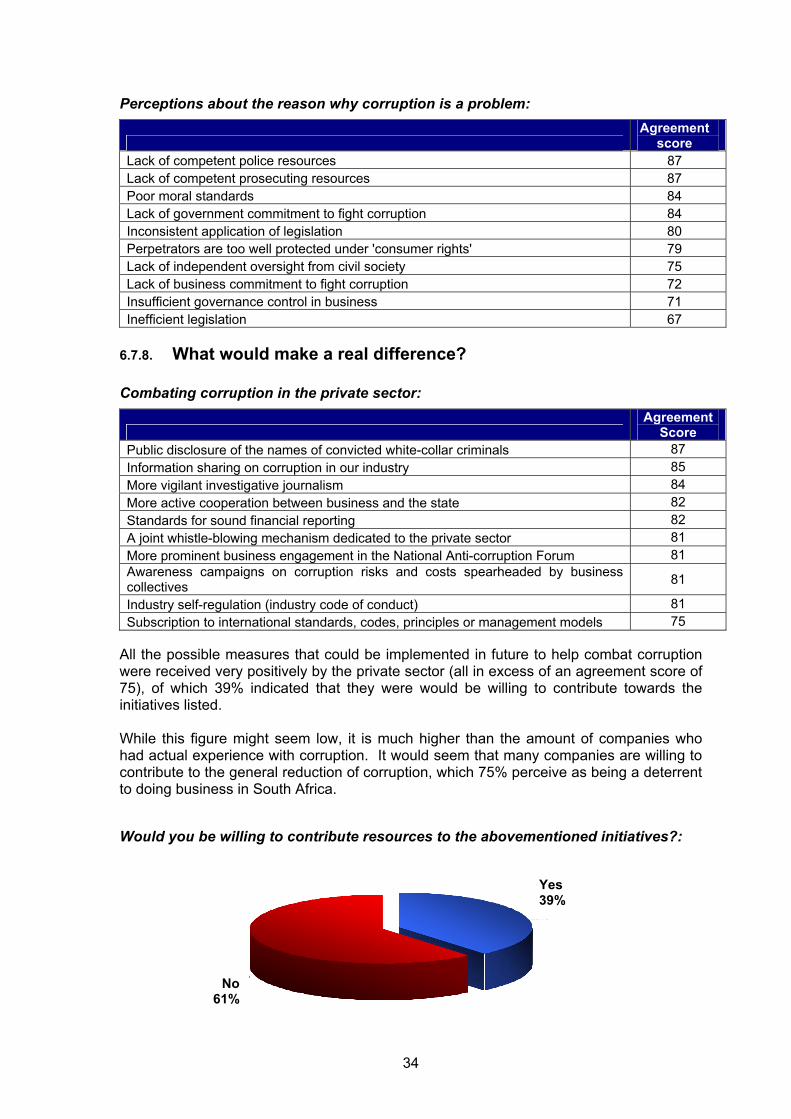
Perceptions about the reason why corruption is a problem:
Agreement
score Lack of competent police resources 87 Lack of competent prosecuting resources 87 Poor moral standards 84 Lack of government commitment to fight corruption 84 Inconsistent application of legislation 80 Perpetrators are too well protected under 'consumer rights' 79 Lack of independent oversight from civil society 75 Lack of business commitment to fight corruption 72 Insufficient governance control in business 71 Inefficient legislation 67
6.7.8. What would make a real difference? Combating corruption in the private sector:
Agreement
Score Public disclosure of the names of convicted white-collar criminals 87 Information sharing on corruption in our industry 85 More vigilant investigative journalism 84 More active cooperation between business and the state 82 Standards for sound financial reporting 82 A joint whistle-blowing mechanism dedicated to the private sector 81 More prominent business engagement in the National Anti-corruption Forum 81 Awareness campaigns on corruption risks and costs spearheaded by business collectives 81
Industry self-regulation (industry code of conduct) 81 Subscription to international standards, codes, principles or management models 75
All the possible measures that could be implemented in future to help combat corruption were received very positively by the private sector (all in excess of an agreement score of 75), of which 39% indicated that they were would be willing to contribute towards the initiatives listed. While this figure might seem low, it is much higher than the amount of companies who had actual experience with corruption. It would seem that many companies are willing to contribute to the general reduction of corruption, which 75% perceive as being a deterrent to doing business in South Africa. Would you be willing to contribute resources to the abovementioned initiatives?:
Yes39%
No61%
Yes 39%
No 61%
35
7. Conclusion The big question is bound to be: “So how big is the problem?” The corruption problem itself is probably best expressed by the actual experiences that companies had with bribery. To recap:
• 11.5% of companies had bribes offered to them (not accepted) • 7.3% of companies had individuals who accepted bribes • 16% of companies had bribes demanded from them (not paid) • 5.5% of companies had individuals who paid bribes
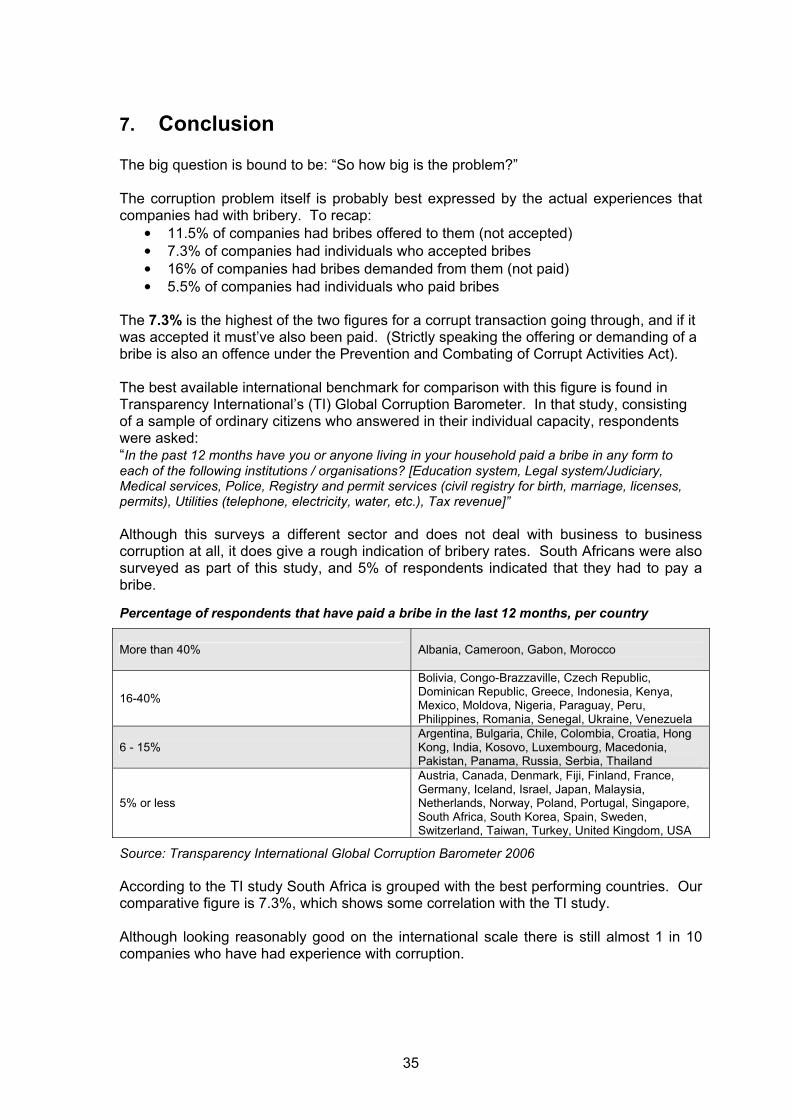
The 7.3% is the highest of the two figures for a corrupt transaction going through, and if it was accepted it must’ve also been paid. (Strictly speaking the offering or demanding of a bribe is also an offence under the Prevention and Combating of Corrupt Activities Act). The best available international benchmark for comparison with this figure is found in Transparency International’s (TI) Global Corruption Barometer. In that study, consisting of a sample of ordinary citizens who answered in their individual capacity, respondents were asked: “In the past 12 months have you or anyone living in your household paid a bribe in any form to each of the following institutions / organisations? [Education system, Legal system/Judiciary, Medical services, Police, Registry and permit services (civil registry for birth, marriage, licenses, permits), Utilities (telephone, electricity, water, etc.), Tax revenue]” Although this surveys a different sector and does not deal with business to business corruption at all, it does give a rough indication of bribery rates. South Africans were also surveyed as part of this study, and 5% of respondents indicated that they had to pay a bribe. Percentage of respondents that have paid a bribe in the last 12 months, per country
More than 40% Albania, Cameroon, Gabon, Morocco
16-40%
Bolivia, Congo-Brazzaville, Czech Republic, Dominican Republic, Greece, Indonesia, Kenya, Mexico, Moldova, Nigeria, Paraguay, Peru, Philippines, Romania, Senegal, Ukraine, Venezuela
6 - 15% Argentina, Bulgaria, Chile, Colombia, Croatia, Hong Kong, India, Kosovo, Luxembourg, Macedonia, Pakistan, Panama, Russia, Serbia, Thailand
5% or less
Austria, Canada, Denmark, Fiji, Finland, France, Germany, Iceland, Israel, Japan, Malaysia, Netherlands, Norway, Poland, Portugal, Singapore, South Africa, South Korea, Spain, Sweden, Switzerland, Taiwan, Turkey, United Kingdom, USA
Source: Transparency International Global Corruption Barometer 2006 According to the TI study South Africa is grouped with the best performing countries. Our comparative figure is 7.3%, which shows some correlation with the TI study. Although looking reasonably good on the international scale there is still almost 1 in 10 companies who have had experience with corruption.
36
Perhaps a more disturbing outcome of the survey is the large levels of agreement to perception statements such as:
• Corruption occurs because of a poor ethical culture within the South African business community generally - 76.3%
• Corruption is a deterrent to doing business in South Africa - 75% • Current levels of corruption are harmful to further investment in South Africa - 74%
These perceptions do not come from nowhere, but the reasons for discrepancies between perception and reality have not been satisfactorily established. The fact that the problem is always further away could however suggest that these perceptions don’t come from actual experience, but from the large corruption stories that are carried in the media. There are countless reports of corruption in the press, but very few about actual convictions, or of strong and decisive action taken against perpetrators. (“Chances of being prosecuted are slim” – 80.8% agreement). This can quite easily lead to perceptions that, despite all the talk, corruption is quite acceptable in South Africa, which reflects negatively on the moral values being displayed. Strong action could go a long way in bridging the gap between perception and reality. This is not only the task of government, but also businesses who discover senior staff engaged in corruption. Any form of protectionism is bound to have a negatively impact on perceptions. And perceptions are important. Adv. Willie Hoffmeyer (Head of the Special Investigating Unit) made the point at a recent corruption seminar: “If a country is perceived to be corrupt it will attract corrupt investors.” Changing the perceptions of the un-ethical culture in the South African business environment is essential for maintaining faith in the continued growth of the South African economy. This has to happen at all levels: with individuals, within companies, in industry associations and the business and public sector environment in general. Some industries have existing codes of ethics, but in many cases these remain paper documents. They will remain meaningless unless they have an impact on how companies do business, how they get business (the biggest corruption area), what kinds of companies they do business with, and how they interact with government and regulators. Through inconsistencies in any of these areas businesses send a message to competitors, clients, suppliers and specifically employees about the values they uphold. The survey suggests that the majority of businesses are concerned about corruption, not necessarily because of the impact on their company, but because of the impact on the country. We hope that more businesses and industry bodies come forward to actively engage in this challenge.
37
8. References:
• Transparency International. 2006. Global Corruption Barometer, Transparency International, Berlin
• South Africa. Department: Public Service and Administration. 2002. Business Survey on
Corruption – Research Report
• Statistics SA. 2006. Gross Domestic Product, Annual estimates 1993 – 2005, Annual estimates per region 1995 – 2005, Third quarter: 2006, http://www.statssa.gov.za/PublicationsHTML/P04413rdQuarter2006/html/P04413rdQuarter2006.html, accessed 11 December 2006.
9. Thank you: • To all those who took the time to complete the rather lengthy questionnaire. • To all industry associations and other parties who consulted with us during the
drafting of the questionnaire. • To all those who distributed the electronic links to the web-based interviews to
their members. - Afrikaanse Handelsinstituut - AgriSA - Business Against Crime - Business Unity SA - Chamber of Mines - Compliance Institute of South Africa - Consumer Goods Council SA - Customs Caucus - JSE - Life Officers Association - Master Builders SA - National African Federated Building Industry - National African Federated Chamber of Commerce and Industry - National Association of Automobile Manufacturers SA - National Bargaining Council for Road Freight Industry - National Industrial Chamber - Overseas Security Advisory Council - Retail Motor Industry - Retailers Association - Road Freight employers association - SA Banking Risk Information Centre - SA Chamber of Business - SA Federation of Civil Engineering Contractors - SA Fraud Prevention Service - SA Insurance Association - SA Leisure & Tourism Association - SA Petroleum Industry Association - Security Industry Alliance - Steel & Engineering Industry Federation of South Africa
• To Interactive Direct / eDM mailroom who distributed the link to their database at no charge.
• Special thanks to GTZ for providing the funding to make this survey possible.