research report states reported revenue growth in july
TRANSCRIPT

RE S E AR C H RE P O R T
States Reported Revenue Growth in
July–September Quarter, Reflecting
Revenue Shifts from the Prior Quarter State Tax and Economic Review, 2020 Quarter 3
Lucy Dadayan
March 2021
S T A T E A N D L O C A L F I N A N C E I N I T I A T I V E

AB O U T T H E U R BA N I N S T I T U TE
The nonprofit Urban Institute is a leading research organization dedicated to developing evidence-based insights
that improve people’s lives and strengthen communities. For 50 years, Urban has been the trusted source for
rigorous analysis of complex social and economic issues; strategic advice to policymakers, philanthropists, and
practitioners; and new, promising ideas that expand opportunities for all. Our work inspires effective decisions that
advance fairness and enhance the well-being of people and places.
AB O U T T H E T A X P O LI C Y C E N TE R
The Urban-Brookings Tax Policy Center aims to provide independent analyses of current and longer-term tax
issues and to communicate its analyses to the public and to policymakers in a timely and accessible manner. The
Center combines top national experts in tax, expenditure, budget policy, and microsimulation modeling to
concentrate on overarching areas of tax policy that are critical to future debate.
Copyright © March 2021. Urban Institute. Permission is granted for reproduction of this file, with attribution to the
Urban Institute. Cover image by Tim Meko.

Contents Acknowledgments iv
Get Real-Time Data v
Executive Summary vi
Trends in State and Local Revenues 1
Trends in State Tax Revenue in 2020 Quarter 3 5
Personal Income Taxes 6
Withholding 8
Estimated Payments 11
Final Payments 14
Refunds 15
Actual versus Forecasted Income Tax Revenues 16
Corporate Income Taxes 17
General Sales Taxes 19
Motor Fuel Taxes 21
Other Taxes 22
Preliminary Review of State Revenue in 2020 Quarter 4 22
Factors Driving State Tax Revenues 24
Economic Indicators 24
State Gross Domestic Product 24
State Unemployment and Employment 26
Personal Consumption Expenditures 28
Housing Market 30
Tax Law Changes Affecting the Third Quarter of 2020 33
Conclusion 36
Appendix: Additional Tables 38
Notes 51
References 53
About the Author 54
Statement of Independence 55

i v A C K N O W L E D G M E N T S
Acknowledgments This report is funded in part by the Bill and Melinda Gates Foundation. We are grateful to them and to
all our funders, who make it possible for Urban to advance its mission.
The views expressed are those of the author and should not be attributed to the Urban Institute, its
trustees, or its funders. Funders do not determine research findings or the insights and
recommendations of Urban experts. Further information on the Urban Institute’s funding principles is
available at urban.org/fundingprinciples.
Thanks to Kim Rueben, Tracy Gordon, Safia Sayed, and Michael Marazzi for their thoughtful review
of and feedback on the report.

G E T R E A L - T I M E D A T A v
Get Real-Time Data The State Tax and Economic Review is the preeminent source of data and analysis on state tax collections.
The Urban Institute’s State and Local Finance Initiative regularly collects data and information from all
50 states, uses this information to adjust national and state data from the US Census Bureau, then
provides the most timely, accurate, and in-depth look at how states are faring.
Visit our project page to read previous State Tax and Economic Review reports and subscribe to gain
direct access to the following datasets:
Monthly State Government Tax Revenue Data
Data from all states from 2010 to present on revenue from the individual income tax, corporate income
tax, general sales tax, and total taxes.
Monthly State Government Personal Income Tax Data
Data from 41 states with broad-based income taxes from 2010 to present for the following components
of personal income taxes: withholding, estimated payments, final payments, refunds, and total net
personal income taxes.
Quarterly State Government Tax Revenue Data
Data from all states from 2010 to present on tax revenue from the individual income tax, corporate
income tax, general sales tax, and motor fuel tax.
Annual State Government Tax Revenue Collections versus Official Forecasts
Data from nearly all states from fiscal year 2015 onward for actual revenue collections and revenue
forecasts for the individual income tax, corporate income tax, and general sales tax.
Annual State and Local Government Gambling Revenue Data
Data from all states for fiscal year 2000 onward for revenues collected on various types of gambling,
including lottery, pari-mutuels, casinos and racinos, and video games.
Monthly State Government Marijuana Tax Revenue Data
Data from all states that tax sales of recreational marijuana from inception of the tax to present.

v i E X E C U T I V E S U M M A R Y
Executive Summary ◼ State and local government tax revenues from major sources—personal income, corporate
income, sales, and property taxes—were 17.1 percent higher in the third quarter of 2020 than
in the prior year, which was in sharp contrast to the 0.2 percent average annual decline for the
prior four quarters. The growth in state and local government tax revenues was primarily
caused by the shifting of income tax deadlines in most states from April 15 to July 15 and a
share of 2019 income tax revenue being received in the third quarter of 2020 instead of the
second quarter of 2020. Therefore, the strong revenue growth in the third quarter of 2020
should be viewed in combination with the steep revenue declines in the second quarter of
2020. Using six-month periods when making comparisons to the prior year presents a clearer
picture of states’ fiscal health.
◼ State government tax revenues from major sources showed year-over-year growth at 25.9
percent for the third quarter of 2020, which contrasts with the 2.4 percent average annual
decline for the prior four quarters. As noted, the strong growth in the third quarter of 2020 was
the mirror image of the steep revenue declines in the second quarter of 2020, largely reflecting
the shifting of state income tax receipts across quarters for many states. Growth rates varied
considerably among major revenue sources:
» State personal income tax revenues grew by $39.5 billion or 42.7 percent in the third
quarter of 2020, mostly because states delayed their income tax filing deadlines into the
third quarter. As a reminder, state personal income tax revenues declined by $46.2 billion
or 32.1 percent in the second quarter of 2020. This volatility in income tax revenues is the
consequence of both federal and state policy decisions related to the pandemic. State
personal income tax revenues declined by 2.8 percent for the second and third quarters of
2020 combined, compared with the same period in 2019.
» State sales tax revenues grew by $2.3 billion or 2.7 percent in the third quarter of 2020.
Growth in the third quarter followed the steep decline seen in the second quarter, when
sales tax revenues declined by $12.1 billion or 13.2 percent because of actions taken by
individuals, businesses, and governments early in the spring that dramatically reduced
business activity. State sales tax revenues had seen some increases prior to the onset of the
COVID-19 pandemic, mostly in response to the US Supreme Court’s June 2018 South
Dakota v. Wayfair, Inc. decision and subsequent changes in state tax rules. The ability of
states to collect sales taxes on e-commerce transactions propped up sales taxes in many

E X E C U T I V E S U M M A R Y v i i
states during the pandemic, as many consumers switched from in-person to online
shopping. Despite the growth observed in the third quarter of 2020, state sales tax
revenues declined by 5.5 percent for the second and third quarters of 2020 combined
compared with the same period in 2019.
» State corporate income tax revenues grew by $8.5 billion or 63.8 percent in the third
quarter of 2020 compared with the same quarter in 2019. As with personal income taxes,
most states extended the due date for corporate final and estimated payments. Therefore,
the strong growth in the third quarter of 2020 is largely related to timing as revenues were
shifted. State corporate income tax revenues were 8.6 percent lower in the second and
third quarters of 2020 combined, compared to the same period in 2019.
» Local government tax revenues from major sources showed year-over-year growth of 5.4
percent for the third quarter of 2020, which contrasts with the 3.9 percent average annual
growth rates for the prior four quarters. Year-over-year growth in local government tax
revenues from major sources was 1.7 percent in the second and third quarters of 2020
combined.
» Local property tax revenues, the largest source for local government revenues, increased
5.3 percent year over year for the third quarter of 2020, which is slightly stronger than the
4.2 percent average growth for the prior four quarters. Year-over-year growth in local
government property tax revenues was 2.5 percent in the second and third quarters of
2020 combined.
◼ Preliminary data for the fourth quarter of 2020 indicate year-over-year growth in overall
state tax revenue collections as well as in major sources of tax revenues: personal income,
corporate income, and sales taxes.
» State personal income tax collections grew 8.9 percent in the fourth quarter of 2020
compared with the same period a year earlier. Growth in the median state was
substantially weaker, at 4.5 percent.
» State corporate income tax collections grew 23 percent in the fourth quarter of 2020
compared with the same period a year earlier. Growth in the median state was weaker, at
17 percent.
» State sales tax collections grew 3.3 percent in the fourth quarter of 2020 compared with
the same period a year earlier. Growth in the median state was stronger, at 5.4 percent.
◼ Economic factors driving revenue growth were mostly negative in the third quarter of 2020.
State economic performance took a dramatic negative turn with the spread of the pandemic

v i i i E X E C U T I V E S U M M A R Y
across the nation. However, growth in some economic factors had been weakening since mid-
2019, well before the COVID-19 pandemic began.
» Real gross domestic product (GDP) declined 2.8 percent for the third quarter of 2020
compared with the same quarter in 2019. This is the second consecutive quarter of decline,
and preliminary figures indicate that GDP declined further in the fourth quarter of 2020.
Declines in real GDP were expected because of the massive economic disruptions caused
by the COVID-19 pandemic and responses from governments, businesses, and individuals.
» The seasonally adjusted unemployment rate was 8.8 percent in the third quarter of 2020,
which was an improvement over the double-digit unemployment rate observed in the
second quarter of 2020. The pandemic forced many businesses to shut down or
dramatically reduce activity, leaving millions of Americans out of work, especially in the
second quarter of 2020.
» Year-over-year decline in employment was 7.0 percent for the third quarter of 2020. All 50
states reported outright employment declines in the third quarter compared to a year
earlier. However, overall employment growth had slowed even before the onset of the
COVID-19 pandemic.
» Personal consumption expenditures declined 1.7 percent for the third quarter of 2020
compared with the same quarter a year earlier. Declines in personal consumption spending
were largely expected given that oil prices declined precipitously and that the COVID-19
pandemic stalled large portions of the economy beginning in mid-March, leading to steep
declines in spending on services.
» House prices increased 4.8 percent in nominal terms for the third quarter of 2020
compared with a year earlier. Overall, house price growth was weaker throughout 2019
and 2020 than in the prior two years. Although average house prices have been rising since
the Great Recession, as of the third quarter of 2020, they were still below their pre–Great
Recession peaks in four states.
S T A T E T A X A N D E C O N O M I C R E V I E W , 2 0 2 0 Q U A R T E R 3 1
Trends in State and Local Revenues The COVID-19 pandemic caused an unprecedented economic shock across the world. As a result, state
and local government tax revenues saw steep declines this past spring. Some of the revenue losses were
in response to government actions that deferred revenue collections to a later period; others were due
to underlying economic factors. In the past few months, we have seen some rebounding in state tax
revenues, due in part to federal aid provided early in the pandemic.
State and local tax revenues have become increasingly volatile and sensitive to economic, policy,
and behavioral changes. Unfortunately, we expect the impact of the COVID-19 pandemic on state and
local government tax revenues to be ongoing and to differ widely across specific states and localities.
Although some states have seen state revenues bounce back, others have not. The recently passed
American Rescue Plan Act will cushion state and local budgets and should help protect recent signs of
economic recovery. Although infection rates are falling and individuals are getting vaccinated, states’
additional fiscal needs and recovery paths are still uncertain because of changes in consumer behavior
in response to the pandemic and because of public health and economic risks associated with the new
variants of the COVID-19 virus.
State and local government tax revenues fluctuated wildly after the passage of the Tax Cuts and
Jobs Act of 2017 (TCJA), as discussed in previous State Tax and Economic Review quarterly reports.
Growth in state and local government tax revenues had normalized in the second half of 2019, but that
did not last as the COVID-19 pandemic spread to the United States.
Table 1 shows state and local government tax revenues from major sources for the third quarter of
2019 and the third quarter of 2020 as well as the nominal percentage change between both quarters
and the average quarterly year-over-year growth in the prior four quarters. Table 1 also shows
revenues for the second and third quarters combined for 2019 and 2020 as well as the nominal
percentage changes between the two periods. Overall, states and localities reported strong revenue
growth in the third quarter of 2020. However, that growth was largely because of the deferral of tax
filing deadlines and income tax receipts being shifted from the second quarter to the third quarter of
2020. Major findings include the following:
◼ State and local government tax revenues from major sources grew 17.1 percent in the third
quarter of 2020 compared with a year earlier; this contrasts with the average quarterly year-
over-year decline rate of 0.2 percent in the prior four quarters. As noted, however, this growth
reflects shifts in revenues between the second and third quarters. State and local revenues for

2 S T A T E T A X A N D E C O N O M I C R E V I E W , 2 0 2 0 Q U A R T E R 3
the second and third quarters of 2020 combined declined 2.0 percent compared with the same
period in 2019.
◼ State government tax revenue from major sources grew 25.9 percent in the third quarter of
2020 relative to a year earlier, which is in sharp contrast to the average year-over-year declines
of 2.4 percent observed for the prior four quarters. However, state government tax revenues
from major sources declined 4.3 percent in the second and third quarters of 2020 combined,
compared with the same period in 2019. The growth in state personal income tax revenues
was 42.7 percent for the third quarter of 2020 compared with the third quarter of 2019,
though largely reflecting the delay in filing deadlines. This contrasts with the average quarterly
year-over-year declines of 4.1 percent for the prior four quarters and with year-over-year
declines of 2.8 percent in the second and third quarters of 2020 combined. State corporate
income tax revenues increased 63.8 percent for the third quarter of 2020 compared with a
year earlier. However, part of the strong growth in corporate income taxes was because of the
delays in filing deadlines. Corporate income tax revenues declined 8.6 percent in the second
and third quarters of 2020 combined, compared with the same period in 2019. State sales tax
collections increased 2.7 percent for the third quarter of 2020 compared with the third quarter
of 2019. However, sales tax revenues declined 5.5 percent in the second and third quarters of
2020 combined, compared with the same period in 2019.
◼ Local government tax revenue from major sources grew 5.4 percent from a year earlier in the
third quarter of 2020, which was stronger than the 3.9 percent average quarterly year-over-
year growth for the prior four quarters. However, year-over-year growth in local government
tax revenues from major sources was weaker, at 1.7 percent in the second and third quarters of
2020 combined. Local property taxes, the single largest source of local government tax
revenues, increased 5.3 percent from the prior year; average quarterly year-over-year growth
was 4.2 percent for the prior four quarters. Local property taxes saw some fluctuations in the
past two years as some taxpayers shifted the timing of their property tax payments in response
to passage of the TCJA in late 2017. Local sales taxes declined 1.2 percent for the third quarter
of 2020 compared with the level a year earlier. Both local personal income taxes and local
corporate income taxes saw double-digit growth in the third quarter of 2020, but these
constitute a relatively small share of local revenues (less than 10 percent in a typical quarter),
are concentrated in a few states, and (as with state income taxes) reflect in part the shifting of
receipts from the second quarter of 2020 to the third quarter of 2020 because of postponed
income tax return filing deadlines.

S T A T E T A X A N D E C O N O M I C R E V I E W , 2 0 2 0 Q U A R T E R 3 3
TABLE 1
State and Local Government Tax Revenue Trends
Tax source 2019 Q3 2020 Q3 Y-O-Y %
change
Average quarterly
Y-O-Y growth rate, prior four
quarters (%)
2019 Q2 and
2019 Q3
2020 Q2 and
2020 Q3 Y-O-Y %
change Total state and local major taxes $340,594 $398,969 17.1 (0.2) $751,964 $737,219 (2.0) State major taxes $195,286 $245,794 25.9 (2.4) $461,937 $442,133 (4.3)
Personal income tax 92,449 131,956 42.7 (4.1) 236,504 229,791 (2.8) Corporate income tax 13,259 21,712 63.8 (3.8) 40,150 36,714 (8.6) Sales tax 85,023 87,340 2.7 0.9 176,409 166,639 (5.5) Property tax 4,556 4,785 5.0 1.9 8,874 8,989 1.3
Local major taxes $145,308 $153,175 5.4 3.9 $290,027 $295,086 1.7 Personal income tax 8,841 10,373 17.3 (0.9) 21,134 20,138 (4.7) Corporate income tax 1,819 2,531 39.1 (0.7) 4,671 4,980 6.6 Sales tax 23,587 23,295 (1.2) 4.8 46,385 46,724 0.7 Property tax 111,061 116,976 5.3 4.2 217,837 223,244 2.5
Source: US Census Bureau (tax revenue), with adjustments by the author. Notes: Q = quarter; Y-O-Y = year-over-year.
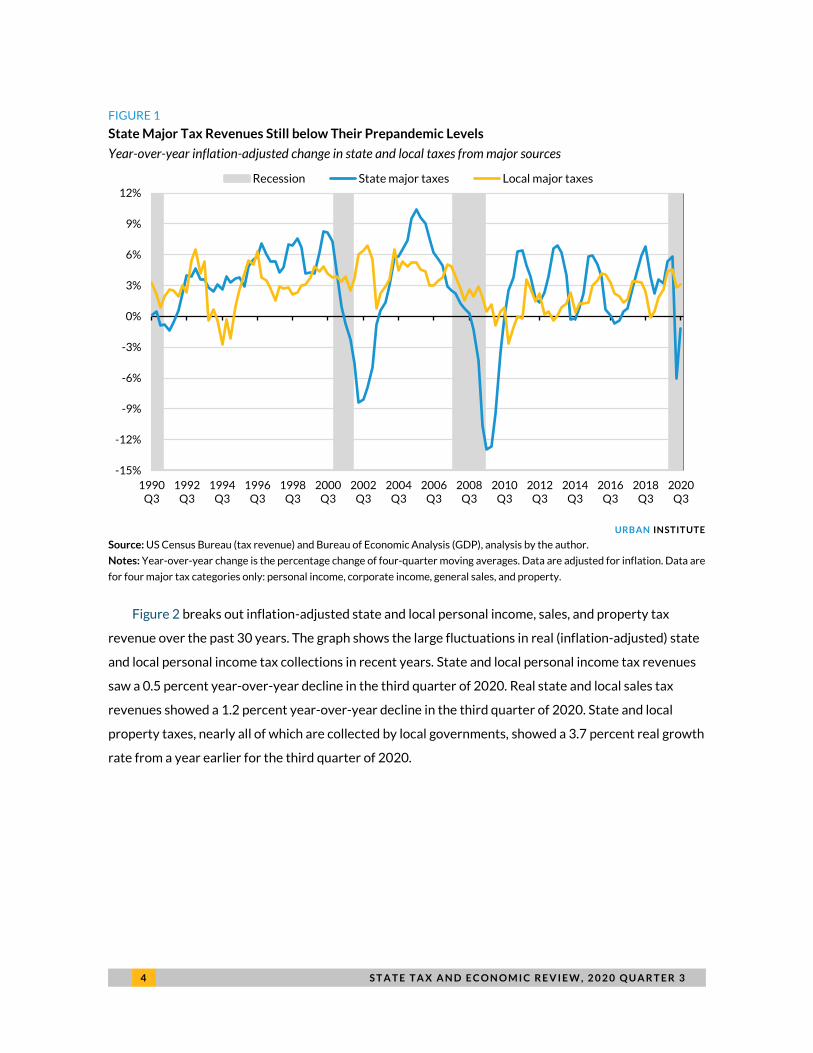
Figure 1 shows longer-term trends in state and local tax collections, specifically the year-over-year
percentage change in the four-quarter moving average of inflation-adjusted state and local tax
collections from major sources: personal income tax, corporate income tax, sales tax, and property tax.
As shown in Figure 1, state tax revenues from major sources fluctuated greatly over the past few years,
mostly driven by the impact of the federal fiscal cliff negotiations (in 2013), volatility in the stock
market, and the impact of taxpayer behavior in response to the passage of the TCJA. The pandemic
caused further volatility in state and local taxes. State taxes from major sources, adjusted for inflation,
declined 1.2 percent on average for the past four quarters relative to a year earlier. Most states rely
heavily on three major sources of taxes (personal income, corporate income, and sales tax), all of which
respond rapidly to economic upticks and declines as well as to government policy decisions.
The four-quarter moving average of inflation-adjusted local taxes from major sources showed a 3.1
percent increase for the third quarter of 2020. Most local governments rely heavily on property taxes,
which are relatively stable and respond relatively slowly to changes in property values. Over the past
two decades, property taxes have consistently made up at least two-thirds of total local tax collections.
4 S T A T E T A X A N D E C O N O M I C R E V I E W , 2 0 2 0 Q U A R T E R 3
FIGURE 1
State Major Tax Revenues Still below Their Prepandemic Levels
Year-over-year inflation-adjusted change in state and local taxes from major sources
URBAN INSTITUTE
Source: US Census Bureau (tax revenue) and Bureau of Economic Analysis (GDP), analysis by the author.
Notes: Year-over-year change is the percentage change of four-quarter moving averages. Data are adjusted for inflation. Data are
for four major tax categories only: personal income, corporate income, general sales, and property.
Figure 2 breaks out inflation-adjusted state and local personal income, sales, and property tax
revenue over the past 30 years. The graph shows the large fluctuations in real (inflation-adjusted) state
and local personal income tax collections in recent years. State and local personal income tax revenues
saw a 0.5 percent year-over-year decline in the third quarter of 2020. Real state and local sales tax
revenues showed a 1.2 percent year-over-year decline in the third quarter of 2020. State and local
property taxes, nearly all of which are collected by local governments, showed a 3.7 percent real growth
rate from a year earlier for the third quarter of 2020.
-15%
-12%
-9%
-6%
-3%
0%
3%
6%
9%
12%
1990Q3
1992Q3
1994Q3
1996Q3
1998Q3
2000Q3
2002Q3
2004Q3
2006Q3
2008Q3
2010Q3
2012Q3
2014Q3
2016Q3
2018Q3
2020Q3
Recession State major taxes Local major taxes

S T A T E T A X A N D E C O N O M I C R E V I E W , 2 0 2 0 Q U A R T E R 3 5
FIGURE 2
State and Local Sales Tax Revenues Took a Sharp Turn in the Second Quarter of 2020
Year-over-year inflation-adjusted change in major state-local taxes
URBAN INSTITUTE
Source: US Census Bureau (tax revenue) and Bureau of Economic Analysis (GDP), analysis by the author.
Notes: Year-over-year change is the percentage change of four-quarter moving averages. Data are adjusted for inflation.
Trends in State Tax Revenue in 2020 Quarter 3
Total state tax revenue increased 18.8 percent in nominal terms in the third quarter of 2020 relative to
a year earlier, according to US Census Bureau data adjusted by the author (Table A1).1 All major sources
of taxes (except for motor fuel taxes) showed growth in the third quarter of 2020. The year-over-year
growth in state personal income tax revenues was 42.7 percent for the third quarter of 2020. Corporate
income tax revenue collections grew 63.8 percent for the third quarter of 2020 compared with a year
earlier. State sales tax collections grew 2.7 percent while motor fuel tax collections declined 5.7 percent
relative to a year earlier. However, much of the growth in personal income and corporate income tax
revenues was caused by the shifting of revenues from the second quarter of 2020 into the third quarter
of 2020. Table A1 shows (1) nominal and inflation-adjusted growth in state government tax revenue
collections from major sources and (2) average quarterly year-over-year growth between the first
quarter of 2010 and the third quarter of 2020. The inflation-adjusted average annual growth rate in
overall state tax revenues since 2010 was only 2.7 percent.
-20%
-15%
-10%
-5%
0%
5%
10%
15%
1990Q3
1992Q3
1994Q3
1996Q3
1998Q3
2000Q3
2002Q3
2004Q3
2006Q3
2008Q3
2010Q3
2012Q3
2014Q3
2016Q3
2018Q3
2020Q3
Recession Personal income tax Sales tax Property tax

6 S T A T E T A X A N D E C O N O M I C R E V I E W , 2 0 2 0 Q U A R T E R 3
Regions differed in year-over-year total state tax revenue growth for the third quarter of 2020
(Table A2). State tax revenues saw double-digit growth in all but the New England, Plains, and Southeast
regions. The Far West and Rocky Mountain regions had the strongest year-over-year growth at 36.1
and 29.2 percent, respectively, while the New England region had the weakest growth at 2.5 percent.2
Thirty-seven states reported growth in total state tax revenue collections for the third quarter of
2020 relative to a year prior, with 27 states reporting double-digit growth. State tax revenues declined
in 13 states, with North Dakota and New Jersey reporting the steepest declines at 29.2 and 8.4 percent,
respectively.
Because a substantial portion of income tax revenues was shifted from second quarter of 2020 to
the third quarter of 2020 because of the deferral of tax filing deadlines for tax year 2020, it is important
to analyze revenue growth trends for the second and third quarters of 2020 combined. State total tax
revenues declined 5.6 percent in the second and third quarters of 2020 combined, compared with the
same period in 2019, with a median decline of 3.8 percent (Table A3). State tax revenues declined in 41
states over that six-month period, ranging from a 0.3 percent decline in Georgia to a 39.1 percent
decline in North Dakota. Nine states reported growth, with Idaho and Utah reporting the largest growth
at 10.2 and 5.7 percent, respectively.
Personal Income Taxes
State personal income tax revenues increased 42.7 percent in nominal terms and 41.2 percent in
inflation-adjusted terms in the third quarter of 2020 compared with the same period in 2019. This
contrasts with the steep declines reported in the second quarter of 2020. These wild swings in personal
income tax collections were primarily in response to the deferral of tax filing deadlines, which shifted
income tax revenues from the second quarter of 2020 to the third quarter of 2020. The average
quarterly year-over-year growth rate in state personal income tax collections since 2010 has been 6.1
percent in nominal terms and 4.4 percent in real terms (Table A1).
Because the Internal Revenue Service delayed income tax deadlines in 2020 from April 15 to July
15 and states generally followed suit, states collected substantially less income tax revenue in April
2020. Typically, April is the most important month for income tax payments. Usually states collect
around 13 to 15 percent of annual personal income tax revenues in April, with 70 to 75 percent coming
from estimated and final payments. In 2020, large shares of estimated and final payments were shifted
to July. These changes resulted in wide variations from prior years.

S T A T E T A X A N D E C O N O M I C R E V I E W , 2 0 2 0 Q U A R T E R 3 7
Personal income tax collections increased across all regions in the third quarter of 2020 compared
with the same period in 2019 (Table A2). The Far West region saw the largest growth, at 82.9 percent,
largely reflecting substantial income tax growth in California.
As noted, the income tax revenue picture in the second and third quarters of 2020 is complicated
because of delayed income tax filing deadlines. This led to substantial declines in personal income tax
collections across the states for the second quarter and significant growth in the third quarter.
However, some states adjusted their accounting to shift income tax revenues received in July back into
June, which falls in fiscal year 2020 in most states. Therefore, it is important to examine income tax
revenues trends for the second and third quarters combined.
Overall, personal income tax collections increased in 36 states, with 32 states reporting double-
digit percentage-point growth in the third quarter of 2020 compared with the same quarter in 2019.
The largest growth in dollar value was in California, where income tax revenues increased by $19 billion
or 91.6 percent, mostly because the income tax filing deadline was delayed from April 15 to July 15.
State personal income tax revenues declined in Connecticut, Maine, Minnesota, New Jersey, South
Carolina, and Wisconsin, reflecting that these states shifted a portion of income tax collections received
in July back to the second quarter of 2020.
Despite strong year-over-year growth in the third quarter of 2020, state personal income tax
revenues were down by 2.8 percent for the second and third quarters of 2020 combined, compared
with the same period in 2019 (Table A3).
To get a clearer picture of the underlying trends in personal income tax collections, we examine
trends in the four major components: withholding, quarterly estimated payments, final payments, and
refunds. The US Census Bureau does not collect data on the individual components of personal income
tax collections. The data presented here were collected by the author directly from the states.
TABLE 2
Growth in State Government Personal Income Tax Components
Year-over-year nominal percentage change
Personal income tax components
Calendar Year 2019 Calendar Year 2020
2019Q1
2019 Q2
2019 Q3
2019 Q4
CY 2019
2020 Q1
2020 Q2
2020 Q3
2020 Q4
CY 2020
Withholding 1.2 5.2 4.3 4.8 3.8 5.8 (1.3) 5.1 6.2 4.0 Estimated payments (8.8) 16.3 2.4 9.1 4.9 9.7 (64.0) 102.9 16.7 (4.6) Final payments 18.5 39.0 21.2 20.8 32.7 (10.3) (55.7) 621.7 (9.0) (3.3) Refunds (0.3) (1.1) 8.2 7.4 1.0 9.9 (16.4) 106.0 (9.6) 5.5
Total (0.2) 18.7 3.9 6.2 7.9 4.4 (34.8) 47.5 7.6 1.4
Source: Individual state data, analysis by the author.
Notes: CY = calendar year; Q = quarter. The percentage changes for total personal income tax differ from data reported by the US
Census Bureau. Red numbers in parentheses represent declines.
8 S T A T E T A X A N D E C O N O M I C R E V I E W , 2 0 2 0 Q U A R T E R 3
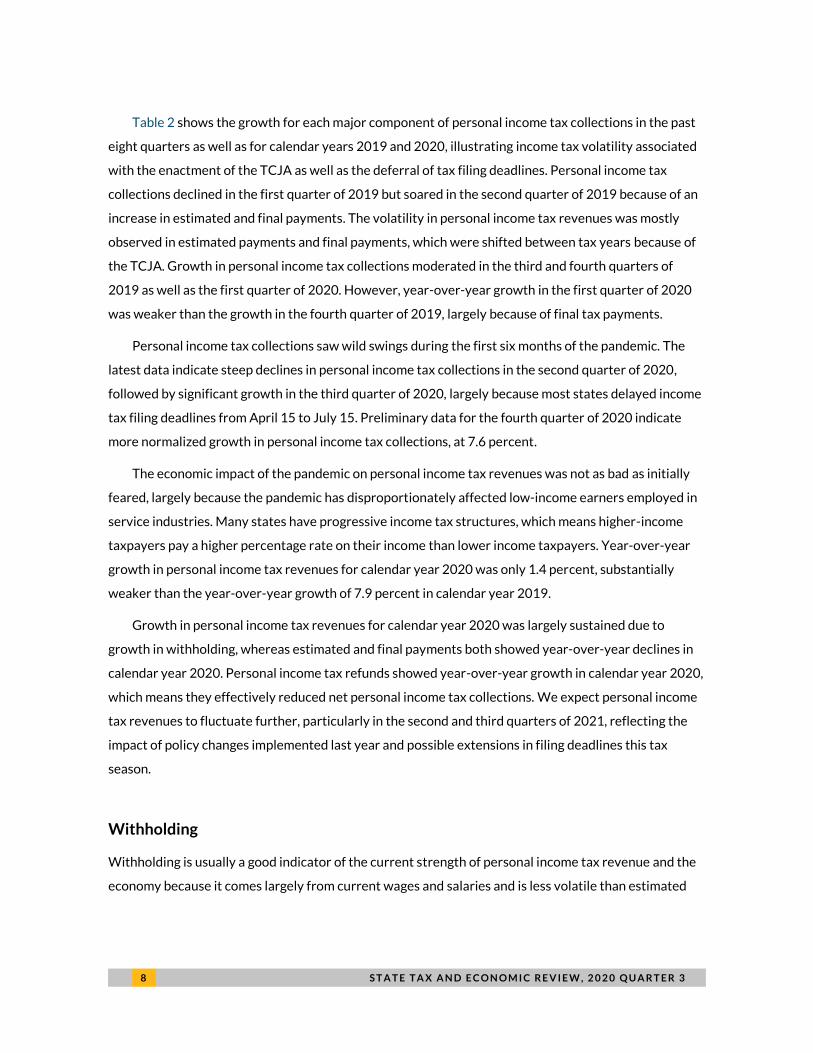
Table 2 shows the growth for each major component of personal income tax collections in the past
eight quarters as well as for calendar years 2019 and 2020, illustrating income tax volatility associated
with the enactment of the TCJA as well as the deferral of tax filing deadlines. Personal income tax
collections declined in the first quarter of 2019 but soared in the second quarter of 2019 because of an
increase in estimated and final payments. The volatility in personal income tax revenues was mostly
observed in estimated payments and final payments, which were shifted between tax years because of
the TCJA. Growth in personal income tax collections moderated in the third and fourth quarters of
2019 as well as the first quarter of 2020. However, year-over-year growth in the first quarter of 2020
was weaker than the growth in the fourth quarter of 2019, largely because of final tax payments.
Personal income tax collections saw wild swings during the first six months of the pandemic. The
latest data indicate steep declines in personal income tax collections in the second quarter of 2020,
followed by significant growth in the third quarter of 2020, largely because most states delayed income
tax filing deadlines from April 15 to July 15. Preliminary data for the fourth quarter of 2020 indicate
more normalized growth in personal income tax collections, at 7.6 percent.
The economic impact of the pandemic on personal income tax revenues was not as bad as initially
feared, largely because the pandemic has disproportionately affected low-income earners employed in
service industries. Many states have progressive income tax structures, which means higher-income
taxpayers pay a higher percentage rate on their income than lower income taxpayers. Year-over-year
growth in personal income tax revenues for calendar year 2020 was only 1.4 percent, substantially
weaker than the year-over-year growth of 7.9 percent in calendar year 2019.
Growth in personal income tax revenues for calendar year 2020 was largely sustained due to
growth in withholding, whereas estimated and final payments both showed year-over-year declines in
calendar year 2020. Personal income tax refunds showed year-over-year growth in calendar year 2020,
which means they effectively reduced net personal income tax collections. We expect personal income
tax revenues to fluctuate further, particularly in the second and third quarters of 2021, reflecting the
impact of policy changes implemented last year and possible extensions in filing deadlines this tax
season.
Withholding
Withholding is usually a good indicator of the current strength of personal income tax revenue and the
economy because it comes largely from current wages and salaries and is less volatile than estimated
S T A T E T A X A N D E C O N O M I C R E V I E W , 2 0 2 0 Q U A R T E R 3 9
payments or final settlements. However, bonuses and stock options received by employees are also
subject to withholding.
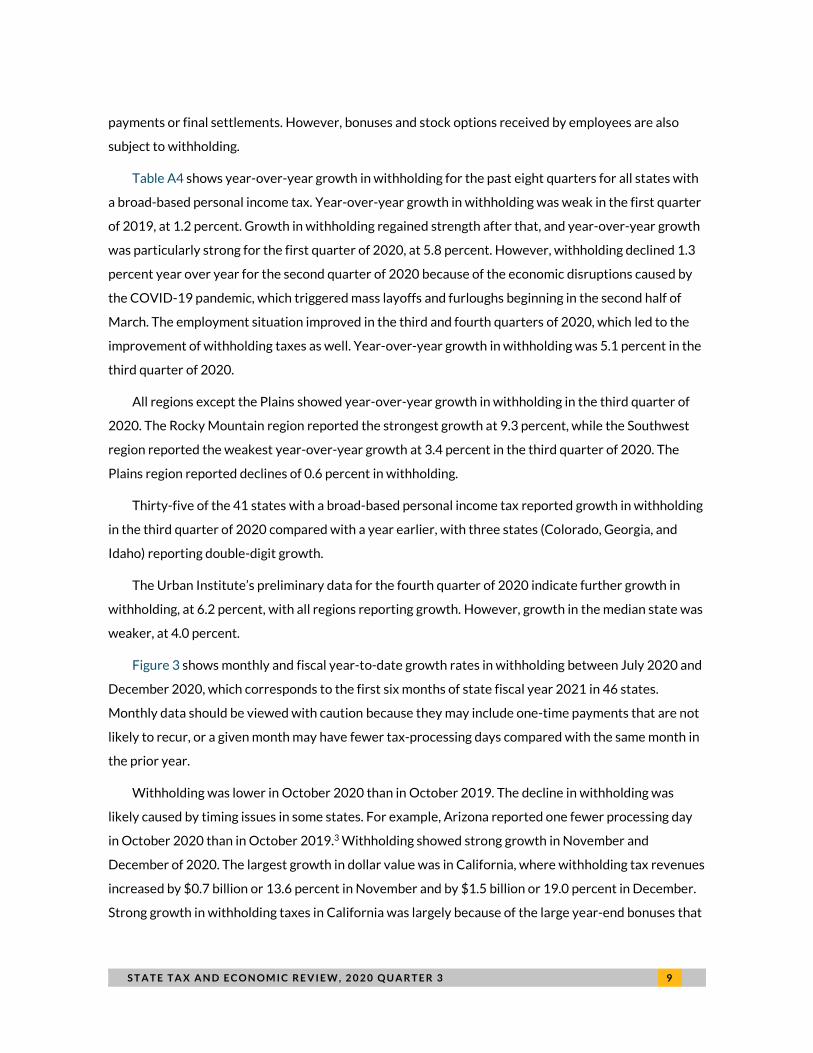
Table A4 shows year-over-year growth in withholding for the past eight quarters for all states with
a broad-based personal income tax. Year-over-year growth in withholding was weak in the first quarter
of 2019, at 1.2 percent. Growth in withholding regained strength after that, and year-over-year growth
was particularly strong for the first quarter of 2020, at 5.8 percent. However, withholding declined 1.3
percent year over year for the second quarter of 2020 because of the economic disruptions caused by
the COVID-19 pandemic, which triggered mass layoffs and furloughs beginning in the second half of
March. The employment situation improved in the third and fourth quarters of 2020, which led to the
improvement of withholding taxes as well. Year-over-year growth in withholding was 5.1 percent in the
third quarter of 2020.
All regions except the Plains showed year-over-year growth in withholding in the third quarter of
2020. The Rocky Mountain region reported the strongest growth at 9.3 percent, while the Southwest
region reported the weakest year-over-year growth at 3.4 percent in the third quarter of 2020. The
Plains region reported declines of 0.6 percent in withholding.
Thirty-five of the 41 states with a broad-based personal income tax reported growth in withholding
in the third quarter of 2020 compared with a year earlier, with three states (Colorado, Georgia, and
Idaho) reporting double-digit growth.
The Urban Institute’s preliminary data for the fourth quarter of 2020 indicate further growth in
withholding, at 6.2 percent, with all regions reporting growth. However, growth in the median state was
weaker, at 4.0 percent.
Figure 3 shows monthly and fiscal year-to-date growth rates in withholding between July 2020 and
December 2020, which corresponds to the first six months of state fiscal year 2021 in 46 states.
Monthly data should be viewed with caution because they may include one-time payments that are not
likely to recur, or a given month may have fewer tax-processing days compared with the same month in
the prior year.
Withholding was lower in October 2020 than in October 2019. The decline in withholding was
likely caused by timing issues in some states. For example, Arizona reported one fewer processing day
in October 2020 than in October 2019.3 Withholding showed strong growth in November and
December of 2020. The largest growth in dollar value was in California, where withholding tax revenues
increased by $0.7 billion or 13.6 percent in November and by $1.5 billion or 19.0 percent in December.
Strong growth in withholding taxes in California was largely because of the large year-end bonuses that

1 0 S T A T E T A X A N D E C O N O M I C R E V I E W , 2 0 2 0 Q U A R T E R 3
led to higher withholding and because of large withholdings tied to the initial public offerings of shares
of companies located in California, such as AirBnB and DoorDash.4
Despite solid growth in withholding, unemployment rates remain higher in most states than their
prepandemic levels. The disconnect between withholding tax collections and higher unemployment
rates is largely because of the disproportionate impact of the pandemic-induced recession on lower-
income taxpayers.
Year-to-date growth in withholding for the first six months of fiscal year 2021 was 5.7 percent.
States collected around $177 billion in withholding revenues from July 2020 through December 2020.
Thirty-two states reported growth while eight states reported declines in withholding tax revenues for
the July through December 2020 period.
FIGURE 3
Withholding Declined in October but Rebounded Since Then
Percentage change in withholding tax collections compared with the previous year, monthly and year-to date
for state fiscal year 2020
URBAN INSTITUTE
Source: Individual state government agencies, analysis by the author.
Notes: FYTD = fiscal year to date.
-3%
0%
3%
6%
9%
12%
Jul-20 Aug-20 Sep-20 Oct-20 Nov-20 Dec-20
Monthly State FYTD 2020
S T A T E T A X A N D E C O N O M I C R E V I E W , 2 0 2 0 Q U A R T E R 3 1 1
Estimated Payments
Higher-income taxpayers (and the self-employed) generally make estimated tax payments (also known
as declarations) on their income not subject to withholding. This income often comes from investments,
such as capital gains realized in the stock market, or from self-employment or business income.
Estimated payments normally represent a small share of overall income tax revenues, but because of
their volatility, they can have a large impact on the direction of overall collections. Estimated payments
accounted for 23.3 percent of total personal income tax revenues in the third quarter of 2020 and 7.1
percent in the fourth quarter of 2020.
The first estimated payment for each tax year is due in April in most states; the second, third, and
fourth payments are generally due in June, September, and January, respectively (although many high-
income taxpayers make the last estimated payment in December so that it is deductible on the federal
tax return for that tax year rather than the next). In some states, the first estimated payment includes
payments with extension requests for income tax returns for the previous tax year and is thus related
partly to income received in that previous tax year. Subsequent estimated payments are generally
related to income for the current tax year, although that relationship is often quite loose.
As noted, because the first estimated payment contains a combination of payments related to the
current and prior tax year, it is not a good indication of the current strength of the economy. The second
and third estimated payments are easier to interpret because they are almost always related to the
current year, and they can give a real-time look at how the economy and income tax base are doing.
Weakness in these payments can reflect weakness in nonwage income, such as that generated by the
stock market. However, it can also be “noisy” in the sense that it reflects taxpayers’ responses to tax-
payment rules as well as to expected nonwage income.
The filing deadline for federal individual income tax returns in 2020 was extended from April 15 to
July 15, and most states also delayed their filing deadlines.5 The federal government also extended the
filing deadline for estimated tax payments for tax year 2020 that were due on April 15. Twenty-nine
states followed the federal government and extended the filing deadline for the first estimated
payments attributable to tax year 2020 from April 15 to July 15 (Loughead 2020).
To make things even more confusing, eight states (Delaware, Indiana, Montana, Nebraska, New
Jersey, New York, Oklahoma, and Rhode Island) delayed the first estimated payments for tax year 2020
originally due on April 15 to July 15 but did not extend the deadline for the second estimated payments
for tax year 2020, which were due on June 15. It appears that most taxpayers have filed first estimated
payments for tax year 2020 with their 2019 income tax returns, even in the states where the first
1 2 S T A T E T A X A N D E C O N O M I C R E V I E W , 2 0 2 0 Q U A R T E R 3
estimated payments for tax year 2020 were due in April. That could be because of confusion caused by
differences between federal and state due dates for filing estimated payments for tax year 2020.
Moreover, estimated payments may have declined for some self-employed individuals if their earnings
declined.
As expected, because of delays in filing deadlines, all states but Arizona and Illinois reported double-
digit percentage-point declines from prior-year levels for the first estimated payments for tax year 2020,
those that were to be filed in April 2020. Estimated payments due in April declined 82.3 percent on
average compared with the prior year, but the decline in the median state was 72 percent (Table A5).
Arizona and Illinois are among the states that had not extended the deadline for the first quarterly
estimated payments for tax year 2020. That is the likely reason that those two states, in contrast with
the others, saw growth in estimated payments in April.
Declines in the second estimated payments for tax year 2020 were also steep and widespread,
again likely because of delayed filing deadlines from June 15 to July 15. Estimated payments due in June
declined 47.9 percent on average compared with the prior year; the decline in the median state was
38.8 percent. States also reported declines in the third estimated payments for tax year 2020 that were
due in September, although such declines were less severe, an average of 1.5 percent.
Finally, states reported year-over-year growth of 33.5 percent for the fourth estimated payments
for tax year 2020 (filed in December 2020 and January 2021). However, growth in the median state was
10.2 percent. The largest growth in dollar value was in California, where the fourth estimated payments
increased by $5.5 billion or 48.6 percent. The second largest growth in dollar value was in New York,
reporting growth of $0.9 billion or 21.9 percent in the fourth estimated payments for tax year 2020 (Table
A5). Estimated payments in California alone represented nearly 50 percent of the total fourth estimated
payments filed for tax year 2020. Therefore, strong growth for the fourth estimated payments is largely
attributable to the growth in California. Some taxpayers also likely held off making estimated payments
during the year because of uncertainty around the pandemic. Strong growth in the fourth estimated
payments for tax year 2020 might also reflect realization of higher capital gains from the strong stock
market and shifts of capital gains into tax year 2020 by some taxpayers in anticipation of possible higher
tax rates with a new federal administration.
In prior State Tax and Economic Review reports, we have warned that because of wide fluctuations in
the performance of financial markets, possible declines in self-employment income, and other changes
in the economy related to the COVID-19 pandemic, estimated payments were likely to be lower in
2020. Now we have data for estimated income tax payments through January 2021, and our data show
that 26 states reported declines in estimated payments for the April 2020 through January 2021 period
S T A T E T A X A N D E C O N O M I C R E V I E W , 2 0 2 0 Q U A R T E R 3 1 3
compared with the same period in the prior year. Estimated payments for the nation increased by $1.6
billion or 2.0 percent between April 2020 to January 2021 compared with the same period a year
earlier. However, this growth was attributable to California, where estimated payments increased by $3
billion or 11.2 percent. California’s estimated payments represented over one-third of the national
total. If we exclude California, estimated payments for the rest of the nation declined 2.5 percent
between April 2020 and January 2021 (Table A6).
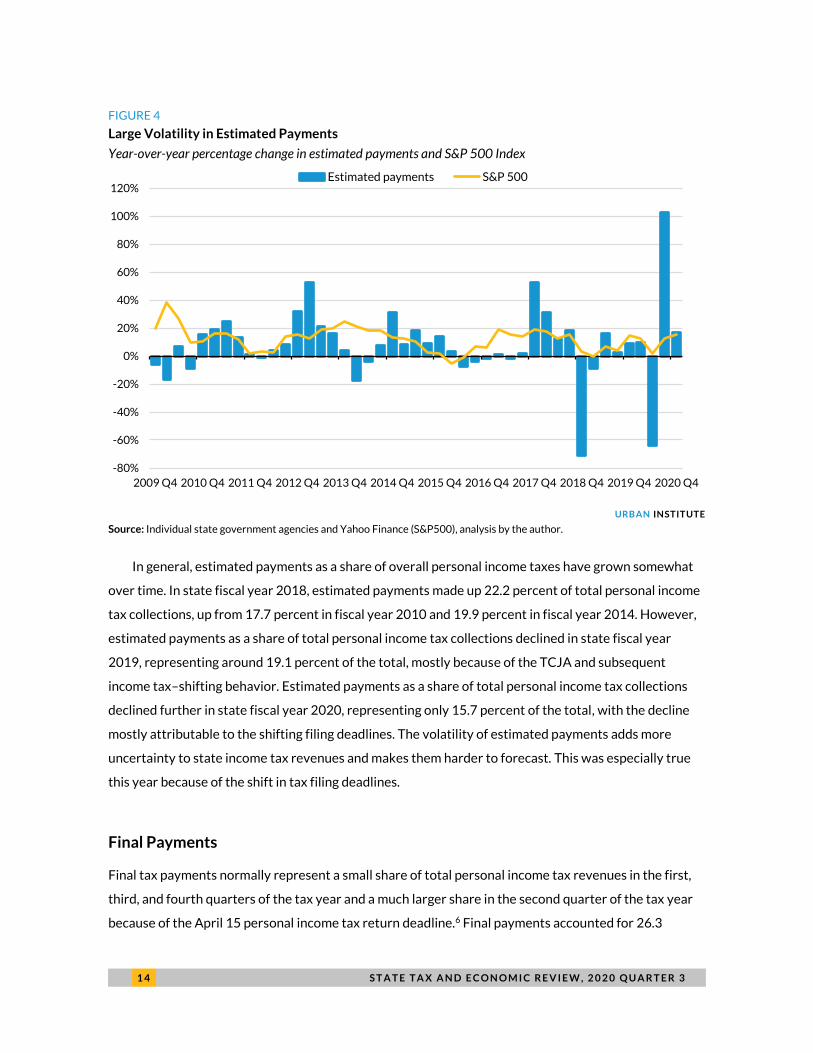
Figure 4 shows year-over-year percentage change by quarter in estimated payments and in the S&P
500 Index for the past 11 years. The longer-term trends indicate substantial volatility in estimated
payments, which is partially caused by volatility in the stock market but is also affected by federal tax
policy changes and taxpayers’ subsequent behavioral changes related to tax timing. For example, growth
in estimated payments in the final quarter of 2012 and the first quarter of 2013 was much larger than the
growth rates in the S&P 500 Index because estimated payments were tied to the impact of the “fiscal cliff”
budget deal as Congress raised top federal income tax rates for tax year 2013. Therefore, some high-
income taxpayers accelerated income into tax year 2012 to avoid higher tax rates for future years. This
led to large declines in the year-over-year comparisons for estimated payments the following year.
Similarly, the substantial growth in estimated payments in the final quarter of 2017, as well as in the
first quarter of 2018, and the steep declines in estimated payments in the final quarter of 2018 were
mostly attributable to the passage of the TCJA. However, the further decline in estimated payments in the
first quarter of 2019 was likely also driven by the weak stock market performance in December 2018 and
January 2019. In response to declines in realized capital gains, some taxpayers may have reduced their
December 2018 and January 2019 estimated payments. After two consecutive quarters of decline,
estimated payments rebounded and showed strong growth in the second quarter of 2019 compared with
the year-earlier level; growth in the stock market was weaker for the same period.
Estimated payments showed continued year-over-year growth for the second half of 2019 and for the
first quarter of 2020; growth in the stock market was stronger for the same period. Estimated payments
saw steep declines at 64 percent for the second quarter of 2020 compared with the same period in 2019,
mostly because of filing deadline extensions. For the second quarter of 2020, the stock market ended 1.6
percent higher than for the second quarter of 2019. Estimated payments showed abrupt growth in the
third quarter of 2020, a mirror image of the steep declines in estimated payments in the second quarter
of 2020 caused by the deferral of tax filing deadlines. Year-over-year growth in the stock market was
strong at 12.3 percent in the third quarter of 2020. Finally, estimated payments increased 16.7 percent
in the fourth quarter of 2020, which was more in line with the 15.2 percent growth in the stock market
compared with a year earlier.
1 4 S T A T E T A X A N D E C O N O M I C R E V I E W , 2 0 2 0 Q U A R T E R 3
FIGURE 4
Large Volatility in Estimated Payments
Year-over-year percentage change in estimated payments and S&P 500 Index
URBAN INSTITUTE
Source: Individual state government agencies and Yahoo Finance (S&P500), analysis by the author.
In general, estimated payments as a share of overall personal income taxes have grown somewhat
over time. In state fiscal year 2018, estimated payments made up 22.2 percent of total personal income
tax collections, up from 17.7 percent in fiscal year 2010 and 19.9 percent in fiscal year 2014. However,
estimated payments as a share of total personal income tax collections declined in state fiscal year
2019, representing around 19.1 percent of the total, mostly because of the TCJA and subsequent
income tax–shifting behavior. Estimated payments as a share of total personal income tax collections
declined further in state fiscal year 2020, representing only 15.7 percent of the total, with the decline
mostly attributable to the shifting filing deadlines. The volatility of estimated payments adds more
uncertainty to state income tax revenues and makes them harder to forecast. This was especially true
this year because of the shift in tax filing deadlines.
Final Payments
Final tax payments normally represent a small share of total personal income tax revenues in the first,
third, and fourth quarters of the tax year and a much larger share in the second quarter of the tax year
because of the April 15 personal income tax return deadline.6 Final payments accounted for 26.3
-80%
-60%
-40%
-20%
0%
20%
40%
60%
80%
100%
120%
2009 Q4 2010 Q4 2011 Q4 2012 Q4 2013 Q4 2014 Q4 2015 Q4 2016 Q4 2017 Q4 2018 Q4 2019 Q4 2020 Q4
Estimated payments S&P 500

S T A T E T A X A N D E C O N O M I C R E V I E W , 2 0 2 0 Q U A R T E R 3 1 5
percent of all personal income tax revenues in the second quarter of 2019 but less than 7 percent in the
third and fourth quarters of 2019 as well as in the first quarter of 2020. Because most states extended
the filing deadline for income tax returns from April 15 to July 15 in 2020, a significant share of final
payments was shifted into the third quarter of 2020. Therefore, final payments represented only 17.9
percent of personal income tax revenues in the second quarter of 2020 (compared with 26.3 percent in
2019), but also 17.2 percent in the third quarter of 2020. The shifting of final payments from the second
quarter of 2020 to the third quarter of 2020 caused large variations in percentage changes.
Table A7 shows year-over-year final payment amounts and growth rates for April through
December. In prior State Tax and Economic Review reports, we presented quarterly data. However, the
alternative nine-month range paints a clearer picture of final payment tax collections during the
pandemic. Final payments on average declined by $1.3 billion or 2.7 percent for April through
December 2020 from a year earlier; the decline in the median state was 2.1 percent. By contrast, final
payments showed double-digit percentage-point year-over-year growth in the prior year, for April
through December 2019.
Twenty-seven states reported declines in final payments for April through December 2020
compared with a year earlier, while 11 states reported growth for the same period. Once again
California had the largest increase in final payments in dollar value ($577 million) during April through
December 2020. Final payments in California represented nearly one-fifth of the national total.
Refunds
By definition, personal income tax refunds represent a negative share of personal tax revenues and
usually are a small amount in the third and fourth quarters of the tax year and a much larger negative
amount in the first and second quarters of the tax year.
Refunds compared with the prior year increased 9.9 percent for the first quarter of 2020 but
declined 16.4 percent for the second quarter of 2020 as people delayed filing their taxes. In total, states
paid out $3.9 billion less in tax refunds in the second quarter of 2020 than in the second quarter of
2019, mostly because of the later processing of income tax refunds caused by delayed income tax filing
deadlines. This subsequently led to strong year-over-year growth in refunds in the third quarter of
2020, and states paid out $5.6 billion more in tax refunds in the third quarter of 2020. Preliminary data
for the fourth quarter indicate that states paid out $0.9 billion less in tax refunds in the fourth quarter
of 2020 than in the fourth quarter of 2019. In total, 23 states paid out less in tax refunds in the fourth
quarter of 2020 than in the same quarter in 2019. California had the largest decline in refunds in dollar

1 6 S T A T E T A X A N D E C O N O M I C R E V I E W , 2 0 2 0 Q U A R T E R 3
value ($401 million) in the fourth quarter of 2020, followed by New York ($384 million), but that is
largely because of their size.
Actual versus Forecasted Income Tax Revenues
We collect data on actual and forecasted amounts for monthly personal income tax revenue from the
states. Although monthly personal income tax forecast information is not available for all states, it was
available for 24 states (Table 3). In this section, we present data for the July–September quarter to
illustrate the variance between actual and forecasted personal income tax revenues. As expected, this
year third quarter income tax collections were drastically different because of extended income tax
filing deadlines.
Actual personal income tax collections in the third quarter of 2020 were higher than in the third
quarter of 2019 in 20 of the 24 states for which we have detailed data. Personal income tax collections
showed double-digit growth in 19 states in the July–September 2020 quarter.
State revenue forecasters anticipated large fluctuations in income tax collections in the second and
third quarters of 2020 because of the extended income tax filing deadlines. Actual personal income tax
collections in the July–September quarter were higher than the forecasts in 22 states and below the
forecasts in only 2 states, with an average underestimate of 12.1 percent and a median underestimate
of 6.5 percent (Table 3). States that underestimated personal income tax revenues in that quarter the
most were the states that prepared their monthly forecasts well before the pandemic hit the US. Large
variations were inevitable because these states could not have accounted for the delay in income tax
filing deadlines.
However, even states that updated their revenue forecasts after the pandemic hit faced difficulties
forecasting revenues precisely. In the past two years, state revenue forecasters faced many
uncertainties related to the passage of the TCJA and warned that forecasts were subject to higher-
than-usual margins of error because predicting taxpayers’ behavioral responses to the federal tax policy
changes would be difficult. State revenue forecasters continue facing considerable challenges in
forecasting revenues because of uncertainties about the length of the pandemic and associated
economic damage (Dadayan 2020a).

S T A T E T A X A N D E C O N O M I C R E V I E W , 2 0 2 0 Q U A R T E R 3 1 7
TABLE 3
Actual versus Forecasted State Personal Income Tax Revenues for April-June 2020
Dollar amounts in millions
July–Sep. 2019
actual
July–Sep. 2020
actual
July–Sep. 2020
forecast
Percent change, July–Sep. 2020
vs. July–Sep. 2019
Percentage variance,
July–Sep. 2020 actual from
forecast Forecast
date
Median 31.4 6.5
Average $58,997 $92,569 $82,572 56.9 12.1
Arizona $1,361 $1,926 $1,755 41.6 9.8 Jun-20
Arkansas $774 $924 $878 19.3 5.3 Apr-20
California $20,429 $39,147 $32,453 91.6 20.6 May-20
Colorado $1,949 $3,184 $2,974 63.4 7.1 Sep-20
Idaho $358 $482 $425 34.7 13.5 Jul-20
Illinois $4,995 $6,397 $5,592 28.1 14.4 Jul-20
Indiana $1,436 $2,169 $1,489 51.0 45.7 Dec-19
Kansas $831 $1,249 $1,225 50.4 2.0 Jun-20
Maine $447 $430 $382 (3.7) 12.6 Aug-20
Minnesota $2,917 $2,906 $2,741 (0.4) 6.0 May-20
Mississippi $483 $594 $604 23.1 (1.5) Nov-19
Montana $355 $518 $341 45.7 51.7 Jun-19
Nebraska $656 $931 $890 42.0 4.6 Aug-20
New Mexico $410 $453 $422 10.6 7.5 Sep-20
New York $11,072 $18,225 $17,730 64.6 2.8 Jul-20
North Dakota $97 $153 $90 56.8 69.3 Mar-19
Ohio $2,282 $2,906 $2,822 27.3 3.0 Mar-19
Oklahoma $668 $844 $818 26.5 3.2 Feb-20
Pennsylvania $3,125 $4,522 $4,459 44.7 1.4 Jun-20
Rhode Island $347 $368 $325 5.9 13.1 May-20
South Carolina $1,449 $1,426 $1,356 (1.5) 5.2 Aug-20
Vermont $205 $415 $386 102.7 7.7 Aug-20
West Virginia $504 $614 $592 22.0 3.8 Jan-20
Wisconsin $1,850 $1,786 $1,825 (3.5) (2.1) Nov-20
Source: Individual state data, analysis by the author.
Corporate Income Taxes
State corporate income tax revenue is highly volatile because corporate profits and the timing of tax
payments can vary and shift across quarters. Further, most states collect a small share of state revenues
from corporate taxes and can therefore experience large fluctuations in percentage terms, with little
overall budgetary impact. Average quarterly year-over-year growth rates in state corporate income tax
collections were 5.1 percent in nominal terms and 3.3 percent in real terms since 2010 (Table A1).
State corporate income tax revenue saw steep declines during the Great Recession and only
recently approached or surpassed levels observed before the Great Recession, driven by strong growth
in reported profits following enactment of the TCJA. This growth weakened substantially in early 2020

1 8 S T A T E T A X A N D E C O N O M I C R E V I E W , 2 0 2 0 Q U A R T E R 3
and fell off because of the COVID-19 pandemic. Year-over-year corporate income tax receipts grew by
double digits in percentage-point terms for seven consecutive quarters, from the second quarter of
2018 through the fourth quarter of 2019. However, the strong growth observed during that time was
largely attributable to the TCJA, which created an incentive for corporations to shift profits from tax
year 2017 into tax years 2018 and beyond because of the law’s lower federal corporate income tax
rates.
Under the Coronavirus Aid, Relief, and Economic Security (CARES) Act passed in March 2020, net
operating losses (NOLs) incurred in calendar years 2018, 2019, and 2020 can be carried back to each of
the five tax years preceding the tax year of such loss. Therefore, corporate income tax revenues may
also be retrospectively lowered for prior fiscal years in those states that have rolling conformity with
the Internal Revenue Service tax code and have adopted the NOL carryback provisions. More than half
of the states (including states with large shares of corporate income tax revenues, such as California,
Illinois, New Jersey, and New York) have decoupled from the federal NOL carryback provisions. States
that conform with the federal NOL carryback provisions may have state-specific restrictions on either
the timing or the amount of the allowable carrybacks.
To mitigate the impact of the pandemic, the Internal Revenue Service extended the filing deadline
for corporations filing calendar-year income tax returns from March 15, 2020, to July 15, 2020.7 Many
states followed and extended corporate income tax return and payment due dates as well. This led to
steep declines in state corporate income tax revenues in the second quarter of 2020 followed by a spike
in the third quarter of 2020.
State corporate income tax revenues declined 44.2 percent in the second quarter of 2020
compared with a year earlier but increased 63.8 percent in the third quarter of 2020. Growth in the
median state was 46.8 percent in the third quarter of 2020. Thirty-seven states reported year-over-
year growth in corporate income tax collections, while seven states reported declines (Table A2). All
regions reported double-digit growth, with the Far West region reporting the strongest year-over-year
growth in corporate income tax revenues, at 176.3 percent, and the New England region reported the
smallest growth, at 14.2 percent. However, as with personal income taxes, these increases are largely
caused by the delays in filing deadlines that shifted corporate income tax revenues from the second
quarter to the third quarter. State corporate income tax revenues were 8.6 percent lower in the second
and third quarters of 2020 combined than in the same period in 2019. Thirty-six states reported year-
over-year declines over that six-month period; eight states reported growth (Table A3).

S T A T E T A X A N D E C O N O M I C R E V I E W , 2 0 2 0 Q U A R T E R 3 1 9
The future of corporate income tax collections is unpredictable not only because of the impact of
the COVID-19 pandemic but also because of the various provisions of the TCJA, some of which might
be altered under the Biden administration. (See prior State Tax and Economic Review reports for
detailed discussions of the TCJA provisions and the law’s impact on state corporate income taxes.)
Even before the pandemic greatly affected the US economy, states were forecasting lower
corporate income tax collections for fiscal years 2020 and 2021, mostly because of higher costs for
business inputs and a weaker global economy (Dadayan 2020a). Moreover, data from the Bureau of
Economic Analysis indicated substantial prepandemic weakness in business investment,8 which implied
lower corporate income tax revenue collections. The outlook for state corporate income tax revenues
remains gloomy for the coming months because of the pandemic-induced economic downturn, which
had a strong negative impact on some industries (such as hospitality, entertainment, travel, and oil and
gas), but a positive impact on some other industries (such as construction).
General Sales Taxes
General state sales tax collections increased 2.7 percent in nominal terms for the third quarter of 2020
compared with the same period in 2019 (Table A1), which follows sharp declines seen in the second
quarter of 2020 that were primarily caused by the pandemic. Sales tax revenue declines observed in the
second quarter of 2020 were the first in a decade. Before the pandemic, sales tax collections had grown
continuously since the first quarter of 2010 in nominal terms, and growth generally has been steady if
unspectacular.
Year-over-year sales tax collections increased in all regions but the Far West and Plains for the
third quarter of 2020 (Table A2). The Southwest region reported the strongest average growth at 25.2
percent; the Southeast region reported the smallest average growth at 1.5 percent. The Far West and
Plains regions reported declines in sales tax revenues at 11.4 and 0.4 percent, respectively.
Thirty-one of 45 states with broad-based sales taxes reported growth in sales tax collections for the
third quarter of 2020 compared with the prior year. Eight states reported double-digit percentage-
point increases. Overall, states that saw solid growth in sales tax revenues include those that impose
sales taxes on grocery food items as well as those that did not mandate statewide stay-at-home orders
throughout the pandemic. On the other hand, states that saw declines in sales tax revenues in the third
quarter of 2020 include those whose economies rely on the tourism and hospitality industry (e.g.,
Hawaii and Nevada) and that reported higher COVID-19 caseloads because of densely populated
metropolitan areas (e.g., California, Florida, and New York).

2 0 S T A T E T A X A N D E C O N O M I C R E V I E W , 2 0 2 0 Q U A R T E R 3
State sales tax revenues were 5.5 percent lower in the second and third quarters of 2020 combined,
compared with the same period in 2019. The smaller offset relative to the declines in the third quarter
of 2020 is because of less shifting of revenue collections across quarters (Table A3).
The recovery in sales tax collections was relatively slow following the Great Recession. Since 2010,
the average quarterly year-over-year growth rate in state sales tax collections has been 3.7 percent in
nominal terms and 2.0 percent in real terms. The weak annual growth rate in sales tax collections is
partially attributable to tax dollars being lost because online retail sellers were not collecting and
remitting sales tax on some or all sales. However, growth in sales tax revenue collections strengthened
in the recent past, largely because of sales tax base expansions in several states and because of states’
efforts to capture tax revenues from a larger share of online sales following the Wayfair decision.
On June 21, 2018, the US Supreme Court ruled in favor of South Dakota in South Dakota v. Wayfair,9
giving states the authority to require out-of-state sellers with at least a specified amount of sales within
the state to collect sales taxes and transfer the revenues to state governments. Since the Supreme
Court’s Wayfair ruling, 43 of 45 states with general sales taxes have enacted laws or regulations to
require sales tax collections by remote sellers. The remaining two states, Florida and Missouri, have bills
under consideration that are likely to be enacted into law soon.10 States have set different sales and
volume thresholds for internet sales taxation (Table A8). Finally, most states have also enacted laws or
regulations requiring marketplace facilitators to collect sales taxes on behalf of their sellers.
State implementation of online sales taxation does not address if and how local jurisdictions that
operate independently and have independent taxing authority will collect sales taxes from remote
sellers. However, some states (e.g., Alabama and Texas) have either passed legislation or continue
debating regulations for creating a “single local use tax rate” that remote sellers can use to calculate the
local tax due instead of applying local sales tax rates for the specific jurisdiction in which a sale is made.
The pandemic has had a detrimental impact on state sales tax revenue collections, particularly in
states with high reliance on the tourism, entertainment, and hospitality industries. Federally mandated
travel restrictions and state or regionally mandated restrictions on a wide range of businesses and
services have led to less business activity, less consumer spending, and therefore less sales tax revenue
collections for states, particularly during the second quarter of 2020. Our previous analysis indicated
that sales tax revenues shrank by over $6 billion in the month of May alone.11 Sales tax increases in the
third quarter were caused in part by pent-up demand from consumers as well as by delays in sales tax
remittances from businesses. About half of the states also extended filing and remittance deadlines for
sales tax payments by retailers.

S T A T E T A X A N D E C O N O M I C R E V I E W , 2 0 2 0 Q U A R T E R 3 2 1
Motor Fuel Taxes
State motor fuel sales taxes declined 5.7 percent year over year for the third quarter of 2020. This is the
second consecutive quarterly decline in motor fuel sales taxes in nominal terms since the first quarter of
2013. Moreover, the declines in motor fuel sales taxes observed in the second and third quarters of
2020 were much steeper than declines observed throughout the Great Recession, likely because of
declines in travel related to state and local restrictions and businesses and individuals engaging in
remote work.
Motor fuel sales tax collections have fluctuated since the Great Recession. Average quarterly year-
over-year growth in state motor fuel tax collections has been 3.4 percent in nominal terms and 1.7
percent in real terms since 2010. Economic growth, changing fuel prices, general increases in fuel
efficiency, and changing driving habits all affect gasoline consumption and motor fuel taxes. Changes in
state motor fuel tax rates also affect tax collections.
Growth rates from the third quarter of 2019 to the third quarter of 2020 varied widely across the
states and the regions (Table A2). Motor fuel tax revenue collections decreased in all regions but the
Great Lakes, where revenues increased 5.9 percent, due to tax increases in Illinois and Ohio. The
steepest declines were in the New England and Plains regions, with a 12.5 percent decline in each.
Forty-three states reported year-over-year declines in motor fuel sales tax collections for the third
quarter of 2020; 17 states reported double-digit declines. In total, seven states (Alabama, Idaho, Illinois,
Mississippi, Nebraska, North Dakota, and Ohio) reported growth in motor fuel sales tax collections in
the third quarter of 2020 compared with the same quarter in 2019. Growth in these states was mostly
caused by motor fuel tax rate increases. For example, Illinois doubled its motor fuel tax rate from 19
cents a gallon to 38 cents a gallon and increased the diesel fuel rate from 21.5 cents to 45.5 cents.12
Ohio increased its gasoline tax rate from 28 cents a gallon to 38.5 cents a gallon and increased the tax
rate for diesel and all other fuel types from 28 cents a gallon to 47 cents a gallon.13
State motor fuel sales tax revenues declined 11.8 percent in the second and third quarters of 2020
combined compared with the same period in 2019, with a median decline of 13.2 percent (Table A3).
Declines in motor fuel sales tax revenue collections in the second and third quarters of 2020 were
largely anticipated because of stay-at-home orders across states earlier in the spring and because many
employees continue to work remotely, which has drastically reduced commuting traffic.

2 2 S T A T E T A X A N D E C O N O M I C R E V I E W , 2 0 2 0 Q U A R T E R 3
Other Taxes
The US Census Bureau’s quarterly data on state tax collections provide detailed information for some of
the smaller revenue sources, including state property taxes, tobacco product excise taxes, alcoholic
beverage excise taxes, and motor vehicle and operators’ license taxes. In Table A9, we show year-over-
year growth rates for four-quarter moving average inflation-adjusted revenue for the nation as a whole.
In the third quarter of 2020, states collected $52.4 billion from all the smaller tax sources, which
constituted 17.1 percent of total state tax collections.
Compared with major tax sources, revenues from smaller taxes have been growing at a slower pace
since the Great Recession. The average quarterly year-over-year growth rate in state tax revenues from
smaller sources was 1.7 percent in real terms since 2010.
The four-quarter moving average of inflation-adjusted revenues from smaller tax sources showed a
4.5 percent decline for the third quarter of 2020 compared with the same quarter in 2019. State
property taxes, which represent a small portion of overall state tax revenues, increased 2.8 percent. Tax
revenue from motor vehicle and operators’ licenses decreased 3.3 percent, and tax revenue from
alcoholic beverage sales decreased 4.2 percent. Revenue from tobacco product sales decreased 1.7
percent, marking the eighth consecutive quarter of decline. Finally, revenues from all other smaller tax
sources decreased 6.1 percent in the third quarter of 2020 compared with levels a year earlier.
Preliminary Review of State Revenue in 2020 Quarter 4
Preliminary data collected from 48 states for the October–December quarter of 2020 (Table A10)
show growth in overall state tax collections as well as in personal income, corporate income, and sales
tax collections compared with the fourth quarter in 2019.
The pandemic caused wild swings in states’ economic activity in recent months, consequently
affecting state tax revenues. Overall state tax collections increased 6.5 percent in the fourth quarter of
2020 compared with the same quarter in 2019. Growth in the median state was somewhat weaker at
4.4 percent. Despite overall growth in state tax collections in the fourth quarter of 2020, a look at
individual states shows a mixed story. Thirty-eight states reported growth, with eight states reporting
double-digit increases. On the other hand, 10 states reported declines in overall tax collections, with
Alaska and North Dakota reporting the steepest declines at 60.5 and 22.8 percent, respectively. Both
states have a high reliance on the oil and gas industry and thus on severance tax revenues (Dadayan and
Boyd 2016). Severance tax revenues saw substantial declines even before the pandemic because of

S T A T E T A X A N D E C O N O M I C R E V I E W , 2 0 2 0 Q U A R T E R 3 2 3
weakness in oil and natural gas prices throughout 2019 and the freefall of prices in April 2020; this
subsequently led to weaknesses in overall state tax revenues.
Personal income tax collections increased 8.9 percent in the fourth quarter of 2020 compared with
a year earlier, but growth in the median state was only 4.5 percent. Thirty-two states reported growth
while nine states reported declines. Growth in personal income tax collections in the fourth quarter of
2020 is a mixed story. States that have progressive tax rate structures have seen growth in personal
income tax revenue collections, and for the most part these are disproportionately tied to the earnings
of high-income taxpayers. Strong stock market prices likely also contributed to the strength of personal
income tax revenues. On the other hand, unemployment rates in most states remain higher than their
prepandemic levels. Strong income tax revenues and stock prices might indicate shifting of capital gains
realizations into 2020 if taxpayers forecast higher future tax rates on capital gains under the new
federal administration.
State sales tax collections increased 3.3 percent for the fourth quarter of 2020 compared with the
same quarter in 2019; growth in the median state was 5.4 percent. Thirty-three states reported growth
in sales tax collections, with six states reporting double-digit growth. Eleven states reported declines in
sales tax collections in the fourth quarter of 2020, with Hawaii reporting the largest decline at 20.4
percent. Steep declines in Hawaii are largely because of the state’s reliance on the tourism and
hospitality industry, which remains severely depressed because of the pandemic.
Finally, corporate income tax revenues increased 23.0 percent year over year for the fourth quarter
of 2020; growth in the median state was 17.0 percent. Thirty-two states reported growth in corporate
income tax collections, with 25 states reporting double-digit growth. On the other hand, 11 states
reported declines in corporate income tax collections.
Looking ahead at the coming months, state tax revenues are likely to remain depressed in the states
that have high reliance on tourism, hospitality, and entertainment industries, largely because of
economic disruptions and reduced business activity caused by the pandemic. Tax revenues will also
likely remain depressed in the states with high reliance on sales tax and severance tax revenues. Earlier
in the pandemic, state revenue estimates suggested a total $200 billion tax revenue shortfall for fiscal
years 2020 and 2021 combined when compared with tax revenue forecasts prepared before the
pandemic (Dadayan 2020c). Although revenue shortfalls are likely to be less severe than our earlier
projections, many states continue reporting revenue shortfalls.14
2 4 S T A T E T A X A N D E C O N O M I C R E V I E W , 2 0 2 0 Q U A R T E R 3
Factors Driving State Tax Revenues State revenues vary across place and time because of three underlying forces: state-level changes in the
economy (which often differ from national trends), different ways that national economic changes and
trends affect each state’s tax system, and legislated changes in tax rates or rules. The next two sections
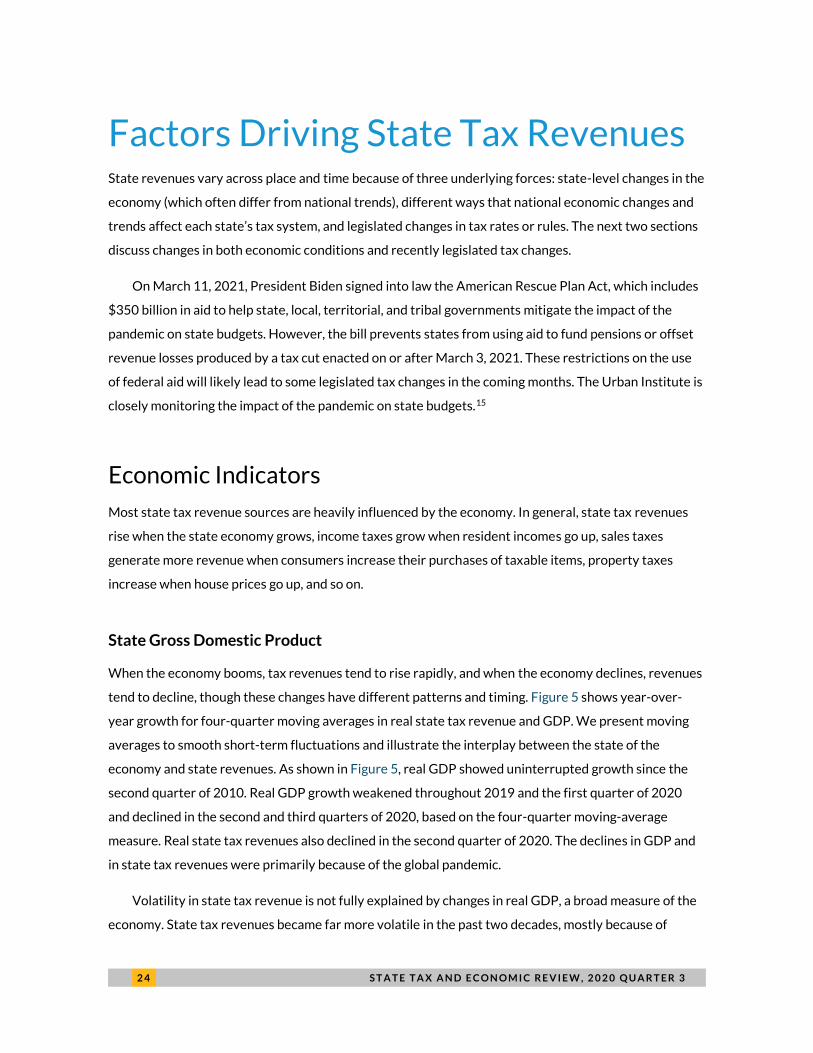
discuss changes in both economic conditions and recently legislated tax changes.
On March 11, 2021, President Biden signed into law the American Rescue Plan Act, which includes
$350 billion in aid to help state, local, territorial, and tribal governments mitigate the impact of the
pandemic on state budgets. However, the bill prevents states from using aid to fund pensions or offset
revenue losses produced by a tax cut enacted on or after March 3, 2021. These restrictions on the use
of federal aid will likely lead to some legislated tax changes in the coming months. The Urban Institute is
closely monitoring the impact of the pandemic on state budgets.15
Economic Indicators
Most state tax revenue sources are heavily influenced by the economy. In general, state tax revenues
rise when the state economy grows, income taxes grow when resident incomes go up, sales taxes
generate more revenue when consumers increase their purchases of taxable items, property taxes
increase when house prices go up, and so on.
State Gross Domestic Product
When the economy booms, tax revenues tend to rise rapidly, and when the economy declines, revenues
tend to decline, though these changes have different patterns and timing. Figure 5 shows year-over-
year growth for four-quarter moving averages in real state tax revenue and GDP. We present moving
averages to smooth short-term fluctuations and illustrate the interplay between the state of the
economy and state revenues. As shown in Figure 5, real GDP showed uninterrupted growth since the
second quarter of 2010. Real GDP growth weakened throughout 2019 and the first quarter of 2020
and declined in the second and third quarters of 2020, based on the four-quarter moving-average
measure. Real state tax revenues also declined in the second quarter of 2020. The declines in GDP and
in state tax revenues were primarily because of the global pandemic.
Volatility in state tax revenue is not fully explained by changes in real GDP, a broad measure of the
economy. State tax revenues became far more volatile in the past two decades, mostly because of

S T A T E T A X A N D E C O N O M I C R E V I E W , 2 0 2 0 Q U A R T E R 3 2 5
changes in state tax rates and states’ growing reliance on income taxes, some of which are progressive
and very dependent on volatile income sources such as stock options and capital gains.
FIGURE 5
State Tax Revenue Is More Volatile Than the Economy
Year-over-year change in real state taxes and real GDP
URBAN INSTITUTE
Source: US Census Bureau (tax revenue) and Bureau of Economic Analysis (GDP), analysis by the author.
Notes: Year-over-year change is the percentage change of four-quarter moving averages. Data are adjusted for inflation.
States vary substantially in terms of the correlation between growth rates in real state tax revenues
and state GDP. Figure 6 shows for each state the four-quarter moving averages in real state tax
revenue and real state GDP for the third quarter of 2020 compared with the same quarter in 2019. By
this measure, real state tax revenues decreased in 32 states, and real state GDP decreased in 47 states.
(Alaska and North Dakota are outlier states and are excluded from Figure 6 to better display the overall
relationship.) The year-over-year change in real state tax revenues ranged from negative 24.6 percent
for Alaska and negative 20.2 percent for North Dakota to 10.2 percent growth for Idaho; the change in
real state GDP ranged from negative 5.7 percent for Hawaii to 0.5 percent growth for Utah. The
national average year-over-year decline in real state GDP was 2.3 percent, and the national average
year-over-year decline in real state tax revenues was 2.1 percent, based on the four-quarter moving-
average measure.
-12%
-9%
-6%
-3%
0%
3%
6%
9%
12%
1978Q3
1981Q3
1984Q3
1987Q3
1990Q3
1993Q3
1996Q3
1999Q3
2002Q3
2005Q3
2008Q3
2011Q3
2014Q3
2017Q3
2020Q3
Real GDP Real state tax revenue

2 6 S T A T E T A X A N D E C O N O M I C R E V I E W , 2 0 2 0 Q U A R T E R 3
FIGURE 6
Growth Disparity: State Tax Revenues versus State GDP
Year-over-year change in real state taxes and real GDP, 2020 quarter 3 versus 2019 quarter 3
URBAN INSTITUTE
Source: US Census Bureau (tax revenue) and Bureau of Economic Analysis (GDP), analysis by the author.
Notes: Year-over-year change is the percentage change of four-quarter moving averages. Data are adjusted for inflation.
Red lines show US averages. Figure excludes Alaska and North Dakota because both are outliers.
State Unemployment and Employment
The national unemployment rate climbed to 9.9 percent in the fourth quarter of 2009, which until
recently was the highest rate observed since 1982. Before March 2020, the unemployment rate had
seen nearly uninterrupted decline from that peak. The unemployment rate was 3.6 percent in the fourth
quarter of 2019, which was a 50-year low.16 The unemployment rate increased to 3.8 percent in the first
quarter of 2020 and increased to 13 percent in the second quarter of 2020, marking the highest level on
record since 1948. However, the unemployment rate dropped to 8.8 percent in the third quarter of
2020 as states slowly reopened economies after limiting activities during the second quarter of 2020.
Unemployment rates ranged from 4.1 percent in Nebraska to 14.7 percent in Nevada for the third
quarter of 2020. According to preliminary data, the national unemployment rate dropped to 6.7 percent
in the fourth quarter of 2020.
AL
ARAZ
CA
CO
CT
DE
FL
GA
HI
IA
ID
IL
IN
KSKY
LA
MAMD
ME
MI
MN
MOMS
MT
NC
NE
NH NJNM
NV
NYOH
OK
OR
PA
RI
SC
SDTN
TX
UT
VA
VT
WA
WI
WV
WY
-12%
-9%
-6%
-3%
0%
3%
6%
9%
12%
-6% -5% -4% -3% -2% -1% 0% 1%
State government real total tax
State GDP
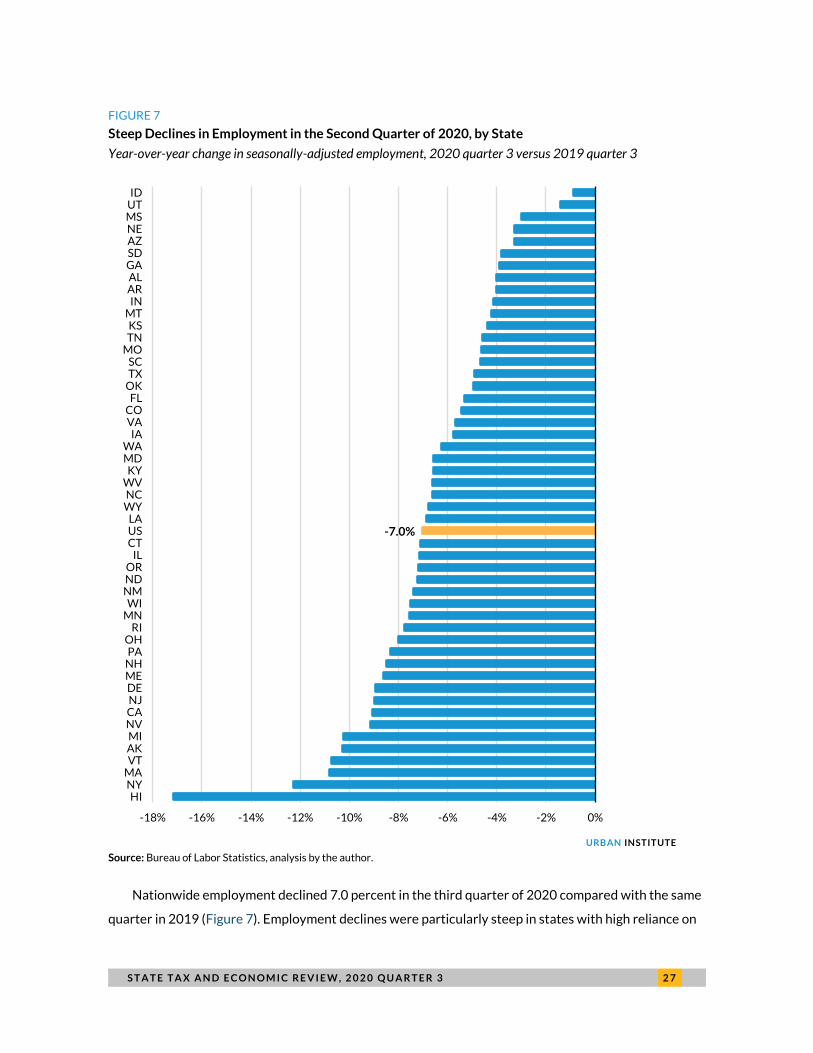
S T A T E T A X A N D E C O N O M I C R E V I E W , 2 0 2 0 Q U A R T E R 3 2 7
FIGURE 7
Steep Declines in Employment in the Second Quarter of 2020, by State
Year-over-year change in seasonally-adjusted employment, 2020 quarter 3 versus 2019 quarter 3
URBAN INSTITUTE
Source: Bureau of Labor Statistics, analysis by the author.
Nationwide employment declined 7.0 percent in the third quarter of 2020 compared with the same
quarter in 2019 (Figure 7). Employment declines were particularly steep in states with high reliance on
-7.0%
-18% -16% -14% -12% -10% -8% -6% -4% -2% 0%
HINY
MAVTAKMI
NVCANJDEMENHPA
OHRI
MNWI
NMNDOR
ILCTUSLA
WYNC
WVKY
MDWA
IAVACO
FLOKTXSC
MOTNKS
MTIN
ARAL
GASDAZNEMSUTID

2 8 S T A T E T A X A N D E C O N O M I C R E V I E W , 2 0 2 0 Q U A R T E R 3
hospitality and tourism industries (such as Hawaii and Nevada) as well as in states that experienced high
numbers of COVID-19 cases during the first phase of the pandemic (such as Michigan and New York).
Employment declines year over year ranged from 0.9 percent in Idaho to 17.1 percent in Hawaii for the
third quarter of 2020. Although the employment situation improved in the third and fourth quarters of
2020, about 10 million fewer people are employed than were employed last February. Moreover, 14
percent of people who lost their jobs during the pandemic had been employed by state and local
governments. States and localities cut public-sector jobs to address budgetary challenges caused by the
pandemic. The American Rescue Plan might help state and local governments rehire some of the
employees who were laid off because of the pandemic.
Personal Consumption Expenditures
“Personal consumption expenditures” is a measure of national consumer spending. The measure shows
the value of the goods and services purchased by American consumers and is correlated with the base
for states’ sales taxes. Figure 8 displays the year-over-year percentage change in the four-quarter
moving average of real personal consumption expenditures for services, durable goods, and nondurable
goods as well as for aggregate state real sales tax collections. We also show trends in the consumption
of energy goods and services.
Before the pandemic, overall growth rates for both goods and services were weaker than growth
rates observed before the Great Recession. Growth rates in state sales tax revenues were also
substantially weaker than the peaks observed before the Great Recession, although growth in sales tax
revenues improved after the Wayfair decision as states started requiring remote sellers to collect and
remit sales and use tax. Year-over-year spending on services declined an average of 4.4 percent in the
third quarter of 2020, while year-over-year spending on both durable and nondurable goods increased.
Before the pandemic, spending on services was resilient to economic downturns. However,
spending on services declined in the second quarter of 2020, marking the first decline on record since
1948. This is primarily because of the unique characteristics of the current downturn. American
consumers spend substantially more on services (70 percent of total consumption) than on goods and
spending on services as a share of total personal consumption has generally grown steadily throughout
the past four decades. Thus, the current reversal in this long-term trend may be a temporary change
rather than a reversal in economic activity.
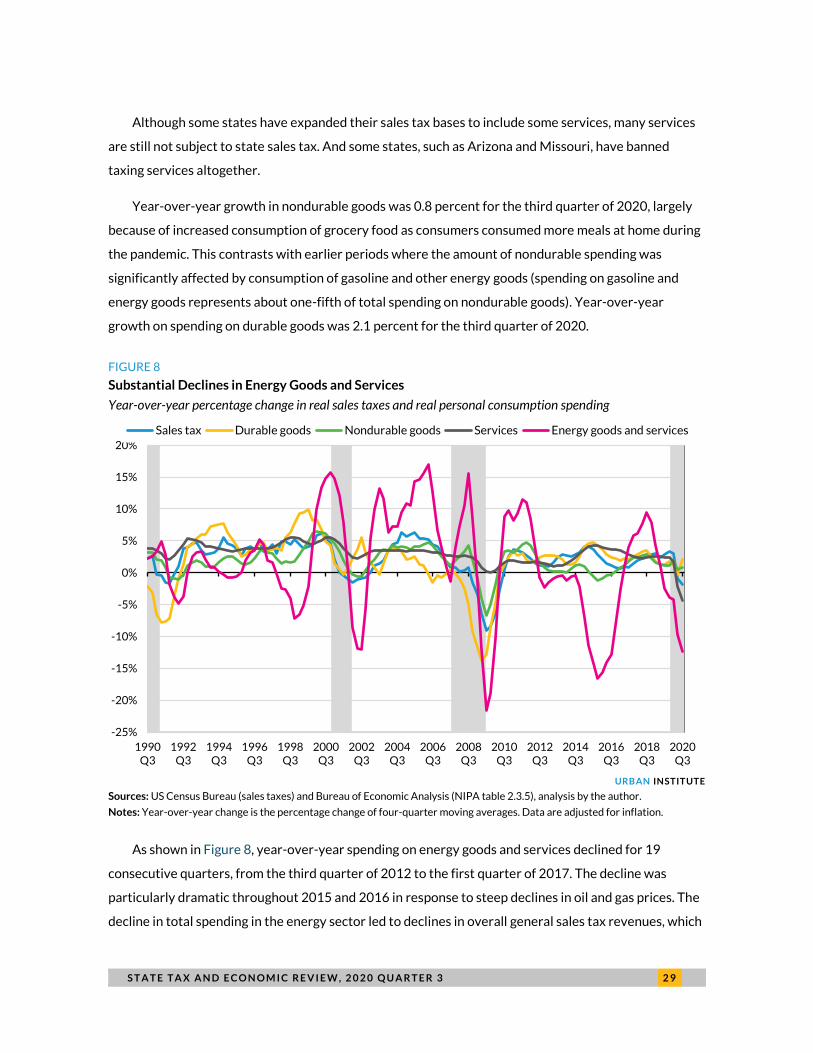
S T A T E T A X A N D E C O N O M I C R E V I E W , 2 0 2 0 Q U A R T E R 3 2 9
Although some states have expanded their sales tax bases to include some services, many services
are still not subject to state sales tax. And some states, such as Arizona and Missouri, have banned
taxing services altogether.
Year-over-year growth in nondurable goods was 0.8 percent for the third quarter of 2020, largely
because of increased consumption of grocery food as consumers consumed more meals at home during
the pandemic. This contrasts with earlier periods where the amount of nondurable spending was
significantly affected by consumption of gasoline and other energy goods (spending on gasoline and
energy goods represents about one-fifth of total spending on nondurable goods). Year-over-year
growth on spending on durable goods was 2.1 percent for the third quarter of 2020.
FIGURE 8
Substantial Declines in Energy Goods and Services
Year-over-year percentage change in real sales taxes and real personal consumption spending
URBAN INSTITUTE
Sources: US Census Bureau (sales taxes) and Bureau of Economic Analysis (NIPA table 2.3.5), analysis by the author.
Notes: Year-over-year change is the percentage change of four-quarter moving averages. Data are adjusted for inflation.
As shown in Figure 8, year-over-year spending on energy goods and services declined for 19
consecutive quarters, from the third quarter of 2012 to the first quarter of 2017. The decline was
particularly dramatic throughout 2015 and 2016 in response to steep declines in oil and gas prices. The
decline in total spending in the energy sector led to declines in overall general sales tax revenues, which
-25%
-20%
-15%
-10%
-5%
0%
5%
10%
15%
20%
1990Q3
1992Q3
1994Q3
1996Q3
1998Q3
2000Q3
2002Q3
2004Q3
2006Q3
2008Q3
2010Q3
2012Q3
2014Q3
2016Q3
2018Q3
2020Q3
Sales tax Durable goods Nondurable goods Services Energy goods and services
3 0 S T A T E T A X A N D E C O N O M I C R E V I E W , 2 0 2 0 Q U A R T E R 3
are based on prices as well as quantity consumed. Overall consumption of energy goods and services
had been recovering since the second quarter of 2017 and showed strong year-over-year growth
through the first quarter of 2019, largely bouncing back from previously depressed levels. However,
year-over-year growth in consumption of energy goods and services weakened substantially in the
second quarter of 2019 and showed declines in the second half of 2019 and throughout 2020. Because
oil prices declined precipitously in April and because many people are commuting less and working
remotely, spending on energy goods and services will continue to decline in the coming months. The
year-over-year decline in spending on energy goods and services for the third quarter of 2020 was 12.4
percent.
Housing Market
House prices are an important determinant of local property taxes, though changes in property tax
revenues often lag property price changes. Assessment lags and assessment caps can affect how quickly
house price changes translate into property tax revenue changes, but declines in house prices usually
lead to declines in property taxes, while growth in house prices usually lead to growth in property tax
revenues.
Figure 9 shows year-over-year percentage changes in the four-quarter moving average of the
house price index and local property taxes in nominal terms. House prices saw steep declines during the
Great Recession, which led to a significant slowdown in local property tax growth and to an actual
decline in property tax revenues during state fiscal years 2011 and 2012.17 Growth in the house price
index began weakening in mid-2005, and the price index declined for five straight years, between the
first quarter of 2008 and the fourth quarter of 2012, though patterns varied across states and regions.
The trend in the house price index has been generally upward between 2013 and 2018 but showed
some weakness following the first quarter of 2019. National average house prices appreciated 4.8
percent for the third quarter of 2020 compared with one year earlier; year-over-year growth in local
property taxes was 5.2 percent for the same period.
Statewide house price indexes increased in all states for the third quarter of 2020 compared with a
year earlier, ranging from a 0.8 percent increase in Hawaii to a 10.0 percent increase in Idaho. Year-
over-year growth was 4.8 percent for the nation. Despite continuous and strong nationwide growth in
the housing market, prices are still below their prerecession peaks in Connecticut, Illinois, Maryland,
and New Jersey. Figure 10 shows the state-by-state nominal percentage change in house price indexes
at the end of the third quarter of 2020 compared with the first quarter of 2007.

S T A T E T A X A N D E C O N O M I C R E V I E W , 2 0 2 0 Q U A R T E R 3 3 1
FIGURE 9
Growth in Housing Prices and in Local Property Taxes Weakened during the Pandemic
Year-over-year percentage change in house prices versus local property taxes
URBAN INSTITUTE
Sources: US Census Bureau (property taxes) and Federal Housing Finance Agency (house price indexes), analysis by the author.
Notes: Year-over-year change is the percentage change of four-quarter moving averages.
National average house prices grew 22.2 percent in nominal terms between the first quarter of
2007 and the third quarter of 2020. However, house price movements varied substantially across the
states. House prices are above their pre–Great Recession peaks in 46 states in the third quarter of 2020
but are still lower in 4 states (in nominal terms). Housing prices in Connecticut were the hardest hit and
are still on average 8.2 percent below their peak. On the other hand, statewide house price indexes
increased by double-digit rates in 41 states over this period. In 19 states, growth in statewide average
house prices since 2007 was over 25 percent, with Colorado, Texas, and North Dakota having the
highest growth rates at 69.8, 63.0, and 60.6 percent, respectively.
-9%
-6%
-3%
0%
3%
6%
9%
12%
1990Q3
1992Q3
1994Q3
1996Q3
1998Q3
2000Q3
2002Q3
2004Q3
2006Q3
2008Q3
2010Q3
2012Q3
2014Q3
2016Q3
2018Q3
2020Q3
Recession Housing price index Local property taxes

3 2 S T A T E T A X A N D E C O N O M I C R E V I E W , 2 0 2 0 Q U A R T E R 3
FIGURE 10
Growth in House Price Indexes Since the Prerecession Peak
Percent change in house prices from pre-recession peak level, 2020 quarter 3 versus 2007 quarter 1
URBAN INSTITUTE
Source: Federal Housing Finance Agency (house price indexes), analysis by the author.
22.2%
-10% 0% 10% 20% 30% 40% 50% 60% 70%
CTMD
ILNJDERI
NVFL
VAAZCA
NMMSVT
NHWVNY
MNPAWIALHI
ARMEAK
MOMIUS
OHLA
MAGA
WYSC
NCIA
KYINKS
OKORMTNE
WATNUTID
SDNDTX
CO
S T A T E T A X A N D E C O N O M I C R E V I E W , 2 0 2 0 Q U A R T E R 3 3 3
The pandemic has not drastically impacted residential real estate property values. However, the
pandemic’s exact effects on commercial real estate property values, and thus commercial property tax
revenues and potentially residential properties, remains uncertain. Most commercial property (hotels,
retails, and offices) owners should expect reductions in commercial property values in their 2021
assessments. Further, residential properties in high-cost or densely populated cities such as San
Francisco or New York City are also likely to be negatively affected by the pandemic. Predicting the
pandemic’s long-term effects on real estate and commercial properties is difficult because it is still
unclear whether remote work and online shopping will remain the new standard even once other
normal living patterns return.
In response to the negative economic impact of the pandemic, the Federal Reserve cut interest
rates twice, once on March 3, 2020, and again on March 16, 2020. These were the largest one-time
interest rate cuts since 2008 but followed earlier cuts in short-term interest rates that began in July
2019, even though the economy was still expanding at that time. Because interest rates are now very
low, there is virtually no room for the Federal Reserve to pursue further interest rate cuts to stimulate
the economy.
Tax Law Changes Affecting the Third Quarter of 2020
Anticipated and actual federal policy changes had a substantial impact on state tax revenues in the past
few years. But changes in state tax laws also affect state tax revenue trends. Only a few states enacted
tax changes for fiscal year 2021, partly because of the pandemic and shortened legislative sessions but
also because of deep uncertainty surrounding revenue projections at the time. We present analysis
here based on the data and information retrieved from the National Association of State Budget
Officers’ Fall 2020 Fiscal Survey of the States. However, the analysis and forecasted effects are based
on anticipated revenue gains or losses based on states’ legislated tax changes and do not include the
effects of changing economic conditions related to the COVID-19 pandemic. Because of decreased
economic activity, actual revenue collections typically varied from expected tax revenues.
During the third quarter of 2020, enacted tax changes were forecasted to increase revenues by
$1.1 billion compared with the same period in 2019.18 Overall, tax changes were expected to decrease
personal income taxes by $32 million and increase corporate income taxes by $1 billion. Enacted tax
changes for sales taxes were insignificant. Further, some states enacted tax changes in other taxes and
fees, which were expected to increase state tax and fee revenues by approximately $126 million

3 4 S T A T E T A X A N D E C O N O M I C R E V I E W , 2 0 2 0 Q U A R T E R 3
(National Association of State Budget Officers 2020). Below, we discuss some of the major enacted tax
changes for fiscal year 2021.
The estimated impact of all the enacted tax changes was a projected net increase of $5.2 billion in
state revenues in fiscal year 2021. By comparison, legislated tax actions in fiscal year 2020 were more
substantial, with an estimated net revenue increase of $8.1 billion. California and New Jersey enacted the
most substantial changes, with estimated net revenue increases of $5.0 billion and $0.6 billion,
respectively, for fiscal year 2021. Legislated changes were also substantial in Colorado, with an estimated
net revenue increase of over $235 million.
Two states enacted personal income tax increases, and 13 states enacted decreases for fiscal year
2021. Legislated tax changes were estimated to increase aggregate personal income tax revenues by
$250 million in fiscal year 2021. The largest estimated increase was in New Jersey, where Governor
Phil Murphy extended the millionaire tax by raising the gross income tax rate from 8.97 percent to
10.75 percent for taxpayers with an annual income between $1 million and $5 million. The tax rate
increase is retroactive to January 1, 2020. Previously, the 10.75 percent tax rate applied only to
taxpayers with an annual income of $5 million or more.19 Lawmakers in Wisconsin reduced personal
income tax rates by cutting the rates for the two lowest income tax brackets from 3.86 percent to 3.54
percent and from 5.04 percent to 4.65 percent.20 These tax rate reductions were estimated to decrease
personal income tax collections by $179 million in fiscal year 2021.
Four states enacted corporate income tax increases, and five enacted decreases. Legislated tax
changes were estimated to increase aggregate corporate income tax revenues by $4.3 billion in fiscal
year 2021, but this is almost entirely driven by actions in California. The largest corporate income tax
change was in California, where Governor Gavin Newsom signed a tax bill that is estimated to increase
corporate income tax revenues by $4.1 billion in fiscal year 2021. The tax bill introduced two major
changes pertaining to corporations. First, the tax bill suspended the NOL deductions for corporation
with net income of over $1 million for tax years 2020 through 2022. Second, the tax bill limited
utilization of business credits for tax years 2020 through 2022; businesses can claim a maximum of $5
million in tax credits. Some corporations have both NOLs and credits. Because the tax bill put
restrictions on both NOLs and credits, the interaction between the two measures would increase the
tax revenues even further.21 In New Jersey, Governor Murphy signed a law that extended the 2.5
percent surtax imposed on corporations with annual net income over $1 million through tax year 2023.
The surtax, however, is not applicable on public utilities and S corporations. This measure is estimated
to increase corporate income tax revenues by $210 million in fiscal year 2021.22

S T A T E T A X A N D E C O N O M I C R E V I E W , 2 0 2 0 Q U A R T E R 3 3 5
Seven states enacted sales tax increases, and five states enacted decreases. Legislated tax changes
were estimated to increase sales tax revenues by $128 million in fiscal year 2021. The most significant
legislative change was in Tennessee, where officials revised the law related to online sales taxation to
now require marketplace facilitators with sales over $100,000 to remit sales and use tax. The revised
law also lowered the annual sales economic nexus threshold from $500,000 to $100,000 for out-of-
state marketplace sellers.23
Five states enacted changes for taxes on cigarettes and gaming, with an estimated overall decrease
of $42 million in fiscal year 2021. The estimated impact of each state’s changes was not significant.
Twelve states enacted changes for some other taxes and fees, with an estimated overall increase of
$514 million in fiscal year 2021. These changes were estimated to increase state revenues in eight
states but decrease revenue in four states. The largest estimated increase was in California, mostly
because of the managed-care organization (MCO) tax. In California, officials urged an extension of the
MCO tax that was set to expire on July 1, 2019.24 Governor Newsom approved the bill to renew the
MCO tax retroactively, subject to approval from the federal government.25 The federal government
initially rejected California’s MCO tax on January 30, 2020,26 but finally approved it for the period of
January 1, 2020, through June 30, 2023.27

3 6 S T A T E T A X A N D E C O N O M I C R E V I E W , 2 0 2 0 Q U A R T E R 3
Conclusion State tax revenues and economies were strong and had a period of sustained growth before the onset of
the global pandemic. However, the pandemic and subsequent federal and state policy actions rapidly
altered states’ fiscal year 2020 trajectory for revenues (Dadayan 2020b). States saw steep declines in
revenues in the second quarter of 2020, though some of this was caused by shifting revenues into the
next quarter and next fiscal year. Many states cut spending, laid off or furloughed workers, or used
federal aid or rainy-day funds while they waited to see what their revenues would be after the July 15
income tax filing deadline.
We now have complete data for state fiscal year 2020 for 47 states. These data show a 3.2 percent
decline in overall state tax revenue collections compared with fiscal year 2019 collections, but the
decline for the median state was 1.5 percent. The declines in state tax revenues ended a 10-year
expansion. Before the spread of the COVID-19 pandemic, states were reporting steady revenue growth
and forecasting solid growth for fiscal year 2020 (Dadayan 2020a). Although revenues declined in many
states in fiscal year 2020, some of the declines and budget deficits at the end of fiscal year 2020
reflected the delay of income tax revenues into July and therefore into the first quarter of fiscal year
2021. According to our preliminary analysis, about 15 states had accrued income tax revenue in fiscal
year 2020 though it was received after the end of the fiscal year. Overall, the pandemic’s impact on
state personal income tax revenues has tended to be less severe than first expected, especially in states
that have progressive income tax rates and thus have greater reliance on high-income taxpayers. This
mostly reflects the fact that most Americans who have been economically affected by the pandemic’s
recession are low-wage earners.
Fiscal and monetary policies adopted by the federal government in response to the pandemic also
helped state governments to sustain their revenue performance. For example, the $600 weekly federal
supplement to unemployment benefits under the CARES Act may have helped states sustain their
income tax withholding revenues. However, with the exemption of some 2020 unemployment
compensation from federal income, we might see states also exempt these payments, which might
lower state income taxes in the next quarter.
Although states reported robust revenue growth in the third quarter of 2020, that was mostly a
reversal of steep revenue declines in the second quarter of 2020, reflecting the shifting in state income
tax receipts. If we look at revenue changes over the six-month period (April through September 2020),
we find a 2.0 percent year-over-year decline.

S T A T E T A X A N D E C O N O M I C R E V I E W , 2 0 2 0 Q U A R T E R 3 3 7
States continue facing fiscal uncertainties because of the pandemic, which has substantially
weakened the economy since March 2020. Although vaccines, declining caseloads, easing of state
restrictions, and support from the American Rescue Plan will likely lead to improving economic and
fiscal conditions, a recovery will still take some time, and economic activity could look different in a
postpandemic world.
Governors and legislators in many states had discussed larger changes to state tax policies in the
beginning of 2021. But how these proposals will interact with federal relief payments and restrictions
on using funds to decrease state tax rates will be an ongoing policy concern.
3 8 S T A T E T A X A N D E C O N O M I C R E V I E W , 2 0 2 0 Q U A R T E R 3
Appendix: Additional Tables TABLE A1
Quarterly State Government Tax Revenue by Major Tax
2010 Q1–2020 Q3 average growth
Nominal Y-O-Y Percentage Change Inflation rate
Real Y-O-Y Percentage Change
PIT CIT Sales MFT Total PIT CIT Sales MFT Total
6.1 5.1 3.7 3.4 4.4 1.7 4.4 3.3 2.0 1.7 2.7
2020 Q3 42.7 63.8 2.7 (5.7) 18.8 1.1 41.2 62.0 1.6 (6.7) 17.5 2020 Q2 (32.1) (44.2) (13.2) (17.7) (24.3) 0.6 (32.5) (44.6) (13.7) (18.2) (24.8) 2020 Q1 5.0 (1.2) 4.1 5.1 4.2 1.7 3.3 (2.8) 2.3 3.4 2.4 2019 Q4 6.2 18.4 5.7 7.5 5.6 1.6 4.5 16.5 4.0 5.8 3.9 2019 Q3 4.3 11.6 7.1 6.0 5.5 1.7 2.5 9.7 5.3 4.2 3.7 2019 Q2 18.8 21.0 2.5 3.5 10.5 1.8 16.7 18.8 0.6 1.6 8.5 2019 Q1 (2.4) 40.5 5.6 1.4 2.7 2.0 (4.3) 37.8 3.5 (0.6) 0.6 2018 Q4 (9.2) 12.0 4.5 6.0 (0.1) 2.3 (11.3) 9.4 2.1 3.6 (2.4) 2018 Q3 7.9 26.4 6.3 8.8 8.4 2.5 5.2 23.3 3.7 6.2 5.7 2018 Q2 10.6 17.5 5.3 8.9 8.9 2.6 7.8 14.5 2.6 6.1 6.2 2018 Q1 15.3 (6.5) 5.0 10.9 8.9 2.1 12.9 (8.4) 2.8 8.6 6.6 2017 Q4 14.9 10.5 4.5 9.7 9.1 2.0 12.6 8.4 2.4 7.6 7.0 2017 Q3 4.6 6.5 3.1 2.0 3.9 1.9 2.6 4.5 1.2 0.0 2.0 2017 Q2 (0.0) 11.7 3.2 5.2 2.3 1.7 (1.7) 9.8 1.5 3.5 0.6 2017 Q1 8.9 (28.1) 2.3 0.9 3.3 2.0 6.7 (29.5) 0.3 (1.1) 1.2 2016 Q4 0.3 (3.4) 1.7 1.2 1.2 1.5 (1.2) (4.8) 0.2 (0.3) (0.3) 2016 Q3 2.4 (9.0) 2.7 1.4 1.3 1.0 1.5 (9.8) 1.7 0.4 0.3 2016 Q2 (2.8) (9.7) 1.2 0.3 (1.7) 0.9 (3.7) (10.5) 0.2 (0.6) (2.5) 2016 Q1 1.7 (5.9) 1.9 2.9 1.4 0.8 0.9 (6.6) 1.1 2.0 0.6 2015 Q4 5.1 (9.4) 2.7 3.5 2.4 0.8 4.3 (10.2) 1.8 2.7 1.5 2015 Q3 6.5 0.3 3.5 5.0 4.1 0.9 5.5 (0.6) 2.6 4.1 3.2 2015 Q2 14.0 6.0 3.6 2.5 7.1 1.1 12.8 4.8 2.5 1.5 5.9 2015 Q1 6.9 3.3 5.8 4.3 5.5 1.1 5.8 2.2 4.7 3.2 4.3 2014 Q4 8.4 10.1 6.5 2.4 5.7 1.5 6.8 8.5 5.0 0.9 4.1 2014 Q3 4.4 7.4 6.6 0.6 4.3 2.0 2.4 5.3 4.5 (1.3) 2.2 2014 Q2 (6.7) (0.3) 4.6 4.0 (1.0) 2.1 (8.6) (2.4) 2.5 1.9 (3.0) 2014 Q1 (1.3) 7.9 3.0 2.8 0.5 1.8 (3.0) 6.0 1.2 1.0 (1.3) 2013 Q4 1.1 3.6 5.1 3.6 3.0 1.8 (0.7) 1.8 3.2 1.7 1.2 2013 Q3 4.9 1.8 5.5 2.8 5.3 1.7 3.1 0.1 3.7 1.1 3.5 2013 Q2 19.2 8.5 4.6 2.0 10.0 1.7 17.2 6.6 2.8 0.3 8.1 2013 Q1 18.2 9.6 3.9 (1.7) 8.9 1.9 16.0 7.6 2.0 (3.4) 6.9 2012 Q4 10.4 2.5 3.3 1.3 5.6 2.1 8.1 0.4 1.2 (0.8) 3.4 2012 Q3 4.7 8.6 2.3 2.2 3.1 1.8 2.8 6.7 0.5 0.3 1.3 2012 Q2 4.7 1.6 2.1 1.7 3.2 1.7 2.9 (0.2) 0.4 (0.1) 1.4 2012 Q1 4.0 4.2 4.6 1.3 3.7 2.1 1.9 2.1 2.5 (0.8) 1.6 2011 Q4 3.7 (6.5) 3.5 0.7 3.2 2.0 1.7 (8.3) 1.5 (1.2) 1.2 2011 Q3 9.7 2.5 3.7 (0.3) 6.2 2.4 7.2 0.1 1.3 (2.6) 3.7 2011 Q2 15.3 19.3 5.7 7.5 11.1 2.2 12.9 16.8 3.5 5.2 8.8 2011 Q1 12.1 4.4 6.3 13.4 10.0 1.9 10.1 2.5 4.4 11.3 8.0 2010 Q4 10.5 19.8 4.8 11.8 8.4 1.6 8.8 17.9 3.2 10.1 6.7 2010 Q3 4.8 (0.9) 4.5 10.6 5.4 1.4 3.4 (2.3) 3.1 9.1 3.9 2010 Q2 2.2 (19.4) 4.8 4.0 2.6 1.1 1.0 (20.3) 3.7 2.8 1.5 2010 Q1 2.4 0.8 0.6 (0.2) 2.9 0.6 1.9 0.2 0.0 (0.7) 2.3
Source: Bureau of Economic Analysis (GDP) and US Census Bureau (tax revenue), analysis by the author. Notes: CIT = corporate income tax; PIT = personal income tax; MFT = motor fuel tax; Y-O-Y = year-over-year.

S T A T E T A X A N D E C O N O M I C R E V I E W , 2 0 2 0 Q U A R T E R 3 3 9
TABLE A2
Quarterly State Government Tax Revenue, by State
Nominal percentage change, 2020 quarter 3 versus 2019 quarter 3 State/region PIT CIT Sales MFT Total
US (median) 28.8 46.8 3.9 (8.3) 11.9
US (average) 42.7 63.8 2.7 (5.7) 18.8
New England 5.0 14.2 2.7 (12.5) 2.5
Connecticut (11.3) 2.8 7.1 (5.7) (5.5)
Maine (2.8) (0.2) (1.1) (13.9) (2.5)
Massachusetts 1.2 16.1 0.9 (16.3) 0.1
New Hampshire 89.3 30.6 N/A (9.6) 14.3
Rhode Island 48.3 85.9 6.2 (8.3) 22.9
Vermont 102.7 (30.0) 11.4 (12.0) 34.6
Mideast 43.8 24.2 2.0 (11.1) 20.6
Delaware 32.6 7.4 N/A (13.9) 15.3
Maryland 1.6 (7.1) 2.0 (9.4) (2.4)
New Jersey (11.1) (15.9) 2.1 (18.3) (8.4)
New York 64.6 52.5 (8.0) (8.0) 35.2
Pennsylvania 45.5 49.1 15.7 (12.1) 23.1
Great Lakes 25.9 57.7 5.4 5.9 16.5
Illinois 28.7 50.6 2.2 27.1 24.2
Indiana 35.2 96.1 4.9 (8.3) 20.1
Michigan 32.4 55.4 9.8 (5.5) 16.4
Ohio 26.8 NM 5.5 12.9 10.5
Wisconsin (3.5) 52.7 0.9 (12.2) 1.5
Plains 24.0 45.0 (0.4) (12.5) 9.3
Iowa 24.4 70.1 1.6 (24.1) 12.8
Kansas 50.4 44.0 5.9 (10.7) 23.7
Minnesota (0.4) 19.4 (6.9) (13.0) (0.6)
Missouri 50.2 98.9 2.7 (8.3) 27.5
Nebraska 42.1 17.2 10.7 1.0 23.1
North Dakota 40.4 59.4 (24.5) (16.6) (29.2)
South Dakota N/A 627.8 8.3 (5.2) 6.0
Southeast 15.7 39.2 1.5 (3.3) 8.4
Alabama 28.8 133.8 8.9 25.8 26.2
Arkansas 20.0 10.4 10.0 (8.3) 11.2
Florida N/A (9.4) (4.1) (10.2) (3.3)
Georgia 13.8 35.9 (5.1) (1.1) 6.7
Kentucky 4.5 (5.3) 7.0 (6.5) 3.5
Louisiana 11.2 98.2 (5.9) (8.3) 5.9
Mississippi 21.5 94.9 11.9 0.8 14.6
North Carolina 29.4 94.1 7.7 10.4 21.3
South Carolina (1.5) (2.6) 3.6 (18.6) (0.0)
Tennessee NM 86.1 3.9 (2.9) 17.8
Virginia 8.9 36.1 5.9 (8.3) 8.6
West Virginia 22.0 110.5 6.2 (8.3) 5.5
Southwest 30.9 92.6 25.2 (8.1) 12.0
Arizona 41.6 29.7 11.0 (8.3) 18.3
New Mexico 10.6 NM (6.4) (8.3) (7.5)
Oklahoma 23.9 144.9 4.4 (7.0) 9.3
Texas N/A N/A 32.4 (8.2) 12.7
Rocky Mountain 64.2 17.6 4.0 (6.5) 29.2 Colorado 63.4 2.3 (0.9) (11.4) 30.8 Idaho 34.9 24.5 11.8 4.1 17.1

4 0 S T A T E T A X A N D E C O N O M I C R E V I E W , 2 0 2 0 Q U A R T E R 3
State/region PIT CIT Sales MFT Total Montana 45.7 44.6 N/A (5.3) 22.2 Utah 83.5 55.0 8.3 (8.3) 42.4 Wyoming N/A N/A (8.5) (7.3) (7.2)
Far West 82.9 176.3 (11.4) (9.1) 36.1 Alaska N/A 84.9 N/A (20.1) 4.5 California 91.6 192.6 (14.7) (7.8) 47.6
Hawaii 38.9 85.1 (24.6) (27.1) (7.2)
Nevada N/A N/A (6.2) (8.3) (6.4)
Oregon 20.7 36.0 N/A (8.3) 17.3
Washington N/A N/A (0.9) (14.1) (0.8) Source: US Census Bureau (tax revenue), analysis by the author. Notes: CIT = corporate income tax; PIT = personal income tax; MFT = motor fuel tax; N/A = not applicable; NM = not meaningful.

S T A T E T A X A N D E C O N O M I C R E V I E W , 2 0 2 0 Q U A R T E R 3 4 1
TABLE A3
State Government Tax Revenue Trends During the Pandemic, by State
Nominal percentage change, April-September 2020 versus April-September 2019 State/region PIT CIT Sales MFT Total
US (median) (2.5) (8.4) (2.5) (13.2) (3.8)
US (average) (2.8) (8.6) (5.5) (11.8) (5.6)
New England (0.8) (9.3) (5.6) (18.1) (5.4)
Connecticut (2.6) (4.3) (5.2) (14.9) (7.3)
Maine 5.7 (13.8) (4.3) (17.4) (0.9)
Massachusetts (1.6) (13.6) (7.6) (24.2) (6.4)
New Hampshire 15.3 (2.2) N/A (21.1) (5.4)
Rhode Island (0.3) 5.2 (1.9) (2.5) (2.4)
Vermont 13.7 (45.3) 5.7 (0.5) 1.7
Mideast (3.9) (7.7) (9.3) (18.9) (6.7)
Delaware (1.7) (28.3) N/A (19.8) (3.9)
Maryland (0.1) (3.9) (14.1) (14.9) (5.6)
New Jersey (7.4) (17.3) (9.0) (13.7) (9.5)
New York (4.0) 6.0 (13.2) (22.7) (6.1)
Pennsylvania (2.5) (9.6) (2.5) (19.2) (6.1)
Great Lakes (3.0) (4.6) (3.0) 3.6 (2.1)
Illinois (2.9) (5.9) (6.6) 35.9 0.6
Indiana (2.4) (9.2) (0.9) (12.7) (4.6)
Michigan 1.7 (12.4) (2.5) (18.1) (3.0)
Ohio (6.4) NM (1.9) 14.7 (2.6)
Wisconsin (6.0) 9.6 (1.4) (12.6) (3.6)
Plains (5.0) (6.1) (2.1) (13.6) (6.8)
Iowa (0.9) 3.7 (2.1) (16.6) (3.9)
Kansas (9.0) (12.9) 0.8 (13.6) (5.7)
Minnesota (6.6) (2.6) (4.8) (17.7) (5.8)
Missouri (4.8) 0.7 (0.4) (10.1) (4.0)
Nebraska 2.5 (26.8) 5.9 (6.6) 0.1
North Dakota (5.9) (20.7) (18.9) (15.8) (39.1)
South Dakota N/A (3.5) 5.9 (7.4) 3.5
Southeast (0.6) (13.4) (5.9) (10.3) (4.3)
Alabama (4.4) 7.2 2.6 18.2 2.4
Arkansas (3.7) (5.5) 5.6 (2.9) 0.1
Florida N/A (34.9) (13.7) (17.1) (13.2)
Georgia 5.4 (2.5) (7.3) 0.4 (0.3)
Kentucky 4.3 (12.6) 0.6 (12.7) (1.1)
Louisiana (11.2) (7.5) (9.7) (15.5) (8.4)
Mississippi (6.5) (10.4) 4.5 (8.1) (3.1)
North Carolina (1.1) (4.1) (2.0) (12.9) (1.7)
South Carolina 3.8 (27.8) (2.8) (15.3) (2.3)
Tennessee (27.7) (5.6) (1.4) (7.8) (1.5)
Virginia (1.1) 9.6 (3.1) (13.5) (0.9)
West Virginia (5.5) (4.0) 2.0 (12.3) (10.6)
Southwest (1.7) 13.5 (2.4) (14.3) (8.5)
Arizona (3.2) (16.9) 4.6 (14.1) (1.3)
New Mexico 8.2 NM 1.5 (15.5) 4.3
Oklahoma (3.9) (10.0) (1.5) (9.3) (8.3)
Texas N/A N/A (3.9) (15.1) (11.8)
Rocky Mountain 9.1 (23.8) 1.1 (12.7) 1.5 Colorado 7.5 (31.4) (5.3) (11.6) (1.1) Idaho 19.6 (10.9) 9.7 (1.6) 10.2

4 2 S T A T E T A X A N D E C O N O M I C R E V I E W , 2 0 2 0 Q U A R T E R 3
State/region PIT CIT Sales MFT Total Montana (0.4) 3.2 N/A (7.1) (0.7) Utah 10.9 (25.8) 7.0 (25.2) 5.7 Wyoming N/A N/A (10.2) (5.5) (15.3)
Far West (4.9) (7.0) (9.2) (16.8) (7.6) Alaska N/A (62.6) N/A (9.2) (28.6) California (3.7) (5.5) (8.7) (14.1) (6.9)
Hawaii (6.7) (51.0) (24.6) (28.8) (21.7)
Nevada N/A N/A (14.1) 2.9 (15.0)
Oregon (16.0) (2.9) N/A (12.8) (13.2)
Washington N/A N/A (5.5) (32.0) (2.3) Source: US Census Bureau (tax revenue), analysis by the author. Notes: CIT = corporate income tax; PIT = personal income tax; MFT = motor fuel tax; N/A = not applicable; NM = not meaningful.

S T A T E T A X A N D E C O N O M I C R E V I E W , 2 0 1 9 Q U A R T E R 3 4 3
TABLE A4
State Personal Income Tax Withholding
Year-over-year nominal percentage change
State/region
Calendar Year 2019 Calendar Year 2020
2019 Q1 2019 Q2 2019 Q3 2019 Q4 2020 Q1 2020 Q2 2020 Q3 2020 Q4
US (median) 2.7 5.3 5.0 4.3 6.9 (0.1) 4.0 4.0 US (average) 1.2 5.2 4.3 4.8 5.8 (1.3) 5.1 6.2
New England 5.7 3.2 4.5 3.1 4.7 2.5 4.7 5.1 Connecticut 6.4 7.3 5.5 2.8 2.0 1.9 4.0 6.6 Maine 3.6 5.3 7.4 6.7 7.6 2.8 9.2 7.8 Massachusetts 6.0 1.5 4.1 3.1 5.8 2.9 4.5 4.3 Rhode Island 3.9 1.2 3.8 2.0 6.9 1.1 3.4 4.0 Vermont 1.9 1.5 0.6 (0.3) 3.1 2.3 7.3 1.5
Mideast 0.5 5.0 5.1 4.6 5.6 (2.1) 4.3 2.8 Delaware 3.2 7.9 6.2 0.9 10.1 (2.3) 4.8 (39.8) Maryland 0.9 4.0 6.7 5.5 8.9 2.7 5.3 7.7 New Jersey 4.8 4.5 6.2 3.2 7.0 (5.8) 7.5 9.5 New York (1.5) 5.5 5.0 4.8 4.6 (1.8) 3.0 2.8 Pennsylvania 3.7 5.1 2.4 4.1 3.8 (6.7) 4.5 (6.7)
Great Lakes 1.6 5.3 4.0 4.1 4.2 (2.8) 4.7 3.6 Illinois 2.7 5.1 4.2 3.2 3.1 (0.0) 6.0 6.1 Indiana (2.8) 8.7 1.4 4.8 7.3 (10.1) 9.6 2.3 Michigan (2.5) 5.2 7.6 6.0 6.9 4.3 5.0 2.9 Ohio 2.3 3.5 2.5 1.9 1.6 (10.6) 1.3 0.4 Wisconsin 7.7 4.7 3.0 5.3 3.4 (1.3) (0.0) 4.0
Plains 0.4 2.8 3.4 3.3 4.4 (1.9) (0.6) 3.4 Iowa (0.6) (4.1) (3.5) (3.9) 3.0 0.8 3.6 1.2 Kansas 3.7 7.6 2.8 6.4 9.7 (4.0) 3.2 4.4 Minnesota 2.1 5.7 5.1 2.8 1.6 (2.2) (6.0) 4.5 Missouri (3.6) (2.2) 6.0 6.4 4.7 (3.3) 0.1 1.9 Nebraska (0.2) 8.2 2.1 6.5 10.9 2.3 8.2 6.2 North Dakota 13.3 5.5 10.2 3.7 13.3 (6.0) 2.5 (4.9)
Southeast (0.4) 3.1 2.1 1.8 5.4 (0.6) 4.2 3.9 Alabama 3.9 8.3 1.7 5.4 9.0 (5.2) 1.9 3.9 Arkansas 1.3 8.2 1.9 5.7 9.3 (8.9) (4.4) (4.1) Georgia (4.0) 0.1 (2.4) (2.3) 6.0 6.0 11.2 6.5 Kentucky (2.4) (4.0) 2.1 2.0 7.5 1.0 5.6 5.3 Louisiana (2.8) 6.3 9.9 (4.7) 14.9 (7.9) (11.0) 0.2 Mississippi (0.4) 2.5 (1.0) 3.5 7.3 (4.7) 0.2 4.7 North Carolina (1.6) 0.9 (1.0) (0.2) 3.4 1.4 8.9 5.0 South Carolina 4.9 7.2 6.6 4.9 2.4 2.2 4.6 3.3 Virginia 1.2 4.5 5.8 5.8 2.9 (2.1) 2.4 3.4 West Virginia 6.6 6.8 (0.4) 1.2 4.1 (10.3) (5.4) (0.0)
Southwest 3.8 9.8 7.3 7.9 7.3 (0.4) 3.4 5.5 Arizona 2.3 8.4 7.1 8.7 10.3 2.5 2.4 8.5 New Mexico 3.5 20.1 13.2 13.9 12.8 (12.3) 3.2 ND Oklahoma 6.0 7.0 5.0 4.3 0.9 1.6 4.8 1.0
Rocky Mountain 4.6 2.8 6.1 5.8 10.8 7.7 9.3 13.7 Colorado 5.6 7.2 6.1 3.5 10.9 11.3 14.1 15.4 Idaho (19.9) (17.5) 3.2 9.7 12.1 8.0 11.5 14.9 Montana 3.1 5.6 7.6 4.2 9.7 0.7 2.8 11.2 Utah 15.5 3.3 6.5 9.0 10.3 3.3 1.6 10.9
Far West 0.9 8.4 5.3 8.2 7.2 (2.3) 8.4 12.6 California 0.2 9.4 5.1 8.2 7.5 (2.4) 9.2 14.2 Hawaii 17.8 (14.1) 4.1 5.6 4.4 (8.7) (1.2) (5.1) Oregon 3.3 7.9 7.0 9.0 4.9 (0.1) 4.1 3.1
Source: Individual state data, analysis by the author. Notes: Alaska, Florida, Nevada, New Hampshire, South Dakota, Tennessee, Texas, Washington, and Wyoming have no broad-based personal income tax and are not shown in this table. ND = no data.

4 4 S T A T E T A X A N D E C O N O M I C R E V I E W , 2 0 2 0 Q U A R T E R 3
TABLE A5
State Personal Income Tax: Estimated Payments/Declarations
Year-over-year nominal percentage change Estimated Payments for Tax Year 2019 Estimated Payments for Tax Year 2020
State
April 2019,
1st payment
June 2019,
2nd payment
Sep. 2019,
3rd payment
Dec. 2019-
Jan. 2020, 4th
payment
April 2020,
1st payment
June 2020,
2nd payment
Sep. 2020,
3rd payment
Dec. 2020–
Jan. 2021, 4th
payment
Median 18.0 10.4 11.1 11.0 (72.0) (38.8) (2.3) 10.2 Average 35.7 1.3 0.4 10.5 (82.3) (47.9) (1.5) 33.5
Alabama 30.1 11.5 12.7 13.3 (74.8) (61.2) (3.6) 13.3 Arizona (25.1) 13.4 13.3 15.1 16.4 (30.5) 0.3 33.2 Arkansas (3.2) 3.1 14.3 9.8 (16.8) (19.3) 11.2 21.9 California 7.6 (3.6) (14.2) 8.6 (83.2) (82.8) 11.3 48.6 Colorado 62.9 (0.5) 1.7 6.1 (92.0) (66.3) (2.2) 18.6 Connecticut (18.3) (31.1) (15.9) (11.0) (76.1) (75.8) (5.5) 26.2 Delaware 11.2 12.3 15.0 13.5 (58.0) (18.3) 9.0 17.9 Georgia 2.8 6.1 4.3 4.7 (76.4) (69.7) (9.5) 8.0 Hawaii 138.6 22.9 48.1 41.9 (66.8) (39.9) (17.7) 0.7 Illinois 19.7 12.3 8.9 7.2 9.5 (20.8) (8.2) 10.2 Indiana 19.2 10.0 8.8 13.0 (72.2) (52.8) (0.1) 9.2 Iowa 9.4 7.3 15.7 18.2 (20.4) (23.1) 4.2 (1.7) Kansas 12.4 13.3 19.0 22.0 (56.7) (31.9) (1.3) 13.1 Kentucky 4.6 (0.7) (1.0) 11.0 (82.8) 126.6 (1.4) 7.3 Louisiana 17.7 20.9 20.3 25.2 (45.4) (31.3) (2.5) 1.0 Maine 18.3 15.6 6.2 9.3 (66.0) (51.6) 15.4 40.4 Maryland (1.0) 19.9 20.7 16.5 (75.9) 41.1 1.7 74.4 Massachusetts 7.6 0.3 3.4 3.2 (77.2) 10.1 (4.0) 23.5 Michigan 9.9 5.5 3.8 3.6 (73.5) (65.2) (0.3) 20.7 Minnesota 71.0 9.3 9.3 11.6 (75.4) 103.3 2.4 12.1 Mississippi 97.8 20.1 11.0 14.0 (79.1) (44.5) (10.9) 9.8 Missouri 135.6 (68.7) (74.7) NM (52.5) 54.1 15.2 NM Montana 27.6 (0.8) 17.2 35.0 (66.1) (26.3) 3.4 1.9 Nebraska 20.6 10.1 11.3 10.8 (63.7) (20.7) 0.3 15.3 New Jersey 10.4 7.1 5.0 8.7 (75.0) (43.7) (7.9) (4.3) New York 57.1 7.5 2.8 7.3 (96.9) (37.7) (8.5) 21.9 North Carolina 15.1 13.2 11.8 16.2 (56.0) (48.6) 1.0 9.6 North Dakota 40.6 12.7 16.0 9.6 (86.9) (47.4) (17.1) 4.6 Ohio 8.1 12.9 16.0 7.2 (66.0) (55.5) (6.1) 7.5 Oklahoma 31.6 3.6 (2.0) (7.3) (90.6) (48.9) (22.7) (6.1) Oregon 53.5 11.5 12.9 14.1 (77.1) (1.8) (4.4) 12.7 Pennsylvania 13.9 13.0 11.1 8.7 (70.0) (59.0) (10.8) (50.7) Rhode Island 5.3 10.6 9.9 16.6 (64.9) (59.4) (2.3) (1.1) South Carolina 157.4 18.2 11.1 16.8 (85.8) 28.3 4.4 18.5 Vermont 20.1 14.9 18.7 13.1 (71.8) (55.0) 3.2 12.6 Virginia 30.3 13.7 20.5 24.7 (45.5) (8.5) (9.4) (2.0) West Virginia (9.9) 10.0 5.2 5.3 (62.7) (46.7) (11.3) (1.6) Wisconsin 51.9 0.9 2.7 1.6 (86.7) 110.4 (11.5) 10.0
Source: Individual state data, analysis by the author. Notes: Alaska, Florida, Nevada, New Hampshire, South Dakota, Tennessee, Texas, Washington, and Wyoming have no broad-based personal income tax and are not shown in this table. Data are not available for Idaho, New Mexico, and Utah. NM = not meaningful.
S T A T E T A X A N D E C O N O M I C R E V I E W , 2 0 2 0 Q U A R T E R 3 4 5
TABLE A6
State Personal Income Tax: Estimated Payments/Declarations During the Pandemic
Amounts (dollars in millions) and year-over-year nominal percentage change
State
Dollars in millions Dollar change Percent change
Apr 2018-
Jan 2019
Apr 2019-
Jan 2020
Apr 2020-
Jan 2021
Apr 2019-Jan 2020 vs
Apr 2018-Jan 2019
Apr 2020-Jan 2021 vs
Apr 2019-Jan 2020
Apr 2019-Jan 2020 vs
Apr 2018-Jan 2019
Apr 2020-Jan 2021 vs
Apr 2019-Jan 2020
Median 13.9 (2.2) Average $73,167 $81,401 $83,048 $8,233.8 $1,646.5 11.3 2.0
Alabama 282 322 319 40.5 (3.0) 14.4 (0.9) Arizona 551 627 706 76.1 79.6 13.8 12.7 Arkansas 330 355 393 24.4 38.2 7.4 10.8 California 26,178 26,829 29,828 650.8 2,999.2 2.5 11.2 Colorado 1,397 1,668 1,530 271.2 (138.1) 19.4 (8.3) Connecticut 1,596 1,273 1,252 (322.3) (21.5) (20.2) (1.7) Delaware 199 221 238 22.6 16.8 11.4 7.6 Georgia 826 870 793 43.6 (77.1) 5.3 (8.9) Hawaii 569 798 746 228.3 (51.9) 40.1 (6.5) Illinois 1,977 2,219 2,254 241.5 34.9 12.2 1.6 Indiana 841 939 921 98.2 (18.4) 11.7 (2.0) Iowa 452 528 506 75.4 (21.1) 16.7 (4.0) Kansas 436 516 515 80.0 (0.2) 18.4 (0.0) Kentucky 513 541 526 28.4 (15.1) 5.5 (2.8) Louisiana 308 382 377 74.2 (4.7) 24.1 (1.2) Maine 276 311 358 34.3 47.4 12.4 15.2 Maryland 1,958 2,232 2,686 273.7 454.1 14.0 20.3 Massachusetts 2,405 2,487 2,425 81.8 (62.3) 3.4 (2.5) Michigan 1,206 1,266 1,266 60.3 0.1 5.0 0.0 Minnesota 2,091 2,640 2,520 549.1 (120.1) 26.3 (4.6) Mississippi 392 480 444 88.5 (35.8) 22.6 (7.4) Missouri 212 534 1,322 322.1 788.2 152.3 147.7 Montana 278 320 339 42.1 18.7 15.2 5.8 Nebraska 330 377 384 46.9 7.3 14.2 1.9 New Jersey 2,894 3,066 2,742 171.8 (324.2) 5.9 (10.6) New York 13,785 16,798 16,158 3,013.4 (640.0) 21.9 (3.8) North Carolina 1,192 1,356 1,344 163.8 (12.0) 13.7 (0.9) North Dakota 68 83 78 14.2 (4.9) 20.8 (5.9) Ohio 833 904 881 71.2 (22.7) 8.6 (2.5) Oklahoma 434 472 352 38.9 (120.2) 9.0 (25.4) Oregon 2,610 3,299 2,839 689.7 (460.1) 26.4 (13.9) Pennsylvania 1,755 1,952 1,578 197.0 (374.1) 11.2 (19.2) Rhode Island 217 242 220 25.4 (21.4) 11.7 (8.9) South Carolina 342 413 423 71.2 10.4 20.8 2.5 Vermont 153 177 175 23.8 (1.7) 15.5 (0.9) Virginia 1,845 2,290 2,140 444.8 (149.7) 24.1 (6.5) West Virginia 255 261 245 5.7 (16.0) 2.2 (6.1) Wisconsin 1,185 1,357 1,224 171.3 (132.2) 14.4 (9.7)
Source: Individual state data, analysis by the author. Notes: Alaska, Florida, Nevada, New Hampshire, South Dakota, Tennessee, Texas, Washington, and Wyoming have no broad-based personal income tax and are not shown in this table. Data are not available for Idaho, New Mexico, and Utah.
4 6 S T A T E T A X A N D E C O N O M I C R E V I E W , 2 0 2 0 Q U A R T E R 3
TABLE A7
State Personal Income Tax: Final Payments
Amounts (dollars in millions) and year-over-year nominal percentage change
State
Dollars in millions Dollar change Percent change
Apr- Dec 2018
Apr- Dec 2019
Apr- Dec 2020
Apr-Dec 2019 vs Apr-
Dec 2018
Apr-Dec 2020 vs Apr-
Dec 2019
Apr-Dec 2019 vs Apr-
Dec 2018
Apr-Dec 2020 vs Apr-
Dec 2019
Median 34.4 (2.1) Average 34,789.9 47,153.0 45,892.9 12,363.1 (1,260.0) 35.5 (2.7)
Alabama 397.8 541.5 519.6 143.7 (21.9) 36.1 (4.0) Arizona 763.4 1,123.7 1,074.6 360.3 (49.1) 47.2 (4.4) Arkansas 280.0 364.5 397.6 84.5 33.1 30.2 9.1 California 6,191.7 7,992.1 8,569.3 1,800.4 577.2 29.1 7.2 Colorado 750.0 902.9 943.3 152.9 40.4 20.4 4.5 Connecticut 1,447.4 1,348.4 1,318.6 (99.0) (29.8) (6.8) (2.2) Delaware 132.5 179.8 164.9 47.2 (14.8) 35.7 (8.3) Georgia 843.2 1,262.8 1,253.8 419.5 (9.0) 49.8 (0.7) Hawaii 193.5 240.8 257.3 47.3 16.6 24.5 6.9 Idaho 452.0 659.7 777.4 207.7 117.7 45.9 17.8 Illinois 1,725.0 2,583.6 2,055.7 858.6 (527.9) 49.8 (20.4) Indiana 611.9 805.8 795.0 193.9 (10.8) 31.7 (1.3) Iowa 325.8 535.3 405.3 209.4 (129.9) 64.3 (24.3) Kansas 542.8 786.7 643.8 244.0 (143.0) 45.0 (18.2) Kentucky 300.3 348.8 356.2 48.5 7.4 16.1 2.1 Louisiana 387.7 554.6 515.0 166.9 (39.6) 43.1 (7.1) Maine 241.9 304.6 308.7 62.6 4.1 25.9 1.4 Maryland 1,519.2 2,178.9 1,998.8 659.7 (180.2) 43.4 (8.3) Massachusetts 2,000.7 2,895.1 2,843.6 894.4 (51.5) 44.7 (1.8) Michigan 858.4 1,203.6 1,164.2 345.2 (39.4) 40.2 (3.3) Minnesota 1,317.8 1,670.0 1,637.8 352.2 (32.2) 26.7 (1.9) Missouri 832.1 1,148.9 683.5 316.8 (465.4) 38.1 (40.5) Montana 173.3 222.6 89.0 49.3 (133.6) 28.4 (60.0) Nebraska 288.1 398.7 396.0 110.6 (2.7) 38.4 (0.7) New Jersey 2,380.3 3,484.7 3,215.8 1,104.4 (268.9) 46.4 (7.7) New York 2,336.2 3,109.3 3,164.5 773.2 55.1 33.1 1.8 North Carolina 1,619.8 2,196.8 2,074.8 576.9 (122.0) 35.6 (5.6) North Dakota 46.4 56.5 54.5 10.1 (2.0) 21.8 (3.5) Ohio 713.5 1,051.8 955.8 338.3 (96.0) 47.4 (9.1) Oklahoma 307.2 378.3 364.4 71.1 (13.9) 23.1 (3.7) Pennsylvania 1,219.3 1,604.1 1,522.8 384.7 (81.2) 31.6 (5.1) Rhode Island 185.3 242.8 239.8 57.5 (3.1) 31.0 (1.3) South Carolina 648.2 830.7 829.0 182.5 (1.7) 28.2 (0.2) Utah 788.0 1,166.2 1,431.6 378.2 265.4 48.0 22.8 Vermont 134.6 165.3 176.9 30.8 11.6 22.9 7.0 Virginia 1,072.3 1,626.1 1,724.0 553.8 97.9 51.6 6.0 West Virginia 244.4 324.7 312.3 80.3 (12.4) 32.9 (3.8) Wisconsin 517.8 662.4 657.9 144.6 (4.6) 27.9 (0.7)
Source: Individual state data, analysis by the author. Notes: Alaska, Florida, Nevada, New Hampshire, South Dakota, Tennessee, Texas, Washington, and Wyoming have no broad-based personal income tax and are not shown in this table. Data are not available for Mississippi, New Mexico, and Oregon.
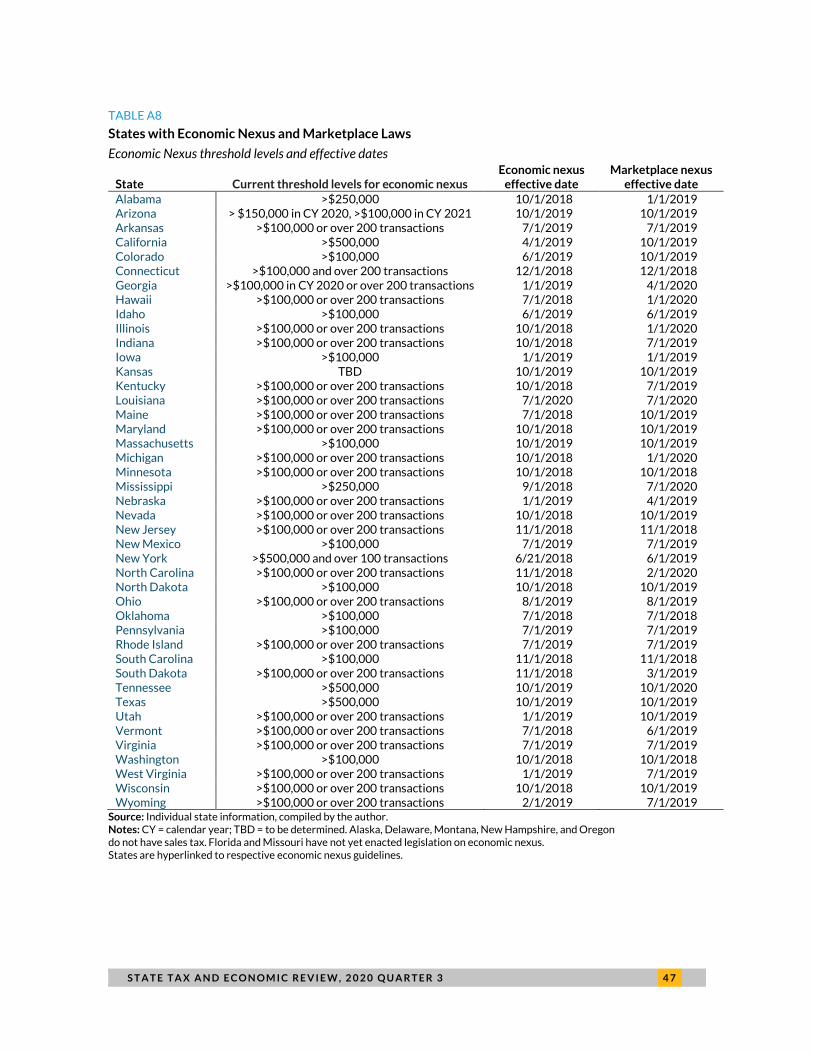
S T A T E T A X A N D E C O N O M I C R E V I E W , 2 0 2 0 Q U A R T E R 3 4 7
TABLE A8
States with Economic Nexus and Marketplace Laws
Economic Nexus threshold levels and effective dates
State Current threshold levels for economic nexus Economic nexus
effective date Marketplace nexus
effective date
Alabama >$250,000 10/1/2018 1/1/2019 Arizona > $150,000 in CY 2020, >$100,000 in CY 2021 10/1/2019 10/1/2019 Arkansas >$100,000 or over 200 transactions 7/1/2019 7/1/2019 California >$500,000 4/1/2019 10/1/2019 Colorado >$100,000 6/1/2019 10/1/2019 Connecticut >$100,000 and over 200 transactions 12/1/2018 12/1/2018 Georgia >$100,000 in CY 2020 or over 200 transactions 1/1/2019 4/1/2020 Hawaii >$100,000 or over 200 transactions 7/1/2018 1/1/2020 Idaho >$100,000 6/1/2019 6/1/2019 Illinois >$100,000 or over 200 transactions 10/1/2018 1/1/2020 Indiana >$100,000 or over 200 transactions 10/1/2018 7/1/2019 Iowa >$100,000 1/1/2019 1/1/2019 Kansas TBD 10/1/2019 10/1/2019 Kentucky >$100,000 or over 200 transactions 10/1/2018 7/1/2019 Louisiana >$100,000 or over 200 transactions 7/1/2020 7/1/2020 Maine >$100,000 or over 200 transactions 7/1/2018 10/1/2019 Maryland >$100,000 or over 200 transactions 10/1/2018 10/1/2019 Massachusetts >$100,000 10/1/2019 10/1/2019 Michigan >$100,000 or over 200 transactions 10/1/2018 1/1/2020 Minnesota >$100,000 or over 200 transactions 10/1/2018 10/1/2018 Mississippi >$250,000 9/1/2018 7/1/2020 Nebraska >$100,000 or over 200 transactions 1/1/2019 4/1/2019 Nevada >$100,000 or over 200 transactions 10/1/2018 10/1/2019 New Jersey >$100,000 or over 200 transactions 11/1/2018 11/1/2018 New Mexico >$100,000 7/1/2019 7/1/2019 New York >$500,000 and over 100 transactions 6/21/2018 6/1/2019 North Carolina >$100,000 or over 200 transactions 11/1/2018 2/1/2020 North Dakota >$100,000 10/1/2018 10/1/2019 Ohio >$100,000 or over 200 transactions 8/1/2019 8/1/2019 Oklahoma >$100,000 7/1/2018 7/1/2018 Pennsylvania >$100,000 7/1/2019 7/1/2019 Rhode Island >$100,000 or over 200 transactions 7/1/2019 7/1/2019 South Carolina >$100,000 11/1/2018 11/1/2018 South Dakota >$100,000 or over 200 transactions 11/1/2018 3/1/2019 Tennessee >$500,000 10/1/2019 10/1/2020 Texas >$500,000 10/1/2019 10/1/2019 Utah >$100,000 or over 200 transactions 1/1/2019 10/1/2019 Vermont >$100,000 or over 200 transactions 7/1/2018 6/1/2019 Virginia >$100,000 or over 200 transactions 7/1/2019 7/1/2019 Washington >$100,000 10/1/2018 10/1/2018 West Virginia >$100,000 or over 200 transactions 1/1/2019 7/1/2019 Wisconsin >$100,000 or over 200 transactions 10/1/2018 10/1/2019 Wyoming >$100,000 or over 200 transactions 2/1/2019 7/1/2019
Source: Individual state information, compiled by the author. Notes: CY = calendar year; TBD = to be determined. Alaska, Delaware, Montana, New Hampshire, and Oregon do not have sales tax. Florida and Missouri have not yet enacted legislation on economic nexus. States are hyperlinked to respective economic nexus guidelines.

4 8 S T A T E T A X A N D E C O N O M I C R E V I E W , 2 0 2 0 Q U A R T E R 3
TABLE A9
Quarterly State Government Tax Revenue for Nonmajor Tax Revenue Sources
Year-over-year real percentage change; four-quarter moving averages
2020 Q3 collections ($ millions)
Property tax
Tobacco product
sales tax
Alcoholic beverage sales tax
Motor vehicle & operators' license taxes
Other taxes
Total nonmajor
taxes
$4,785 $4,891 $1,768 $8,537 $32,455 $52,436
2010 Q1 – 2020 Q3 average growth
2.0 (0.5) 0.9 1.7 2.0 1.7
2020 Q3 2.8 (1.7) (4.2) (3.3) (6.1) (4.5) 2020 Q2 0.5 (2.7) (2.8) (3.3) (4.1) (3.4) 2020 Q1 1.1 (3.2) 2.2 1.4 1.7 1.2 2019 Q4 0.1 (4.1) 2.2 0.9 1.7 0.9 2019 Q3 (0.4) (6.2) (0.2) 1.2 3.4 1.8 2019 Q2 5.2 (7.7) (2.0) 0.8 4.7 2.7 2019 Q1 6.4 (5.5) (0.6) 4.3 5.2 4.0 2018 Q4 9.0 (5.3) (1.5) 7.1 5.3 4.6 2018 Q3 8.1 0.8 0.0 4.4 5.2 4.8 2018 Q2 3.6 5.2 1.3 4.7 3.6 3.8 2018 Q1 1.0 4.7 1.1 1.1 2.6 2.4 2017 Q4 (0.6) 6.1 2.9 (0.3) 1.9 1.8 2017 Q3 (1.2) 3.6 3.0 3.7 0.5 1.1 2017 Q2 0.4 1.8 2.2 1.5 (0.4) 0.2 2017 Q1 3.0 1.2 1.1 2.3 (1.7) (0.4) 2016 Q4 2.3 1.4 0.4 2.7 (1.7) (0.4) 2016 Q3 4.9 1.2 0.7 1.0 (2.5) (1.0) 2016 Q2 4.1 0.6 1.6 2.6 (1.8) (0.4) 2016 Q1 5.0 1.8 2.6 2.3 (1.4) 0.0 2015 Q4 8.7 0.1 1.5 2.8 (1.0) 0.4 2015 Q3 6.1 (0.8) 1.3 1.6 (0.4) 0.4 2015 Q2 5.2 (2.1) 1.6 1.2 (0.7) (0.0) 2015 Q1 4.3 (4.0) (0.2) 1.2 (0.4) (0.1) 2014 Q4 0.8 (4.6) 1.5 (0.7) (1.9) (1.7) 2014 Q3 3.2 (3.7) 1.3 0.6 (1.7) (1.1) 2014 Q2 5.2 0.5 (0.1) 1.1 (0.4) 0.3 2014 Q1 5.1 1.8 1.3 0.8 0.4 1.0 2013 Q4 4.8 3.7 (0.7) 0.3 3.2 2.8 2013 Q3 3.2 3.6 (2.4) (0.5) 3.6 2.8 2013 Q2 (0.3) (1.0) (1.9) (0.9) 2.7 1.5 2013 Q1 (3.2) (1.6) (0.1) 0.2 2.5 1.3 2012 Q4 (4.8) (2.6) 2.2 2.0 1.2 0.6 2012 Q3 (9.2) (3.4) 3.4 3.1 2.2 0.9 2012 Q2 (10.6) (2.3) 3.0 3.1 4.1 2.1 2012 Q1 (10.8) (2.5) 0.6 2.1 7.6 4.0 2011 Q4 (11.0) (1.9) (0.5) 1.8 11.8 6.5 2011 Q3 (7.5) (0.9) 0.5 0.4 12.8 7.3 2011 Q2 (3.8) 0.8 1.6 1.6 12.2 7.6 2011 Q1 2.5 2.8 3.2 3.4 10.1 7.4 2010 Q4 8.2 3.2 3.3 4.1 7.9 6.7 2010 Q3 13.4 2.3 3.1 5.7 5.0 5.5 2010 Q2 13.4 0.6 2.1 3.8 (0.9) 1.2 2010 Q1 9.9 (1.2) 0.7 1.5 (8.6) (4.7)
Source: US Census Bureau (tax revenue), analysis by the author.

S T A T E T A X A N D E C O N O M I C R E V I E W , 2 0 2 0 Q U A R T E R 3 4 9
TABLE A10
Preliminary Quarterly State Government Tax Revenue, by State
Nominal percentage change, 2020 quarter 4 versus 2019 quarter 4
US (median) 4.5 17.0 5.4 4.4
US (average) 8.9 23.0 3.3 6.5
New England 7.0 40.5 3.5 6.4
Connecticut 10.2 36.7 7.1 9.4
Maine 15.4 43.5 6.2 10.7
Massachusetts 5.0 50.4 (0.8) 4.6
New Hampshire 10.9 10.6 N/A 4.4
Rhode Island 0.1 114.1 7.7 2.5
Vermont 11.9 (4.0) 13.5 8.1
Mideast 4.1 17.4 0.2 6.3
Delaware (41.1) (52.8) N/A (5.4)
Maryland 15.0 71.8 (4.9) 12.1
New Jersey 3.6 17.0 5.1 16.7
New York 6.5 4.5 (5.4) 2.5
Pennsylvania (5.1) 30.3 5.4 2.2
Great Lakes 3.0 15.8 5.3 3.7
Illinois 3.9 4.6 2.7 2.7
Indiana 2.4 (8.2) 6.4 2.4
Michigan 3.1 (4.5) 8.7 4.3
Ohio 0.7 N/A 5.4 2.3
Wisconsin 4.3 62.5 1.6 8.1
Plains 2.9 12.7 2.4 2.6
Iowa (4.0) 37.1 6.3 2.2
Kansas 4.5 4.8 5.7 4.3
Minnesota 5.9 23.8 (0.3) 5.0
Missouri 0.4 0.8 4.5 1.4
Nebraska 4.7 (21.2) 5.7 2.4
North Dakota 19.1 (13.3) (19.1) (22.8)
South Dakota N/A N/A 6.7 8.2
Southeast 4.7 19.5 3.6 5.1
Alabama 3.4 22.8 8.3 6.6
Arkansas (3.0) 17.0 5.3 1.2
Florida N/A 21.6 (0.8) 2.7
Georgia 6.4 7.6 6.0 6.0
Kentucky N/A 41.3 4.8 5.5
Louisiana 1.3 99.3 (0.7) 2.2
Mississippi 5.1 (23.5) 11.1 5.7
North Carolina 8.3 253.7 5.1 8.3
South Carolina 5.6 46.1 9.4 6.5
Tennessee (28.2) 6.2 6.5 4.7
Virginia 3.3 39.4 5.4 6.1
West Virginia (0.2) 12.6 5.2 (2.3)
Southwest 8.9 (16.1) (1.3) (4.8)
Arizona 11.1 (16.9) 12.0 10.9
New Mexico ND ND ND ND
Oklahoma 5.2 (14.5) 7.8 (1.5)
Texas N/A N/A (3.9) (8.6)
Rocky Mountain 12.7 36.4 6.4 11.5 Colorado 19.8 72.5 2.2 17.3 Idaho 14.5 12.8 14.9 12.3
State/region PIT CIT Sales Total
5 0 S T A T E T A X A N D E C O N O M I C R E V I E W , 2 0 2 0 Q U A R T E R 3
Montana (14.9) (14.7) N/A (8.9) Utah 10.8 33.4 12.1 10.3 Wyoming N/A N/A (12.2) ND
Far West 20.6 33.8 6.8 14.1 Alaska N/A (59.9) N/A (60.5) California 24.1 37.1 12.0 19.0
Hawaii (3.1) 38.9 (20.4) (10.2)
Nevada N/A N/A (5.9) (6.4)
Oregon (2.5) 8.7 N/A (1.1)
Washington N/A N/A 2.2 7.3
Source: Individual state data, analysis by the author.
Notes: CIT = corporate income tax; PIT = personal income tax; N/A = not applicable; ND = no data.
N O T E S 5 1
Notes 1 The author made several adjustments for the third quarter of 2020 and to several previous quarters of tax
revenue data reported by the US Census Bureau based on information and data received directly from the states
and from the Census Bureau.
2 In this report, the author uses US Bureau of Economic Analysis regions as the basis of analysis.
3 See Arizona Joint Legislative Budget Committee, “Monthly Fiscal Highlights, November 2020,” accessed March 5,
2021, https://www.azleg.gov/jlbc/mfh-nov-20.pdf.
4 Justin Garosi and Brian Uhler, “Income Tax Withholding Tracker: December 1 - December 23,” California
Legislative Analyst’s Office, December 23, 2020, https://lao.ca.gov/LAOEconTax/Article/Detail/603.
5 Thirty-seven of 41 states with broad-based personal income tax extended filing deadline to July 15, 2020. Among
the remaining four states, Idaho extended to June 15, Hawaii to July 20, Iowa to July 31, and Virginia to June 1.
6 Income tax returns are due on April 15 in 35 of 41 states that have a broad-based personal income tax. The
remaining six states have individual income tax return due dates later than April 15. Those states are Arkansas
(May 15), Delaware (April 30), Hawaii (April 20), Iowa (April 30), Louisiana (May 15), and Virginia (May 1).
7 See “IRS Extends More Tax Deadlines to Cover Individuals, Trusts, Estates, Corporations and Others,” news
release, Internal Revenue Service, April 9, 2020, https://www.irs.gov/newsroom/irs-extends-more-tax-
deadlines-to-cover-individuals-trusts-estates-corporations-and-others.
8 See “Section 5 – Saving and Investment, National Income and Product Accounts,” US Bureau of Economic
Analysis, accessed March 5, 2021,
https://apps.bea.gov/iTable/iTable.cfm?reqid=19&step=2#reqid=19&step=2&isuri=1&1921=survey.
9 See South Dakota v. Wayfair, Brief of Amici Curiae Law Professors and Economists in Support of Petitioner, No. 17-
494, March 5, 2018, https://www.supremecourt.gov/DocketPDF/17/17-
494/37603/20180305141434827_Brief%20of%20Amici%20Curiae%20Law%20Professors%20and%20Econo
mists%20iso%20Petitioner.PDF.
10 See Janelle Cammenga, “Florida and Missouri, the Last Wayfair Holdouts, Consider Remote Sales Tax Bills,” Tax
Foundation, February 5, 2021, https://taxfoundation.org/missouri-florida-remote-sales-tax.
11 See Lucy Dadayan, “The COVID-19 Effect: State Sales Tax Receipts Shrank $6 Billion in May,” Forbes, July 14,
2020, https://www.forbes.com/sites/lucydadayan/2020/07/14/the-covid-19-effect-state-sales-tax-receipts-
shrank-6-billion-in-may.
12 See Illinois Department of Revenue, “Motor Fuel Tax Rates and Fees,” accessed March 5, 2021,
https://www2.illinois.gov/rev/research/taxrates/Pages/motorfuel.aspx.
13 See Ohio Department of Taxation, “Ohio Motor Fuel Tax Rates,” accessed March 5, 2021,
https://www.tax.ohio.gov/excise/motor_fuel/tax_rates.aspx.
14 See Lucy Dadayan and Kim Rueben. “Why States and Localities Need More Federal Aid,” TaxVox, February 22,
2021, https://www.taxpolicycenter.org/taxvox/why-states-and-localities-need-more-federal-aid.
15 See “How the COVID-19 Pandemic is Transforming State Budgets,” Urban Institute State and Local Finance
Initiative, accessed March 5, 2021, https://www.urban.org/policy-centers/cross-center-initiatives/state-and-
local-finance-initiative/projects/state-fiscal-pages-covid-edition.

5 2 N O T E S
16 See US Bureau of Labor Statistics, “Labor Force Statistics from the Current Population Survey,” accessed March
5, 2021, https://www.bls.gov/web/empsit/cpsee_e08.htm.
17 For more discussion of the relationship between property tax and house prices, see Dadayan (2012).
18 Author’s analysis of data from National Association of State Budget Officers (2019), table A-1 and table A-2.
19 See State of New Jersey, Governor Phil Murphy, “Governor Murphy, Lt. Governor Oliver, Senate President
Sweeney, Assembly Speaker Coughlin, Assembly Budget Chair Pintor Marin, and Senate Budget Chair Sarlo
Announce Agreement to Include Millionaire’s Tax in Revised FY2021 Budget,” September 17, 2020,
https://nj.gov/governor/news/news/562020/approved/20200917a.shtml.
20 See Wisconsin Department of Revenue, “Wisconsin Tax Bulletin. Number 212,” February 2021,
https://www.revenue.wi.gov/WisconsinTaxBulletin/212-02-21-WTB.pdf.
21 See California Legislative Analyst’s Office, The 2020-21 May Revision: Revenue Proposals in the 2020‑21 May
Revision,” May 20, 2020, https://lao.ca.gov/Publications/Report/4238.
22 See New Jersey Treasury, Division of Taxation, “Corporation Business Tax Reform Information, Surtax,” accessed
March 5, 2021, https://www.state.nj.us/treasury/taxation/cbt/surtax.shtml.
23 See Tennessee Department of Revenue, “Marketplace Sellers, Marketplace Facilitators & Out-of-State Dealers,”
accessed March 5, 2021, https://www.tn.gov/revenue/taxes/sales-and-use-tax/out-of-state-dealers-
marketplace-facilitators.html.
24 See Gabriel Petek, “The 2019-20 Budget: Analysis of the Medi-Cal Budget,” California Legislative Analyst’s
Office, February 13, 2019, https://lao.ca.gov/Publications/Report/3935.
25 See California Department of Health Care Services, letter to Kristin Fan, Centers for Medicare and Medicaid
Services, “California Request for Waiver For Manager Care Organization Tax,” September 30, 2019,
https://www.dhcs.ca.gov/services/Documents/MCOTax09302019.pdf.
26 See US Department of Health and Human Services’ response letter addressed to the California Department of
Health Care Services, January 30, 2020, https://www.dhcs.ca.gov/services/Documents/CMS-Response-to-CA-
Tax-Waiver-Request1-30-20.pdf.
27 See California Legislative Analyst’s Office, “The 2020-21 Budget: Overview of the California Spending Plan,”
October 5, 2020, https://lao.ca.gov/Publications/Report/4263.

R E F E R E N C E S 5 3
References Dadayan, Lucy. 2020b. COVID-19 And Government Actions Caused State Tax Revenues To Plunge In April. Washington
DC: Urban-Brookings Tax Policy Center. https://www.taxpolicycenter.org/taxvox/covid-19-and-
government-actions-caused-state-tax-revenues-plunge-april.
Dadayan, Lucy. 2020c. COVID-19 Pandemic Could Slash 2020-21 State Revenues By $200 Billion. Washington DC:
Urban-Brookings Tax Policy Center. https://www.taxpolicycenter.org/taxvox/covid-19-pandemic-could-
slash-2020-21-state-revenues-200-billion.
Dadayan, Lucy. 2020a. State Revenue Forecasts Before COVID-19 and Directions Forward. Washington, DC: Urban
Institute. https://www.urban.org/sites/default/files/publication/101962/state-revenue-forecasts-before-
covid-19-and-directions-forward_0.pdf.
Dadayan, Lucy. 2012. The Impact of the Great Recession on Local Property Taxes. Albany, NY: Nelson A. Rockefeller
Institute of Government. https://rockinst.org/wp-content/uploads/2018/02/2012-07-16-
Recession_Local_-Property_Tax.pdf.
Dadayan, Lucy, and Donald J. Boyd. 2016. Double, Double, Oil and Trouble. Albany, NY: Nelson A. Rockefeller
Institute of Government. http://rockinst.org/wp-content/uploads/2018/02/2016-02-
By_Numbers_Brief_No5.pdf.
Loughead, Katherine. 2020. In Some States, 2020 Estimated Tax Payments Are Due before 2019 Tax Returns.
Washington, DC: Tax Foundation. https://taxfoundation.org/2020-quarterly-estimated-tax-payments-
2019-tax-returns.
National Association of State Budget Officers. 2020. The Fiscal Survey of States: Fall 2020. Washington, DC: National
Associaton of State Budget Officers. https://www.nasbo.org/reports-data/fiscal-survey-of-states.

5 4 A B O U T T H E A U T H O R
About the Author
Lucy Dadayan is a senior research associate with the Urban-Brookings Tax Policy Center at the Urban
Institute. Before joining Urban, Dadayan was a senior research scientist with the Rockefeller Institute
of Government, where she wrote extensively on state and local government fiscal issues, including state
government tax revenue trends, personal income taxes, tax revenue forecasts, property taxes, gambling
tax revenue, government employment, spending on social services, education spending, and state
spending on children’s programs. She has authored or coauthored four chapters for the Book of the
States (2015, 2016, and 2017 editions). Dadayan’s work is frequently cited in major news media,
including the Wall Street Journal, the New York Times, the Bond Buyer, Bloomberg, the Washington Post,
Forbes, the Boston Globe, the Financial Times, and the Los Angeles Times. Dadayan is often invited to
present at conferences and provide testimonies for state government agencies. Dadayan holds an MA
in public policy and affairs and a PhD in informatics, both from the State University of New York at
Albany.
ST A T E M E N T O F I N D E P E N D E N C E
The Urban Institute strives to meet the highest standards of integrity and quality in its research and analyses and in
the evidence-based policy recommendations offered by its researchers and experts. We believe that operating
consistent with the values of independence, rigor, and transparency is essential to maintaining those standards. As
an organization, the Urban Institute does not take positions on issues, but it does empower and support its experts
in sharing their own evidence-based views and policy recommendations that have been shaped by scholarship.
Funders do not determine our research findings or the insights and recommendations of our experts. Urban
scholars and experts are expected to be objective and follow the evidence wherever it may lead.
500 L'Enfant Plaza SW
Washington, DC 20024
www.urban.org