research report - virginia department of transportation
TRANSCRIPT

Virginia Transportation Research Council, 530 Edgemont Road,Charlottesville, VA 22903-2454, www.vtrc.net, (434) 293 -1900
http://www.virginiadot.org/vtrc/main/online_reports/pdf/08-r4.pdf
Final Report VTRC 08-R4
research reportHigh-Performance
Continuously ReinforcedConcrete Pavements in Richmond
and Lynchburg, Virginia
Virginia Transportation Research Council
CELIK OZYILDIRIM, Ph.D., P.E.Principal Research Scientist
Standard Title Page - Report on Federally Funded Project 1. Report No.: 2. Government Accession No. 3. Recipient’s Catalog No. FHWA/VTRC 08-R4
4. Title and Subtitle: 5. Report Date: High-Performance Continuously Reinforced Concrete Pavements in Richmond and Lynchburg, Virginia
September 2007
6. Performing Organization Code: 7. Author(s): Celik Ozyildirim, Ph.D., P.E.
8. Performing Organization Report No.: VTRC 08-R4
9. Performing Organization and Address: 10. Work Unit No. (TRAIS): Virginia Transportation Research Council 530 Edgemont Road 11. Contract or Grant No.: Charlottesville, VA 22903
54177
12. Sponsoring Agencies’ Name and Address 13. Type of Report and Period Covered: Virginia Department of Transportation Final 1401 E. Broad Street 14. Sponsoring Agency Code Richmond, VA 23219
Federal Highway Administration 400 North 8th Street, Room 750 Richmond, VA 23219-4825
15. Supplementary Notes 16. Abstract This study evaluated the properties of two high performance concrete (HPC) paving projects in Virginia. These continuously reinforced concrete pavements were placed on State Route 288 near Richmond and on the U.S. 29 Madison Heights Bypass in Lynchburg; a minimum flexural strength of 650 psi at 28 days was required for each. In an attempt to control cracking, reduced shrinkage was sought through the use of large maximum size well-graded aggregates and proper curing. The results showed that satisfactory strengths can be obtained at 28 days. Concretes with the lowest water content had the lowest shrinkage, as expected. For desired performance, good construction practices including a level base, correct steel placement, proper consolidation, timely texturing, and effective curing are required. Although pavement designs are based on flexural strength, compressive strength tests are more convenient and less variable than are flexural strength tests. Therefore, a correlation was established between flexural and compressive strength, and acceptance of the pavements was based on compressive strength.
The findings of the study led to the following recommendations with regard to the concrete used in HPC paving projects:
• Consider specifying strength at ages above 28 days to encourage the use of a higher percentage of pozzolanic material. • Specify the use of large maximum size aggregate in combination with well-graded aggregate to reduce water content and minimize
segregation. • Use trial batches to determine the minimum cementitious materials content that provides acceptable strength and workability. • Use actual elastic modulus values to check and adjust the design of the pavement. • Use a test section before the start of the paving operation to determine if any changes to the equipment and placement procedures are
needed. • Use compressive strength for the acceptance of a project after a correlation with flexural strength is established. • Permit maturity testing to estimate the strength of concrete in the pavement for opening to traffic based on concrete curing time and
temperature. If as little as a 10 percent increase in service life were achieved by using HPC, the savings would be in the millions of dollars over the
life of the pavement. With proper selection of the aggregates, a reduction in the cementitious material content of 50 lb/yd3 is possible and would translate to a savings of about $400,000 dollars for the two projects investigated in this study. The reduction in time for opening to traffic of new or reconstructed pavements through strength estimation by the maturity method and the use of appropriate earlier strength mixtures can lead to road user cost savings close to $0.5 million per year. 17 Key Words 18. Distribution Statement Concrete, pavement, high-performance concrete, continuously reinforced concrete pavement, strength, temperature, smoothness, maturity, aggregate grading
No restrictions. This document is available to the public through NTIS, Springfield, VA 22161.
19. Security Classif. (of this report) 20. Security Classif. (of this page) 21. No. of Pages 22. Price Unclassified Unclassified 29
Form DOT F 1700.7 (8-72) Reproduction of completed page authorized
FINAL REPORT
HIGH-PERFORMANCE CONTINUOUSLY REINFORCED CONCRETE PAVEMENTS IN RICHMOND AND LYNCHBURG, VIRGINIA
Celik Ozyildirim, Ph.D., P.E. Principal Research Scientist
Virginia Transportation Research Council (A partnership of the Virginia Department of Transportation
and the University of Virginia since 1948)
In Cooperation with the U.S. Department of Transportation Federal Highway Administration
Charlottesville, Virginia
September 2007
VTRC 08-R4

ii
DISCLAIMER
The contents of this report reflect the views of the author, who is responsible for the facts and the accuracy of the data presented herein. The contents do not necessarily reflect the official views or policies of the Virginia Department of Transportation, the Commonwealth Transportation Board, or the Federal Highway Administration. This report does not constitute a standard, specification, or regulation.
Copyright 2007 by the Commonwealth of Virginia. All rights reserved.

iii
ABSTRACT This study evaluated the properties of two high performance concrete (HPC) paving projects in Virginia. These continuously reinforced concrete pavements were placed on State Route 288 near Richmond and on the U.S. 29 Madison Heights Bypass in Lynchburg; a minimum flexural strength of 650 psi at 28 days was required for each. In an attempt to control cracking, reduced shrinkage was sought through the use of large maximum size well-graded aggregates and proper curing. The results showed that satisfactory strengths can be obtained at 28 days. Concretes with the lowest water content had the lowest shrinkage, as expected. For desired performance, good construction practices including a level base, correct steel placement, proper consolidation, timely texturing, and effective curing are required. Although pavement designs are based on flexural strength, compressive strength tests are more convenient and less variable than are flexural strength tests. Therefore, a correlation was established between flexural and compressive strength, and acceptance of the pavements was based on compressive strength.
The findings of the study led to the following recommendations with regard to the
concrete used in HPC paving projects:
• Consider specifying strength at ages above 28 days to encourage the use of a higher percentage of pozzolanic material.
• Specify the use of large maximum size aggregate in combination with well-graded aggregate to reduce water content and minimize segregation.
• Use trial batches to determine the minimum cementitious materials content that provides acceptable strength and workability.
• Use actual elastic modulus values to check and adjust the design of the pavement. • Use a test section before the start of the paving operation to determine if any changes
to the equipment and placement procedures are needed. • Use compressive strength for the acceptance of a project after a correlation with
flexural strength is established. • Permit maturity testing to estimate the strength of concrete in the pavement for
opening to traffic based on concrete curing time and temperature. If as little as a 10 percent increase in service life were achieved by using HPC, the
savings would be in the millions of dollars over the life of the pavement. With proper selection of the aggregates, a reduction in the cementitious material content of 50 lb/yd3 is possible and would translate to a savings of about $400,000 dollars for the two projects investigated in this study. The reduction in time for opening to traffic of new or reconstructed pavements through strength estimation by the maturity method and the use of appropriate earlier strength mixtures can lead to road user cost savings close to $0.5 million per year.

FINAL REPORT
HIGH-PERFORMANCE CONTINUOUSLY REINFORCED CONCRETE PAVEMENTS IN RICHMOND AND LYNCHBURG, VIRGINIA
Celik Ozyildirim, Ph.D., P.E. Principal Research Scientist
INTRODUCTION
Over the years, concrete pavements have served motorists well in the transportation system. One of the biggest advantages of properly prepared concrete is its high durability.1 Concrete responds well to harsh environmental conditions, high traffic volumes, and heavy loadings if designed and placed properly.2 The performance of concrete pavement is dependent on several factors such as the base design, pavement design, mixture proportions, construction practices, and the environment. Environmental changes in temperature and moisture cause the volume of the concrete to change. When the concrete is restrained, these changes can lead to stresses high enough to cause cracking. Cracks can adversely affect the durability and service life of the pavement.3 To contain these cracks, longitudinal steel reinforcement bars are placed in continuously reinforced concrete pavement (CRCP). Although cracking still occurs, the reinforcement controls the width and spacing of the cracks, and it preserves aggregate interlock and load transfer at the crack.2 Several factors, such as water, cement, and paste contents, in addition to aggregate amount, type, and size, affect the extent of volumetric change in concrete.4 Using a larger coarse aggregate will reduce the change in volume, but a larger coarse aggregate is associated with concerns about segregation, workability, smoothness, and a reduction in strength.5 Segregation can be decreased by ensuring the aggregates are well graded and properly stored, and the possible reduction in strength can be offset by the water reduction possible with a larger aggregate size.4 Construction practices also play a large role in overall concrete performance. Placement, consolidation, finishing, and curing affect the strength and durability of the pavement.2 Any handling procedure that promotes segregation will adversely affect the quality of the concrete.4 Proper consolidation will minimize the entrapped air voids that reduce strength and durability.4 Effective curing is essential for the development of the desired properties and the reduction of the volumetric changes.4 The two projects investigated in this study implemented CRCPs. CRCPs are expected to have a longer service life and require less maintenance than traditional jointed concrete pavements.6 Therefore, it is a cost-effective choice, but only when proper consideration is given to the base design and preparation, pavement design, concrete materials, and construction practices.7 High-performance concrete (HPC) in pavements is expected to provide a long service life with minimal maintenance.6 In Virginia, the HPC characteristics chosen for the subject
2
projects were adequate workability for placement, high flexural strength exceeding 650 psi at 28 days to resist stresses, low shrinkage and temperature variation for reduced strains, and reduced permeability for improved durability
PURPOSE AND SCOPE
This research was conducted to characterize the properties of the concrete and the pavement on two HPC CRCP projects in Virginia. Specifically, the following properties and parameters were determined:
1. the physical and mechanical properties of the concrete indicated in the Guide for the
Mechanistic-Empirical Design of New and Rehabilitated Pavement Structures (MEPDG),8 which included compressive and flexural strength, coefficient of thermal expansion, modulus of elasticity, and Poisson’s ratio
2. the strength, permeability, and shrinkage of the concretes with varying cementitious
material contents, water–cementitious materials ratios, and aggregate size
3. the correlation between flexural and compressive strengths
4. the estimation of compressive strength using temperature and time data
5. the smoothness of the pavements. Concretes were mixed at batch plants erected on site and delivered in nonagitating dump trucks.
METHODOLOGY Six tasks were carried out to achieve the study objectives: 1. Two HPC CRCP projects were selected for the evaluation.
2. The properties of the concrete used in the projects were determined. 3. The correlation between flexural and compressive strength was determined. 4. The pavement temperature was determined. 5. Compressive strength was estimated using temperature and time data. 6. The smoothness of the pavements was determined.
Site Selection and Description
As stated previously, two sites were selected for investigation: (1) a site on State Route (S.R.) 288 outside Richmond, and (2) a site on the U.S. 29 (Madison Heights) Bypass near

3
Lynchburg. These two sites were selected because construction was planned or was in progress at the sites. In both projects, mobile concrete plants near the job site were used. In Phase II of the U.S. 29 Bypass project, sampling and testing of concrete samples were done in accordance with the Virginia Department of Transportation’s (VDOT) new end-result specifications (ERS) for concrete9 without enforcement of the pay factors. S.R. 288 Near Richmond Project Description
This project was completed with the construction of three sections. The first two sections were CRCP and the third section was asphalt concrete. Section 1 started 1.08 mi south of S.R. 76 (Powhite Parkway) and stretched to the Charter Colony Parkway. Section 2 ran from the Charter Colony Parkway to the Chesterfield/Powhatan county line. Section 3 ran from the county line to I-64. The project covered four lanes, two northbound and two southbound, and collector/distributor lanes at S.R. 76 and U.S. 60. Each direction had one 12-ft lane and one 14-ft lane of CRCP, with 2 ft of the14-ft lane as part of the shoulder. The rest of the shoulder was asphalt. The same paving contractor paved both CRCP sections under two different general contractors.
The slab thickness of the CRCP was 10 in. In some places, the difficulty in providing a
level base course resulted in varying thicknesses of the concrete slab, generally on the high side of the slab, drawing attention to the need for proper base preparation. Underneath the CRCP, Section 1 had a Type I asphalt-treated open-graded drainage layer (OGDL) 3 in thick over a cement-treated aggregate (CTA) subbase. The CTA was between 6 and 8 in thick. The OGDL consisted of No. 57 aggregate stabilized with 2.5 percent asphalt cement. Section 2 had a similar structure, but the OGDL was composed of No. 8 and No. 68 aggregate stabilized with 4.3 percent asphalt cement. To assist in drainage, a longitudinal underdrain was placed 6 in below the pavement surface.
Inside the CRCP, reinforcing steel was placed at mid-depth in the longitudinal direction
to control cracks and aid in load transfer. The reinforcing steel comprised No. 6 bars covering 0.7 percent of the pavement cross section and No. 5 bars spaced every 4 ft running in the transverse direction. The steel was kept at the proper height by steel chairs that locked the bars into place. Materials and Placement
In 2000, construction began on S.R. 288 with connections and ramps. The concrete mixture design is shown in Table 1 as the M1 mix. The coarse aggregate was amphibole gneiss and metamorphosed granite with a nominal maximum size of 2 in. The fine aggregate was natural sand. The cementitious material was Type II cement with Class F fly ash. Mixtures also contained an air-entraining or water-reducing admixture. Three batches, B11, B21, and B31, were tested in 2000. In 2001, the first batch, B41, used the M1 mixture, but the mixture was switched to M2 (see Table 1) because of problems with the concrete segregating. The segregation was the result of a rich mixture, the large 2-in maximum size aggregate, poor
4
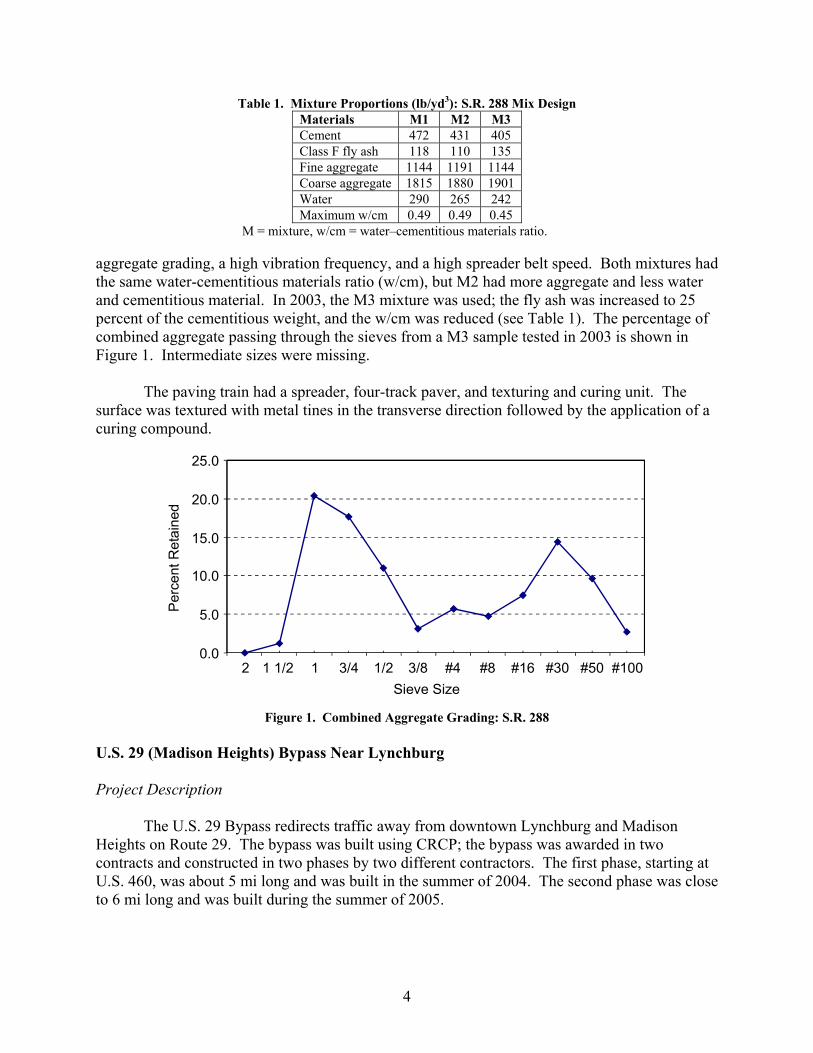
Table 1. Mixture Proportions (lb/yd3): S.R. 288 Mix Design Materials M1 M2 M3 Cement 472 431 405 Class F fly ash 118 110 135 Fine aggregate 1144 1191 1144 Coarse aggregate 1815 1880 1901 Water 290 265 242 Maximum w/cm 0.49 0.49 0.45
M = mixture, w/cm = water–cementitious materials ratio. aggregate grading, a high vibration frequency, and a high spreader belt speed. Both mixtures had the same water-cementitious materials ratio (w/cm), but M2 had more aggregate and less water and cementitious material. In 2003, the M3 mixture was used; the fly ash was increased to 25 percent of the cementitious weight, and the w/cm was reduced (see Table 1). The percentage of combined aggregate passing through the sieves from a M3 sample tested in 2003 is shown in Figure 1. Intermediate sizes were missing.
The paving train had a spreader, four-track paver, and texturing and curing unit. The
surface was textured with metal tines in the transverse direction followed by the application of a curing compound.
0.0
5.0
10.0
15.0
20.0
25.0
2 1 1/2 1 3/4 1/2 3/8 #4 #8 #16 #30 #50 #100Sieve Size
Per
cent
Ret
aine
d
Figure 1. Combined Aggregate Grading: S.R. 288 U.S. 29 (Madison Heights) Bypass Near Lynchburg Project Description
The U.S. 29 Bypass redirects traffic away from downtown Lynchburg and Madison Heights on Route 29. The bypass was built using CRCP; the bypass was awarded in two contracts and constructed in two phases by two different contractors. The first phase, starting at U.S. 460, was about 5 mi long and was built in the summer of 2004. The second phase was close to 6 mi long and was built during the summer of 2005.

5
The pavement structure for the U.S. 29 Bypass was slightly different than that for S.R. 288. Instead of a CTA subbase, an 8-in cement-treated soil subbase (12% hydraulic cement by volume) was constructed and covered by a thin layer of asphalt liquid and No. 8 aggregate. In lieu of an OGDL, an asphalt concrete base course (BM-25.0) was placed. This layer was designed to provide drainage and stability. The top layer was 12 in of CRCP. One 12-ft-wide lane and one 14-ft-wide lane were built in both the north and south directions. The lanes themselves were 12 ft wide, and the additional 2 ft on the outside lane was part of the shoulder. The remaining shoulders were asphalt concrete. To assist in drainage, a longitudinal underdrain was placed 6 in below the pavement surface.
Steel reinforcement in the longitudinal direction consisted of No. 7 bars at 0.7 percent of
the concrete cross-sectional area. It was placed at mid-depth and held by chairs that kept the bars at the correct height. In the transverse direction, No. 5 bars were placed 4 ft apart. Materials and Placement The mixture proportions of the two phases of the U.S. 29 Bypass are shown in Table 2. Both phases are designed for the same w/cm; however, Phase 2 had a higher cementitious materials content. The coarse aggregate was No. 57 with a nominal maximum aggregate size of 1 in from two sources. In Phase 1, the coarse aggregate was crushed granite from a quarry in Mount Athos, Virginia. In Phase 2, mixtures had crushed aplite from a quarry at Piney River, Virginia. The fine aggregate was natural sand. Initially, for Phase 2, water was held back to yield a w/cm of 0.44; however, the concrete yield was reduced. To increase the yield, the w/cm was raised to 0.48.
Figure 2 summarizes the coarse and fine aggregate sieve analysis for both phases, which had a similar gradation despite the different sources of aggregate used. Aggregates were kept moist with sprinklers on the stock piles, which also helped to limit the maximum concrete temperature to 90°F as required by the project specifications.
During Phase 1 in the summer of 2004, a four-track paver with 26 vibrators was used to place the concrete. The paver used in Phase 2 was a two-track machine with 16 vibrators. For both phases, the vibrators were running at 8,000 vibrations per minute, and one pass with the paver placed the entire 26-ft-wide strip of concrete. The paver kept the profile by following a string line with of tolerance of ±½ in. The concrete surface was textured by random transverse tining. After texturing, a curing compound was sprayed.
Table 2. Mixture Proportions (lb/yd3): U.S. 29 Bypass
w/cm = Water–cementitious materials ratio.
Material Phase 1 Phase 2 Cement 423 443 Fly ash 141 148 Water 275 290 Coarse aggregate 1871 1657 Fine aggregate 1252 1224 Maximum w/cm 0.49 0.49

6
0
5
10
15
20
25
30
35
1 1/2" 1" 3/4" 1/2" 3/8" #4 #8 #16 #30 #50 #100 #200Sieve Size
Phase 1Phase 2
Per
cent
Ret
aine
d
Figure 2. Combined Aggregate Grading: U.S. 29 Bypass
For both phases, the procedures and equipment were used with a test strip before
mainline paving began to identify and correct any potential problems attributable to equipment and procedures. This allowed for prediction of timing, equipment handling, and concrete quality and provided experience to the workers. There were problems in relation to consolidation and finishing, and adjustments to ensure proper workability of the concrete and the frequency of the vibrators were made.
Determination of Concrete Properties
The concretes were tested in the fresh state for air content (ASTM C 231), slump (ASTM C 143), concrete temperature (ASTM 1064), and unit weight (ASTM 138). The concretes were tested in the hardened state for compressive strength, flexural strength, elastic modulus, coefficient of thermal expansion, permeability, drying shrinkage, and resistance to cycles of freezing and thawing. These tests were conducted in accordance with the specifications listed in Table 3 using the sample sizes indicated.
Table 3. Tests and Specimen Sizes for Determination of Hardened Concrete Properties Test Specification Size (in)
Compressive strength AASHTO T 22 4 x 8 and 6 x 12 Flexural strength ASTM C 78 3 x 3 x 11.2 and 6 x 6 x 14 Elastic modulus ASTM C 469 4 x 8 and 6 x 12 Coefficient of thermal expansion AASHTO TP 60 4 x 8 and 6 x 12 Permeabilitya AASHTO T 277 4 x 2 Drying shrinkageb ASTM C 157 3 x 3 x 11.2 and 6 x 6 x 14 Freezing and thawingc ASTM C 666 3 x 4 x 16
aCured 1 week at 73°F and 3 weeks at 100°F. bMoist cured for 7 days and then air dried in the laboratory. For the concrete with 2-in maximum size aggregate, larger specimens were used. cMoist cured for 2 weeks and then air dried at least 1 week; tested in 2% NaCl in accordance with ASTM C 666, Procedure A.

7
Correlation Between Compressive and Flexural Strength Project specifications required that the concrete have a minimum flexural strength of 650
psi at 28 days. The flexural strength test has high variability and is difficult to conduct.4 Therefore, for convenience and reduced variability, acceptance was based on compressive strength once a correlation between compressive strength and flexural strength was derived. To develop the correlation, concretes were tested at different ages for flexural strength and compressive strength either before or at the beginning of the project. The values were plotted, and the relationship was established.
Pavement Temperature The temperature of the concrete from the beginning of placement until about 3 weeks after completion was monitored using sensors located at several depths. The sensors were tied to a stake placed vertically in the concrete to stay at the specified depth. Thermocouples were placed to measure the concrete temperature at no fewer than three depths: 2 in below the top surface, 2 in above the bottom surface, at mid-depth, and sometimes at mid-depth touching the steel reinforcement.
Estimations of Compressive Strength Using Temperature and Time Data The temperature data were used to determine the concrete maturity index (a product of
concrete temperature above a datum temperature and time). The cylinders were tested at different ages and at the time of testing the maturity index was determined.4 The relationship between the maturity index and strength prior to placement would indicate strength in the pavement with time using the field temperature data.4
Smoothness of Pavements The International Roughness Index (IRI) was used to determine the smoothness of the pavements. Smooth pavements last longer because of reduced dynamic loading,10 and they provide improved ride quality, which is important to the traveling public.
VDOT has a special provision for rideability (smoothness)11 in which IRI in inches per mile is established for each 0.1-mi section for each lane. The specification includes the quality rating scale for acceptance based on the final rideability determination. The pay adjustment in the specification is applied to the final surface area. In the two projects examined in this study, if the IRI is 60.1 to 70 in/mi, the contractor receives the full pay; for any higher value, a disincentive up to 100 in/mi applies; for any lower value, an incentive applies. If the IRI is above 100 in per mile, corrective work is required. A recent VDOT rideability specification12
has a wider IRI range for full pay (55.1 to 70 in/mi, with higher incentives and disincentives). After construction, the IRI was measured and recorded for each project.

8
RESULTS AND DISCUSSION
S.R. 288 Near Richmond Concrete Properties and Correlation of Flexural and Compressive Strengths
Concrete mixtures met the requirements for air content (4% to 8%) and temperature (40°F to 90°F), as indicated in Table 4. The air content of the M3 mixture stayed high, causing a drop in unit weight. The slump of the first two mixtures fell within the specified range (0 to 3 in), but the M3 mixture had a high slump, which necessitated extra manual work to form the pavement edge.
Figures 3 through 5 show the correlations between compressive strength and flexural
strength, the 95 percent confidence limits, and the equation used to derive an acceptance criterion based on compressive strength for the three phases of S.R. 288. The correlation showed that in order to yield a flexural strength of 650 psi, compressive strengths of 4,260 psi and 4,690 psi were needed for the years 2000 and 2001, respectively, and a compressive strength of 3,840 psi was needed for 2003.
Tables 5 through 7 show the results of the tests of hardened concretes for the S.R. 288
project, displayed in three tables by year of construction. In 2000, when construction began and exits were placed (see Table 5, M1), all three batches had compressive strengths of 4,260 psi at 28 days and flexural strengths of 645 psi and above at 28 days. At 1 year, the flexural strengths exceeded 800 psi. The elastic moduli were measured at 1 year, and values exceeded 4,600 ksi.
Table 4. Fresh Concrete Properties: S.R. 288
Mixture B11 B21 B31 B41 M1 Date Cast 11/17/2000 11/17/2000 11/17/2000 9/12/2001 Air (%) 5.8 5.3 8.0 6.0 Slump (in) 1.5 1.5 2.0 1.2 Concrete temperature (°F) 59 61 57 82 Air temperature (°F) 52 57 58 77 Unit weight (lb/ft3) 144 144 144 142 M2 Date Cast 9/27/2001 10/2/2001 10/31/2001 Air (%) 6.8 7.5 6.6 Slump (in) 1.5 2.0 1.2 Concrete temperature (°F) 72 73 64 Air temperature (°F) 73 74 70 Unit weight (lb/ft3) 142 142 141 M3 Date Cast 11/18/2003 11/18/2003 11/21/2003 Air (%) 7.9 7.5 7.5 Slump (in) 4.5 4.0 3.8 Concrete temperature (°F) 67 65 67 Air temperature (°F) 55 64 70 Unit weight (lb/ft3) 138.0 139.6 ---

9
y = 0.091x + 262R2 = 0.98
0100200300400500600700800900
0 2000 4000 6000 8000Compressive Strength (psi)
Flex
ural
Stre
ngth
(psi
)
Figure 3. Compressive Versus Flexural Strength: S.R. 288 (2000)
y = 0.094x + 209R2 = 0.96
0100200300400500600700800900
0 2000 4000 6000 8000Compressive Strength (psi)
Flex
ural
Stre
ngth
(psi
)
Figure 4. Compressive Versus Flexural Strength: S.R. 288 (2001)
y = 0.061x + 416R2 = 0.98
0100200300400500600700800900
0 2000 4000 6000 8000Compressive Strength (psi)
Flex
ural
Stre
ngth
(psi
)
Figure 5. Compressive Versus Flexural Strength: S.R. 288 (2003)

10
Table 5. Hardened Concrete Properties: S.R. 288 (2000) M1
Test
Age B11
11/17/2000 B21
11/17/200 B31
11/17/2000 3 d 2350 2260 2190 7 d 3680 3540 3500
14 d 4260 4070 4130 28 d 4570 4590 4370
Compressive strength (psi)
1 yr 6210 6240 6280 Emeasured (106 psi) 1 yr 4.63 5.02 4.97 Eempirical (106 psi) 1 yr 4.49 4.50 4.52
3 d 460 460 415 7 d 600 640 550
14 d 720 690 585 28 d 700 685 645
Flexural strength (psi)
1 yr 820 805 805 Permeability (coulombs) 28d 1161 1282 1075
28 d 398 258 355 16 wk 570 435 505 32 wk 610 473 563
Shrinkage (microstrain)
64 wk 658 515 578
Table 6. Hardened Concrete Properties: S.R. 288 (2001) M1 M2
Test
Age B41 B12 B22 B32 1d 1980 1360 1420 1240 7 d 3490 3520 3800 3570
14 d 4010 3870 4260 4150 28 d 4640 4540 4780 4670
Compressive strength (psi)
56 d 5310 4600 5630 4780 Emeasured (106 psi) 28 d 4.63 4.29 4.73 4.65 Eempirical (106 psi) 28 d 3.8 3.76 3.86 3.78
1d 505 320 330 315 7 d 665 620 590 550
14 d 655 655 580 570 28 d 670 625 605 600
Flexural strength (psi)
56 d 635 675 705 675 Permeability (coulombs) 28 d 2104 2195 1405 1711
28 d 233 328 313 388 16 wk 408 470 490 568 32 wk 418 500 518 553
Shrinkage (microstrain)
64 wk 445 505 545 595

11
Table 7. Hardened Concrete Properties: S.R. 288 (2003) M3
Test
Age B13 B23 B33 7 d 3350 3080 3530
14 d 3700 3510 4090 28 d 4520 3870 4570 90 d 5545 5270 5820
Compressive strength (psi)
1 yr 6940 6660 7760 7 d 3.94 4.32 4.52
14 d 4.05 4.11 4.67 28 d 4.62 4.14 5.80 90 d 4.93 4.86 5.30
Emeasured (106 psi)
1 yr 5.56 5.51 5.85 28d 3.60 3.39 3.68 Eempirical (106 psi) 1 yr 4.46 4.44 4.79 7 d 625 610 665
14 d 630 600 645 28 d 665 650 725 90 d 760 710 780
Flexural strength (psi)
1 yr 875 830 845 Permeability (coulombs) 28 d 694 647 ---
28 d 300 260 250 16 wk 493 455 435
Shrinkage (microstrain)
32 wk 508 475 478 Coefficient of thermal expansion (10-6/°F)
4 mo 6.22 6.10 5.72
Poisson’s ratio 4 mo 0.20 0.22 0.21 The measured values were higher than those calculated by the empirical formula (ACI 318), which uses unit weight and compressive strength. If in any batch the unit weight is missing, an estimated value from a batch with the same mix design is used.
In 2001, the mainline paving started with the first batch using the M1 mixture from 2000,
but a switch was made to M2 for subsequent batches because of segregation. The compressive strengths shown in Table 6 for the two mixtures are similar. However, the flexural strengths were lower for M2. Therefore, according to the year 2001 correlation, the compressive strength needed to exceed 4,690 psi to meet the minimum flexural strength, and only batch B22 exceeded this minimum value. The flexural strength of the M2 mixtures was more than 600 psi at 28 days but still lower than the minimum flexural strength. However, all three M2 batches met the minimum flexural strength requirement of 650 psi at 56 days. The permeability values of the year 2001 mixtures were higher than those of year 2000; however, they were all less than 3500 coulombs, indicating low permeability. The measured elastic modulus values for M1 and M2 were higher than those found using the empirical formula (ACI 318). The elastic moduli of the concrete for years 2000 and 2001 were determined at 1 year and 28 days, respectively. Therefore, as expected, the elastic modulus in year 2000 after 1 year was higher than the modulus at 28 days in 2001.
Table 7 summarizes the data from year 2003, which used the M3 mixture. In this set, all
compressive strength values were above the correlation value of 3,840 psi at 28 days and all batches met the minimum flexural strength of 650 psi at 28 days. Strength values at 1 year were

12
higher than those in 2000 and 2001, which can be attributed to the higher percentage of fly ash and lower w/cm. The measured average elastic modulus value of the M3 batches was higher than the 28-day value of M2 and the 1-year value of M1. The elastic modulus values measured were higher than those calculated by the empirical formula. In the empirical formula, the elastic modulus of the aggregate is related to unit weight and strength; it does not include the full effect of the aggregate amount.
The permeability of M3 was much lower than the permeability of M1 and M2 because of
the higher percentage of fly ash and lower w/cm. At 28 days, it was almost one half of the permeability of mixtures prepared in 2000 and almost one third of the permeability of mixtures in 2001. In general, the shrinkage values were less than 600 microstrain at 32 and 64 weeks. Concretes made in 2003 had the lowest amount of water and lower shrinkage values than those made in 2000 and 2001.
In the freeze-thaw test, the weight loss, durability, and surface rating of the concrete are
determined at 300 cycles. The acceptance criteria require a maximum weight loss of 7 percent, a minimum durability factor of 60, and a maximum surface rating of 3. Table 8 shows the results of the freeze-thaw tests in 2000, 2001, and 2003. The batches in 2000 were associated with high durability factors but showed high amounts of weight loss and a high surface rating. The 2001 and 2003 batches performed better and met the acceptance criteria. The air contents were higher in the 2001 and 2003 batches.
Table 8. Freeze-Thaw Resistance: S.R. 288
Batch Year Weight Loss (%) Durability Factor Surface Rating B11 2000 18.8 82 4.1 B21 2000 14.9 84 3.2 B31 2000 13.5 112 2.8 B41 2001 0.2 103 0.6 B12 2001 0.1 113 0.5 B22 2001 0.3 109 0.0 B32 2001 0.6 106 0.5 B13 2003 0.0 103 0.5 B23 2003 0.0 103 0.9 B33 2003 0.0 103 0.7
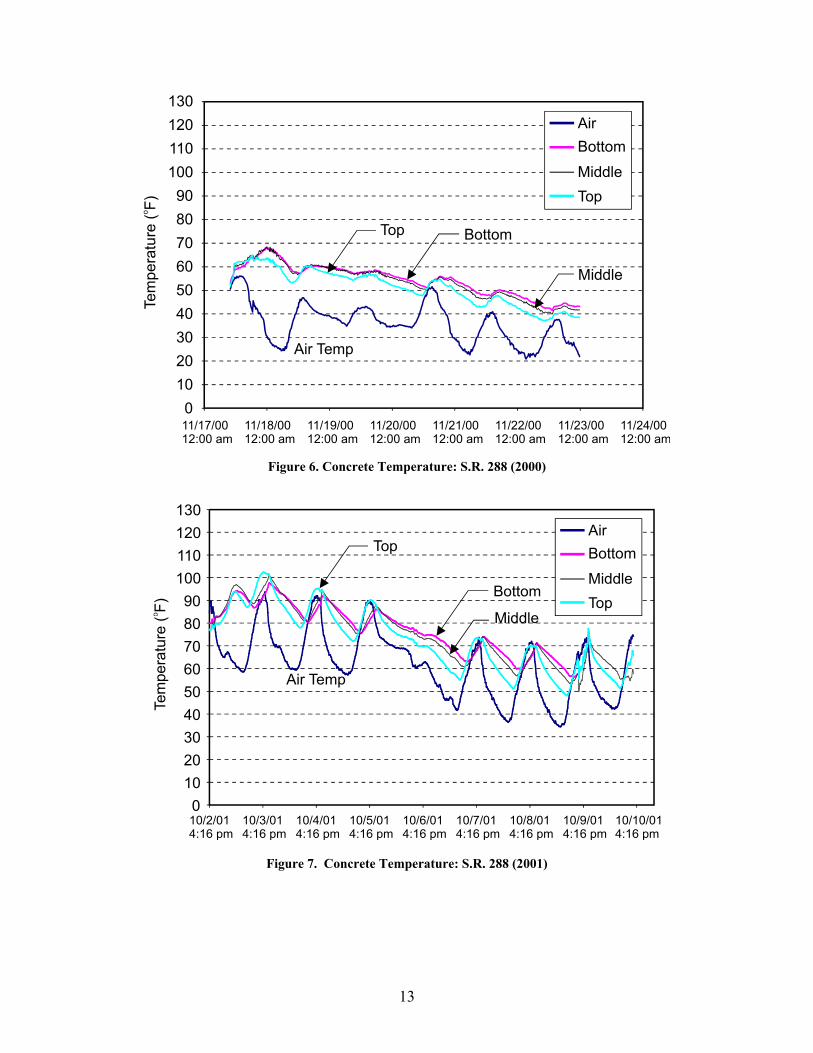
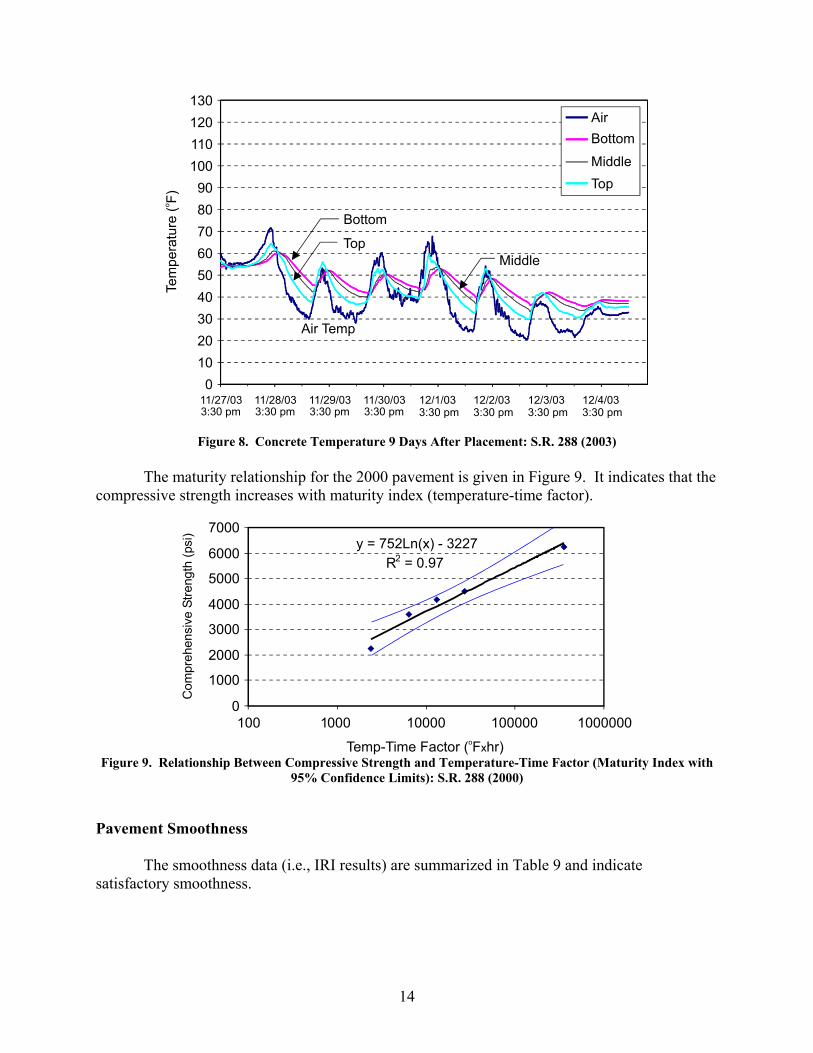
Pavement Temperature and Determination of Compressive Strength Using Temperature and Time Data The temperature data collected on S.R. 288 in 2000, 2001, and 2003 are shown in Figures 6, 7, and 8, respectively. The temperature data displayed in Figure 6 show that the concrete temperature peak occurs at an air temperature low point, demonstrating the marked effect of the heat of hydration. After this point, the daily concrete temperature peak gradually decreases following the air temperature. In 2001 (Figure 7), the difference between concrete temperature and air temperature is evident the first night, but after that the concrete temperature follows the air temperature in a pattern. The concrete temperature data for 2003 given in Figure 8 are for 9 days after placement. Again, the concrete temperature follows the air temperature in a pattern after the rate of hydration has slowed. Each year, the temperature differential in the concrete was usually less than 5 degrees but reached as high as 12 degrees.
13
11/17/0012:00 am
11/18/0012:00 am
11/19/0012:00 am
11/20/0012:00 am
11/21/0012:00 am
11/22/0012:00 am
11/23/0012:00 am
11/24/0012:00 am
Tem
pera
ture
(F)o
Air
Bottom
MiddleTop
0102030405060708090
100110120130
Air Temp
Top
Middle
Bottom
Figure 6. Concrete Temperature: S.R. 288 (2000)
10/2/014:16 pm
10/3/014:16 pm
10/4/014:16 pm
10/5/014:16 pm
10/6/014:16 pm
10/7/014:16 pm
10/8/014:16 pm
10/9/014:16 pm
10/10/014:16 pm
Tem
pera
ture
(F)o
Air
BottomMiddleTop
0102030405060708090
100110120130
Air Temp
Top
Middle
Bottom
Figure 7. Concrete Temperature: S.R. 288 (2001)
14
11/27/033:30 pm
11/28/033:30 pm
11/29/033:30 pm
11/30/033:30 pm
12/1/033:30 pm
12/2/033:30 pm
12/3/033:30 pm
12/4/033:30 pm
Tem
pera
ture
(F)o
Air
Bottom
MiddleTop
0102030405060708090
100110120130
Air Temp
TopMiddle
Bottom
Figure 8. Concrete Temperature 9 Days After Placement: S.R. 288 (2003) The maturity relationship for the 2000 pavement is given in Figure 9. It indicates that the compressive strength increases with maturity index (temperature-time factor).
y = 752Ln(x) - 3227 R 2 = 0.97
0
1000
2000
3000
4000
5000
6000
7000
100 1000 10000 100000 1000000
Com
preh
ensi
ve S
treng
th (p
si)
Temp-Time Factor ( F hr)o x Figure 9. Relationship Between Compressive Strength and Temperature-Time Factor (Maturity Index with
95% Confidence Limits): S.R. 288 (2000)
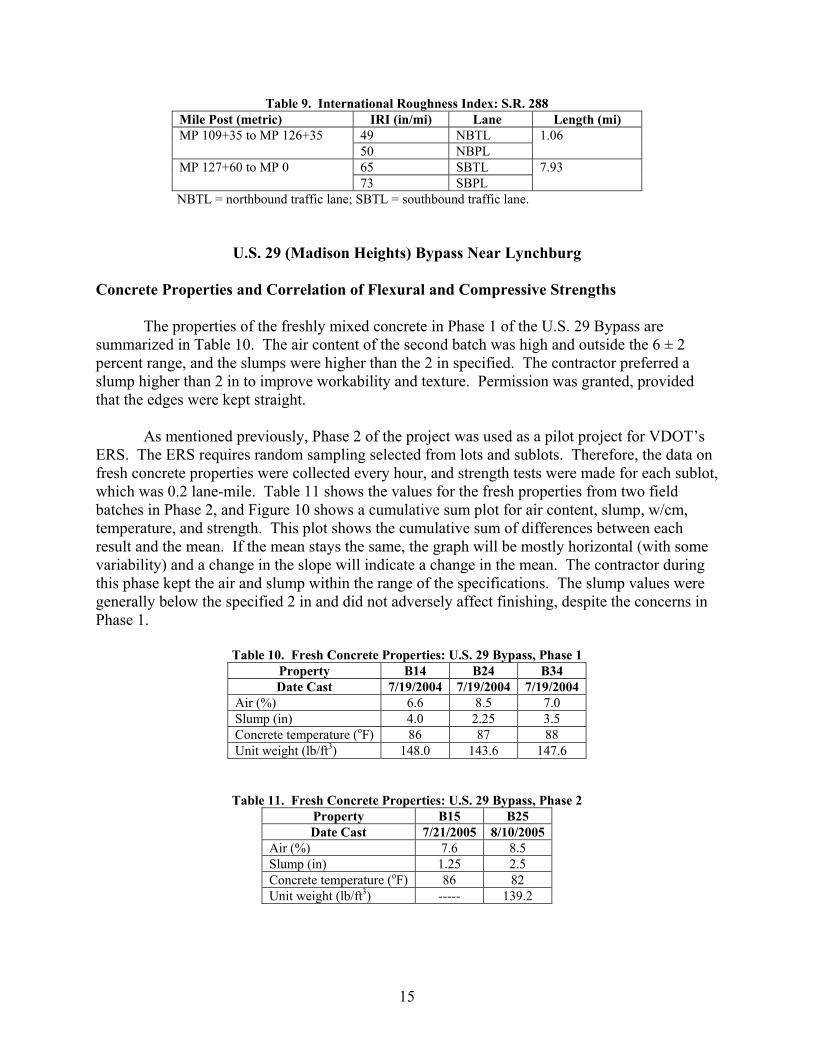
Pavement Smoothness The smoothness data (i.e., IRI results) are summarized in Table 9 and indicate satisfactory smoothness.
15
Table 9. International Roughness Index: S.R. 288 Mile Post (metric) IRI (in/mi) Lane Length (mi)
49 NBTL MP 109+35 to MP 126+35 50 NBPL
1.06
65 SBTL MP 127+60 to MP 0 73 SBPL
7.93
NBTL = northbound traffic lane; SBTL = southbound traffic lane.
U.S. 29 (Madison Heights) Bypass Near Lynchburg Concrete Properties and Correlation of Flexural and Compressive Strengths
The properties of the freshly mixed concrete in Phase 1 of the U.S. 29 Bypass are summarized in Table 10. The air content of the second batch was high and outside the 6 ± 2 percent range, and the slumps were higher than the 2 in specified. The contractor preferred a slump higher than 2 in to improve workability and texture. Permission was granted, provided that the edges were kept straight.
As mentioned previously, Phase 2 of the project was used as a pilot project for VDOT’s
ERS. The ERS requires random sampling selected from lots and sublots. Therefore, the data on fresh concrete properties were collected every hour, and strength tests were made for each sublot, which was 0.2 lane-mile. Table 11 shows the values for the fresh properties from two field batches in Phase 2, and Figure 10 shows a cumulative sum plot for air content, slump, w/cm, temperature, and strength. This plot shows the cumulative sum of differences between each result and the mean. If the mean stays the same, the graph will be mostly horizontal (with some variability) and a change in the slope will indicate a change in the mean. The contractor during this phase kept the air and slump within the range of the specifications. The slump values were generally below the specified 2 in and did not adversely affect finishing, despite the concerns in Phase 1.
Table 10. Fresh Concrete Properties: U.S. 29 Bypass, Phase 1
Property B14 B24 B34 Date Cast 7/19/2004 7/19/2004 7/19/2004
Air (%) 6.6 8.5 7.0 Slump (in) 4.0 2.25 3.5 Concrete temperature (oF) 86 87 88 Unit weight (lb/ft3) 148.0 143.6 147.6
Table 11. Fresh Concrete Properties: U.S. 29 Bypass, Phase 2 Property B15 B25 Date Cast 7/21/2005 8/10/2005
Air (%) 7.6 8.5 Slump (in) 1.25 2.5 Concrete temperature (oF) 86 82 Unit weight (lb/ft3) ----- 139.2

16
-200
-150
-100
-50
0
50
100
150
6/27 7/7 7/17 7/27 8/6 8/16 8/26Date
StrengthConcrete TempSlumpW/C RatioAir
Cum
ulat
ive
Sum
Lim
its
Slump
Strength
W/C Ratio
AirConcrete
Temp
Figure 10. Cumulative Sum Plot of Concrete Properties: U.S 29 Bypass, Phase 2 (2005)
Figure 11 shows the compressive versus flexural strength correlation and the 95 percent
confidence limits for Phase 1. Only a few data points were available and used for S.R. 288, and a linear regression analysis explained the relationship with a high correlation coefficient. The U.S. 29 Bypass Phase 1 project had many more samples to determine the correlation, and a logarithmic equation fit the data better. A value of 4,000 psi for compressive strength was selected to yield a flexural strength of 650 psi.
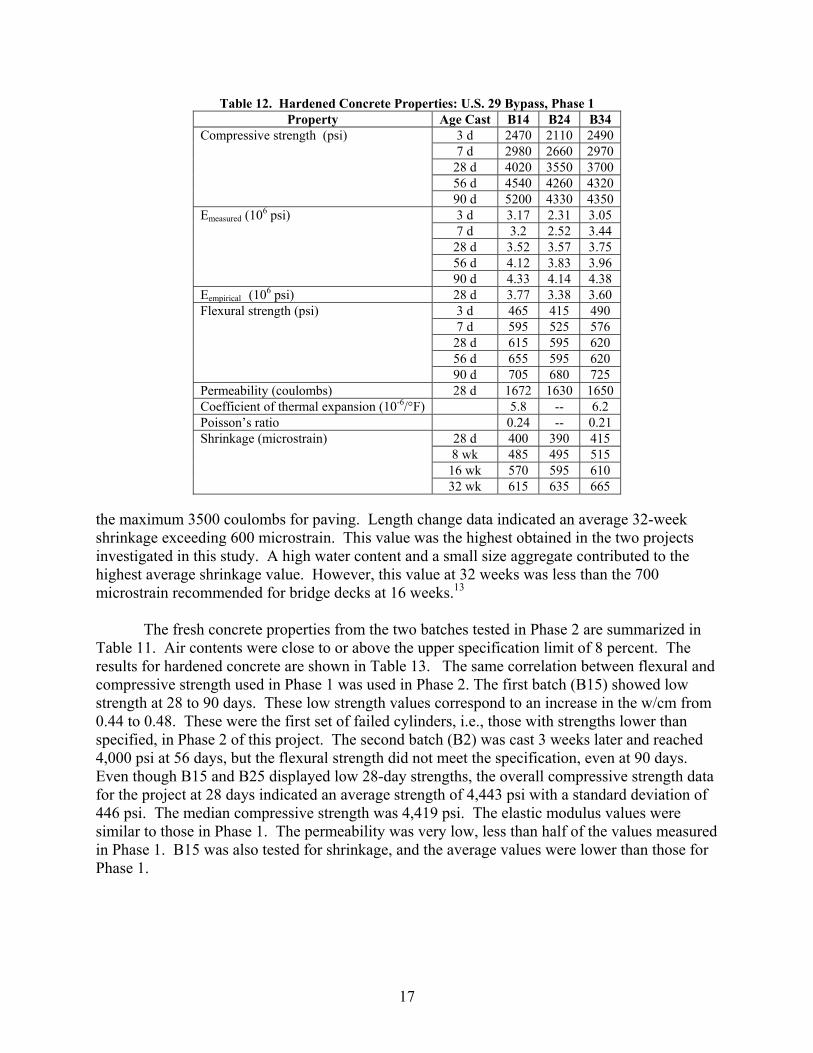
Table 12 shows the results from Phase 1 of the U.S. 29 Bypass paving. When the
samples were tested at 28 days, only one batch had reached the required compressive strength of 4,000 psi, and none had the specified flexural strength. At 56 days, all of the cylinders met the compressive strength requirements, but only one batch met the 650 psi flexural strength requirement. However, all cylinders and beams finally met the minimum flexural strength requirement at 90 days. At 28 days, the elastic modulus of each batch passed 3,500 ksi. At 90 days, the elastic moduli were 4,140 ksi or more. The permeability results were less than half of
Figure 11. Compressive Versus Flexural Strength: U.S. 29 Bypass, Phase 1 (2004)
17
Table 12. Hardened Concrete Properties: U.S. 29 Bypass, Phase 1 Property Age Cast B14 B24 B34
3 d 2470 2110 2490 7 d 2980 2660 2970
28 d 4020 3550 3700 56 d 4540 4260 4320
Compressive strength (psi)
90 d 5200 4330 4350 3 d 3.17 2.31 3.05 7 d 3.2 2.52 3.44
28 d 3.52 3.57 3.75 56 d 4.12 3.83 3.96
Emeasured (106 psi)
90 d 4.33 4.14 4.38 Eempirical (106 psi) 28 d 3.77 3.38 3.60
3 d 465 415 490 7 d 595 525 576
28 d 615 595 620 56 d 655 595 620
Flexural strength (psi)
90 d 705 680 725 Permeability (coulombs) 28 d 1672 1630 1650 Coefficient of thermal expansion (10-6/°F) 5.8 -- 6.2 Poisson’s ratio 0.24 -- 0.21
28 d 400 390 415 8 wk 485 495 515
16 wk 570 595 610
Shrinkage (microstrain)
32 wk 615 635 665
the maximum 3500 coulombs for paving. Length change data indicated an average 32-week shrinkage exceeding 600 microstrain. This value was the highest obtained in the two projects investigated in this study. A high water content and a small size aggregate contributed to the highest average shrinkage value. However, this value at 32 weeks was less than the 700 microstrain recommended for bridge decks at 16 weeks.13
The fresh concrete properties from the two batches tested in Phase 2 are summarized in Table 11. Air contents were close to or above the upper specification limit of 8 percent. The results for hardened concrete are shown in Table 13. The same correlation between flexural and compressive strength used in Phase 1 was used in Phase 2. The first batch (B15) showed low strength at 28 to 90 days. These low strength values correspond to an increase in the w/cm from 0.44 to 0.48. These were the first set of failed cylinders, i.e., those with strengths lower than specified, in Phase 2 of this project. The second batch (B2) was cast 3 weeks later and reached 4,000 psi at 56 days, but the flexural strength did not meet the specification, even at 90 days. Even though B15 and B25 displayed low 28-day strengths, the overall compressive strength data for the project at 28 days indicated an average strength of 4,443 psi with a standard deviation of 446 psi. The median compressive strength was 4,419 psi. The elastic modulus values were similar to those in Phase 1. The permeability was very low, less than half of the values measured in Phase 1. B15 was also tested for shrinkage, and the average values were lower than those for Phase 1.

18
Table 14 displays the results of the freeze-thaw test on beams from the U.S. 29 Bypass. For Phase 1, all three batches met the requirements with a high durability factor, low weight loss, and low surface rating with the exception of the third batch, whose weight loss was above but close to 7 percent. Freeze-thaw data for Phase 2 showed that the durability factors were high and the weight loss and surface rating very low, indicating very good resistance.
Table 13. Hardened Concrete Properties: U.S. 29 Bypass, Phase 2
Property
Age
B15 7/21/2005
B25 8/10//05
4 d 2540 --- 7 d 2510 3080
28 d 3440 3610 56 d 3910 4000
Compressive strength (psi)
90 d 3880 4690 4 d 510 --- 7 d 515 530
28 d 545 580 56 d 550 620
Flexural strength (psi)
90 d 595 575 4 d 3.26 --- 7 d 3.35 3.23
28 d 3.51 3.37 56 d 3.78 3.66
Emeasured (106 psi)
90 d 3.58 3.91 Eempirical (106 psi) 28 d 3.22 3.26 Permeability (coulombs) 28 d 706 938
28 d 320 --- 8 wk 395 --- 32 wk 525 ---
Shrinkage (microstrain)
64 wk 510 --- Coefficient of thermal expansion (10-6/°F) 5.5 5.4 Poisson’s ratio 0.18 0.20
Table 14. Freeze-Thaw Results for U.S. 29 Bypass, Phase 1
Batch Phase Weight Loss (%) Durability Factor Surface Rating B14 1 0.4 103 1.0 B24 1 0.2 102 1.2 B34 1 8.4 90 2.8 B15 2 0.0 100 0.4 B25 2 0.1 103 0.7
Pavement Temperature and Determination of Compressive Strength Using Temperature and Time Data The temperature data displayed in Figure 12 show the initial concrete temperatures for the U.S. 29 Bypass in 2004. The thermocouple closest to the surface was the first to reach a peak of 120°F, but the bottom thermocouple reached the highest temperature of 124°F shortly after the top and middle thermocouples reached their peak. After the first peak caused by the heat of hydration, the concrete temperatures stayed within a 10-degree differential, and this differential decreased as the rate of hydration slowed.

19
Figure 12. Concrete Temperature: U.S. 29 Bypass, Phase 1 (2004) Figure 13 shows the concrete temperatures in Phase 2, constructed in 2005. The heat of hydration caused a temperature peak of 130°F approximately 10 hr after the concrete was placed at a depth of 6 in, both touching the steel and not touching the steel. This figure shows that the temperature difference was negligible between the thermocouple touching the steel and the thermocouple not touching the steel at a 6-in depth. The concrete closest to the surface had the greatest variability because it had a greater dependence on the air temperature, whereas the concrete 2 in from the bottom showed the least variability and dependence on air temperature.
Figure 13. Concrete Temperature: U.S. 29 Bypass, Phase 2 (2005)
20
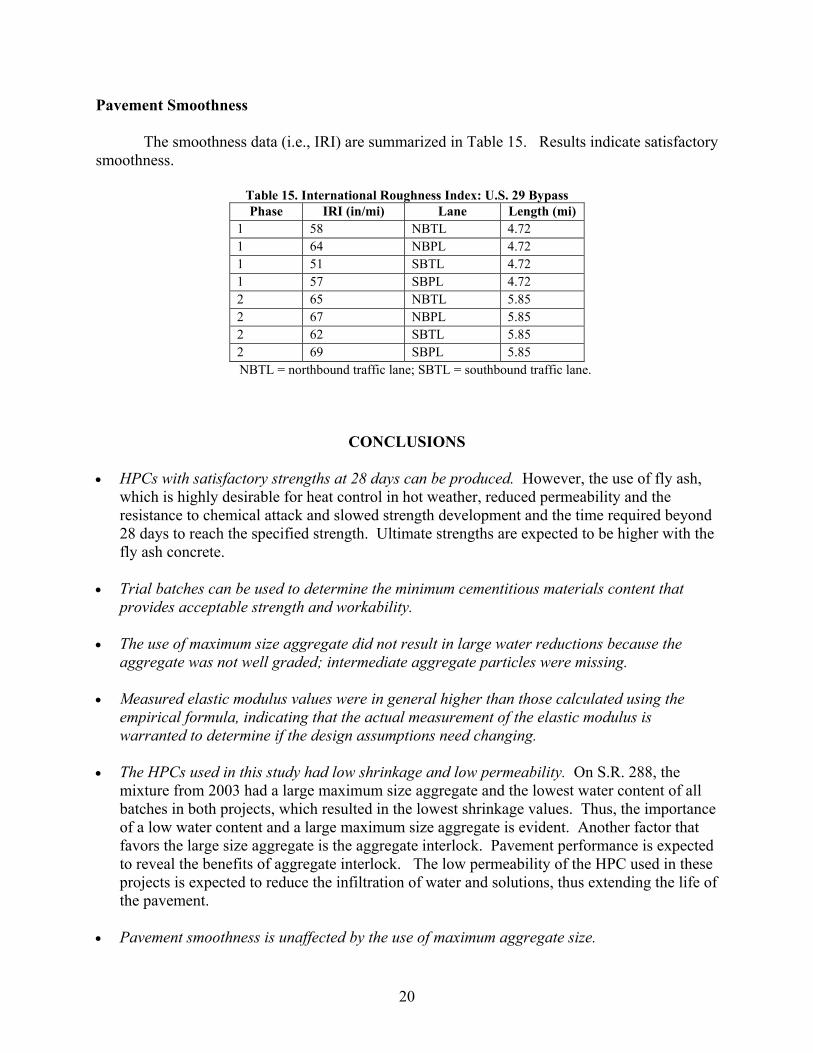
Pavement Smoothness The smoothness data (i.e., IRI) are summarized in Table 15. Results indicate satisfactory smoothness.
Table 15. International Roughness Index: U.S. 29 Bypass Phase IRI (in/mi) Lane Length (mi)
1 58 NBTL 4.72 1 64 NBPL 4.72 1 51 SBTL 4.72 1 57 SBPL 4.72 2 65 NBTL 5.85 2 67 NBPL 5.85 2 62 SBTL 5.85 2 69 SBPL 5.85
NBTL = northbound traffic lane; SBTL = southbound traffic lane.
CONCLUSIONS • HPCs with satisfactory strengths at 28 days can be produced. However, the use of fly ash,
which is highly desirable for heat control in hot weather, reduced permeability and the resistance to chemical attack and slowed strength development and the time required beyond 28 days to reach the specified strength. Ultimate strengths are expected to be higher with the fly ash concrete.
• Trial batches can be used to determine the minimum cementitious materials content that
provides acceptable strength and workability. • The use of maximum size aggregate did not result in large water reductions because the
aggregate was not well graded; intermediate aggregate particles were missing. • Measured elastic modulus values were in general higher than those calculated using the
empirical formula, indicating that the actual measurement of the elastic modulus is warranted to determine if the design assumptions need changing.
• The HPCs used in this study had low shrinkage and low permeability. On S.R. 288, the
mixture from 2003 had a large maximum size aggregate and the lowest water content of all batches in both projects, which resulted in the lowest shrinkage values. Thus, the importance of a low water content and a large maximum size aggregate is evident. Another factor that favors the large size aggregate is the aggregate interlock. Pavement performance is expected to reveal the benefits of aggregate interlock. The low permeability of the HPC used in these projects is expected to reduce the infiltration of water and solutions, thus extending the life of the pavement.
• Pavement smoothness is unaffected by the use of maximum aggregate size.

21
• Use of a test section before the start of the paving operation for an HPC CRCP enables the determination of the mixture characteristics for the particular equipment and the environment.
• Compressive strength can be used to determine the acceptance of an HPC CRCP after a
correlation with flexural strength is established.
• For desired performance, good construction practices including a level base, correct steel placement, proper consolidation, timely texturing, and effective curing are needed.
• Maturity testing can be used to estimate the strength of concrete in the pavement for opening
to traffic.
RECOMMENDATION
With regard to the concrete used in HPC CRCP projects, VDOT’s Materials Division and districts should employ the following practices:
• Consider specifying strength at ages above 28 days to encourage the use of a higher
percentage of pozzolanic material. • Specify the use of a large maximum size aggregate in combination with well-graded
aggregate to reduce the water content and minimize segregation. • Use trial batches to determine the minimum cementitious materials content that
provides acceptable strength and workability. • Use actual elastic modulus values to check and adjust the design of the pavement. • Use a test section before the start of the paving operation to determine if any changes
to the equipment and placement procedures are needed. • Use compressive strength for the acceptance of a project after a correlation with
flexural strength is established. • Permit maturity testing to estimate the strength of concrete in the pavement for
opening to traffic based on concrete curing time and temperature.
COSTS AND BENEFITS ASSESSMENT
HPCs with satisfactory strength, low permeability, and low shrinkage are expected to provide a long service life with minimal maintenance. If as little as a 10 percent increase in

22
service life were achieved, the savings would be in the millions of dollars over the life of an HPC CRCP.
The reduction in cementitious material content by 50 lb/yd3 would translate to a savings of about $400,000 for the two projects investigated.
The reduction in time for opening to traffic of new or reconstructed pavements through strength estimation by the maturity method and appropriate early strength mixtures can lead to an annual savings in road user costs close to $0.5 million per year (see the Appendix).
ACKNOWLEDGMENTS
The author thanks the Virginia Transportation Research Council and the Federal
Highway Administration for their support of this research project. The assistance of Mike Burton, Bill Ordel, and Andy Mills in the making and testing of specimens; Jackie Rosser in data evaluation and presentation; and Jim Gillespie in the cost/benefit calculation is acknowledged and appreciated. The invaluable assistance of VDOT’s Richmond and Lynchburg Districts and Central Office; the generous review by Bob Long, Trenton Clarke, Mohamed Elfino, Don French, Michael Sprinkel, and Kevin McGhee; and the preparation of the report by the VTRC Media Center are also appreciated.
REFERENCES
1. Pasko, T.J. Pavements: Past, Present, and Future. Concrete International, Vol. 20, No. 7, 1998, pp. 47-52.
2. Elfino, M., Ozyildirim, C., and Steele, R. CRCP in Virginia: Lessons Learned. In
Proceedings of the Seventh International Conference on Concrete Pavements, September 9-13, 2001, Orlando, Florida, pp. 451-465.
3. Zafar, I.R., and Snyder, M.B. Factors Affecting Deterioration of Transverse Cracking in
Jointed Reinforced Concrete Pavements. In Transportation Research Record No. 1307, pp. 162-168. Transportation Research Board, Washington, D.C., 1977.
4. Neville, A.M. Properties of Concrete. John Wiley and Sons, Inc., New York, 1996. 5. Mindess, S., Francis, J.F., and Darwin, D. Concrete. Second edition. Prentice-Hall, Inc.,
Upper Saddle River, N.J., 1981. 6. Zia, P., Leming, M.L., Ahmad, S.H., Schemmel, J.J., Elliott, R.P., and Naaman, A.E.
Mechanical Behavior of High Performance Concretes. Volume 1. Summary Report. SHRP-C-361. Strategic Highway Research Program, Washington, D.C., 1993.
23
7. Forster, W.P. Concrete Materials and Mix Design for Assuring Durable Pavements. In Proceedings of the 6th International Purdue Conference on Concrete Pavement Design and Materials for High Performance, Volume 1. Purdue University, Indianapolis, Ind., 1997, pp. 111-118.
8. ARA, Inc., ERES Consultants Division. Guide for the Mechanistic-Empirical Design of New
and Rehabilitated Pavement Structures. NCHRP 137-A. Transportation Research Board, Washington, D.C., 2004. www.trb.org/mepdg/. Accessed August 24, 2007.
9. Hughes, C.S., and Ozyildirim, C. End-Result Specification for Hydraulic Cement Concrete.
VTRC 05-R29. Virginia Transportation Research Council, Charlottesville, 2005. 10. Papagiannakis, A.T., and Gujarathi, M.S. Roughness Model Describing Heavy Vehicle-
Pavement Interaction. In Transportation Research Record No. 1501. Transportation Research Board, Washington, D.C., 1996, pp. 50-59.
11. Virginia Department of Transportation. Special Provision for Rideability. Richmond, November 5, 1998.
12. Virginia Department of Transportation. Special Provision for Rideability. Richmond, July
14, 2004. 13. Babaei, K., and Fouladgar, A. Solutions to Concrete Bridge Deck Cracking. Concrete
International, Vol. 19, No. 7, 1997, pp. 34-37.

24
25
APPENDIX
POTENTIAL ROAD USER COST SAVINGS The use of the maturity test can enable VDOT to open a new or reconstructed lane to traffic earlier than is now the case because the pavement can reach the minimum acceptable strength sooner. This would lead to an annual road user costs savings of approximately $0.5 million, as described here. When PCC pavement is placed, the pavement typically acquires sufficient strength to bear traffic after 14 days. This research showed that PCC pavements can be constructed with mixtures that acquire sufficient strength to bear traffic after 7 days, on average. This implies that a lane of pavement constructed or reconstructed may be opened to traffic 7 days sooner, on average, than a lane of pavement constructed using a typical PCC mix. Motorists who use the lane will realize a cost saving because the transitory presence of the work zone imposes additional time and fuel costs on them. The value of these additional costs depends heavily on the traffic volume on the road that is repaired.
Lane Closure and Its Impact The length of the activity area that is closed to traffic depends on the number of lane-miles of pavement that will be repaired or replaced during the closure. The lengths of the longitudinal buffer areas on either side of the activity area depend on the speed of the approaching traffic (Virginia Department of Transportation, Virginia Work Area Protection Manual, Richmond, 2005). Although the length of the lane closure may vary, on a highway with a design speed of 65 mph, a ratio of 1.5 mil of lane closure for each 1 mi of lane repair is plausible. The Highway Capacity Manual (Transportation Research Board, Highway Capacity Manual, Washington, D.C., 2000) recommends that the throughput capacity of two 12-ft-wide lanes designed to accommodate a free-flow speed of 65 mph be assumed to be 4,000 vehicles per hour (vph) if there are no shoulder obstructions or other adverse conditions. The HCM recommends that the capacity of the same facility with one lane closed to traffic be assumed to be 1,500 vph, with an approximate 10 mph reduction in mean speed. The reduction in mean speed implies that, whereas a vehicle at the free-flow speed would consume1 hr/65 mi, or 0.923 min/mi, a vehicle traversing a work zone in which one of the two lanes is closed will consume 1 hr/55 mi, or 1.091 min/mi. The travel time delay would, therefore, amount to 0.168 min/mi (0.0028 hr/mi) × the number of vehicles that pass × the length of the work zone, for as long as the work zone is in place. If the traffic volume were to exceed 1,500 vph at any time during the lane closure, the reduction in throughput capacity would cause queuing, an additional travel time delay.

26
Relevant Fraction of Virginia’s Highway System As of December 2006, Virginia’s interstate highway system included 183.21 centerline-miles of PCC pavement (about 732.84 lane-miles), 16.4% of the total interstate mileage. Daily vehicles miles traveled (VMT) per lane-mile averaged 9,301 on rural interstates and 22,958 on urban interstates. The Commonwealth’s primary system included 164.21 centerline-miles of PCC pavement (about 656.84 lane-miles), 5.6% of the total primary mileage. Daily VMT per lane-mile averaged 3,241 on non-interstate rural principal arterials and 7,231 on non-interstate urban principal arterials (T. Chowdhury, personal communication). If it is assumed that the system of non-interstate principal arterials roughly equates to the primary system, there were about 1,389.68 lane-miles of PCC pavement carrying an average VMT per lane-mile of 10,297 vehicles per day (vpd). Newly placed PCC pavement has an estimated life cycle of 30 years from placement to repair. Older PCC pavement has an estimated life cycle of 20 years. If it be assumed that on average 55.5872 lane-miles, or 1/25 of the PCC lane-miles in the Commonwealth, will be repaired or replaced every year, it follows from the work zone assumptions described that this repair work will mean the closure of 83.3808 lane-miles, each lane-mile being closed for as long as needed for the new PCC pavement to reach minimum strength.
Resulting Travel Time Savings The travel time cost occasioned by the repairs on the average mile of PCC pavement would be 1.5 mi × 0.0028 hr/mi × 10,297 vpd = 43.204152 veh-hr per day of closure per mile of repair. A reduction of the time from 14 days to 7 days would therefore save 7 days × 43.204152 veh-hr/day = 302.429 veh-hr/mi of lane closure. Given 83.3808 miles of lane closure per year (to repair or replace 55.5872 lane-miles of pavement), the travel time savings amount to 25,216.776 veh-hr per year. An estimate of the value of travel-time for a passenger car (Chui, M.K., and McFarland, W.F., The Value of Travel Time: New Estimates Developed Using a Speed-Choice Model, Texas Transportation Institute, College Station, 1986), updated to 2006 prices (Bureau of Labor Statistics, CPI Inflation Calculator, U.S. Department of Labor, Washington, D.C., 2006), puts the value of these savings at $19.21/hr. Therefore, the user cost savings achievable using a 7-day-to-traffic mix rather than a 14-day-to-traffic mix are estimated at $484,414 per year. This simple computation provides a quite conservative estimate of the potential savings. For one thing, some of the vehicles traveling on any given segment of road will be heavy trucks, whose travel time is valued at roughly twice that of a passenger car. For another thing, the peak-hour traffic volume on some individual PCC pavement segments may be high enough to cause queuing when one lane is closed; this would impose additional travel time delay costs plus additional fuel consumption costs.