research rundowns >intro > experimental design · research rundowns >intro >...
TRANSCRIPT
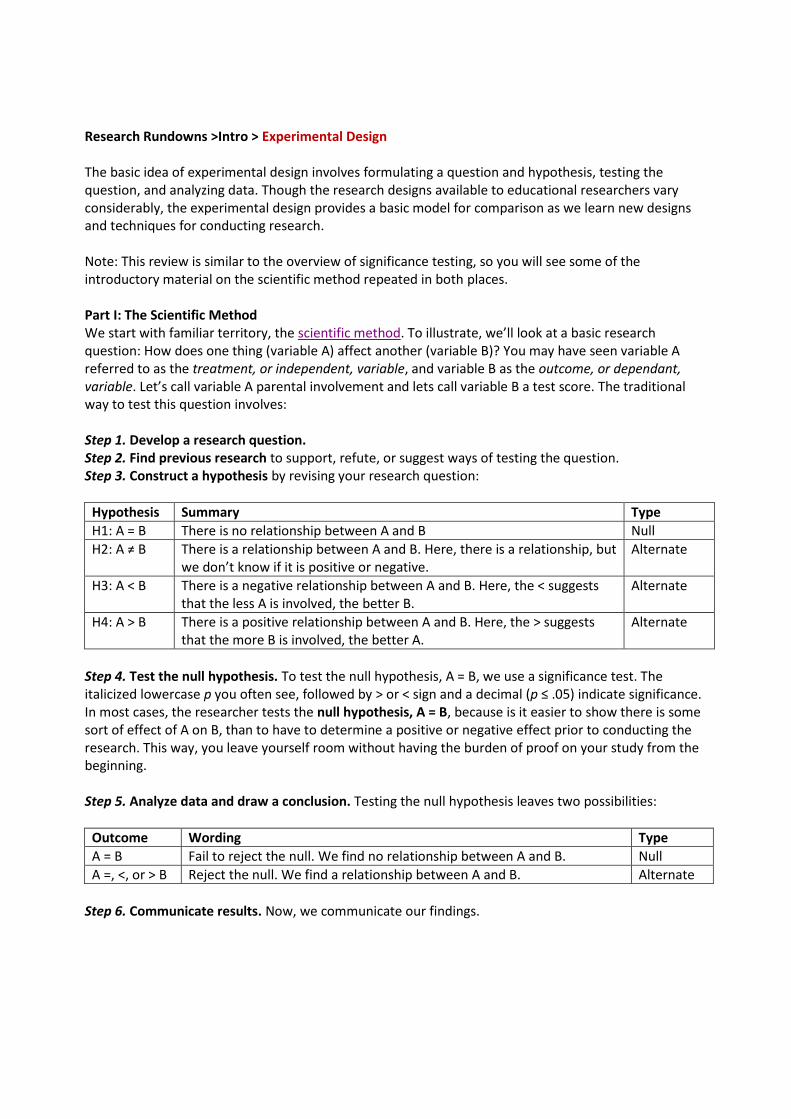
Research Rundowns >Intro > Experimental Design The basic idea of experimental design involves formulating a question and hypothesis, testing the question, and analyzing data. Though the research designs available to educational researchers vary considerably, the experimental design provides a basic model for comparison as we learn new designs and techniques for conducting research. Note: This review is similar to the overview of significance testing, so you will see some of the introductory material on the scientific method repeated in both places. Part I: The Scientific Method We start with familiar territory, the scientific method. To illustrate, we’ll look at a basic research question: How does one thing (variable A) affect another (variable B)? You may have seen variable A referred to as the treatment, or independent, variable, and variable B as the outcome, or dependant, variable. Let’s call variable A parental involvement and lets call variable B a test score. The traditional way to test this question involves: Step 1. Develop a research question. Step 2. Find previous research to support, refute, or suggest ways of testing the question. Step 3. Construct a hypothesis by revising your research question:
Hypothesis Summary Type H1: A = B There is no relationship between A and B Null H2: A ≠ B There is a relationship between A and B. Here, there is a relationship, but
we don’t know if it is positive or negative. Alternate
H3: A < B There is a negative relationship between A and B. Here, the < suggests that the less A is involved, the better B.
Alternate
H4: A > B There is a positive relationship between A and B. Here, the > suggests that the more B is involved, the better A.
Alternate
Step 4. Test the null hypothesis. To test the null hypothesis, A = B, we use a significance test. The italicized lowercase p you often see, followed by > or < sign and a decimal (p ≤ .05) indicate significance. In most cases, the researcher tests the null hypothesis, A = B, because is it easier to show there is some sort of effect of A on B, than to have to determine a positive or negative effect prior to conducting the research. This way, you leave yourself room without having the burden of proof on your study from the beginning. Step 5. Analyze data and draw a conclusion. Testing the null hypothesis leaves two possibilities:
Outcome Wording Type A = B Fail to reject the null. We find no relationship between A and B. Null A =, <, or > B Reject the null. We find a relationship between A and B. Alternate
Step 6. Communicate results. Now, we communicate our findings.

Part II: Control One of the most important concepts to understand when about learning research methods is control. Control differentiates experimental from all other types of research. Recall the previous example of parental involvement (the treatment, or independent, variable) affecting test score (the outcome, or dependant, variable). As educational researchers, we know that many other things (extraneous variables) affect a student’s test-taking ability. Some of these might include how much the student studied for the test, IQ, test anxiety, etc. We could spend hours thinking of effects. That’s where control comes in. If the researcher could control for all these variables, which are extraneous to what he or she really wants to know about (parental involvement), the researcher could make a prediction about the effects of A on B. As you have seen, however, its not that simple when working with people. In a pure experimental design, the researcher can control for all factors related to the outcome. In other words, we can image it possible to have students in our study who were exactly alike except for level of parent involvement. Then, we could say that parental involvement affected test scores. Since we have to control many things, social science research can never be experimental (well, maybe with clones. . .). Thus, the example we’ve been using is quasi-experimental, which acknowledges that we will try to control for as many extraneous variables as we can, but acknowledge that that is virtually impossible in experimental research. Part III: Control vs Experimental Group Finally, you may see research groups defined as control group vs. experimental group. The control group will not receive a treatment. The experimental group will receive a treatment. We can’t use the previous example, because it is likely (and perhaps slightly unethical when considering possible psychological effects on children) to assign students to a parental involvement group (control) versus no parental involvement group (treatment). To try another example, let’s say you teach the same lesson in the same day to two different groups of students. You want to know if letting the students work individually (the traditional method) is more effective than letting them work in teams for learning biology. In this case, individual work is the control, while teams work is the treatment. We can then test for differences between groups using the following null hypothesis: H1: individual work = group work.

Research Rundowns >Intro > Introduction to Educational Research Introduction to Educational Research As a student, teacher, or administrator, consider how many times you have heard, “evidence-based practice” or “according to the research.” It seems that every new idea in education is research-based, but what does that really mean? This overview is a summary of important concepts and considerations related to research in education. What is Educational Research? A cyclical process of steps that typically begins with identifying a research problem or issue of study. It then involves reviewing the literature, specifying a purpose for the study, collecting and analyzing data, and forming an interpretation of information. This process culminates in a report, disseminated to audiences, that is evaluated and used in the educational community. (Creswell, 2002) In less comprehensive terms, educational research is an organized approach to asking, answering, and effectively reporting a question. Why Educational Research? Educators need to be consumers (and producers) of research. Creswell (2002) notes the following reasons, describing the various purposes of educational research:
1. Improve Practice Research can suggest ways of improving practice that have been verified with many applications and by many different types of people, which is difficult for practitioners.
2. Add to Knowledge Research can add to what we know about how people learn and what we can do help facilitate the learning process.
3. Address Gaps in Knowledge Research can address areas in which little is know, like perhaps the effects of online versus traditional classroom learning.
4. Expand Knowledge Research can allow us to extend what we know in ways we never conceived.
5. Replicate Knowledge Research can act as a test to verify previous findings.
6. Add Voices of Individuals to Knowledge Research can add an important perspective for different learning types. Much of the educational research prior to the Eighties is based on able, white, middle-to-upper class males. This is certainly not reflective of our increasingly heterogeneous students, and research helps revise theory and practice to reflect different student needs.
These are only a few of the many reasons research is important, particularly to educators. In an increasingly data-driven society, it is vital that educators know how to locate, find, and interpret research on their own. Further, educators need to be able to conduct quality research to examine issues within their own contexts.

What are the Basic Types of Research? Briefly, get used to using the following words: quantitative, qualitative, network analysis, and mixed methods. We will review each on this site, but for now, consider these brief descriptions:
1. Quantitative Research (QUANT)–descriptive and inferential statistics. This type of research design is best for “What?” questions.
2. Qualitative Research (QUAL)– descriptive and thematic analysis. This type of research design is best for “How?” and “Why?” questions.
3. Mixed Methods (MIXED)–integrated, synthesis, and multi-method approaches. This type of research design is good for any questions you can think of, particularly those that can’t be answer easily with numbers alone. Consider the “best” way to evaluate student achievement, for example.
How is Research Distinguished? The final emphasis point in this brief introduction is fundamental your understanding as a soon-to-be consumer/producer of research. Where most introductory students struggle is in distinguishing primary and secondary sources. We’ll return to this later, but to be sure we are clear from the beginning. . . Empirical research implies that the study is original and stresses systematic observation. Journal articles and other types of peer-reviewed sources (such as academic conference papers) are the main venue for empirical research. These first publications of empirical research are also referred to as primary sources. In academic settings, you are generally only to use primary sources. Your best source for journal articles is a research database. If nothing else, you can visually tell that periodicals, such as newspapers, magazines, online weekly reports (such as Education Week), or even text books, dictionaries, and encyclopedias (like Wikipedia) are much different. The usual tip is that these types of publications have advertisements, where journal articles generally do not. These are all secondary sources. You might see references to research, but the actual report is in a journal article, as above. You are generally not to use secondary sources. This chart will help.

Research Rundowns >Intro > Writing Research Questions This review is a collection of views and advice on composing research questions from problem statements. It mostly reads as a list of tips and suggestions. A research question is the fundamental core of a research project, study, or review of literature. It focuses the study, determines the methodology, and guides all stages of inquiry, analysis, and reporting. The research question begins with a research problem, an issue someone would like to know more about or a situation that needs to be changed or addressed, such as:
Areas of concern Conditions that could be improved Difficulties that need to be eliminated Questions seeking answers
A research problem leads to a hypothesis (H) and/or research question (RQ) Questions should in some way. . .
Be worth investigating Contribute knowledge & value to the field Improve educational practice Improve the human condition
Characteristics of a good research question:
The question is feasible. The question is clear. The question is significant. The question is ethical.
From Research Problem to Research Questions and Purpose Step 1. Draft a research question/hypothesis. Example: What effects did 9/11/01 have on the future plans of students who were high school seniors at the time of the terrorist attacks? Example (measurable) Questions: Did seniors consider enlisting in the military as a result of the attacks?, Did seniors consider colleges closer to home as a result? Step 2. Draft a purpose statement. Example: The purpose of this study is to determine the effects of the 9/11/01 tragedy on the future plans of high school seniors. Step 3. Revise and rewrite the research question/hypothesis. Example: What is the association between 9/11/01 and future plans of high school seniors? Step 4. Revise and rewrite the research question/hypothesis. Example: Purpose Statement (Declarative): The purpose of this study is to explore the association between 9/11/01 and future plans of high school seniors.

Operationalize Notice that the above research question suggested an association or a relationship. When composing your own, it is helpful to determine which variables you would like to understand, and then word your question in such a way as to suggest how you will test your question. This is called operationalizing, referring to the actions, processes, or operations used to measure or identify variables. Finally, you will want to be specific about whom you are studying. Using my example above, “students” is not specific, so I might revise to public high school seniors in the Midwest. Expanding Simple Research Questions You can expand your question by introducing additional variables or characteristics. We call these connecting, mediating, or moderating variables. Example: What is the relationship between 9/11/01 and enlisting in the military? Variables I might introduce to expand the question include:
Demographics (gender/age/ethnicity/religious preference) Geographic location Parent’s educational level Role of parent Student’s /parent’s political affiliation
Common Errors
The Nobel Laureate (taking on your life’s work) Example: The Effects of 9/11/01 on K-12 students
The term paper (taking on too little) Example: How many high school seniors enlisted in the military prior to 2002 graduation?
The Black Hole (taking on too much) Example: The Effects of 9/11/01 on High School Seniors
A Few Good Wording Tips*. . . 1. When a relationship is expected among a certain type of subject, reference the population. Example: Among young children, there is a positive relationship between level of psychomotor coordination and degree of self-esteem. 2. Make RQs and Hs as specific and succinct as possible. OK: Administrators who provide wellness programs for their employees project positive effectiveness. Better: Administrators who provide wellness programs for their employees receive higher employee ratings on selected leadership qualities than administrators who do not provide wellness programs. 3. Avoid words or terms that do not add to the meaning of RQs and Hs. Rather than: Among elementary school teachers, those who are teaching in year-round schools will report having higher morale than those who are teaching in elementary schools that follow a more traditional school-year schedule. Try: Among elementary school teachers, those who teach in year-round schools have higher morale than those who teach on a traditional schedule.

A Few Good Wording Tips*. . ., cont. 4. Stick to what will be studied, not implications or your value judgments. Rather than: Religion is good for society. Try: Regular attendance at religious services is inversely associated with cheating behavior while taking classroom tests. 5. Name the variables in the order in which they occur or will be measured. Example. There is a positive relationship between College Board Scholastic Aptitude Test scores and first-semester grades earned in college. 6. Avoid the words significant or significance. 7. Avoid using the word “prove.” 8. Avoid using two different terms to refer to the same variable. *Note: “Wording” examples are attributed to Dr. Kathy Haywood, UMSL

Research Rundowns >Mixed Methods > Mixed Methods Research Designs The field of mixed methods has only been widely accepted for the last decade, though researchers have long been using multiple methods, just not calling them “mixed.” Mixed methods research takes advantage of using multiple ways to explore a research problem. Basic Characteristics
� Design can be based on either or both perspectives. � Research problems can become research questions and/or hypotheses based on prior literature,
knowledge, experience, or the research process. � Sample sizes vary based on methods used. � Data collection can involve any technique available to researchers. � Interpretation is continual and can influence stages in the research process.
Why Use Mixed Methods? The simple answer is to overcome the limitations of a single design. A detailed answer involves:
� To explain and interpret. � To explore a phenomenon. � To develop and test a new instrument. � To serve a theoretical perspective. � To complement the strengths of a single design. � To overcome the weaknesses of a single design. � To address a question at different levels. � To address a theoretical perspective at different levels.
What are some strengths?
� Can be easy to describe and to report. � Can be useful when unexpected results arise from a prior study. � Can help generalize, to a degree, qualitative data. � Helpful in designing and validating an instrument. � Can position research in a transformative framework.
What are some weaknesses?
� Time required. � Resolving discrepancies between different types of data. � Some designs generate unequal evidence. � Can be difficult to decide when to proceed in sequential designs. � Little guidance on transformative methods.

Methodologist John Creswell suggested a systematic framework for approaching mixed methods research. His framework involves four decisions to consider and six strategies. Four Decisions for Mixed Method Designs (Creswell, 2003, p. 211)
1. What is the implementation sequence of data collection? 2. What method takes priority during data collection and analysis? 3. What does the integration stage of finding involve? 4. Will a theoretical perspective be used?
Six Mixed Methods Design Strategies (Creswell, 2003)
1. Sequential Explanatory � Characterized by: Collection and analysis of quantitative data followed by a collection
and analysis of qualitative data. � Purpose: To use qualitative results to assist in explaining and interpreting the findings of
a quantitative study.
2. Sequential Exploratory � Characterized by: An initial phase of qualitative data collection and analysis followed by
a phase of quantitative data collection and analysis. � Purpose: To explore a phenomenon. This strategy may also be useful when developing
and testing a new instrument
3. Sequential Transformative � Characterized by: Collection and analysis of either quantitative or qualitative data first.
The results are integrated in the interpretation phase. � Purpose: To employ the methods that best serve a theoretical perspective.
4. Concurrent Triangulation � Characterized by: Two or more methods used to confirm, cross-validate, or corroborate
findings within a study. Data collection is concurrent. � Purpose: Generally, both methods are used to overcome a weakness in using one
method with the strengths of another.
5. Concurrent Nested � Characterized by: A nested approach that gives priority to one of the methods and
guides the project, while another is embedded or “nested.” � Purpose: The purpose of the nested method is to address a different question than the
dominant or to seek information from different levels.
6. Concurrent Transformative � Characterized by: The use of a theoretical perspective reflected in the purpose or
research questions of the study to guide all methodological choices. � Purpose: To evaluate a theoretical perspective at different levels of analysis.

Research Rundowns >Qualitative Methods > Qualitative Coding & Analysis
This review is in the form of an abbreviated set of directions for initial coding and analysis. There are many ways to accomplish both actions. This approach assumes you are using interview data. For a more detailed treatment of these and related analysis concepts, click here. Interview Data (Identifying & Coding Themes) Open coding At this first level of coding, you are looking for distinct concepts and categories in the data, which will form the basic units of your analysis. In other words, you are breaking down the data into first level concepts, or master headings, and second-level categories, or subheadings. Researchers often use highlights to distinguish concepts and categories. For example, if interviewees consistently talk about teaching methods, each time an interviewee mentions teaching methods, or something related to a teaching method, you would use the same color highlight. Teaching methods would become a concept, and other things related (types, etc.) would become categories – all highlighted the same color. Use different colored highlights to distinguish each broad concept and category. What you should have at the end of this stage are transcripts with 3-5 different colors in lots of highlighted text. Transfer these into a brief outline, with concepts being main headings and categories being subheadings. Axial coding In open coding, you were focused primarily on the text to define concepts and categories. In axial coding, you are using your concepts and categories while re-reading the text to 1. Confirm that your concepts and categories accurately represent interview responses and, 2. Explore how your concepts and categories are related. To examine the latter, you might ask, What conditions caused or influenced concepts and categories? What is/was the social/political context? or What are the associated effects or consequences?
For example, if one of your concepts is Adaptive Teaching, and two of your categories are tutoring and group projects, an axial code might be a phrase like “our principal encourages different teaching methods.” This discusses the context of the concept and/or categories, and suggests that you may need a new category labeled “supportive environment.” Axial coding is merely a more directed approach at looking at the data, to help make sure that you have identified all important aspects. Have your highlights ready for revision/addition.
Create a table Transfer final concepts and categories into a data table, such as this one (Aulls, 2004). Note how the researcher listed the major categories, then explained them after the table. This is a very effective way to organize results and/or discussion in a research paper. Here is an excellent comprehensive guide (think desk reference) to creating data displays for qualitative research. Note: Be patient. This appears to be a quick process, but it should not be. After you are satisfied with your coding procedures, I suggest submitting your table to an expert for review, or perhaps even one of the participants (if interviewing) to promote validity.
Research Rundowns >Qualitative Methods > Qualitative Research Design This review provides an overview of qualitative methods and designs using examples of research. Note that qualitative researchers frequently employ several methods in a single study. Basic Qualitative Research Characteristics
1. Design is generally based on a social constructivism perspective. 2. Research problems become research questions based on prior research or experience. 3. Sample sizes can be as small as one. 4. Data collection involves interview, observation, and/or archival (content) data. 5. Interpretation is based on a combination of researcher perspective and data collected.
Keywords
Transcribing is the process of converting audio or video data to text for analysis. Coding is the process of reviewing notes and discovering common “themes.” Themes describe the patterns/phenomenon as results.
Overview of Methods 1. Interview (Individual, focus groups) What is the difference between an interview and a survey? Primarily, open-ended questions differentiate the two. Qualitative researchers are concerned with making inference based on perspective, so it is extremely important to get as much data as possible for later analysis. Therefore, researchers spend a considerable amount of time designing interview questions. Interviews are designed to generate participant perspectives about ideas, opinions, and experiences. 2. Observation (Individual, group, location) How is data derived from an observation? The researcher may use a variety of methods for observing, including taking general notes, using checklists, or time-and-motion logs. The considerable time it takes for even a short observation deters many researchers from using this method. Also, the researcher risks his or her interpretation when taking notes, which is accepted by qualitative researchers, but meets resistance from post-positivists. Observations are designed to generate data on activities and behaviors, and are generally more focused on setting than other methods. 3. Document Analysis (Content analysis of written data) What types of documents do qualitative researchers analyze? Virtually anything that supports the question asked. Print media has long been a staple data source for qualitative researchers, but electronic media (email, blogs, user Web pages, and even social network profiles) have extended the data qualitative researchers can collect and analyze. The greatest challenge offered by document analysis can be sifting through all of the data to make general observations.
A Few Qualitative Research Designs 1. Biographical Study A biographical study is often the first design type that comes to mind for most people. For example, consider O’Brien’s John F. Kennedy: A Biography. The author takes a collection of archival documents (interviews, speeches, and other writings) and various media (pictures, audio, and video footage) to present a comprehensive story of JFK. In the general sense, a biographical study is considered an exhaustive account of a life experience; however, just as some studies are limited to single aspects of a phenomenon, the focus of a biographical study can be much narrower. The film Madame Curie is an example. Crawford studies the film from a biographical perspective to present the reader with an examination of how all aspects of a film (director’s perspective, actors, camera angles, historical setting) work to present a biography. Read the introduction and scan the text to get a feel for this perspective. 2. Phenomenology Your first step should be to take this word apart – phenomenon refers to an occurrence or experience, logical refers to a path toward understanding. So, we have a occurrence and a path (let’s go with an individual’s experience), which leads to a way of looking at the phenomenon from an individual’s point of view. The reactions, perceptions, and feelings of an individual (or group of individuals) as she/he experienced an event are principally important to the phenomenologist looking to understand an event beyond purely quantitative details. Gaston-Gayles, et al.’s (2005) look at how the civil rights era changed the role of college administrators is a good example. The authors interview men and women who were administrators during that time to identify how the profession changed as a result. 3. Grounded Theory In a grounded theory study, interpretations are continually derived from raw data. A keyword to remember is emergent. The story emerges from the data. Often, researchers will begin with a broad topic, then use qualitative methods to gather information that defines (or further refines) a research question. For example, a teacher might want to know what effects the implementation of a dress code might have on discipline. Instead of formulating specific questions, a grounded theorist would begin by interviewing students, parents, and/or teachers, and perhaps asking students to write an essay about their thoughts on a dress code. The researcher would then follow the process of developing themes from reading the text by coding specific examples (using a highlighter, maybe) of where respondents mentioned common things. Resistance might be a common pattern emerging from the text, which may then become a topic for further analysis. A grounded theory study is dynamic, in that it can be continually revised throughout nearly all phases of the study. You can imagine that this would frustrate a quantitative researcher. However, remember that perspective is centrally important to the qualitative researcher. While the end result of a grounded theory study is to generate some broad themes, the researcher is not making an attempt to generalize the study in the same, objective way characteristic of quantitative research. Here is a link to a grounded theory article on student leadership. 4. Ethnography Those with sociology or anthropology backgrounds will be most familiar with this design. Ethnography focuses on meaning, largely through direct field observation. Researchers generally (though not always) become part of a culture that they wish to study, then present a picture of that culture through the “eyes” of its members. One of the most famous ethnographers is Jane Goodall, who studied chimpanzees by living among them in their native East African habitat.

5. Case Study A case study is an in-depth analysis of people, events, and relationships, bounded by some unifying factor. An example is principal leadership in middle schools. Important aspects include not only the principal’s behaviors and views on leadership, but also the perceptions of those who interact with her/him, the context of the school, outside constituents, comparison to other principals, and other quantitative “variables.” Often, you may see a case study labeled “ethnographic case study” which generally refers to a more comprehensive study focused on a person or group of people, as the above example. Case studies do not have to be people-focused, however, as a case study to look at a program might be conducted to see how it accomplishes its intended outcomes. For example, the Department of Education might conduct a case study on a curricular implementation in a school district – examining how new curriculum moves from development to implementation to outcomes at each level of interaction (developer, school leadership, teacher, student).

Research Rundowns >Quantitative Methods > Correlation A synonym for correlation is relationship. Therefore, the question: “Among 7th graders, what is the correlation between math and science scores?” is the same as asking, “Among 7th graders, what is the relationship between math and science scores?” Why would this be useful? Depending on your research question, you may want to know if two things are related (or not). This relation, statistically, is referred to as a linear trend. For example, as one value (in this case, math score) improves, the other (in this case, science score) also improves. This would be a positive correlation. This and other possibilities are listed below: Variable 1 Action Variable 2 Action Type of Correlation
Math Score ↑ Science Score ↑ Positive; as Math Score improves, Science Score improves
Math Score ↓ Science Score ↓ Positive; as Math Score declines, Science Score declines
Math Score ↑ Science Score ↓ Negative; as Math Score improves, Science Score declines
Math Score ↓ Science Score ↑ Negative; as Math Score declines, Science Score improves
The following graphs show the same relationships:
The above graphs show lines with perfect relationships. Imagine individual dots for each student along a line representing the intersection between a math and a science score. Using the perfect positive relationship example, a student scoring a 90 in math would also score a 90 in science. Repeat this in increments of 10 and you get a perfect relationship. Alternately, using the perfect negative relationship example, a student scoring a 90 in math would have a 60 in science.
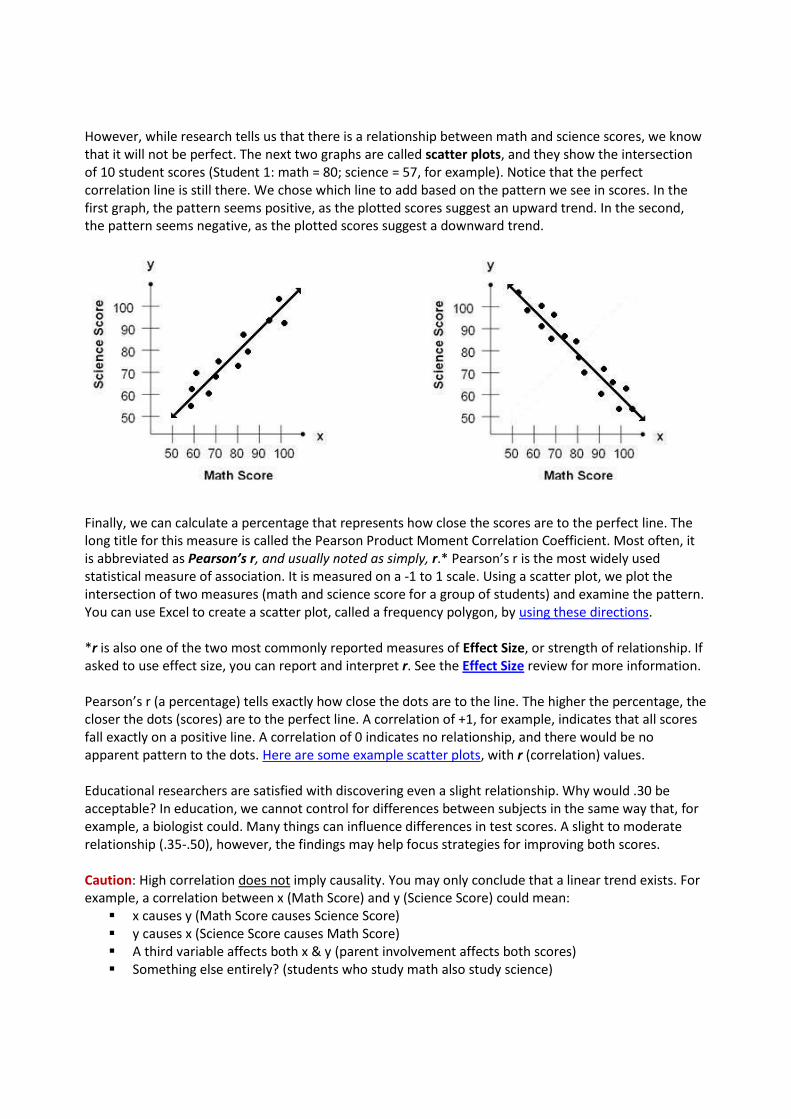
However, while research tells us that there is a relationship between math and science scores, we know that it will not be perfect. The next two graphs are called scatter plots, and they show the intersection of 10 student scores (Student 1: math = 80; science = 57, for example). Notice that the perfect correlation line is still there. We chose which line to add based on the pattern we see in scores. In the first graph, the pattern seems positive, as the plotted scores suggest an upward trend. In the second, the pattern seems negative, as the plotted scores suggest a downward trend.
Finally, we can calculate a percentage that represents how close the scores are to the perfect line. The long title for this measure is called the Pearson Product Moment Correlation Coefficient. Most often, it is abbreviated as Pearson’s r, and usually noted as simply, r.* Pearson’s r is the most widely used statistical measure of association. It is measured on a -1 to 1 scale. Using a scatter plot, we plot the intersection of two measures (math and science score for a group of students) and examine the pattern. You can use Excel to create a scatter plot, called a frequency polygon, by using these directions. *r is also one of the two most commonly reported measures of Effect Size, or strength of relationship. If asked to use effect size, you can report and interpret r. See the Effect Size review for more information. Pearson’s r (a percentage) tells exactly how close the dots are to the line. The higher the percentage, the closer the dots (scores) are to the perfect line. A correlation of +1, for example, indicates that all scores fall exactly on a positive line. A correlation of 0 indicates no relationship, and there would be no apparent pattern to the dots. Here are some example scatter plots, with r (correlation) values. Educational researchers are satisfied with discovering even a slight relationship. Why would .30 be acceptable? In education, we cannot control for differences between subjects in the same way that, for example, a biologist could. Many things can influence differences in test scores. A slight to moderate relationship (.35-.50), however, the findings may help focus strategies for improving both scores. Caution: High correlation does not imply causality. You may only conclude that a linear trend exists. For example, a correlation between x (Math Score) and y (Science Score) could mean:
� x causes y (Math Score causes Science Score) � y causes x (Science Score causes Math Score) � A third variable affects both x & y (parent involvement affects both scores) � Something else entirely? (students who study math also study science)

Computing and Reporting Correlations The superintendent would like to know what relationships exist between different domains of CRCT (Criterion-Referenced Competency Test) scores. She has provided your principal with the included Excel file, “CorrelationData,” which is a random sample of 7th grade students. The students were chosen randomly in such a way that all 7th grade students had an equal chance at being selected. Since the principal knows you are taking a research course, she has asked you to complete the assignment. You use Excel to calculate correlation coefficients and to create a scatter plot. Here are some sample data. You can copy and paste into Excel. Using Excel, calculate correlation coefficients (directions below) for all pairs of scores. By looking at the table that follows, you can see which scores you need to calculate.
1. Click on an empty cell that you want the correlation to be displayed in. 2. Click Insert/Function (Excel 97/03) or Formulas/Insert Function (Excel 07) 3. In the Search box, type Correlation. Click “Go.” 4. Highlight CORREL. Click OK. 5. For “Array 1,” go back to the worksheet and highlight the first set of scores you wish to correlate
(click and drag). 6. Alternately, if you are more familiar with formula values you can use =CORREL(A4:A93,B4:B93)
for Reading and English. Put the pointer in “Array 2,” and repeat for the second sample you wish to correlate (click and drag). Click OK.
7. Excel returns the correlation coefficient between the two samples. 8. Repeat as necessary for all pairs of scores.
Delete the example values in the table below and use it to display your results. This type of table is also called a correlation matrix. Notice that only half of the values are filled in. This is because data in a correlation matrix are inverse, so that Reading/English is the same as English/Reading. Table 1. Seventh Grade CRCT Score Correlations
Reading
English
Math
Science
Social S.
Reading
1.00
English
0.87
1.00
Math
0.71
0.76
1.00
Science
0.74
0.67
0.71
1.00
Social S.
0.80
0.65
0.98
0.65
1.00

Research Rundowns >Quantitative Methods > Effect Size As you read educational research, you’ll encounter t-test (t) and ANOVA (F) statistics frequently. Hopefully, you understand the basics of (statistical) significance testing as related to the null hypothesis and p values, to help you interpret results. If not, see the Significance Testing (t-test, chi square, ANOVA) review for more information. In this class, we’ll consider the difference between statistical significance and practical significance, using a concept called effect size. The “Significance” Issue Most statistical measures used in educational research rely on some type of statistical significance measure to authenticate results. Recall that the one thing t-tests, ANOVA, chi square, and even correlations have in common is that interpretation relies on a p value (p = statistical significance). That is why the easy way to interpret significance studies is to look at the direction of the sign (<, =, or >) to understand if the results are statistically meaningful. While most published statistical reports include information on significance, such measures can cause problems for practical interpretation. For example, a significance test does not tell the size of a difference between two measures (practical significance), nor can it easily be compared across studies. To account for this, the American Psychological Association (APA) recommended all published statistical reports also include effect size (for example, see the APA 5th edition manual section, 1.10: Results section). Further guidance is summed by Neill (2008):
1. When there is no interest in generalizing (e.g., we are only interested in the results for the sample), there is no need for significance testing. In these situations, effect sizes are sufficient and suitable.
2. When examining effects using small sample sizes, significance testing can be misleading. Contrary to popular opinion, statistical significance is not a direct indicator of size of effect, but rather it is a function of sample size, effect size, and p level.
3. When examining effects using large samples, significant testing can be misleading because even small or trivial effects are likely to produce statistically significant results.
What is Effect Size? The simple definition of effect size is the magnitude, or size, of an effect. Statistical significance (e.g., p < .05) tells us there was a difference between two groups or more based on some treatment or sorting variable. For example, using a t-test, we could evaluate whether the discussion or lecture method is better for teaching reading to 7th graders: For six weeks, we use the discussion method to teach reading to Class A, while using the lecture method to teach reading to Class B. At the end of the six weeks, both groups take the same test. The discussion group (Class A), averages 92, while the lecture group (Class B) averages 84. Recalling the Significance Testing review, we would calculate standard deviation and evaluate the results using a t-test. The results give us a value for p, telling us (if p <.05, for example) the discussion method is superior for teaching reading to 7th graders. What this fails to tell us is the magnitude of the difference. In other words, how much more effective was the discussion method? To answer this question, we standardize the difference and compare it to 0.

Effect Size (Cohen’s d, r) & Standard Deviation Effect size is a standard measure that can be calculated from any number of statistical outputs. One type of effect size, the standardized mean effect, expresses the mean difference between two groups in standard deviation units. Typically, you’ll see this reported as Cohen’s d, or simply referred to as “d.” Though the values calculated for effect size are generally low, they share the same range as standard deviation (-3.0 to 3.0), so can be quite large. Interpretation depends on the research question. The meaning of effect size varies by context, but the standard interpretation offered by Cohen (1988) is: .8 = large (8/10 of a standard deviation unit) .5 = moderate (1/2 of a standard deviation) .2 = small (1/5 of a standard deviation) *Recall from the Correlation review r can be interpreted as an effect size using the same guidelines. If you are comparing groups, you don’t need to calculate Cohen’s d. If you are asked for effect size, it is r. Calculating Effect Size (Cohen’s d) Option 1 (on your own) Given mean (m) and standard deviation (sd), you can calculate effect size (d). The formula is:
d =
m1 (group or treatment 1) – m2 (group or treatment 2) [pooled] sd
Where pooled sd is *√sd1+sd2/2] Option 2 (using an online calculator) If you have mean and standard deviation already, or the results from a t-test, you can use an online calculator, such as this one. When using the calculator, be sure to only use Cohen’s d when you are comparing groups. If you are working with correlations, you don’t need d. Report and interpret r. Wording Results The basic format for group comparison is to provide: population (N), mean (M) and standard deviation (SD) for both samples, the statistical value (t or F), degrees freedom (df), significance (p), and confidence interval (CI.95). Follow this information with a sentence about effect size (see red, below). Effect size example 1 (using a t-test): p ≤ .05, or Significant Results Among 7th graders in Lowndes County Schools taking the CRCT reading exam (N = 336), there was a statistically significant difference between the two teaching teams, team 1 (M = 818.92, SD = 16.11) and team 2 (M = 828.28, SD = 14.09), t(98) = 3.09, p ≤ .05, CI.95 -15.37, -3.35. Therefore, we reject the null hypothesis that there is no difference in reading scores between teaching teams 1 and 2. Further, Cohen’s effect size value (d = .62) suggested a moderate to high practical significance. Effect size example 2 (using a t-test): p ≥ .05, or Not Significant Results Among 7th graders in Lowndes County Schools taking the CRCT science exam (N = 336), there was no statistically significant difference between female students (M = 834.00, SD = 32.81) and male students (841.08, SD = 28.76), t(98) = 1.15 p ≥ .05, CI.95 -19.32, 5.16. Therefore, we fail to reject the null hypothesis that there is no difference in science scores between females and males. Further, Cohen’s effect size value (d = .09) suggested low practical significance.

Research Rundowns >Quantitative Methods > Instrumentation, Validity, Reliability Part I: The Instrument Instrument is the generic term that researchers use for a measurement device (survey, test, questionnaire, etc.). To help distinguish between instrument and instrumentation, consider that the instrument is the device and instrumentation is the course of action (the process of developing, testing, and using the device). Instruments fall into two broad categories, researcher-completed and subject-completed, distinguished by those instruments that researchers administer versus those that are completed by participants. Researchers chose which type of instrument, or instruments, to use based on the research question. Examples are listed below: Researcher-completed Instruments Subject-completed Instruments
Rating scales Questionnaires Interview schedules/guides Self-checklists Tally sheets Attitude scales Flowcharts Personality inventories Performance checklists Achievement/aptitude tests Time-and-motion logs Projective devices Observation forms Sociometric devices Usability Usability refers to the ease with which an instrument can be administered, interpreted by the participant, and scored/interpreted by the researcher. Example usability problems include:
1. Students are asked to rate a lesson immediately after class, but there are only a few minutes before the next class begins (problem with administration).
2. Students are asked to keep self-checklists of their after school activities, but the directions are complicated and the item descriptions confusing (problem with interpretation).
3. Teachers are asked about their attitudes regarding school policy, but some questions are worded poorly which results in low completion rates (problem with scoring/interpretation).
Validity and reliability concerns (discussed below) will help alleviate usability issues. For now, we can identify five usability considerations:
1. How long will it take to administer? 2. Are the directions clear? 3. How easy is it to score? 4. Do equivalent forms exist? 5. Have any problems been reported by others who used it?
It is best to use an existing instrument, one that has been developed and tested numerous times, such as can be found in the Mental Measurements Yearbook. We will turn to why next.

Part II: Validity Validity is the extent to which an instrument measures what it is supposed to measure and performs as it is designed to perform. It is rare, if nearly impossible, that an instrument be 100% valid, so validity is generally measured in degrees. As a process, validation involves collecting and analyzing data to assess the accuracy of an instrument. There are numerous statistical tests and measures to assess the validity of quantitative instruments, which generally involves pilot testing. The remainder of this discussion focuses on external validity and content validity. External validity is the extent to which the results of a study can be generalized from a sample to a population. Establishing eternal validity for an instrument, then, follows directly from sampling. Recall that a sample should be an accurate representation of a population, because the total population may not be available. An instrument that is externally valid helps obtain population generalizability, or the degree to which a sample represents the population. Content validity refers to the appropriateness of the content of an instrument. In other words, do the measures (questions, observation logs, etc.) accurately assess what you want to know? This is particularly important with achievement tests. Consider that a test developer wants to maximize the validity of a unit test for 7th grade mathematics. This would involve taking representative questions from each of the sections of the unit and evaluating them against the desired outcomes. Part III: Reliability Reliability can be thought of as consistency. Does the instrument consistently measure what it is intended to measure? It is not possible to calculate reliability; however, there are four general estimators that you may encounter in reading research:
1. Inter-Rater/Observer Reliability: The degree to which different raters/observers give consistent answers or estimates.
2. Test-Retest Reliability: The consistency of a measure evaluated over time. 3. Parallel-Forms Reliability: The reliability of two tests constructed the same way, from the same content. 4. Internal Consistency Reliability: The consistency of results across items, often measured with
Cronbach's Alpha. Relating Reliability and Validity Reliability is directly related to the validity of the measure. There are several important principles. First, a test can be considered reliable, but not valid. Consider the SAT, used as a predictor of success in college. It is a reliable test (high scores relate to high GPA), though only a moderately valid indicator of success (due to the lack of structured environment – class attendance, parent-regulated study, and sleeping habits – each holistically related to success). Second, validity is more important than reliability. Using the above example, college admissions may consider the SAT a reliable test, but not necessarily a valid measure of other quantities colleges seek, such as leadership capability, altruism, and civic involvement. The combination of these aspects, alongside the SAT, is a more valid measure of the applicant’s potential for graduation, later social involvement, and generosity (alumni giving) toward the alma mater. Finally, the most useful instrument is both valid and reliable. Proponents of the SAT argue that it is both. It is a moderately reliable predictor of future success and a moderately valid measure of a student’s knowledge in Mathematics, Critical Reading, and Writing.

Part IV: Validity and Reliability in Qualitative Research Thus far, we have discussed Instrumentation as related to mostly quantitative measurement. Establishing validity and reliability in qualitative research can be less precise, though participant/member checks, peer evaluation (another researcher checks the researcher’s inferences based on the instrument (Denzin & Lincoln, 2005), and multiple methods (keyword: triangulation), are convincingly used. Some qualitative researchers reject the concept of validity due to the constructivist viewpoint that reality is unique to the individual, and cannot be generalized. These researchers argue for a different standard for judging research quality. For a more complete discussion of trustworthiness, see Lincoln and Guba’s (1985) chapter.

Research Rundowns >Quantitative Methods > Mean & Standard Deviation Descriptive statistics summarize data. To aid in comprehension, we can reorganize scores into lists. For example, we might put test scores in order, so that we can quickly see the lowest and highest scores in a group (this is called an ordinal variable, by the way. You can learn more about scales of measure here). After arranging data, we can determine frequencies, which are the basis of such descriptive measures as mean, median, mode, range, and standard deviation. Let’s walk through an example using test scores:
Student Score Score Score Frequency
1 100 ←1. As you can see, these scores are not in a user-friendly, interpretable format. 2. The first thing to do is order them.→
100 ←3. Now you’ve got an ordered list that much easier to interpret at first glance. 4. You can go a step further and put like numbers together.→
100 4
2 78 100 97 2
3 97 100 93 1
4 97 100 88 1
5 78 97 87 1
6 88 97 86 1
7 87 93 78 2
8 100 88 ↑ 5. This is called a
Frequency
Distribution.
9 86 87
10 93 86
11 95 78
12 92 78
Now, we can take those same scores and get some more useful information. Recall that Mean is arithmetic average of the scores, calculated by adding all the scores and dividing by the total number of scores. Excel will perform this function for you using the command =AVERAGE(Number:Number). Now we know the average score, but maybe knowing the range would help. Recall that Range is the difference between the highest and lowest scores in a distribution, calculated by taking the lowest score from the highest. You can calculate this one by simple subtraction. Understanding range may lead you to wonder how most students scored. In other words, you know what they scored, but maybe you want to know about where the majority of student scores fell – in other words, the variance of scores. Standard Deviation introduces two important things, The Normal Curve (shown below) and the 68/95/99.7 Rule. We’ll return to the rule soon.
The Normal Curve tells us that numerical data will be distributed in a pattern around an average (the center line). Standard deviation is considered the most useful index of variability. It is a single number that tells us the variability, or spread, of a distribution (group of scores). Standard Deviation is calculated by:

Step 1. Determine the mean. Step 2. Take the mean from the score. Step 3. Square that number. Step 4. Take the square root of the total of squared scores. Excel will perform this function for you using the command =STDEV(Number:Number).
Student Score Standard Deviation
1 100 1. Click on an empty cell and type in the formula for Standard Deviation.→ 2. The formula returns the number, in this case, 8.399134, which we round to 8.40.
2 78
3 97
4 97
5 78 =STDEV(A2:A13)
6 88
7 87
8 100
9 86
10 93
11 95
12 92
That number, 8.40, is 1 unit of standard deviation. The 68/95/99.7 Rule tells us that standard deviations can be converted to percentages, so that:
� 68% of scores fall within 1 SD of the mean. � 95% of all scores fall within 2 SD of the mean. � 99.7% of all scores fall within 3 SD of the mean.
For the visual learners, you can put those percentages directly into the standard curve:
Since 1 SD in our example is 8.40, and we know that the mean is 92, we can be sure that 68% of the scores on this test fall between 83.6 and 100.4. To get this range, I simply added 1 SD (8.40) to the mean (92), and took 1 SD away from the mean. Sometimes you see SD referred to as +/- in a journal article, which is indicating the same thing. Note: Quick thinkers will notice that since 50% of the sample is below the mean (to the left of 0 on the curve), you can add percentages. In other words, 84.13% of the scores fall 1SD above the mean. To get that number, I took the percentages between -3 SD and 0 on the left, (which equal 50), then added the percentage from 0 to 1 SD on the right (which is .3413).

Research Rundowns >Quantitative Methods > Significance Testing (t-tests) In this review, we’ll look at significance testing, using mostly the t-test as a guide. As you read educational research, you’ll encounter t-test and ANOVA statistics frequently. Part I reviews the basics of significance testing as related to the null hypothesis and p values. Part II shows you how to conduct a t-test, using an online calculator. Part III deal s with interpreting t-test results. Part IV is about reporting t-test results in both text and table formats and concludes with a guide to interpreting confidence intervals. What is Statistical Significance? The terms “significance level” or “level of significance” refer to the likelihood that the random sample you choose (for example, test scores) is not representative of the population. The lower the significance level, the more confident you can be in replicating your results. Significance levels most commonly used in educational research are the .05 and .01 levels. If it helps, think of .05 as another way of saying 95/100 times that you sample from the population, you will get this result. Similarly, .01 suggests that 99/100 times that you sample from the population, you will get the same result. These numbers and signs (more on that later) come from Significance Testing, which begins with the Null Hypothesis. Part I: The Null Hypothesis We start by revisiting familiar territory, the scientific method. We’ll start with a basic research question: How does variable A affect variable B? The traditional way to test this question involves: Step 1. Develop a research question. Step 2. Find previous research to support, refute, or suggest ways of testing the question. Step 3. Construct a hypothesis by revising your research question:
Hypothesis Summary Type H1: A = B There is no relationship between A and B Null H2: A ≠ B There is a relationship between A and B. Here, there is a relationship, but
we don’t know if it is positive or negative. Alternate
H3: A < B There is a negative relationship between A and B. Here, the < suggests that the less A is involved, the better B.
Alternate
H4: A > B There is a positive relationship between A and B. Here, the > suggests that the more B is involved, the better A.
Alternate
Step 4. Test the null hypothesis. To test the null hypothesis, A = B, we use a significance test. The italicized lowercase p you often see, followed by > or < sign and a decimal (p ≤ .05) indicate significance. In most cases, the researcher tests the null hypothesis, A = B, because is it easier to show there is some sort of effect of A on B, than to have to determine a positive or negative effect prior to conducting the research. This way, you leave yourself room without having the burden of proof on your study from the beginning. Step 5. Analyze data and draw a conclusion. Testing the null hypothesis leaves two possibilities:
Outcome Wording Type A = B Fail to reject the null. We find no relationship between A and B. Null A =, <, or > B Reject the null. We find a relationship between A and B. Alternate
Step 6. Communicate results. See Wording results, below.

Part II: Conducting a t-test (for Independent Means) So how do we test a null hypothesis? One way is with a t-test. A t-test asks the question, “Is the difference between the means of two samples different (significant) enough to say that some other characteristic (teaching method, teacher, gender, etc.) could have caused it?” To conduct a t-test using an online calculator, complete the following steps: Step 1. Compose the Research Question. Step 2. Compose a Null and an Alternative Hypothesis. Step 3. Obtain two random samples of at least 30, preferably 50, from each group. Step 4. Conduct a t-test:
Go to http://www.graphpad.com/quickcalcs/ttest1.cfm For #1, check “Enter mean, SD and N.” For #2, label your groups and enter data. You will need to have mean and SD. N is group size. For #3, check “Unpaired t test.” For #4, click “Calculate now.”
Step 5. Interpret the results (see below). Step 6. Report results in text or table format (see below).
Get p from “P value and statistical significance:” Note that this is the actual value. Get the confidence interval from “Confidence interval:” Get the t and df values from “Intermediate values used in calculations:” Get Mean, and SD from “Review your data.”
Part III. Interpreting a t-test (Understanding the Numbers)
t tells you a t-test was used. (98) tells you the degrees of freedom (the sample - # of tests performed). 3.09 is the “t statistic” – the result of the calculation. p ≤ .05 is the probability of getting the observed score from the sample groups. This the most
important part of this output to you. If this sign It means all these things p ≥ .05 likely to be a result of chance (same as saying A = B) difference is not significant null is correct “fail to reject the null” There is no relationship between A and B. If this sign It means all these things p ≤ .05 not likely to be a result of chance (same as saying A ≠ B) difference is significant null is incorrect “reject the null” There is a relationship between A and B.
Note: We acknowledge that the average scores are different. With a t-test we are deciding if that difference is significant (is it due to sampling error or something else?).

Understanding the Confidence Interval (CI) The Confidence Interval (CI) of a mean is a region within which a score (like mean test score) may be said to fall with a certain amount of “confidence.” The CI uses sample size and standard deviation to generate a lower and upper number that you can be 95% sure will include any sample you take from a set of data. Consider Georgia’s AYP measure, the CRCT. For a science CRCT score, we take several samples and compare the different means. After a few calculations, we could determine something like. . .the average difference (mean) between samples is -7.5, with a 95% CI of -22.08 to 6.72. In other words, among all students’ science CRCT scores, 95 out of 100 times we take group samples for comparison (for example by year, or gender, etc.), one of the groups, on average will be 7.5 points lower than the other group. We can be fairly certain that the difference in scores will be between -22.08 and 6.72 points. Part IV. Wording Results Wording Results in Text In text, the basic format is to report: population (N), mean (M) and standard deviation (SD) for both samples, t value, degrees freedom (df), significance (p), and confidence interval (CI.95)* . Example 1: p ≤ .05, or Significant Results Among 7th graders in Lowndes County Schools taking the CRCT reading exam (N = 336), there was a statistically significant difference between the two teaching teams, team 1 (M = 818.92, SD = 16.11) and team 2 (M = 828.28, SD = 14.09), t(98) = 3.09, p ≤ .05, CI.95 -15.37, -3.35. Therefore, we reject the null hypothesis that there is no difference in reading scores between teaching teams 1 and 2. Example 2: p ≥ .05, or Not Significant Results Among 7th graders in Lowndes County Schools taking the CRCT science exam (N = 336), there was no statistically significant difference between female students (M = 834.00, SD = 32.81) and male students (841.08, SD = 28.76), t(98) = 1.15 p ≥ .05, CI.95 -19.32, 5.16. Therefore, we fail to reject the null hypothesis that there is no difference in science scores between females and males. Wording Results in APA Table Format Table 1. Comparison of CRCT 7th Grade Science Scores by Gender
Note: On the Web site, this appears blocked and should not be. See the .pdf for the correct format.
Gender
n
Mean
SD
t
df
p
95% Confidence Interval
Female
50
834.00
32.81
–
–
–
–
Male
50
841.08
28.76
–
–
–
–
Total
100
837.54
30.90
1.14
98
.2540
-19.32 – 5.16

Research Rundowns >Writing > Literature Reviews > What is a Literature Review? What is a Literature Review? A literature review is not an annotated bibliography in which you summarize briefly each article that you have reviewed. While a summary of what you have read is contained within the literature review, it goes well beyond merely summarizing studies. It focuses on a specific topic of interest to you and includes a critical analysis of the relationship among different works, and relating this research to your work. It may be written as a stand-alone paper or to provide a theoretical framework and rationale for a research study (such as a thesis or dissertation). (Mongan-Rallis, 2006) Seven Simple Rules Here are seven simple rules that cover the most common literature review mistakes, in no particular order. Refer to these rules before submitting any written work:
1. Do not write in the first person (no I or we). 2. Single space after all punctuation. This is APA format. If you double space by habit, use Find and
Replace in Microsoft Word to replace double spaces with single spaces. 3. Pay attention to capitalization on the References page. Only capitalize the first letters of titles
and after punctuation. Capitalize and italicize all first letters in journal titles. 4. Limit direct quotations to two, total, in the review and always include author, year, and page
numbers for direct quotations. For example, (Galvan, 2006, p. 76). Paraphrase! 5. Everything is double-spaced – not single, not triple, double. Everything is double-spaced. 6. Use subheadings for the different points in your review. 7. Only use peer-reviewed sources. Newspapers and magazines do not count as peer-review
references. Here is a quick guide to telling the difference. Guidelines for Writing a Literature Review The following guidelines are modeled after the similarly titled guidelines by Dr. Helen Mongan-Rallis. Both forms are based on Galvan’s (2006) text, and sections of this guide have been quoted directly or with only minor revision from both sources. This adaptation is organized to reflect a three-part approach I found effective for pacing students. I typically recommend six-eight weeks for writing a first review. The three sections include the following: Steps 1-4: Finding Research (one-two weeks) Steps 5-6: Analyzing and Organizing Research (two-three weeks) Steps 7-9: Citing and Writing Research (three-four weeks, repeating 1-6 as needed) In addition to using this guide, you should also (a) locate and browse examples of literature reviews in your field to get a feel for what they are and how they are written and (b) read other writing guides to see different perspectives and approaches. Examples include:
1. Review of Literature: UW–Madison: The Writing Center. 2. How to. . .Write a Literature Review: UC–Santa Cruz: University Library. 3. Information Fluency: Literature Review: Washington & Lee: Leyburn Library.

Research Rundowns >Writing > Literature Reviews > Steps 1-4: Finding Research Guidelines for Writing a Literature Review: Steps 1-4: Finding Research Note: The following guidelines are modeled after the similarly titled guidelines by Dr. Helen Mongan-Rallis. Both forms are based on Galvan’s (2006) text, and sections of this guide have been quoted directly or with only minor revision from both sources. Step 1: Decide on a Topic You may write your literature review on a topic of your choice, ideally related to student achievement. It is common to revise, or even change, your topic after searching for literature. Step 2: Learn to Use ERIC. Search online databases, such as ERIC and Academic Search Premiere, for literature on your topic. Here is a link to information on using ERIC to locate research. Both databases contain links to a variety of information. However, not all of it is peer-reviewed. Here is a quick guide to telling the difference. One quick note on ERIC: You may not always have access to the full text of articles you find. In most cases, however, libraries can help you get you electronic copies. Step 3: Identify the Literature to Review. You may also search for literature sources using Google Scholar and FindArticles, though you must ensure that the articles you find are from peer-reviewed, academic journals. Here are some tips for identifying suitable literature and narrowing your search:
1. Start with a general descriptor from the database thesaurus or one that you know is already a well defined descriptor based on your prior knowledge of the field. You will need to experiment with different searches, such as limiting your search to descriptors that appear only in the document titles, or in both the document title and in the abstract.
2. Redefine your topic if needed. As you search you will quickly learn if the topic that you are reviewing is too broad. Try to narrow it to a specific area of interest within the broad area that you have chosen (remember: this is only an introductory literature review).
3. As part of your search, be sure to identify landmark or classic studies and theorists as these provide you with a framework/context for your study.
Step 4: Develop and Track a Search Strategy. When searching for literature, it is imperative to develop and track a search strategy. The following link is to an example of a helpful search strategy worksheet.

Research Rundowns >Writing > Literature Reviews > Steps 5-6: Analyzing and Organizing Guidelines for Writing a Literature Review: Steps 5-6: Analyzing and Organizing Note: The following guidelines are modeled after the similarly titled guidelines by Dr. Helen Mongan-Rallis. Both forms are based on Galvan’s (2006) text, and sections of this guide have been quoted directly or with only minor revision from both sources. Step 5: Analyze the Literature. Once you have identified and located the articles for your review, you need to analyze and organize them before you begin writing. The follow steps should help:
1. Overview the articles. Skim the articles to get an idea of the general purpose and content of the article (focus on the abstract, introduction and first few paragraphs, and the conclusion of each article. As you skim the articles, record the notes on each (see # 3).
2. Group the articles into categories (e.g. into topics and subtopics and chronologically within each subtopic). Begin to develop a subject level outline with what studies you’ve found. This will help you see what you may need to expand or limit.
3. Take notes. 1. Decide on the format in which you will take notes as you read the articles. You can do
this using a word processor, a data base program, an Excel spreadsheet, or the "old-fashioned" way of using note cards. Just be consistent.
2. Define key terms. Note differences in the ways key terms are defined. 3. Pay attention to numbers. Note key statistics that you may want to use in the
introduction to your review. 4. Select useful quotations that you may want to include. Important: If you copy the exact
words from an article, be sure to cite the page number. You will need this if you decide to use the quotation when you write your review (direct quotations must always be accompanied by page numbers in APA). To ensure that you have quoted accurately (and to save time in note taking), use Edit/Copy/Paste in Microsoft Word or Select/Copy Image (or Text, depending on version) to Clipboard in Adobe. Note: although you may collect a large number of quotations during the note taking phase of your review, when you write the review, use quotations very sparingly. A good rule to follow is to quote only when some key meaning would be lost in translation if you were to paraphrase the original author's words.
5. Note emphases, strengths, and weaknesses. Since different research studies focus on different aspects of the issue under study, each article that you read will have different emphases, strengths, and weaknesses. Your role as a reviewer is to evaluate what you read, so that your review is not a mere description of different articles, but rather a critical analysis that makes sense of the collection of articles that you are reviewing. Critique the research methodologies used in the studies, and distinguish between assertions (author/s opinion) and actual research findings.
6. Identify major trends or patterns. As you read a range of articles on your topic, you should make note of trends and patterns over time as reported in the literature. This step requires you to synthesize and make sense of what you read, since these patterns and trends may not be immediately obvious but become apparent to you after reviewing numerous articles. Your analysis can make generalizations across a majority of studies, but should also note inconsistencies.

7. Identify gaps in the literature, and reflect on why these might exist. This idea is based on the understanding/s that you have gained by reading literature on your topic. These gaps will be important to address as you plan and write your review.
8. Identify relationships among studies. Note relationships among studies, such as which led to subsequent research in the same area. You may notice that studies fall into distinct categories (that you see emerging or that are already discussed in the literature). Keep notes so that you can address these relationships in your review and discuss relevant studies using these categories as a framework.
9. Keep your review focused on your topic. Make sure that the articles you find are relevant and directly related to your topic. As you take notes, record which specific aspects of the article you are reading are applicable. If you are using an electronic form of note taking, you might note these descriptors in a separate field (e.g. in Microsoft Word using an outline format and filling in studies underneath each heading or in Excel have a separate column for each descriptor).
10. Evaluate your references for currency and coverage. Although you can always find more articles on your topic, you have to decide at what point you are finished with collecting new references so that you can begin writing. However, before you begin, you must evaluate your references list to ensure that it is up to date and has reported the most current work. Typically a review will cover the last five years, but should also refer to any landmark studies prior to this time if they have significance in shaping the direction of the field. If you include studies prior to the past five years that are not landmark studies, you should defend why you have chosen these rather than more current ones.
Step 6: Synthesize the Literature Prior to Writing the Review. Using your notes, develop a subject outline (a few main headings, with subheadings underneath) of your final review. The following are the key steps as outlined by Galvan (2006, pp. 71-79):
1. Consider your purpose before beginning to write. In the case of this introductory literature review, your initial purpose is to provide an overview of the topic that is of interest to you, demonstrating your understanding of key works and concepts. You are also developing skills in reviewing and writing, on which you will build in subsequent courses within your program. This literature review is not intended to comprehensively cover your topic, but should give you a basis for a more detailed future study.
2. Consider how you reassemble your notes. Plan how you will organize your findings into a unique analysis of the picture that you have captured in your notes. Important: A literature review is not series of annotations (like an annotated bibliography). Galvan (2006, p. 72) describes the difference between an annotated bibliography and a literature review as, “like describing trees when you really should be describing a forest. In the case of a literature review, you are really creating a new forest, which you will build by using the trees you found in the literature you read.”
3. Create a topic outline that traces your argument. For each topic, explain to the reader your line of argument; then explain and justify it. A few ways to organize topics include:
1. Differences among studies. 2. Obvious gaps or areas needing more research. 3. Relevant theories. 4. A discussion of how individual studies relate to and advance theory. 5. Conclusions and implications. 6. Specific directions for future research near the end of the review.

Research Rundowns >Writing > Literature Reviews > Steps 7-9: Citing and Writing Guidelines for Writing a Literature Review: Steps 7-9: Citing and Writing Note: The following guidelines are modeled after the similarly titled guidelines by Dr. Helen Mongan-Rallis. Both forms are based on Galvan’s (2006) text, and sections of this guide have been quoted directly or with only minor revision from both sources. Step 7: Review APA Guidelines. Read through the links provided below to become familiar with the common core elements of how to write in APA style. Be sure to check which edition you are writing in, 5th or 6th. Guidelines/help for both are included below. In particular, pay attention to general document guidelines (e.g. font, margins, and spacing), title page, abstract, body, text and References citations, and quotations:
1. Purdue OWL (Online Writing Lab): User-friendly 5th edition APA style guide. 2. APA Tutorial (the basics): The basics of APA Style (6th edition) 3. APA Tutorial (what’s new): What’s new in the 6th edition
Step 8: Write the Review (Galvan, 2006, pp. 81-90).
1. Identify the broad problem area, but avoid global statements. 2. Early in the review, indicate why the topic being reviewed is important. 3. Distinguish between research findings and other sources of information. 4. Indicate why certain studies are important. 5. If commenting on the timeliness of a topic, be specific in describing the time frame. 6. If citing a classic or landmark study or one that was replicated, identify it as such. 7. Justify comments such as, “no studies were found.” 8. Avoid long lists of nonspecific references. 9. If the results of previous studies are inconsistent or widely varying, cite them separately. 10. Cite all relevant references in text and in the References page.
Step 9: Develop a Coherent Essay (Galvan, 2006, pp. 91-96).
1. Provide an overview near the beginning of the review. 2. Near the beginning of a review, state explicitly what will and will not be covered. 3. Specify your research question and purpose/significance in the introduction. 4. Aim for a clear and cohesive essay that integrates the key details of the literature and
communicates your point of view. A literature is not a series of annotated articles. 5. Use subheadings and transitions to improve the flow of your paper. 6. Consider reviewing studies from different disciplines separately. 7. Write a conclusion for the end of the review. Since this review will be written to stand alone, the
conclusion needs to make clear how the material in the body of the review has supported the research topic stated in the introduction.
8. Check the flow of your argument for coherence. Final Note: For detailed treatment of any of these steps, I highly recommend you pick up Galvan’s (2006) text. I have not found it invaluable for teaching, but also as a personal reference guide. It is a very approachable step-by-step guide with useful checklists and literature review samples.

ResearchRundowns>Writing>WritingaResearchReport
Thisreviewcoversthebasicelementsofaresearchreport.Thisisageneralguideforwhatyouwillsee
injournalarticlesordissertations.Thisformatassumesamixedmethodsstudy,butyoucanleaveout
eitherquantitativeorqualitativesectionsifyouonlyusedasinglemethodology.
Thisreviewisdividedintosectionsforeasyreference.TherearefiveMAJORpartsofaResearchReport:
1. Introduction
2. ReviewofLiterature
3. Methods
4. Results
5. Discussion
Note:Asageneralguideforlength,theIntroduction,ReviewofLiterature,andMethodsshouldbe
about1/3ofyourpaper,Discussion1/3,thenResults1/3.
Section1:CoverSheet(APAformatcoversheet)optional,ifrequired.
Section2:Abstract(abasicsummaryofthereport,includingsample,treatment,design,results,and
implications)(≤150words)optional,ifrequired.
Section3:Introduction(1‐3paragraphs)
• Basicintroduction
• Supportivestatistics(canbefromperiodicals)
• StatementofPurpose
• StatementofSignificance
Section4:Researchquestion(s)orhypotheses
• Anoverallresearchquestion(optional)
• Aquantitative‐based(hypotheses)
• Aqualitative‐based(researchquestions)
Note:Youwillgenerallyhavemorethanone,especiallyifusinghypotheses.
Section5:ReviewofLiterature
▪ Shouldbeorganizedbysubheadings
▪ Shouldadequatelysupportyourstudyusingsupporting,related,and/orrefutingevidence
▪ Isasynthesis,notacollectionofindividualsummaries
Section6:Methods
▪ Procedure:Describedatagatheringorparticipantrecruitment,includingIRBapproval
▪ Sample:Describethesampleordataset,includingbasicdemographics
▪ Setting:Describethesetting,ifapplicable(generallyonlyinqualitativedesigns)
▪ Treatment:Ifapplicable,describe,indetail,howyouimplementedthetreatment
▪ Instrument:Describe,indetail,howyouimplementedtheinstrument;Describethereliability
andvalidityassociatedwiththeinstrument
▪ DataAnalysis:Describetypeofprocedure(t‐test,interviews,etc.)andsoftware(ifused)

Section7:Results
▪ RestateResearchQuestion1(Quantitative)
▪ Describeresults
▪ RestateResearchQuestion2(Qualitative)
▪ Describeresults
Section8:Discussion
▪ RestateOverallResearchQuestion
▪ Describehowtheresults,whentakentogether,answertheoverallquestion
▪ ***Describehowtheresultsconfirmorcontrasttheliteratureyoureviewed
Section9:Recommendations(optional,generallyrelatedtopractice)
Section10:Limitations
▪ Discuss,inseveralsentences,thelimitationsofthisstudy.
▪ ResearchDesign(overall,theninfoaboutthelimitationsofeachseparately)
▪ Sample
▪ Instrument/s
▪ Otherlimitations
Section11:Conclusion(Abriefclosingsummary)
Section12:References(APAformat)