research to production: biofuel workflows process...
TRANSCRIPT
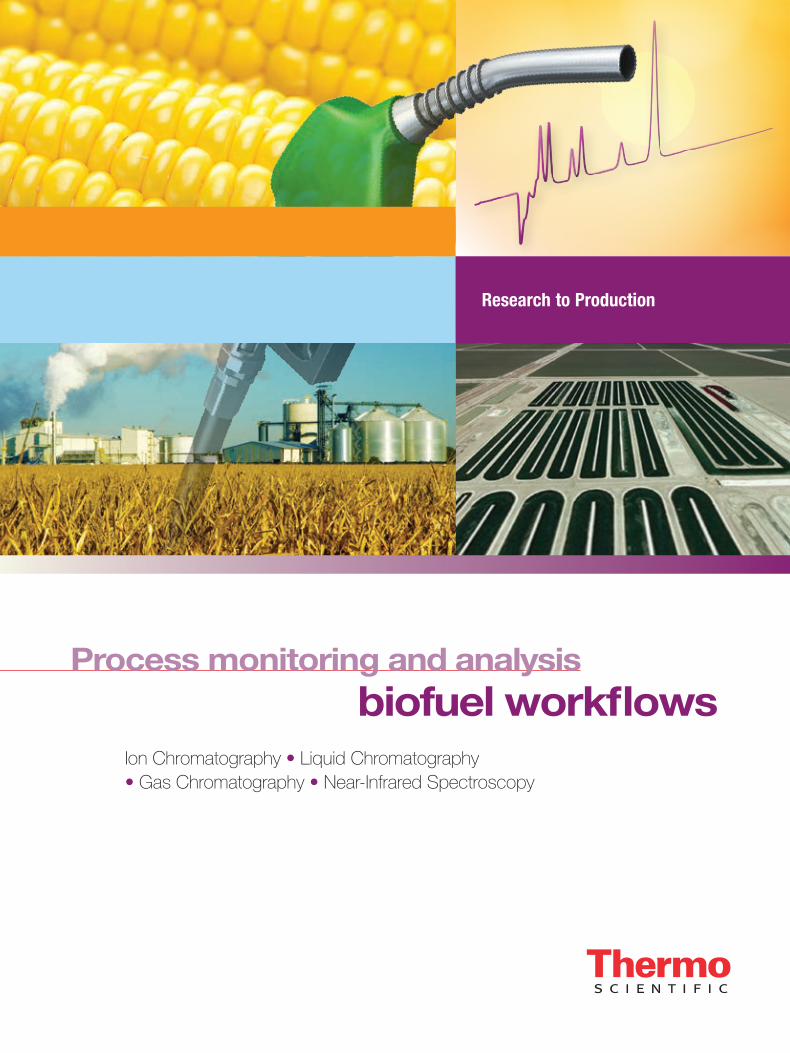
Process monitoring and analysis biofuel workflows
Ion Chromatography • Liquid Chromatography • Gas Chromatography • Near-Infrared Spectroscopy
Research to Production
Biofuel production the global challenge
Biofuel is defined as a solid, liquid, or gas fuel derived from biological
material. This broad-based class of biofuel compounds can be
separated into two categories.
Bioalcohol comes from crops such as corn, sugar cane, wheat, sorghum, and cellulosic plants
such as corn stover, wood, and grasses. With the exception of sorghum, these crops are not naturally
high in sugars. However, the grains are high in starch, and the rest of the plant is rich in cellulose and
hemicellulose. Making the cellulose more accessible to hydrolysis and solubilizing hemicelluloses sugars
is currently difficult and expensive. The analytical challenge is quantifying the diverse mixture of sugars
present in hemicellulose.
Biodiesel can be produced from plants that contain high amounts of oils, such as soybean, palm, or
jatropha. It can also be made using algae. Algae, a single or multicellular plant, can be the source of both
sugars for bioalcohol (such as ethanol and butanol) and oils for biodiesel where the need to quantify fatty
acid methyl esters (FAMEs) and trace contaminants are key to ensure final product quality.
There are Thermo Scientific™ solutions for every step of your workflow process. Whether the solutions
employ near-infrared (NIR) spectroscopy or ion (IC), liquid (LC), or gas chromatography (GC), we can
deliver critical information about your biofuel process in a timely manner with a choice of systems
and models to best suit your specific application requirements and budget.
Chromatography provides the capability to develop a detailed understanding of the chemical composition
and trace contaminant analysis for volatile and nonvolatile samples in every step of the process, while
NIR spectroscopy can be used to provide quick answers on feedstock composition on line for real-time
process monitoring or final product quality.
2
3
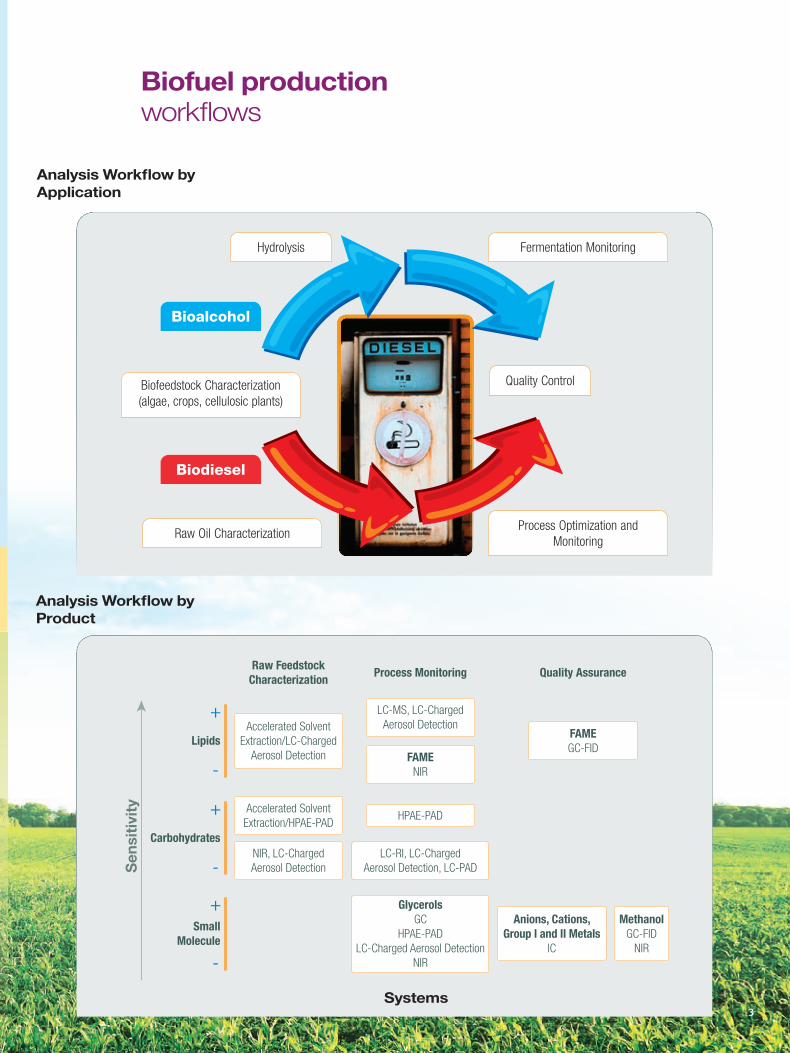
Biofuel production workflows
Process Optimization and Monitoring
Raw Oil Characterization
Biofeedstock Characterization (algae, crops, cellulosic plants)
Biodiesel
Bioalcohol
Quality Control
Fermentation MonitoringHydrolysis
Sens
itivi
ty
Lipids
+
-
Raw FeedstockCharacterization
Carbohydrates
+
-
Quality AssuranceProcess Monitoring
SmallMolecule
+
-
Accelerated SolventExtraction/LC-Charged
Aerosol Detection
FAMEGC-FID
MethanolGC-FID
NIR
Anions, Cations,Group I and II Metals
IC
GlycerolsGC
HPAE-PADLC-Charged Aerosol Detection
NIR
FAMENIR
LC-MS, LC-ChargedAerosol Detection
HPAE-PAD
LC-RI, LC-ChargedAerosol Detection, LC-PAD
Accelerated SolventExtraction/HPAE-PAD
NIR, LC-ChargedAerosol Detection
Analysis Workflow by Product
Systems
Analysis Workflow by Application
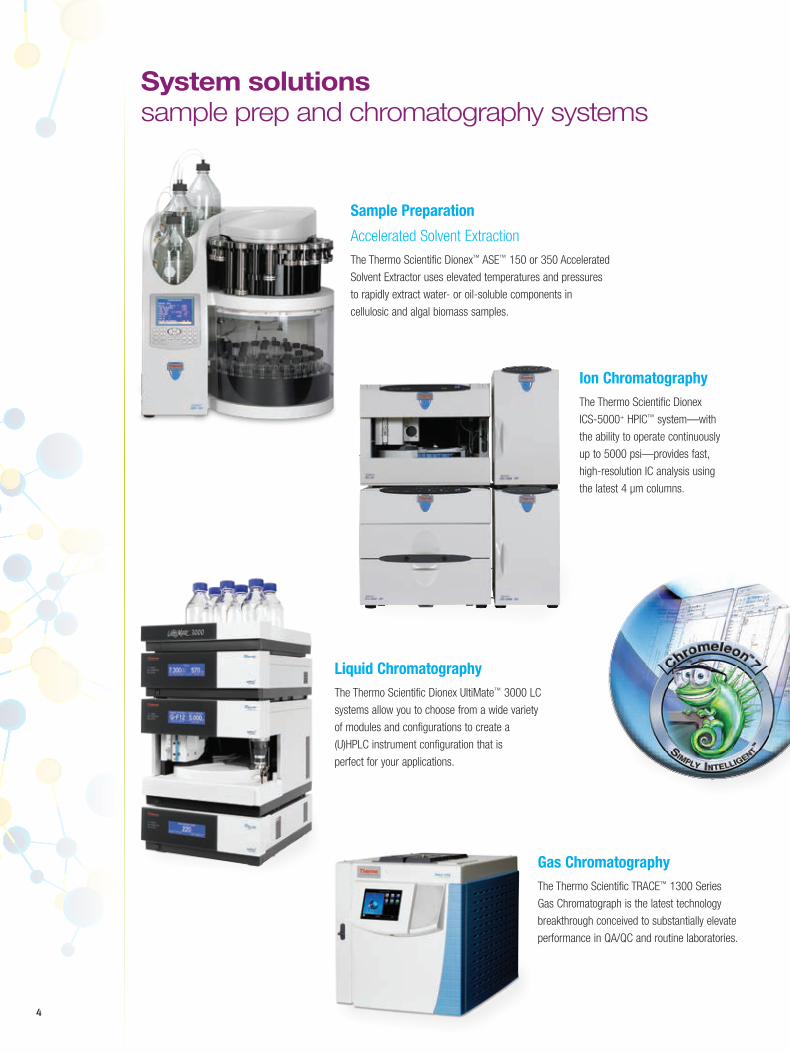
Liquid ChromatographyThe Thermo Scientific Dionex UltiMate™ 3000 LC
systems allow you to choose from a wide variety
of modules and configurations to create a
(U)HPLC instrument configuration that is
perfect for your applications.
System solutions sample prep and chromatography systems
4
Sample Preparation
Accelerated Solvent Extraction
The Thermo Scientific Dionex™ ASE™ 150 or 350 Accelerated
Solvent Extractor uses elevated temperatures and pressures
to rapidly extract water- or oil-soluble components in
cellulosic and algal biomass samples.
Gas ChromatographyThe Thermo Scientific TRACE™ 1300 Series
Gas Chromatograph is the latest technology
breakthrough conceived to substantially elevate
performance in QA/QC and routine laboratories.
Ion ChromatographyThe Thermo Scientific Dionex
ICS-5000+ HPIC™ system—with
the ability to operate continuously
up to 5000 psi—provides fast,
high-resolution IC analysis using
the latest 4 μm columns.
5
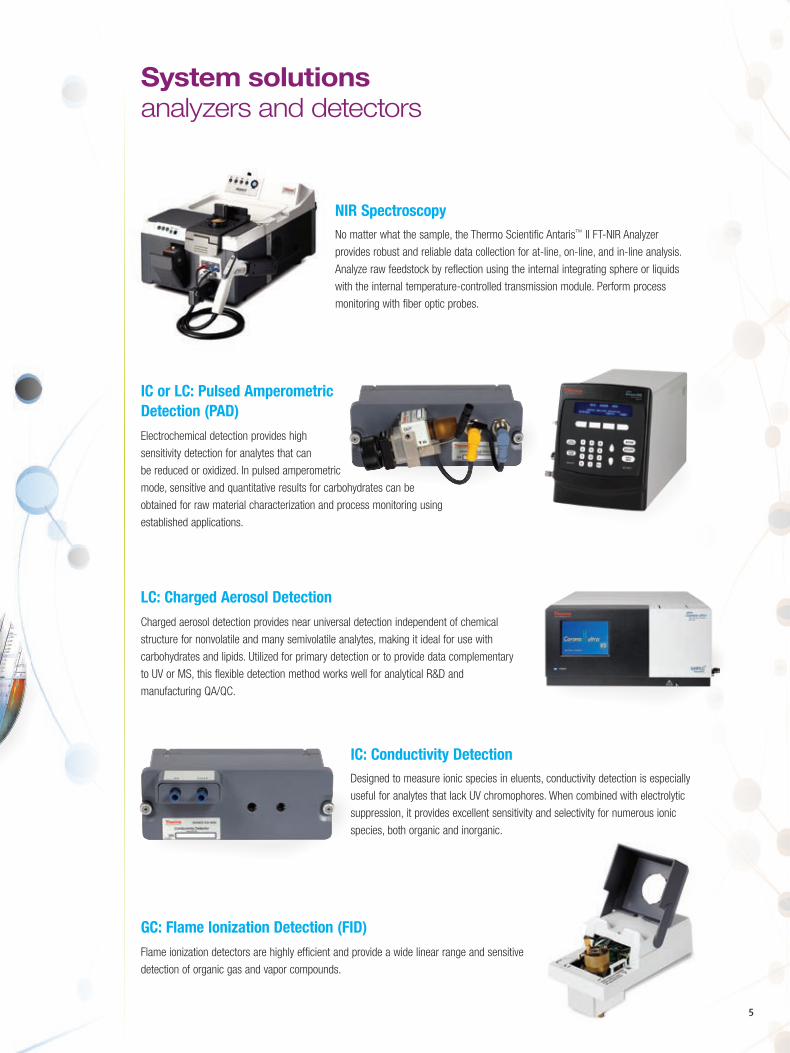
System solutions analyzers and detectors
NIR SpectroscopyNo matter what the sample, the Thermo Scientific Antaris™ II FT-NIR Analyzer
provides robust and reliable data collection for at-line, on-line, and in-line analysis.
Analyze raw feedstock by reflection using the internal integrating sphere or liquids
with the internal temperature-controlled transmission module. Perform process
monitoring with fiber optic probes.
LC: Charged Aerosol DetectionCharged aerosol detection provides near universal detection independent of chemical
structure for nonvolatile and many semivolatile analytes, making it ideal for use with
carbohydrates and lipids. Utilized for primary detection or to provide data complementary
to UV or MS, this flexible detection method works well for analytical R&D and
manufacturing QA/QC.
IC: Conductivity DetectionDesigned to measure ionic species in eluents, conductivity detection is especially
useful for analytes that lack UV chromophores. When combined with electrolytic
suppression, it provides excellent sensitivity and selectivity for numerous ionic
species, both organic and inorganic.
IC or LC: Pulsed Amperometric Detection (PAD)Electrochemical detection provides high
sensitivity detection for analytes that can
be reduced or oxidized. In pulsed amperometric
mode, sensitive and quantitative results for carbohydrates can be
obtained for raw material characterization and process monitoring using
established applications.
GC: Flame Ionization Detection (FID)Flame ionization detectors are highly efficient and provide a wide linear range and sensitive
detection of organic gas and vapor compounds.
6
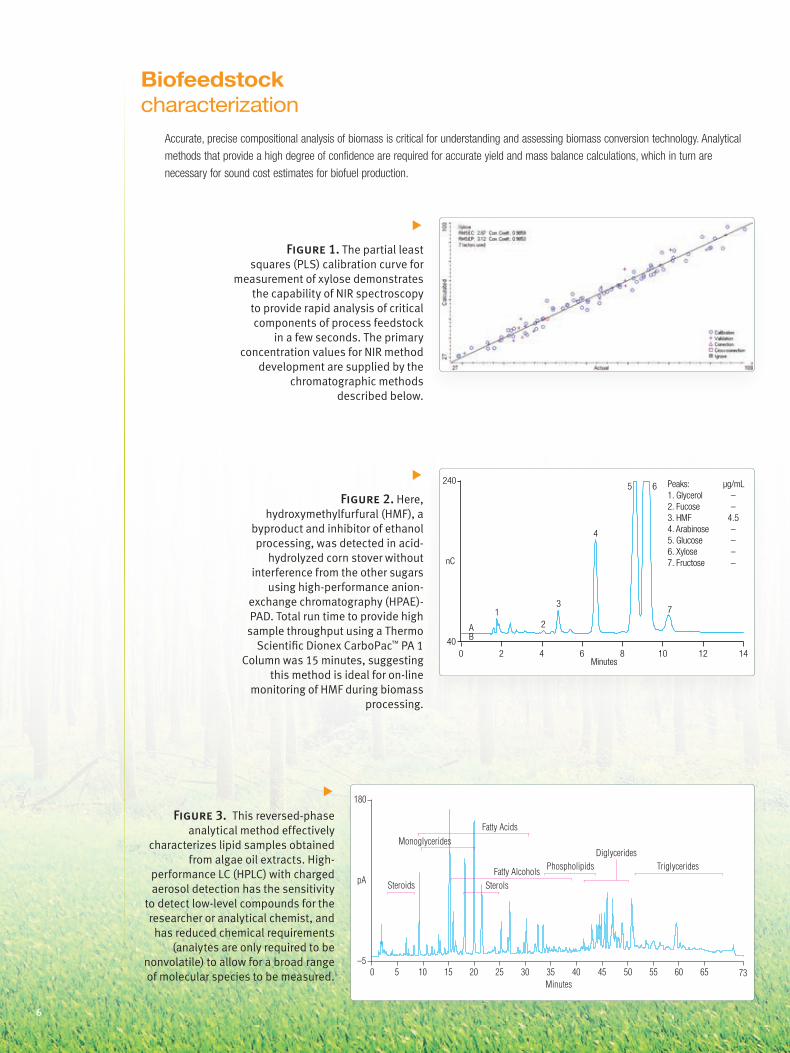
Biofeedstock characterization
Accurate, precise compositional analysis of biomass is critical for understanding and assessing biomass conversion technology. Analytical
methods that provide a high degree of confidence are required for accurate yield and mass balance calculations, which in turn are
necessary for sound cost estimates for biofuel production.
�Figure 1. The partial least
squares (PLS) calibration curve for measurement of xylose demonstrates
the capability of NIR spectroscopy to provide rapid analysis of critical components of process feedstock
in a few seconds. The primary concentration values for NIR method
development are supplied by the chromatographic methods
described below.
�Figure 2. Here,
hydroxymethylfurfural (HMF), a byproduct and inhibitor of ethanol processing, was detected in acid-
hydrolyzed corn stover without interference from the other sugars
using high-performance anion-exchange chromatography (HPAE)-PAD. Total run time to provide high sample throughput using a Thermo
Scientific Dionex CarboPac™ PA 1 Column was 15 minutes, suggesting
this method is ideal for on-line monitoring of HMF during biomass
processing.
�Figure 3. This reversed-phase
analytical method effectively characterizes lipid samples obtained
from algae oil extracts. High-performance LC (HPLC) with charged aerosol detection has the sensitivity
to detect low-level compounds for the researcher or analytical chemist, and has reduced chemical requirements
(analytes are only required to be nonvolatile) to allow for a broad range of molecular species to be measured.
0 2 4 6 8 10 12 14Minutes
40
240
nC
3
BA
12
4
5 6
7
Peaks: µg/mL1. Glycerol –2. Fucose –3. HMF 4.54. Arabinose –5. Glucose –6. Xylose –7. Fructose –
0 5 10 15 20 25 30 35 40 45 50 55 60 65 73–5
180
pA
Minutes
Fatty Alcohols
Fatty Acids Monoglycerides
Steroids Sterols
Triglycerides Diglycerides
Phospholipids
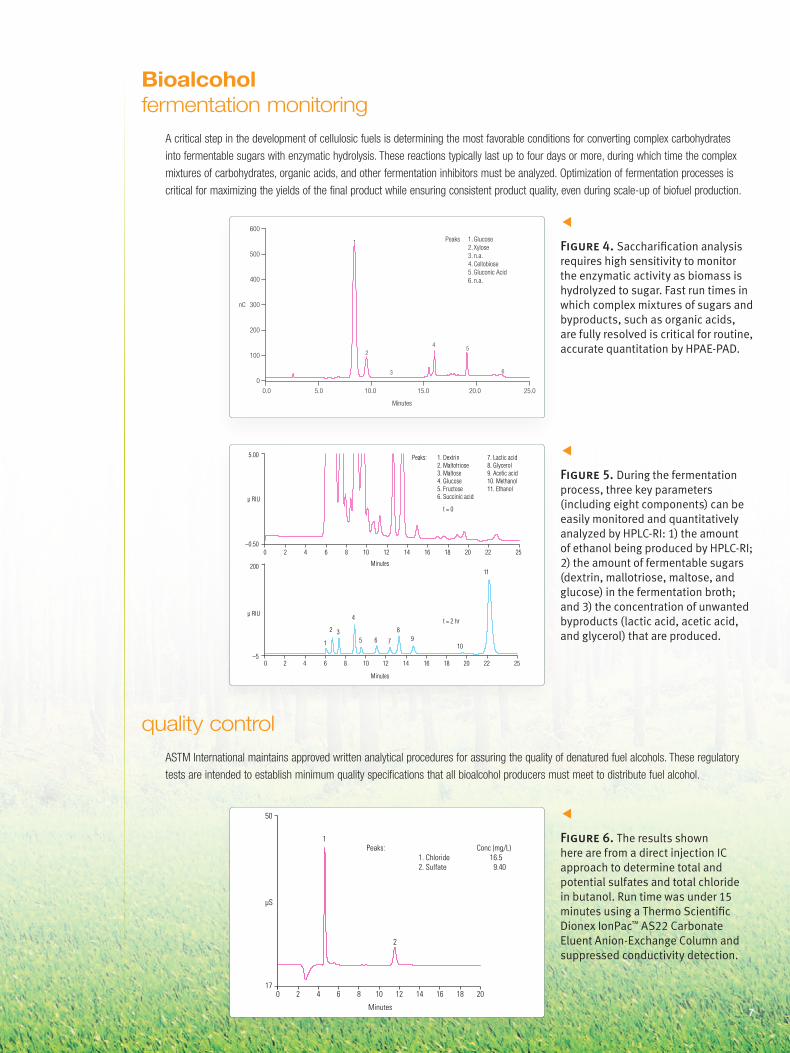
�Figure 4. Saccharification analysis requires high sensitivity to monitor the enzymatic activity as biomass is hydrolyzed to sugar. Fast run times in which complex mixtures of sugars and byproducts, such as organic acids, are fully resolved is critical for routine, accurate quantitation by HPAE-PAD.
�Figure 5. During the fermentation process, three key parameters (including eight components) can be easily monitored and quantitatively analyzed by HPLC-RI: 1) the amount of ethanol being produced by HPLC-RI; 2) the amount of fermentable sugars (dextrin, mallotriose, maltose, and glucose) in the fermentation broth; and 3) the concentration of unwanted byproducts (lactic acid, acetic acid, and glycerol) that are produced.
7
–5
200
µ RIU
1
2 3
4
0 2 4 6 8 10 12 14 16 18 20 22 25
Minutes
5 6 7
8 9
10
11
0 2 4 6 8 10 12 14 16 18 20 22 25 –0.50
5.00
µ RIU
Minutes
t = 0
t = 2 hr
Peaks: 1. Dextrin� 7. Lactic acid� 2. Maltotriose� 8. Glycerol 3. Maltose� 9. Acetic acid� 4. Glucose 10. Methanol� 5. Fructose 11. Ethanol 6. Succinic acid � �
�Figure 6. The results shown here are from a direct injection IC approach to determine total and potential sulfates and total chloride in butanol. Run time was under 15 minutes using a Thermo Scientific Dionex IonPac™ AS22 Carbonate Eluent Anion-Exchange Column and suppressed conductivity detection.
µS
Peaks: Conc (mg/L) 1. Chloride 16.5 2. Sulfate 9.40
0 2 4 6 8 10 12 14 16 18 2017
50
1
2
Minutes
0.0 5.0 10.0 15.0 20.0 25.0
0
100
200
300
400
500
nC
600
Minutes
1
2
3
4 5
6
Peaks 1. Glucose 2. Xylose 3. n.a. 4. Cellobiose 5. Gluconic Acid 6. n.a.
Bioalcohol fermentation monitoring
A critical step in the development of cellulosic fuels is determining the most favorable conditions for converting complex carbohydrates
into fermentable sugars with enzymatic hydrolysis. These reactions typically last up to four days or more, during which time the complex
mixtures of carbohydrates, organic acids, and other fermentation inhibitors must be analyzed. Optimization of fermentation processes is
critical for maximizing the yields of the final product while ensuring consistent product quality, even during scale-up of biofuel production.
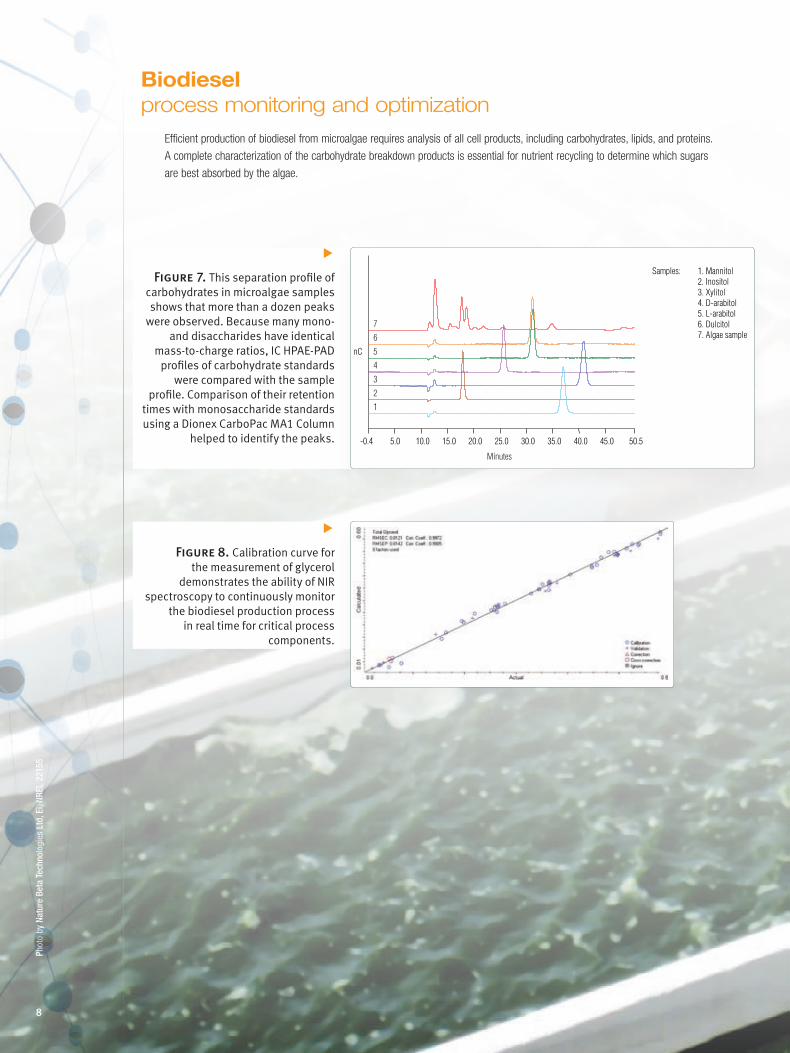
quality control ASTM International maintains approved written analytical procedures for assuring the quality of denatured fuel alcohols. These regulatory
tests are intended to establish minimum quality specifications that all bioalcohol producers must meet to distribute fuel alcohol.
Biodiesel process monitoring and optimization
Efficient production of biodiesel from microalgae requires analysis of all cell products, including carbohydrates, lipids, and proteins.
A complete characterization of the carbohydrate breakdown products is essential for nutrient recycling to determine which sugars
are best absorbed by the algae.
�Figure 7. This separation profile of
carbohydrates in microalgae samples shows that more than a dozen peaks
were observed. Because many mono- and disaccharides have identical
mass-to-charge ratios, IC HPAE-PAD profiles of carbohydrate standards
were compared with the sample profile. Comparison of their retention
times with monosaccharide standards using a Dionex CarboPac MA1 Column
helped to identify the peaks.
Samples: 1. Mannitol 2. Inositol 3. Xylitol 4. D-arabitol 5. L-arabitol 6. Dulcitol 7. Algae sample
-0.4 5.0 10.0 15.0 20.0 25.0 30.0 35.0 40.0 45.0 50.5
7
6
5
4
3
21
Minutes
nC
�Figure 8. Calibration curve for
the measurement of glycerol demonstrates the ability of NIR
spectroscopy to continuously monitor the biodiesel production process
in real time for critical process components.
Phot
o by
Nat
ure
Beta
Tec
hnol
ogie
s Lt
d, E
i, NR
EL 2
2155
8
Biodiesel quality control
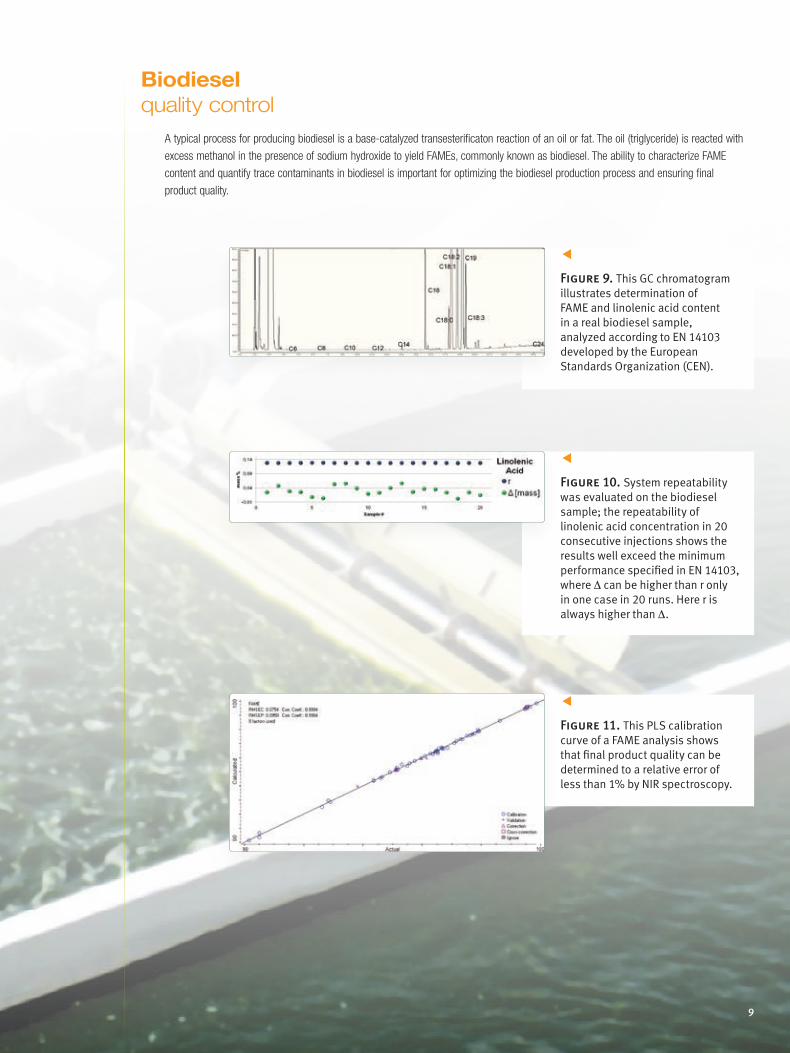
A typical process for producing biodiesel is a base-catalyzed transesterificaton reaction of an oil or fat. The oil (triglyceride) is reacted with
excess methanol in the presence of sodium hydroxide to yield FAMEs, commonly known as biodiesel. The ability to characterize FAME
content and quantify trace contaminants in biodiesel is important for optimizing the biodiesel production process and ensuring final
product quality.
�Figure 9. This GC chromatogram illustrates determination of FAME and linolenic acid content in a real biodiesel sample, analyzed according to EN 14103 developed by the European Standards Organization (CEN).
�Figure 10. System repeatability was evaluated on the biodiesel sample; the repeatability of linolenic acid concentration in 20 consecutive injections shows the results well exceed the minimum performance specified in EN 14103, where Δ can be higher than r only in one case in 20 runs. Here r is always higher than Δ.
�Figure 11. This PLS calibration curve of a FAME analysis shows that final product quality can be determined to a relative error of less than 1% by NIR spectroscopy.
9
Biodiesel quality control
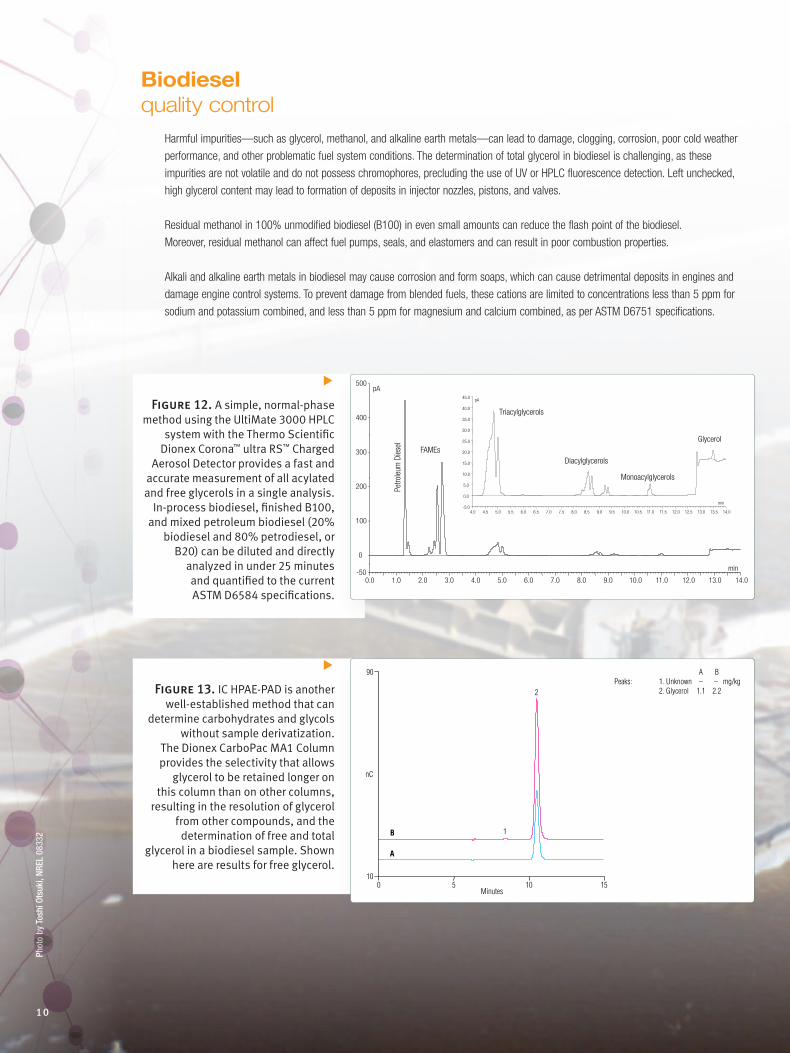
Harmful impurities—such as glycerol, methanol, and alkaline earth metals—can lead to damage, clogging, corrosion, poor cold weather
performance, and other problematic fuel system conditions. The determination of total glycerol in biodiesel is challenging, as these
impurities are not volatile and do not possess chromophores, precluding the use of UV or HPLC fluorescence detection. Left unchecked,
high glycerol content may lead to formation of deposits in injector nozzles, pistons, and valves.
Residual methanol in 100% unmodified biodiesel (B100) in even small amounts can reduce the flash point of the biodiesel.
Moreover, residual methanol can affect fuel pumps, seals, and elastomers and can result in poor combustion properties.
Alkali and alkaline earth metals in biodiesel may cause corrosion and form soaps, which can cause detrimental deposits in engines and
damage engine control systems. To prevent damage from blended fuels, these cations are limited to concentrations less than 5 ppm for
sodium and potassium combined, and less than 5 ppm for magnesium and calcium combined, as per ASTM D6751 specifications.
10
�Figure 13. IC HPAE-PAD is another
well-established method that can determine carbohydrates and glycols
without sample derivatization. The Dionex CarboPac MA1 Column provides the selectivity that allows
glycerol to be retained longer on this column than on other columns,
resulting in the resolution of glycerol from other compounds, and the determination of free and total
glycerol in a biodiesel sample. Shown here are results for free glycerol.
100 5 10 15
90
1
2
A
B
nC
Minutes
A BPeaks: 1. Unknown – – mg/kg 2. Glycerol 1.1 2.2
�Figure 12. A simple, normal-phase
method using the UltiMate 3000 HPLC system with the Thermo Scientific
Dionex Corona™ ultra RS™ Charged Aerosol Detector provides a fast and
accurate measurement of all acylated and free glycerols in a single analysis.
In-process biodiesel, finished B100, and mixed petroleum biodiesel (20%
biodiesel and 80% petrodiesel, or B20) can be diluted and directly
analyzed in under 25 minutes and quantified to the current ASTM D6584 specifications.
0.0 1.0 2.0 3.0 4.0 5.0 6.0 7.0 8.0 9.0 10.0 11.0 12.0 13.0 14.0 -50
0
100
200
300
400
500 pA
min
4.0 4.5 5.0 5.5 6.0 6.5 7.0 7.5 8.0 8.5 9.0 9.5 10.0 10.5 11.0 11.5 12.0 12.5 13.0 13.5 14.0 -5.0
0.0
5.0
10.0
15.0
20.0
25.0
30.0
35.0
40.0
45.0 pA
min
Triacylglycerols
Diacylglycerols
Monoacylglycerols
Glycerol FAMEs
Petro
leum
Die
sel
Phot
o by
Tos
hi O
tsuk
i, NR
EL 0
8332
Biodiesel quality control
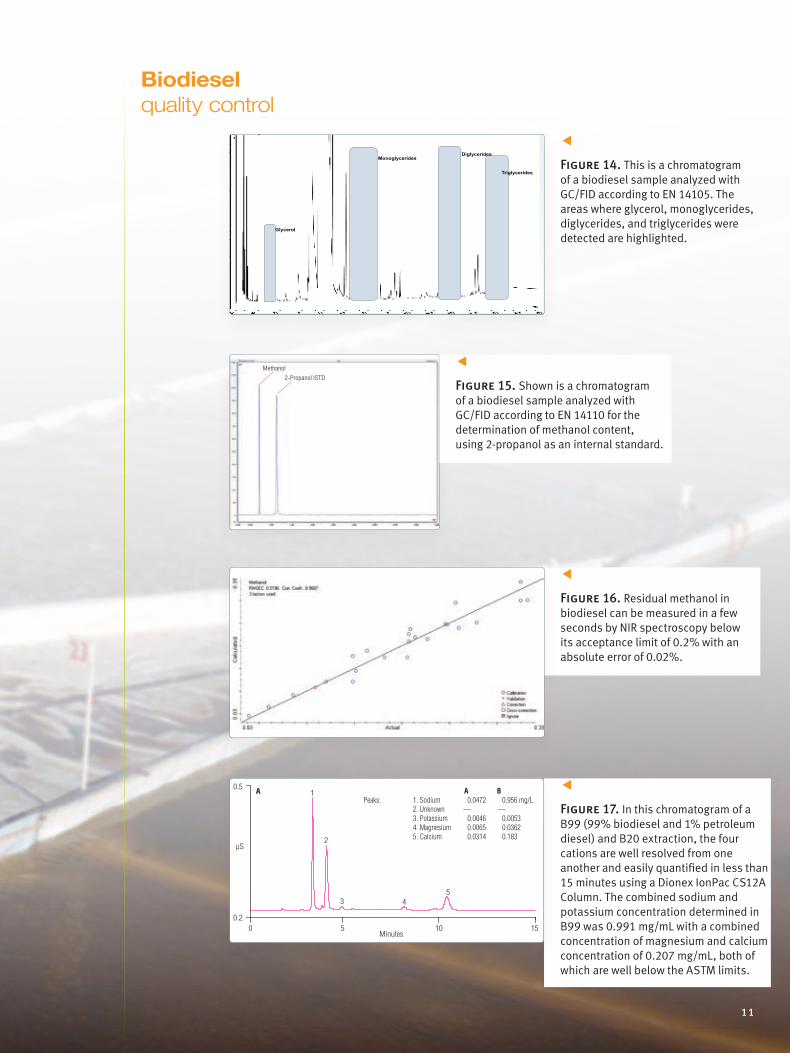
�Figure 14. This is a chromatogram of a biodiesel sample analyzed with GC/FID according to EN 14105. The areas where glycerol, monoglycerides, diglycerides, and triglycerides were detected are highlighted.
Glycerol
Monoglycerides Diglycerides
sedirecylgirT
Methanol
2-Propanol ISTD
�Figure 17. In this chromatogram of a B99 (99% biodiesel and 1% petroleum diesel) and B20 extraction, the four cations are well resolved from one another and easily quantified in less than 15 minutes using a Dionex IonPac CS12A Column. The combined sodium and potassium concentration determined in B99 was 0.991 mg/mL with a combined concentration of magnesium and calcium concentration of 0.207 mg/mL, both of which are well below the ASTM limits.
0.5
0.2
µS
1
150 5
A BPeaks: 1. Sodium 0.0472 0.956 mg/L 2. Unknown — — 3. Potassium 0.0046 0.0053 4. Magnesium 0.0065 0.0362 5. Calcium 0.0314 0.183
Minutes
A
2
3 45
10
11
�Figure 16. Residual methanol in biodiesel can be measured in a few seconds by NIR spectroscopy below its acceptance limit of 0.2% with an absolute error of 0.02%.
�Figure 15. Shown is a chromatogram of a biodiesel sample analyzed with GC/FID according to EN 14110 for the determination of methanol content, using 2-propanol as an internal standard.
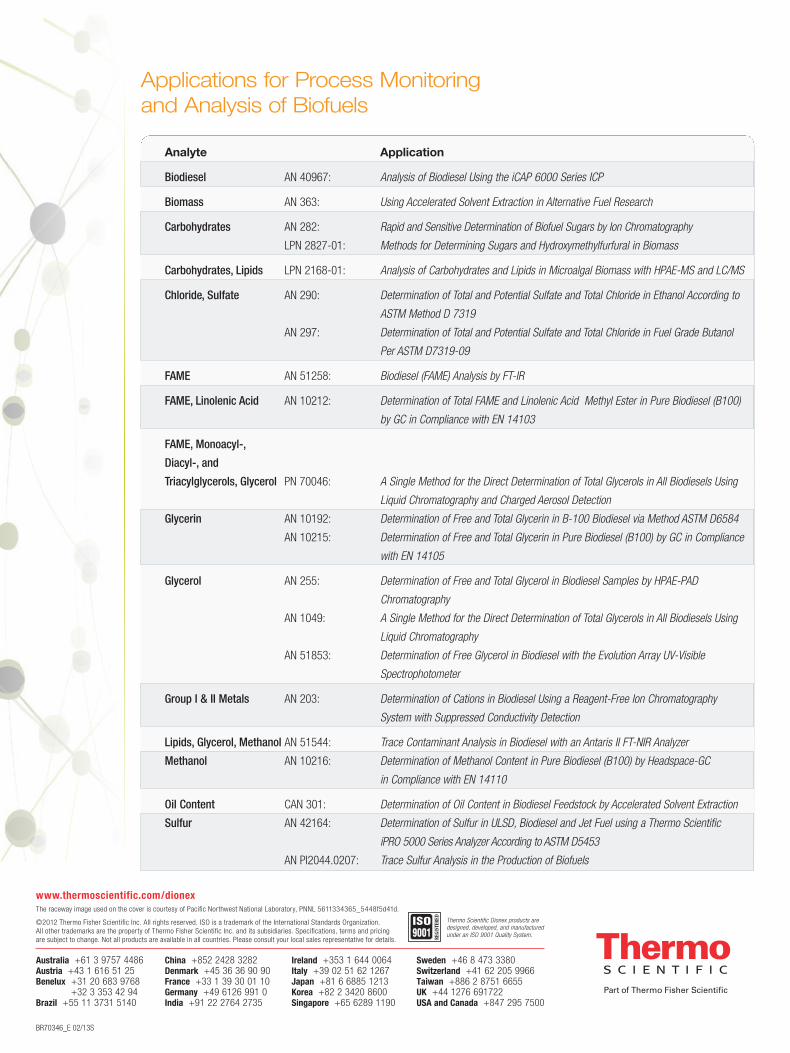
Applications for Process Monitoring and Analysis of Biofuels
Analyte Application
Biodiesel AN 40967: Analysis of Biodiesel Using the iCAP 6000 Series ICP
Biomass AN 363: Using Accelerated Solvent Extraction in Alternative Fuel Research
Carbohydrates AN 282: Rapid and Sensitive Determination of Biofuel Sugars by Ion Chromatography
LPN 2827-01: Methods for Determining Sugars and Hydroxymethylfurfural in Biomass
Carbohydrates, Lipids LPN 2168-01: Analysis of Carbohydrates and Lipids in Microalgal Biomass with HPAE-MS and LC/MS
Chloride, Sulfate AN 290: Determination of Total and Potential Sulfate and Total Chloride in Ethanol According to
ASTM Method D 7319
AN 297: Determination of Total and Potential Sulfate and Total Chloride in Fuel Grade Butanol
Per ASTM D7319-09
FAME AN 51258: Biodiesel (FAME) Analysis by FT-IR
FAME, Linolenic Acid AN 10212: Determination of Total FAME and Linolenic Acid Methyl Ester in Pure Biodiesel (B100)
by GC in Compliance with EN 14103
FAME, Monoacyl-,
Diacyl-, and
Triacylglycerols, Glycerol PN 70046: A Single Method for the Direct Determination of Total Glycerols in All Biodiesels Using
Liquid Chromatography and Charged Aerosol Detection
Glycerin AN 10192: Determination of Free and Total Glycerin in B-100 Biodiesel via Method ASTM D6584
AN 10215: Determination of Free and Total Glycerin in Pure Biodiesel (B100) by GC in Compliance
with EN 14105
Glycerol AN 255: Determination of Free and Total Glycerol in Biodiesel Samples by HPAE-PAD
Chromatography
AN 1049: A Single Method for the Direct Determination of Total Glycerols in All Biodiesels Using
Liquid Chromatography
AN 51853: Determination of Free Glycerol in Biodiesel with the Evolution Array UV-Visible
Spectrophotometer
Group I & II Metals AN 203: Determination of Cations in Biodiesel Using a Reagent-Free Ion Chromatography
System with Suppressed Conductivity Detection
Lipids, Glycerol, Methanol AN 51544: Trace Contaminant Analysis in Biodiesel with an Antaris II FT-NIR Analyzer
Methanol AN 10216: Determination of Methanol Content in Pure Biodiesel (B100) by Headspace-GC
in Compliance with EN 14110
Oil Content CAN 301: Determination of Oil Content in Biodiesel Feedstock by Accelerated Solvent Extraction
Sulfur AN 42164: Determination of Sulfur in ULSD, Biodiesel and Jet Fuel using a Thermo Scientific
iPRO 5000 Series Analyzer According to ASTM D5453
AN PI2044.0207: Trace Sulfur Analysis in the Production of Biofuels
BR70346_E 02/13S
Australia +61 3 9757 4486Austria +43 1 616 51 25Benelux +31 20 683 9768
+32 3 353 42 94Brazil +55 11 3731 5140
China +852 2428 3282Denmark +45 36 36 90 90France +33 1 39 30 01 10Germany +49 6126 991 0India +91 22 2764 2735
Ireland +353 1 644 0064Italy +39 02 51 62 1267 Japan +81 6 6885 1213Korea +82 2 3420 8600Singapore +65 6289 1190
Sweden +46 8 473 3380 Switzerland +41 62 205 9966Taiwan +886 2 8751 6655UK +44 1276 691722USA and Canada +847 295 7500
www.thermoscientific.com/dionexThe raceway image used on the cover is courtesy of Pacific Northwest National Laboratory, PNNL 5611334365_5448f5d41d. ©2012 Thermo Fisher Scientific Inc. All rights reserved. ISO is a trademark of the International Standards Organization. All other trademarks are the property of Thermo Fisher Scientific Inc. and its subsidiaries. Specifications, terms and pricing are subject to change. Not all products are available in all countries. Please consult your local sales representative for details.
Thermo Scientific Dionex products are designed, developed, and manufactured under an ISO 9001 Quality System.