research2guidance's mhealth app market sizing 2015 - 2020
TRANSCRIPT

© research2guidance 2015
mHealth App Market Sizing 2015 - 2020
Data report to size opportunities in the mHealth app market opportunity
Current market size Country markets
Top publishers 17 mHealth business models
Market forecast
November 2015
www.mHealthEconomics.com

© research2guidance 2015
research2guidance’s mHealth App Market Sizing 2015 - 2020
1
CONTENTS
1 Summary.......................................................................................................................................... 3 2 Scope ............................................................................................................................................... 5 3 Current status of the mHealth app market ..................................................................................... 7
3.1 mHealth app categories’ market share ................................................................................. 12 3.2 Country market share by downloads and revenues ............................................................. 16
4 Top 10 mHealth countries’ profiles ............................................................................................... 21 4.1 China ...................................................................................................................................... 21 4.1 USA ........................................................................................................................................ 24 4.2 Germany ................................................................................................................................ 27 4.3 Japan ...................................................................................................................................... 29 4.4 United Kingdom ..................................................................................................................... 32 4.5 France .................................................................................................................................... 34 4.6 Russia ..................................................................................................................................... 37 4.7 Brazil ...................................................................................................................................... 39 4.8 Italy ........................................................................................................................................ 42 4.9 Turkey .................................................................................................................................... 45
5 17 mHealth business models ........................................................................................................ 48 5.1 Paid downloads ..................................................................................................................... 49 5.2 Device sales ........................................................................................................................... 50 5.3 Commission for appointments .............................................................................................. 51 5.4 Featured listing ...................................................................................................................... 51 5.5 One-time service fee for a consultation ................................................................................ 52 5.6 Service subscription ............................................................................................................... 52 5.7 Transaction ............................................................................................................................ 53 5.8 Advertising ............................................................................................................................. 53 5.9 Sponsored content or incentives .......................................................................................... 54 5.10 Contract work for 3rd parties ................................................................................................. 54 5.11 Technology licensing ............................................................................................................. 54 5.12 Sales of source code/white label ........................................................................................... 55 5.13 Integrated in-app healthcare services ................................................................................... 55 5.14 Sales of user tracking data..................................................................................................... 55 5.15 Affiliate sales ......................................................................................................................... 56 5.16 Processing fee ........................................................................................................................ 56 5.17 Fundraising ............................................................................................................................ 57
6 Top 10 Health&Fitness app publishers’ profiles ............................................................................ 58 6.1 Runtastic ................................................................................................................................ 59 6.2 Nike, Inc ................................................................................................................................. 60 6.3 MyFitnessPal.com .................................................................................................................. 61 6.4 FitBit Inc, ................................................................................................................................ 62 6.5 Azumio ................................................................................................................................... 63 6.6 Fitness Keeper ....................................................................................................................... 64 6.7 MapMyFitness ....................................................................................................................... 65 6.8 NexerCise ............................................................................................................................... 66 6.9 GP Apps ................................................................................................................................. 67 6.10 Pacer Health Inc, .................................................................................................................... 68

© research2guidance 2015
research2guidance’s mHealth App Market Sizing 2015 - 2020
2
7 Top 10 Medical app publishers’ profiles ....................................................................................... 69 7.1 Kinosis .................................................................................................................................... 70 7.2 Epic ........................................................................................................................................ 71 7.3 Ovuline Inc, ............................................................................................................................ 72 7.4 GoodRX .................................................................................................................................. 73 7.5 Allscripts Health ..................................................................................................................... 74 7.6 CareZone ............................................................................................................................... 75 7.7 WebMD ................................................................................................................................. 76 7.8 Leafly ..................................................................................................................................... 77 7.9 Unbound medicine ................................................................................................................ 78 7.10 Epocrates ............................................................................................................................... 79
8 mHealth app market forecast 2015-2020 ..................................................................................... 80 8.1 mHealth user base and app downloads forecast .................................................................. 81 8.2 Market revenue forecast ....................................................................................................... 87
Service revenue ............................................................................................................. 89 Device revenue .............................................................................................................. 91 Transactions .................................................................................................................. 94 Paid downloads ............................................................................................................. 94 Advertising ..................................................................................................................... 95
9 Appendix ........................................................................................................................................ 97 9.1 About research2guidance ..................................................................................................... 97 9.2 List of figures ......................................................................................................................... 98 9.3 List of tables......................................................................................................................... 100

© research2guidance 2015
research2guidance’s mHealth App Market Sizing 2015 - 2020
3
1 SUMMARY
The mHealth app market can currently list XX apps developed by XX app publishers drawn from the Health&Fitness and Medical sections of the leading app stores.
Despite Android overall market dominance in the app market, IOS remained the leading platform for the mHealth app market. XX billion mHealth apps were downloaded from main app stores in 2015, of which XX% were downloaded from IOS devices.
IOS mHealth app publishers also spend most of the $XXm for paid app downloads and in-app-purchase features and services (IAP). XX% of it has been made with IOS apps.
The importance of IAP for mHealth business models has grown since 2010 but has not yet reached the same level as other app categories like games or Lifestyle. IAP now represents XX% of mHealth app store revenues with significant differences between Health&Fitness and Medical apps and platforms.
Downloads today are coming from Health& Fitness apps, but classical app store revenues are higher for Medical apps.
Fitness tracking apps remain the largest and most downloaded app category representing XX% of mHealth apps and XX% of mHealth app downloads. Recently, apps that target women have also become very popular. They currently account for XX% of all apps and XX% of downloads.
The largest markets for mHealth apps are the USA, China, Japan, Germany and the UK. Other countries1 are niche markets which might offer good market conditions for a specific mHealth solution but are significantly smaller than the top 5 markets. The majority of the countries offer a higher reach for Android apps but app store revenues are higher for IOS apps in most countries.
There is a lot of hype in the market that attracts new entrants every year but the majority of mHealth app publishers did not find the right business model to monetize from low average download numbers and income from traditional app store revenue sources (paid downloads and IAP). As a consequence, companies developed a variety of business models, transforming mHealth apps into tools, often to sell devices and services.
Device sales now represent the largest market segment for mHealth companies. In 2015, mHealth app publishers will generate $XXbn alone from selling connected devices. Service sales account for $XXbn of market revenues overlapping with IAP revenues as most low-priced mHealth services delivered via an app are being paid by IAP.
In 2015 the total market value is $XXbn.
The market will be driven by private users as they will continue to download and use mHealth apps and their connected devices, paying for it out of their own pockets. In addition, from 2018 onwards, traditional health care players will start to reimburse mHealth solutions on a larger scale.
1 The report compares 56 country markets based on their app store revenues, downloads, mHealth user numbers, top 5 Health&Fitness and Medical app downloads for IOS and Android apps

© research2guidance 2015
research2guidance’s mHealth App Market Sizing 2015 - 2020
4
The number of mHealth app users will increase to XXbn2. XX% of mHealth app users will be active, using the app at least once a month.
The demand for mHealth apps will continue to grow but at a lower rate reaching XXbn downloads by 2020. Android users will download more mHealth apps (XXbn downloads) than IOS users (XXbn downloads) by that time.
In 2020, users will still use smartphones (XX%) to access mHealth app services, followed by tablets (XX%) smart watches (XX%).
By the end of 2020, the mHealth market will have grown by XX% (CAGR) to reach US$XX billion.
mHealth service revenue including IAP will become the main revenue source reaching $XXbn. The service revenue will come from privately paid low priced digital mHealth, teleconsultation, high value subscription services and corporate paid reimbursed services.
Sales of devices, such as app connected sensors, wristbands, and glucose readers will increase to $XXbn by 2020. Growth of shipment volume will be largely offset by a decrease of device prices.
Mobile shop outlets will increase in importance and will help to bring overall online sales in line with other product categories. This will include RX and OTC products. Transaction revenues will increase from $XXm to $XXm by 2020.
Revenue growth from paid downloads will remain flat until 2020, reaching $XXm by 2020. As in other app categories, mHealth apps will make increasing use of the freemium model, allowing for a free initial download of the app, with further attached services, devices or app features available for purchase.
In app advertisement, revenue will increase to $XXm by 2020, but remain a niche revenue stream for the mHealth market.
The mHealth market will reach a significant size over the next five years. The cumulated market value until 2020 is $XXbn. Although a significant share of the market value comes from reimbursed services (XX%), private users/patients will remain the main driver for at least the next five years.
2 A capable device user that has downloaded at least one mHealth app. Capable devices are smartphones, tablets, iPod Touch and smart watches that could run apps.
© research2guidance 2015
research2guidance’s mHealth App Market Sizing 2015 - 2020
5
2 SCOPE
This report sizes the mHealth opportunity until 2020. It is a data report that concentrates on providing facts and forecasts for the mHealth economy. The objective is to define the dimensions of the market for mHealth solutions today and in the future. The report breaks down the mHealth market on a national level and highlights the top mHealth app publishers globally, to inform market potential. It defines the most commonly utilised mHealth business models at present to show how companies are trying to make money today and to forecast how this will evolve over the coming years.
For the purpose of this report, the mHealth market consists of the following revenue streams:
x App store download related revenues of the categories Health&Fitness and Medical including paid download and in app purchase (IAP) revenues
x Advertisement revenues that are related to app advertisement (IAA) x mHealth service revenues that are linked to services delivered through the app. This mainly
includes remote consultation and monitoring services but also a large variety of niche services.
x mHealth device revenues that relate to devices being sold in conjunction with an mHealth app. It sizes the mHealth market on a global level and within the countries, lists key mHealth app publishers and explains current Interpretation.
x mHealth transaction revenues that come from selling drugs and sanitary products via an app.
For clarification, the mHealth market sizing excludes healthcare revenues that are not mHealth app related or are based on services to build mHealth apps, devices or services. This includes the following for example:
x Device sales of traditional meters and sensors that are not directly linked to an app. This includes devices like glucose readers or blood pressure meters that are being sold independently from an app but where the data could be stored into a database with the help of a cable or OTA3 transmission.
x Health care services delivered by HCPs or web portals that are not connected with an app x Web based banner and search revenues x Third party app development and consultancy services x App development tool or white label app licensing x SMS only mHealth services
App category scope: The report covers apps that are listed in the Health&Fitness and Medical app sections of the app stores. Country scope: The report includes data from 56 countries4: 21 from the Asia/Pacific, 20 from Europe, 11, America and 4 from Africa.
3 OTA: Over the air (mainly Bluetooth) 4 Argentina, Australia, Austria, Belgium, Brazil, Canada, Chile, China, Colombia, Czech Republic, Denmark, Ecuador, Egypt, Finland, France, Germany, Hong Kong, Hungary, India, Indonesia, Ireland, Israel, Italy, Japan, Kenya, Malaysia, Mexico, Netherlands, New Zealand, Nigeria, Norway, Pakistan, Peru, Philippines, Poland, Portugal, Romania, Russian Federation, Saudi Arabia, Singapore, South Africa, South Korea, Spain, Sri Lanka, Sweden, Switzerland, Taiwan, Thailand, Turkey, UAE, United Kingdom, United States, Uruguay, Venezuela, Vietnam

© research2guidance 2015
research2guidance’s mHealth App Market Sizing 2015 - 2020
6
Platform scope: The report provides details for the two main native app platforms, IOS and Android and summarises the market for competing platforms, such as Windows Phone, Amazon and Ubuntu. Time horizon: Insights concerning the current status of the mHealth app market are predominantly drawn from Q2 in 2015. The forecast covers a timeline from 2015 until 2020. Sizing metrics: The report defines the current status as well as future markets with the help of some key metrics: downloads, users and revenues. All metrics are further detailed by country, business model or platform for example.

© research2guidance 2015
research2guidance’s mHealth App Market Sizing 2015 - 2020
9
The iOS mHealth app market is more competitive than the Android mHealth market in terms of app numbers. It offers a slightly higher reach in terms of downloads but it outperforms the Android platform in app store revenues for mHealth apps.
In 2015 iOS user will have spent $XXm for mHealth paid app downloads and in app purchase (IAP). This is almost twice as much as Android users spend on mHealth apps ($XXm). The revenue share of other platforms is small. Windows Phone users only spend $9m on mHealth apps. All other platforms account for $XXm in app store revenues.
In 2015 users spend $XXm for paid mHealth app downloads ($XXm) and IAP ($XXm) in total. For a market which is only 6 years old, this must be labeled as success.
Figure 2: Estimated app store revenues of mHealth apps by app store (2015)
The share of IAP has been growing since its introduction in 2010. With an average app market share of XX% on iOS and XX% on Google Play, IAP represents the number one revenue source in the app stores today. The IAP share of mHealth apps is, when compared with the rest of the market, relatively low, especially in Medical category. Medical apps mostly generate app store revenues from paid downloads (XX% on iOS and XX% on Google Play). The same applies to other app categories e.g. Productivity or Music. In contrast to Social Media or Games, paid downloads represent only a small proportion of revenues. For Health&Fitness apps, XX% of iOS resp. XX% of Google Play app stores revenues come from IAP.
mHealth app publishers are also using the freemium model offering consumers the ability to unlock additional app features or access additional training or diet plans for example, but this occurs far less frequently than is practiced in other app categories.
© research2guidance 2015 | Source: research2guidance, Priori Data
iOS Google Play Windows Phone Other app stores
Other app stores: other global app stores e.g. Amazon, Blackberry WorldApp store revenues: in-app-purchace and paid downloads
Mill
ion
$XXm app store revenues in 2015
XX% of revenues generated by paid downloads
© research2guidance 2015
research2guidance’s mHealth App Market Sizing 2015 - 2020
10
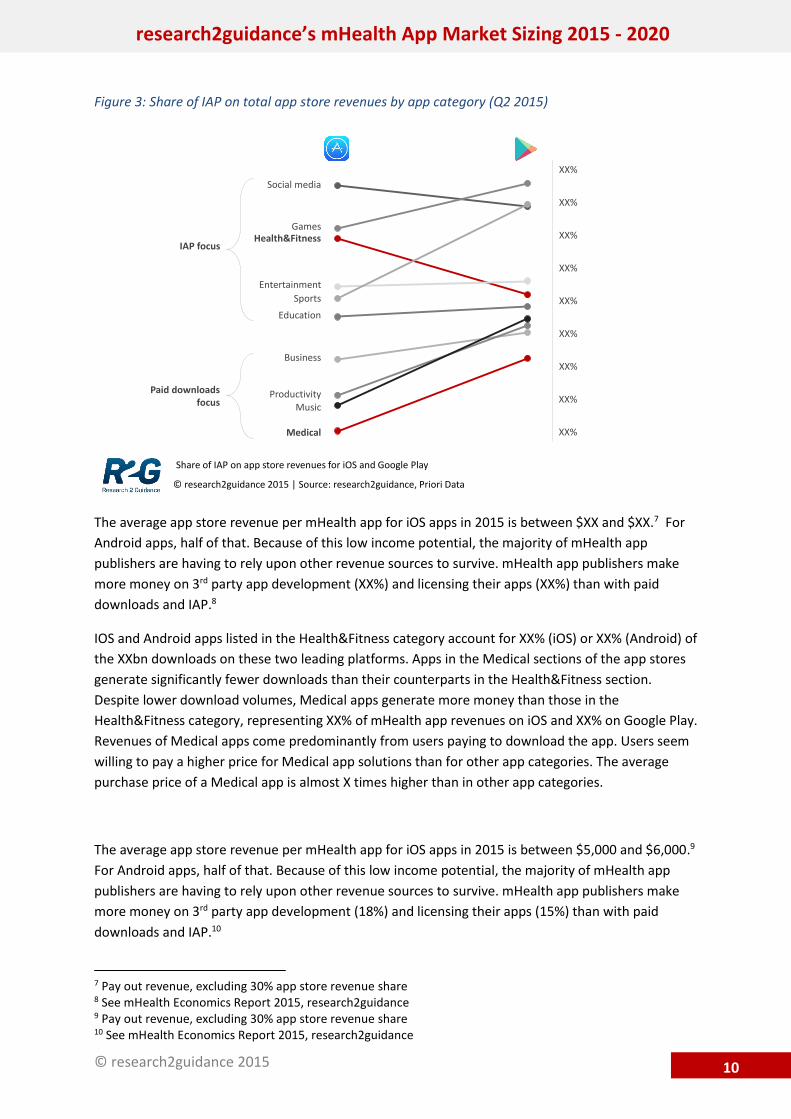
Figure 3: Share of IAP on total app store revenues by app category (Q2 2015)
The average app store revenue per mHealth app for iOS apps in 2015 is between $XX and $XX.7 For Android apps, half of that. Because of this low income potential, the majority of mHealth app publishers are having to rely upon other revenue sources to survive. mHealth app publishers make more money on 3rd party app development (XX%) and licensing their apps (XX%) than with paid downloads and IAP.8
IOS and Android apps listed in the Health&Fitness category account for XX% (iOS) or XX% (Android) of the XXbn downloads on these two leading platforms. Apps in the Medical sections of the app stores generate significantly fewer downloads than their counterparts in the Health&Fitness section. Despite lower download volumes, Medical apps generate more money than those in the Health&Fitness category, representing XX% of mHealth app revenues on iOS and XX% on Google Play. Revenues of Medical apps come predominantly from users paying to download the app. Users seem willing to pay a higher price for Medical app solutions than for other app categories. The average purchase price of a Medical app is almost X times higher than in other app categories.
The average app store revenue per mHealth app for iOS apps in 2015 is between $5,000 and $6,000.9 For Android apps, half of that. Because of this low income potential, the majority of mHealth app publishers are having to rely upon other revenue sources to survive. mHealth app publishers make more money on 3rd party app development (18%) and licensing their apps (15%) than with paid downloads and IAP.10
7 Pay out revenue, excluding 30% app store revenue share 8 See mHealth Economics Report 2015, research2guidance 9 Pay out revenue, excluding 30% app store revenue share 10 See mHealth Economics Report 2015, research2guidance
© research2guidance 2015 | Source: research2guidance, Priori Data
Social media
GamesHealth&Fitness
Entertainment
EducationSports
Business
ProductivityMusic
Medical
XX%
XX%
XX%
XX%
XX%
XX%
XX%
XX%
XX%
IAP focus
Paid downloads focus
Share of IAP on app store revenues for iOS and Google Play

© research2guidance 2015
research2guidance’s mHealth App Market Sizing 2015 - 2020
24
4.1 USA USA is the second biggest market for mHealth apps in terms of revenues. However, the growth of US mHealth market is slowing down and mHealth downloads on iOS have decreased by 8pp between Q1 and Q2 2015. On the other hand app store revenues
increased by 30pp. USA is mainly iOS market but the difference between downloads on iOS and Android is not very significant.
mHealth apps are able to generate XXm downloads in one quarter. XX% are from apps that are listed in the Health& Fitness category. App store revenues (paid downloads and IAP) were $XXm in Q2 2015. The revenue share for Medical apps is XX%.
Figure 15: USA country performance for downloads and revenues (Q2 2015)
Google Play iOS
Downloads (Q2 2015)
Health and Fitness Medical
mHealth users: XXm
mHealth DLs IOS: XXm
mHealth DLs Android: XXm
App store revenue iOS: $XXm
App store revenue Android: $XXm
Number of apps iOS: XX
Reve
nues
Downloads
iOS country
Android country
Google Play iOS
App store revenues (Q2 2015)
Health and Fitness Medical
Downloads from iOS Revenues from Android
Downloads from Android Revenues from iOS
Figure 14: USA country mHealth profile (2015)

© research2guidance 2015
research2guidance’s mHealth App Market Sizing 2015 - 2020
25
The most popular apps in USA are weight loss apps and health and fertility trackers. Most of the Top Health&Fitness apps are published by American companies and belong to the market leaders. More than XX downloads are needed per month to belong to the top 5 list in the Health& Fitness for iOS and Google Play.
The Medical section lists personal health record apps, prescription and medication managers and pregnancy tracking apps. A top 5 app in the Medical section in the Apple App Store and Google Play needs to achieve more than XX downloads per month.
Table 6: USA’s most downloaded Health&Fitness apps (September 2015)
App name Download 09/15
BM
App name Download 09/15
BM
1 MyFitnessPal XX FREE IAP 1 Fitbit XX FREE
2 Fitbit XX FREE 2 MyFitnessPal XX FREE
IAP
3 Period Tracker Lite XX FREE 3 Pedometer XX FREE
4 Steps Pedometer XX FREE IAP 4 Period Calender XX FREE
5 Sworkit Lite XX FREE 5 CVS/Pharmacy XX FREE
Table 7: USA's most downloaded Medical apps (September 2015)
App name Download 09/15
BM App name Download09/15
BM
1 GoodRx XX FREE 1 GoodRx XX FREE
2 Touch Surgery XX FREE 2 CareZone XX FREE
3 FollowMyHealth XX FREE 3 MyChart XX FREE
4 MyChart XX FREE 4 Ovia Pregnancy XX FREE
5 Ovia Pregnancy XX FREE 5 FollowMyHealth XX FREE
Table 8: USA's top earning Health&Fitness apps (September 2015)
App name Revenues 09/15
BM
App name Revenues 09/15
BM
1 MyFitnessPal $ XX FREE IAP 1
MyFitnessPal $ XX FREE IAP
2 Weight Watchers $ XX FREE IAP 2 Lose It! $ XX FREE
IAP
3 Headspace $ XX FREE IAP 3 Geocaching Intro $ XX FREE
IAP
4 DailyBurn $ XX FREE IAP 4
Calm - Meditate, Sleep, Relax $ XX FREE
IAP
5 Lose It! $ XX FREE IAP 5 Strava $ XX FREE
IAP

© research2guidance 2015
research2guidance’s mHealth App Market Sizing 2015 - 2020
26
Table 9: USA's top earning Medical apps (September 2015)
App name Revenues 09/15
BM
App name Revenues 09/15
BM
1 Epocrates $ XX FREE IAP 1
Sanford Guide: Antimicrobial Rx $ XX FREE
IAP
2 Sanford Guide to Antimicr. Therapy $ XX FREE
IAP 2 Pregnancy+ $ XX FREE IAP
3 5 Minute Clinical Consult $ XX FREE
IAP 3 mySugr Diabetes Logbook $ XX FREE
IAP
4 Davis's Drug Guide $ XX FREE IAP 4 Diabetes Connect $ XX FREE
IAP
5 Nursing Central $ XX FREE IAP 5 Davis's Drug Guide $ XX FREE
IAP

© research2guidance 2015
research2guidance’s mHealth App Market Sizing 2015 - 2020
59
6.1 RUNTASTIC
Runtastic is an Austrian mobile fitness company, founded in 2009, producing activity tracking apps, hardware products and fitness services. Their app portfolio includes 60 fitness tracking apps being
published on iOS or Google Play. In 2014 they launched their first wearable, the ‘Orbit’ which was sold for $120. On August 5, 2015, Adidas bought Runtastic, and Axel Springer’s 50.1% share, for $239 million. After Adidas bought Runtastic they entered the smartwatch market in August 2015 announcing the launch of the ‘moment’ smartwatch being sold for $130.
App portfolio performance
The company’s app portfolio is balanced for Android and IOS. Number of apps as well as downloads are almost the same for both platforms. App store revenues are mainly coming from IAP (XX%) and from IOS app users (XX%).
Main countries are Germany, China, West European markets and the USA.
Table 42: Runtastic app portfolio summary
DOWNLOADS APP STORE REVENUE ($) in million # of
unique apps
# of downloads (Q2 2015)
Share of Free DLs Share of Paid DLs
IAP Installs
XX XX XX XX XX XX X% X% XX M XX M XX M XX M
Total # of downloads (Q2 2015) Total Revenue (Q2 2015)
XX $XX
Figure 34: Share of Runtastic downloads for iOS and Google Play by country for Q2 2015
Key Information (Q2 2015):
Number of apps: XX
Downloads: XXm
App store revenue: XXm
Average app rating: XX
CH 16%
US 15%
DE 11%
FR 9%IT 7%
Other 42%
DE 13%
ES 9%
IT 9%
FR 9%
US 7%
Other 53%
© research2guidance 2015
research2guidance’s mHealth App Market Sizing 2015 - 2020
83
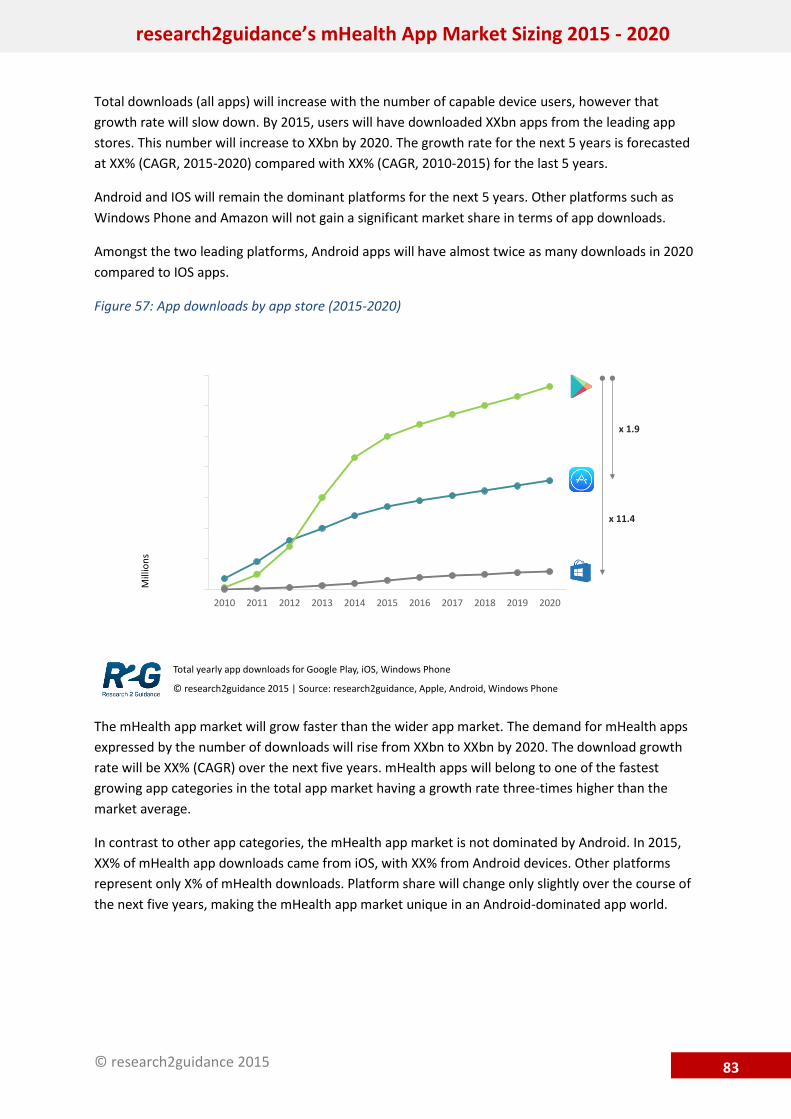
Total downloads (all apps) will increase with the number of capable device users, however that growth rate will slow down. By 2015, users will have downloaded XXbn apps from the leading app stores. This number will increase to XXbn by 2020. The growth rate for the next 5 years is forecasted at XX% (CAGR, 2015-2020) compared with XX% (CAGR, 2010-2015) for the last 5 years.
Android and IOS will remain the dominant platforms for the next 5 years. Other platforms such as Windows Phone and Amazon will not gain a significant market share in terms of app downloads.
Amongst the two leading platforms, Android apps will have almost twice as many downloads in 2020 compared to IOS apps.
Figure 57: App downloads by app store (2015-2020)
The mHealth app market will grow faster than the wider app market. The demand for mHealth apps expressed by the number of downloads will rise from XXbn to XXbn by 2020. The download growth rate will be XX% (CAGR) over the next five years. mHealth apps will belong to one of the fastest growing app categories in the total app market having a growth rate three-times higher than the market average.
In contrast to other app categories, the mHealth app market is not dominated by Android. In 2015, XX% of mHealth app downloads came from iOS, with XX% from Android devices. Other platforms represent only X% of mHealth downloads. Platform share will change only slightly over the course of the next five years, making the mHealth app market unique in an Android-dominated app world.
-
10,000
20,000
30,000
40,000
50,000
60,000
70,000
2010 2011 2012 2013 2014 2015 2016 2017 2018 2019 2020
x 1.9
x 11.4
Total yearly app downloads for Google Play, iOS, Windows Phone
Mill
ions
© research2guidance 2015 | Source: research2guidance, Apple, Android, Windows Phone

© research2guidance 2015
research2guidance’s mHealth App Market Sizing 2015 - 2020
84
Figure 58: mHealth app downloads by app store (2015-2020)
Despite above-average download growth, mHealth apps will remain a niche category within the app store representing only X% of total app downloads by 2020.
mHealth apps are more important for the iOS platform than for any other platform representing XX% of all downloads in 2015 and XX% by 2020. The mHealth app download share on other platforms is only half or even less than the iOS mHealth app download share.
2015 2016 2017 2018 2019 2020Other platforms 182 181 211 239 267 293Windows Phone 60 84 109 131 151 166Android 1,299 1,559 1,839 2,134 2,432 2,724iOS 1,499 1,799 2,069 2,276 2,480 2,679All dowloads 3,041 3,623 4,229 4,779 5,330 5,862
0
1,000
2,000
3,000
4,000
5,000
6,000
XX%
XX%
Estimated app downloads from app stores in health&fitness and medical category
CAGRXX%
XX%
XX%
Mill
ions
© research2guidance 2015 | Source: research2guidance, Priori Data

© research2guidance 2015
research2guidance’s mHealth App Market Sizing 2015 - 2020
97
9 APPENDIX
9.1 ABOUT RESEARCH2GUIDANCE research2guidance is a strategy advisory and market research company. We concentrate on the mobile app eco-system. We are convinced that mobile health solutions will make a difference to people’s lives and that the impact on the healthcare industry will be significant. We provide insights to make it happen and to successfully lead your business.
research2guidance +49 30 609 89 33 62 www.mHealtheconomics.com [email protected] November 2015
Our analyst team:
Ralf-Gordon Jahns
Ralf is the research director of research2guidance. He has worked for more than 19 years in the telecom and media industry. Prior to research2guidance he was a partner and member of the leadership team of Capgemini Telecom Media & Networks. Ralf is a frequent keynote speaker on mobile industry events, publisher of a multitude of mobile app market reports and executive consultant of more than 30 clients in the mobile and app industry.
Zuzana Vranova
Zuzana is a senior research analyst at research2guidance. She is managing the mHealth App Developer Economics research program and has worked on app market sizing and benchmarking projects globally and EU focused. She supported various projects on mHealth app launch strategies and target setting for major market players. Zuzana holds a BSc. in Applied Mathematics.

© research2guidance 2015
research2guidance’s mHealth App Market Sizing 2015 - 2020
98
9.2 LIST OF FIGURES Figure 1: Number of mHealth apps displayed in main app stores (2015) ............................................... 8 Figure 2: Estimated app store revenues of mHealth apps by app store (2015)...................................... 9 Figure 3: Share of IAP on total app store revenues by app category (Q2 2015) ................................... 10 Figure 4: Share of Medical apps in mHealth app downloads and revenues ......................................... 11 Figure 5: mHealth app category market share by app numbers (September 2015, iOS) ..................... 12 Figure 7: mHealth app category market share by downloads (September 2015, iOS) ......................... 14 Figure 8: Share of app category downloads for Health&Fitness and Medical apps (September 2015, iOS) ........................................................................................................................................................ 15 Figure 9: mHealth downloads and revenues of market leaders (Q2 2015, iOS and Google Play) ........ 16 Figure 10: mHealth downloads and revenues by country on iOS and Google Play (Q2 2015) ............. 17 Figure 11: Share of downloads and revenues on iOS by country (Q2 2015) ........................................ 18 Figure 12: Share of downloads and revenues on Google Play in Q2 2015 by country ......................... 19 Figure 13: China country mHealth profile (2015) .................................................................................. 21 Figure 14 China country performance for downloads and revenues (Q2 2015) .................................. 22 Figure 15: USA country mHealth profile (2015) .................................................................................... 24 Figure 16: USA country performance for downloads and revenues (Q2 2015) .................................... 24 Figure 17: Germany country mHealth profile (2015) ............................................................................ 27 Figure 18: Germany country performance for downloads and revenues (Q2 2015) ............................ 28 Figure 19: Japan country mHealth profile (2015) ................................................................................. 30 Figure 20: Japan country performance for downloads and revenues (Q2 2015) ................................. 30 Figure 21: United Kingdom country mHealth profile (2015)................................................................. 32 Figure 22: United Kingdom country performance for downloads and revenues (Q2 2015) ................ 33 Figure 23: France country mHealth profile (2015) ................................................................................ 35 Figure 24: France country performance for downloads and revenues (Q2 2015) ................................ 35 Figure 25: Russia country mHealth profile (2015)................................................................................. 37 Figure 26: Russia country performance for downloads and revenues (Q2 2015) ................................ 38 Figure 27: Brazil country mHealth profile (2015) .................................................................................. 40 Figure 28: Brazil country performance for downloads and revenues (Q2 2015) .................................. 40 Figure 29: Italy country mHealth profile (2015) .................................................................................... 42 Figure 30: Italy country performance for downloads and revenues (Q2 2015) .................................... 43 Figure 31: Turkey country mHealth profile (2015) ................................................................................ 45 Figure 32: Turkey country performance for downloads and revenues (Q2 2015) ............................... 45 Figure 33: Downloads and revenues by mHealth app publishers per year .......................................... 49 Figure 34: Top 10 Health&Fitness app publishers’ share of global downloads for Q2 2015 ................ 58 Figure 35: Share of Runtastic downloads for iOS and Google Play by country for Q2 2015 ................. 59 Figure 36: Share of Nike downloads for iOS and Google Play by country for Q2 2015 ........................ 60 Figure 37: Share of MyFitnessPal downloads for iOS and Google Play by country for Q2 2015 .......... 61 Figure 38: Share of Fitbit downloads for iOS and Google Play by country for Q2 2015 ....................... 62 Figure 39: Share of Azumio downloads for iOS and Google Play by country for Q2 2015 ................... 63 Figure 40: Share of Fitness Keeper downloads for iOS and Google Play by country for Q2 2015 ........ 64 Figure 41: Share of MapMyFitness downloads for iOS and Google Play by country for Q2 2015 ........ 65 Figure 42: Share of Nexercise downloads for iOS and Google Play by country for Q2 2015 ................ 66 Figure 43: Share of GP Apps downloads for iOS and Google Play by country for Q2 2015 .................. 67 Figure 44: Share of Pacer Health downloads for iOS and Google Play by country for Q2 2015 ........... 68 Figure 45: Top 10 Medical app publishers share of global downloads for Q2 2015 ............................. 69

© research2guidance 2015
research2guidance’s mHealth App Market Sizing 2015 - 2020
99
Figure 46: Share of Kinosis downloads for iOS and Google Play by country for Q2 2015 .................... 70 Figure 47: Share of Epic downloads for iOS and Google Play by country for Q2 2015 ......................... 71 Figure 48: Share of Ovuline downloads for iOS and Google Play by country for Q2 2015 ................... 72 Figure 49: Share of GoodRX downloads for iOS and Google Play by country for Q2 2015 ................... 73 Figure 50: Share of Allscripts downloads for iOS and Google Play by country for Q2 2015 ................. 74 Figure 51: Share of CareZone downloads for iOS and Google Play by country for Q2 2015 ................ 75 Figure 52: Share of WebMD downloads for iOS and Google Play by country for Q2 2015 .................. 76 Figure 53: Share of Leafly downloads for iOS and Google Play by country for Q2 2015 ...................... 77 Figure 54: Share of Unbound Medicine downloads for iOS and Google Play by country for Q2 2015. 78 Figure 55: Share of Epocrates downloads for iOS and Google Play by country for Q2 2015 ................ 79 Figure 56: Number of addressable app users by device (2015-2020) ................................................... 81 Figure 57: Number of mHealth publishers and displayed apps (2015-2020) ....................................... 82 Figure 58: App downloads by app store (2015-2020) ........................................................................... 83 Figure 59: mHealth app downloads by app store (2015-2020) ............................................................. 84 Figure 60: Share of mHealth app downloads on all app downloads per app store (2015-2020) ......... 85 Figure 61: Number of mHealth app users (2015-2020) ........................................................................ 86 Figure 62: mHealth market revenue by revenue source (2015-2020) .................................................. 88 Figure 63: Share of mHealth revenue sources (2015-2020) ................................................................. 89 Figure 64: Number of service users by service category (2015-2020) .................................................. 90 Figure 65: mHealth service revenue (2015-2020) ................................................................................. 91 Figure 66: Connected device shipments (2015-2020) ........................................................................... 92 Figure 67: Number of device users (2015-2020) ................................................................................... 93 Figure 68: Device revenue (2015-2020) ................................................................................................ 93 Figure 69: Transaction revenue (2015-2020) ........................................................................................ 94 Figure 70: Paid download revenue (2015-2020) ................................................................................... 95 Figure 71: Advertising revenue (2015-2020) ......................................................................................... 95 Figure 72: Share of revenue streams on cumulated market revenue (2015-2020) .............................. 96

© research2guidance 2015
research2guidance’s mHealth App Market Sizing 2015 - 2020
100
9.3 LIST OF TABLES Table 1: Country mHealth app downloads and revenues for 56 countries (Q2 2015) ......................... 20 Table 2: China’s most downloaded Health&Fitness apps (September 2015) ....................................... 22 Table 3: China's most downloaded Medical apps (September 2015) ................................................... 23 Table 4: China's top earning Health&Fitness apps (September 2015) .................................................. 23 Table 5: China's top earning Health&Fitness apps (September 2015) .................................................. 23 Table 6: USA’s most downloaded Health&Fitness apps (September 2015) ......................................... 25 Table 7: USA's most downloaded Medical apps (September 2015) ..................................................... 25 Table 8: USA's top earning Health&Fitness apps (September 2015) .................................................... 25 Table 9: USA's top earning Medical apps (September 2015) ................................................................ 26 Table 10: Germany's most downloaded Medical apps (September 2015) ........................................... 28 Table 11: Germany’s most downloaded Medical apps (September 2015) ........................................... 29 Table 12: Germany's top earning Health&Fitness apps (September 2015) .......................................... 29 Table 13: Germany's top earning Medical apps (September 2015) ...................................................... 29 Table 14: Japan's most downloaded Health&Fitness apps (September 2015) ..................................... 31 Table 15: Japan's most downloaded Medical apps (September 2015) ................................................. 31 Table 16: Japan's top earning Health&Fitness apps (September 2015) ............................................... 31 Table 17: Japan's top earning Medical apps (September 2015) ........................................................... 32 Table 18: United Kingdom's most downloaded Health&Fitness apps (September 2015) .................... 33 Table 19: United Kingdom's most downloaded Medical apps (September 2015) ................................ 34 Table 20: United Kingdom's top earning Health&Fitness apps (September 2015)............................... 34 Table 21: United Kingdom’s top earning Medical apps (September 2015) ......................................... 34 Table 22: France’s most downloaded Health&Fitness apps (September 2015) ................................... 36 Table 23: France’s most downloaded Medical apps (September 2015) ............................................... 36 Table 24: France's top earning Health&Fitness apps (September 2015) .............................................. 36 Table 25: France's top earning Medical apps (September 2015) .......................................................... 37 Table 26: Russia’s most downloaded Health&Fitness apps (September 2015) .................................... 38 Table 27: Russia’s most downloaded Medical apps (September 2015) ................................................ 39 Table 28: Russia's top earning Health&Fitness apps (September 2015)............................................... 39 Table 29: Russia's top earning Medical apps (September 2015) .......................................................... 39 Table 30: Brazil’s most downloaded Health&Fitness apps (September 2015) ..................................... 41 Table 31: Brazil’s most downloaded Medical apps (September 2015) ................................................. 41 Table 32: Brazil's top earning Health&Fitness apps (September 2015) ................................................ 41 Table 33: Brazil's top earning Medical apps (September 2015) ............................................................ 42 Table 34: Italy’s most downloaded Health&Fitness apps (September 2015) ....................................... 43 Table 35: Italy’s most downloaded Medical apps (September 2015) ................................................... 44 Table 36: Italy’s top earning Health&Fitness apps (September 2015) .................................................. 44 Table 37: Italy's top earning Medical apps (September 2015) .............................................................. 44 Table 38: Turkey’s most downloaded Health&Fitness apps (September 2015) ................................... 46 Table 39: Turkey’s most downloaded Medical apps (September 2015) ............................................... 46 Table 40: Turkey's top earning Health&Fitness apps (September 2015) .............................................. 46 Table 41: Turkey’s top earning Medical apps (September 2015) ......................................................... 47 Table 42: Runtastic app portfolio summary .......................................................................................... 59 Table 43: Nike app portfolio summary .................................................................................................. 60 Table 44: MyFitnessPal app portfolio summary .................................................................................... 61 Table 45: Fitbit app portfolio summary ................................................................................................. 62

© research2guidance 2015
research2guidance’s mHealth App Market Sizing 2015 - 2020
101
Table 46: Azumio app portfolio summary ............................................................................................. 63 Table 47: Fitness Keeper app portfolio summary ................................................................................. 64 Table 48: MapMyFitness app portfolio summary ................................................................................. 65 Table 49: Nexercise app portfolio summary ......................................................................................... 66 Table 50: GP Apps app portfolio summary............................................................................................ 67 Table 51: Pacer Health app portfolio summary .................................................................................... 68 Table 52: Kinosis app portfolio summary .............................................................................................. 70 Table 53: Epic app portfolio summary .................................................................................................. 71 Table 54: Ovuline app portfolio summary ............................................................................................. 72 Table 55: GoodRX app portfolio summary ............................................................................................ 73 Table 56: Allscripts app portfolio summary .......................................................................................... 74 Table 57: CareZone app portfolio summary .......................................................................................... 75 Table 58: WebMD app portfolio summary ............................................................................................ 76 Table 59: Leafly app portfolio summary................................................................................................ 77 Table 60: Unbound Medicine app portfolio summary .......................................................................... 78 Table 61: Epocrates app portfolio summary ......................................................................................... 79