researcher 2016;8(7) · pdf fileinteractive petrophysics version 3.6 software program ®...
TRANSCRIPT

Researcher 2016;8(7) http://www.sciencepub.net/researcher
54
Subsurface Study and Petrophysical Analysis of Kharita Formation in Tut field, North Western Desert, Egypt
Neamat Aboelhassan1, Elhamy Tarabees1 and Mohamed Alaa2
1: Geology Department, Faculty of Science, Damanhour University
2: Halliburton Company, Egypt [email protected]; +201285813589
Abstract: Tut Field is located at Khalda concession in the northwestern part of the Western Desert, Egypt. It lies between Latitudes 30° 44' 40" and 30° 46' N and Longitudes 26° 57' 20" and 26° 59' 20" E. This work aims to study the subsurface and reservoir characteristics to evaluate the hydrocarbon potential of Kharita Formation based on subsurface data available from open-hole well log records of nine wells distributed in the area of study. The subsurface geologic setting, in terms of determining the stratigraphic and structural settings, is gained through the construction of different aligned stratigraphic and structural cross sections, isopach and lithofacies maps. The petrophysical evaluation, in terms of determining the petrophysical characteristics; net pay thickness, effective
porosity ( ), shale content ( ), water saturation ( ) and hydrocarbon saturation ( ), is acquired through quantitative computer processed interpretation. The petrophysical characteristics are illustrated laterally in the form of iso-parametric maps and vertically in the form of litho-saturation cross-plots. According to subsurface study and petrophysical evaluation the most productive area is located in some areas of northern and central parts of Tut field. So it is recommended to focus the exploration activities on these areas. [Neamat Aboelhassan, Elhamy Tarabees and Mohamed Alaa. Subsurface Study and Petrophysical Analysis of Kharita Formation in Tut field, North Western Desert, Egypt. Researcher 2016;8(7):54-61]. ISSN 1553-9865 (print); ISSN 2163-8950 (online). http://www.sciencepub.net/researcher. 8. doi:10.7537/marsrsj080716.08. Keywords: Tut Field, Subsurface study, Petrophysical evaluation, Kharita Formation, Hydrocarbon saturation 1. Introduction
Tut Field is located 4-5 km north and northwest of Salam Field at the northern edge of the major Safir-Salam-Tut ridge at Khalda concession in the northwestern part of the Western Desert. This area is a part of the Western Desert which is considered the most prolific petroleum province in Egypt. It lies between Latitudes 30° 44' 40" and 30° 46' N and Longitudes 26° 57' 20" and 26° 59' 20" E as shown in figure (1). 2. Material and Methods
The present study depends on the use of the available open-hole well log records (electric, radioactivity and sonic logs) in the form of composite well logs (Resistivity, Caliper, SP, GR, Density, Neutron, and Sonic) of nine wells distributed in the area of study. The subsurface geologic setting is gained through the construction of stratigraphic and structural cross sections, isopach maps and lithofacies maps. The petrophysical evaluation is gained through the computer processed interpretation that passes through the quantitative interpretation technique. The petrophysical characteristics are illustrated laterally (in the form of iso-parametric maps) and vertically (in the form of litho-saturation cross-plots). This study mainly depends on the use of computer software programs, such as Interactive Petrophysics version 3.6
software program ® Schlumberger, 2010 and other petroleum-related geological software programs.
Figure 1: Location map showing the studied wells.
3. Results
a. Subsurface geologic setting The subsurface geologic setting of the northern
part of Western Desert has been investigated by many workers such as Norton (1967), Abdine and Deibis (1972), El Gezeery et al. (1972), Khaled (1974), Schlumberger (1984), Barakat and Darwish (1987),
Researcher 2016;8(7) http://www.sciencepub.net/researcher
55
Hanter (1990), EGPC (1992), Berglund et al. (1994), Schlumberger (1995), El-Shaarawy and Montasser (1996), Meshref (1996), El-Kadi et al. (1998), Shalaby et al. (2000 and 2011), Zein El-Din et al. (2001), El-Khadragy et al. (2010) and El Nady (2013).
Geologic setting of the study area is determined by reviewing the general stratigraphy and structure using subsurface data with the aid of isopach maps, lithofacies maps and cross sections through the study area.
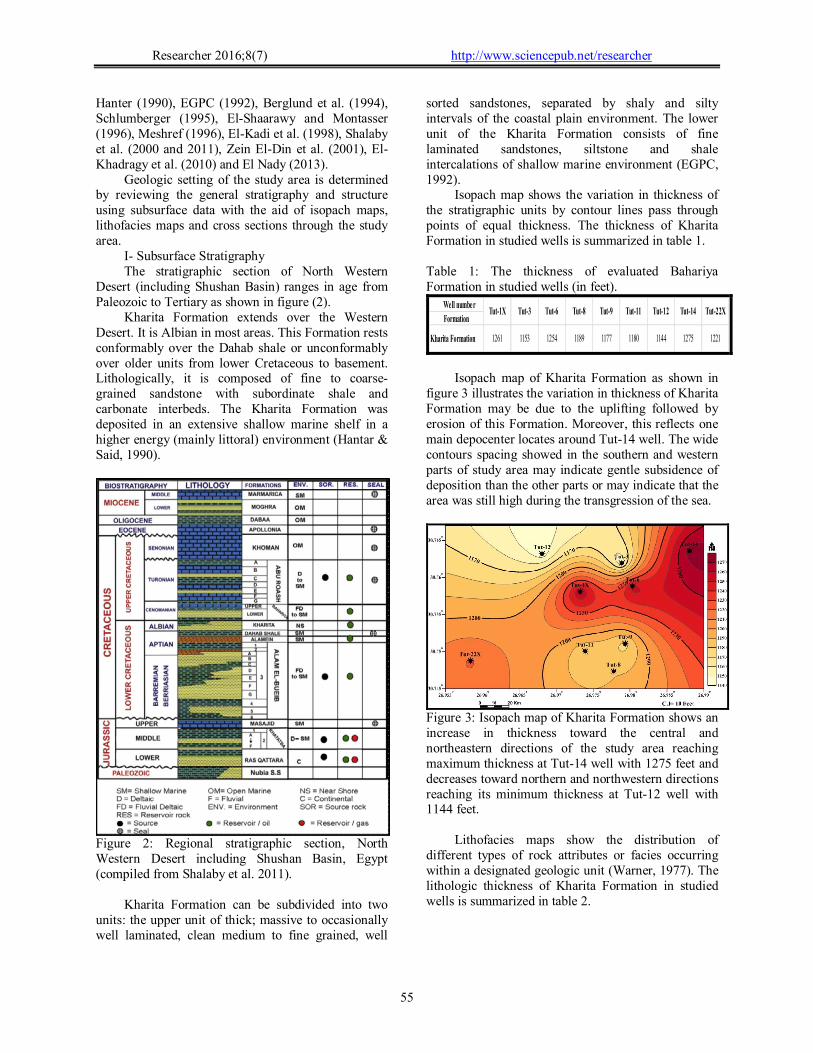
I- Subsurface Stratigraphy The stratigraphic section of North Western
Desert (including Shushan Basin) ranges in age from Paleozoic to Tertiary as shown in figure (2).
Kharita Formation extends over the Western Desert. It is Albian in most areas. This Formation rests conformably over the Dahab shale or unconformably over older units from lower Cretaceous to basement. Lithologically, it is composed of fine to coarse-grained sandstone with subordinate shale and carbonate interbeds. The Kharita Formation was deposited in an extensive shallow marine shelf in a higher energy (mainly littoral) environment (Hantar & Said, 1990).
Figure 2: Regional stratigraphic section, North Western Desert including Shushan Basin, Egypt (compiled from Shalaby et al. 2011).
Kharita Formation can be subdivided into two units: the upper unit of thick; massive to occasionally well laminated, clean medium to fine grained, well
sorted sandstones, separated by shaly and silty intervals of the coastal plain environment. The lower unit of the Kharita Formation consists of fine laminated sandstones, siltstone and shale intercalations of shallow marine environment (EGPC, 1992).
Isopach map shows the variation in thickness of the stratigraphic units by contour lines pass through points of equal thickness. The thickness of Kharita Formation in studied wells is summarized in table 1.
Table 1: The thickness of evaluated Bahariya Formation in studied wells (in feet).
125411531261Kharita Formation 12751144118011771189
Tut-22XTut-14Tut-12Tut-11Tut-9Tut-8Tut-6Tut-3Tut-1X Well number
Formation
1221
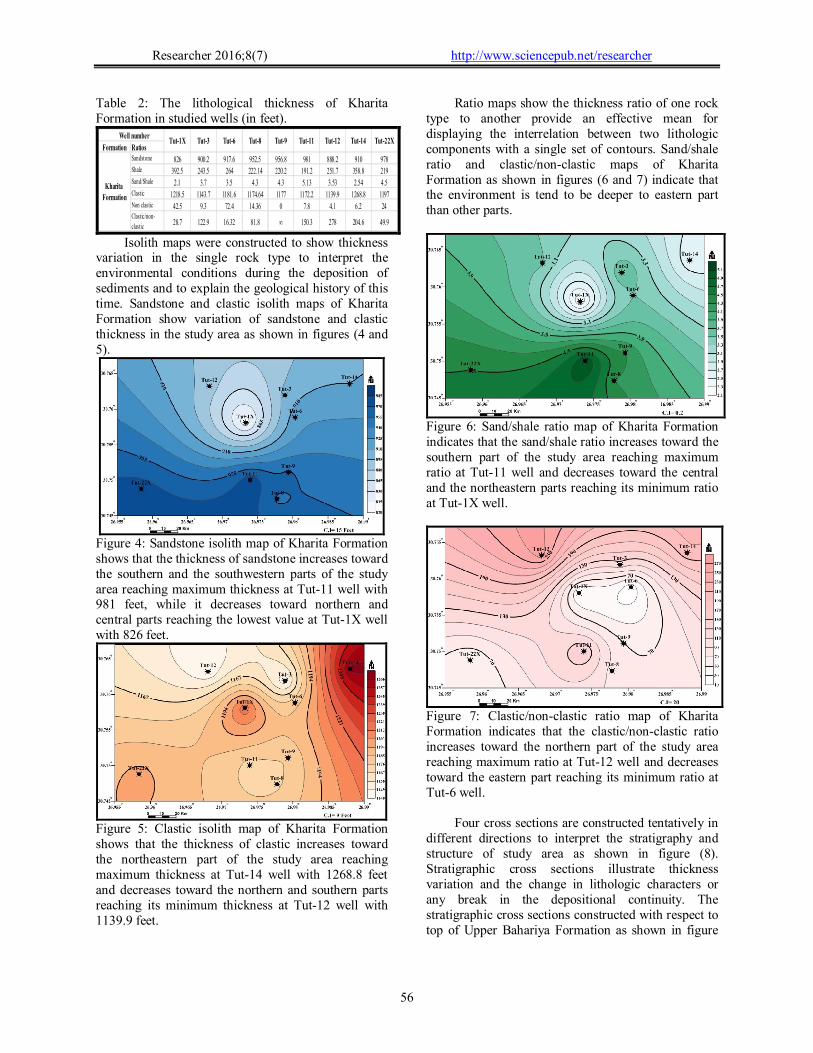
Isopach map of Kharita Formation as shown in
figure 3 illustrates the variation in thickness of Kharita Formation may be due to the uplifting followed by erosion of this Formation. Moreover, this reflects one main depocenter locates around Tut-14 well. The wide contours spacing showed in the southern and western parts of study area may indicate gentle subsidence of deposition than the other parts or may indicate that the area was still high during the transgression of the sea.
Figure 3: Isopach map of Kharita Formation shows an increase in thickness toward the central and northeastern directions of the study area reaching maximum thickness at Tut-14 well with 1275 feet and decreases toward northern and northwestern directions reaching its minimum thickness at Tut-12 well with 1144 feet.
Lithofacies maps show the distribution of
different types of rock attributes or facies occurring within a designated geologic unit (Warner, 1977). The lithologic thickness of Kharita Formation in studied wells is summarized in table 2.
Researcher 2016;8(7) http://www.sciencepub.net/researcher
56
Table 2: The lithological thickness of Kharita Formation in studied wells (in feet).
RatiosFormation
978910888.2981956.8952.5917.6900.2826Sandstone
219358.8251.7191.2220.2222.14264243.5392.5Shale
4.52.543.535.134.34.33.53.72.1Sand/Shale
11971268.81139.91172.211771174.641181.61143.71218.5Clastic
246.24.17.8014.3672.49.342.5Non clastic
49.9204.6278150.3∞81.816.32122.928.7Clastic/non-
clastic
Kharita
Formation
Tut-8Tut-6Tut-3Tut-1X Well number
Tut-22XTut-14Tut-12Tut-11Tut-9
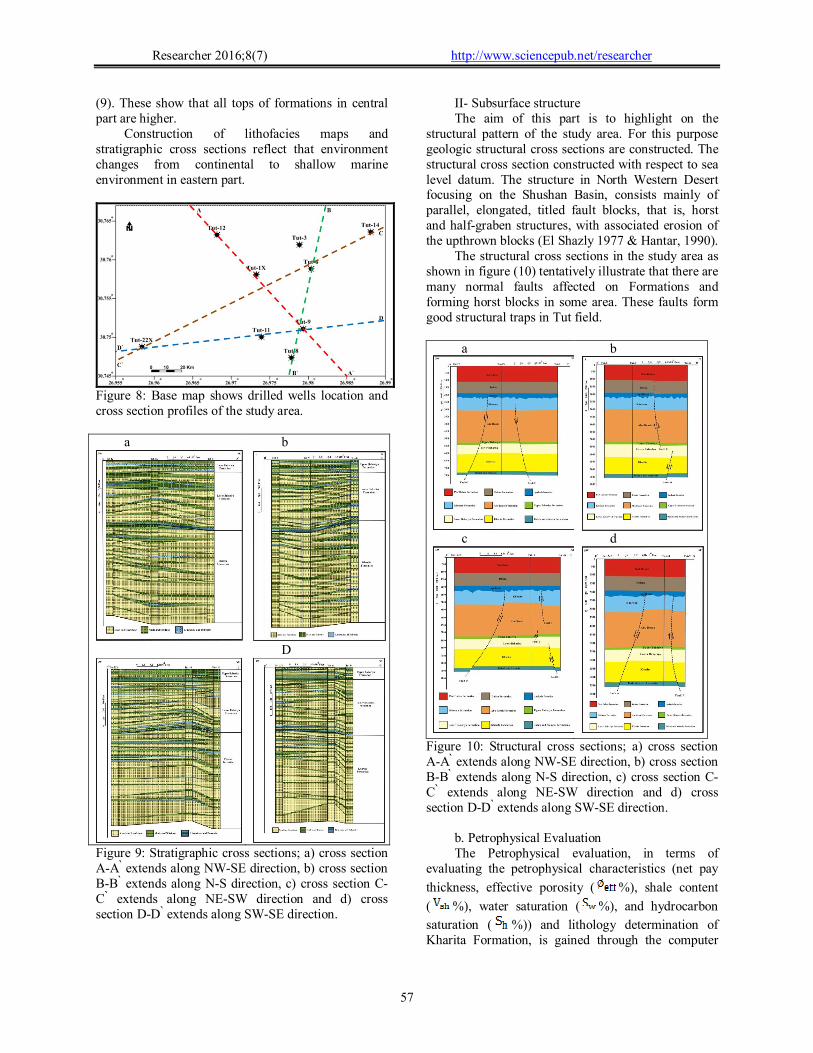
Isolith maps were constructed to show thickness
variation in the single rock type to interpret the environmental conditions during the deposition of sediments and to explain the geological history of this time. Sandstone and clastic isolith maps of Kharita Formation show variation of sandstone and clastic thickness in the study area as shown in figures (4 and 5).
Figure 4: Sandstone isolith map of Kharita Formation shows that the thickness of sandstone increases toward the southern and the southwestern parts of the study area reaching maximum thickness at Tut-11 well with 981 feet, while it decreases toward northern and central parts reaching the lowest value at Tut-1X well with 826 feet.
Figure 5: Clastic isolith map of Kharita Formation shows that the thickness of clastic increases toward the northeastern part of the study area reaching maximum thickness at Tut-14 well with 1268.8 feet and decreases toward the northern and southern parts reaching its minimum thickness at Tut-12 well with 1139.9 feet.
Ratio maps show the thickness ratio of one rock type to another provide an effective mean for displaying the interrelation between two lithologic components with a single set of contours. Sand/shale ratio and clastic/non-clastic maps of Kharita Formation as shown in figures (6 and 7) indicate that the environment is tend to be deeper to eastern part than other parts.
Figure 6: Sand/shale ratio map of Kharita Formation indicates that the sand/shale ratio increases toward the southern part of the study area reaching maximum ratio at Tut-11 well and decreases toward the central and the northeastern parts reaching its minimum ratio at Tut-1X well.
Figure 7: Clastic/non-clastic ratio map of Kharita Formation indicates that the clastic/non-clastic ratio increases toward the northern part of the study area reaching maximum ratio at Tut-12 well and decreases toward the eastern part reaching its minimum ratio at Tut-6 well.
Four cross sections are constructed tentatively in
different directions to interpret the stratigraphy and structure of study area as shown in figure (8). Stratigraphic cross sections illustrate thickness variation and the change in lithologic characters or any break in the depositional continuity. The stratigraphic cross sections constructed with respect to top of Upper Bahariya Formation as shown in figure
Researcher 2016;8(7) http://www.sciencepub.net/researcher
57
(9). These show that all tops of formations in central part are higher.
Construction of lithofacies maps and stratigraphic cross sections reflect that environment changes from continental to shallow marine environment in eastern part.
Figure 8: Base map shows drilled wells location and cross section profiles of the study area.
a
b
D
Figure 9: Stratigraphic cross sections; a) cross section A-A ̀extends along NW-SE direction, b) cross section B-B ̀ extends along N-S direction, c) cross section C-C ̀ extends along NE-SW direction and d) cross section D-D ̀ extends along SW-SE direction.
II- Subsurface structure The aim of this part is to highlight on the
structural pattern of the study area. For this purpose geologic structural cross sections are constructed. The structural cross section constructed with respect to sea level datum. The structure in North Western Desert focusing on the Shushan Basin, consists mainly of parallel, elongated, titled fault blocks, that is, horst and half-graben structures, with associated erosion of the upthrown blocks (El Shazly 1977 & Hantar, 1990).
The structural cross sections in the study area as shown in figure (10) tentatively illustrate that there are many normal faults affected on Formations and forming horst blocks in some area. These faults form good structural traps in Tut field.
a b
c d
Figure 10: Structural cross sections; a) cross section A-A ̀extends along NW-SE direction, b) cross section B-B ̀ extends along N-S direction, c) cross section C-C ̀ extends along NE-SW direction and d) cross section D-D ̀ extends along SW-SE direction.
b. Petrophysical Evaluation The Petrophysical evaluation, in terms of
evaluating the petrophysical characteristics (net pay
thickness, effective porosity ( %), shale content
( %), water saturation ( %), and hydrocarbon
saturation ( %)) and lithology determination of Kharita Formation, is gained through the computer
Researcher 2016;8(7) http://www.sciencepub.net/researcher
58
processed interpretation that passes through the quantitative interpretation techniques by using Interactive Petrophysics version 3.6 software program ® Schlumberger, 2010.
The petrophysical characteristics and lithology are presented vertically in the form of litho-saturation crossplots, laterally in the form of iso-parametric maps and lithological crossplots.
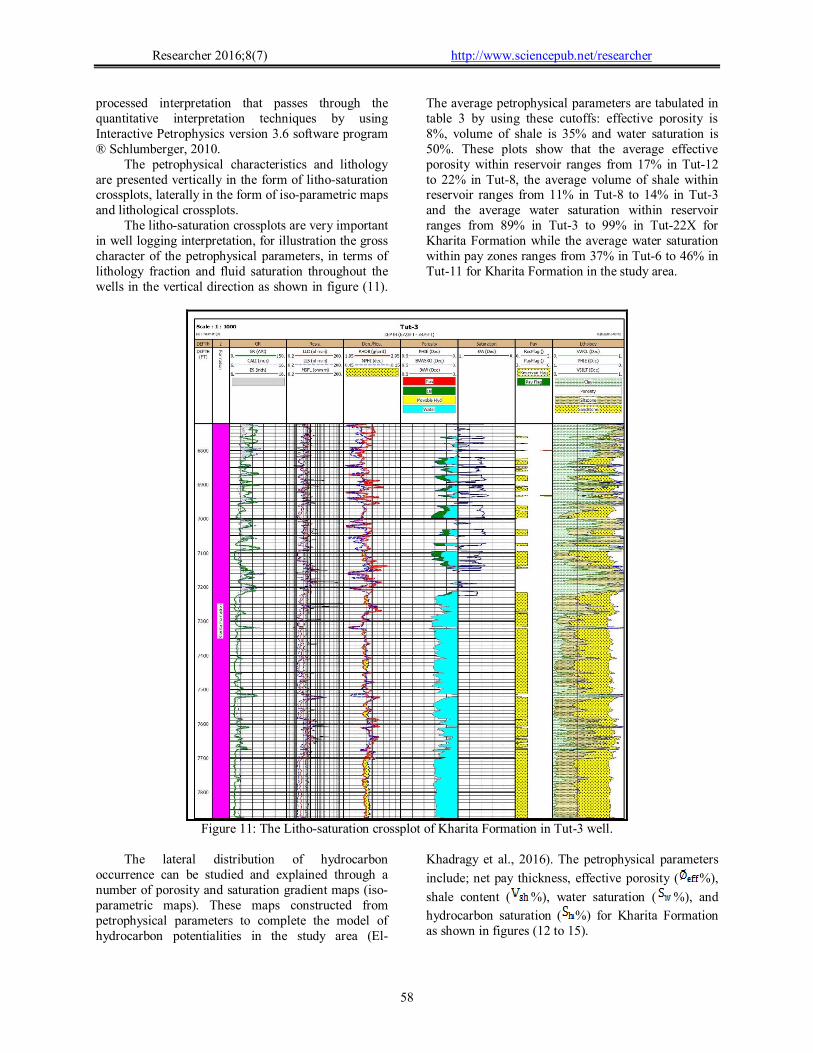
The litho-saturation crossplots are very important in well logging interpretation, for illustration the gross character of the petrophysical parameters, in terms of lithology fraction and fluid saturation throughout the wells in the vertical direction as shown in figure (11).
The average petrophysical parameters are tabulated in table 3 by using these cutoffs: effective porosity is 8%, volume of shale is 35% and water saturation is 50%. These plots show that the average effective porosity within reservoir ranges from 17% in Tut-12 to 22% in Tut-8, the average volume of shale within reservoir ranges from 11% in Tut-8 to 14% in Tut-3 and the average water saturation within reservoir ranges from 89% in Tut-3 to 99% in Tut-22X for Kharita Formation while the average water saturation within pay zones ranges from 37% in Tut-6 to 46% in Tut-11 for Kharita Formation in the study area.
Figure 11: The Litho-saturation crossplot of Kharita Formation in Tut-3 well.
The lateral distribution of hydrocarbon
occurrence can be studied and explained through a number of porosity and saturation gradient maps (iso-parametric maps). These maps constructed from petrophysical parameters to complete the model of hydrocarbon potentialities in the study area (El-
Khadragy et al., 2016). The petrophysical parameters
include; net pay thickness, effective porosity ( %),
shale content ( %), water saturation ( %), and
hydrocarbon saturation ( %) for Kharita Formation as shown in figures (12 to 15).

Researcher 2016;8(7) http://www.sciencepub.net/researcher
59
Table 3: The average petrophysical parameters for reservoirs in Kharita Formation that obtained from petrophysical evaluation of the study area.
Figure 12: Net pay thickness map of of Kharita Formation shows an increase in net pay thickness toward some areas of northern and central parts of the study area at Tut-14 and Tut-1X and decreased toward the southern part of the study area at Tut-8 and Tut-22X.
Figure 13: Effective porosity map of Kharita Formation which observed within the range from 18% in Tut-22X to 22% in Tut-8.The highest value of effective porosity is found in middle part of the southern direction of the study area, while the lowest value of effective porosity is found in the southwestern part.
Figure 14: Shale content map of Kharita Formation which illustrates that the shale content ranges 11% in Tut-8 to 14% in Tut-3. The shale content increases toward the northern part while it decreases toward the other parts of the study area.
Figure 15: Water saturation map of Kharita Formation shows that the most water saturation occurrence is observed within the range of 89% in Tut-3 to 99% in Tut-22X. The highest water saturation value is found at the southern part of the study area while the lowest water saturation value is found at the northern and central parts where the hydrocarbon saturation increases.
The lithologic and mineralogical compositions
were identified qualitatively through the utilizing of crossplots which were established by using the different petrophysical parameters (Shazly and Ramadan, 2011). In this work constructed neutron-density and M-N crossplots for identifying lithology of Formations.
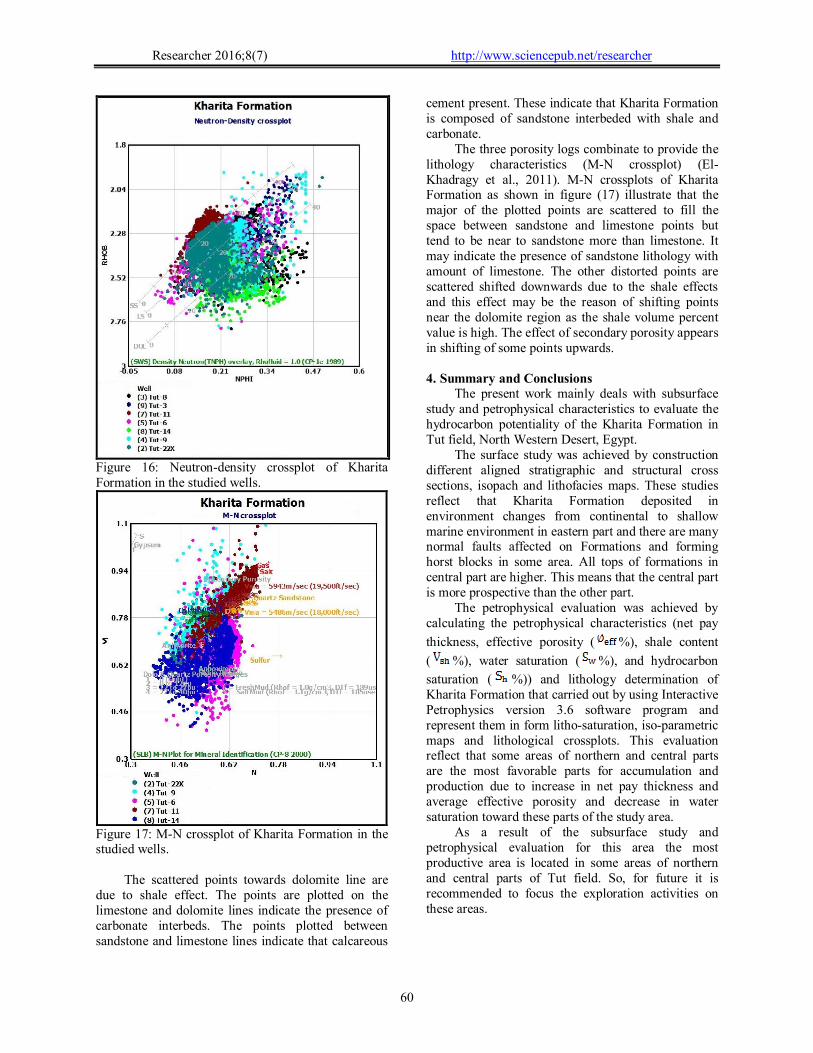
Neutron-density crossplots are commonly used to determine the lithology (using the neutron and density logs) and accurately evaluate the matrix porosity of carbonate rocks. In this case, the bulk density (RHOB) and neutron porosity (NPHI) readings are plotted together (Poupon and Leveaux, 1971). Neutron-density crossplots of Kharita Formation as shown in figure (16) illustrate that the points are aligned on sandstone line indicate sandstone beds.
Researcher 2016;8(7) http://www.sciencepub.net/researcher
60
Figure 16: Neutron-density crossplot of Kharita Formation in the studied wells.
Figure 17: M-N crossplot of Kharita Formation in the studied wells.
The scattered points towards dolomite line are due to shale effect. The points are plotted on the limestone and dolomite lines indicate the presence of carbonate interbeds. The points plotted between sandstone and limestone lines indicate that calcareous
cement present. These indicate that Kharita Formation is composed of sandstone interbeded with shale and carbonate.
The three porosity logs combinate to provide the lithology characteristics (M-N crossplot) (El-Khadragy et al., 2011). M-N crossplots of Kharita Formation as shown in figure (17) illustrate that the major of the plotted points are scattered to fill the space between sandstone and limestone points but tend to be near to sandstone more than limestone. It may indicate the presence of sandstone lithology with amount of limestone. The other distorted points are scattered shifted downwards due to the shale effects and this effect may be the reason of shifting points near the dolomite region as the shale volume percent value is high. The effect of secondary porosity appears in shifting of some points upwards. 4. Summary and Conclusions
The present work mainly deals with subsurface study and petrophysical characteristics to evaluate the hydrocarbon potentiality of the Kharita Formation in Tut field, North Western Desert, Egypt.
The surface study was achieved by construction different aligned stratigraphic and structural cross sections, isopach and lithofacies maps. These studies reflect that Kharita Formation deposited in environment changes from continental to shallow marine environment in eastern part and there are many normal faults affected on Formations and forming horst blocks in some area. All tops of formations in central part are higher. This means that the central part is more prospective than the other part.
The petrophysical evaluation was achieved by calculating the petrophysical characteristics (net pay
thickness, effective porosity ( %), shale content
( %), water saturation ( %), and hydrocarbon
saturation ( %)) and lithology determination of Kharita Formation that carried out by using Interactive Petrophysics version 3.6 software program and represent them in form litho-saturation, iso-parametric maps and lithological crossplots. This evaluation reflect that some areas of northern and central parts are the most favorable parts for accumulation and production due to increase in net pay thickness and average effective porosity and decrease in water saturation toward these parts of the study area.
As a result of the subsurface study and petrophysical evaluation for this area the most productive area is located in some areas of northern and central parts of Tut field. So, for future it is recommended to focus the exploration activities on these areas.

Researcher 2016;8(7) http://www.sciencepub.net/researcher
61
Corresponding Author: Neamat Aboelhassan Geology Department, Faculty of Science, Damanhour University, Egypt Telephone:+201285813589 E-mail: [email protected]
References 1. Abdine, A.S. Deibis, S., 1972: Lower Cretaceous-
Aptian sediments and their oil prospects in the Northern Western Desert, Egypt. 8th Arab Petrol. Conf., Algiers. No. 74 (B-3), 17 p.
2. Barakat, M.G. and Darwish, M., 1987: Contribution to Lithostratigraphy of the Lower Cretaceous Sequence in Mersa Matruh area, North Western Desert, Egypt. M.E.RC. Ain Shams Univ. Earth Sci. Ser., Vol.1, pp. 48-66.
3. EGPC (Egyptian General Petroleum Corporation), 1992: Western Desert, oil and gas fields, a
comprehensive overview. EGPC Petrol. Expl. and Prod. Conf., Cairo, pp. 1-431.
4. El Gezeery, N.H., Mohsen, S.M. and Farid M.I., 1972: Sedimentary Basins of Egypt & their petroleum prospect. 8th Arab Petrol. Conf., Algiers. No. 83 (B-3), 13 p.
5. El-Kadi, H., Hassneien, I. and Ghazaly, A., 1998: Sedimentlogical & Petrophysical studies for Hydrocarbon Evaluation of Cretaceous Rocks in the North Western Desert, Egypt. EGPC, 14th Petrol. Expl. and Prod. Conf. Cairo, 16 p. (poster).
6. El-Khadragy, A.A., Ghorab, M.A., Shazly, T.F., Ramadan M. and Zein, M., 2011: Application of Well Logging Tool to Determine the Minerals Composition of the G Member in Abu Roash Formation, El-Razzak Oil Field, Northern Western Desert, Egypt. Australian Journal of Basic and Applied Sciences, 5(11), pp. 634-658.
7. El-Khadragy, A.A., Saad, M.H. and Azab, A., 2010: Crustral modeling of south Sitra area, north Western Desert, Egypt using Bouguer gravity data. Jour. of Applied Sci. Res., 61 (1), pp.22-27.
8. El-Khadragy, A.A., Shazly, T.F., Ramadan M. and El-Sawy, M.Z., 2016: Petrophysical investigations to both Rudeis and Kareem formations, Ras Ghara oil field, Gulf of Suez, Egypt. Egyptian Journal of Petroleum (2016).
9. El Nady, M.M., 2013: Geothermal History of Hydrocarbon Generation of Wells in the North Western Desert, Egypt. Energy Sources, Part A: Recovery, Utilization, and Environmental Effects Volume 35, Issue 5, pp. 401-412.
10. El- Shaarawy, Z. and Montasser, S., 1996: Positive Flower Structure in the North Western Desert of Egypt and its effect on Hydrocarbon Accumulation.
EGPC Petrol. Expl. and Prod. Conf., Cairo, pp. 87-102.
11. El-Shazly, E.M., 1977: The geology of the Egyptian region. In: Kanes, A.E.M., and Stehli, F.G. (Eds.). The Ocean Basins and Margins. Plenum, New York, pp. 379-444.
12. Hanter, G., 1990. North Western Desert. In Said, R. (ed.): The Geology of Egypt. A.A. Balkema, Rotterdam, Brookfield (pub.), pp.293- 320.
13. Khaled, D.A.M, 1974: Jurassic Prospects in the Western Desert, Egypt. EGPC, 4th Petrol. Expl. and Prod. Conf., Cairo, pp. 214-223.
14. Meshref, W.M., 1996: Cretaceous tectonics and its impact on oil exploration in Northern Egypt. Geol. Soc. Egypt, Spec. Publ. 2, pp. 199-241.
15. Norton, P., 1967: Rock stratigraphic nomenclature of the Western Desert. Internal Report, Pan-American Oil Co., Cairo, 18 p.
16. Poupon, A. and Leveaux, J., 1971: Evaluation of
Water Saturation in shaly Formation," Trans., Ann. SPWLA Logging Symposium.
17. Schlumberger, 1984: Well Evaluation Conference, Egypt. Geology of Egypt, pp. 1-64.
18. Schlumberger, 1995: Well Evaluation Conference, Egypt, 87 p.
19. Shalaby, M.R., Abdel Hamid, A.T. and Abu Shady, A., 2000: Structural setting & Sedimentary Environments using Dipmeter Analysis of some Jurassic reservoirs, North Western Desert, Egypt. 5th International Conf. Geology of the Arab World, Cairo Univ., Egypt, pp. 217-220.
20. Shalaby, M.R., Hakimi, M.H. and Abdullah, W.H., 2011: Geochemical characteristics and hydrocarbon generation modeling of the Jurassic source rocks in the Shushan Basin, north Western Desert, Egypt. Marine and Petroleum Geology, V. 28, pp. 1611-1624.
21. Shazly, T.F. and Ramadan M., 2011: Well Logs Application in Determining the Impact of Mineral Types and Proportions on the Reservoir Performance of Bahariya Formation of Bassel-1x Well, Western Desert, Egypt. Journal of American Science, 2011; 7(1).
22. Warner, L., 1977: "An introduction to the technology of subsurface waste water injection". Municipal Environmental Research Laboratory, U.S., 334p.
23. Zein El-Din, M.Y., Abd El-Gawad, E.A., El-Shayb, H.M., and Haddad, I.A., 2001: Geological studies and hydrocarbon potentialities of the Mesozoic rocks in Ras Kanayis onshore area, North Western Desert, Egypt. Annals of the Geological Survey of Egypt, XXIV, pp. 115-134.
7/25/2016