researching marginalized minorities in the uk higher ... · university of seville ... researching...
TRANSCRIPT
Page 0 of 55
This report was prepared in December 2015 as part of the Work Package 5 “Researching
marginalized minorities in higher education institutions: policies and practice” of the Higher
Education Internationalization and Mobility (HEIM) project.
HEIM is funded by Horizon 2020 Marie Sklodowska-Curie Actions and focused on how
principles of equity and inclusion can be applied to internationalization strategies and programs in
higher education, as well as on developing research and innovation capacity in this field. The
project is implemented by Centre for Higher Education and Equity Research (CHEER) at the
University of Sussex (United Kingdom), in partnership with University of Umea (Sweden),
University of Seville (Spain), and Roma Education Fund (Hungary).
The report is composed of two briefing papers, one on social dimension of higher education
system in the UK prepared by Stela Garaz, Ph.D., Program and Studies Officer at Roma Education
Fund, and another on Roma’s access to education in the UK prepared by Gabriela Petre, who is
Roma from Romania currently studying in the 2nd year of Ph.D. program at National School of
Political and Administrative Studies in Bucharest and who is Roma Education Fund scholarship
beneficiary. The briefing papers are based on documentary analysis and discussions with faculty
and administrative staff of the University of Sussex, conducted between 30th of October and 20th of
December, 2015 in Brighton, during the secondment of Roma Education Fund representatives at
the University of Sussex.
The two participants in the secondment Stela Garaz and Gabriela Petre would like to thank Dr.
Tamsin Hinton-Smith, Tanja Jovanovic, and Kourosh Kouchakpour for their hospitality and
support in all the research and logistics related aspects before and during the secondment. They
would also like to express their gratitude to all faculty and administrative staff members of the
University of Sussex who, despite their very busy schedule and daily workload, found the time to
meet them for discussing about the access to higher education in the UK, which greatly helped the
two secondees to comprehend in a relatively short period of time what the main barriers and
enablers are for socio-economically disadvantaged groups in the UK in accessing higher
education.
Researching Marginalized
Minorities in the UK Higher
Education and the Case of Roma:
Policies and Practice

Page 1 of 55
Summary Points:
Despite the UK government’s attempts of “widening participation” to higher education, there are
groups who still face underrepresentation, which suggests that expansion of higher education did not
necessarily imply equitability. People with disabilities, people whose parents attained relatively low
levels of formal education, people of working class background, as well as ethnic Roma, are still
underrepresented in higher education.
Among all disadvantaged groups, Roma minorities are by far the least represented in the UK
higher education system. Existing estimates suggest that only 3-4% of Roma population attained
higher education, which is significantly less compared to the ratio of mainstream population who
attained higher education (41% in the age group 25-64). The low ratios of secondary education
completion, the cumulated disadvantages faced by Roma minorities (including poverty), as well as the
financial costs associated with higher education are among the main barriers preventing more Roma to
study at university.
The UK system offers an alternative entry route to higher education to the traditional route,
individuals not in possession of a secondary school diploma having the possibility to apply for
preparatory courses and then being eligible to apply for higher education upon their successful
completion. The loans available for preparatory courses attendees and the possibility to have them
written off upon eventual enrolment to higher education constitute a potentially viable alternative route,
which may be particularly useful for socio-economically disadvantaged people.
The financial costs for higher education expected to be covered by students and their families are
significant, since tuition fees and living costs can constitute together between 16% and 48% of the
yearly net income of a family with both parents earning average wages. For socio-economically
disadvantaged students there are possibilities of receiving financial aid in form of state or university-
based grants, but usually the amounts are too small in comparison with the total costs.
At the same time, the UK higher education system has a relatively long experience with study loans.
At the moment, study loans seem to be rather accessible and repayment conditions reasonable, although
it remains to be seen in the years to come if conditions for accessing loans will become stricter and
repayment conditions harder. It also remains to be seen how big of a financial burden will repaying
these loans become for current students when they enter the job market. The prospects of having to pay
study loans in the same period of life when young professionals normally need financial resources for
building their own families and households might prove to be burdensome.
The case of the UK higher education system illustrates that even when access for disadvantaged and
marginalized minorities is opening, equity is not necessarily guaranteed: inequalities can continue
manifesting in other forms inside higher education. Once university studies become more accessible,
the importance of what kind of degree one gets and from which university one gets the respective
degree increases as well, particularly at the stage of employment upon graduation. These new
inequalities raise new barriers for social mobility beyond the mere access to higher education.
Page 2 of 55
Briefing Paper 1
Social Dimension of Higher
Education in the UK: Policies and
Practice
Author:
Stela Garaz
Program and Studies Officer at Roma Education Fund, Hungary

Page 3 of 55
TABLE OF CONTENTS
Introduction ................................................................................................................................................................. 4
1. Disadvantaged groups and their representation in the UK higher education .................................................... 5
1.1. Ethnic minorities (other than Roma) and students with migrant background ................................ 5
1.2. Roma .............................................................................................................................................. 7
1.3. Students with low parental level of education and/or working class background .......................... 8
1.4. Women ......................................................................................................................................... 12
1.5. Students with disabilities .............................................................................................................. 13
1.6. Students from rural areas ............................................................................................................. 13
Section Summary ................................................................................................................................ 13
2. Entry routes to higher education, flexibility of studies, and social dimension ................................................. 14
2.1. The traditional entry route ............................................................................................................ 14
2.2. Non-traditional entry routes ......................................................................................................... 15
2.3. Part time studies ........................................................................................................................... 16
2.4. Student employment..................................................................................................................... 17
2.5. Widening participation policies ................................................................................................... 17
Section Summary ................................................................................................................................ 18
3. Studying in Higher Education in the UK: Financial Implications and Existing Support Schemes................ 18
3.1. Tuition fees .................................................................................................................................. 19
3.2. Living costs .................................................................................................................................. 20
3.3. Costs of higher education in perspective ...................................................................................... 20
3.4. Student financial aid ..................................................................................................................... 21
3.5. Student Loan System.................................................................................................................... 22
Section Summary ................................................................................................................................ 23
Conclusions ................................................................................................................................................................ 23
Annex .......................................................................................................................................................................... 25
References: ................................................................................................................................................................. 26
Page 4 of 55
Introduction
Compared to other developed countries, the UK has one of the highest population ratios with
higher education attainment. Eurostat data for 2014 indicate that within the UK population aged
between 30 and 34, 48% successfully completed tertiary studies (e.g. university, higher technical
institution, etc.). This ratio is higher than the respective ratio in the Euro area (36.5%) and also
than in the entire EU area (38%) for the same age group. Only in a few EU countries the
population ratio who attained higher education is higher than in the UK, i.e. in Switzerland,
Sweden, Norway, Ireland, Cyprus, Luxembourg, and Lithuania, where it ranges between 49% and
53% respectively (Eurostat, 1992-2014).
The access to tertiary education in the UK has also been in constant increase. If in 1992 the ratio of
the UK population aged between 30 and 34 who successfully completed tertiary studies was only
21%, in 1998 it attained 28%, in 2005 - 35%, while in 2010 - 43% (Eurostat, 1992-2014). The
absolute number of students also increased considerably throughout the decades. If in the 1970s
there were about 600,000 university students in the UK, nowadays there are over 2.5 million
(Milburn A. 2012, p.19). The increase is also visible when comparing inter-generational
educational attainment, with 48% of population aged between 30 and 34 having attained higher
education, compared to only 37% in the 45-54 age group and 33% in the 55-64 age group (OECD
2014).
This is in line with a global trend of increase in ratios of population who attained higher education
that started in the middle of the XXth century, resulted from a combination of factors including
changes in the structure of labor market, shift from manufacturing to service based economy
implying demand for new skills, and more recently, the emergence of knowledge-based economies
requiring more highly-skilled labor (Altbach et. al. 2009). Similarly, the British economy becomes
more and more service-based and its labor market more professionalized, while availability of jobs
requiring highly qualified professionals is in increase (Milburn A. 2012).
The figures above reveal that during the last decades, tertiary education in the UK expanded
considerably. But who has benefited of this expansion and to what extent did it imply an opening
access to marginalized minorities and other groups facing socio-economic disadvantages? Has this
growth been accompanied by a more equitable access to tertiary education? What are the exact
policies and practices in the UK tertiary education system aimed at facilitating the access to higher
education for the marginalized and socio-economically disadvantaged groups and how effective
have they been in bringing more equity in accessing tertiary education? Based on the available
statistical information, existing reports and academic research, this briefing paper seeks to find
answers to these questions.
Unlike in some of the countries in Eastern and South-Eastern Europe, there are no affirmative-
action based programs in the UK targeting explicitly Roma population (the term “Roma” in this
paper refers not only to the Roma migrants from Central and Eastern Europe, but also to the
ethnicity category defined in the UK census and national policies as “Gypsies and Travelers”).
This is why this briefing paper focuses on analyzing the higher education environment in general,
in order to identify the alternative means to affirmative action through which the UK tertiary
education system might facilitate the access for Roma. Theoretically, an education system that
does not implement affirmative action tools, but that implements other policy measures aimed at
widening access for socio-economically disadvantaged students and/or for marginalized
minorities, may implicitly facilitate the access to tertiary education for Roma as well. Therefore,
analyzing the general tertiary education environment and its social dimension is highly relevant in
the context of studying Roma’s access to tertiary education.

Page 5 of 55
This briefing paper contains three main sections. The first aims at identifying the underrepresented
groups in tertiary education in the UK, taking as basis the groups that have been historically
underrepresented in the European higher education systems. The second section analyses the
access to higher education in the UK from the perspective of the allowed entry routes and the
flexibility of studies. The third section focuses on financial costs of higher education in the UK
that are supposed to be covered by students and their families, as well as identifies the availability
of financial support schemes. The concluding section summarizes the findings.
There are relevant differences among the four countries of the UK – England, Scotland, Wales,
and Northern Ireland – with regards to policies aimed at facilitating the access to higher education
for socio-economically disadvantaged groups, but also with regards to the financial costs for
attending higher education. Therefore, throughout this briefing paper all such relevant differences
are mentioned and data are respectively presented at country level.
1. Disadvantaged groups and their representation in the UK higher education
In order to improve the access to higher education for the marginalized and socio-economically
disadvantaged groups, countries should first put in place an efficient mechanism of systematic data
collection on the social composition of student body. In the UK the Higher Education Statistics
Agency (hereinafter: HESA) is the institution responsible for collection data on widening
participation in higher education. The Government has not established target numbers/ratios for
enrolment in higher education of specific categories of population; some individual universities
have such targets established via their Access Agreements, through which individual universities
establish the measures through which they are widening participation.
According to the European Higher Education Area (EHEA) report for the UK, the following
indicators on student body composition are collected at entry in higher education, during the
higher education studies, and at graduation: disability status, age, prior qualifications, socio-
economic background, gender, as well as ethnic/cultural/linguistic minority background. No data
is being collected on migrant status or religion (EHEA 2015). Based on the available data, the sub-
sections below summarize the representation of some of the potentially disadvantaged groups in
the UK higher education system.
1.1. Ethnic minorities (other than Roma) and students with migrant background
In case of the UK, it is difficult to separate the category of ethnic minorities from the category of
population with migrant background. This is because today’s ethnic minority population of the UK
largely results from the waves of relatively recent immigration, from 1950s and 1960s, from the
“New Commonwealth” Indian subcontinent, South-East Asia, Caribbean, and Africa (Connor H.
et. al. 2004, p. 8). This implies that many of today’s ethnic minority students are of migrant
background too, since the group is largely composed of second or third generation of immigrant
population. Other ethnic groups in the UK immigrated even more recently. This is why in this
subsection students belonging to ethnic minority groups and students with migrant background are
presented together. According to the 2011 population census, the total UK-domiciled ethnic
minority population was 8,171,819, or 13% of the total UK population (UK Population Census
2011).

Page 6 of 55
In the UK students are asked at enrollment in universities and colleges to categorize themselves to
an ethnic origin group, using the ethnicity classification based on the population census that
include the visible minorities of the UK for the HESA student records. HESA data contain the
following ethnic groups: White, Black or Black British - Caribbean, Black or Black British –
African, Other Black background, Asian or Asian British – Indian, Asian or Asian British –
Pakistani, Asian or Asian British – Bangladeshi, Chinese, Other Asian Background, Other
(including mixed). Hence, there is no separate category for “Gypsies, Roma, and Traveler”. Figure
1 compares the ratio of each of the large ethnic groups in the higher education pool of the UK
domiciled students on the one hand, and within the UK population on the other hand. The data
suggest that the major ethnic minority groups are generally well represented in the UK tertiary
education.
Figure 1. Representation of major UK ethnic groups in higher education
Source: UK Population census 2011, HESA 2013-14.
Although these figures reveal a generally equitable representation of ethnic minorities in the UK
higher education system, inequalities still exist. The existing research suggests that ethnic minority
groups in the UK tend to concentrate in lower status institutions and implicitly are
underrepresented in elite and highly ranked institutions. Minorities are more likely to study in
post-92 institutions than in pre-92 institutions1 (Noden et. al. 2014, Connor H. et. al. 2004). The
available data also suggests that this is not so much related to the ethnicity by itself, as to other
confounding characteristics of ethnic minority students such as their socio-economic status, type
of secondary school attended, and school grades (Noden et. al. 2014). The latter are confirmed by
some previous research arguing that ethnic minorities (except for Indians) were less likely to hold
A/AS levels 2 of qualifications at enrollment, which was particularly the case for Black and
Black/African students; they also came more frequently from secondary education institutions
1 In the UK higher education system, post-92 universities refer to the so-called “new universities” created or renamed as
such in 1992, when John Mayor’s government gave university status to a range of former polytechnics, colleges of
higher education, or central institutions, through the Further and Higher Education Act adopted in 1992. The pre-92
universities are the universities that acquired their status before the 1992 wave of new universities creation. The so
called “Russell-group” of 20 UK universities that are perceived as the most prestigious universities, are all pre-92
universities (Purcell et. al. 2009). 2 In the UK education system, A/AS (Advanced or Advanced Subsidiary levels are two year academic programs taught
in colleges or schools, after the successful graduation of the compulsory secondary education. Enrolment in the A/AS
level programs generally require top grades in the General Certificate of Secondary Education. A/AS level qualifications
are considered to be the gateway to most universities and colleges in the UK
(http://www.bbc.co.uk/schools/parents/alevels/, https://www.nidirect.gov.uk/articles/and-levels).
87%
3%7%
3%0
78%
6%9%
4%2%
White Black Asian Other (including
mixed)
not known
ethnic composition of UK
population, census 2011
higher education students
enrolled in the 2013-14
academic year

Page 7 of 55
having relatively lower results on students’ learning outcome than the White university students
(Connor H. et. al. 2004).
Existing research also suggests that academic attainment in the UK higher education system is
lower for ethnic minority graduates than for White graduates, and that this difference is only partly
explained by variations in students’ qualifications on entry into higher education (Richardson J.,
2008). Minority students are less likely to receive a higher class degree, while Black and Black
African minorities in particular receive the lowest degree outcomes (Connor H. et. al. 2004).
HESA data for 2013-14 reveal that there is no significant difference in studied subjects between
ethnic minorities and white students, or across the different ethnic groups considered for the
statistical data (HESA 2014). However, research based on data from the beginning of 2000s point
to such differences, with twice as high minority representation in technical and vocational subjects
(Connor H. et. al. 2004).
Ethnic minorities also seem to be less successful than white students in their transition from
studies to employment and this kind of disadvantage seems to persist over the last decade. A study
published in 2004 found that minority graduates had higher initial unemployment rates than White
graduates (Connor H. et. al. 2004). Another study, published in 2012, concluded that ethnic
minority graduates in the UK were less likely to find employment than white British people, and
that they were more likely to be in jobs for which they were overqualified (Rafferty A. 2012). This
was also the conclusion of a recent study conducted by researchers from the University of Essex
and published at the beginning of 2016 (Zwysen W. and Longhi S, 2016) that revealed that ethnic
minority university graduates in the UK are between 4% and 15% less likely to be employed six
months after graduation (depending on the specific minority group) in comparison to their white
British peers.
The 2016 study attributes this difference to several factors: first, to the fact that ethnic minorities
tend to graduate less prestigious universities with less competitiveness for the job market, second,
to the fact that minorities have on average lower grades in higher education, third, to the fact that
they are less likely to come from high social class background which may imply lower access to
the financial and social resources contributing to successful employability, fourth, to the fact that
ethnic minorities tend to come from more deprived areas, which implies reduced access to the type
of local community network that could provide the social contacts helping employability. In
addition to differences in employment rates six months after graduation, researchers also found
differences in earnings three and a half years after graduation, ethnic minority graduates
(especially women) earning less on average than their white British counterparts. Similar with the
case of access to higher education, ethnic minority groups are not all alike in their experience with
employment outcomes, with the Pakistani and Bangladeshi graduates facing specifically the
largest gaps in employment outcomes compared to the British white graduates (Zwysen W. and
Longhi S, 2016).
1.2. Roma
There are various estimates regarding the present Roma population size in the UK. World Bank
estimated that in 2010 there were 62,218 Roma in the UK (Council of Europe, 2012). In the 2011
UK population census 58,000 people in England and Wales identified themselves as “Gypsy” or
“Irish Travelers” (Office for National Statistics, 2014). Other estimates vary between 150,000 and
300,000 people, while Council of Europe operates with the average estimate of 225,000 Gypsies,
Roma, and Traveler people in the UK (including Roma migrants), i.e. 0.36% of the UK total
population (Council of Europe, 2012). The 2011 population census data reveal that the proportion
Page 8 of 55
of population with no academic or professional qualification was the largest among Gypsy or Irish
Travelers (60%), i.e. almost three times higher than for England and Wales population as a whole
(23%) (Office for National Statistics, 2014).
The 2014 HESA data indicate that only 3 to 4% of Roma in the UK aged 18 and above attend
university level education (calculation based on HESA data, in Danvers E. 2015), which is a very
low ratio compared to the 41% of the total UK population aged 25-64 who attained tertiary
education (OECD 2014). One of the reasons for particularly low tertiary education attainment
among Roma is the small ratio of secondary education completion. The available data suggest that
only an estimated 80% of Roma in the UK transfer between primary and secondary school, and
just over half still attend school until Year 11 that is usually the final year of secondary school.
Absenteeism and change of schools have also been reported as being highest among Roma pupils
in secondary school (Wilkin A. et. al. 2010). Existing reports also show that Roma pupils have
significantly lower school achievements than non-Roma pupils and also than the Free School Meal
eligible pupils3 (Department for Education and Skills, 2006, Foster B. and Norton P. 2012, p. 91).
Roma pupils are also categorized in the group of pupils with special education needs at
disproportionately higher rates than non-Roma pupils and they are also excluded from schools4
more often (Foster B. and Norton P. 2012, pp. 93, 100).
Research based on empirical evidence about the UK Roma students’ experience with higher
education is still very scarce. Existing accounts are only based on anecdotal evidence and a few
personal testimonies. One of the few existing articles on the topic suggests that there are more
Roma female than male university students in the UK, perhaps because the male young Roma are
more concerned to carry on the traditional family business (Clark C. 2004). The reason for which
researching ethnic Roma in higher education in the UK is hard might be related to the Roma
students’ “invisibility”, since students prefer not to share their ethnic identity for fear of being
stigmatized (Clark C. 2004).
1.3. Students with low parental level of education and/or working class background
The population with relatively low socio-economic status and working class background has also
been historically the least represented group in higher education. As the data presented below
reveal, despite the widening access to higher education in the UK during the last decades, the
socio-economic status still remains a strong predictor for higher education attainment, in terms of
general enrolment and successful graduation, but also in terms of enrolment in the most
prestigious universities.
One of the proxy indicators often used in the literature for measuring students’ socio-economic
background is parental level of education. Besides being used as a way of measuring socio-
economic background, students’ parental level of education may also reveal the extent to which
higher education is accessible by first generation students. OECD collects regularly data on
3 Free School Meals designate a statutory benefit available to school age children from families who receive other
qualifying benefits, such as income support or job seekers allowance, aimed at supporting families facing poverty. The
Free School Meals is often used in studies and reports as a proxy indicator for measuring the ratio of socio-economically
disadvantaged school children. 4 In the UK school system, headmasters can exclude a child from school if they misbehave in or outside the school. The
exclusion can be of a fixed term (for up to 45 school days per academic year), or permanently (case in which the child is
expelled). When the child is expelled temporarily but for more than 5 school days, the school must arrange suitable full-
time education from the sixth school day, e.g. at a pupil referral unit. In case of permanent exclusion, the school or local
council must inform the parents about alternative education that can be arranged. More information can be accessed at
https://www.gov.uk/school-discipline-exclusions/exclusions

Page 9 of 55
parental level of education for OECD countries, including for the UK. Figures 2, 3, and 4 present
such data for a range of European countries, which gives the possibility to also see the situation in
the UK in comparative perspective.
Figure 2. Participation in tertiary education of 20-34 year-old students whose parents have below
upper secondary education (2012)
Source: Organization for Economic Co-operation and Development 2014. Table A4.1a. See Annex 3 for notes
(www.oecd.org/edu/eag.htm). The highlight for England/ N. Ireland was done by the author.
Figure 3. Percentage of 25-64 year-old non-students whose educational attainment is higher than
(upward mobility), lower than (downward mobility) or the same as (status quo) that of their parents
Source: Organization for Economic Co-operation and Development 2014. Table A4.4. See Annex 3 for notes
(www.oecd.org/edu/eag.htm). The highlight for England/ N. Ireland was done by the author.
4%
14%
0
10
20
30
40
50
60
Cze
ch R
epu
bli
c
Jap
an
Ger
man
y
Est
on
ia
Pola
nd
Can
ada
No
rway
Un
ited
Sta
tes
Ru
ssia
n F
eder
atio
n*
Fin
lan
d
Slo
vak
Rep
ub
lic
Au
stri
a
Sw
eden
Eng
land
/N. Ir
elan
d…
Den
mar
k
Fla
nd
ers
(Bel
giu
m)
Av
erag
e
Fra
nce
Ko
rea
Au
stra
lia
Net
her
lan
ds
Irel
and
Ital
y
Spai
n
Proportion of young students (20-34 year-olds) in tertiary education whose parents have below upper
secondary education
Proportion of parents with below upper secondary education in the total parent population%
38%
14%
47%
0%10%20%30%40%50%60%70%80%90%
100%
Cze
ch R
epu
bli
c
Ger
man
y
Au
stri
a
Un
ited
Sta
tes
Slo
vak
Rep
ub
lic
Ital
y
No
rway
Den
mar
k
En
gla
nd
/N.
Irel
and
…
Sp
ain
Av
erag
e
Au
stra
lia
Jap
an
Sw
eden
Est
on
ia
Can
ada
Net
her
lan
ds
Po
lan
d
Irel
and
Fra
nce
Fla
nd
ers
(Bel
giu
m)
Fin
lan
d
Ko
rea
Russ
ian
Fed
erat
ion*
Upward mobility Downward mobility Status quo
Page 10 of 55
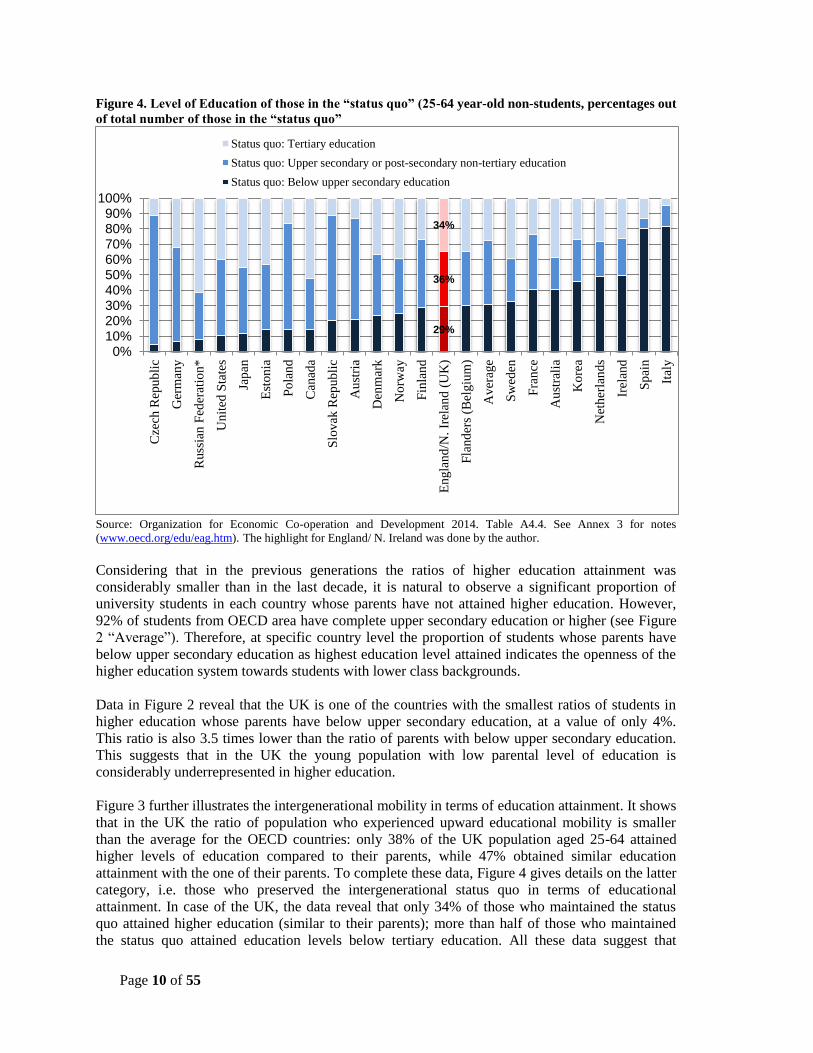
Figure 4. Level of Education of those in the “status quo” (25-64 year-old non-students, percentages out
of total number of those in the “status quo”
Source: Organization for Economic Co-operation and Development 2014. Table A4.4. See Annex 3 for notes
(www.oecd.org/edu/eag.htm). The highlight for England/ N. Ireland was done by the author.
Considering that in the previous generations the ratios of higher education attainment was
considerably smaller than in the last decade, it is natural to observe a significant proportion of
university students in each country whose parents have not attained higher education. However,
92% of students from OECD area have complete upper secondary education or higher (see Figure
2 “Average”). Therefore, at specific country level the proportion of students whose parents have
below upper secondary education as highest education level attained indicates the openness of the
higher education system towards students with lower class backgrounds.
Data in Figure 2 reveal that the UK is one of the countries with the smallest ratios of students in
higher education whose parents have below upper secondary education, at a value of only 4%.
This ratio is also 3.5 times lower than the ratio of parents with below upper secondary education.
This suggests that in the UK the young population with low parental level of education is
considerably underrepresented in higher education.
Figure 3 further illustrates the intergenerational mobility in terms of education attainment. It shows
that in the UK the ratio of population who experienced upward educational mobility is smaller
than the average for the OECD countries: only 38% of the UK population aged 25-64 attained
higher levels of education compared to their parents, while 47% obtained similar education
attainment with the one of their parents. To complete these data, Figure 4 gives details on the latter
category, i.e. those who preserved the intergenerational status quo in terms of educational
attainment. In case of the UK, the data reveal that only 34% of those who maintained the status
quo attained higher education (similar to their parents); more than half of those who maintained
the status quo attained education levels below tertiary education. All these data suggest that
29%
36%
34%
0%10%20%30%40%50%60%70%80%90%
100%
Cze
ch R
epu
bli
c
Ger
man
y
Russ
ian
Fed
erat
ion*
Un
ited
Sta
tes
Jap
an
Est
on
ia
Po
lan
d
Can
ada
Slo
vak
Rep
ub
lic
Au
stri
a
Den
mar
k
No
rway
Fin
lan
d
En
gla
nd
/N.
Irel
and
(U
K)
Fla
nd
ers
(Bel
giu
m)
Av
erag
e
Sw
eden
Fra
nce
Au
stra
lia
Ko
rea
Net
her
lan
ds
Irel
and
Sp
ain
Ital
y
Status quo: Tertiary education
Status quo: Upper secondary or post-secondary non-tertiary education
Status quo: Below upper secondary education

Page 11 of 55
despite the widening participating in the UK higher education in the last decades people with low
parental levels of education, who are also the most likely to be in the category of those with
working class background, still have limited access.
The relatively low attendance of higher education by students with working class background
could be linked to the fact that they are less likely to attend selective secondary schools than
students of middle or upper classes. The existing research on English education system reveals that
there is a substantive difference in enrollments in higher education between students who attended
selective secondary schools and those who attended non-selective secondary schools. In England
selective secondary schools are the ones where admission is based on exams, tests and/or
interviews. Pupils who attended selective state schools were found to be 40% more likely to enroll
in universities and 30% more likely to enroll in high status universities than pupils who attended
non-selective schools. The authors of the research identified that two of the factors determining
this difference were school performance and proportion of eligible pupils for free school meals
(Crawford C. 2014). Free school meal pupils and average state school pupils have in general lower
academic results than independent school pupils (see Figure 5), and as a result their chances to
enroll in higher education are lower as well.
Figure 5. Educational attainment by background
Source: Jerrim J. and Vignoles A, quoted in Milburn A. 2012, p. 28.
Even among those who manage to enroll in higher education inequalities persist. Socio-
economically disadvantaged students are clearly underrepresented in the most selective
universities. Data show that the most advantaged 20% students are seven times more likely to
study in the most selective universities than the 40% most disadvantaged students. The likelihood
of getting into Oxford or Cambridge Universities, the first two highest ranked universities in the
UK according to the University League Table5, is 2000 to 1 for a secondary school pupil eligible
for a Free School Meal (indicator for low social class background), compared to 20 to 1 for a pupil
of private secondary school (indicator for middle to high social class background) (Milburn A.
2012, p. 21). Students of relatively low social-economic status who make it to the university are
also more likely to drop out before graduation, compared to students from more affluent
5 See: http://www.thecompleteuniversityguide.co.uk/league-tables/rankings
Page 12 of 55
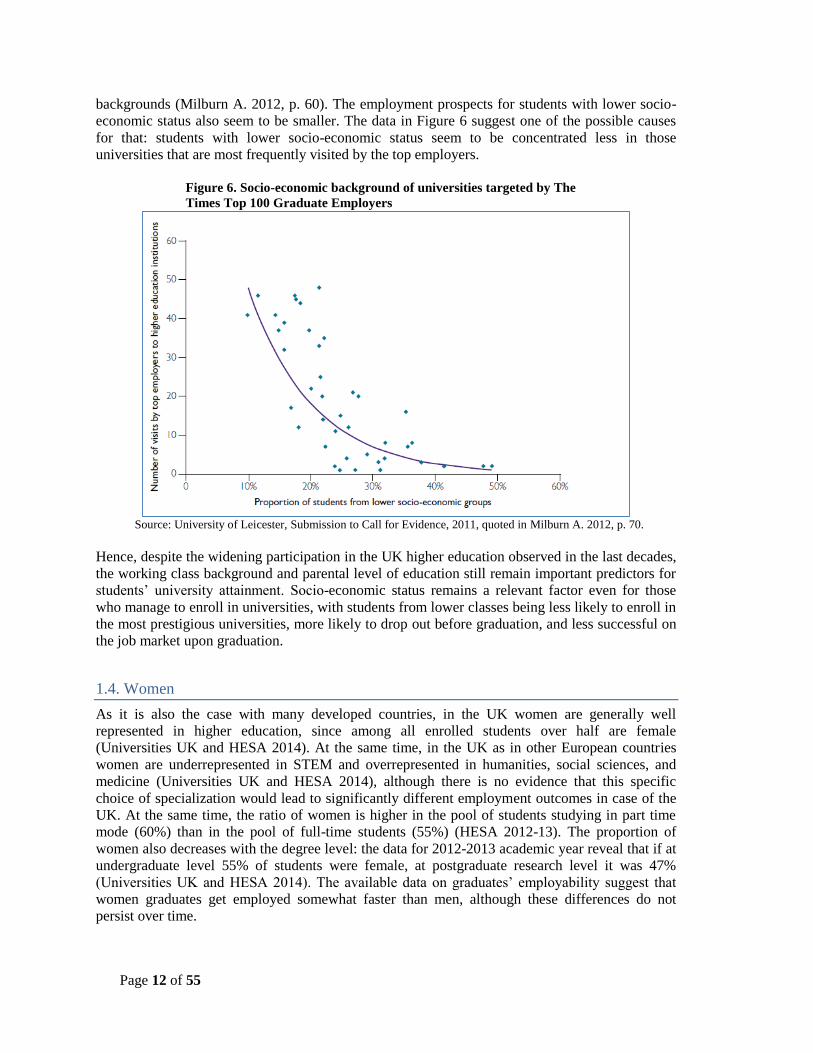
backgrounds (Milburn A. 2012, p. 60). The employment prospects for students with lower socio-
economic status also seem to be smaller. The data in Figure 6 suggest one of the possible causes
for that: students with lower socio-economic status seem to be concentrated less in those
universities that are most frequently visited by the top employers.
Figure 6. Socio-economic background of universities targeted by The
Times Top 100 Graduate Employers
Source: University of Leicester, Submission to Call for Evidence, 2011, quoted in Milburn A. 2012, p. 70.
Hence, despite the widening participation in the UK higher education observed in the last decades,
the working class background and parental level of education still remain important predictors for
students’ university attainment. Socio-economic status remains a relevant factor even for those
who manage to enroll in universities, with students from lower classes being less likely to enroll in
the most prestigious universities, more likely to drop out before graduation, and less successful on
the job market upon graduation.
1.4. Women
As it is also the case with many developed countries, in the UK women are generally well
represented in higher education, since among all enrolled students over half are female
(Universities UK and HESA 2014). At the same time, in the UK as in other European countries
women are underrepresented in STEM and overrepresented in humanities, social sciences, and
medicine (Universities UK and HESA 2014), although there is no evidence that this specific
choice of specialization would lead to significantly different employment outcomes in case of the
UK. At the same time, the ratio of women is higher in the pool of students studying in part time
mode (60%) than in the pool of full-time students (55%) (HESA 2012-13). The proportion of
women also decreases with the degree level: the data for 2012-2013 academic year reveal that if at
undergraduate level 55% of students were female, at postgraduate research level it was 47%
(Universities UK and HESA 2014). The available data on graduates’ employability suggest that
women graduates get employed somewhat faster than men, although these differences do not
persist over time.

Page 13 of 55
1.5. Students with disabilities
The latest available (2011) Eurostat figures reveal that in the UK the ratio of tertiary education
attainment within the population with disabilities varies between 25% and 47%, depending on the
type of disability, the lowest attainment rates being among those suffering of a disability leading to
limitation in work caused by a health condition or difficulty in a basic activity (25% and 30%
respectively) (Eurostat, 2011). Considering that for the general population this ratio is 47% (see
Introduction of this paper), it seems to be the case that the tertiary education attainment rates
among disabled are generally lower than the respective rates among the non-disabled.
In the 2012-13 academic year 10% of higher education students in the UK were known to have a
disability. However, their representation diminishes at the level of post-graduate studies, with 7%
of students known to have a disability in post-graduate part time studies and 6% - in post-graduate
full time studies (HESA 2012-13). According to available statistics for the 2014-15 academic year,
7% of full-time first degree students were receiving Disabled Students’ Allowance, which the
Higher Education Statistics Agency states as proxy indicator for the total number of disabled
students enrolled in the UK tertiary institutions (HESA 2014-15). Considering that about 19% of
total population of the UK is registered as suffering a disability (Papworth Trust 2014), this
category of population appears to be still underrepresented in the UK higher education system.
1.6. Students from rural areas
The UK is a highly urbanized country, with only 18% of rural population in 2014 (World Bank
data 1981-2015). Available data suggest that in UK poverty is concentrated in urban regions, and
not in the rural ones as it is generally the case in Eastern Europe. Statistical indicators for 2012-13
from the Department for Environment, Food and Rural Affairs of the UK Government reveal that
the ratio of population with relatively low income or with absolute low income is higher in urban
areas than in rural areas (Department for Environment, Food and Rural Affairs 2015(a)). An
earlier study of the Office for National Statistics (2011) also revealed that employment rates were
higher and unemployment rates were lower in rural areas as compared to the urban ones; levels of
reported crimes are also lower in the rural areas (Pateman, 2011).
Similarly, the population of rural areas appears to have higher education attainments than the
population of urban areas. Data from the 2013-14 academic year reveal that pupils in rural areas
generally live secondary school with higher grades than pupils in urban areas. The rates of full
time entries to higher education institutions in 2013-14 were also higher in the predominantly rural
areas, as compared to predominantly urban areas (Department for Environment, Food and Rural
Affairs 2015(b)). Data from the UK Office for National Statistics indicate that in 2011, 29.4% of
the population of England and Wales attained Bachelor degrees and higher, compared to only
26.7% in the urban areas. The ratio of population with no qualifications at all is also higher in
urban areas (23.0%) compared to rural areas (21.4%) (Office for National Statistics, 2013). Hence,
in the UK the rural population does not constitute an underrepresented group in higher education.
Section Summary
The data presented in this section suggest that despite the increased participation in the UK higher
education, inequalities still persist. Among the groups of population historically considered as
disadvantaged and with relatively limited access, only in the case of population from rural area the
access seems to be fully equitable, due to the fact that unlike in Eastern Europe, in the UK poverty
is not concentrated in rural areas. Women also seem to be fairly represented, although their

Page 14 of 55
representation diminishes at the level of post-graduate degrees; in addition, as it is the case in other
countries, in the UK women tend to concentrate in different fields of studies than men: they are
generally underrepresented in STEM specializations and overrepresented in humanities, social
sciences and medicine; however, there is no evidence that in the UK context this different choice
of specializations affect employability.
In case of other groups, one can observe either underrepresentation in the general participation to
higher education, or inequalities that manifest themselves inside higher education, for example
through the streaming of disadvantaged students in less prestigious universities, through higher
dropout rates and lower learning outcomes, or through more difficult transition from studies to
employment, or a combination of the two above. Underrepresentation in the general participation
can be observed in the case Roma and in the case of population with disabilities. Inequalities faced
inside higher education can be observed in the case of students with ethnic minority and migrant
background (other than Roma). A combination of the two can be observed in the case of students
with low parental level of education and/or working class background.
Among all the potentially disadvantaged groups Roma are by far the most underrepresented in the
UK higher education system. There are only 3-4% of Roma who attend higher education, which is
significantly smaller compared to the tertiary education attainment among the mainstream
population (41% in the 25-64 age group). Similarly with the countries in Eastern Europe, the
relatively low completion rates of secondary education among Roma, as well as the relatively low
learning outcomes among Roma who attain secondary education, seem to be among the main
reasons for low attainment of tertiary education. Hence, all measures implemented by the UK
universities aimed at widening participation seem to have an insignificant effect on Roma’s access
to higher education.
2. Entry routes to higher education, flexibility of studies, and social dimension
Beyond the financial costs for higher education that are discussed in section 3, the openness of
higher education system for socio-economically disadvantaged students is to a large extent
determined by the existence of alternative entry routes to higher education, as well as by the
flexibility of studies allowed during higher education. There are education systems in which only
one entry route is available, the one requiring the possession of an upper secondary school
diploma. Most countries of Eastern and South-Eastern Europe allow only this entry route
(European Commission/EACEA/Eurydice, 2015), which limits the possibilities to study in higher
education for those who did not complete secondary school, but nevertheless could study in higher
education due to skills acquired via informal learning or work experience. Similarly, flexibility of
studies that usually refer to part-time studies allow combining education with work and/or family
obligations, which can be a critical factor in choosing to attend higher education particularly for
socio-economically disadvantaged people. The aim of this section is to analyze the extent to which
flexibility of studies and existence of alternative entry routes to higher education creates additional
opportunities for accessing higher education for disadvantaged communities in the UK.
2.1. The traditional entry route
Schooling in the UK is compulsory between age 5 and 16. After the completion of compulsory
schooling students sit an external examination for General Certificate of Secondary Education
(called “Standard Grade” in Scotland). Subsequently, students may choose to continue their

Page 15 of 55
education with general/academic programs, pre-vocational, or vocational courses. The
general/academic programs consist of additional 2 years of studying for General Certificate for
Education Advanced Level, generically called “A-level” (called “Scottish Certification of Higher
Grade in Scotland), which is the education level required for the traditional entry route to higher
education. This is the main route for enrolling in higher education (British Government 2012).
Another “regular” route to higher education is via vocational studies. After obtaining the General
Certificate of Secondary Education students may continue their studies in vocational education
that is provided by further education schools or colleges. During vocational education students
may select different programs providing academic or practical skills or a combination of the two
(for details on specific programs, see Cuddy N. and Leney T. 2005). Graduation from some of
these programs makes students eligible to apply to higher education institutions. According to the
data collected by the Universities and Colleges Admissions Services, in 2004 further education
institutions supplied 42% of students of higher education (quoted in Cuddy N. and Leney T. 2005,
p. 26), which suggests that the vocational path towards higher education is not exceptional.
Opening up higher education for vocational education graduates was also one of the goals of the
widening participation agenda (OFFA/HEFCE 2014(b)). Widening the access to higher education
for students with vocational background is particularly relevant since students studying in
vocational programs tend to come from more disadvantaged backgrounds (Payne 2003).
However, a study conducted in 2008 found that although vocational studies may lead to higher
education, holders of vocational degrees have different enrollment characteristics to higher
education than holders of A-level degrees. Vocational education graduates tend to enroll
considerably more often in post-92 institutions and in institutions with relatively low results on
quality assessment than holders of A-level degrees who are overrepresented in institutions with
highest reputation (Hoelscher M. et. al., 2008). Therefore, although vocational education may lead
to enrolment in higher education, the traditional A-level path still opens access to the best
opportunities to enroll in higher education.
Annex 1 presents the structure of the education system in the UK.
2.2. Non-traditional entry routes
In England and Wales individuals who did not complete secondary education (often adults) and
who are at least 19 years old have the possibility to benefit from alternative pathways towards
higher education. For them, special courses are organized by colleges, available in a range of
different subjects. The courses last for one academic year or up to three years, depending on the
subject and on the intensity of studies. Course organization is flexible, since studies can be full
time or part time and through evening courses, while distance learning and online learning are also
available in case of a small number of courses. Upon successful graduation of these courses
students acquire an Access to Higher Education Diploma with which students can apply to enroll
in higher education institutions6. The program is managed by the Quality Assurance Agency for
Higher Education to guarantee the standard of the Diploma and secure public funding (McGrath,
C. et. al. 2014).
To enroll in these courses, students need to pay a tuition fee that is established by the College and
can be over 3,000 GBP for the course7 , but students may apply for a loan. In England the
6 Information taken from the Access to Higher Education website, available at:
https://www.accesstohe.ac.uk/Pages/Default.aspx 7 Source: author’s desktop online research.

Page 16 of 55
Government’s Advanced Lerner Loans scheme will offer loans to all students enrolled in Access
to Higher Education courses expected to pay full fees, starting with August 2016. The loan holders
who will successfully graduate the courses and continue their education at tertiary level will have
their loans for Access to Higher Education courses written off8.
Access courses are available in many locations all over England and Wales. In Northern Ireland
there is one such course offered, although individual universities there have their own
arrangements for access courses.9 In Scotland the alternative route to higher education is provided
through the Scottish Wider Access Programs (SWAP) that are run in colleges all over Scotland
and that are organized for adults with few or no formal qualifications to study at the university
(UCAS 2014). Courses last for one-year full time, although individual colleges may offer flexible
mode of studies in form of part time or distant learning. According to the information posted on
SWAP’s website, the vast majority of SWAP students receive some financial support10.
2.3. Part time studies
The UK universities are not officially required to provide part time studies; they have the
autonomy to decide upon the study mode they allow. Nevertheless, despite the lack of a formal
obligation most institutions do provide this mode of studies (European
Commission/EACEA/Eurydice 2015, p. 156). Part time studies take longer to complete, the exact
duration depending on the specific course11. Part time studies are mainly the mode of studies
preferred by mature undergraduate students.
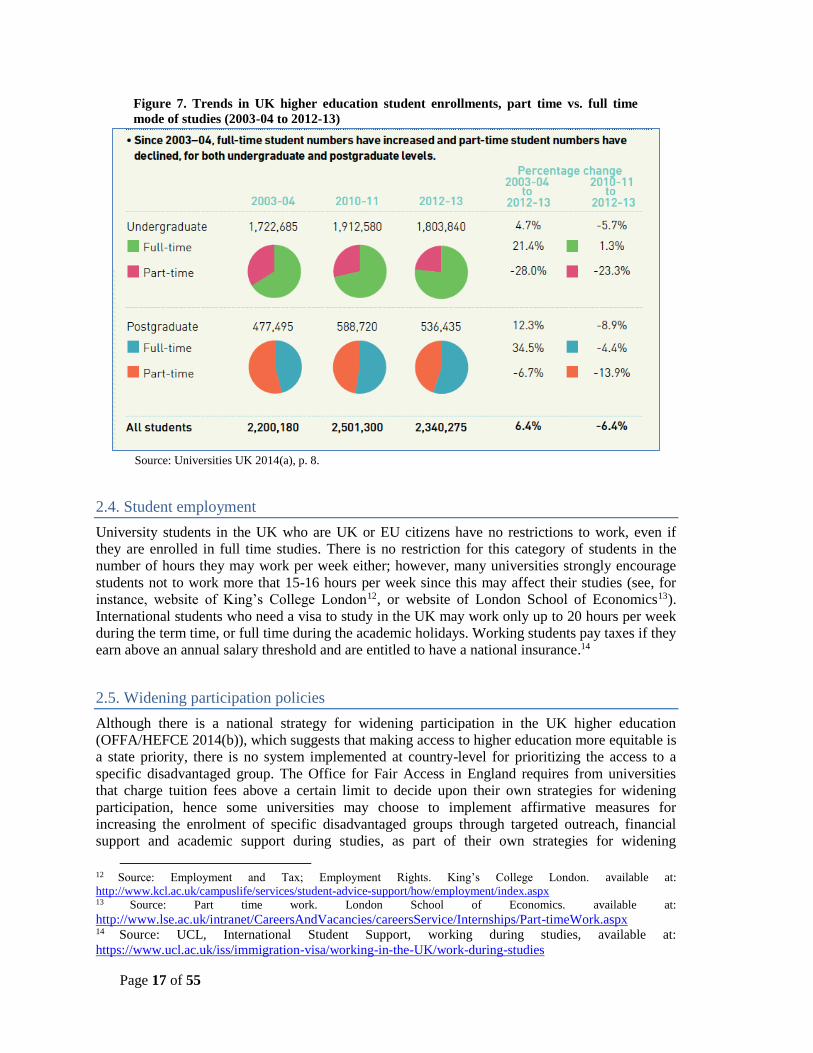
Available data reveal that in 2012-13, 65% of mature undergraduate studies entrants were enrolled
in part time mode of studies, compared to 5% among their counterparts. In the group of
undergraduate entrants aged 25 or above, this ratio was 75% (Universities UK 2014(b), p. 17). The
ratio of part time studies enrollments decreased significantly since 2003, but particularly in the
recent years, both in the undergraduate and in the postgraduate programs. As Figure 7 illustrates,
between 2003 and 2013 the ratio of part time students decreased with 28% in undergraduate
education and with 7% in postgraduate studies (Universities UK 2014(a)).
The main factors for this decrease are believed to be the economic downturn and funding reforms
in England. Economic downturn led to decrease of part time studies because of the increased
unemployment and reduced employment funding. Existing surveys show that this led to reduction
in employers’ funding of employee’s tuition fees for part time university studies, with one in four
employers cutting down such support and one in six restricting the amount of paid time off for
study purposes (Universities UK 2014(b), p. 25). The impact of funding reforms included
increased tuition fees and restrictive eligibility rules for access to tuition fee loans for part time
undergraduate students (Universities UK 2014(b)). Starting with 2012-13, part time students
became ineligible for maintenance loans or grants. As for tuition fee loans, only part time students
studying at an intensity greater than 25% of a full time qualification and for a specific qualification
aim, can access this type of loans (Universities UK 2014(b), p. 22).
8 Information taken from the Access to Higher Education website, available at:
https://www.accesstohe.ac.uk/Pages/Default.aspx 9 Information taken from the Access to Higher Education website, available at:
https://www.accesstohe.ac.uk/Pages/Default.aspx 10 Information taken from the Scottish Wider Access program website, available at:
http://www.scottishwideraccess.org/national-about-swap-what-will-it-cost-me 11 Information taken from the website of the British Council, available at:
http://www.educationuk.org/global/articles/higher-education-courses-qualifications/
Page 17 of 55
Figure 7. Trends in UK higher education student enrollments, part time vs. full time
mode of studies (2003-04 to 2012-13)
Source: Universities UK 2014(a), p. 8.
2.4. Student employment
University students in the UK who are UK or EU citizens have no restrictions to work, even if
they are enrolled in full time studies. There is no restriction for this category of students in the
number of hours they may work per week either; however, many universities strongly encourage
students not to work more that 15-16 hours per week since this may affect their studies (see, for
instance, website of King’s College London12, or website of London School of Economics13).
International students who need a visa to study in the UK may work only up to 20 hours per week
during the term time, or full time during the academic holidays. Working students pay taxes if they
earn above an annual salary threshold and are entitled to have a national insurance.14
2.5. Widening participation policies
Although there is a national strategy for widening participation in the UK higher education
(OFFA/HEFCE 2014(b)), which suggests that making access to higher education more equitable is
a state priority, there is no system implemented at country-level for prioritizing the access to a
specific disadvantaged group. The Office for Fair Access in England requires from universities
that charge tuition fees above a certain limit to decide upon their own strategies for widening
participation, hence some universities may choose to implement affirmative measures for
increasing the enrolment of specific disadvantaged groups through targeted outreach, financial
support and academic support during studies, as part of their own strategies for widening
12 Source: Employment and Tax; Employment Rights. King’s College London. available at:
http://www.kcl.ac.uk/campuslife/services/student-advice-support/how/employment/index.aspx 13 Source: Part time work. London School of Economics. available at:
http://www.lse.ac.uk/intranet/CareersAndVacancies/careersService/Internships/Part-timeWork.aspx 14 Source: UCL, International Student Support, working during studies, available at:
https://www.ucl.ac.uk/iss/immigration-visa/working-in-the-UK/work-during-studies
Page 18 of 55
participation. However, even if many universities have their own programs for widening
participation, a 2014 Eurydice report argues that there has been very little or no change in diversity
of students in the UK between the 2002-03 and the 2012-13 academic years (Eurydice 2014, p. 3).
Scotland is an exception in the UK, both in terms of policies and in terms of changes in student
diversity. Scottish government fixed a target for increasing participation in higher education for
specific underrepresented groups: it prioritizes the increase in participation of students from
publicly-funded schools where generally socio-economic disadvantaged students are concentrated,
for students from further education entering higher education, as well as mature students from
deprived backgrounds (Eurydice 2014). Eurydice data suggest that this led to an increasing
diversity among students, with the proportion of students from deprived backgrounds having
increased from 14% in 2003 to 15% in 2013, and with the proportion of students with minority
ethnic background having increased from 6% in 2002 to 11% in 2012 (Eurydice 2014, p. 3, p. 6).
Section Summary
The UK higher education system does provide an alternative route of access in addition to the
traditional route, through the system of preparatory courses. Even if preparatory courses are
payable, there are possibilities to get study loans that would be written off for those who later
continue with higher education. Despite the opportunities for studying to higher education that this
system presents, studies suggest that students entering through the traditional route still have more
chances to enroll in prestigious universities compared to students entering through alternative
routes, while this difference may have a significant impact for employability upon graduation.
As for the flexibility of studies, both part time mode of studies and employment during education
are allowed. However, the data from the last years reveal that the facto less and less students enroll
in the part time mode of studies, mainly for financial reasons: one the one hand, employers cut
support for paid leave for their employees’ part time studies, on the other hand, the rules for
accessing tuition fee loans became more restrictive and part-time students became non-eligible for
this maintenance loans. Therefore, even if the higher education system does provide opportunities
for flexible mode of studies, the financial costs associated with this type of studies de facto hinder
the actual opportunities to make use of this flexibility.
3. Studying in Higher Education in the UK: Financial Implications and Existing
Support Schemes
Studying in higher education implies costs for living and costs for the education process. In most
countries these costs are covered both by students (or their families) and by the government.
However, countries differ in the extent to which the costs are covered by one side or the other. The
share of costs may also differ over time within the same country. Governments used to cover a
significant part of costs related to higher education studies, but with the process of higher
education “massification” and increased number of enrolled students the costs started to shift to
students and their families. This has significant consequences on the social dimension of higher
education: the higher the costs to be covered by students and their families, the lower the
opportunities to study in higher education for socio-economically disadvantaged people.
The aim of this section is to analyze the social dimension of the UK higher education in light of its
financial costs and financial aid opportunities, in order to determine the extent to which financial
costs may constitute an obstacle for attending higher education.

Page 19 of 55
3.1. Tuition fees
Between 1962 and 1990 higher education was free of charge for all full time undergraduate
students residing in the UK and they were also receiving non-repayable grants for covering living
costs, the amount of which depended on the household income. In 1991 student loans have been
introduced (see below more details on the UK student loan system) and gradually their role
increased in providing financial resources for covering living costs. In 1998 university students
started to charge tuition fees and at the same time the grant system has been abolished. This
change has been justified by the increasing number of students and the implicit increase in costs
for maintaining the system of higher education (Macpherson S. and Liddell G., 2013). Tuition fee
amounts in the UK differ from country to country15; they also vary by field of studies, university,
and level of education.
In England and Wales tuition fees for university studies are the highest. They have been
introduced in 1998 and at the beginning only 35% of undergraduates were charged full amounts of
tuitions, while 20% were charged partial amounts. Since 1998 the ratio of students paying no
tuition fees or only partial tuition fees decreased, while the ratio of students paying tuition fees in
full increased considerably, from 35% in 1998 to 77% in 2009 (See Figure 8 below).
Figure 8. Ratios of students paying tuition fees. England and Wales (England only for 2005-2010)
Source: Paul Bolton 2015, Tuition Fees Statistics, Briefing Paper No. 917
The amount of tuition fees paid by students in England and Wales increased over time as well. If
in 1998 the average student contribution to these fees was 410 GBP per year, in 2005 it increased
to 615 GBP, in 2007 - to 725 GBP, in 2009 – to 1,025 GBP. In 2012 tuition fees increased even
15 In this report, “country” refers to the main territories of the UK: Scotland, Northern Ireland, England, and Wales.
35% 35%39% 41% 42% 43% 43% 45%
49%52%
57%
77%
20% 20% 19%16% 15% 14% 14% 13% 12% 11% 9%
4%
45% 45% 42%43% 43%
43% 39% 37%34%
19%
students paying full tuition fees student paying partial tuition fees
students not paying tuition fees

Page 20 of 55
further for the new cohorts of students, reaching 7,500 GBP average fees and the maximum that
universities could charge was established at 9,000 GBP per academic year (Bolton P. 2015).
In Northern Ireland tuition fees have been also introduced in 1998, but they remained at lower
rates compared to England and Wales. For the 2015-16 academic year student fees in Northern
Ireland can be up to 3,575 GBP per year for students from Northern Ireland and non-UK EU/EEA
countries 16 , while for students coming from Wales, England, and Scotland, tuition fees in
universities of Northern Ireland can be as much as 9,000 GBP per year17.
In Scotland university studies have been free of charge until the beginning of 2000s. In 2001 a
system of graduate endowment was introduced, according to which instead of paying tuition fees
students were supposed to pay a one-off charge one year after graduation, payment that was
intended to reflect the financial gains coming with a university degree. Initially the graduate
endowment was set at 2,000 GBP per student, although some categories of students were
exempted from paying it. The system of endowment was abolished in 2008 by the new Scottish
government who considered that the endowment system acted as a disincentive among under-
represented groups to consider entering higher education. Since the abolition of the endowment
system students domiciled in Scotland, as well as EU/EEA students, have not been charged tuition
fees. Only students coming to study in Scotland from other countries of the UK have been charged
tuition fees (Macpherson S. and Liddell G., 2013).
3.2. Living costs
Since the system of grants for students to cover their living costs have been abolished in 1998,
students and their families had to secure money for covering this type of expense as well during
higher education. Student living costs in the UK differ from country to country and some cities are
more expensive than others; they also depend on whether students need to or do not need to live
outside their family home.
Some general estimates indicate that weekly living costs for students vary between 167 GBP and
287 GBP per week, i.e. approximately between 6,680 GBP and 11,480 GBP for a 40-week
academic year, depending on the university and its location. Living costs for students studying in
universities in London, Oxford University, and University of Sussex in Brighton are among the
highest, while living costs for students studying in University of Leicester, University of Bristol,
and University of Nottingham are the cheapest. These costs include food, activities and study
materials, rent in halls, and weekly travel passes (Palmer K. 2014).
Other estimates suggest that on average the annual living costs for students are around 16,500
GBP in London and 15,500 GBP outside London (Milburn A. 2012, p. 63).
3.3. Costs of higher education in perspective
Adding up the tuition fee amounts with the average costs for living, students in the UK need a
budget between about 6,680 GBP and 20,500 GBP per year, depending on where they study and
on whether they pay tuition fees or not. Considering that only in Scotland students are exempted
from tuition fee payment, only for them the costs would be close to the smallest part of this range.
16 Source: UK Education: Value for Money; website of the British Council, available at:
http://www.educationuk.org/global/articles/costs-and-tuition-fees-for-international-students/ 17 Source: Going to University in Northern Ireland; website of the Complete University Guide, available at:
http://www.thecompleteuniversityguide.co.uk/university-tuition-fees/going-to-university-in-northern-ireland/
Page 21 of 55
In Northern Ireland an average student would need a budget of about 10,000 GBP per year to
cover tuition and living costs, while in England and Wales s/he would need between 14,000 GBP
and 20,500 GBP per year because tuition fees are the highest.
In order to have a better understanding how much these costs affect the financial means of
students’ families in the UK, one can compare them with the average wages. According to data
from the UK Office of National Statistics, in 2013 the median gross annual earnings were about
27,000 GBP (Office for National Statistics, 2013). At this level of annual gross income, the annual
net income would be about 21,445 GBP18, which is the median net amount earned by a full time
employed individual in the UK. A family with two full time earners would hence earn a net annual
income of about 43,000 GBP. Out of this income, a Scottish family of a student would have to
spend about 16% for supporting his/her studies, a Northern Irish family – about 23%, while a
family in England or Wales – between 33% and 48%.
Hence, studying in higher education in the UK can be a significant financial burden for students
and their families, especially for those coming from lower class background working in
professions where earnings are below the median wages or in mono-parental families. The below
sections analyze what tools the UK governments and universities implement in order to counter-
balance the high costs for higher education for students coming from socio-economically
disadvantaged families.
3.4. Student financial aid
In England universities charging tuition fees higher than the established basic fee cap of 6,000
GBP per year, must submit special working plans, called “Access Agreements”, to the Office for
Fair Access (OFFA). The access agreements establish how universities will ensure access to
higher education for under-represented groups through outreach work, financial aid for students
from low income families or under-represented groups, as well as through activities aimed at
supporting disadvantaged students during their studies and in the progress from education to
employment. All higher education institutions charging fees higher than the established basic cap
of 6,000 GBP and the maximum allowed amount of 9,000 GBP need to elaborate and submit such
agreements, specifying how the income received from charging tuition fees higher than the basic
cap is going to be used for facilitating the access to higher education for disadvantaged students
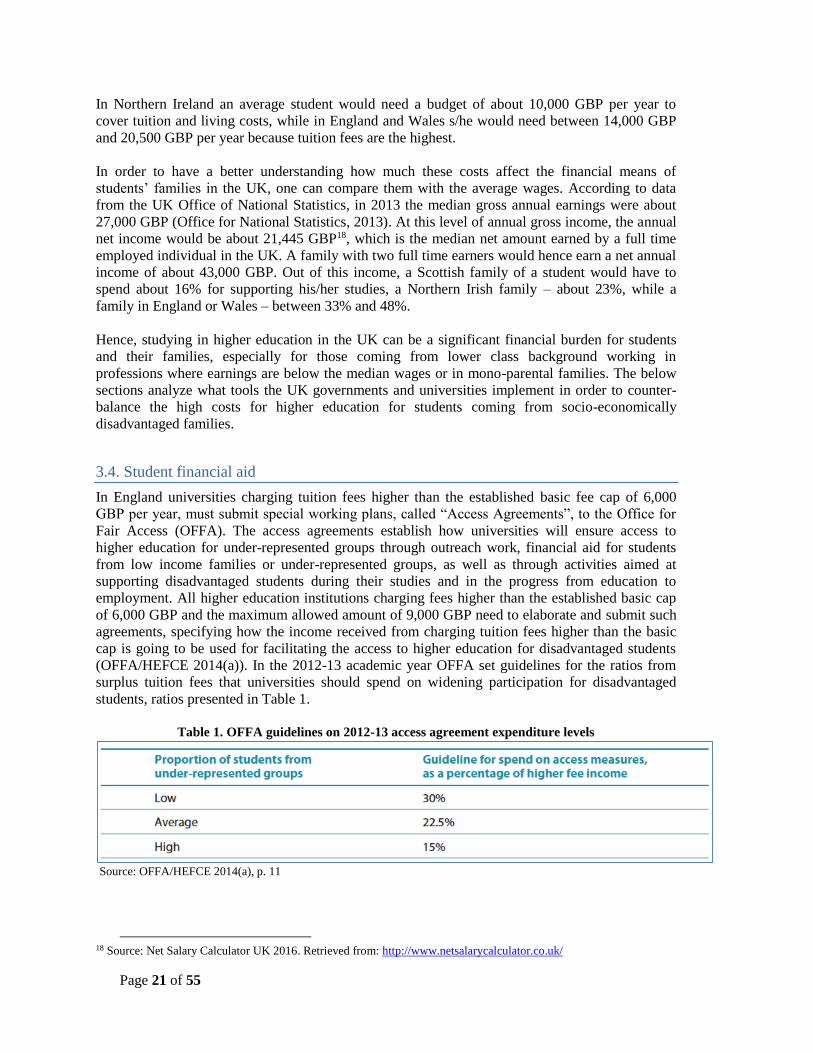
(OFFA/HEFCE 2014(a)). In the 2012-13 academic year OFFA set guidelines for the ratios from
surplus tuition fees that universities should spend on widening participation for disadvantaged
students, ratios presented in Table 1.
Table 1. OFFA guidelines on 2012-13 access agreement expenditure levels
Source: OFFA/HEFCE 2014(a), p. 11
18 Source: Net Salary Calculator UK 2016. Retrieved from: http://www.netsalarycalculator.co.uk/

Page 22 of 55
In the 2012-13 academic year 39.5% of fee-regulated students in England received a financial
award, based on their lower income or under-represented group status. Majority of these students
(31%) received full state support, while the rest received partial state support. Those with full state
support received on average financial support of 1,268 GBP, while those with partial – 731 GBP
(OFFA/HEFCE 2014(a), p. 14). Relative to the total study and living costs calculated in the sub-
sections above, this financial aid covers only a minimal part and therefore cannot constitute a
critical factor for deciding to study in higher education for a socio-economically disadvantaged
student.
According to the system implemented since 2012, students coming from families earning annual
incomes of 25,000 GBP or below are entitled to receive a grant covering living costs in the amount
of 3,250 GBP per year, as well as maintenance loans of 2,750 GBP, 3,850 GBP, or 6,050 GBP,
depending on their living arrangements and where they study. Students from households earning
above 25,000 GBP per year can access higher amounts of loans, and lower amounts of grants
(Milburn A. 2012, p. 77). In addition, individual universities also offer financial support to their
students with disadvantaged backgrounds, in the minimum value established at 347 GBP per year.
Other financial programs can offer additional funds to needy students, through programs such as
Access to Learning Fund, National Scholarship Program, and Disabled Students’ Allowance
(Milburn A. 2012, p. 77).
In summer 2015 the Government announced that starting with the 2016-17 academic year, the
maintenance grants will be replaced with maintenance loans, which implies that students with
disadvantaged backgrounds will not be able to access grants for covering living costs anymore, but
they will have to request loans instead (Bolton P. 2015, p. 8).
3.5. Student Loan System
UK has a relatively long tradition of student loans, which started in 1990-91 academic year, by
that time meant to cover undergraduate students’ living costs (Macpherson S. and Liddell G.,
2013) and could be up to 420 GBP per year (Bolton P. 2015). Since then, the system was modified
several times. In 2012 when new tuition fee rates have been introduced, the loan system was
adjusted as well. Students who enrolled in undergraduate studies starting with 2012-13 and paying
the increased amount of tuition fees (with the fee cap established at 9,000 GBP) could access
tuition fee loans for covering their tuition fees, as well as maintenance loans for covering living
costs during the studies. The amounts for the maintenance loans were determined by students’
living or not living at home, as well as by their family income, with those coming from low-
income families and living away from home having access to higher amounts. In the 2014-2015
academic year the maintenance loans could reach 7,750 GBP (Bolton P. 2015). The part-time
students can also access loans, although under more restrictive rules. As for the Master-level
students, the current system does not allow them access to student loans; however, it is planned to
open access for Master students aged under 30 to a yearly student loan of up to 10,000 GBP per
year and an interest rate of 3%, starting with the 2016-17 academic year (Coughlan S., 2014).
According to OECD Education at a Glance (2015), 92% of Bachelor degree UK-domiciled full
time students benefit from public loans or grants (OECD 2015). Data from the UK Department of
Education indicate that in the 2011-12 academic year 88% of UK students took a maintenance loan
and 85% took a tuition fee loan. The data also reveal that the ratio of students taking loans for
financing their tertiary education increased considerably since the loan system has been
introduced: comparatively, in 1990-91 only 28% of students took loans, while in 2000-01 78% of
students did so (Bolton P. 2015, p. 16).
Page 23 of 55
Students who benefited of the loan system are expected to pay their loans back after graduation,
once they are earning over 21,000 GBP per year (before the increase in tuition fees, the
requirement to pay back the loan started at 15,000 GBP yearly earning). In addition, any debts
remaining 30 years after graduation are written off (Milburn A. 2012, p. 77). The interest rates on
student loans are based on inflation rate + 3% until graduation, after which the interests are
calculated progressively, based on students’ income (Bolton P. 2015).
Section Summary
Financial costs associated with studying in higher education in the UK that need to be covered by
students and their families are quite significant and hence can constitute an important barrier for
accessing higher education for students coming from socio-economically disadvantaged
environment. Tuition fees together with the living costs can constitute from 16% to 48% of the net
annual income of a family where both parents receive average wages, with the smallest costs in
Scotland (due to current lack of tuition fees) and the highest in England and Wales (due to the
highest tuition fee rates). Even if financial support schemes exist both at the level of university and
at the level of government for socio-economically disadvantaged students, their amounts are
usually not high enough to cover at least half of the costs associated to studying in higher
education.
At the same time, the UK’s loan system seems to constitute a viable alternative to the grant- based
financial aid. Most of full time students have access to both tuition fee loans and maintenance
loans at relatively low interest rates and with the obligation to return the loan only upon earning an
annual netto salary equivalent to the general average netto salary in the country. Although the
financial burden for studying in higher education still remains placed on student’s side, the current
loan system in the UK still offers a possibility to access higher education including for potentially
disadvantaged students. It remains to be seen in the years to come how big of a financial burden
repaying these loans will be for the young graduate professionals entering the job market and
having to repay the loans.
Conclusions
The aim of this briefing paper was to analyze the higher education system in the UK in light of its
social dimension, i.e. determining the enablers and barriers in accessing higher education for
socio-economically disadvantaged groups, including marginalized minorities. The access to higher
education in the UK expanded considerably in the last decades, as can be observed by the
constantly increasing ratios of population who attained higher education. This briefing paper
attempted to determine whether in light of this expansion the chances for accessing higher
education in the UK are similar for all categories of population regardless of their socio-economic
background. In the UK there are no state-level affirmative action programs for any specific
category of population potentially facing disadvantages; therefore, the paper focused on other
tools, alternative to affirmative action programs, that could be implemented in the UK for making
the access equitable.
The desktop review conducted for this briefing paper revealed that despite the UK government’s
attempts of “widening participation” to higher education and despite the increased access, there are
disadvantaged groups who still face underrepresentation, which suggests that expansion of higher
education did not necessarily imply equitability. People with disabilities, people whose parents
Page 24 of 55
attained relatively low levels of formal education, people of working class background, as well as
ethnic Roma, are still underrepresented in higher education. In case of people with low parental
level of education and/or working class background, disadvantages can be observed even in case
of those who enroll in universities, since they tend to enroll in less prestigious universities and face
more difficulties in finding employment upon graduation. Ethnic minorities and students with
migrant background (other than Roma) seem to be proportionally represented in higher education;
however, they also tend to study in the less prestigious universities and face more difficulties in
finding jobs upon graduation, compared to their counterparts.
Among all disadvantaged groups, Roma minorities are by far the least represented in the UK
higher education system. Existing estimates suggest that only 3-4% of Roma population have
higher education, which is significantly less compared to the ratio of mainstream population who
attained higher education in the UK (41% in the age group 25-64). The low ratios of secondary
education completion, the cumulated disadvantages faced by Roma minorities (including poverty),
as well as the financial costs associated with higher education are among the barriers preventing
more Roma to study at university.
From the point of view of available entry routes, the UK system offers an alternative to the
traditional route, individuals not in possession of a secondary school diploma having the
possibility to apply for preparatory courses and then being eligible to apply for higher education
upon successful graduation of these preparatory courses. The loans available for preparatory
courses attendees and the possibility to have them written off upon eventual enrolment to higher
education constitute a potentially viable alternative route, which may be particularly useful for
socio-economically disadvantaged people. There are also possibilities to study part time and to
work during studies, although this flexibility may come with significant financial implications.
The financial costs for higher education in the UK expected to be covered by students and their
families are significant, since tuition fees are relatively high and together with the living costs, can
constitute between 16% and 48% of the yearly net income of a family earning average wages. For
socio-economically disadvantaged students there are possibilities of receiving financial aid in form
of state or university-based grants, but usually the amounts are too small in comparison with the
total costs.
At the same time, the UK higher education system has a relatively long experience with study
loans that dates back TO early 1990s, that gradually replaced the system of financial aid in form of
grants, and that currently constitute the main source of funding for students’ higher education. At
the moment, study loans seem to be rather accessible and repayment conditions reasonable,
although it remains to be seen in the years to come if conditions for accessing loans will become
stricter and repayment conditions harder. It also remains to be seen how big of a financial burden
will repaying these loans become for current students when they enter the job market. The
prospects of having to pay study loans in the same period of life when young professionals
normally need financial resources for building their own families and households might prove to
be burdensome.
Finally, the case of the UK higher education system illustrates that even when access for
disadvantaged and marginalized minorities is opening, equity is not guaranteed: inequalities can
continue to manifest in other forms inside higher education. Once university studies become more
accessible, the importance of what kind of degree one gets and from which university one gets the
respective degree increases as well, particularly for the employment upon graduation. These new
inequalities raise new barriers for social mobility beyond the mere access to higher education.

Page 25 of 55
Annex
Source: The education system in UK (© Onisep / Elise Veteau) http://mavoieproeurope.onisep.fr/en/initial-vocational-
education-and-training-in-europe/united-kingdom/

Page 26 of 55
References:
Altbach, P. G., Reisberg, L., & Rumbley, L. E., 2009. Trends in Global Higher Education: Tracking an Academic
Revolution. A Report Prepared for the UNESCO 2009 World Conference on Higher Education. Retrieved from:
https://www.researchgate.net/profile/Philip_Altbach/publication/225084084_Trends_in_Global_Higher_Education_Trac
king_an_Academic_Revolution/links/551ac4020cf251c35b4f5d0d.pdf
Bolton, P., 2015. Student Loan Statistics. Briefing Paper Number 1079, 5 October 2015. House of Commons Library.
British Government 2012. Education System in the UK. Retrieved from:
https://www.gov.uk/government/uploads/system/uploads/attachment_data/file/219167/v01-2012ukes.pdf
Clark, C., 2004. It is Possible to Have an Education and be a Traveller: Education, Higher Education and Gypsy-
Travellers in Britain. In: Institutional Racism in Higher Education. Trentham Books, pp. 71-82.
Coughlan S., 2014. Autumn Statement: Postgraduate loans of £10,000. BBC News, Education and Family, released on 3
December 2014. Retrieved from: http://www.bbc.com/news/education-30293964
Council of Europe, 2012. Estimates on Roma Population in European Countries. Document prepared by the Support
Team of the Special Representative of the Secretary General of the Council of Europe for Roma Issues. Retrieved from:
http://rm.coe.int/CoERMPublicCommonSearchServices/DisplayDCTMContent?documentId=0900001680088ea9
Connor H., Tyers C., Modood T., and Hillage J., 2004. Why the Difference? A Closer Look at Higher Education
Minority Ethnic Students and Graduates. Research Report RR552 of the Institute for Employment Studies. Retrieved
from:
http://www.bristol.ac.uk/media-library/sites/ethnicity/migrated/documents/educationreport.pdf
Crawford, Claire. 2014. The link between secondary school characteristics and university participation and outcomes.
Research Report, London: The Centre for Analysis of Youth Transitions.
Cuddy N. and Leney T. 2004. Vocational Education and Training in the United Kingdom: Short description. Cedefop
Panorama series; 111.
Danvers E., 2015. Higher Education Internationalization and Mobility: Inclusion, Equalities and Innovation. Briefing
Report on Higher Education, Internationalization, and Roma in the UK. Retrieved from:
http://www.sussex.ac.uk/education/cheer/documents/sussexheimreport-uk--final.pdf
Department for Education and Skills, 2006. Ethnicity and education: the evidence on minority ethnic pupils aged 5-16
2006. Nottingham: DfES. Retrieved from: http://dera.ioe.ac.uk/6306/
Department for Environment, Food and Rural Affairs, 2015 (a). Poverty levels in rural and urban areas. Retrieved from:
https://www.gov.uk/government/uploads/system/uploads/attachment_data/file/428604/RuralPovertyStats_May2015.pdf
Department for Environment, Food and Rural Affairs, 2015 (b). Education statistics for rural and urban areas. Retrieved
from:
https://www.gov.uk/government/uploads/system/uploads/attachment_data/file/479432/Education_Nov2015.pdf
EHEA 2015. National Report regarding the Bologna Process implementation 2012-2015. United Kingdom. European
Higher Education Area reports. Retrieved from: http://www.ehea.info/Uploads/SubmitedFiles/4_2015/134140.pdf
European Commission/EACEA/Eurydice, 2015. The European Higher Education Area in 2015: Bologna Process
Implementation Report. Luxembourg: Publications Office of the European Union.
Eurostat 1992-2014. Population aged 30-34 by educational attainment level, sex and NUTS 2 regions (%). Retrieved
from: http://appsso.eurostat.ec.europa.eu/nui/show.do?dataset=edat_lfse_12&lang=en
Eurostat 2011. Tertiary educational attainment (age group 30-34) by type of disability and sex [hlth_de020]. Retrieved
from: http://appsso.eurostat.ec.europa.eu/nui/show.do
Eurydice 2014. Modernization of Higher Education in Europe: Access, Retention and Employability. Eurydice Brief on
Modernization of Higher Education in Europe. Retrieved from:

Page 27 of 55
http://eacea.ec.europa.eu/education/eurydice/documents/thematic_reports/180EN.pdf
Foster, B. and Norton, P., 2012. Educational Equality for Gypsy, Roma and Traveller Children and Young People in the
UK. The Equal Right Review Vol. 8, 85-112.
HEFCE 2015. Differences in Employment Outcomes: Equality and Diversity Characteristics. Issue Paper September
2015/23.
HESA 2012-13. First year UK domiciled HE students by level of study, sex, mode of study and disability 2012/13.
Retrieved from:
https://www.hesa.ac.uk/dox/dataTables/studentsAndQualifiers/download/Disab1213.xlsx
HESA 2013-2014. UK domiciled undergraduate students of known ethnicity by subject area and ethnicity 2013/14.
Retrieved from:
https://www.hesa.ac.uk/images/stories/hesa/pubs_intro_graphics/STUDENT_1314/student_1314_table_J.xlsx
HESA 2014-15. Participation of UK domiciled students in higher education who are in receipt of Disabled Students'
Allowance (DSA): all undergraduates 2014/15. Retrieved from:
https://www.hesa.ac.uk/dox/performanceIndicators/1415_X74D/t7_1415.xlsx
Hoelscher, M., Hayward, H., Ertl, H., and Dunbar‐Goddet, H. 2008. The Transition from Vocational Education and
Training to Higher Education: a Successful Pathway?, Research Papers in Education, 23:2, 139-151
Macpherson, S. and Liddell G. 2013. Student Loans and Repayments, SPICe Briefing 13/78. Retrieved from:
http://www.educationuk.org/global/articles/costs-and-tuition-fees-for-international-students/
McGrath, C., Henham, M. L., Corbett, A., et al. 2014. Higher Education Entrance Qualifications and Exams in Europe:
A Comparison. European Parliament Directorate-General for Internal Policies Policy Department B: Structural and
Cohesion Policies Culture and Education. Retrieved from:
http://www.europarl.europa.eu/RegData/etudes/etudes/join/2014/529057/IPOL-CULT_ET(2014)529057_EN.pdf
Milburn, A., 2012. University Challenge: How Higher Education Can Advance Social Mobility. A progress report by the
Independent Reviewer on Social Mobility and Child Poverty.
Noden Ph., Shiner M., and Modood T., 2014. Black and Minority Ethnic Access to Higher Education. A Reassessment.
LSE Department of Social Policy.
OECD 2014. Education at a Glance 2014: OECD Indicators, OECD Publishing.
OECD 2015. Education at a Glance 2015. Country Note: United Kingdom. OECD Publishing. Retrieved from:
http://www.keepeek.com/Digital-Asset-Management/oecd/education/education-at-a-glance-2015/united-kingdom_eag-
2015-85-en#page1
OFFA/HEFCE 2014(a). Outcomes of access agreement, widening participation strategic statement and National
Scholarship Programme monitoring for 2012-13. Report, Office for Fair Access and Higher Education Funding Council
for England, Bristol: OFFA/HEFCE.
OFFA/HEFCE 2014(b). National Strategy for Access and Student Success in Higher Education. Report by the Higher
Education Funding Council for England (HEFCE) and the Office for Fair Access (OFFA). Retrieved from:
https://www.gov.uk/government/publications/national-strategy-for-access-and-student-success
Office for National Statistics, 2013. 2011 Census Analysis - Comparing Rural and Urban Areas of England and Wales.
Office for National Statistics, Statistics Bulletin, Annual Survey of Hours and Earnings, 2013 Provisional Results.
Retrieved from: http://www.ons.gov.uk/ons/dcp171778_335027.pdf
Office for National Statistics, 2014. What does the 2011 Census tell us about the characteristics of Gypsy or Irish
Travelers in England and Wales? 2011 Census Analysis. Retrieved from:
http://www.ons.gov.uk/peoplepopulationandcommunity/culturalidentity/ethnicity/articles/whatdoesthe2011censustellusa
boutthecharacteristicsofgypsyoririshtravellersinenglandandwales/2014-01-21

Page 28 of 55
Palmer K. 2014. The cheapest and most expensive universities for living costs. The Telegraph, comment from 3:12PM
BST 14 Aug 2014. Retrieved from: http://www.telegraph.co.uk/finance/personalfinance/household-bills/11033327/The-
cheapest-and-most-expensive-universities-for-living-costs.html
Papworth Trust 2014. Disability in the United Kingdom 2014. Facts and Figures. Retrieved from:
http://www.papworthtrust.org.uk/sites/default/files/UK%20Disability%20facts%20and%20figures%20report%202014.p
df
Pateman, T., 2010/11. Rural and Urban Areas: Comparing Lives Using Rural/Urban Classifications. Office for National
Statistics, Regional Trends 43.
Payne, J. 2003. Vocational pathways at age 16–19. Research report RR501. Nottingham: DfES.
Purcell K., Elias P., Atfield G., 2009. Analyzing the relationship between higher education participation and educational
and career development patterns and outcomes. A new classification of higher education institutions. Warwick Institute
for Employment Research, Working Paper 1. Retrieved from:
http://www.hecsu.ac.uk/assets/assets/documents/futuretrack/Futuretrack_Stage_3_Working_Paper_1.pdf
Rafferty, A. (2012). Ethnic Penalties in Graduate Level Over-Education, Unemployment and Wages: Evidence from
Britain. Work Employ. Soc. 26, 987–1006.
Richardson J., 2008. The Attainment of Ethnic Minority Students in UK Higher Education. Studies in Higher Education,
Vol. 33, No. 1, 33-48.
UCAS 2014. Qualification Information Profiles (QIPs) for Access to HE Diploma and Scottish Wider Access
Programme (SWAP). UCAS Rosehill New Barn Lane Cheltenham GL52 3LZ. Retrieved from:
https://www.ucas.com/sites/default/files/ucas-qips-access-to-he-diplomascottish-wider-access-programme%20(2).pdf
UK Population Census 2011. UK Office for National Statistics. Retrieved from: https://www.ons.gov.uk
Universities UK (a). 2014. Higher Education in Facts and Figures. Facts and Figures, London: Universities UK.
Universities UK (b). 2014. Trends in undergraduate recruitment. Empirical Research, Universities UK’s Higher
education in focus series, London: Universities UK Facilities Unit.
Universities UK and HESA. 2014. Patterns and Trends in UK Higher Education. Report, London: Universities UK.
World Bank data, 1981-2015. Urban Population (% of total). Retrieved from:
http://data.worldbank.org/indicator/SP.URB.TOTL.IN.ZS?page=1
Wilkin, A., Derrington, C., White, R., Martin, K., Foster, B., Kinder, K, and Rutt, S., 2010. Improving the Outcomes for
Gypsy, Roma and Traveler Pupils: Final Report. Department for Education Research Report DFE-RR043.
Zwisen W. and Longhi S., 2016. Labour Market Disadvantage of Ethnic Minority British Graduates: University Choice,
Parental Background or Neighbourhood? Institute for Social and Economic Research, Working Paper Series, No. 2016-
02. Retrieved from: https://www.iser.essex.ac.uk/research/publications/working-papers/iser/2016-02.pdf

Page 29 of 55
Briefing Paper 2
Roma Education in the UK:
Strategies for Inclusion and
General Education Indicators
Author:
Gabriela Petre
Ph.D. Candidate at National School of Political and Administrative
Studies, Romania
Page 30 of 55
TABLE OF CONTENTS
1. Gypsy, Traveler and Roma Population in the UK: General Situation, Main Education Indicators
and Comparative Perspectives ................................................................................................................................. 31
1.1. Conceptual clarification .............................................................................................................. 31
1.2. Statistics on Gypsy, Traveler and Roma Population in the UK .................................................. 32
1.3. General socio-economic situation of Gypsy, Traveler and Roma population in the UK ............ 33
1.4. Education indicators attainment, including higher education of Gypsy, Traveler and Roma
Population ................................................................................................................................... 34
1.5. Comparison with other countries – European perspectives of Roma social inclusion ................ 35
2. Government Initiatives for facilitating the access to education for Roma in the UK ...................................... 37
2.1. General strategies and action plans of UK government for Roma inclusion ................................ 37
2.2. Access to education ...................................................................................................................... 40
2.3. Policies, analyses implementation and results.............................................................................. 41
3. Non-Governmental Initiatives for facilitating the access to higher education for Roma in the UK ............... 42
3.1. The role of NGO-led initiatives for facilitating the access to Education – UK perspectives ....... 42
4. Access to Higher Education for Roma in UK from Roma Students’ Perspectives: Enablers and
Barriers ....................................................................................................................................................................... 44
4.1. Roma, Gypsies and Travelers in higher education ....................................................................... 45
4.2. Prejudice and stereotypes ............................................................................................................. 47
4.3. Secondary education and transition to university ......................................................................... 47
4.4. Access to higher education and related costs ............................................................................... 48
4.5. State or university support for students in need ........................................................................... 48
4.6. Support of non-governmental initiatives for facilitating the access to higher education for Roma
in the UK ................................................................................................................................... 48
4.7. Enablers and barriers for Roma, Gypsies and Travelers in higher education ............................... 48
4.8. The impact of higher education on Roma, Gypsies and Travelers ethnic identity ....................... 49
4.9. Measures students consider as suitable to facilitate the access for Roma to higher education in
the UK ....................................................................................................................................... 49
Conclusions ................................................................................................................................................................ 49
References .................................................................................................................................................................. 51
Annex 1 ....................................................................................................................................................................... 53
Page 31 of 55
1. Gypsy, Traveler and Roma Population in the UK: General Situation, Main
Education Indicators and Comparative Perspectives
1.1. Conceptual clarification
From the beginning of the analysis of population targeted by this study it is important to recognize
a problem of identification related to what we indicate as “Gypsy, Traveller and Roma” Population
in UK. The appropriate position is described, as mentioned by Danvers E. (2015:5),19 into the
Report:
“The category of Gypsies, Travelers and Roma in the UK is subject to debate over its
broad application to a number of diverse communities and it is often confused, usage in
policy contexts. The term ‘Roma’ is used as an umbrella term in European Union (EU)
policy frameworks but UK Gypsies tend to be referred to as Gypsies or Romany
Gypsies, whereas Irish Travelers refers to a separate ethnic group”.
Related to history of Roma in the UK, the literature shows that “They all have the same ancestral
roots in India and their languages all have the same Sanskrit base.”20(Fremlova and Ureche,
2009c). According to some scholars “Roma people in UK are defined to be Romani people
migrating predominantly since the mid-1990s, either those seeking asylum from persecution in
mainland European countries.” Therefore in the UK, the term Roma refers to the population
coming from Eastern Europe, while Gypsy and Travellers are the “local” Roma, and have
different identity and require more detailed explanation about their life style. Concerning self-
identification, Gypsy and Travelers do not identify themselves as Roma. In the meantime in the
report FRANET National Focal Point Social Thematic Study „The situation of Roma 2012”
prepared by Human Rights Law Centre University of Nottingham, Lucie Fremlova states that
„They have arrived in the UK over the past two decades from Central and Eastern Europe,
Southern Europe and the Balkans”.
More explicitly regarding the differences between Roma migrants and local Gypsy and Travelers,
Mackary states in her thesis entitled “Access, Agency, Assimilation: Exploring literacy among
adult Gypsies and Travelers in three authorities in Southern England”:
“The traditional view is that Romanies left India around a thousand years ago in family
groups travelling by three main routes, northwards towards Scandinavia, west through
central Europe and south by way of Egypt and North Africa, hence the name Gypsies,
and then north through Spain. “Gypsies” is a derivative of “Little Egyptians”. However
the first issue of the Gypsy Lore Society in July 1888 acknowledged several possibilities
- that Romanies may have been part of European society for 2000 years or that the first
Romanies were a group of several thousand musicians presented by the King of Sindh to
the Shah of Persia in the fifth century. Moreover, in UK, they are divided in several
forms according to the territorial organization of the country and legal status21. Gypsies,
Roma and Travelers in UK comprise six groups: Romani Gypsies, Welsh Gypsies,
Scottish Gypsies, Irish Travelers, Roma, and New Age Travelers, each with different
histories, cultural traditions and languages. Of the six, four are of Romani origin; though
19 Danvers, E. (2015). Higher Education Internationalization and Mobility: Inclusion, Equalities and Innovation.
Supporting Roma Students in Higher Education. 20 www.luciefremlova.co.uk/app/download/5783574496/Getting-to-74Know-the-Roma-Communities-in-England.pdf
Page 32 of 55
Irish Travelers may also be Romanies, their origins are more obscure. Roma, Gypsies,
and Travelers', assuming an inherent link between these groups. Associating Romani
minorities with travelling groups as its roots partly in the traditional romantic image of
the 'travelling Gypsy', which is a western European cultural legacy”22.
In terms of geographical distribution, there are established compact communities alongside UK, in
North of England cities such as Manchester, Sheffield, Bolton, Rotterdam, and Liverpool; big
communities can be also found in Scotland (Glasgow), Wales (Cardiff), as well as in Northern
Ireland (Belfast). As is stated in the A2 and A8 Roma survey, the biggest population of Roma are
based in cities across Northern England. The major concentrations of A2 and A8 Roma
populations are now found in the North of England, the East Midlands, Kent, and in North and
East London.23
1.2. Statistics on Gypsy, Traveler and Roma Population in the UK
Similar with other European countries, there is a big confusion about the real number of Roma
that live in the U.K. Different actors operate with different numbers, which can lead to unlike
measures and action plans supposed to support social inclusion. In 2012, European Commission
operated with figures such as the ones in „Factsheet United Kingdom Key Information Roma
population”24 that estimated for National Roma Integration Strategy a number of 80,000-300,000
Roma in the UK, approximately 225,000 and approximately 0.36% of the population according to
Council of Europe. One of the reasons for this confusion can be because of the lack of data about
Roma migration from other EU countries. “Roma communities are multifaceted and live in many
EU Member States. They are diverse, not only in terms of lifestyle and culture, but also in the
extent to which they are integrated in mainstream national societies. Not all Roma are necessarily
poor and at the same time not all poor Europeans are Roma.”
According to the census realized by Office for National Statistics in UK in 201125, 58,000 people
identified themselves as Gypsy or Irish Traveller 26 (which is 0.1% of the general resident
population of England and Wales). In 2011 it was the first time when within the census process the
authorities decided to introduce self-identification for Roma. The result of the census showed
several issues and some important key points that underline the low socio–economic status of the
group, and also that even if there are some measures that are implemented in order to rise the
status of Roma population in the UK, problems persist and Roma face serious issues regarding
their unemployment, education, health and housing.
As a synthesis of the available statistical data and estimation it is worth to underline Danvers E’s
analysis (2015:6) who, based on different sources, indicated a more accurate picture of Gypsy,
Traveler and Roma population in the UK.
“In the England and Wales census in 2011 Gypsy and Traveler and Irish Traveler
accounted for 58,000 people or 0.1% of the population, the smallest recorded ethnic
22 International Affairs, Yaron Matras (2000) Romani migrations in the post-communist era> Their historical and
political significance , Cambridge Review of International Affairs,13:2, 32-50, DOI: 10.1080/09557570008400297 23 The movement of Roma from new EU Member States: A mapping survey of A2 and A8 Roma in England Patterns of
settlement and current situation of the new Roma communities. 24 http://ec.europa.eu/justice/discrimination/files/roma_country_factsheets_2014/united-kingdom_en.pdf last time
accessed 22.12.2015. 25 What does the 2011 Census tell us about the Characteristics of Gypsy or Irish Traveler’s in England and Wales? 21
January 2014 26The Census include just Gypsy and Travellers and not also Roma which migrate from Central Este Europe in UK.

Page 33 of 55
minority (Office for National Statistics, 2014). In the 2011 Scottish census Gypsy and
Travelers accounted for 4,212 people or 0.1% of the population (General Registrar
Office for Scotland, 2013). In the 2011 Northern Ireland census, 1,301 people were
listed as Irish Traveler/White Gypsy, representing 0.07% of the population
(Northern Ireland Statistics and Research Agency, 2013). It is worth noting that while
failure to complete the census is a criminal offense in the UK, these numbers may not
represent the complete picture of the Gypsy, Traveler and Roma populations. For
example, many Roma avoid declaring their ethnicity at work and school for fear of
discrimination, hostility and racism. Consequently the UK Government have combined
census data with direct counts of caravans, school records and other recording and have
estimated the numbers at 300,000 (Friends, Families and Travelers, 2015).”
1.3. General socio-economic situation of Gypsy, Traveler and Roma population in the UK
Regarding the level of education, „in the UK, one of the richest countries of the world, it is
estimated that between 70% and 90% of Gypsies and Travelers over the age of fifteen are not
literate. Some cannot read at all, others have very poor reading skills and very limited writing
skills. Few attend tertiary education”. With all of this on „Overview of Europe 2020 targets” the
UK did not set out clear indicators, as it is stated in the documents that „countries that have
expressed their national target in relation to an indicator different than the EU headline target
indicator”. In this case, UK set out indicators only related to poverty with the mentions that the
indicators numerical targets are set in 2010 „Child Poverty Act”27 and „Child Poverty Strategy
2011-2014”.
The situation of the Roma community in the UK in recent years has concerned a large number of
diverse institutional stakeholders, public and private, being established structures of Roma
representation at national and international level. However, with all of this, the general reports
about Roma show that the current situation does not provide a ground for next generation of Roma
community to develop themselves. This is mainly because the circle of poverty affects the main
important rights of Roma. Although there are some legislative measures that should support the
process of social inclusion, it is still hard to measures the progress of the minorities’ well-being in
the field. “Extensive discrimination faced by Gypsies, Traveller’s and Roma has been formally
recognized by Member States of the Council of Europe since 1969 28” also “Gypsy or Irish
Travellers are recognized under the Equality Act 201029 and are widely considered by government
and charities to be a vulnerable marginalized group who suffer from poor outcomes”.
According to the Universal Declaration of Human Rights of 1948, "everyone is entitled to all
rights and freedoms, (...) without any discrimination such as race, color, sex, language, religion,
political or other opinion, national or social, property, birth or other status." Although this was the
original meaning of the main humanitarian values, the understanding of certain rights has changed,
and the essence was lost when it was applied nationally and especially locally. In the case of Roma
minority, the argument is often based on the difficulty of understanding its actions and placing the
problem-solving approaches in the exclusive responsibility of the minority. Superficial approach
can be easily noticed when analyzing macro-economic indicators in which national governments
minimize the aspects that concern the enforcement of rights in the case of this minority. From this
point there is only one step to the discrimination and exclusion of the Roma population. Some
27https://www.sheffield.ac.uk/polopoly_fs/1.43714!/file/GT-final-report-for-web.pdf 28 The UK Government’s response to the EU framework on national Roma integration strategies Marc Willers and Owen
Greenhall. 29 Equality Act 2010 related to the situation of Roma Gypsy or Irish Travellers
http://www.legislation.gov.uk/ukpga/2010/15/contents

Page 34 of 55
concerns come also from the voices of the community that push them to organize themselves in
deferent forms of organizations and acting in different ways in order to come up with solutions30.
This was not enough to increase the number of pupils’ attendance at school or the number of
Roma, Gypsy and Travellers young in higher education.
As Danvers E. (2015:6-7) indicates, the health, employment and social housing status of Gypsy,
Traveller and Roma Population from UK is far to be close to that of the whole population:
Analysis of 2011 census data for England and Wales (Office for National Statistics, 2014) showed:
70% of Gypsies and Travelers rated their general health as 'very good' or 'good' compared to
81% of the overall population;
20% of Gypsies and Travelers were unemployed, compared to 7% of the overall population;
41% of Gypsies and Travelers live in social housing compared to 16% of the overall
population.
According to the study of “Expert By Experience” report, Roma Gypsy and Travellers face several
issues’ regarding the housing conditions, starting with eviction from unauthorized places, to
leaving in segregate areas and experiencing “poor housing conditions and the highest levels of
discrimination in access to housing, education, employment and healthcare; and that as a
consequence their chances in the labor market are diminished”.
Issues of accommodation and the negative impact produced by the lack of adequate housing for
Roma, Gypsy and Travels is recognized also by the European Commission in the Report on
discrimination of Roma children in education: “Many Traveler children still face disruption to
their education, often caused by the absence of adequate housing facilities and the risk of eviction.
Therefore, the lack of temporary accommodation for Traveler families can have a very negative
impact on the education of their children.31”
1.4. Education indicators attainment, including higher education of Gypsy, Traveler and Roma
Population
There are some actions in the UK that aim at increasing the number of students and focus in
education progress, but low achievements in formal education among Roma is still persisting. In
comparison with other countries, for example Romania the government shaped several years ago
affirmative actions in education for Roma, allocating special places in secondary schools and
universities for Roma students. For primary education there are other measures explained below.
In the UK there are voices that claim education as the only solution for Roma inclusion, but as in
most the Central and East European countries, the UK government did not manage to make
education and schools accessible place for Roma pupils, even if “in school people are able to
acquire the tools which are necessary in order to achieve a certain degree of autonomy and to
access the different areas of the information society. At the same time it is a place where people
from different cultures can meet each other promoting a mutual knowledge, favoring coexistence
among everyone”32.
A very clear picture is provided by Danvers E. (2015: 3) who mentioned that “Gypsy, Roma and
Traveler young people are far less likely to go to university than the population as a whole.
30Gypsies and Travelers shadow report- response to the United Kingdom’s 18th and 20th report on the International
Convention on the Elimination of all forms of Racial Discrimination (CERD). 31 Report on discrimination of Roma children in education; available at
http://ec.europa.eu/justice/discrimination/files/roma_childdiscrimination_en.pdf 32 The Roma and Education against Social Exclusion Gisela Redondo* and Mimar Ramis.
Page 35 of 55
Between 3 and 4% of the Gypsy, Roma and Traveler in the UK population over 18 is accessing
higher education” (comparing to 43% of those aged 18-30 for the population as a whole).
According to the research “Come closer”33 realized in 2008, in schools non participation of young
people in the age group 14-17 years is 11% for the Roma compared to 3.2% for young people of
other ethnicities. In the primary school “the proportion of Roma children enrolled in primary
education is 64%, compared to 98.9% - national average34”. Significant differences between the
education of Roma and the Roma population are recorded at secondary and university levels of
education. Thus, in the age group 18-30 years old, 9% of Roma are high school graduates and
university graduates 2% versus 41% and 27% for non-Roma population..
According to the 2011 Census, in education Gypsy, Roma and Traveler students in all the stage
are unrepresented. “25% achieved the national expectations in mathematics and English in
cooperation with 74% non-Roma students at the end of primary education. Related to
secondary level 12% students achieved GCSEs (English and Mathematics) in comparison
with 58% non Roma students”. Higher education data are missing in UK regarding the
Roma, Gypsy and Travels, usually universities are collecting their own data trough “Ethnic
monitoring process” for example Sussex university currently is collecting such a data, after
it analyses the website, results that Sussex University is conducting the process, but is not
collecting data for Roma, Gypsy and Travelers. Ethnicity is an indicator under the interest of
Higher Education Statistic Agency, but in order to collect data they are using the categories
available for the 2011 Census.
According to the research findings of the “2009 Mapping Survey of A2 and A8 Roma in
England”35, education is a key point of every child’s entry into society. Education plays a crucial
role in the social inclusion of the child, whether this relates to school provision in the country of
origin or in the target country, which is in this case England.36
Regarding economic situation 60 percent of Roma, Gypsy, and Travelers had no qualifications
almost three times higher in comparison with 23% non-Roma population. In the same line, 47 %
of Roma respondents of the census in 2011 where economically active, in comparison with 63 %
non Roma respondents.
The situation of students on higher education in the UK, is described by Danvers E. (2015: 10): “A
proportional estimate of numbers of Gypsies and Travelers in higher education can be gathered if
we take the 2011 census data of usual residents in aged 18 and above of Gypsy/Travelers or Irish
Travelers at 37,037 (England and Wales), 3,095 (Scotland) and 758 (Northern Ireland) - a
total of 40,890. If this is compared with the numbers of UK domiciled Gypsy/Traveler and Irish
Traveler students accessing higher education at 125 in 2012/13 and 155 in 2013/14”.
1.5. Comparison with other countries – European perspectives of Roma social inclusion
The general picture of the Roma, Gypsy and Travelers in Europe, can be understood from the
study conducted in November 2015, which suggests that Roma are the most negatively perceived
minorities and it is well know that discrimination affects all the areas. Europe’s Roma are often
associated, through public and media discourse, with negative stereotypes which draw upon
33 “Come closer” Report available at http://www.anr.gov.ro/docs/Publicatii/Vino_mai_aproape.pdf 34 Report of Presidential Commission since 2007, page 8; available at
http://www.presidency.ro/static/CPARSDR_raport_extins.pdf 35 The movement of Roma from new EU Member States: A mapping survey of A2 and A8 Roma in England 36 Ibdem 14.
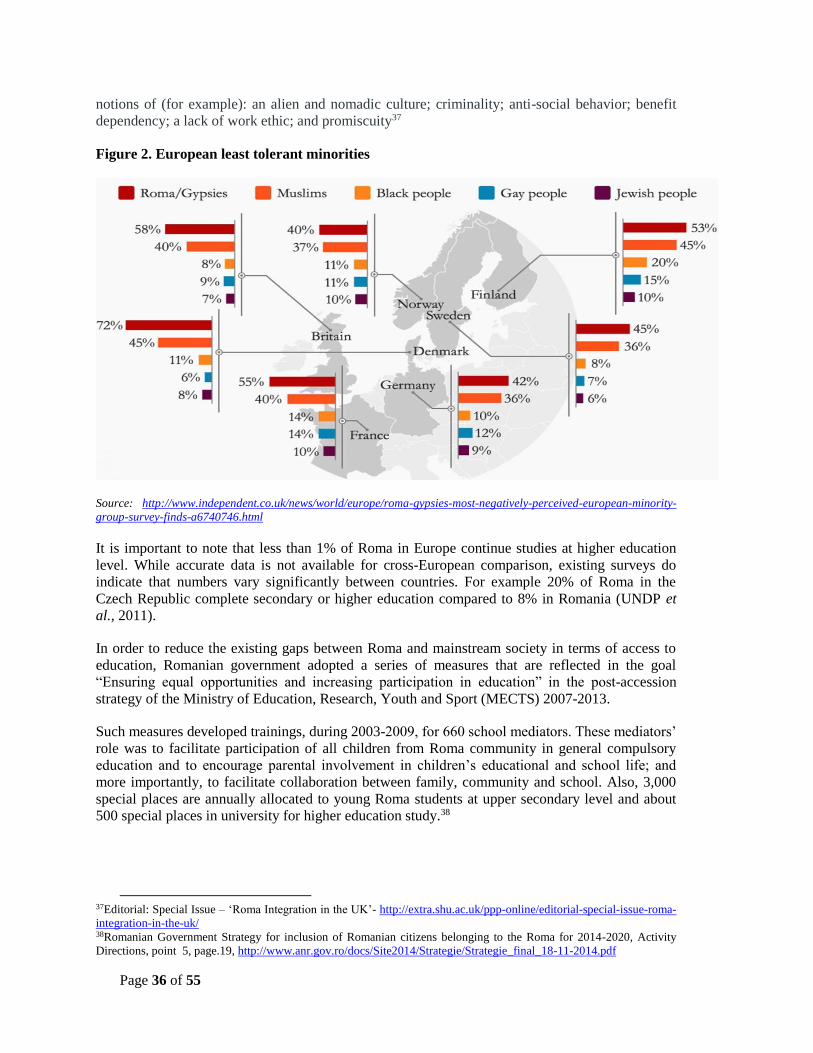
Page 36 of 55
notions of (for example): an alien and nomadic culture; criminality; anti-social behavior; benefit
dependency; a lack of work ethic; and promiscuity37
Figure 2. European least tolerant minorities
Source: http://www.independent.co.uk/news/world/europe/roma-gypsies-most-negatively-perceived-european-minority-
group-survey-finds-a6740746.html
It is important to note that less than 1% of Roma in Europe continue studies at higher education
level. While accurate data is not available for cross-European comparison, existing surveys do
indicate that numbers vary significantly between countries. For example 20% of Roma in the
Czech Republic complete secondary or higher education compared to 8% in Romania (UNDP et
al., 2011).
In order to reduce the existing gaps between Roma and mainstream society in terms of access to
education, Romanian government adopted a series of measures that are reflected in the goal
“Ensuring equal opportunities and increasing participation in education” in the post-accession
strategy of the Ministry of Education, Research, Youth and Sport (MECTS) 2007-2013.
Such measures developed trainings, during 2003-2009, for 660 school mediators. These mediators’
role was to facilitate participation of all children from Roma community in general compulsory
education and to encourage parental involvement in children’s educational and school life; and
more importantly, to facilitate collaboration between family, community and school. Also, 3,000
special places are annually allocated to young Roma students at upper secondary level and about
500 special places in university for higher education study.38
37Editorial: Special Issue – ‘Roma Integration in the UK’- http://extra.shu.ac.uk/ppp-online/editorial-special-issue-roma-
integration-in-the-uk/ 38Romanian Government Strategy for inclusion of Romanian citizens belonging to the Roma for 2014-2020, Activity
Directions, point 5, page.19, http://www.anr.gov.ro/docs/Site2014/Strategie/Strategie_final_18-11-2014.pdf
Page 37 of 55
School mediators’ duties and responsibilities are found in OMECT no. 1539 from 19.07.2007 that
specifies clearly that “the position of school mediators recommended hiring a person who knows
the language and culture of the local community that require services of mediation”.39
In the last 20 years in Romania, young Roma students have benefited from special places for
Roma in high schools 2.9% and 1.3% at the university3.
The new strategy to improve the situation of the Roma in Romania, adopted in 2014, stipulates the
obligation of hiring school mediators in all schools that have minimum 15% Roma students.
Therefore, the Roma Strategy requires in 2016 to engage a minimum of 600 school mediators. By
2020, this function should exist in all 1,680 schools across Romania where the number of Roma
children and students is at least 15%.
2. Government Initiatives for facilitating the access to education for Roma in the UK
2.1. General strategies and action plans of UK government for Roma inclusion
There are no particular strategies and action plans for Roma inclusion in the UK, as can be find in
Central and Eastern Europe. The only strategy is National Roma Integration Strategies which is
relatively newly developed.
In 2011 the European Commission introduced an EU Framework for National Roma Integration
Strategies focussing on four key areas: education, employment, healthcare and housing. It also
invited all Member States to present the European Commission with their strategy for Roma
inclusion or for specific policy measures for the Roma within their wider social inclusion policies.
The main responsibility was to improve the situation of all marginalised people, including the
Roma across the Member States. In relation to education issues as is stated in the communiqué,
“An EU Framework for National Roma Integration Strategies Up To 2020” by implementing
NRSI should ensure “access to quality education, including early childhood education and care, as
well as primary, secondary and higher education, with particular reference to the elimination of
possible segregation at school, the prevention of early school leaving and ensuring successful
transitions from school to employment40.
One of the main objectives of the framework is“Access to education” stressing that it should be
ensured “that all Roma children complete at least primary school”. Member States should ensure
that all Roma children have access to quality education and are not subject to discrimination or
segregation, regardless of whether they are sedentary or not. Member States should, as a
minimum, ensure primary school completion. They should also widen access to quality early
childhood education and care and reduce the number of early school leavers from secondary
education pursuant to the Europe 2020 strategy. Also, Roma youth should be strongly encouraged
to participate in secondary and tertiary education.
According to national legislation children in the UK have 3 basic rights related to education:
39 O.M.E.C.T. no. 1539 from 19.07.2007, Chapter II. Selection, classification, standardization and staff salaries, article
4. 3 “Roma from Romania. From scapegoat to engine development”, Community Development Agency Together, 2013. 40 An EU Framework for National Roma Integration Strategies up to 2020 - Council Conclusions-
http://register.consilium.europa.eu/doc/srv?l=EN&f=ST%2010658%202011%20INIT

Page 38 of 55
Free and compulsory primary education;
Equal access for minorities to education;
Equal opportunities within education systems.
Every child starts the education process at 3 years old and they should attend up to 15 hours of free
education per week. School attendance is compulsory for any child in England and Wales from the
age of 4 to the age of 18). “Although there are no national data available on school attendance
disaggregated by ethnicity41”, in order to better answer to need of Roma Gypsy and Travelers and
to help them to reach their full potential some authority’s use what is call “Pupil Level Annual
School” implemented since 2003, which counts the number of their Roma students, based on
which services have been formatted to better reflect the needs of the Roma communities. These
initiatives are aimed at providing support to the whole family. 42 In addition the authorities
employed Roma as teaching assistants and outreach staff to support the families in the engagement
in their children’s education service provision.
Even if European Commission required to member states to provide Roma strategy UK in order to
improve the socio-economic situation of Roma in Europe, the government did not established a
National Roma Strategy in order to support the Roma inclusion based on “Vademecum. The 10
Common Basic Principles on Roma Inclusion”43, for Roma Gypsy and Travelers preferred to use
some mainstream policy as framework to deliver social inclusion including education area.
The 10 “Common Basic Principles of Rom Inclusion”44 include:
Constructive, pragmatic and non-discriminatory policies: this means more concrete policies
should be built with respect to the situation on the ground. The design, implementation and
evaluation of policies and projects should not be based on preconceptions, In order to meet this
requirement, attention should be paid to studies and other sources of factual information, Roma
people should be involved in the design, implementation or evaluation of policies and projects.
Explicit but not exclusive targeting: this principle rises from the ongoing debate on how to best
address the needs of ethnic minorities with regard to the two contrasting perspectives: a specific
approach -targeted at a specific minority or a general approach. “Explicit but not exclusive
approach” - more concrete focus on Roma people as a target group without excluding other
vulnerable groups that living on the same socio-economic conditions.
Inter-cultural approach - having the role which solves the dilemma of implementing:
measures to promote the inclusion of an ethnic minority often integration will lead to cultural
assimilation. This us come to clarify that “instead of referring to cultural identities”, policies and
projects should focus on the promotion of inter-cultural learning and skills. And this can be
approached by providing to the majority population tools in order to understand the Roma
41 United Kingdom FRANET National Focal Point Social Thematic Study The situation of Roma 2012 Human Rights
Law Centre, University of Nottingham 42 United Kingdom FRANET National Focal Point Social Thematic Study The situation of Roma 2012Human Rights
Law Centre, University of Nottingham 43It is a tool for both policy makers and for professionals who manage programs and projects proposes by European
Commission in order to shape the public policy for Roma inclusion in Europe available at
http://www.coe.int/t/dg4/youth/Source/Resources/Documents/2011_10_Common_Basic_Principles_Roma_Inclusion.pd
f 44 Ibid. 52

Page 39 of 55
culture, the process should be also vice versa in this way will help the both sides to tackle
prejudice implementing this principle should be made based on fundamental human rights.
Aiming for the mainstream refers to long-term impact of policies and projects as sometimes,
despite aiming to support Roma inclusion, they can result in strengthening segregation that
promoting the inclusion of the Roma in mainstream society should be the ultimate aim of all
policies, all actions should be assessed to see if they risk causing segregation and adapted if
necessary for example creating separate and artificial labor markets or indirect discrimination.
Awareness of the gender dimension refers to the role of gender in promoting inclusion also the
principals express the importance of involving in the education of Roma kids for example school
mediators.
Transfer of evidence-based policies underline: the need of learning from own experiences and
exchange experiences with other stakeholders with the aim of highlighting lessons from their
work. In order to benefit from experience, good practices should be highlighted and disseminated
to others. Dialogue should take place among Member States and among Roma stakeholders, and
also with other sectors (for example, concerning work with other vulnerable groups or
developments taking place outside of the EU).
Use of European Union instruments: the seventh Principle draws attention to the EU’s legal,
financial and coordination instruments which can be promoted to Member States as tools for
supporting Roma inclusion. It is connected to the sixth Principle as it refers to coordination and
cooperation among stakeholders at European level.
Involvement of regional and local authorities: the eighth Principle focuses on regional and local
governance as actors at local level are essential for Roma inclusion.
Involvement of civil society and Active participation of the Roma: the last two Principles
concern cooperation with non-governmental organizations (NGOs), social partners,
academics/researchers and Roma communities. These actors should actively participate in the
design, implementation, monitoring and evaluation of policies and projects. Not only do Roma
organizations and networks have valuable expertise to offer, but they can also be important relays
for disseminating information to others.
It could allegedly be understood that if a member state does not use these principals, it would not
be due to the focus in changing the situation of such groups but a matter of political will. It can
also be understood that it is not due to the importance of paying particular attention to such
groups45 even though there is a special request from the European Union in this respect. There are
dilemmas of obtaining an appropriate balance of focus and resources between provision
specifically targeted towards GRT communities, and mainstream service provision.
Likewise, Vivian Reding presents the situation of the Roma as follows:
“Although the situation differs between EU countries, studies show that on average only
around 40% of Roma children complete primary school - compared to an average of 97%
for the general population across the EU. That is why the Commission's Framework
called on all Member States to make sure all Roma children complete at least primary
school. To break the vicious circle of Roma who have no education and who later cannot
45http://www.nfer.ac.uk/nfer/publications/TGS02/TGS02.pdf

Page 40 of 55
find a job and therefore end up living in sheer poverty; to ensure Roma children get
education today, to find work tomorrow.”46
2.2. Access to education
The literature review conducted for this research has shown that the attendance of Gypsy, Roma
and Traveler pupils continues to be identified as a significant problem, particularly in the primary
and secondary phase Roma and Traveler pupils have the lowest achieving results or coming age
requirements of the national curriculum groups within schools in the UK. At the same time,
“nearly 9 out of every 10 children and young people from a Gypsy, Roma or Travelers
background have suffered racial abuse47”, which is in contradiction with the mission of the
government to ensure equality in society, as is stated in the progress report as a core values
“Equality is about creating a fairer society, where diversity is valued and respected, where people
do not face discrimination and prejudice and a society where everyone can participate, flourish and
have the opportunity to fulfill their potential.”48
Traveler Education Support Service and Ethnic Minority Achievement Service are in charge with
all groups of Roma that are alongside UK. In order to increase the attainment of Roma children
there are some outstanding initiatives projects.
England: That there are not national initiatives in England to promote inclusive education
targeting specifically Roma, Gypsy and Travelers and several barriers make social inclusion more
difficult generating lack of understanding of culture.
Traveler Education Support Services: represent a central point of contact access to education,
watching over their wellbeing and attainment in schools in England and often facilitating their
access to other services.49
Scotland: In 2014, the Scottish Government was working on an action plan related to their
proposed commitment to reduce discrimination towards Gypsy and Travelers by 2017.
STEP is a national Knowledge, Exchange and Information Centre, funded by Scottish
Government’s Learning Directorate, Support for Learning Division. It is located in the Institute for
Education, Teaching and Leadership at The Moray House School of Education, The University of
Edinburgh.
National aims of STEP:
o Promoting developments of innovative, diverse and flexible access to education for
Travelers, particularly for those and others with interrupted learning;
o Listening to and enabling Traveler families express their views about education and their
children’s educational needs;
46 Speech Vivian Reading http://europa.eu/rapid/press-release_SPEECH-14-291_en.htm 47Gypsy, Traveller and Roma: Experts by Experience Reviewing UK Progress on the European Union Framework for
National Roma Integration Strategies 48 Welsh Ministers Report on Equality 2014- 49The Movement of the EU member States A mapping survey of A2 and A8 Roma in England Patterns of settlement
and current situation of the new Roma communities avaible at
http://equality.uk.com/Resources_files/movement_of_roma.pdf.
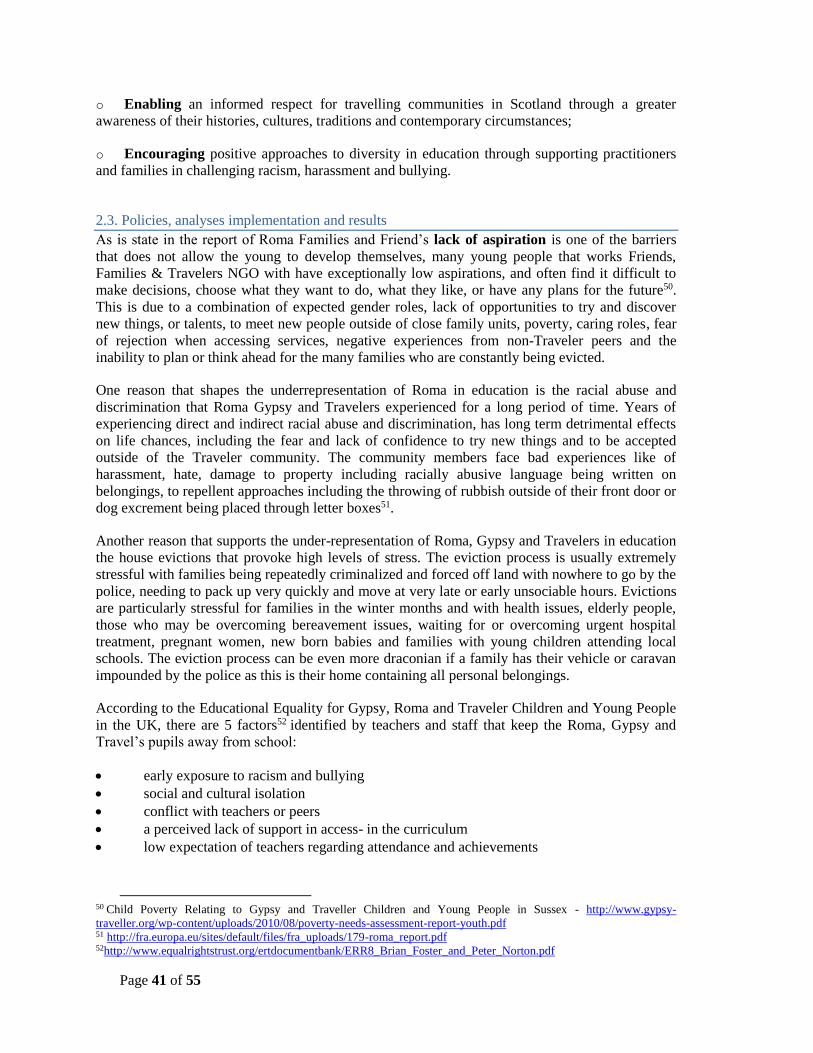
Page 41 of 55
o Enabling an informed respect for travelling communities in Scotland through a greater
awareness of their histories, cultures, traditions and contemporary circumstances;
o Encouraging positive approaches to diversity in education through supporting practitioners
and families in challenging racism, harassment and bullying.
2.3. Policies, analyses implementation and results
As is state in the report of Roma Families and Friend’s lack of aspiration is one of the barriers
that does not allow the young to develop themselves, many young people that works Friends,
Families & Travelers NGO with have exceptionally low aspirations, and often find it difficult to
make decisions, choose what they want to do, what they like, or have any plans for the future50.
This is due to a combination of expected gender roles, lack of opportunities to try and discover
new things, or talents, to meet new people outside of close family units, poverty, caring roles, fear
of rejection when accessing services, negative experiences from non-Traveler peers and the
inability to plan or think ahead for the many families who are constantly being evicted.
One reason that shapes the underrepresentation of Roma in education is the racial abuse and
discrimination that Roma Gypsy and Travelers experienced for a long period of time. Years of
experiencing direct and indirect racial abuse and discrimination, has long term detrimental effects
on life chances, including the fear and lack of confidence to try new things and to be accepted
outside of the Traveler community. The community members face bad experiences like of
harassment, hate, damage to property including racially abusive language being written on
belongings, to repellent approaches including the throwing of rubbish outside of their front door or
dog excrement being placed through letter boxes51.
Another reason that supports the under-representation of Roma, Gypsy and Travelers in education
the house evictions that provoke high levels of stress. The eviction process is usually extremely
stressful with families being repeatedly criminalized and forced off land with nowhere to go by the
police, needing to pack up very quickly and move at very late or early unsociable hours. Evictions
are particularly stressful for families in the winter months and with health issues, elderly people,
those who may be overcoming bereavement issues, waiting for or overcoming urgent hospital
treatment, pregnant women, new born babies and families with young children attending local
schools. The eviction process can be even more draconian if a family has their vehicle or caravan
impounded by the police as this is their home containing all personal belongings.
According to the Educational Equality for Gypsy, Roma and Traveler Children and Young People
in the UK, there are 5 factors52 identified by teachers and staff that keep the Roma, Gypsy and
Travel’s pupils away from school:
early exposure to racism and bullying
social and cultural isolation
conflict with teachers or peers
a perceived lack of support in access- in the curriculum
low expectation of teachers regarding attendance and achievements
50 Child Poverty Relating to Gypsy and Traveller Children and Young People in Sussex - http://www.gypsy-
traveller.org/wp-content/uploads/2010/08/poverty-needs-assessment-report-youth.pdf 51 http://fra.europa.eu/sites/default/files/fra_uploads/179-roma_report.pdf 52http://www.equalrightstrust.org/ertdocumentbank/ERR8_Brian_Foster_and_Peter_Norton.pdf
Page 42 of 55
Developing long term and strategic approaches:53 Key factors which inhibit longer term service
development include: short term crisis management; issues around insecurity of accommodation;
inter-organizational differences around data-sharing; lack of central involvement of Gypsy, Roma
and Traveler communities in policy development; the need for a capacity building approach.
3. Non-Governmental Initiatives for facilitating the access to higher education for
Roma in the UK
3.1. The role of NGO-led initiatives for facilitating the access to Education – UK perspectives
There are only few non-governmental initiatives aimed at facilitating the access to education for
Roma, Gypsy and Travelers in the UK. There are some groups of Roma organization that are
conducting spread activities across the UK regarding the education, but without having a specific
focus on higher education. UK was not part of the Decade for Roma Inclusion. At the European
level trough National Roma Integration Strategy it is supposed that the inclusion of Roma, Gypsy
and Travelers should be realized with the EU FUNDS. According to the 2007 -2013 financial
programming from European Union to UK, €14.4 billion were supposed to be spent under the
programs European Regional Development Fund (ERDF) and European Social Fund and
additional €6.4 billion under the Rural Development Fund. Second financial programming 2014-
2020 allocated €11.6 billion from the European Social Fund and European Regional
Development Fund that support to be spend in order to increase the status of disadvantaged groups
including Roma but according to European Commission monitoring report on the UK regarding
Roma’ Integration Strategy realized in 2014, there is no progress and no consultation regarding
development of strategy. The only hopes in producing changes in the educational outcomes for
Roma pupils remain at the disposal of the local councils of the UK.
The indicators also show that there is not capacity on Roma, Gypsy and Traveler organizations in
order to access Structural Funds and to meet the bureaucracy of such program required at the
European level. Therefore even if it is a big amount of money that can produce changes in the life
of the group and ensures equal access to education, there are no special projects that can allow to
civil society to develop capacity building and take action supposed to increase the number of
Roma children in education and in higher education.
Article 1254 from Scotland is an organization that addressed the unethical reporting exhibited by
many publications concerning Gypsy/Travelers in the UK. To identify misleading and unbalanced
articles are a key driving force in the discrimination experienced by Gypsy/Travelers in UK as a
whole. The activity of the organization is performed by young people as an express of their
concerns regarding Roma in media coverage.
Friends, Families & Travelers55 is a national voluntary organization providing information, advice,
support, an advocacy role, national casework, planning and policy work and campaigning for the
rights of all Travelers regardless of their ethnic group or lifestyle. This includes campaigning for
the right to live a nomadic lifestyle.
53http://www.nfer.ac.uk/nfer/publications/TGS02/TGS02.pdf 54http://www.article12.org/wp-content/uploads/2014/12/YGTL-Media-Audit-Year-3_Final-.pdf 55http://www.gypsy-traveller.org
Page 43 of 55
Since February 2008, they have been working with young people across Sussex on a project
funded by BBC Children In Need. FFT works to support young Gypsies and Travellers to build
their confidence and help them access into the normal activities enjoyed by young people in the
community as well as into work and further education. FFT provides individual support and
mentoring and organizes programmes of group activities during school holiday times as a means
of retaining their interest and enthusiasm. In June 2012 “Friends Families and Travellers”
produced its first professional theatre production called “Crystal’s Vardo” a play for children and
young people written by Suzanna King. The play was premiered at “The Pavilion Theatre” in
Brighton as part of Gypsy Roma Traveller History month and was declared as a great success. In
addition the play was performed in several Brighton schools where it was also well received. The
main role of the play is Crystal a young Gypsy girl who has been bullied at school which become
desperate to get away she runs away from home with her Grandfather’s vardo and pony only to
find herself lost and miles from anywhere familiar, she has not no choice but to put her trust in the
audience to help her find her way back. As Crystal begins to tell the story of her ancestors,
something extraordinary happens and Crystal and her companions find themselves far back in
time, when the first Gypsies migrated from Northern India. By piecing together the shards of her
ancestry, she regains a new confidence in her own identity, whilst raising the awareness of her new
friends. “Crystal’s Vardo” was implemented in response to the continued problems of
discrimination and bullying faced by young Roma Travellers. This can be considered as a great
resource for schools to help tackle these issues and to teach the settled community about the
history and culture of Gypsies and Travellers.56
The Advisory Council for the Education of Romany and other Travellers (ACERT)57 the
organization was founded in 1973 by Lady Plowden, Tom Lee, the General Secretary of the
Romany Guild and others from Gypsy and other communities. Lady Plowden had chaired the
major Government study “Children and their Primary Schools” in 1967, which found that Gypsy
children had the worst access to Education of any group. ACERT is a key partner in running very
successful event “Education on the Hoof” at Appleby Horse Fair each June in Cumbria. It
maintains close links and many common aims with the National Association of Teachers of
Travellers and Other Professionals.
Traveller Education Support Service for Northern Ireland (TESS)58
The Traveller Education Support Service provides advice, guidance and focused support to
schools and to parents and pupils from the Traveller community as part of the Children & Young
People’s Services main aim: “to help improve pupil outcomes and ultimately their life chances".
In order to accomplish his aim TESS has the following objectives:
To improve the quality of educational support provided to the Traveller community;
To provide a consistent service to schools and families in need of support across Northern
Ireland;
To facilitate equality of access from pre-school to post-primary education;
To build the capacity of schools to meet the educational needs of Traveller children and
young people;
To promote whole school approaches to service development;
To promote full inclusion and integration across all areas of youth education;
56 http://www.gypsy-traveller.org 57 http://acert.org.uk/about-acert/ 58 http://www.eani.org.uk/schools/traveller-education-support-service/
Page 44 of 55
To support and encourage family learning, out of school hours learning and life-long
learning.
National Association of Teachers of Travellers (NATT)59
The organization is committed to the education of Gypsy, Roma and Travellers of Irish
Heritage, Fairground, Circus, New and Bargee children and young people. Throughout the year, it
provides resources for teachers of Travellers and other professionals.
Scottish Education Traveller Programme (STEP )60 according to their website their mission is to
give “voice to everyone involved in travelling culture and education”. STEP is in the unique
position of being able to straddle research, policy and practice. We are based within the University
of Edinburgh, Institute of Education Teaching and Leadership, they receive support from Scottish
Government’s Learning and Equalities Directorates and are in charge also with the Traveller
Education Network (TENET), which consist of membership from the majority of Scotland’s local
authorities.
The target groups are: families who experience interruptions to education due to travelling or
cultural reasons. Teachers and all who are involved in education with people from travelling
cultures and it provide information, resources and ideas.
4. Access to Higher Education for Roma in UK from Roma Students’ Perspectives:
Enablers and Barriers
In the analysis on Access to Higher Education in the UK I have conducted a survey based on semi-
structured questionnaire, addressed and transmitted through social networks and contacts with
student belonging to the target group known to learn in this country. Knowing that the number of
students belonging to the target group is relatively limited (150 in the academic year 2013/2014) it
is obvious that accessibility to respondents that I could have is limited as well.
In this respect, I applied a questionnaire containing the following topics:
Roma, Gypsies and Travelers in higher education
Prejudice and stereotypes
Secondary education and transition to university
Access to higher education and related costs
State or university support for students in need
Support of Non-Governmental Initiatives for facilitating the access to higher education for Roma
in the UK
Enablers and barriers for Roma, Gypsies and Travelers in higher education
I managed to interview three Roma students from three different universities in the UK: a student
from Romania, a student from Macedonia, and a student in Bulgaria, as is presented below.
Name: L. I. D.
Age: 39
59 http://www.natt.org.uk 60 http://www.step.education.ed.ac.uk

Page 45 of 55
Gender: Male
Marital status: Unmarried
Origin Country: Romania, Urban area
Degree and specialization MSc in Ethnicity and Multiculturalism
University: University of Salford, School of Nursing, Midwifery, Social Work & Social Sciences
Name: T. F.
Gender: M
Age: 25
Marital status: Unmarried
Origin country: Macedonia, Skopje
Degree and specialization: MA
University: MSc in Migration, University of Oxford
Name: V. P.
Gender: female
Age: NR
Marital status: divorced
Origin country: Bulgaria, Sofia
Degree and specialization: Master`s, International relations
University: Sofia University St. Kliment Ohridski
4.1. Roma, Gypsies and Travelers in higher education
On this subject it is interesting to note the heterogeneity of the origins for the category in which
the subjects have been self-identified: LID belongs to the group of Ursari Roma (those who used
to make the bears dance), while TF and VP did not specify a particular Roma sub-group. At the
community level home T. F. comes from a segregated community, while LID and V.P. are from
integrated communities.
Regarding the attitude towards formal education for Roma, Gypsies and Travelers community,
LID mentions that:
“I was born and raised in urban areas in a building with the majority population. In my
family the education has a great value, no different than other members of society”
TF indicates:
“It depends what we mean by ‘attitude’. If we define it as a desire or willingness to gain
or pursue formal education – in my community, undoubtedly everyone wants that; they
are very keen to gain formal education (including higher education/university studies as
well.”
VP emphasizes that:
“In my local community (Montana, North- Western Bulgaria) more than half of the Roma
population have at least secondary level of education, which speaks by itself for the
attitude to formal education. My city is one of the good examples of places of Roma
communities with significant number of Roma with higher level of education”.

Page 46 of 55
The aspect of traditional position of the woman in Roma, Gypsies and Traveler community is
revealed by subjects as is mentioned below:
LID: “I believe that ‘traditional’ model implied by your question cannot be defined as a
universal or collective concept, but rather should be regarded as a dynamic process of
socially organizing and regulating the cultural experiences, whilst the membership norms
are always negotiated and reshaped. The public discourse in European society today
inclines to claim that GRT should be perceived as an ethnic group that represents an
unyielding, and indissoluble entity and their ethnic identity as a natural product of an
unchangeable traditional culture. Nevertheless, this model was criticized for being
advanced on highly subjective and biased presumptions, failing to take into account the
institutional barriers that could have a major impact on the educational achievement of
children. It can be settled that the concept of GRT "traditional culture" cannot be a
realistic model since the concept of 'culture' is a constant subject of change and redesign
rather than unalterable by its nature”.
TF: “Anyway, there is no difference between women and men in my community;
especially not when it comes to the issue concerning education; generally speaking, the
parents are encouraging their kids (regardless of their gender) to pursue their
education”.
VP: “Traditions in my local community are not different from those in the other parts of
the world: from the woman is expected to take care for children, to be good housewife
and to support her husband development. Those women who study, or who try to build a
career receive attitudes starting from complete admiration (more coming by other
youngsters), to the opposite: full isolation from the community and acceptance as
“gadzi”.”
Different opinions are collected on the subject on whether “marriage and/or childbearing of Roma,
Gypsies and Travelers women can be combined with university studies”, “the possibilities for
Roma, Gypsies and Travelers wives and/or mothers to pursue university studies” and “attitude of
the Roma, Gypsies and Travelers family or community towards Roma women (single, wives,
mothers) who want to pursue higher education”:
LID: “Some of the arguments of your perspective when you talk about ‘extent marriage
and/or childbearing of Roma, Gypsies and Travelers women’ brought in academic debate
are based on the “traditional” division of gender roles of children in GRT communities
which is significantly different between boys and girls in relation to community traditional
customs and expectations. Over the years, numerous researches reach the conclusion that
most of the GRT girls living in close traditional communities have internalized their roles
within the family transmitted by their parents. In this sense it was mentioned that: learning
housework; keeping virginity until marriage; taking care of siblings and becoming “a
good wife and a good mother” are more important than any educational aspirations. First
aspect is related with the awareness that early marriages do not signify a necessity within
different circumstances. This is one of the most convincing arguments that preferences are
not stable but rather determined by goals which are changing over time and
circumstances”.
TF: NR
Page 47 of 55
VP: “It depends on the people who are getting in a relationship/marriage, but in general,
even the educated Roma cannot accept as equal to them the educated Roma
girl/woman/wife. I dare to say that even being educated, being wife of educated Roma
man, you should prove yourself twice more: one time as professional and second time- as
a woman, who is able to handle out each of the duties, which the traditional Roma woman
has to do: cooking, cleaning the house, washing, providing care to everyone…And if you
lose one of these battles, this would reflect on your life, and on the life of your
child/children”.
The sense of belonging to the community, to be part of Roma community seems to be very diluted
or quite very confusing (Q: “Does community support you in your education process (secondary
school and higher education)? If yes, how exactly (morally, financially, the whole community, or
specific members of it, etc.)? Why?”).
LID: “What do you mean by community? I did not live in a Roma community in the sense
you implied, therefore I cannot answer”.
TF: “Yes, definitely! Helping is part of our ‘traditional values’ or rather (moral)
obligations among Roma – I’m an orphan, due to my specific situation, I was supported
morally, financially and otherwise by my the entire community”.
VP: “Yes”.
4.2. Prejudice and stereotypes
LID and VP declare that they didn’t experienced any instances of Roma, Gypsies and Travelers
related prejudice and stereotypes during your school education (primary, secondary school), but
TF indicates briefly “Yes, kind of”. TF remains constantly in his opinion and argue regarding
higher education that
“There is a higher level of political correctness at the university than the one at high
school for instance; however the situation remains the same, especially when it comes to
prejudice and stereotypes towards Roma”, but is important to note that “Instead of
demotivating me, that motivated me even more – the desire and willingness to prove them
wrong has been always a driving force throughout my studies”.
LID and VP consider that they did not suffer prejudice and stereotypes during higher education
studies. Regarding the involvement of university for students to be successful we notice that LID
and TF indicate positive opinions, but VP don’t offer a position on this subject.
4.3. Secondary education and transition to university
On this topic, the subjects express only little information which could help to identify the state of
education route and the main problems of transition to University. TF has a strict position to
indicate “It was ‘integrated’ school. I was the only Roma in the entire school”, but he entered to
higher education immediately after secondary school and he has finished my university studies on
time (“3 years BA and 2 years MA – now I’m doing another MA”). LID was to a school with two
Roma pupils and he has a extended experience on Higher Education (First university - started
at18, finished at 21, Second university - started at 34, finished at 37, Master – started at 38,

Page 48 of 55
finished at 39, PhD started at 39, planned to finish at 42). Unfortunately, no more answers were
received on behalf of VP.
4.4. Access to higher education and related costs
LID and TF are the first generation in their nuclear and/or extended families to study at university
(or to have higher education/university degree); VP declares that he is not the first generation to
attend university courses.
The reasons to continue studies at higher education level are diverse: LID mentions “Ambition”,
while VP indicates her father’s encouragement.
Regarding the fee of tuition, LID did not want to mention the source of financing, TF indicates the
family and university and VP did offer an answer to this question (indicated the sum 3900 Pounds,
but not the source). LID and VP have been working during their studies, while VP declared that
she took a loan to cover her financial needs during the university studies.
Lack of information has been mentioned by all students regarding how they cope with the
financial needs during their university studies and if they received support from their families
(parents, spouse, children, etc.).
4.5. State or university support for students in need
UK education system supports and helps different students in attainment their goals to pursue
higher education: only LID is beneficiary of “Pathway to Excellence Award”, TF and VP don’t
mention a any specific support.
LID and VP don’t know of any state-supported financial or non-financial assistance schemes for
minority groups in the UK (grants, stipends, etc.), TF avoided to offer a response, but LID and TF
indicated that there are non-financial support centers or schemes in their university where students
can ask for help (mentorship schemes, peer counseling, cultural communities, etc.) (
4.6. Support of non-governmental initiatives for facilitating the access to higher education for
Roma in the UK
LID was the beneficiary of Roma Graduation Preparation Program in Budapest before coming to
the UK, while VP got a full scholarship by the University of Oxford.
4.7. Enablers and barriers for Roma, Gypsies and Travelers in higher education
The main problems and barriers for Roma to attend university education:
LID:
Structural and institutional discrimination;
The hidden interests of Roma community representatives and political parties;
Lack of inclusive educational environment.
TF:
Their financial situation
Presumably socialization can be taken as main obstructions.
VP – non –response
Page 49 of 55
4.8. The impact of higher education on Roma, Gypsies and Travelers ethnic identity
LID: “The young generation of GRT has a different perception of their ethnic identity,
which is closer to the mainstream society norms and values, without a clear distinction
between them and other members of society. GRT 'identity' cannot be defined as a
universal or collective concept, but rather should be regarded as a dynamic process of
socially organizing and regulating the cultural experiences, whilst the membership norms
are always negotiated and reshaped. In this view, the need for a ‘ethnic identity’ is
contested as long as the boundaries of ethnic concept are fluid and exposed to the
influence of the larger social structures and social spectacle. Therefore, to answer your
question, there is no quantifiable impact on GRT identity because, the ‘ethnic identity’
itself is a social construct which in my opinion represent a tool for maintaining a deficit
paradigm instead of approaching the socio-economic issues that GRT are confronted
from a citizenship and human rights perspective”.
4.9. Measures students consider as suitable to facilitate the access for Roma to higher education
in the UK
LID:
Affirmative measures (special place at the UK Universities)
Preparation Programs for University Alumni in order to step up towards a Master
degree.
Conclusions
It is important to recognize a problem of identification related to what we indicate as Gypsy,
Traveler and Roma Population in UK. The UK Government combined census data with direct
counts of caravans, school records and other recording and have estimated the numbers at 300,000
(Friends, Families and Travelers, 2015).
The situation of the Roma community in the UK in recent years concerned large number of diverse
institutional stakeholders, public and private, being established structures of Roma representation
at national and international level but with all of this the available data on Roma reveal that the
situation does not give to the next generation of Roma community the ground to develop their self.
Several reasons including the circle of poverty affect the main important rights of Roma and even
if there are some legislative measures that should support the process of social inclusion it is still
hard to see the progress of well-being for minorities.
There are no strategies and action plans special for Roma inclusion in the UK government
inclusion and mainly focusing in education as can be find it in Central and Eastern Europe.
The attendance of Gypsy, Roma and Travelers pupils continues to be identified as a significant
problem, particularly in the primary and secondary phases of schooling. Roma and Traveler pupils
have the lowest achieving results or coming age requirements of the national curriculum groups
within schools in the UK.
Between 3 and 4% of the Gypsy, Roma and Travelers in the UK population over 18 is accessing
higher education, but it is important to note that less than 1% of Roma in Europe continue to
higher education.
Page 50 of 55
No coherent policy framework on Roma Gypsy and Travelers exist at national level. The data
identified as part of this report confirm that a complex range of factors contribute to the
underachievement of these groups.
There are no affirmative measures in order to support the transition of Roma, Gypsy and Travels
in higher education. The government should make sure to set out its priorities for sustainable
growth of the number of Roma in higher education.
There are some spread actions along the UK that aim at increasing the number of students and
focus in education progress but still the low achievement is persisting in this area.
It is important to investigate the extent to which outcomes at the individual level of education
students reflect the perceptions and fulfill their expectations.
There are only few non-governmental initiatives to facilitate the access of Roma, Gypsy and
Travelers in UK higher education.
There is only little information available which could help to identify the state of education route
and the main problems of transition to University for Roma, Gypsy and Travelers in the UK in
higher education. Majority of Roma, Gypsy and Travelers in the UK in higher education are at the
first generation who access university courses (Danvers 2015).
The main problems and barriers for Roma to attend university education in the UK, opinions
expressed by interviewed students:
Structural and institutional discrimination;
Lack of inclusive educational environment;
Their financial situation;
Presumably socialization can be taken as main obstructions.
Measures considered suitable to facilitate the access of Roma to higher education in UK:
Affirmative measures (special place at the UK Universities).
Preparation Programs for University Alumni in order to step up towards a Master degree.
Schools must have clear policies on prevention of bullying as much to possible to use this
polices in order to avoid the cases of bulling.
To increase the number of Roma cultural and history activities in school as a measures support.
Page 51 of 55
References
1. Danvers, E. (2015). Higher Education Internationalization and Mobility: Inclusion, Equalities and Innovation. Supporting Roma
Students in Higher Education.
2. www.luciefremlova.co.uk/app/download/5783574496/Getting-to-74Know-the-Roma-Communities-in-
England.pdf
3. International Affairs, Yaron Matras (2000) Romani migrations in the post-communist era> Their
historical and political significance , Cambridge Review of International Affairs,13:2, 32-50, DOI:
10.1080/09557570008400297
4. The movement of Roma from new EU Member States: A mapping survey of A2 and A8 Roma in
England Patterns of settlement and current situation of the new Roma communities.
5. http://ec.europa.eu/justice/discrimination/files/roma_country_factsheets_2014/united-kingdom_en.pdf
6. What does the 2011 Census tell us about the Characteristics of Gypsy or Irish Traveler’s in England and
Wales? 21 January 2014
7. The Census include just Gypsy and Travelers and not also Roma which migrate from Central Este
Europe in UK
8. https://www.sheffield.ac.uk/polopoly_fs/1.43714!/file/GT-final-report-for-web.pdf
9. The UK Government’s response to the EU framework on national Roma integration strategies Marc
Willers and Owen Greenhall.
10. Equality Act 2010 related to the situation of Roma Gypsy or Irish Travelers
http://www.legislation.gov.uk/ukpga/2010/15/contents
11. Gypsies and Travellersshadow report- response to the United Kingdom’s 18th and 20th report on the
International Convention on the Elimination of all forms of Racial Discrimination (CERD).
12. Report on discrimination of Roma children in education available at
http://ec.europa.eu/justice/discrimination/files/roma_childdiscrimination_en.pdf
13. The Roma and Education Against Social Exclusion Gisela Redondo* and Mimar Ramis.
14. Come more closer avaible http://www.anr.gov.ro/docs/Publicatii/Vino_mai_aproape.pdf
15. Rapport of Presidential Commission since 2007 page 8 available at
http://www.presidency.ro/static/CPARSDR_raport_extins.pdf last time accessed 07.11.2015
16. https://www.hesa.ac.uk/intros/stuintro1213 last time accessed 21.12.205
17. The movement of Roma from new EU Member States: A mapping survey of A2 and A8 Roma in
England
18. Editorial: Special Issue – ‘Roma Integration in the UK’- http://extra.shu.ac.uk/ppp-online/editorial-
special-issue-roma-integration-in-the-uk/.
19. Romanian Government Strategy for inclusion of Romanian citizens belonging to the Roma for 2014-
2020, Activity Directions, point 5, page. 19,
http://www.anr.gov.ro/docs/Site2014/Strategie/Strategie_final_18-11-2014.pdf
20. O.M.E.C.T. nr. 1539 din 19.07.2007, Chapter II. Selection, classification, standardization and staff
salaries, article 4
21. ”Roma from Romania. From scapegoat to engine development”, Community Development Agency
Together, 2013
22. United Kingdom FRANET National Focal Point Social Thematic Study The situation of Roma 20.12
Human Rights Law Centre, University of Nottingham
23. United Kingdom FRANET National Focal Point Social Thematic Study The situation of Roma
2012Human Rights Law Centre, University of Nottingham
24. It is a tool for both policy makers and for professionals who manage programs and projects proposes by
European Commission in order to shape the public policy for Roma inclusion in Europe available at
http://www.coe.int/t/dg4/youth/Source/Resources/Documents/2011_10_Common_Basic_Principles_Roma_I
nclusion.pdf
25. Speech Vivian Reading http://europa.eu/rapid/press-release_SPEECH-14-291_en.htm
26. Department for Communities and Local Government (2012) Progress report by the ministerial working
group on tackling inequalities experienced by Gypsies and Travellers. London: HMSO.
27. Gypsy, Traveller and Roma: Experts by Experience Reviewing UK Progress on the European Union
Framework for National Roma Integration Strategies
28. Welsh Ministers Report on Equality 2014-http://www3.hants.gov.uk/education/emtas/travellers.htm
Page 52 of 55
29. The Movement of the EU member States A mapping survey of A2 and A8 Roma in England Patterns of
settlement and current situation of the new Roma communities avaible at
http://equality.uk.com/Resources_files/movement_of_roma.pdf.
30. Child Poverty Relating to Gypsy and Traveller Children and Young People in Sussex-http://www.gypsy-
traveller.org/wp-content/uploads/2010/08/poverty-needs-assessment-report-youth.pdf
31. http://www.equalrightstrust.org/ertdocumentbank/ERR8_Brian_Foster_and_Peter_Norton.pdf last time
accesat at 21.12.2015
32. Roma in Europe: The Implementation of European Union Instruments and Policies for Roma Inclusion –
Progress Report 2008-2010-Brussels, 7.4.2010 SEC(2010) 400 final
33. http://www.nfer.ac.uk/nfer/publications/TGS02/TGS02.pdf
34. http://www.nfer.ac.uk/nfer/publications/TGS02/TGS02.pdf
35. http://www.article12.org/wp-content/uploads/2014/12/YGTL-Media-Audit-Year-3_Final-.pdf
36. Scottish Government funding to organisations working with
Gypsy/Travellershttp://www.gov.scot/Topics/People/Equality/gypsiestravellers/strategy/funding
37. http://www.gypsy-traveller.org
38. http://www.europeandialogue.org/
39. Conference of World Bank, UNICEF and OSF -7th-8th April 2014 –
Bucharesthttp://www.worldbank.org/content/dam/Worldbank/Event/ECA/romania/Arthur%20Ivatts.pdf
40. https://www.gov.uk/government/uploads/system/uploads/attachment_data/file/181669/DFE-RR043.pdf
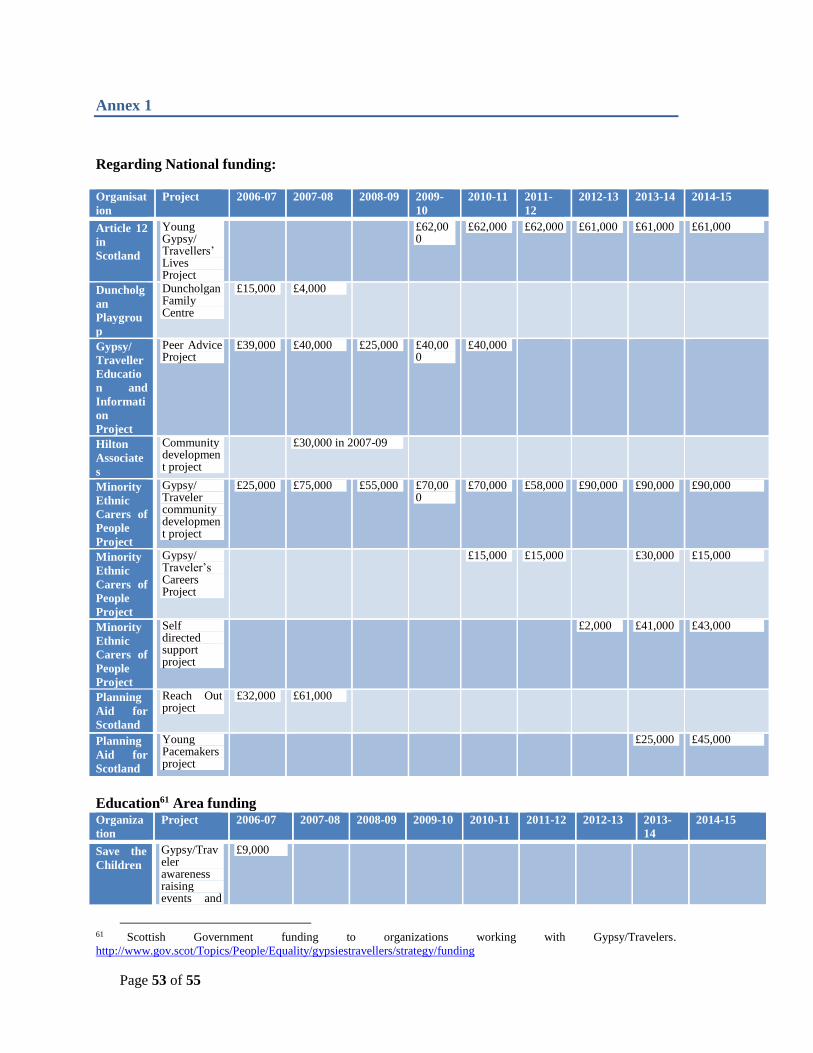
Page 53 of 55
Annex 1
Regarding National funding:
Organisat
ion
Project 2006-07 2007-08 2008-09 2009-
10
2010-11 2011-
12
2012-13 2013-14 2014-15
Article 12
in
Scotland
Young Gypsy/ Travellers’ Lives Project
£62,000
£62,000 £62,000 £61,000 £61,000 £61,000
Duncholg
an
Playgrou
p
Duncholgan Family Centre
£15,000 £4,000
Gypsy/
Traveller
Educatio
n and
Informati
on
Project
Peer Advice Project
£39,000 £40,000 £25,000 £40,000
£40,000
Hilton
Associate
s
Community development project
£30,000 in 2007-09
Minority
Ethnic
Carers of
People
Project
Gypsy/ Traveler community development project
£25,000 £75,000 £55,000 £70,000
£70,000 £58,000 £90,000 £90,000 £90,000
Minority
Ethnic
Carers of
People
Project
Gypsy/ Traveler’s Careers Project
£15,000 £15,000 £30,000 £15,000
Minority
Ethnic
Carers of
People
Project
Self directed support project
£2,000 £41,000 £43,000
Planning
Aid for
Scotland
Reach Out project
£32,000 £61,000
Planning
Aid for
Scotland
Young Pacemakers project
£25,000 £45,000
Education61 Area funding Organiza
tion
Project 2006-07 2007-08 2008-09 2009-10 2010-11 2011-12 2012-13 2013-
14
2014-15
Save the
Children
Gypsy/Traveler awareness raising events and
£9,000
61 Scottish Government funding to organizations working with Gypsy/Travelers.
http://www.gov.scot/Topics/People/Equality/gypsiestravellers/strategy/funding

Page 54 of 55
exhibition at the National Museum of Scotland
Save the
Children
Young Gypsy/Traveler project
£40,000
Scottish
Traveller
Educatio
n Project
E-learning and Gypsy/Traveler education in Scotland
£117,000 £85,000 £110,000
£115,000
£115,000
£104,000
£114,000
£114,000
£114,000
Scottish
Traveller
Educatio
n Project
Family Literacy project
£62,000