reservoir and farm pond design - agrimoon.com
TRANSCRIPT

Reservoir and
Farm Pond Design
Dr. S. N. Panda Dr. B. C. Sahoo Dr. K. P. Sudheer

Reservoir and Farm Pond Design -: Course Content Developed By :-
Dr. S. N. Panda
Professor
Dept. of Agricultural and Food Engg., IIT, Kharagpur
Dr. B. C. Sahoo
Associate Professor (SWCE)
College of Agricultural Engg. and Tech., Orissa University of
Agriculture and Technology
Dr. K. P. Sudheer
Professor
Civil Engineering Department, IIT, Madras

INDEX
Lesson Name Page No
Module 1: Fundamentals of Reservoir and Farm Ponds
Lesson 1 Introduction to Rainwater Harvesting 5-9
Lesson 2 Hydrological Aspects of Water Harvesting 1024
Lesson 3 Identification of Areas Suitable for Water Harvesting
25-39
Lesson 4 Reservoir/Dam and Farm Ponds 40-52
Lesson 5 Earthen Embankments 53-58
Lesson 6 Earthen Embankment Classification 59-63 Module 2: Basic Design Aspect of Reservoir and Farm Pond Lesson 7 Components of Embankment 64-66
Lesson 8 Basic Design Concept I 67-71
Lesson 9 Basic Design Concept II
72-75
Lesson 10 Design of Dam Components 76-85 Module 3: See and Stability Analysis of Reservoir and Farm ponds Lesson 11 See through Dam 86-93
Lesson 12 Estimation of See Flow 94-99
Lesson 13 Determination of Location of See Line 100-106
Lesson 14 Flow Net 107-112
Lesson 15 See Analysis I 113-118
Lesson 16 See Analysis II 119-124
Lesson 17 Failure and Damages I
125-127
Lesson 18 Failure and Damages II 128-132
Lesson 19 Control of See Using Drainage System 133-138
Lesson 20 Stability Analysis I 139-144
Lesson 21 Stability Analysis II 145-152
Lesson 22 Stability Analysis III 153-155
Lesson 23 Stability Analysis IV 156-159
Lesson 24 Slope Protection
160-163

Module 4: Construction of Reservoir and Farm Ponds
Lesson 25 Construction 164-176
Lesson 26 Operation and Maintenance of Water Harvesting System
177-181
Module 5: Economic Analysis of Farm Pond and Reservoir
Lesson 27 Introduction to Economic Analysis 182-186
Lesson 28 Economic Indicators
187-189 Module 6: Miscellaneous Aspects on Reservoir and Farm Pond Lesson 29 Water Quality of Harvested Water and Environmental Considerations
190-195
Lesson 30 Method to Reduce See and Evaporation Losses 196-206
Lesson 31 Runoff Inducement Methods 207-214
Lesson 32 Other Water Harvesting Structures 215-237
Farm Power
5 www.AgriMoon.Com
Module 1: Fundamentals of Reservoir and Farm Ponds
Lesson 1 Introduction to Rainwater Harvesting
1.1 Definition and Scope of Rainwater Harvesting
The present trend of agriculture is passing through a transition phase. Pressure on the most vital natural resources like land and water is increasing due to rise in population, increasing demand on food grains and urbanization. More and more marginal lands are being utilized today across the globe for crop production consequent upon the rising demand on the food grains by the growing population. Major chunk of this land is located in the arid or semi-arid regions where, the rainfall occurs irregularly and in small quantity. Much of this scarce rainwater is soon lost as surface runoff resulting in frequent agricultural droughts. Consequently, the very existence of human beings and livestock population is threatened and in some pockets the situation is observed to be seriously critical. While irrigation is assumed to be the most obvious response to drought, it has proved to be costly and can only benefit a fortunate few. Therefore, an increasing interest on a low cost alternative to conventional irrigation methods is observed in rainfed areas and this is generally referred to as „rainwater harvesting‟.
In spite of remarkable achievements in the field of science and technology, nature remains to be a mystery for human beings. Sophisticated technologies have enabled us to derive fresh water from sea water through desalinization and avert drought situations by artificial raining through cloud seeding in some parts of the developed countries. Amidst such developments, the shortage of water even for drinking purpose has stood up as a threat across the world, especially in under developed and developing countries like India.
The never ending exchange of water from the atmosphere to the oceans and back again is known as the hydrologic cycle. This cycle is the source of all forms of precipitation and thus, all water. Precipitation stored in streams, lakes and soil evaporates while the water stored in plants transpires to form clouds that store water in the atmosphere. Making the most efficient use of the scarce and precious resource has become very much imperative. It includes using appliances and plumbing fixtures to conserve rainwater without wasting and taking advantage of alternative water sources such as grey water reuse and rainwater harvesting.
Definitions
Water harvesting, in broad sense, can be defined as the 'collection of runoff for productive uses'. It also can be defined in various ways such as the process of collecting natural precipitation from catchments for beneficial use or the process of concentrating precipitation through runoff and storing it for beneficial use.
Rainwater harvesting is the process of direct collection of rainwater and the generated surface runoff out of it. The conservation of rainwater refers to storing of the collected rainwater for direct use or for recharging the ground water. Runoff may be harvested from
Farm Power
6 www.AgriMoon.Com
rooftops and land surfaces as well as from intermittent or ephemeral watercourses. Thus rainwater harvesting and conservation aims at optimum utilization of the natural resource i.e. rainwater, which is the first form of water obtained from the hydrologic cycle. Hence, it is known as the primary source of water. On the other hand, the rivers, lakes and underground reservoirs are the secondary sources of water. In present times, in absence of rainwater harvesting and conservation, we depend entirely on such secondary sources of water and in the process it is forgotten that rain is the ultimate source that feeds to these secondary sources. The value of this important primary source of water must not be lost. Rainwater harvesting and conservation mean to understand the value of rain and to make the optimum use of rainwater at the place where it falls.
Water harvesting techniques, which are used to harvest runoff from rooftops or land surfaces, fall under the term rainwater harvesting. All other systems which collect discharges from watercourses are grouped under the term floodwater harvesting.
1.2 History of Rainwater Harvesting
Various forms of water harvesting (WH) have been used traditionally through centuries. Some of them, as practiced across the Middle East in ancient agriculture, were based on techniques such as diversion of „wadi‟ flow (spate flow from normally dry watercourses) onto agricultural fields. WH systems dating back 4000 years or more have been discovered in the Negev Desert of Israel. These schemes involved the clearing of hillsides from vegetation to increase runoff, which was then directed to fields in the plains.
Floodwater farming was in practice in the desert areas of Arizona and northwest New Mexico for last 1000 years. The Hopi Indians on the Colorado Plateau were carrying out crop production in the fields situated at the mouth of ephemeral streams. These fields, where the streams fan out, are called "Akchin". Micro-catchment techniques used in southern Tunisia for growing trees were discovered in the nineteenth century by some travelers. In "Khadin" system of India, floodwater was impounded at the upstream of earthen bund sand crops were grown at the points of infiltration under residual soil moisture.
The importance of traditional, small scale systems of WH in Sub-Saharan Africa has just begun to gather recognition. Simple stone lines are used, for example, in some West African countries, notably Burkina Faso, and earth bunding systems are found in Eastern Sudan and the Central Rangelands of Somalia for water harvesting.
1.3 Need and Importance of Rainwater Harvesting
The need of rain water harvesting and conservation can be understood by the fact that the wettest place on the earth i.e. Cherrapunjee in Meghalaya state of India, which receives 12063.3 mm of average annual rainfall (1973 – 2002), suffers from acute shortage of drinking water. The reason attributed to inadequate provision of rainwater harvesting leading to quick draining of runoff down the slope along the hilly tracts. The annual rainfall over India is estimated to be 1170 mm, which is much higher than the global average of 800 mm. Moreover, 80 per cent of it occurs in about 70 rainy days during monsoon months (June – September). It makes clear that the sub-continent receives highly intensive and erratic rains in short periods. Practically, it is not possible to arrest all the rains coming in a short duration
Farm Power
7 www.AgriMoon.Com
even through some gigantic structures and thus, it leads to draining out of the runoff at a faster rate leaving little scope for recharging of ground water. Consequently, most part of the country is facing shortage of water even for domestic uses. In regions where crops are entirely rainfed, a reduction of 50% in the seasonal rainfall, for example, may result in a total crop failure. If, however, the available rain can be concentrated on a smaller area, reasonable yields will still be received. Of course in a year of severe drought there may be no runoff to collect, but an efficient water harvesting system will improve plant growth in the majority of years.
Again, the arrival as well as departure of the south-west monsoon in the country is quite uncertain. The timing of onset of monsoon rain, for example in eastern region of India, fluctuates from the last week of May to second week of July leaving the field preparations for kharif crops in a state of quandary. Further, reports reveal that at least two critical dry spells are expected to occur during the rainy season and these two events are coincidental to important field operations and crop growth stages. A dry spell during kharif season if continues for at least 10 days or more is said to be a critical dry spell. When this dry spell occurs during beusan or transplanting stage of rice, the operation is either delayed or deferred in rainfed agriculture. Both the operations are very much essential for a better harvest from rice. In case the operation is delayed, the crop production reduces drastically and when it is deferred, the crop fails. Further, when the critical dry spell coincides with the critical growth stage of the crops, which extends from flowering to grain formation in most of the crops, the crop yield is severely reduced. In order to safeguard the rainfed crops from such drought like situations, rainwater harvesting is imperative.
Apart from the risks of dry spells in kharif season, it is observed that growing of a second crop in rainfed areas following withdrawal of monsoon is a chance factor. It is because of quick depletion of soil moisture from the seeding zone due to cessation of monsoon rain. Studies reveal that successful germination of the seeds of many of the oilseed and pulse crops in winter is very much essential for getting a good yield. Adequate soil moisture in the seeding zone of the crops is required to be maintained at the time of sowing of the crops. Water balance study in the crop root-zone of rainfed areas in eastern India reveals that the soil moisture in the seeding zone remains deficient for germination in more than 60% of the years. A provision of pre-sowing irrigation would be of immense help for this purpose. Thus, lack of a source of irrigation is a major constraint for growing a second crop in rainfed areas. Further, the provision of gravity fed irrigation for these areas is an uphill task in the part of the government. It implies that the rainfed areas will remain mono-cropped along with a chance factor of good harvest in rainy season unless and otherwise the rainfall excess during the late season stage of the kharif crop is harvested. In order to make the second green revolution in the rainfed areas of eastern India successful, a second crop needs to be grown with the provision of supplemental irrigation from the conserved rainwater.
1.3.1 Benefits of Water Harvesting System
A water harvesting system offers the following benefits:
In arid and semi-arid regions, water harvesting is a guarantee of optimum crop production against vagaries of monsoon provided other production factors with

Farm Power
8 www.AgriMoon.Com
respect to soil and crop are favourable. This is especially important when no other source of water is available for irrigation.
Water harvesting system can provide water to take care of the irregularities of rainfall and supplement the soil moisture deficiency for increasing and stabilizing crop production. As the cropping risk is reduced, application of organic or inorganic fertilizers becomes economically viable resulting in increase of the potential yields.
Water harvesting can meet water needs for domestic uses and livestock consumption where public supplies are not available.
The extent of arid areas suffering from desertification increases due to want of water harvesting. The provision of water harvesting in those areas helps increase vegetative cover and consequently environmental degradation is checked. It has been also found effective in recharging the groundwater aquifers.
Generally, water harvesting is a low-external-input technology and not difficult to implement. With few exceptions, it does not require use of pumps or input of energy to convey or apply harvested water.
The implementation of water harvesting may however have a number of detrimental effects as follows:
Increase soil erosion when slopes are cleared to promote runoff
Loss of habitat of flora and fauna due to clearance of slope
Loss of habitat of flora and fauna in depressions (temporary wetlands)
Conflicts among people living upstream and downstream of watershed for the use of harvested water
Conflicts between farmers and herders in dry environment when the harvested water is used for livestock.
1.4 Components of Rainwater Harvesting
Water harvesting is the process of collecting and storing water from an area that has been treated to increase runoff generation from precipitation. Regardless of the purpose and type, all water harvesting systems have the following components (Fig. 1.1).
Catchment Area: Catchment area, watershed and drainage basin are the synonymous terminologies used in rainwater harvesting. It is the geographical area that contributes runoff, resulting from precipitation, which passes through a single point into a water harvesting unit, a large stream, a river, lake or an ocean. Therefore, it is also called as the runoff area. The catchment may be only a few hectares for small ponds or hundreds of square kilometers for large streams, rivers. After all, each catchment area is an independent hydrologic unit and any change made in its land use affects the runoff yield of the catchment.

Farm Power
9 www.AgriMoon.Com
Storage Facility: Water harvesting systems are not only for storing water to meet the crop water requirement but also for meeting the demand of households and livestock consumption. The storage facility refers to the structure where harvested runoff is held until it is used by crops, animals or people. Water may be stored on the ground for example in ponds and reservoirs, in the soil profile as moisture or recharged into the underground aquifers.
Fig. 1.1. Major components of typical water harvesting system.
(Source: Owesis et al., 2012)
Target: The target groups of a water harvesting system may be the plants, animals or human beings. They are the end users of the system. While in agriculture, the target group is comprised of plants and animals, it is the people and their needs in domestic use. Complex or large scale water harvesting systems usually have additional components for conveying and diverting runoff water to the target and/or storage facility.
Farm Power
10 www.AgriMoon.Com
Lesson 2 Hydrological Aspects of Water Harvesting
2.1 Introduction
Assessment of available water quantity and quality of an area is the prime importance in planning, designing, and operation of water resource projects. Such projects may vary in size from micro- to macro-scale, depending on water supply and demand characteristics. Water supply is harnessed from surface water and groundwater sources. Surface water is mainly available in glaciers, lakes, rivers, and reservoirs of various scales. Similarly, groundwater is available in unconfined, semi-confined, confined aquifers of different yield potentials depending on aquifer materials. Part of the precipitation is harvested in the aforementioned natural and man-made structures to meet the future water demand during deficit periods. Water demand is mainly from agricultural, industrial, and municipal sectors where agricultural demand comprises more than 80% of the total demand. With the recent industrialization and population growth in towns/cities of the country, the conflict between the aforementioned water-use sectors is of prime concern. Further discussion in this lesson is focused on surface water supply for meeting the demand in agricultural sector.
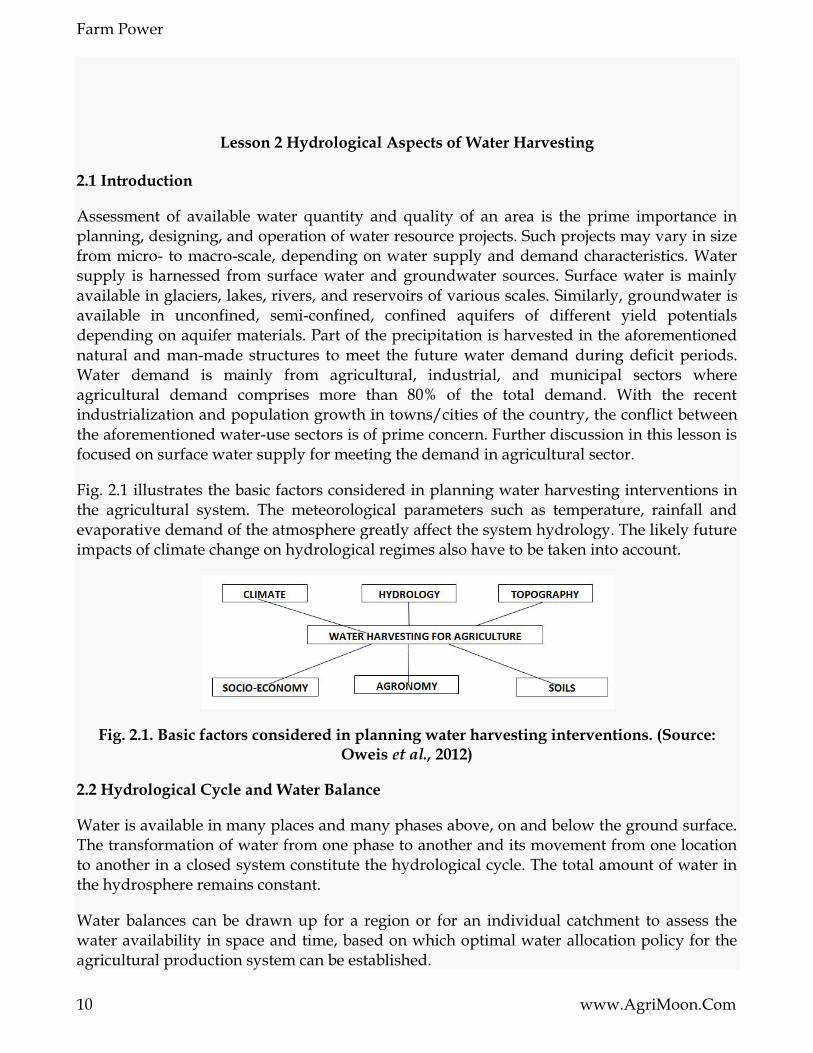
Fig. 2.1 illustrates the basic factors considered in planning water harvesting interventions in the agricultural system. The meteorological parameters such as temperature, rainfall and evaporative demand of the atmosphere greatly affect the system hydrology. The likely future impacts of climate change on hydrological regimes also have to be taken into account.
Fig. 2.1. Basic factors considered in planning water harvesting interventions. (Source: Oweis et al., 2012)
2.2 Hydrological Cycle and Water Balance
Water is available in many places and many phases above, on and below the ground surface. The transformation of water from one phase to another and its movement from one location to another in a closed system constitute the hydrological cycle. The total amount of water in the hydrosphere remains constant.
Water balances can be drawn up for a region or for an individual catchment to assess the water availability in space and time, based on which optimal water allocation policy for the agricultural production system can be established.

Farm Power
11 www.AgriMoon.Com
Fig. 2.2 shows the relationship between the various forms of water storage and water movement in a small catchment. The perceptible water in the atmosphere (Wi-W0) is transformed and falls on the ground surface as precipitation (P) and part of it will infiltrate into the soil (F), while the other part may find its way as overland flow (Q0) into the channels networks. Water is transferred from the land and plant surfaces to the atmosphere by evaporation (E) or through vegetation by means of transpiration (T).
Fig. 2.2. Small catchment-scale relationship between various forms of water and its movement. (Source: Oweiset al., 2012)
If rainfall intensity exceeds the infiltration rate of soil or if the upper most parts of the soil matrix are saturated, rainwater will be collected in puddles and then overland flow occurs on the land surface as surface runoff. A portion of runoff may infiltrate into the ground or may evaporate returning to the atmosphere.
During and following precipitation soil moisture in the unsaturated subsurface zone is replenished by the process of infiltration. Once the upper soil layers are largely saturated, water will percolate down to the deeper layers, recharging the groundwater (G). Some will also flow laterally through the soil (Qi), known as interflow, into the channel network and contributes to stream flow during dry periods. During prolonged dry periods, soil moisture may be replenished through capillary contribution (C) from shallow groundwater table. Overland flow, interflow and groundwater contribution (Qg) are all combined and modified in the channel or river network to form the runoff from the catchment.
Hydrological modeling tool in small watersheds may be used to assess the amount of water available for agricultural purposes. Irrigation water that infiltrates into the soil first enters the crop root zone. This water may return back to the atmosphere through evapotranspiration. This upper root-zone can hold a limited quantity of water, depending on the field capacity of soil (the amount of water that a soil retains after drainage under gravity). If water is added further to the zone when it is at field capacity, the water percolates down to the saturated or groundwater zone. Water leaves the ground water zone by capillary action into the root zone or by seepage into streams.

Farm Power
12 www.AgriMoon.Com
2.3 Hydrological Characteristics
The hydrological characteristics of a region are determined largely by its climate, topography, soil and geology. Key climatic factors are the depth, intensity and frequency of rainfall and the effects of temperature and humidity on evapotranspiration.
2.3.1 Evapotranspiration
Evaporation and transpiration are decisive elements in the design of a water harvesting system. Precipitation deposited on vegetation eventually evaporates and quantity of water reaching the soil surface is correspondingly less. Evaporation and transpiration are indicative of changes in the moisture level of a basin. Estimates of these factors are also used in determining water supply requirements of proposed irrigation projects. Consumptive water use is the total actual evapotranspiration from an area plus the water used directly in building plant tissue. Evapotranspiration is strongly related to the density of plant coverage and its stages of development. There are numerous approaches to estimate actual and potential evapotranspiration, including the water budget and lysimeter methods, but none of them is generally applicable for all purposes. In some hydrologic studies, mean basin evapotranspiration is required while in other cases we are interested to know dynamics of water needs of a particular crop cover.
2.3.2 Precipitation
Precipitation results from condensation of moisture in the atmosphere. The term denotes all forms of water that reach the earth from the atmosphere. The usual forms are rainfall, snowfall, hail, frost and dew. Of all these, only the first two contribute significant amount of water. Rainfall is the predominant form of precipitation causing stream flow. The following are key terms used for rainfall analysis.
Rainfall intensity is the quantity of rain falling in a given time over an area and can be expressed in terms of cm/h or mm/h
Rainfall duration is the time during which a rainfall event takes place.
Frequency of a rainfall is the frequency with which a given amount of rain occurs over a given period, for example, once in four year or once in six year, etc.
Magnitude of rainfall is the total amount of rain falling at a point over a given period of time, i.e. daily, monthly, annually.
2.3.3 Frequency Analysis and Design Rainfall
Frequency analysis can be used to estimate the frequency of occurrence of past events, on the probability of occurrence of future events. Rainfall is a continuous random variable, varying with time (stochastic variable) and can take any value greater than or equal to zero. Exceedance probability is the probability that the rainfall will be greater than or equal to a given value. For example, if the exceedance probability of 300 mm annual rainfall for a given location is 20%, one can expect that on an average the occurrence of annual rainfall equal or exceeds 300mm is one in five years.
Farm Power
13 www.AgriMoon.Com
The return period or recurrence interval is the average time between occurrences of an event with a certain magnitude or greater. The return period T is related to exceedance probability, Peas follows;
Pe=1/T (2.1)
Thus, for example, if the exceedance probability of a 250 mm annual rainfall for an area is 67%, the annual rainfall may equal or exceed 250 mm twice in a three year period.
For water harvesting purposes, frequency analysis is usually performed for annual and monthly rainfall data. Frequency analysis is made by plotting rainfall amounts against their cumulative probability, Pc. The relationship between Pe and Pc is:
Pe =1- Pc (2.2)
For example, the Pe of zero annual rainfall in any location is 100%, therefore, Pc=0.
Plotting rainfall against Pe or Pc can be done in various ways. For water harvesting, it is sufficient to use the Weibull plotting position formula, because the required design value for rainfall lies within the range of the data. The Weibull formula is:
Pe= m/(N+1) (2.3)
Where, m = rank of the event, m=1 for the largest value, and N = number of rainfall events or sample size.
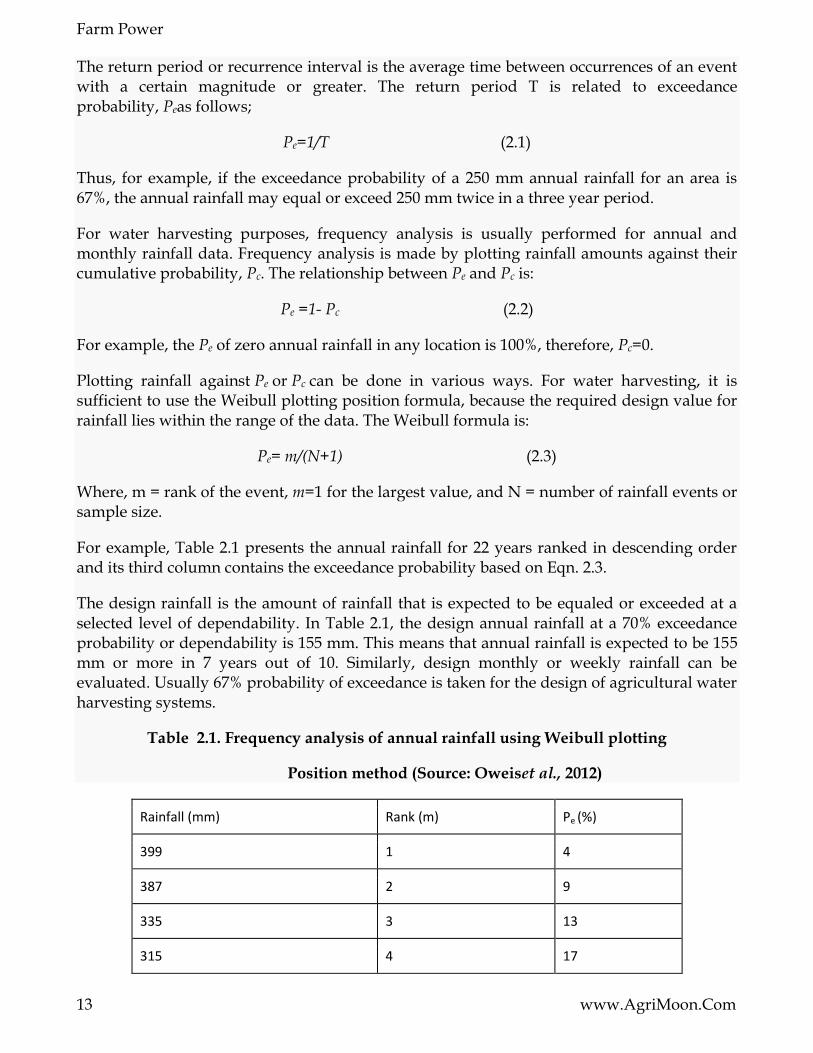
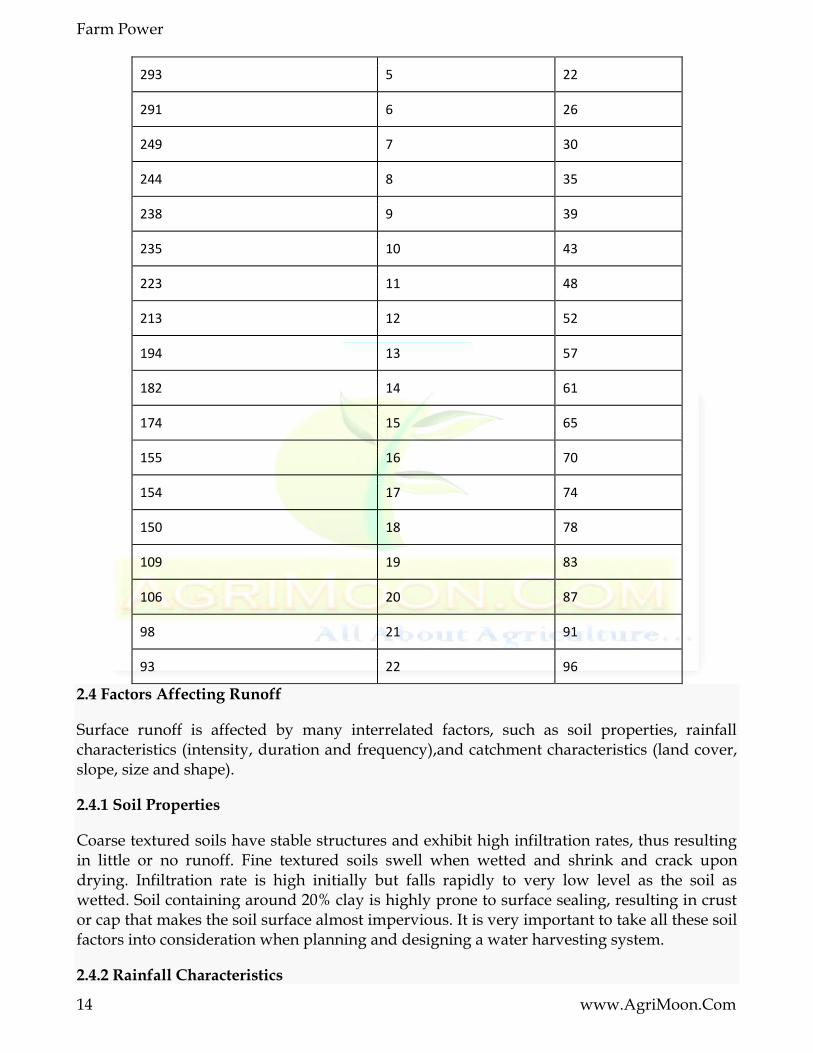
For example, Table 2.1 presents the annual rainfall for 22 years ranked in descending order and its third column contains the exceedance probability based on Eqn. 2.3.
The design rainfall is the amount of rainfall that is expected to be equaled or exceeded at a selected level of dependability. In Table 2.1, the design annual rainfall at a 70% exceedance probability or dependability is 155 mm. This means that annual rainfall is expected to be 155 mm or more in 7 years out of 10. Similarly, design monthly or weekly rainfall can be evaluated. Usually 67% probability of exceedance is taken for the design of agricultural water harvesting systems.
Table 2.1. Frequency analysis of annual rainfall using Weibull plotting
Position method (Source: Oweiset al., 2012)
Rainfall (mm) Rank (m) Pe (%)
399 1 4
387 2 9
335 3 13
315 4 17
Farm Power
14 www.AgriMoon.Com
293 5 22
291 6 26
249 7 30
244 8 35
238 9 39
235 10 43
223 11 48
213 12 52
194 13 57
182 14 61
174 15 65
155 16 70
154 17 74
150 18 78
109 19 83
106 20 87
98 21 91
93 22 96
2.4 Factors Affecting Runoff
Surface runoff is affected by many interrelated factors, such as soil properties, rainfall characteristics (intensity, duration and frequency),and catchment characteristics (land cover, slope, size and shape).
2.4.1 Soil Properties
Coarse textured soils have stable structures and exhibit high infiltration rates, thus resulting in little or no runoff. Fine textured soils swell when wetted and shrink and crack upon drying. Infiltration rate is high initially but falls rapidly to very low level as the soil as wetted. Soil containing around 20% clay is highly prone to surface sealing, resulting in crust or cap that makes the soil surface almost impervious. It is very important to take all these soil factors into consideration when planning and designing a water harvesting system.
2.4.2 Rainfall Characteristics
Farm Power
15 www.AgriMoon.Com
Intensity, duration and frequency are the most important characteristics of rainfall for water harvesting. In general, in India the runoff producing storms are usually of high intensity and short duration. The kinetic energy of falling drops is proportional to rainfall intensity. High intensity rainfall breaks down soil aggregates at the soil surface, filling pores with fine particles. As a result, soil surface sealing develops which reduces infiltration and induces runoff. Therefore, runoff coefficients from intense short-duration rainstorms are usually greater than those from less intense rainstorms having the same depth of rainfall.
2.4.3 Catchment Characteristics
Surface roughness and vegetation impede overland flow and increase surface storage capacity. Vegetative cover also protects the soil surface against erosion and from the destructive impact of falling raindrops. This reduces the development of crusting and soil surface sealing and hence reduces runoff.
Generally, surface runoff increases with the rise in land slope angle. This is mainly because less water is retained on the soil surface and it flows more quickly towards the outlet with minimum loss by evaporation and infiltration in the catchment. Ground relief may take all kinds of shapes and sizes which affects the runoff generation.
The runoff coefficient generally decreases with the increase in catchment size and/or slope length. In water harvesting system, rainfall induces surface runoff in preferably bare, crusted and smooth land surfaces. At the lower end of the slope, runoff water is collected in shallow depressions, which also receive direct rainfall.
For macro-catchment, the rainfall-runoff process is extremely complex due to the large spatial variations in soil type, topography, and use and land cover conditions over the vast area of the runoff producing catchment. Therefore, it is important to monitor the response of the macro-catchment to major rainstorm events by measuring the runoff at carefully selected gauging stations along the flow path of runoff.
While the rainfall is infiltrating and runoff is being collected in the target area, some water will evaporate from the open water surface, but the major portion infiltrates and is stored in the root zone.
2.5 Runoff Models Suitable for Water Harvesting
Rainfall-runoff models aim to describe surface runoff as a function of rainfall. Model parameters are calibrated to a specific location and field conditions. Here, various methods are presented to establish the relationship between rainfall and runoff for micro- and macro-catchments.
2.5.1 Micro-Catchment
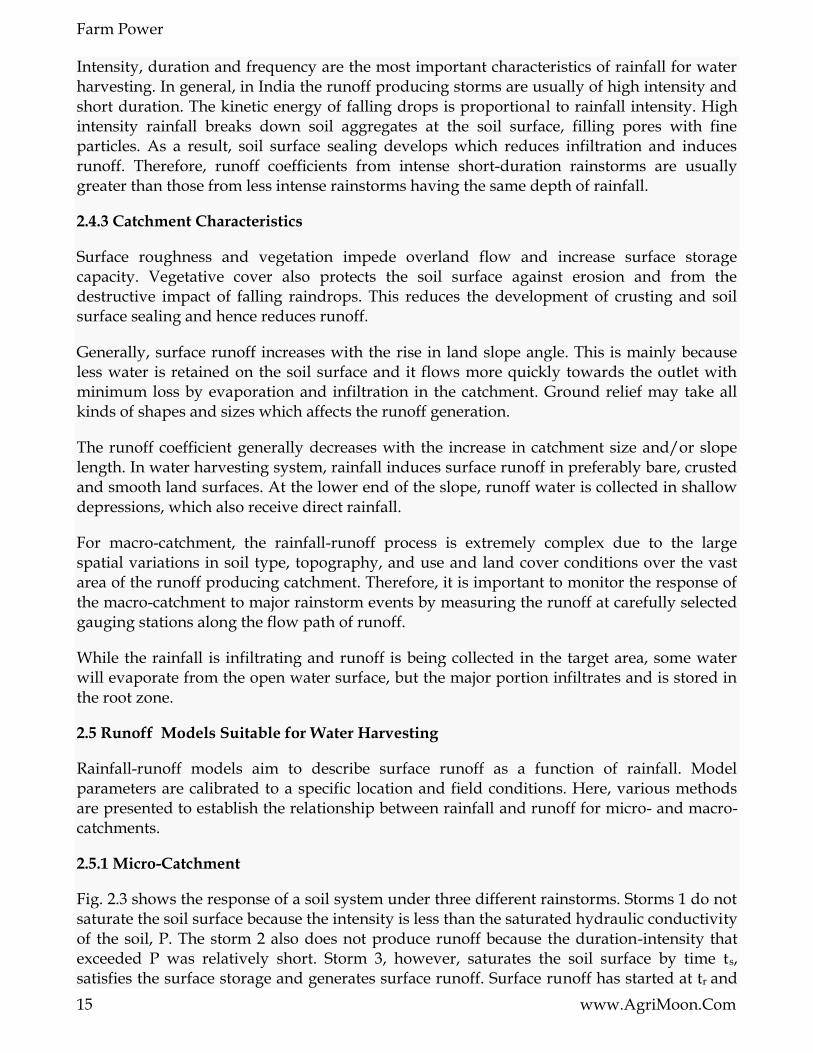
Fig. 2.3 shows the response of a soil system under three different rainstorms. Storms 1 do not saturate the soil surface because the intensity is less than the saturated hydraulic conductivity of the soil, P. The storm 2 also does not produce runoff because the duration-intensity that exceeded P was relatively short. Storm 3, however, saturates the soil surface by time ts, satisfies the surface storage and generates surface runoff. Surface runoff has started at tr and
Farm Power
16 www.AgriMoon.Com
ended at te (Fig. 2.3). A curve for cumulative runoff is also shown. Between ts and tr, the surface storage capacity (SSC) has been filled.
Fig. 2.3. Micro-catchment response under three different rainstorms.
(Source: Oweiset al., 2012)
Threshold rain (TR) is defined as the total rainfall depth measured from the onset of the rainstorm until the start of surface runoff flow. TR is calculated using the following equation;
Where, ts= time at which the soil surface becomes saturated, tr = time at which runoff starts, R(t)= rainfall intensity rate, function of time t, I(t)=water infiltration rate, function time t, and SSC= surface storage capacity.
Fig. 2.4 shows one way to partition the rainwater in a micro-catchment into many components, based on a steady (constant intensity, R) rainstorm of duration T. Components 1,2 and 3 are, respectively, the first, second, and third terms in the right hand site of Eqn. 2.4. Component 4 represents the amount of excess rainwater at any point in the micro-catchment. Component 5 represent infiltration, during rain, between tr and T. Since the distance traveled by runoff in the micro-catchment of water harvesting is small and thus negligible, no allowance is made for routing surface runoff flow. Therefore, excess rainwater at all points in the micro-catchment is summed and taken as the generated runoff. Component 3 represents surface storage, which will eventually infiltrate into the soil when the rain ceases or when the rain intensity becomes less than the infiltration capacity of the soil. Therefore, infiltration plays the major role in determining the amount of surface runoff.
There are many models (empirical, physical and numerical) to describe the behavior of the system. However, factors affecting this system and its outcome, particularly antecedent soil moisture content, soil cover and soil structure, are continuously changing during the growing season. Very few data on rainfall intensity and duration are available especially in dry areas.

Farm Power
17 www.AgriMoon.Com
Furthermore, it is extremely difficult, if not impossible, to predict the intensity and duration of future rainstorms. Therefore, the only rational way to estimate surface runoff for water harvesting purposes is based on the depth of rainfall (daily, monthly or yearly).
Fig. 2.4. Component of partitioning a steady intensity rainstorm of duration T for water harvesting purposes. (Source: Oweis et al., 2012)
Threshold rain is the sum of components 1, 2 and 3; component 3 and 4 (above the curve) are the surface storage and surface runoff, respectively; and component 5 is the infiltration amount between tr and T and P is the saturated hydraulic conductivity of the soil.
The runoff coefficient is defined as the ratio of the amount of runoff to the amount of rainfall. For a single storm, the runoff coefficient (RC) can be expressed as (Fig. 2.4):
RC= component 4/rainstorm depth (2.5)
The rainstorm depth can be expressed as:
Rainstorm depth=TR+ Component 4+ Component 5 (2.6)
Equations 2.5 and 2.6 are combined and rearranged as:
RC=1-[(TR+ Component5)/rainstorm depth] (2.7)
By selecting a reasonable value for TR and assuming component 5 is very small (»zero), one can get a maximum limiting value for RC in a given area. For example, if the depth of the rainstorm in Fig. 2.4 is 10 mm and TR is taken as 4 mm, then the maximum value for RC is 0.60.
Daily rainfall represents the sum of all rainstorms during the 24 hours of the day. However, for the purposes of the present analysis, the rainstorm depth in Eqns. (2.5) and (2.7) will be taken as the daily rainfall.
In small catchments, most of runoff is in the form of sheet flow, and hence runoff plots under controlled conditions may be used to measure runoff under rainfall of differing intensities.
Farm Power
18 www.AgriMoon.Com
The plot must be representative for the area to be developed for water harvesting. It is advisable to experiment on plots of various sizes (slope length and slope angles).
Overestimation of RC may result in reduced crop yields or crop failure due to water shortages. Underestimation of RC results in setting aside more land than necessary as catchment areas and endangering the safety of the water harvesting system structures. The effect of excess or deficit moisture condition varies according to the crop. Millet, for example, can tolerate drought but not waterlogging but maize does not tolerate either.
2.5.2 Macro-Catchment
Methods suitable for estimation of runoff in macro-catchments include the unit hydrograph, the soil conservation Service (SCS) curve number, and the rainfall excess model. The first two methods are relatively simple, standard, well document and can be found in most of the textbooks on hydrology and water resources systems engineering. The third method is not well known as it is more complex. A brief description of the first two methods is given below.
Unit Hydrograph Method
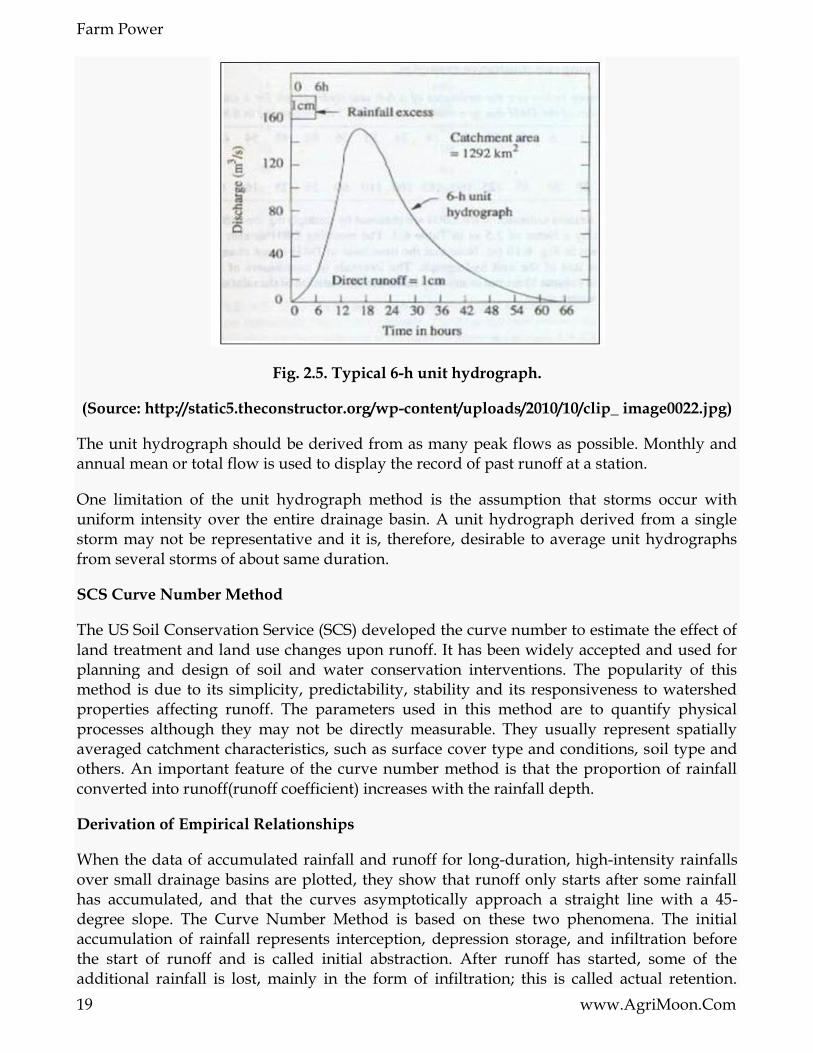
The unit hydrograph method is still frequently used to determine runoff, despite many limiting factors. A hydrograph is a graph of discharge passing through a particular point on a stream, plotted as a function of time. A unit hydrograph is a graph of the direct runoff of 1 mm of effective rainfall distributed uniformly over the basin area (catchment) at a uniform rate during a storm, of particular duration. Figure 2.5 shows a typical 6-hour unit hydrograph. The unit hydrograph is assumed to be representative of the runoff process for a watershed. The method is based on following three postulates:
Constant duration of flow for a given drainage basin; the duration of flow depends on the duration of rainfall and not on its intensity.
Linearity for rain of equal duration but of different intensity; runoff is proportional to the rainfall intensity.
Runoff caused by several periods of rainfall can be superimposed.
Farm Power
19 www.AgriMoon.Com
Fig. 2.5. Typical 6-h unit hydrograph.
(Source: http://static5.theconstructor.org/wp-content/uploads/2010/10/clip_ image0022.jpg)
The unit hydrograph should be derived from as many peak flows as possible. Monthly and annual mean or total flow is used to display the record of past runoff at a station.
One limitation of the unit hydrograph method is the assumption that storms occur with uniform intensity over the entire drainage basin. A unit hydrograph derived from a single storm may not be representative and it is, therefore, desirable to average unit hydrographs from several storms of about same duration.
SCS Curve Number Method
The US Soil Conservation Service (SCS) developed the curve number to estimate the effect of land treatment and land use changes upon runoff. It has been widely accepted and used for planning and design of soil and water conservation interventions. The popularity of this method is due to its simplicity, predictability, stability and its responsiveness to watershed properties affecting runoff. The parameters used in this method are to quantify physical processes although they may not be directly measurable. They usually represent spatially averaged catchment characteristics, such as surface cover type and conditions, soil type and others. An important feature of the curve number method is that the proportion of rainfall converted into runoff(runoff coefficient) increases with the rainfall depth.
Derivation of Empirical Relationships
When the data of accumulated rainfall and runoff for long-duration, high-intensity rainfalls over small drainage basins are plotted, they show that runoff only starts after some rainfall has accumulated, and that the curves asymptotically approach a straight line with a 45-degree slope. The Curve Number Method is based on these two phenomena. The initial accumulation of rainfall represents interception, depression storage, and infiltration before the start of runoff and is called initial abstraction. After runoff has started, some of the additional rainfall is lost, mainly in the form of infiltration; this is called actual retention.
Farm Power
20 www.AgriMoon.Com
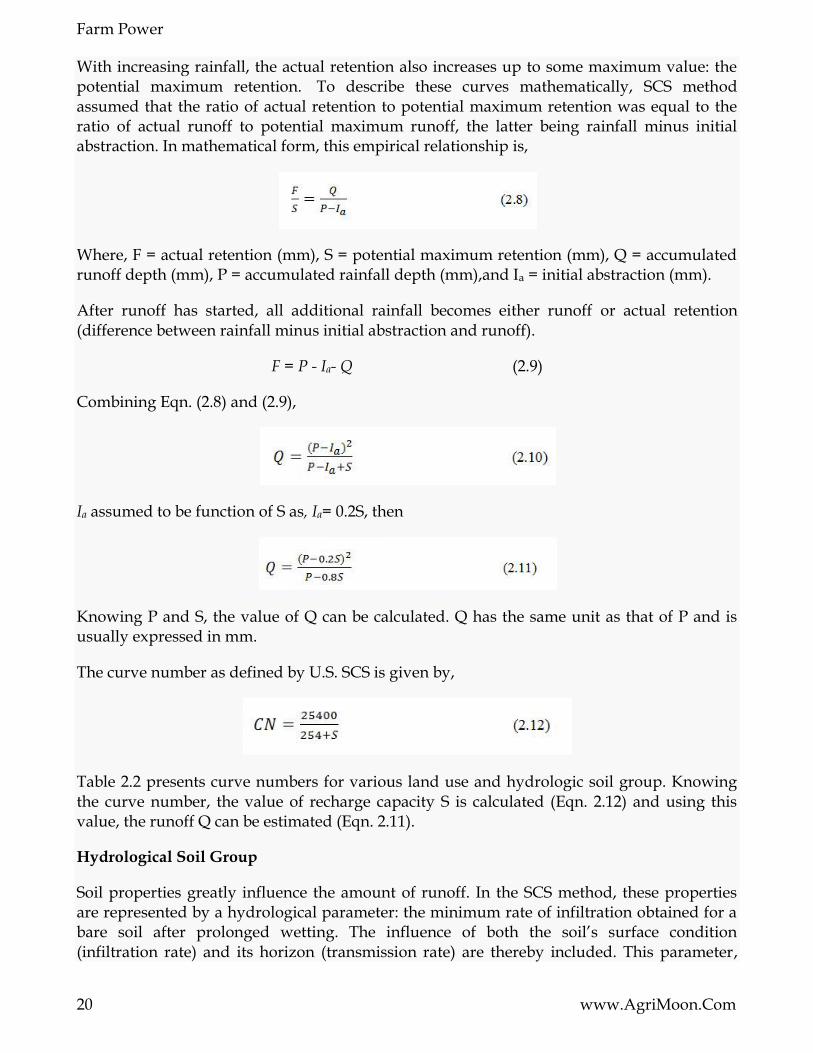
With increasing rainfall, the actual retention also increases up to some maximum value: the potential maximum retention. To describe these curves mathematically, SCS method assumed that the ratio of actual retention to potential maximum retention was equal to the ratio of actual runoff to potential maximum runoff, the latter being rainfall minus initial abstraction. In mathematical form, this empirical relationship is,
Where, F = actual retention (mm), S = potential maximum retention (mm), Q = accumulated runoff depth (mm), P = accumulated rainfall depth (mm),and Ia = initial abstraction (mm).
After runoff has started, all additional rainfall becomes either runoff or actual retention (difference between rainfall minus initial abstraction and runoff).
F = P - Ia- Q (2.9)
Combining Eqn. (2.8) and (2.9),
Ia assumed to be function of S as, Ia= 0.2S, then
Knowing P and S, the value of Q can be calculated. Q has the same unit as that of P and is usually expressed in mm.
The curve number as defined by U.S. SCS is given by,
Table 2.2 presents curve numbers for various land use and hydrologic soil group. Knowing the curve number, the value of recharge capacity S is calculated (Eqn. 2.12) and using this value, the runoff Q can be estimated (Eqn. 2.11).
Hydrological Soil Group
Soil properties greatly influence the amount of runoff. In the SCS method, these properties are represented by a hydrological parameter: the minimum rate of infiltration obtained for a bare soil after prolonged wetting. The influence of both the soil‟s surface condition (infiltration rate) and its horizon (transmission rate) are thereby included. This parameter,
Farm Power
21 www.AgriMoon.Com
which indicates a soil‟s runoff potential, is the qualitative basis of the classification of all soils into four groups. The Hydrological Soil Groups, as defined by the SCS soil scientists, are:
Group A: Soils having high infiltration rates even when thoroughly wetted and a high rate of water transmission. Examples are: deep, well to excessively drained sands or gravels.
Group B: Soils having moderate infiltration rates when thoroughly wetted and a moderate rate of water transmission. Examples are: moderately deep to deep, moderately well to well drained soils with moderately fine to moderately coarse textures.
Group C: Soils having low infiltration rates when thoroughly wetted and a low rate of water transmission. Examples are: soils with a layer that impedes the downward movement of water or soils of moderately fine to fine texture.
Group D: Soils having very low infiltration rates when thoroughly wetted and a very low rate of water transmission. Examples are: clay soils with a high swelling potential, soils with a permanently high water table, soils with a clay pan or clay layer at or near the surface, or shallow soils over nearly impervious material.
Antecedent Moisture Condition
The soil moisture condition in the drainage basin before runoff occurs is another important factor influencing the final CN value. In the Curve Number Method, the soil moisture condition is classified in three Antecedent Moisture Condition (AMC) classes:
AMC I: The soils in the drainage basin are practically dry (i.e. the soil moisture content is at wilting point).
AMC II: Average condition.
AMC III: The soils in the drainage basins are practically saturated from antecedent rainfalls (soil moisture content is at field capacity).
These classes are based on 5-day antecedent rainfall (i.e. the accumulated total rainfall preceding the runoff under consideration). In the original SCS method, a distinction was made between the dormant and the growing season to allow for differences in evapotranspiration.
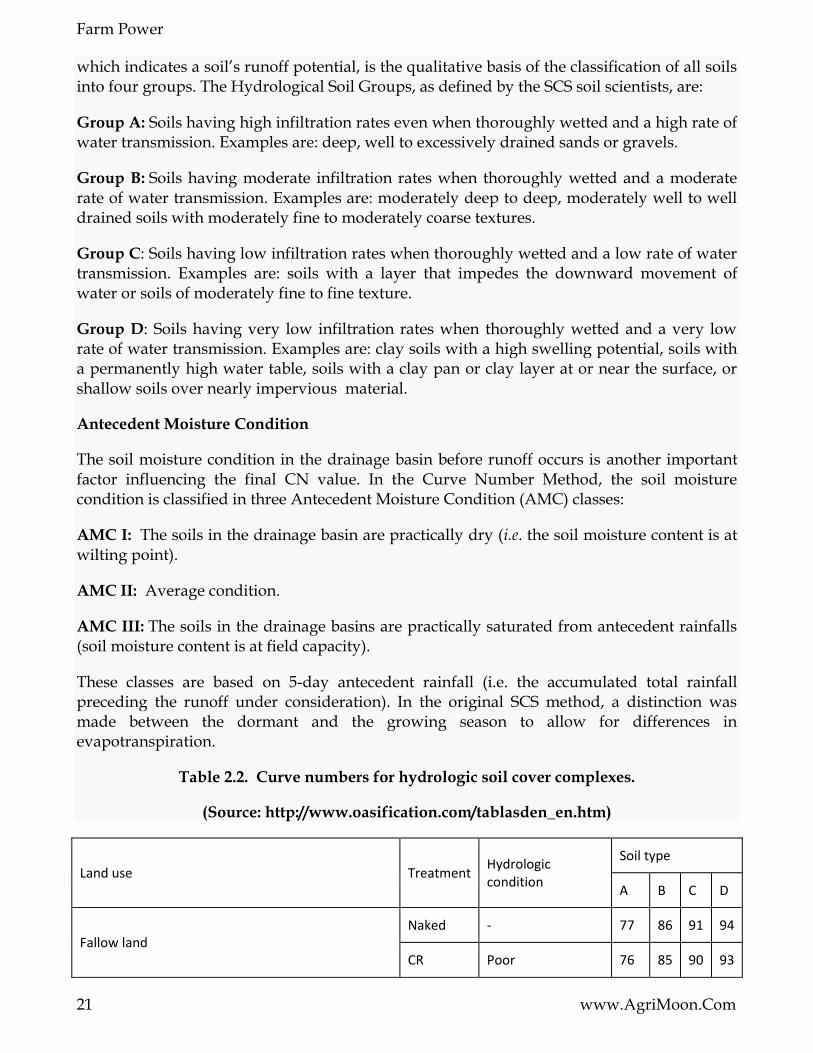
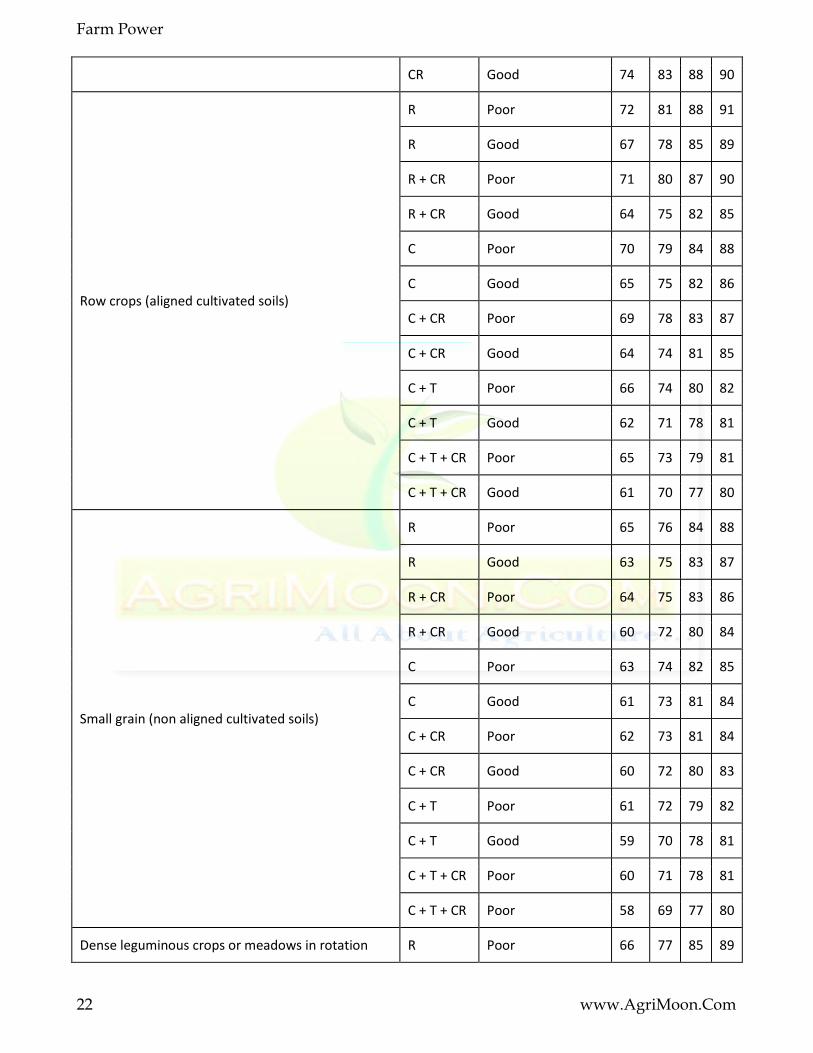
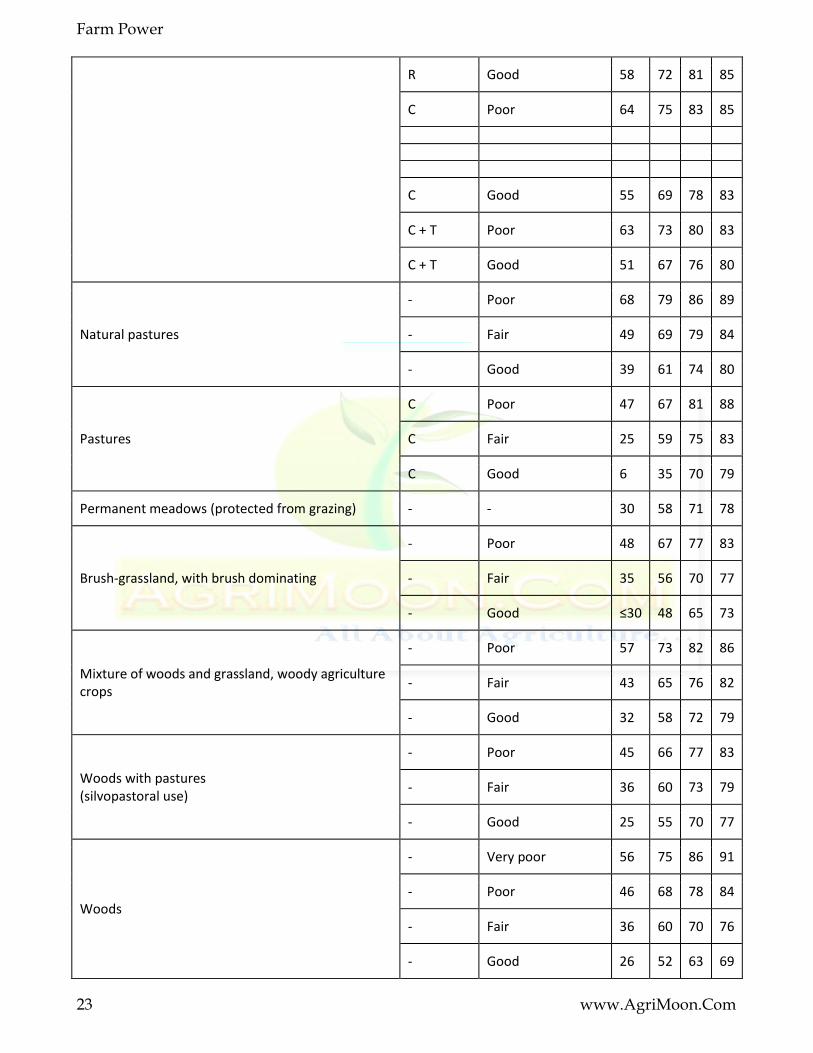
Table 2.2. Curve numbers for hydrologic soil cover complexes.
(Source: http://www.oasification.com/tablasden_en.htm)
Land use Treatment Hydrologic condition
Soil type
A B C D
Fallow land Naked - 77 86 91 94
CR Poor 76 85 90 93
Farm Power
22 www.AgriMoon.Com
CR Good 74 83 88 90
Row crops (aligned cultivated soils)
R Poor 72 81 88 91
R Good 67 78 85 89
R + CR Poor 71 80 87 90
R + CR Good 64 75 82 85
C Poor 70 79 84 88
C Good 65 75 82 86
C + CR Poor 69 78 83 87
C + CR Good 64 74 81 85
C + T Poor 66 74 80 82
C + T Good 62 71 78 81
C + T + CR Poor 65 73 79 81
C + T + CR Good 61 70 77 80
Small grain (non aligned cultivated soils)
R Poor 65 76 84 88
R Good 63 75 83 87
R + CR Poor 64 75 83 86
R + CR Good 60 72 80 84
C Poor 63 74 82 85
C Good 61 73 81 84
C + CR Poor 62 73 81 84
C + CR Good 60 72 80 83
C + T Poor 61 72 79 82
C + T Good 59 70 78 81
C + T + CR Poor 60 71 78 81
C + T + CR Poor 58 69 77 80
Dense leguminous crops or meadows in rotation R Poor 66 77 85 89
Farm Power
23 www.AgriMoon.Com
R Good 58 72 81 85
C Poor 64 75 83 85
C Good 55 69 78 83
C + T Poor 63 73 80 83
C + T Good 51 67 76 80
Natural pastures
- Poor 68 79 86 89
- Fair 49 69 79 84
- Good 39 61 74 80
Pastures
C Poor 47 67 81 88
C Fair 25 59 75 83
C Good 6 35 70 79
Permanent meadows (protected from grazing) - - 30 58 71 78
Brush-grassland, with brush dominating
- Poor 48 67 77 83
- Fair 35 56 70 77
- Good ≤30 48 65 73
Mixture of woods and grassland, woody agriculture crops
- Poor 57 73 82 86
- Fair 43 65 76 82
- Good 32 58 72 79
Woods with pastures (silvopastoral use)
- Poor 45 66 77 83
- Fair 36 60 73 79
- Good 25 55 70 77
Woods
- Very poor 56 75 86 91
- Poor 46 68 78 84
- Fair 36 60 70 76
- Good 26 52 63 69

Farm Power
24 www.AgriMoon.Com
- Very good 15 44 54 61
Country houses - - 59 74 82 86
Gravel roads - - 72 82 87 89
Asphalt roads - - 74 84 90 92
Abbreviations meaning: CR=with vegetal residue cover that extends for at least 5% of the soil surface all over the year; R=when soil labours (ploughing, sowing, etc.) are made in straight line, without considering the slope; C=when cultivation is made according to contour lines; and T=in terraces cultivations (open terraces with drainage for soil conservation)
Farm Power
25 www.AgriMoon.Com
Lesson 3 Identification of Areas Suitable for Water Harvesting
3.1 Introduction
Rainwater harvesting is the collection of surface runoff mainly for agricultural and domestic purposes. The identification of potential sites for rainwater harvesting (RWH) is an important step towards maximizing water availability and land productivity in rain fed areas. The traditional fragmented approach of identification of potential sites for RWH is no longer viable and a more holistic approach to water management is essential. Development of methodology for identifying potential sites for RWH is an important step towards identifying areas suitable for certain techniques of water harvesting.
3.2 Parameters for Identifying Suitable Areas
Parameters to be considered for identifying areas suitable for water harvesting include:
Climatic parameters of the region, especially rainfall
Hydrology and alternative water resources
Topography of the region
Type of vegetation and agricultural production/forestry activities
Soil types of the region including soil depth and fertility status
Socio-economic conditions of the community
National laws and regulations
Infrastructural facilities available or planned for the area
3.2.1Rainfall Characteristics
The availability of rainfall data collected over years is crucial for the determination of the rainfall-runoff potential of a region. This is particularly true in arid and semi arid regions, where rainfall varies considerably from year to year. However average rainfall can still be used in areas with insufficient rainfall data. Future changes in rainfall pattern expected due to global climate change are also to be taken into consideration.
Rainfall can be measured on site using non recording / recording rainfall gauges to record single rainfall events or the daily total rainfall in the project area. However such data should be used with caution especially when extrapolating the findings to adjacent areas. The elevation of rain gauges from the ground level also affects the amount of rainfall measured. To avoid such discrepancies, the rain gauges should be placed at the same height throughout the project area.
Farm Power
26 www.AgriMoon.Com
Threshold rain is the depth of rainfall that must fall before runoff starts. It is used in some rainfall-runoff models as an initial value of runoff. Sufficient allowance must be given for the variation of the rainfall in time and space. Apart from the threshold rain that varies with rainfall intensity, the soil type, degree of slope, vegetation cover and antecedent soil moisture condition are other important parameters to be taken into consideration for accurate rainfall measurement.
The intensity of the rainfall is a good indicator of whether a particular rainfall event is likely to produce runoff or not. Of course, determination of the threshold intensity of rainfall that triggers runoff is more difficult to be determined than ascertaining the threshold rainfall depth. Rainfall intensity should also be determined as it is required for rainfall - runoff models. Recording rain gauges can be used for its determination. Rainfall duration can also be determined reliably using a recording rain gauge. This is also an important factor as it is often related to peak discharge in simulation models.
Once these data have been acquired, the most important rainfall parameters to be determined are:
The relationship between the storm intensity and its duration; and
The number of storms per year, including their mean standard deviation and probability distribution.
These parameters will then be used to calculate the volume of water available for cropping, possibly by generating synthetic rainfall events for deterministic calculation of runoff quantities.
The temperature regime, air humidity and wind conditions during the cropping period are the other climatic factors which have to be taken into consideration when selecting a certain area for water harvesting.
3.2.2 Hydrology and Water Resources
The hydrological processes relevant to water harvesting practices are those involved in the production, flow, and storage of runoff from rainfall within a particular catchment area. The intricacies of this phenomenon cannot be explained in detail here, but an overview is presented.
Rainfall received in a particular catchment area can be divided into two major components such as the effective rainfall (direct runoff) for water harvesting and the losses. The sources of the losses are:
Evaporation from the ground
Water infiltration in the catchment
Depression storage in the catchment
Water intercepted by leaves of the plants
Farm Power
27 www.AgriMoon.Com
In arid and semi-arid areas, extreme fluctuations in both annual rainfall and its distribution during rainy season are considered as the major constraints to agricultural production. In most cases rainfall shows no regular pattern; the wet periods are often followed by marked dry periods. Modeling the rainfall - runoff process in hydrological analysis of an area is very complicated and the model designer must choose the most appropriate model from the existing models or develop one to suit the area under consideration. The lack of meteorological data, suitable topographic maps etc. often creates complications limiting strongly the usefulness of models.
The availability of sufficient runoff from the target area that can be stored to meet the water requirement of the selected crops during the dry periods in between two rainfall events is a good indication of the suitability of the area for water harvesting.
Another factor to be taken into consideration is the availability of other water sources e.g. shallow ground water in wadi beds and renewable ground water from deeper aquifers. These water sources can either substitute runoff water during drought periods or extend the cropping period beyond the rainy season.
3.2.3 Vegetation and Land Use
Vegetation strongly affects the surface runoff. An increase in the vegetative density results in a corresponding increase in losses due to interception, retention, and infiltration, which consequently decreases the volume of runoff. The density of vegetation on a given area can be determined in a variety of ways, but remote sensing is the most advanced and accurate method for large project areas subject to availability of funds. Reflectance of the soil and the vegetation is the indicator of the density of the vegetation in remote sensing.
Land use pattern affects the suitability of land for water harvesting in various ways. Introducing micro-catchment harvesting in areas already under cropping is much easier than transferring farmers into potentially suitable areas. On the other hand, farming activities in catchment areas such as primary and secondary tillage operations reduce the runoff yield significantly due to increase in the infiltration rates. On the contrary, overgrazing removes the vegetation cover which results in higher runoff volumes from the catchment. However, overgrazing entails in most cases a higher soil erosion risk with negative impacts on the water harvesting potential of the region.
3.2.4 Topography, Soil Type and Soil Depth
The suitability of an area for water harvesting depends strongly on its topography and soil characteristics, namely:
The slope of a terrain which is a decisive factor for any type of water harvesting
Surface structure which influences the rainfall runoff process
Infiltration and percolation rates, which determine the movement of water into the soil and within the soil matrix

Farm Power
28 www.AgriMoon.Com
Soil depth which together with the soil texture determines the quantity of water that can be stored in the soil.
The topography has a strong impact on infiltration volume and runoff yield. Micro-catchment systems are more appropriate for gentle slopes, whereas macro-catchment techniques can only be established in terrains having significant slope. Further information is given in Chapter 3.
The infiltration rate is the amount of water entering the soil, through its surface, over a given time. Infiltrometers and/or rainfall simulators can be used to determine the infiltration behavior of any soil. The main soil parameters affecting infiltration rate are the texture, structure, and depth of the soil. Vegetation and soil fauna also influence the infiltration rate. Dense vegetation absorbs the kinetic energy of the falling raindrops and thus, reduces the splash erosion and helps increasing the water retention followed by increasing the infiltration rate. A well developed root system after natural decay leaves tubular structures in the soil profile that helps increasing the infiltration rate. On the contrary, a bare soil is dislodged quickly due to its exposure to the direct hit of raindrops and thus, the existing soil pores in the surface are sealed resulting in decrease of infiltration rate.
Initial infiltration rates are higher in dry soils. As the rainfall continues, the infiltration rate declines gradually when the soil pores near the surface are filled up with water resulting in lowering down the hydraulic gradient, the driving force for the infiltration process. In clay-rich soils, the cracks that frequently occur in dry condition get closed as the soil becomes wet.
3.2.5 Socio-economic Condition and Infrastructure
The socioeconomic condition of the stakeholders opting for water harvesting scheme is very much important. Many projects have been abandoned soon after their implementation as a result of the negligence of this very important aspect during planning stage. Key considerations of this aspect include the farming systems of the community under consideration, the financial resources of the average farmer in the area, cultural behaviors and religious beliefs of the people, the attitude of the farmers towards the introduction of new farming methods, the farmers‟ knowledge about irrigated agriculture, land property rights, and the role of men and women in the community. The mobility of the populace may also influence the planning decisions.
As in any development project, the existing infrastructures or that will be developed in the future in the same area have to be taken into account when planning a water harvesting scheme.
3.3 Methods of Data Acquisition
3.3.1 Overview
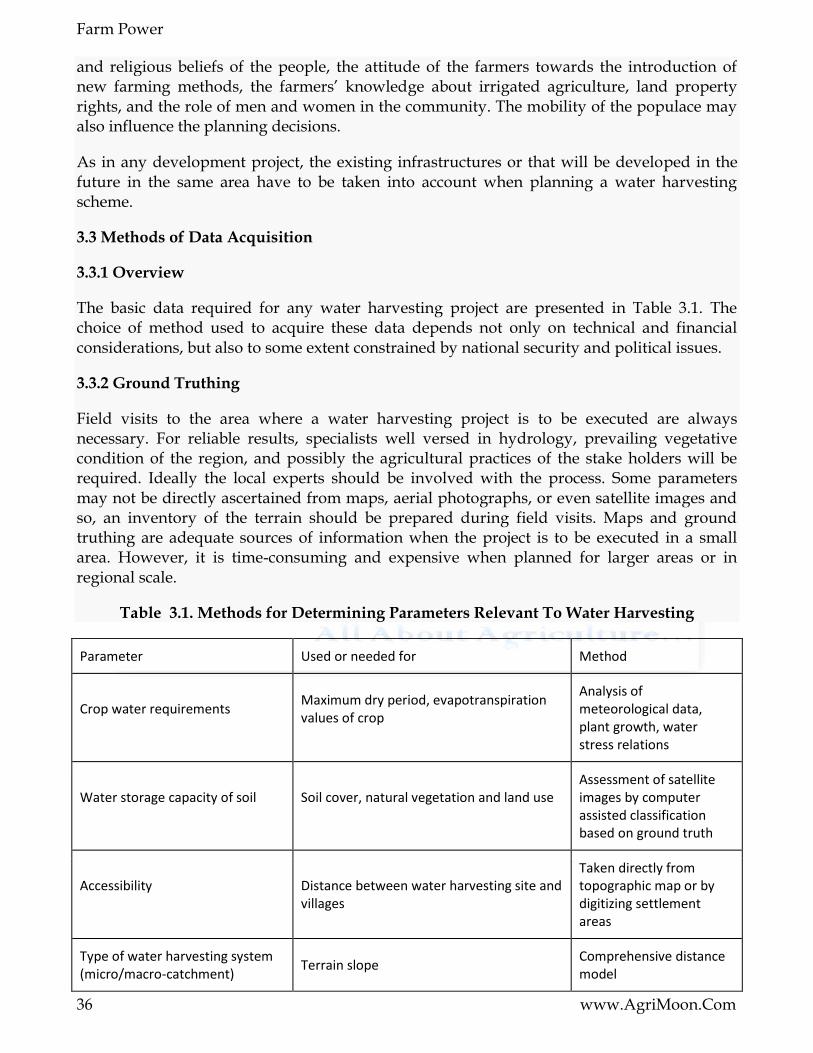
The basic data required for any water harvesting project are presented in Table 3.1. The choice of method used to acquire these data depends not only on technical and financial considerations, but also to some extent constrained by national security and political issues.
Farm Power
29 www.AgriMoon.Com
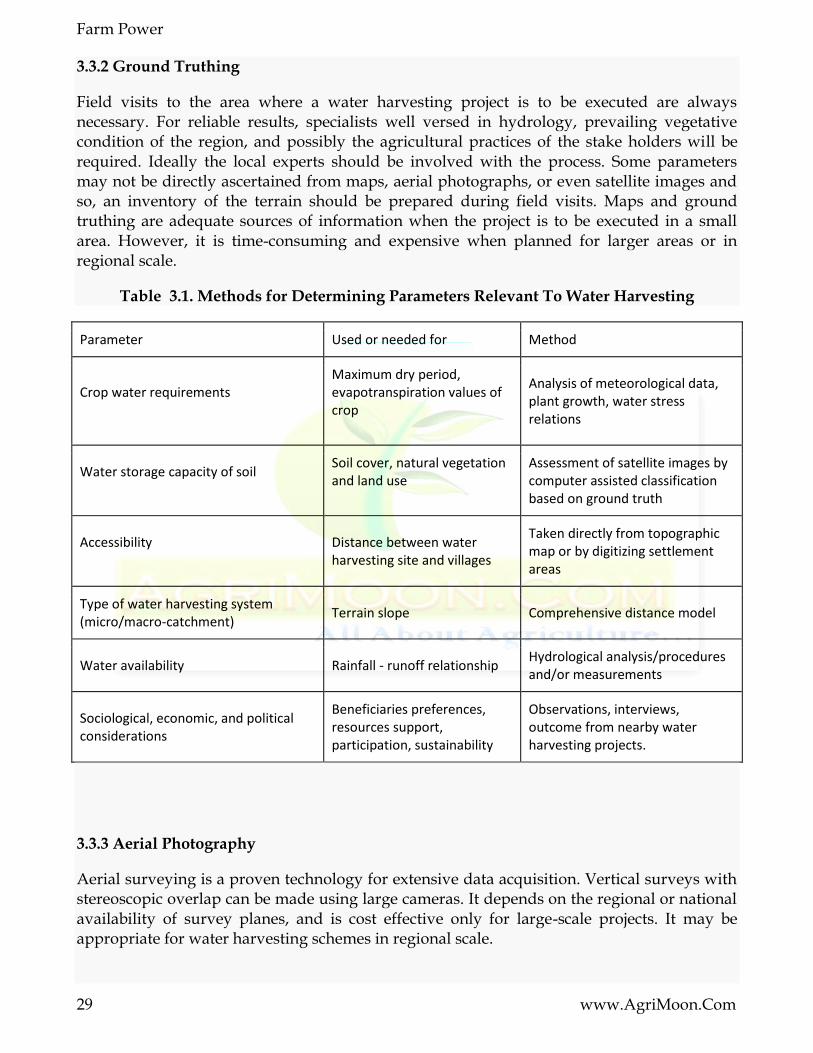
3.3.2 Ground Truthing
Field visits to the area where a water harvesting project is to be executed are always necessary. For reliable results, specialists well versed in hydrology, prevailing vegetative condition of the region, and possibly the agricultural practices of the stake holders will be required. Ideally the local experts should be involved with the process. Some parameters may not be directly ascertained from maps, aerial photographs, or even satellite images and so, an inventory of the terrain should be prepared during field visits. Maps and ground truthing are adequate sources of information when the project is to be executed in a small area. However, it is time-consuming and expensive when planned for larger areas or in regional scale.
Table 3.1. Methods for Determining Parameters Relevant To Water Harvesting
Parameter Used or needed for Method
Crop water requirements
Maximum dry period, evapotranspiration values of crop
Analysis of meteorological data, plant growth, water stress relations
Water storage capacity of soil
Soil cover, natural vegetation and land use
Assessment of satellite images by computer assisted classification based on ground truth
Accessibility
Distance between water harvesting site and villages
Taken directly from topographic map or by digitizing settlement areas
Type of water harvesting system (micro/macro-catchment)
Terrain slope Comprehensive distance model
Water availability Rainfall - runoff relationship Hydrological analysis/procedures and/or measurements
Sociological, economic, and political considerations
Beneficiaries preferences, resources support, participation, sustainability
Observations, interviews, outcome from nearby water harvesting projects.
3.3.3 Aerial Photography
Aerial surveying is a proven technology for extensive data acquisition. Vertical surveys with stereoscopic overlap can be made using large cameras. It depends on the regional or national availability of survey planes, and is cost effective only for large-scale projects. It may be appropriate for water harvesting schemes in regional scale.
Farm Power
30 www.AgriMoon.Com
3.3.4 Satellite and Remote-Sensing Technology
Satellite and remote-sensing technologies coupled with geographical information systems are the most powerful and reasonably cost-efficient tools used in assessing the potential for water harvesting.
The term remote-sensing is used to describe all the procedures employed in recording information from high altitudes above the Earth‟s surface. This can be done from an airplane or satellite. Remote sensing technology can not only be used for gathering preliminary information, but also to monitor and update data continuously at regular intervals.
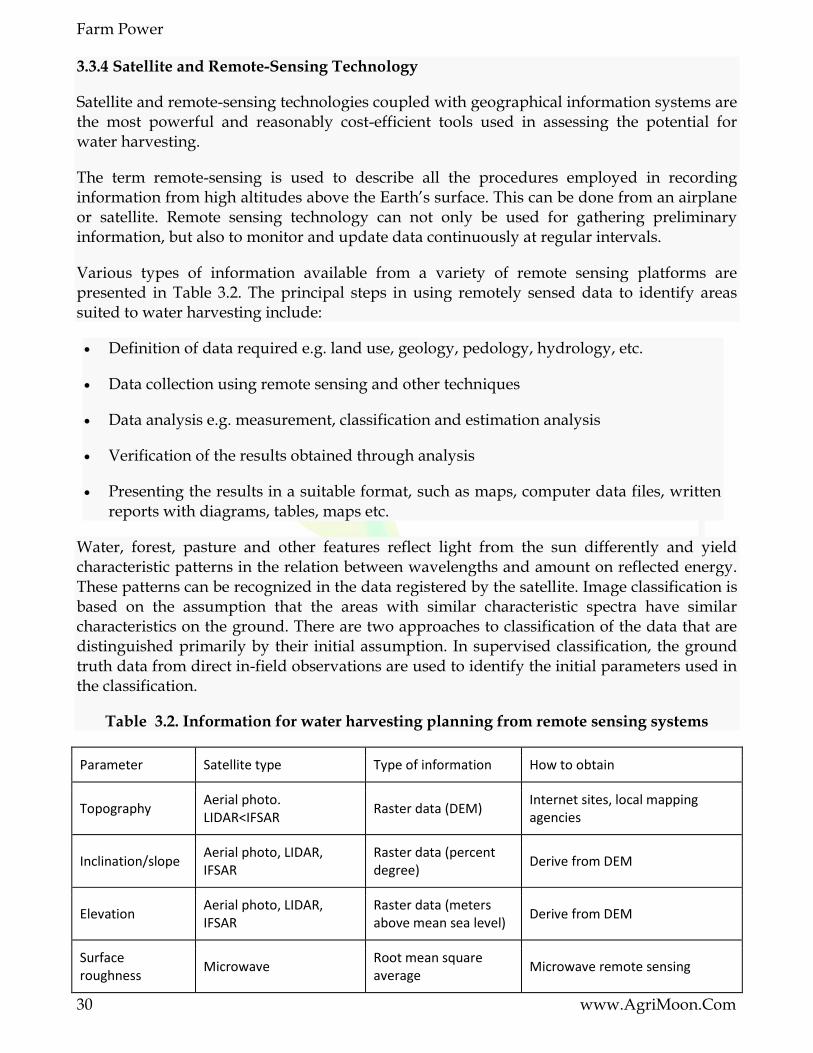
Various types of information available from a variety of remote sensing platforms are presented in Table 3.2. The principal steps in using remotely sensed data to identify areas suited to water harvesting include:
Definition of data required e.g. land use, geology, pedology, hydrology, etc.
Data collection using remote sensing and other techniques
Data analysis e.g. measurement, classification and estimation analysis
Verification of the results obtained through analysis
Presenting the results in a suitable format, such as maps, computer data files, written reports with diagrams, tables, maps etc.
Water, forest, pasture and other features reflect light from the sun differently and yield characteristic patterns in the relation between wavelengths and amount on reflected energy. These patterns can be recognized in the data registered by the satellite. Image classification is based on the assumption that the areas with similar characteristic spectra have similar characteristics on the ground. There are two approaches to classification of the data that are distinguished primarily by their initial assumption. In supervised classification, the ground truth data from direct in-field observations are used to identify the initial parameters used in the classification.
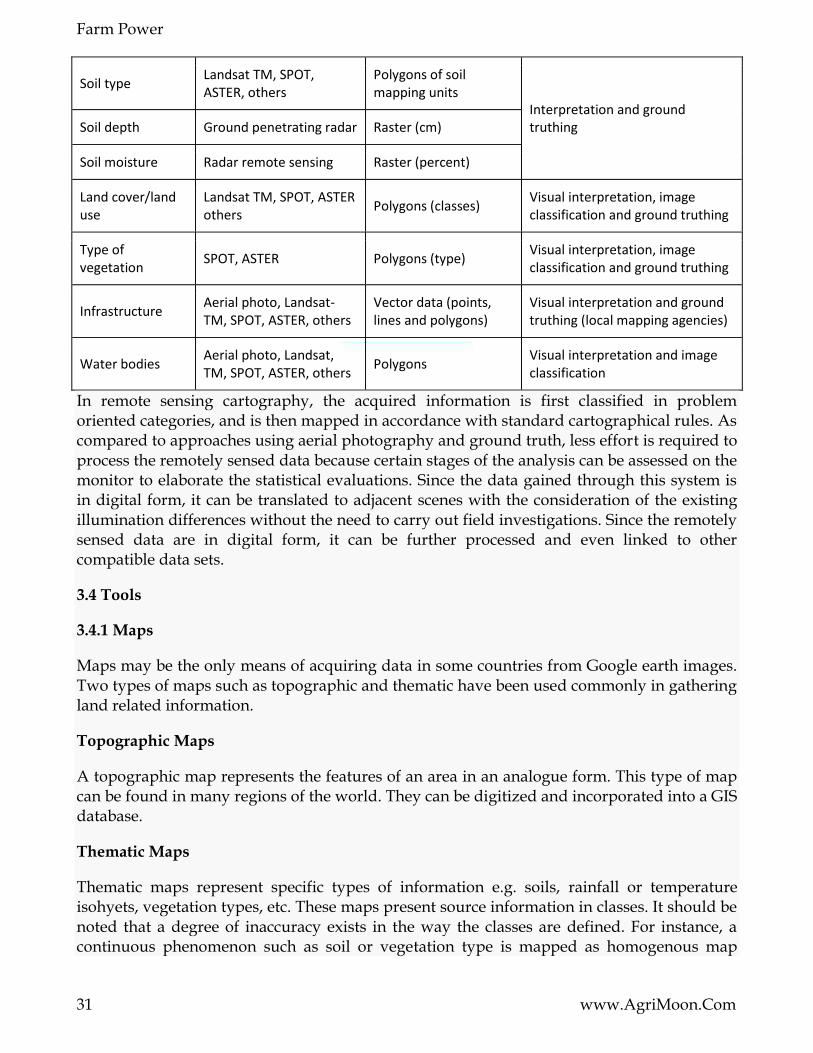
Table 3.2. Information for water harvesting planning from remote sensing systems
Parameter Satellite type Type of information How to obtain
Topography Aerial photo. LIDAR<IFSAR
Raster data (DEM) Internet sites, local mapping agencies
Inclination/slope Aerial photo, LIDAR, IFSAR
Raster data (percent degree)
Derive from DEM
Elevation Aerial photo, LIDAR, IFSAR
Raster data (meters above mean sea level)
Derive from DEM
Surface roughness
Microwave Root mean square average
Microwave remote sensing
Farm Power
31 www.AgriMoon.Com
Soil type Landsat TM, SPOT, ASTER, others
Polygons of soil mapping units
Interpretation and ground truthing Soil depth Ground penetrating radar Raster (cm)
Soil moisture Radar remote sensing Raster (percent)
Land cover/land use
Landsat TM, SPOT, ASTER others
Polygons (classes) Visual interpretation, image classification and ground truthing
Type of vegetation
SPOT, ASTER Polygons (type) Visual interpretation, image classification and ground truthing
Infrastructure Aerial photo, Landsat-TM, SPOT, ASTER, others
Vector data (points, lines and polygons)
Visual interpretation and ground truthing (local mapping agencies)
Water bodies Aerial photo, Landsat, TM, SPOT, ASTER, others
Polygons Visual interpretation and image classification
In remote sensing cartography, the acquired information is first classified in problem oriented categories, and is then mapped in accordance with standard cartographical rules. As compared to approaches using aerial photography and ground truth, less effort is required to process the remotely sensed data because certain stages of the analysis can be assessed on the monitor to elaborate the statistical evaluations. Since the data gained through this system is in digital form, it can be translated to adjacent scenes with the consideration of the existing illumination differences without the need to carry out field investigations. Since the remotely sensed data are in digital form, it can be further processed and even linked to other compatible data sets.
3.4 Tools
3.4.1 Maps
Maps may be the only means of acquiring data in some countries from Google earth images. Two types of maps such as topographic and thematic have been used commonly in gathering land related information.
Topographic Maps
A topographic map represents the features of an area in an analogue form. This type of map can be found in many regions of the world. They can be digitized and incorporated into a GIS database.
Thematic Maps
Thematic maps represent specific types of information e.g. soils, rainfall or temperature isohyets, vegetation types, etc. These maps present source information in classes. It should be noted that a degree of inaccuracy exists in the way the classes are defined. For instance, a continuous phenomenon such as soil or vegetation type is mapped as homogenous map

Farm Power
32 www.AgriMoon.Com
units with sharp boundaries, whereas the actual circumstances on the ground vary within each map unit; this may affect the project results significantly.
3.4.2 Aerial Photographs
There are archives of black and white aerial photographs in many parts of the world, but their usefulness depends on the age and scale of the images and the specific purpose for which they were taken. Color infrared photographs can be used to differentiate vegetation types.
3.4.3 Geographic Information System
A GIS is a computer based system used to capture, store, edit, manage, and display geographically referenced information, including spatial and descriptive data. Spatial data deal with the location and shape of various features and the relationship among them. Such features as topography, water resources, soil types, land use, infrastructure and administrative boundaries can also be combined in a GIS.
Descriptive data describe the characteristics of these features. Thus a GIS serves as a tool for representing the real world. GIS can be used to help policy makers in identifying and prioritizing appropriate rainwater harvesting interventions.
Lesson 3 Identification of Areas Suitable for Water Harvesting
3.1 Introduction
Rainwater harvesting is the collection of surface runoff mainly for agricultural and domestic purposes. The identification of potential sites for rainwater harvesting (RWH) is an important step towards maximizing water availability and land productivity in rain fed areas. The traditional fragmented approach of identification of potential sites for RWH is no longer viable and a more holistic approach to water management is essential. Development of methodology for identifying potential sites for RWH is an important step towards identifying areas suitable for certain techniques of water harvesting.
3.2 Parameters for Identifying Suitable Areas
Parameters to be considered for identifying areas suitable for water harvesting include:
Climatic parameters of the region, especially rainfall
Hydrology and alternative water resources
Topography of the region
Type of vegetation and agricultural production/forestry activities
Soil types of the region including soil depth and fertility status
Socio-economic conditions of the community
National laws and regulations
Farm Power
33 www.AgriMoon.Com
Infrastructural facilities available or planned for the area
3.2.1Rainfall Characteristics
The availability of rainfall data collected over years is crucial for the determination of the rainfall-runoff potential of a region. This is particularly true in arid and semi arid regions, where rainfall varies considerably from year to year. However average rainfall can still be used in areas with insufficient rainfall data. Future changes in rainfall pattern expected due to global climate change are also to be taken into consideration.
Rainfall can be measured on site using non recording / recording rainfall gauges to record single rainfall events or the daily total rainfall in the project area. However such data should be used with caution especially when extrapolating the findings to adjacent areas. The elevation of rain gauges from the ground level also affects the amount of rainfall measured. To avoid such discrepancies, the rain gauges should be placed at the same height throughout the project area.
Threshold rain is the depth of rainfall that must fall before runoff starts. It is used in some rainfall-runoff models as an initial value of runoff. Sufficient allowance must be given for the variation of the rainfall in time and space. Apart from the threshold rain that varies with rainfall intensity, the soil type, degree of slope, vegetation cover and antecedent soil moisture condition are other important parameters to be taken into consideration for accurate rainfall measurement.
The intensity of the rainfall is a good indicator of whether a particular rainfall event is likely to produce runoff or not. Of course, determination of the threshold intensity of rainfall that triggers runoff is more difficult to be determined than ascertaining the threshold rainfall depth. Rainfall intensity should also be determined as it is required for rainfall - runoff models. Recording rain gauges can be used for its determination. Rainfall duration can also be determined reliably using a recording rain gauge. This is also an important factor as it is often related to peak discharge in simulation models.
Once these data have been acquired, the most important rainfall parameters to be determined are:
The relationship between the storm intensity and its duration; and
The number of storms per year, including their mean standard deviation and probability distribution.
These parameters will then be used to calculate the volume of water available for cropping, possibly by generating synthetic rainfall events for deterministic calculation of runoff quantities.
The temperature regime, air humidity and wind conditions during the cropping period are the other climatic factors which have to be taken into consideration when selecting a certain area for water harvesting.
Farm Power
34 www.AgriMoon.Com
3.2.2 Hydrology and Water Resources
The hydrological processes relevant to water harvesting practices are those involved in the production, flow, and storage of runoff from rainfall within a particular catchment area. The intricacies of this phenomenon cannot be explained in detail here, but an overview is presented.
Rainfall received in a particular catchment area can be divided into two major components such as the effective rainfall (direct runoff) for water harvesting and the losses. The sources of the losses are:
Evaporation from the ground
Water infiltration in the catchment
Depression storage in the catchment
Water intercepted by leaves of the plants
In arid and semi-arid areas, extreme fluctuations in both annual rainfall and its distribution during rainy season are considered as the major constraints to agricultural production. In most cases rainfall shows no regular pattern; the wet periods are often followed by marked dry periods. Modeling the rainfall - runoff process in hydrological analysis of an area is very complicated and the model designer must choose the most appropriate model from the existing models or develop one to suit the area under consideration. The lack of meteorological data, suitable topographic maps etc. often creates complications limiting strongly the usefulness of models.
The availability of sufficient runoff from the target area that can be stored to meet the water requirement of the selected crops during the dry periods in between two rainfall events is a good indication of the suitability of the area for water harvesting.
Another factor to be taken into consideration is the availability of other water sources e.g. shallow ground water in wadi beds and renewable ground water from deeper aquifers. These water sources can either substitute runoff water during drought periods or extend the cropping period beyond the rainy season.
3.2.3 Vegetation and Land Use
Vegetation strongly affects the surface runoff. An increase in the vegetative density results in a corresponding increase in losses due to interception, retention, and infiltration, which consequently decreases the volume of runoff. The density of vegetation on a given area can be determined in a variety of ways, but remote sensing is the most advanced and accurate method for large project areas subject to availability of funds. Reflectance of the soil and the vegetation is the indicator of the density of the vegetation in remote sensing.
Land use pattern affects the suitability of land for water harvesting in various ways. Introducing micro-catchment harvesting in areas already under cropping is much easier than transferring farmers into potentially suitable areas. On the other hand, farming activities in
Farm Power
35 www.AgriMoon.Com
catchment areas such as primary and secondary tillage operations reduce the runoff yield significantly due to increase in the infiltration rates. On the contrary, overgrazing removes the vegetation cover which results in higher runoff volumes from the catchment. However, overgrazing entails in most cases a higher soil erosion risk with negative impacts on the water harvesting potential of the region.
3.2.4 Topography, Soil Type and Soil Depth
The suitability of an area for water harvesting depends strongly on its topography and soil characteristics, namely:
The slope of a terrain which is a decisive factor for any type of water harvesting
Surface structure which influences the rainfall runoff process
Infiltration and percolation rates, which determine the movement of water into the soil and within the soil matrix
Soil depth which together with the soil texture determines the quantity of water that can be stored in the soil.
The topography has a strong impact on infiltration volume and runoff yield. Micro-catchment systems are more appropriate for gentle slopes, whereas macro-catchment techniques can only be established in terrains having significant slope. Further information is given in Chapter 3.
The infiltration rate is the amount of water entering the soil, through its surface, over a given time. Infiltrometers and/or rainfall simulators can be used to determine the infiltration behavior of any soil. The main soil parameters affecting infiltration rate are the texture, structure, and depth of the soil. Vegetation and soil fauna also influence the infiltration rate. Dense vegetation absorbs the kinetic energy of the falling raindrops and thus, reduces the splash erosion and helps increasing the water retention followed by increasing the infiltration rate. A well developed root system after natural decay leaves tubular structures in the soil profile that helps increasing the infiltration rate. On the contrary, a bare soil is dislodged quickly due to its exposure to the direct hit of raindrops and thus, the existing soil pores in the surface are sealed resulting in decrease of infiltration rate.
Initial infiltration rates are higher in dry soils. As the rainfall continues, the infiltration rate declines gradually when the soil pores near the surface are filled up with water resulting in lowering down the hydraulic gradient, the driving force for the infiltration process. In clay-rich soils, the cracks that frequently occur in dry condition get closed as the soil becomes wet.
3.2.5 Socio-economic Condition and Infrastructure
The socioeconomic condition of the stakeholders opting for water harvesting scheme is very much important. Many projects have been abandoned soon after their implementation as a result of the negligence of this very important aspect during planning stage. Key considerations of this aspect include the farming systems of the community under consideration, the financial resources of the average farmer in the area, cultural behaviors
Farm Power
36 www.AgriMoon.Com
and religious beliefs of the people, the attitude of the farmers towards the introduction of new farming methods, the farmers‟ knowledge about irrigated agriculture, land property rights, and the role of men and women in the community. The mobility of the populace may also influence the planning decisions.
As in any development project, the existing infrastructures or that will be developed in the future in the same area have to be taken into account when planning a water harvesting scheme.
3.3 Methods of Data Acquisition
3.3.1 Overview
The basic data required for any water harvesting project are presented in Table 3.1. The choice of method used to acquire these data depends not only on technical and financial considerations, but also to some extent constrained by national security and political issues.
3.3.2 Ground Truthing
Field visits to the area where a water harvesting project is to be executed are always necessary. For reliable results, specialists well versed in hydrology, prevailing vegetative condition of the region, and possibly the agricultural practices of the stake holders will be required. Ideally the local experts should be involved with the process. Some parameters may not be directly ascertained from maps, aerial photographs, or even satellite images and so, an inventory of the terrain should be prepared during field visits. Maps and ground truthing are adequate sources of information when the project is to be executed in a small area. However, it is time-consuming and expensive when planned for larger areas or in regional scale.
Table 3.1. Methods for Determining Parameters Relevant To Water Harvesting
Parameter Used or needed for Method
Crop water requirements
Maximum dry period, evapotranspiration values of crop
Analysis of meteorological data, plant growth, water stress relations
Water storage capacity of soil
Soil cover, natural vegetation and land use
Assessment of satellite images by computer assisted classification based on ground truth
Accessibility
Distance between water harvesting site and villages
Taken directly from topographic map or by digitizing settlement areas
Type of water harvesting system (micro/macro-catchment)
Terrain slope Comprehensive distance model

Farm Power
37 www.AgriMoon.Com
Water availability Rainfall - runoff relationship Hydrological analysis/procedures and/or measurements
Sociological, economic, and political considerations
Beneficiaries preferences, resources support, participation, sustainability
Observations, interviews, outcome from nearby water harvesting projects.
3.3.3 Aerial Photography
Aerial surveying is a proven technology for extensive data acquisition. Vertical surveys with stereoscopic overlap can be made using large cameras. It depends on the regional or national availability of survey planes, and is cost effective only for large-scale projects. It may be appropriate for water harvesting schemes in regional scale.
3.3.4 Satellite and Remote-Sensing Technology
Satellite and remote-sensing technologies coupled with geographical information systems are the most powerful and reasonably cost-efficient tools used in assessing the potential for water harvesting.
The term remote-sensing is used to describe all the procedures employed in recording information from high altitudes above the Earth‟s surface. This can be done from an airplane or satellite. Remote sensing technology can not only be used for gathering preliminary information, but also to monitor and update data continuously at regular intervals.
Various types of information available from a variety of remote sensing platforms are presented in Table 3.2. The principal steps in using remotely sensed data to identify areas suited to water harvesting include:
Definition of data required e.g. land use, geology, pedology, hydrology, etc.
Data collection using remote sensing and other techniques
Data analysis e.g. measurement, classification and estimation analysis
Verification of the results obtained through analysis
Presenting the results in a suitable format, such as maps, computer data files, written reports with diagrams, tables, maps etc.
Water, forest, pasture and other features reflect light from the sun differently and yield characteristic patterns in the relation between wavelengths and amount on reflected energy. These patterns can be recognized in the data registered by the satellite. Image classification is based on the assumption that the areas with similar characteristic spectra have similar characteristics on the ground. There are two approaches to classification of the data that are distinguished primarily by their initial assumption. In supervised classification, the ground

Farm Power
38 www.AgriMoon.Com
truth data from direct in-field observations are used to identify the initial parameters used in the classification.
Table 3.2. Information for water harvesting planning from remote sensing systems
Parameter Satellite type Type of information How to obtain
Topography Aerial photo. LIDAR<IFSAR
Raster data (DEM) Internet sites, local mapping agencies
Inclination/slope Aerial photo, LIDAR, IFSAR
Raster data (percent degree)
Derive from DEM
Elevation Aerial photo, LIDAR, IFSAR
Raster data (meters above mean sea level)
Derive from DEM
Surface roughness
Microwave Root mean square average
Microwave remote sensing
Soil type Landsat TM, SPOT, ASTER, others
Polygons of soil mapping units
Interpretation and ground truthing Soil depth
Ground penetrating radar
Raster (cm)
Soil moisture Radar remote sensing Raster (percent)
Land cover/land use
Landsat TM, SPOT, ASTER others
Polygons (classes) Visual interpretation, image classification and ground truthing
Type of vegetation
SPOT, ASTER Polygons (type) Visual interpretation, image classification and ground truthing
Infrastructure Aerial photo, Landsat-TM, SPOT, ASTER, others
Vector data (points, lines and polygons)
Visual interpretation and ground truthing (local mapping agencies)
Water bodies Aerial photo, Landsat, TM, SPOT, ASTER, others
Polygons Visual interpretation and image classification
In remote sensing cartography, the acquired information is first classified in problem oriented categories, and is then mapped in accordance with standard cartographical rules. As compared to approaches using aerial photography and ground truth, less effort is required to process the remotely sensed data because certain stages of the analysis can be assessed on the monitor to elaborate the statistical evaluations. Since the data gained through this system is in digital form, it can be translated to adjacent scenes with the consideration of the existing illumination differences without the need to carry out field investigations. Since the remotely

Farm Power
39 www.AgriMoon.Com
sensed data are in digital form, it can be further processed and even linked to other compatible data sets.
3.4 Tools
3.4.1 Maps
Maps may be the only means of acquiring data in some countries from Google earth images. Two types of maps such as topographic and thematic have been used commonly in gathering land related information.
Topographic Maps
A topographic map represents the features of an area in an analogue form. This type of map can be found in many regions of the world. They can be digitized and incorporated into a GIS database.
Thematic Maps
Thematic maps represent specific types of information e.g. soils, rainfall or temperature isohyets, vegetation types, etc. These maps present source information in classes. It should be noted that a degree of inaccuracy exists in the way the classes are defined. For instance, a continuous phenomenon such as soil or vegetation type is mapped as homogenous map units with sharp boundaries, whereas the actual circumstances on the ground vary within each map unit; this may affect the project results significantly.
3.4.2 Aerial Photographs
There are archives of black and white aerial photographs in many parts of the world, but their usefulness depends on the age and scale of the images and the specific purpose for which they were taken. Color infrared photographs can be used to differentiate vegetation types.
3.4.3 Geographic Information System
A GIS is a computer based system used to capture, store, edit, manage, and display geographically referenced information, including spatial and descriptive data. Spatial data deal with the location and shape of various features and the relationship among them. Such features as topography, water resources, soil types, land use, infrastructure and administrative boundaries can also be combined in a GIS.
Descriptive data describe the characteristics of these features. Thus a GIS serves as a tool for representing the real world. GIS can be used to help policy makers in identifying and prioritizing appropriate rainwater harvesting interventions.

Farm Power
40 www.AgriMoon.Com
Lesson 4 Reservoir/Dam and Farm Ponds
4.1 Definition
A dam may be defined as an obstruction or a barrier built across a stream or a river. At the upstream of this barrier, water gets collectedforming a pool of water. The side on which water gets collected is called the upstream side, and the other side of the barrier is called the downstream side. The lake of water which is formed upstream is often called a reservoir, or a dam reservoir, or a river reservoir, or a storage reservoir.
The water collected in this reservoir can be supplied for irrigating the farm lands through a system of canal network, or may be supplied for drinking purposes. The lake so formed can be used for recreation uses also. The energy of this collected water can be used to turn the blades of a turbine to generate electrical power. And in times of floods, the dams can serve as protections for the towns and cities farther down the river.
Apart from these numerous advantages and uses (such as navigation, irrigation, electricity, flood control, etc.) of a dam, it sometimes helps us in planning war strategy and helps us in controlling the advanceme0nt of enemies and their forces. Dams have been frequently opened in times of war. The Dutch breached their dikes during second world war to bedevil the invading Germans, Chinese used to marauders, partly destroyed the famous Dnieprostroi Dam in the Ukraine to keep its power plant from failing into the hands of Hitler‟s men.
4.2 Classification of Dams
Dams can be classified depending upon the materials used for construction, use and design as follows:
4.2.1 Classification According to the Material used for Dam Construction
The dams classified according to the material used for construction are of seven types. Three of them are of ancient origin and four have come into general use only in the last century. The dams of ancient origin are:
Earth dam
Rock-fill dam
Solid masonry gravity dams
The dams introduced in the last century are:
Hollow masonry gravity dams
Steel dam

Farm Power
41 www.AgriMoon.Com
Timber dams
R.C.C Arch dam
(1) Earth Dam: Earth dams are made of soil that is pounded down solidly. They are built in areas where the foundation is not strong enough to bear the weight of concrete dam, and where earth is more easily available as a building material compared to concrete or stone or rock (Fig. 1).
Fig. 4.1. Cross sectional view of earth dam. (Source: Nelson, 1985)
(2) Rock-fill dam: Rock-fill dams are formed of loose rocks and boulders piled in the river bed (Fig. 2). A slab of reinforced concrete is often laid across the upstream face of a rock-fill dam to make it water-tight.
(3) Solid masonry gravity dam: These dams are big in size and quite expensive to be built but are more durable and solid than earth and rock-fill dams. They can be constructed on any dam site, where there is a natural foundation strong enough to bear the heavy weight of the dam (Fig. 3).
Fig. 4.2. Cross sectional view of rock fill dam.
(Source: http://www.enggpedia.com/civil-engineering)
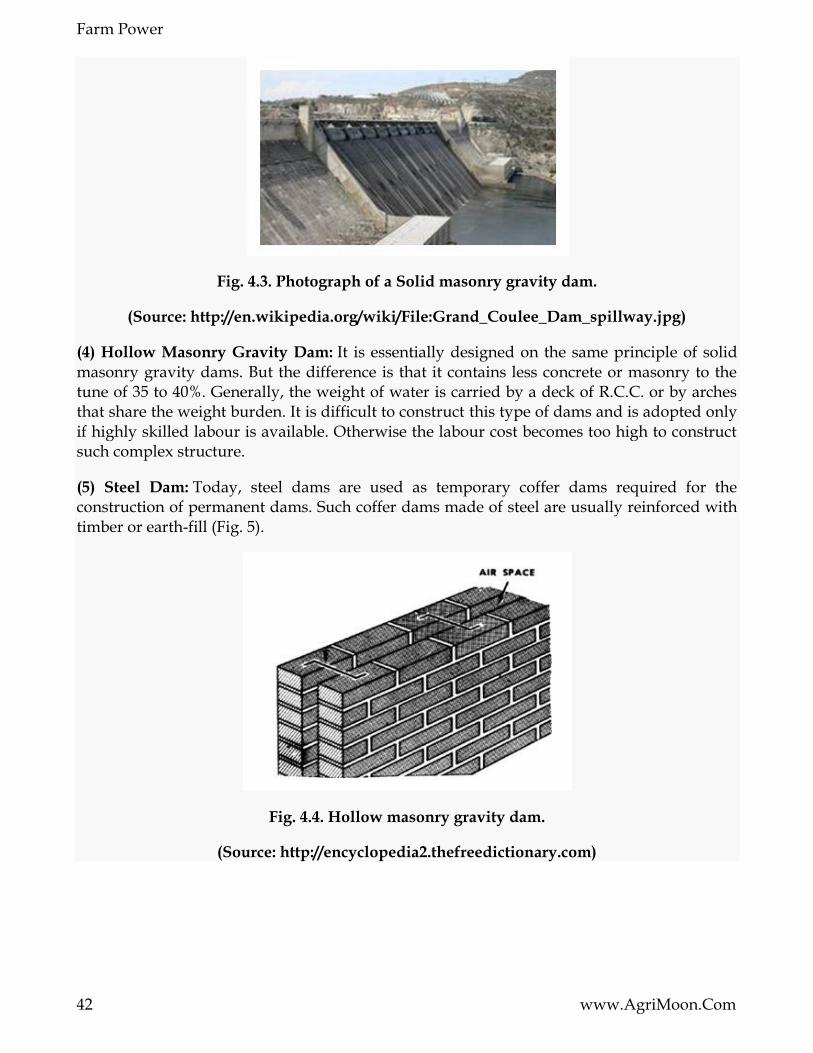
Farm Power
42 www.AgriMoon.Com
Fig. 4.3. Photograph of a Solid masonry gravity dam.
(Source: http://en.wikipedia.org/wiki/File:Grand_Coulee_Dam_spillway.jpg)
(4) Hollow Masonry Gravity Dam: It is essentially designed on the same principle of solid masonry gravity dams. But the difference is that it contains less concrete or masonry to the tune of 35 to 40%. Generally, the weight of water is carried by a deck of R.C.C. or by arches that share the weight burden. It is difficult to construct this type of dams and is adopted only if highly skilled labour is available. Otherwise the labour cost becomes too high to construct such complex structure.
(5) Steel Dam: Today, steel dams are used as temporary coffer dams required for the construction of permanent dams. Such coffer dams made of steel are usually reinforced with timber or earth-fill (Fig. 5).
Fig. 4.4. Hollow masonry gravity dam.
(Source: http://encyclopedia2.thefreedictionary.com)

Farm Power
43 www.AgriMoon.Com
Fig. 4.5. Photograph of a steel dam.
(Source: http://roadtrekin.blogspot.in/)
(6) Timber Dam: These dams are short lived because rotting sets in a few years time. In spite of regular maintenance, the life of a timber dam is not more than 30 to 40 years. However, these are useful for low level needs in agricultural sector (Fig. 6). For example, a cattle-raiser may need a pool for the purpose of drinking and bathing of his livestock and other related needs.
(7) Arch Dam: Arch dams are very complex and complicated. They make use of horizontal arch action in place of weight to hold back the water (Fig. 7). They are best suited at sites where the dam must be extremely high and narrow.
Fig. 4.6. View of a timber dam.
Fig. 4.7. View of an Arch dam.
(Sources: http://civilsolution.wordpress.com/ , http://www.stucky.ch/)
4.2.2 Classification of Dams According to their Use
Based on the use, the dams are divided into three types such as storage dams, diversion dams and detention dams.
(i) Storage Dam: These dams are constructed to store water during the periods of surplus supply and the stored water is used later during the periods of deficient supply (Fig. 8). In countries like India,where the rainfall pattern is very erratic, huge amount of rainfall received
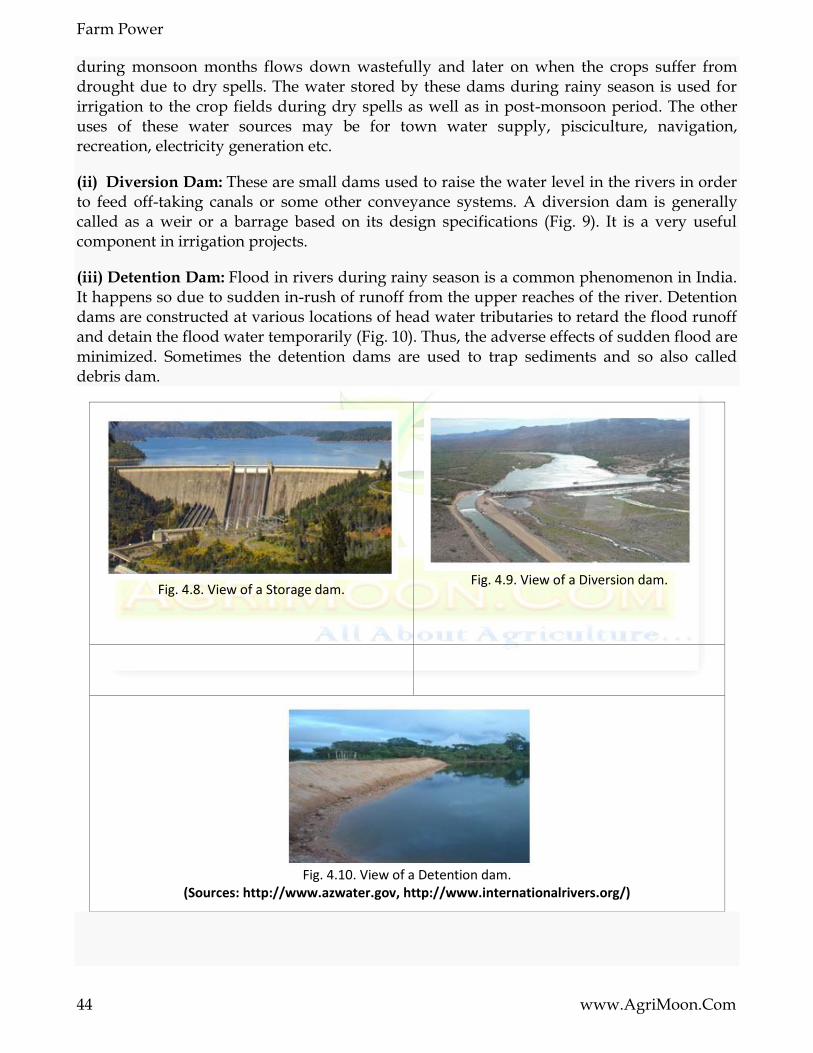
Farm Power
44 www.AgriMoon.Com
during monsoon months flows down wastefully and later on when the crops suffer from drought due to dry spells. The water stored by these dams during rainy season is used for irrigation to the crop fields during dry spells as well as in post-monsoon period. The other uses of these water sources may be for town water supply, pisciculture, navigation, recreation, electricity generation etc.
(ii) Diversion Dam: These are small dams used to raise the water level in the rivers in order to feed off-taking canals or some other conveyance systems. A diversion dam is generally called as a weir or a barrage based on its design specifications (Fig. 9). It is a very useful component in irrigation projects.
(iii) Detention Dam: Flood in rivers during rainy season is a common phenomenon in India. It happens so due to sudden in-rush of runoff from the upper reaches of the river. Detention dams are constructed at various locations of head water tributaries to retard the flood runoff and detain the flood water temporarily (Fig. 10). Thus, the adverse effects of sudden flood are minimized. Sometimes the detention dams are used to trap sediments and so also called debris dam.
Fig. 4.8. View of a Storage dam.
Fig. 4.9. View of a Diversion dam.
Fig. 4.10. View of a Detention dam.
(Sources: http://www.azwater.gov, http://www.internationalrivers.org/)
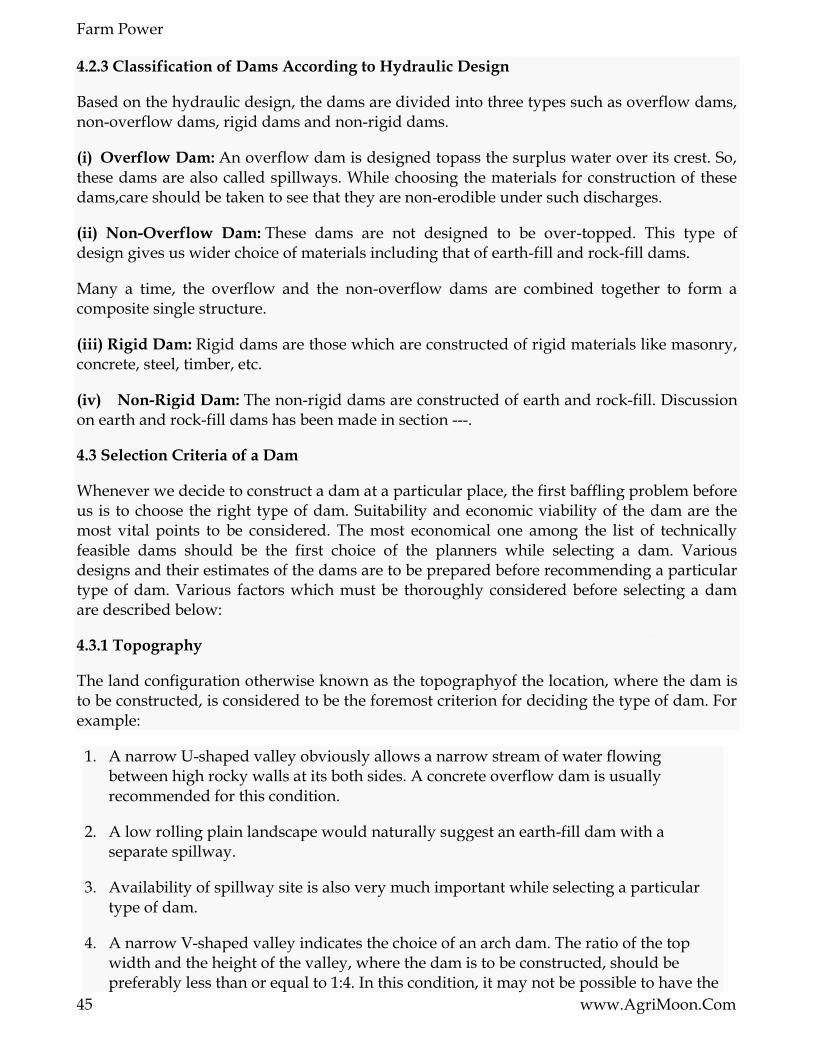
Farm Power
45 www.AgriMoon.Com
4.2.3 Classification of Dams According to Hydraulic Design
Based on the hydraulic design, the dams are divided into three types such as overflow dams, non-overflow dams, rigid dams and non-rigid dams.
(i) Overflow Dam: An overflow dam is designed topass the surplus water over its crest. So, these dams are also called spillways. While choosing the materials for construction of these dams,care should be taken to see that they are non-erodible under such discharges.
(ii) Non-Overflow Dam: These dams are not designed to be over-topped. This type of design gives us wider choice of materials including that of earth-fill and rock-fill dams.
Many a time, the overflow and the non-overflow dams are combined together to form a composite single structure.
(iii) Rigid Dam: Rigid dams are those which are constructed of rigid materials like masonry, concrete, steel, timber, etc.
(iv) Non-Rigid Dam: The non-rigid dams are constructed of earth and rock-fill. Discussion on earth and rock-fill dams has been made in section ---.
4.3 Selection Criteria of a Dam
Whenever we decide to construct a dam at a particular place, the first baffling problem before us is to choose the right type of dam. Suitability and economic viability of the dam are the most vital points to be considered. The most economical one among the list of technically feasible dams should be the first choice of the planners while selecting a dam. Various designs and their estimates of the dams are to be prepared before recommending a particular type of dam. Various factors which must be thoroughly considered before selecting a dam are described below:
4.3.1 Topography
The land configuration otherwise known as the topographyof the location, where the dam is to be constructed, is considered to be the foremost criterion for deciding the type of dam. For example:
1. A narrow U-shaped valley obviously allows a narrow stream of water flowing between high rocky walls at its both sides. A concrete overflow dam is usually recommended for this condition.
2. A low rolling plain landscape would naturally suggest an earth-fill dam with a separate spillway.
3. Availability of spillway site is also very much important while selecting a particular type of dam.
4. A narrow V-shaped valley indicates the choice of an arch dam. The ratio of the top width and the height of the valley, where the dam is to be constructed, should be preferably less than or equal to 1:4. In this condition, it may not be possible to have the
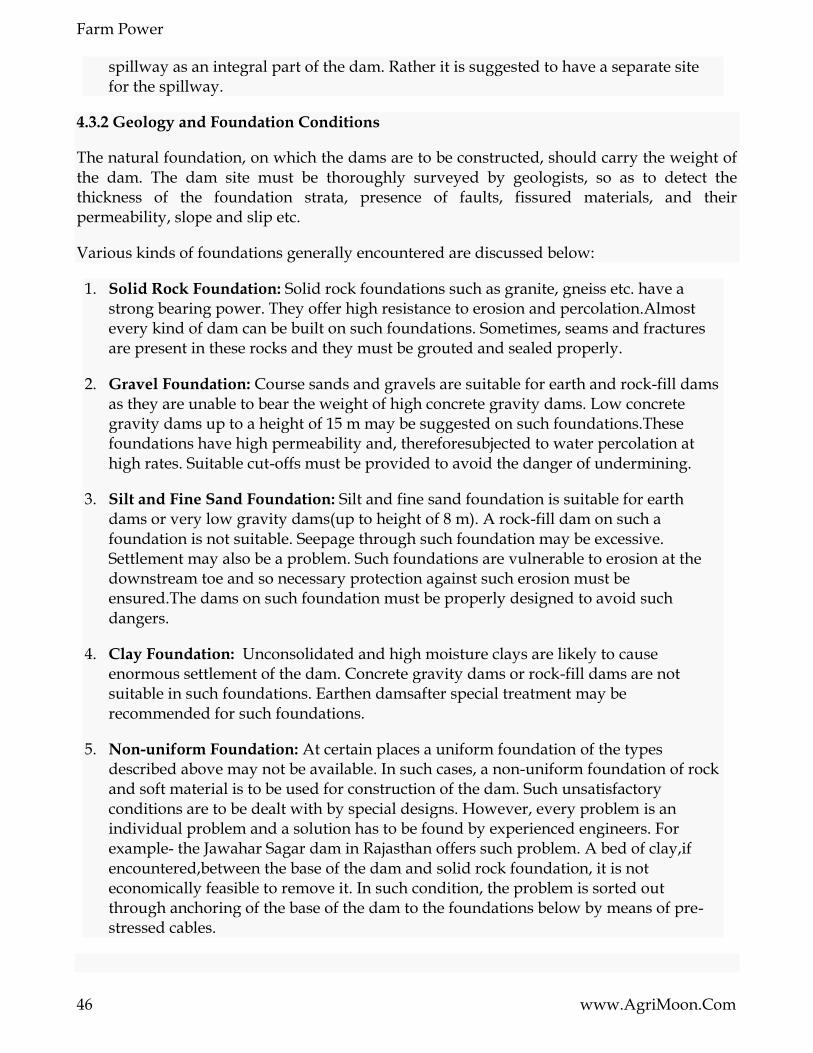
Farm Power
46 www.AgriMoon.Com
spillway as an integral part of the dam. Rather it is suggested to have a separate site for the spillway.
4.3.2 Geology and Foundation Conditions
The natural foundation, on which the dams are to be constructed, should carry the weight of the dam. The dam site must be thoroughly surveyed by geologists, so as to detect the thickness of the foundation strata, presence of faults, fissured materials, and their permeability, slope and slip etc.
Various kinds of foundations generally encountered are discussed below:
1. Solid Rock Foundation: Solid rock foundations such as granite, gneiss etc. have a strong bearing power. They offer high resistance to erosion and percolation.Almost every kind of dam can be built on such foundations. Sometimes, seams and fractures are present in these rocks and they must be grouted and sealed properly.
2. Gravel Foundation: Course sands and gravels are suitable for earth and rock-fill dams as they are unable to bear the weight of high concrete gravity dams. Low concrete gravity dams up to a height of 15 m may be suggested on such foundations.These foundations have high permeability and, thereforesubjected to water percolation at high rates. Suitable cut-offs must be provided to avoid the danger of undermining.
3. Silt and Fine Sand Foundation: Silt and fine sand foundation is suitable for earth dams or very low gravity dams(up to height of 8 m). A rock-fill dam on such a foundation is not suitable. Seepage through such foundation may be excessive. Settlement may also be a problem. Such foundations are vulnerable to erosion at the downstream toe and so necessary protection against such erosion must be ensured.The dams on such foundation must be properly designed to avoid such dangers.
4. Clay Foundation: Unconsolidated and high moisture clays are likely to cause enormous settlement of the dam. Concrete gravity dams or rock-fill dams are not suitable in such foundations. Earthen damsafter special treatment may be recommended for such foundations.
5. Non-uniform Foundation: At certain places a uniform foundation of the types described above may not be available. In such cases, a non-uniform foundation of rock and soft material is to be used for construction of the dam. Such unsatisfactory conditions are to be dealt with by special designs. However, every problem is an individual problem and a solution has to be found by experienced engineers. For example- the Jawahar Sagar dam in Rajasthan offers such problem. A bed of clay,if encountered,between the base of the dam and solid rock foundation, it is not economically feasible to remove it. In such condition, the problem is sorted out through anchoring of the base of the dam to the foundations below by means of pre-stressed cables.
Farm Power
47 www.AgriMoon.Com
4.3.3 Availability of Materials
In order to achieve economy in dam construction, the materials required for it must be available locally or at short distances from the construction site. Sometimes, good soil is easily available, which naturally calls for an earthen dam. If sand, cement and stone etc. are easily available, one should naturally think of a concrete gravity dam. If the material has to be transported from far off distances, then a hollow concrete dam(Buttress) is a better choice.
4.3.4 Spillway Size and Location
Spillway, as discussed earlier, disposes the surplus river discharge. The capacity of the spillway depends on the magnitudes of the floods to be by-passed. The spillway will, therefore, become much more important on streams with large flood potential. On such rivers, the spillway becomes a primary structure and the type of dam becomes a secondary consideration.
The cost of construction of a separate spillway may be enormous or sometimes a suitable separate site for the spillway may not be available. In such cases, it is desirable to combine the spillway and the dam as one structure leading to adoption of a concrete overflow dam.
At certain places, where the excavated material from a separate spillway channel can be utilized in dam embankment, an earth-fill dam may prove to be advantageous. Small spillway requirement often favours the selections of earth-fill or rock-fill dams even in narrow dam sites.
The practice of building a concrete spillway on earth and rock embankments is being discouraged these days, because of their conservative design assumptions and the vigil and watch required during their operations.
4.3.5 Earthquake Zone
If the dam is to be situated in an earthquake zone, its design must include the earthquake forces. Its safety should be ensured against the increased stress induced by an earthquake of worst intensity. The type of structures best suited to resist earthquake shocks without danger are earthen dams and concrete gravity dams.
4.3.6 Height of the Dam
Earthen dams are usually not provided with heights more than 30 m or so. Hence, for greater heights, gravity dams are generally preferred.
4.3.7 Other Considerations
Various other factors such as the life of the dam, the width of the roadway to be provided over the dam, problem of skilled labour, legal and aesthetic points must also be considered before a final decision on dam. However, the overall cost of construction and maintenance; and the funds available will finally decide the choice of a particular kind of dam at a particular site.
Farm Power
48 www.AgriMoon.Com
4.4 Introduction and Classification Farm Ponds
4.4.1 Introduction
Farm ponds are the most commonly used sources of ex-situ water harvesting structures. In addition to receiving direct rainfall, provision is also made to allow the runoff, generated from the upper reaches, to enter into it.It has wide adaptability in farmers‟ fields and is used as a handy source of water supply to crop fields. Such ponds are in use since time immemorial not only as assured sources of water supply to crops but also for pisciculture, livestock consumption and meetingthe demands from other sectors etc. However, these ponds have wide variations in shape and size as per the method of construction and their suitability to different topographic conditions. Most of the ponds, initially, constructed in fields are of regular shape. As time progresses,these ponds lose their regular shape and become irregular due to poor repair and maintenance.
4.4.2 General Classification of Pond
Based on the method of construction, location and purpose of use, the farm ponds are divided into several types. A general classification of farm ponds is discussed below:
1. Dugout pond
2. Surface pond
3. Spring or creek fed pond
4. Off-stream storage pond
5. Seepage pond
6. Pump-fed pond and
7. Embankment pond
(i) Dugout Pond
Dugout ponds also called excavated ponds as they are constructed by digging the soil. Ideal location for this pond is flat topography. The excavated soil is used in construction of embankments around the ponds. These ponds collect in-situ rainwater, surface runoff from the adjacent catchments and groundwater. The harvested water is lifted by means of indigenous lifting devices and pumps forvarious purposes such as irrigation, domestic water supply, livestock consumption etc. Excavated ponds are usually generally designed with a regular shape. The conventional shapes of the ponds may be square, rectangular or circular. Out of the three shapes, the circular pond has the highest storage capacity and the least perimeter for a given surface area and side slope. A comparison has been shown in Table 2.1.

Farm Power
49 www.AgriMoon.Com
Table 2.1. Perimeter and storage capacity of different shaped farm ponds
Shape of pond Side slope Perimeter (m) Storage capacity (m3)
Circular 1:5:1 105 1499
Square 1:5:1 120 1464
Rectangular 1:5:1 122 1458
N.B.: Each pond has equal surface area of 900 m2 and equal depth of 2 m.
However, it is difficult to construct circular shaped ponds. Therefore, the square and rectangular shaped ponds are widely adopted. For the same sizeof pond, the total dike length is more in case of rectangular shape than a square one. The perimeter of the pond increases as the shape gets more and more elongated resulting in increase of the construction cost. The dimensions and perimeter ofdifferentfarm ponds having same size of 400 m2 are presented in Table 2.2.
Table 2.2. Dimensions of farm ponds of size 400 m2 and of different shapes
Pond shape Length: width Width (m) Length (m) Perimeter (m)
Square 1:1 20.00 20.00 80.00
Rectangular
2.1 14.14 28.28 84.85
3:1 11.55 34.64 92.37
4:1 10.00 40.00 100.00
Square ponds are preferred when the pond size is small, less than or equal to 400 m2, because of low construction cost. For ponds larger than 400m2 size, the rectangular ponds are recommended.
(ii) Surface Pond
Surface ponds, also called as excavated-cum-embankment type ponds, are the most common types of farm ponds. They are partly excavated in ground where there is some depression and the excavated soil is used for the construction of the embankments. The dugout soil is utilized for the construction of the embankments of the ponds so that the pond can store maximum amount of water. These ponds are mostly fed by surface runoff although they catch in-situ rainfall and so, at times called as watershed ponds. Normally they get no supply during the dry season. Water from these ponds flows out by gravity till the water level in the pond reaches the ground level and then the rest amount of stored water is pumped out. Selection of site of these ponds is therefore very important.
Farm Power
50 www.AgriMoon.Com
(iii) Spring or Creek Fed Ponds
Spring or creek fed ponds are those where a spring or a creek is the source of water supply to the pond. Construction of these ponds depends on the availability of natural springs or creeks.
(iv) Off-Stream Storage Ponds
Such ponds are constructed by the side of the streams which flow only seasonally. They are so called since they are used to store the diverted seasonal water of the stream. These ponds also called barrage ponds as they are fed directly by the water running straight out from the water body to the ponds or diversion ponds as the water entering a channel is fed indirectly to the ponds in a controlled manner.
(v) Seepage Ponds
These ponds are supplied with water from the water table by seepage. The water level in the pond will vary according to the level of water table in the adjacent aquifer.
(vi) Pump-Fed Ponds
These ponds are normally at higher level than the water level in adjacent water sources such as a well, spring, lake or irrigation canal and are supplied water from these sources by pumping.
(vii) Levee Pond
These types of ponds are formed by embankments and are usually of a regular shape (rectangular) and are of uniform depth. They are fed with water from wells, storage reservoirs, streams or estuaries. They are mostly used in aquaculture.
4.4.3 Lined and Unlined Ponds
The ponds discussed above may be of lined or unlined types. Unlined ponds have no linings and are otherwise called earthen ponds. They have high seepage losses and hence their storage capacity decreases with time after cessation of rainfall. The rate of seepage losses gradually decreases with deposition of silt in the bottom and sides of the ponds. On the contrary, a lining material is provided either on the sides or bottom or both of the ponds to check the seepage losses in case of lined ponds. Consequently, these ponds have low or even no seepage loss and high storage capacity compared to the unlined ones. The lined ponds are named depending on the types of lining material. Some of the commonly used lined materials are polyethylene, bitumen, clay, brick and cement-concrete etc.
Some more types of ponds based on the purpose of use are walled ponds, drainable ponds, un-drainable ponds, pump drained ponds, cut and fill ponds etc.
Depending on the way the ponds fit in with the features of the local landscape, they have been conveniently grouped into three basic types such as sunken pond, barrage pond and diversion pond.
Farm Power
51 www.AgriMoon.Com
Sunken Ponds
A sunken pond is leveled with the ground surface and completely dug out. If it is required to have a sunken pond of 4 ft. deep, it needs to be dug 4 ft. down.
Following features are associated with sunken ponds:
The floor of the pond is generally below the level of the surrounding.
The pond is directly fed by groundwater, rainfall and/or surface runoff. It can also be fed by pumping.
It is not drainable or partially drainable.
These are sometimes constructed in the bottom of the valley by building a dam across the downstream end or in a series down the valley.
Barrage Ponds
Barrage ponds are made by building a wall across a small stream and the ponds are, therefore, like small conservation dams. Water for these ponds comes from a springor seepage area. It is very important that ponds of this type should not be constructed in places where there will be a very large flood of water down the stream in the rainy season.Sometimes barrage ponds are made below large conservation dams making use of seepage water. Barrage ponds have the following features:
It is drainable through the river bed.
It may have diversion canal or without. If large floods are present, the excess water is normally diverted around one side of the pond through a diversion canal. The pond water level then is controlled through water intake. Water enters directly to the pond from a spring, reservoir, lake etc. through a point called as inlet and flows out at another point called as outlet.
To protect the pond dike from floods, a spillway is built.
Diversion Ponds
Diversion ponds are constructed by bringing water from another source to the pond.The features of the diversion pond are:
The diversion ponds are fed directly by gravity or by pumping through a diversion canal from a spring, lake or reservoir. The water flow is controlled through a water intake. There is an inlet and outlet for each pond.
They can be constructed either in sloping ground as a cut and fill pond or in a flat ground as a four dike embankment pond sometimes called as paddy pond.
It is usually drainable through a drainage canal.

Farm Power
52 www.AgriMoon.Com
It is important to note that the choice of a particular type of pond largely depends on the kind of water supply available and on the existing topography of the site selected. For an example, if the valley bottom is 50 to 100 m wide, barrage ponds might be appropriate and when the valley bottom is more than 100m wide, diversion ponds may be built. However, when there are choices of several types of ponds, one should give highest priority to diversion ponds fed by gravity and lowest priority to barrage ponds in flooding areas requiring large diversion canals.
Shallow and Deep Ponds
Depending on the depth of water, the pond may be classified as shallow or deep pond. Except in some barrage ponds built on streams with steep longitudinal slope, fish ponds are generally shallow. Their maximum water depth is limited to 1.5 m. The depth of the pond should be at least 0.5 m to limit the growth of aquatic plants. The water depth in small ponds in many of the rural areas varies from 0.5 to 1 m. It is to be noted that the deeper ponds are much more expensive to excavate because of increasing exposed area and volume of earth works. Furthermore, the lifting of the excavated earth materials becomes difficult and requires more labour works and hence, wages. However it has some advantages too. In dry regions with more evaporation losses, deeper ponds are useful to reduce the evaporation loss and enable the pond users to have enough storage for pisciculture, domestic and agricultural uses. Even in the cold regions, where it may be necessary to provide the fish with a refuge in deep ponds, warmer water is useful during the cold weather.

Farm Power
53 www.AgriMoon.Com
Lesson 5 Earthen Embankments
5.1 Introduction
Earthen embankments have been used since ancient times to impound and divert water. These are simple compacted structures that rely on their mass to resist sliding and overturning and are the most common types of dams found worldwide. Modern haulage methods and developments in soil mechanics towards the end of the nineteenth century have greatly increased the safety and life of these structures.
The main advantages involved in the construction of the earthen dams are:
Use of locally available material in construction
Simple design procedure
Requirement of comparatively small plant and equipment
Flexibility in foundation requirements as compared to the other types of dams. The broad base of an earth dam spreads the load on the foundation.
Higher resistance of earth-fill dams to settlement and movement than rigid structures. So, they are more suitable for areas where earth movements are common.
However the earthen embankments are not free from disadvantages and these are:
An earth embankment is easily eroded by water flowing on, over or against it. Thus, a spillway for removal of excess water and adequate upstream protection are essential for an earth dam.
Design and construction of an effective spillway is usually the most technically difficult part in any dam building work. A site with a poor quality spillway should be avoided.
Inadequately compacted earthen embankment offers weak structural strength and facilitates formation of pathways for preferential seepage.
Earthen dams require continual maintenance against soil erosion, tree growth, subsidence, animal and insect damage and seepage.
5.2 Basic Terminologies
When discussing about the physical characteristics of a dam, the following terminologies are frequently used.
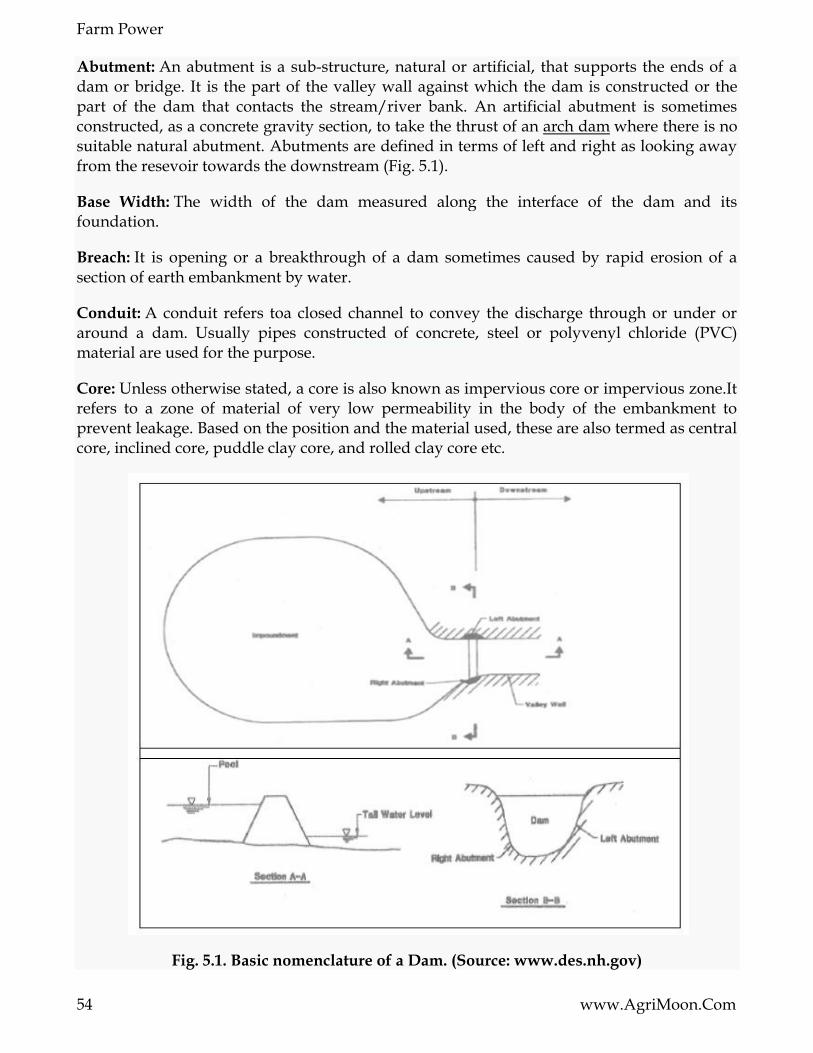
Farm Power
54 www.AgriMoon.Com
Abutment: An abutment is a sub-structure, natural or artificial, that supports the ends of a dam or bridge. It is the part of the valley wall against which the dam is constructed or the part of the dam that contacts the stream/river bank. An artificial abutment is sometimes constructed, as a concrete gravity section, to take the thrust of an arch dam where there is no suitable natural abutment. Abutments are defined in terms of left and right as looking away from the resevoir towards the downstream (Fig. 5.1).
Base Width: The width of the dam measured along the interface of the dam and its foundation.
Breach: It is opening or a breakthrough of a dam sometimes caused by rapid erosion of a section of earth embankment by water.
Conduit: A conduit refers toa closed channel to convey the discharge through or under or around a dam. Usually pipes constructed of concrete, steel or polyvenyl chloride (PVC) material are used for the purpose.
Core: Unless otherwise stated, a core is also known as impervious core or impervious zone.It refers to a zone of material of very low permeability in the body of the embankment to prevent leakage. Based on the position and the material used, these are also termed as central core, inclined core, puddle clay core, and rolled clay core etc.
Fig. 5.1. Basic nomenclature of a Dam. (Source: www.des.nh.gov)
Farm Power
55 www.AgriMoon.Com
Crest Length: It refers to the length of the top of a dam from left abutment to right abutment. In addition to the length of spillway, it includes the powerhouse, navigation lock, fish pass, etc. where these ancillary structures form a structural part of the dam. These structures should not be included in crest length when they are detached from the dam.
Crest of Dam: The crest of dam refers to the crown of an overflow section of a dam. In other words, it is the elevation of the uppermost surface of a dam excluding any parapet wall, railings, etc.
Crest Width: The width or thickness of a dam at its crest level. In general, the term "thickness" is used for gravity and arch dams and "width" is used for other dams.
Cutoff: An impervious construction by means of which seepage is reduced or prevented from passing through foundation material.
Cutoff Wall: It is a wall made of impervious material such as concrete or asphalt concrete or steel sheet or piling etc. built into the foundation to reduce the seepage rate under the dam.
Drainage Layer or Blanket: It refers to a layer of pervious material placed directly over the foundation material or downstream slope to safely drain the seepage of the embankment. When such a blanket is placed on the impoundment floor and upstream embankment to prevent seepage enering the dam, it is called an upstream blanket.
Drawdown: It is the resultant lowering of water surface level in the reservoir due to release of water.
Embankment: It is made of fill material, usually earth or rock, placed with sloping sides of the dam and usually with a length greater than its height.
Face: The external surface of a structure, such as the surface of a dam or appurtenanceis called as its face.
Flashboard: A length of timber, concrete, or steel placed on the crest of a spillway to raise the retention water level but which may be removed in the event of a flood by manual retrieval, a tripping device or by deliberately designed failure of the flashboard or its supports.
Foundation of Dam: The natural material on which the dam structure is placed. It is often modified to provide more favourable hydraulic characteristics.
Freeboard: The vertical distance between a stated reservoir elevation and the crest of the dam is called as its freeboard (Fig. 5.2). "Net freeboard", "dry freeboard", "flood freeboard", or "residual freeboard" is the expression for the vertical distance between the estimated maximum water elevation and the crest of the dam. "Gross freeboard" or "total freeboard" is the expression for the vertical distance between the maximum normal water elevation and the crest of the dam.
Gate: In general, a device in which a member is moved across the waterway from an external position to control or stop the flow is called as the gate. There are several types of gates in use.
Farm Power
56 www.AgriMoon.Com
Crest Gate: It is also called as spillway gate. A gate on the crest of a spillway that controls overflow or reservoir water level.
Flap Gate: A gate hinged along one edge, usually either the top or bottom edge. Examples of bottom hinged flap gates are tilting gates and fish belly gates so called from their shape in cross section.
Outlet Gate: A gate controlling the outflow of water from a reservoir is called as an outlet gate.
Radial Gate: It is a gate with a curved upstream plate and radial arms hinged to piers or other supporting structures. It is also called as tainter gate.
Slide Gate: It is a gate that can be opened or closed by sliding in supporting guides. It is also called as a sluice gate.
Heel of Dam: The junction of the upstream face of a gravity or arch dam with the foundation surface is called heel of the dam. In the case of an embankment dam, this junction is referred to as the upstream toe of the dam.
Intake: An intake refers to any structure in a reservoir or dam through which water is drawn into an outlet or measuring flume.
Outlet: It is an opening in a dam through which water can be freely discharged for a particular purpose from a reservoir.
Low Level Outlet: It is an opening at a low level from the reservoir generally used for emptying the impoundment. It is also called as bottom outlet.
Pervious Zone: It refers to a part of the cross section of an embankment dam comprising material of high permeability.
Riprap: It is a layer of stones, broken rocks or precast blocks placed in random fashion on the upstream slope of an embankment dam, on a reservoir shore or on the sides of a channel as a protection against waves, ice action and flowing water. Very large riprap is sometimes referred to as armoring.
Seepage Collar: It refers to a projecting collar usually of concrete or steel built around the outside of a pipe, tunnel or conduit under an embankment dam, to lengthen the seepage path along the outer surface of the conduit.
Spillway: It is a structure over or through which flood flows are discharged (Fig. 5.3). If the flow is controlled by gates, it is considered as a controlled spillway; if the elevation of the spillway crest is the only control, it is considered as an uncontrolled spillway.
Auxiliary Spillway or Emergency Spillway: A secondary spillway designed to operate only during exceptionally large floods.
Shaft Spillway or Morning glory Spillway: A vertical or inclined shaft into which flood water spills and then is conducted through, under, or around a dam by means of
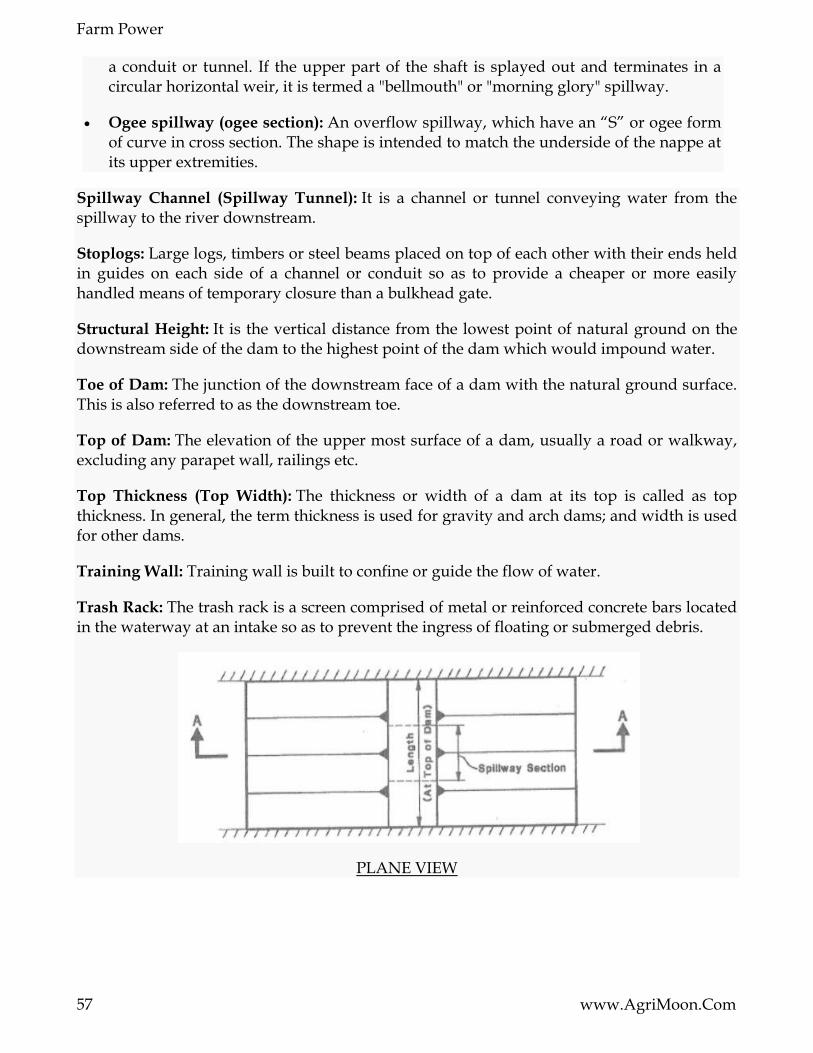
Farm Power
57 www.AgriMoon.Com
a conduit or tunnel. If the upper part of the shaft is splayed out and terminates in a circular horizontal weir, it is termed a "bellmouth" or "morning glory" spillway.
Ogee spillway (ogee section): An overflow spillway, which have an “S” or ogee form of curve in cross section. The shape is intended to match the underside of the nappe at its upper extremities.
Spillway Channel (Spillway Tunnel): It is a channel or tunnel conveying water from the spillway to the river downstream.
Stoplogs: Large logs, timbers or steel beams placed on top of each other with their ends held in guides on each side of a channel or conduit so as to provide a cheaper or more easily handled means of temporary closure than a bulkhead gate.
Structural Height: It is the vertical distance from the lowest point of natural ground on the downstream side of the dam to the highest point of the dam which would impound water.
Toe of Dam: The junction of the downstream face of a dam with the natural ground surface. This is also referred to as the downstream toe.
Top of Dam: The elevation of the upper most surface of a dam, usually a road or walkway, excluding any parapet wall, railings etc.
Top Thickness (Top Width): The thickness or width of a dam at its top is called as top thickness. In general, the term thickness is used for gravity and arch dams; and width is used for other dams.
Training Wall: Training wall is built to confine or guide the flow of water.
Trash Rack: The trash rack is a screen comprised of metal or reinforced concrete bars located in the waterway at an intake so as to prevent the ingress of floating or submerged debris.
PLANE VIEW

Farm Power
58 www.AgriMoon.Com
SECTION A-A
Fig. 5.2. Dam geometry. (Source: www.des.nh.gov)
PLANE VIEW
SECTION A-A
Fig. 5.3. Operating element of a dam. (Source: www.des.nh.gov)
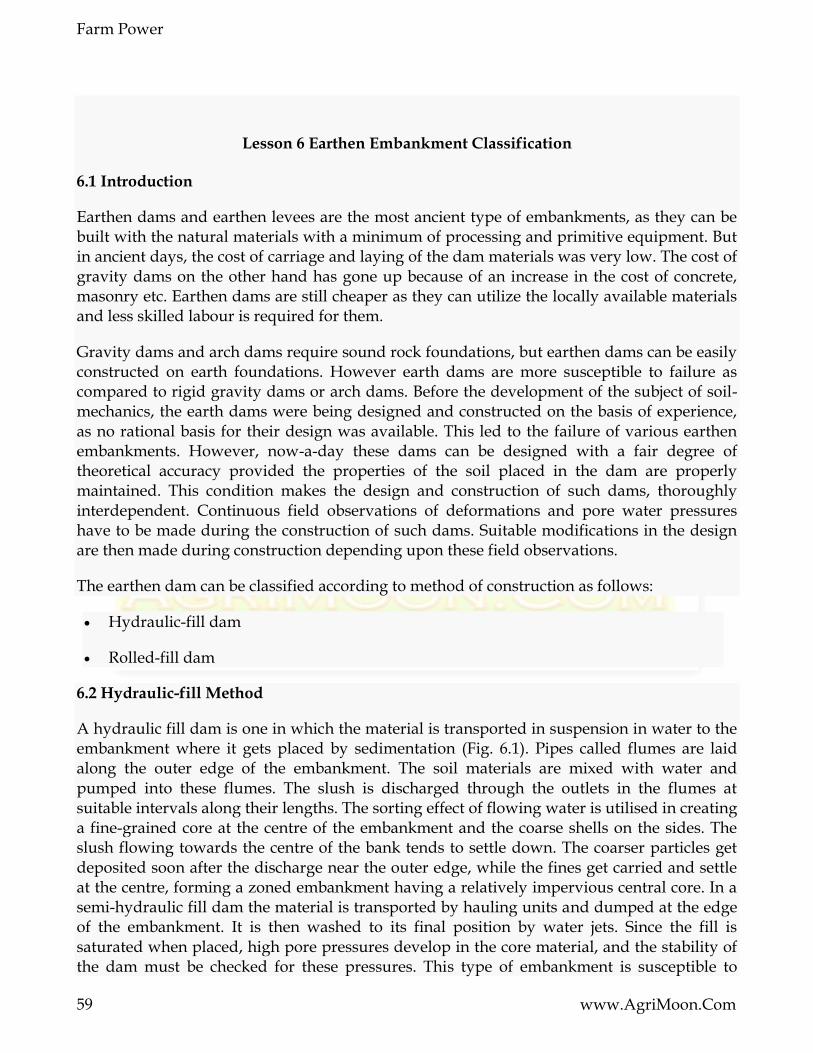
Farm Power
59 www.AgriMoon.Com
Lesson 6 Earthen Embankment Classification
6.1 Introduction
Earthen dams and earthen levees are the most ancient type of embankments, as they can be built with the natural materials with a minimum of processing and primitive equipment. But in ancient days, the cost of carriage and laying of the dam materials was very low. The cost of gravity dams on the other hand has gone up because of an increase in the cost of concrete, masonry etc. Earthen dams are still cheaper as they can utilize the locally available materials and less skilled labour is required for them.
Gravity dams and arch dams require sound rock foundations, but earthen dams can be easily constructed on earth foundations. However earth dams are more susceptible to failure as compared to rigid gravity dams or arch dams. Before the development of the subject of soil-mechanics, the earth dams were being designed and constructed on the basis of experience, as no rational basis for their design was available. This led to the failure of various earthen embankments. However, now-a-day these dams can be designed with a fair degree of theoretical accuracy provided the properties of the soil placed in the dam are properly maintained. This condition makes the design and construction of such dams, thoroughly interdependent. Continuous field observations of deformations and pore water pressures have to be made during the construction of such dams. Suitable modifications in the design are then made during construction depending upon these field observations.
The earthen dam can be classified according to method of construction as follows:
Hydraulic-fill dam
Rolled-fill dam
6.2 Hydraulic-fill Method
A hydraulic fill dam is one in which the material is transported in suspension in water to the embankment where it gets placed by sedimentation (Fig. 6.1). Pipes called flumes are laid along the outer edge of the embankment. The soil materials are mixed with water and pumped into these flumes. The slush is discharged through the outlets in the flumes at suitable intervals along their lengths. The sorting effect of flowing water is utilised in creating a fine-grained core at the centre of the embankment and the coarse shells on the sides. The slush flowing towards the centre of the bank tends to settle down. The coarser particles get deposited soon after the discharge near the outer edge, while the fines get carried and settle at the centre, forming a zoned embankment having a relatively impervious central core. In a semi-hydraulic fill dam the material is transported by hauling units and dumped at the edge of the embankment. It is then washed to its final position by water jets. Since the fill is saturated when placed, high pore pressures develop in the core material, and the stability of the dam must be checked for these pressures. This type of embankment is susceptible to
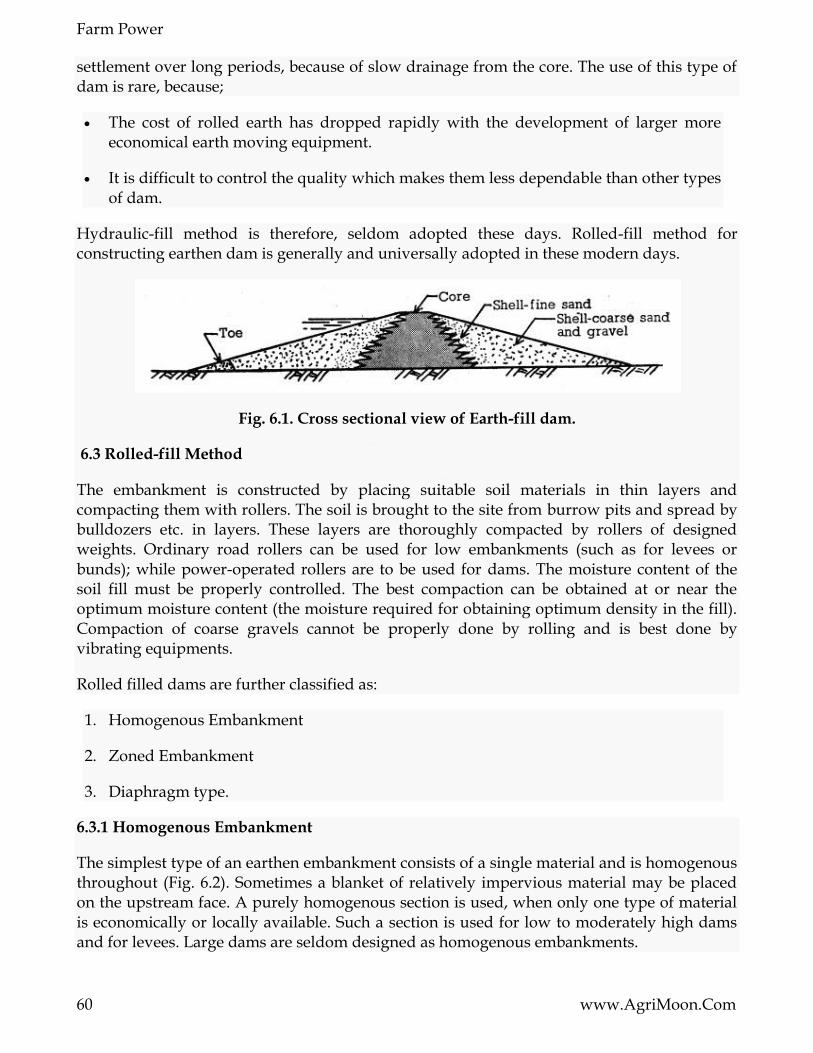
Farm Power
60 www.AgriMoon.Com
settlement over long periods, because of slow drainage from the core. The use of this type of dam is rare, because;
The cost of rolled earth has dropped rapidly with the development of larger more economical earth moving equipment.
It is difficult to control the quality which makes them less dependable than other types of dam.
Hydraulic-fill method is therefore, seldom adopted these days. Rolled-fill method for constructing earthen dam is generally and universally adopted in these modern days.
Fig. 6.1. Cross sectional view of Earth-fill dam.
6.3 Rolled-fill Method
The embankment is constructed by placing suitable soil materials in thin layers and compacting them with rollers. The soil is brought to the site from burrow pits and spread by bulldozers etc. in layers. These layers are thoroughly compacted by rollers of designed weights. Ordinary road rollers can be used for low embankments (such as for levees or bunds); while power-operated rollers are to be used for dams. The moisture content of the soil fill must be properly controlled. The best compaction can be obtained at or near the optimum moisture content (the moisture required for obtaining optimum density in the fill). Compaction of coarse gravels cannot be properly done by rolling and is best done by vibrating equipments.
Rolled filled dams are further classified as:
1. Homogenous Embankment
2. Zoned Embankment
3. Diaphragm type.
6.3.1 Homogenous Embankment
The simplest type of an earthen embankment consists of a single material and is homogenous throughout (Fig. 6.2). Sometimes a blanket of relatively impervious material may be placed on the upstream face. A purely homogenous section is used, when only one type of material is economically or locally available. Such a section is used for low to moderately high dams and for levees. Large dams are seldom designed as homogenous embankments.
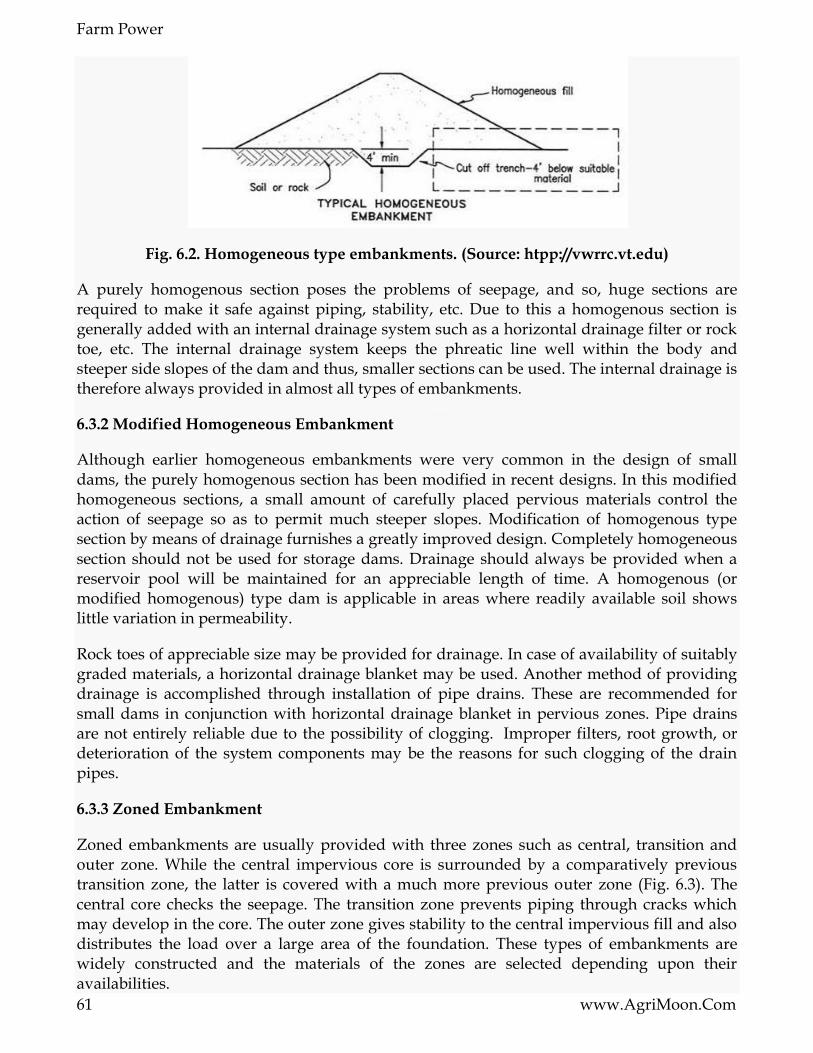
Farm Power
61 www.AgriMoon.Com
Fig. 6.2. Homogeneous type embankments. (Source: htpp://vwrrc.vt.edu)
A purely homogenous section poses the problems of seepage, and so, huge sections are required to make it safe against piping, stability, etc. Due to this a homogenous section is generally added with an internal drainage system such as a horizontal drainage filter or rock toe, etc. The internal drainage system keeps the phreatic line well within the body and steeper side slopes of the dam and thus, smaller sections can be used. The internal drainage is therefore always provided in almost all types of embankments.
6.3.2 Modified Homogeneous Embankment
Although earlier homogeneous embankments were very common in the design of small dams, the purely homogenous section has been modified in recent designs. In this modified homogeneous sections, a small amount of carefully placed pervious materials control the action of seepage so as to permit much steeper slopes. Modification of homogenous type section by means of drainage furnishes a greatly improved design. Completely homogeneous section should not be used for storage dams. Drainage should always be provided when a reservoir pool will be maintained for an appreciable length of time. A homogenous (or modified homogenous) type dam is applicable in areas where readily available soil shows little variation in permeability.
Rock toes of appreciable size may be provided for drainage. In case of availability of suitably graded materials, a horizontal drainage blanket may be used. Another method of providing drainage is accomplished through installation of pipe drains. These are recommended for small dams in conjunction with horizontal drainage blanket in pervious zones. Pipe drains are not entirely reliable due to the possibility of clogging. Improper filters, root growth, or deterioration of the system components may be the reasons for such clogging of the drain pipes.
6.3.3 Zoned Embankment
Zoned embankments are usually provided with three zones such as central, transition and outer zone. While the central impervious core is surrounded by a comparatively previous transition zone, the latter is covered with a much more previous outer zone (Fig. 6.3). The central core checks the seepage. The transition zone prevents piping through cracks which may develop in the core. The outer zone gives stability to the central impervious fill and also distributes the load over a large area of the foundation. These types of embankments are widely constructed and the materials of the zones are selected depending upon their availabilities.
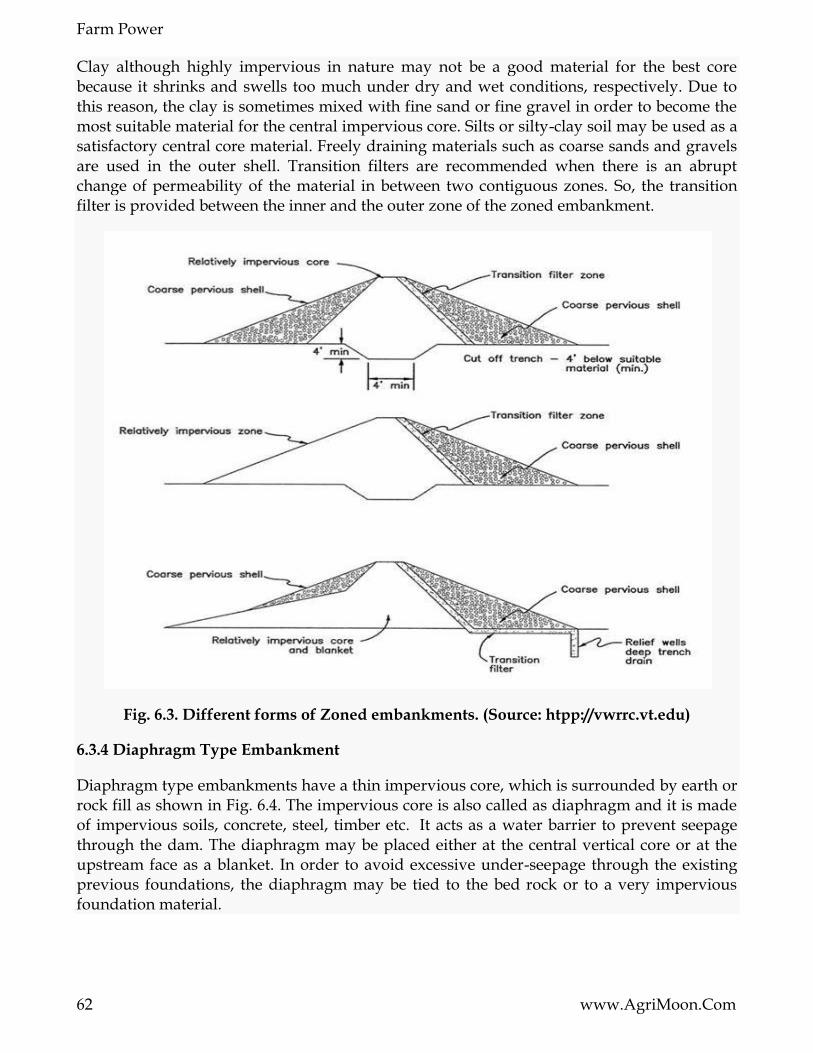
Farm Power
62 www.AgriMoon.Com
Clay although highly impervious in nature may not be a good material for the best core because it shrinks and swells too much under dry and wet conditions, respectively. Due to this reason, the clay is sometimes mixed with fine sand or fine gravel in order to become the most suitable material for the central impervious core. Silts or silty-clay soil may be used as a satisfactory central core material. Freely draining materials such as coarse sands and gravels are used in the outer shell. Transition filters are recommended when there is an abrupt change of permeability of the material in between two contiguous zones. So, the transition filter is provided between the inner and the outer zone of the zoned embankment.
Fig. 6.3. Different forms of Zoned embankments. (Source: htpp://vwrrc.vt.edu)
6.3.4 Diaphragm Type Embankment
Diaphragm type embankments have a thin impervious core, which is surrounded by earth or rock fill as shown in Fig. 6.4. The impervious core is also called as diaphragm and it is made of impervious soils, concrete, steel, timber etc. It acts as a water barrier to prevent seepage through the dam. The diaphragm may be placed either at the central vertical core or at the upstream face as a blanket. In order to avoid excessive under-seepage through the existing previous foundations, the diaphragm may be tied to the bed rock or to a very impervious foundation material.
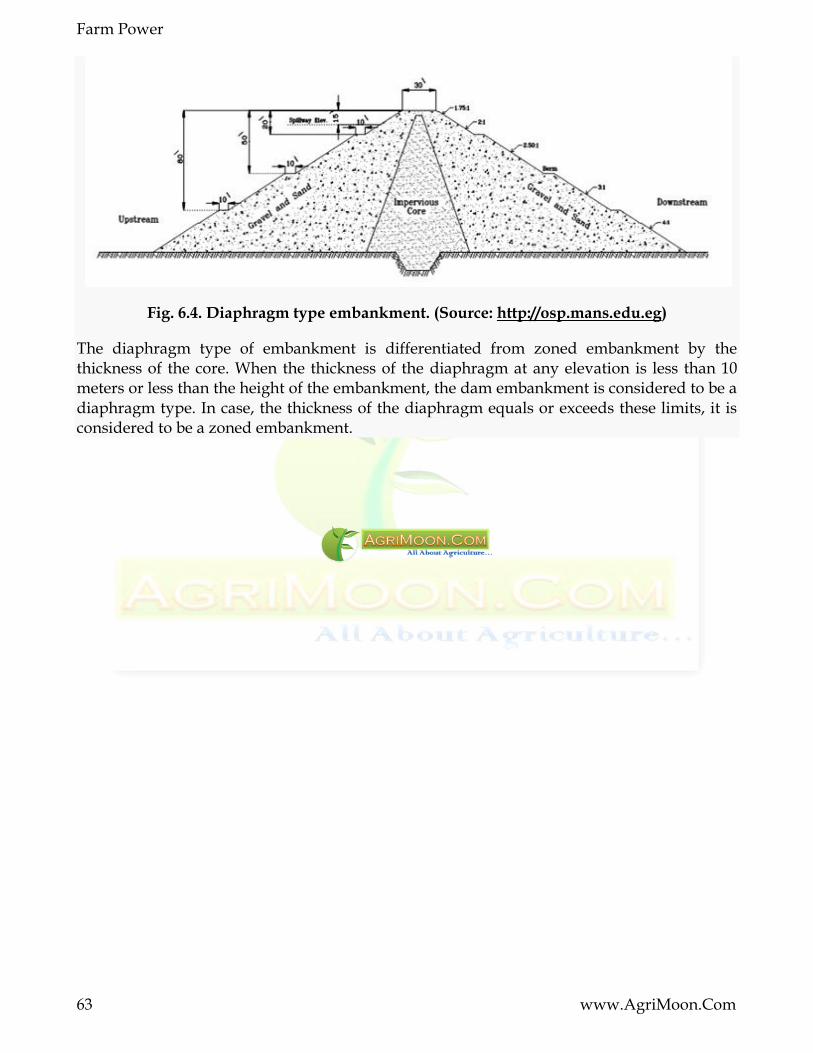
Farm Power
63 www.AgriMoon.Com
Fig. 6.4. Diaphragm type embankment. (Source: http://osp.mans.edu.eg)
The diaphragm type of embankment is differentiated from zoned embankment by the thickness of the core. When the thickness of the diaphragm at any elevation is less than 10 meters or less than the height of the embankment, the dam embankment is considered to be a diaphragm type. In case, the thickness of the diaphragm equals or exceeds these limits, it is considered to be a zoned embankment.

Farm Power
64 www.AgriMoon.Com
Module 2: Basic Design Aspect of Reservoir and Farm Pond
Lesson 7 Components of Embankment
The functions and design requirements of the components of embankment dams are discussed below:
7.1 Cutoff Trenches
Most of the embankment dams can benefit from the construction of a cutoff in the foundation. A cutoff serves the following purposes:
a) It reduces the seepage loss of stored water through foundations and abutments
b) It prevents subsurface erosion by piping
c) It improves the stability of the dam
These trenches are classified into two general types such as sloping-side trenches and vertical-side trenches. The cutoff trench should be located upstream from the centerline of the crest of dam, but not beyond a point where the cover of impervious embankment above the trench will fail to provide resistance to percolation at least equal to that offered by the trench itself. The centerline of this trench should be kept parallel to the centerline to the dam across the canyon bottom or valley floor. However, it should converge towards the centerline of the dam as it is carried up the abutments in order to maintain the required embankment cover. Whenever economically feasible, the seepage through a pervious foundation should be cut off by a trench extending to bedrock or other impervious stratum. This is the most positive means of controlling the amount of seepage and ensures no difficulty while piping through the foundation or by uplift pressure at the downstream toe.
The type of cut-off should be decided on the basis of detailed geological investigations. It is desirable to provide a positive cut-off. Where this is not possible, partial cutoff with or without upstream impervious blanket may be provided. In some cases, adequate drainage arrangements may be provided on the downstream which may, inter-alia, includes relief well. Cut-off may be in the form of trench, sheet piling, cement-bound curation, diaphragm of bentonite clay, concrete or other impervious materials.
7.2 Core
The core provides impermeable barrier within the body of the dam. Impervious soils are generally suitable for the core. IS: 1498-1970+ may be referred to for suitability of soils for the core. However, highly compressible soils with high liquid limit and organic content may be avoided for the core as they are prone to swelling and formation of cracks.
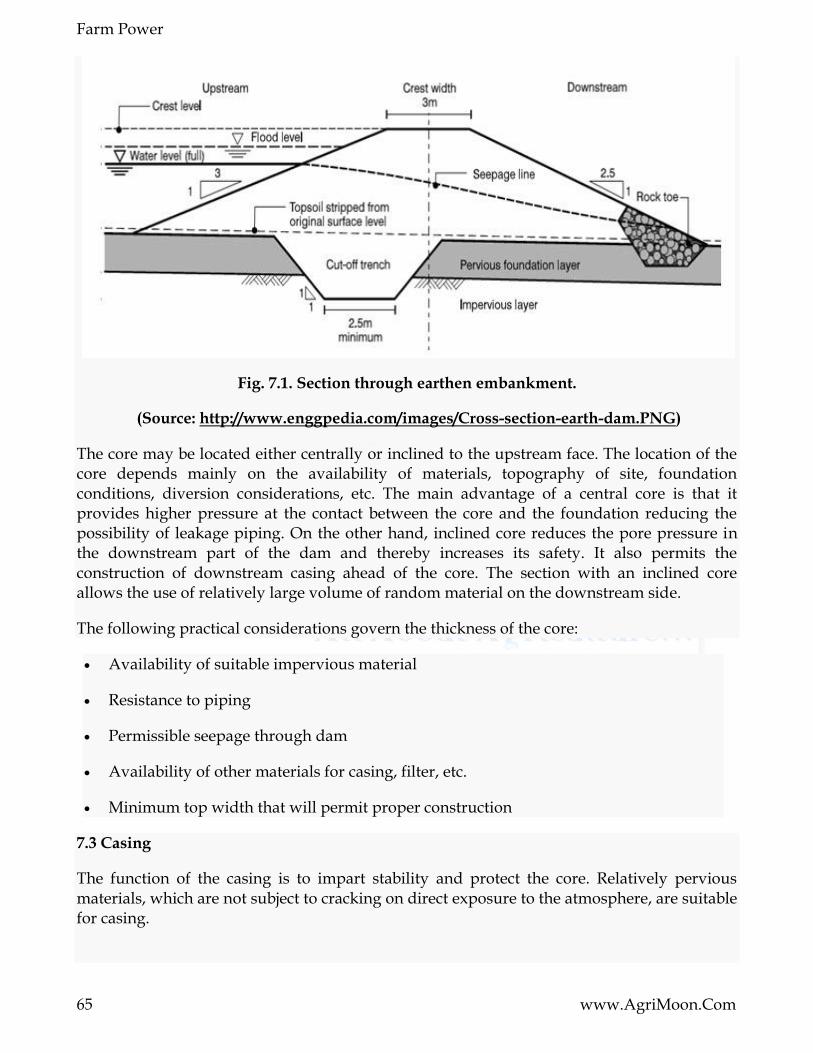
Farm Power
65 www.AgriMoon.Com
Fig. 7.1. Section through earthen embankment.
(Source: http://www.enggpedia.com/images/Cross-section-earth-dam.PNG)
The core may be located either centrally or inclined to the upstream face. The location of the core depends mainly on the availability of materials, topography of site, foundation conditions, diversion considerations, etc. The main advantage of a central core is that it provides higher pressure at the contact between the core and the foundation reducing the possibility of leakage piping. On the other hand, inclined core reduces the pore pressure in the downstream part of the dam and thereby increases its safety. It also permits the construction of downstream casing ahead of the core. The section with an inclined core allows the use of relatively large volume of random material on the downstream side.
The following practical considerations govern the thickness of the core:
Availability of suitable impervious material
Resistance to piping
Permissible seepage through dam
Availability of other materials for casing, filter, etc.
Minimum top width that will permit proper construction
7.3 Casing
The function of the casing is to impart stability and protect the core. Relatively pervious materials, which are not subject to cracking on direct exposure to the atmosphere, are suitable for casing.
Farm Power
66 www.AgriMoon.Com
7.4 Internal Drainage System
Internal drainage system comprises an inclined vertical filter, a horizontal filter, a rock toe and a toe drain etc. As far as possible, locally available sands and gravels should be used for this purpose.
The design of filter consists of applying the conventional filter criteria which take into account only the grain size distribution and the shape of grains. However, in addition to the grain size, the stability of base soil adjacent to a given filter depends on its resistance to drag forces. In view of this, when the soil containing 20% or more clay is used as base soil and has non-dispersive properties, the filter criteria may not be enforced strictly and the clean sand available locally may be used irrespective of the gradation. This relaxation should be applied to dams up to 10 m height only. For dams of height more than 10 m, the criteria for filters protecting cohesive soil may be relaxed by the designer depending upon his judgment and experience.
Inclined or vertical filter together with the base filter, if required, is desirable to be provided especially to protect silty core material. However, the inclined or vertical filter may be deleted in zoned sections having pervious downstream shell and clayey cores. Moreover, transition filter between the core and the downstream shell would be necessary in case of dam where rock fill is used as shell material. In case of dam reaches, where the head of water is 3 m or less, it may not be necessary to provide blanket or chimney filters. In this case, adequate toe protection shall, however, be provided.
Wherever silt material is to be filled in the cut-off and the downstream face of the cut-off is sufficiently open to receive soil particles migrating under high seepage gradients, it is advisable to provide a protective filter layer along the downstream face of the cut-off trench also.
Grouting of foundation is a process of injecting a fluid sealing material under pressure into the underlying formations through specially drilled holes for the purpose of sealing off or filling joint seams, fissures, or other openings. Unless the geologic conditions dictate otherwise, the foundation should be grouted to a depth below the surface of the rock equal to the reservoir head which lies above the surface of the rock.
The grouting of a dam foundation is usually performed along a single line of grout holes, with center to center distance of 10 to 20 feet. It creates a deep, impermeable water barrier referred to as "ground curtain". Multiple lines of grout holes may be used when severely fractured or highly permeable rock is encountered.
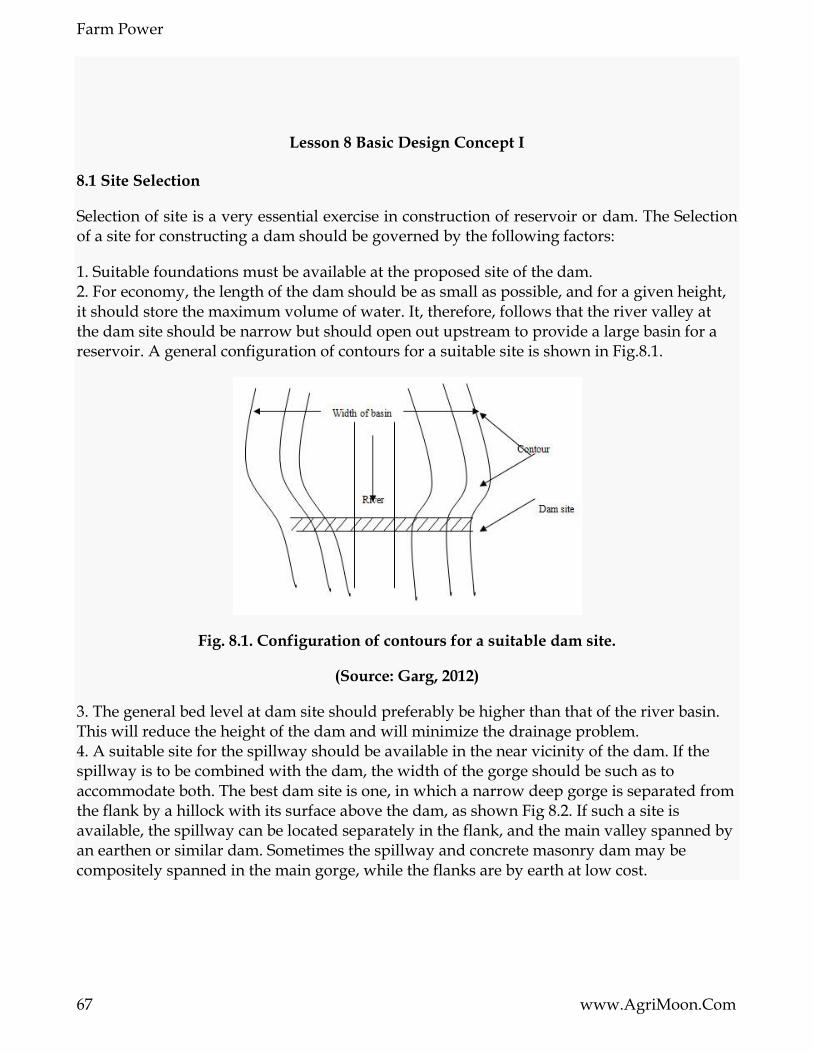
Farm Power
67 www.AgriMoon.Com
Lesson 8 Basic Design Concept I
8.1 Site Selection
Selection of site is a very essential exercise in construction of reservoir or dam. The Selection of a site for constructing a dam should be governed by the following factors:
1. Suitable foundations must be available at the proposed site of the dam. 2. For economy, the length of the dam should be as small as possible, and for a given height, it should store the maximum volume of water. It, therefore, follows that the river valley at the dam site should be narrow but should open out upstream to provide a large basin for a reservoir. A general configuration of contours for a suitable site is shown in Fig.8.1.
Fig. 8.1. Configuration of contours for a suitable dam site.
(Source: Garg, 2012)
3. The general bed level at dam site should preferably be higher than that of the river basin. This will reduce the height of the dam and will minimize the drainage problem. 4. A suitable site for the spillway should be available in the near vicinity of the dam. If the spillway is to be combined with the dam, the width of the gorge should be such as to accommodate both. The best dam site is one, in which a narrow deep gorge is separated from the flank by a hillock with its surface above the dam, as shown Fig 8.2. If such a site is available, the spillway can be located separately in the flank, and the main valley spanned by an earthen or similar dam. Sometimes the spillway and concrete masonry dam may be compositely spanned in the main gorge, while the flanks are by earth at low cost.

Farm Power
68 www.AgriMoon.Com
Fig. 8.2. Criterion for dam site. (Source: Garg, 2012)
5. Materials required for the construction of dam should be easily available in the locality so that the cost of transportation remains as low as possible. 6. The reservoir basin should be reasonably water tight. The stored water should not escape out through its side walls and bed. 7. The value of land and property likely to be submerged by the proposed dam should be as low as possible. 8. The dam site should have an easy access to important towns and cities by rails, roads, etc. 9. Site for establishing labour colonies with a healthy environment should be available at the proximity of the dam site.
8.2 General Design Considerations for Earth Dam
1. A fill of sufficiently low permeability should be developed out of the available materials, so as to best serve the intended purpose with minimum cost. Borrow pits should be as close to the dam site as possible, so as to reduce the leads.
2. Spillway and outlet capacities should be sufficient enough to avoid the possibility of overtopping during design flood.
3. Sufficient freeboard must be provided for wind set-up, wave action, frost action and earthquake motions.
4. The seepage line should remain well within the downstream face of the dam, so that no sloughing off the face occurs.
5. There should not be any possibility of free flow of water from the upstream to the downstream face.
6. The upstream face should be properly protected against wave action. The downstream face should be protected against rains and wave action due to tail water. Provisions of horizontal berms at suitable intervals in the downstream face may be thought of, so as to reduce the erosion due to direct flow of rain water. Ripraps should be provided on the entire upstream face, downstream slope near the toe and slightly above the tail water so as to avoid erosion.
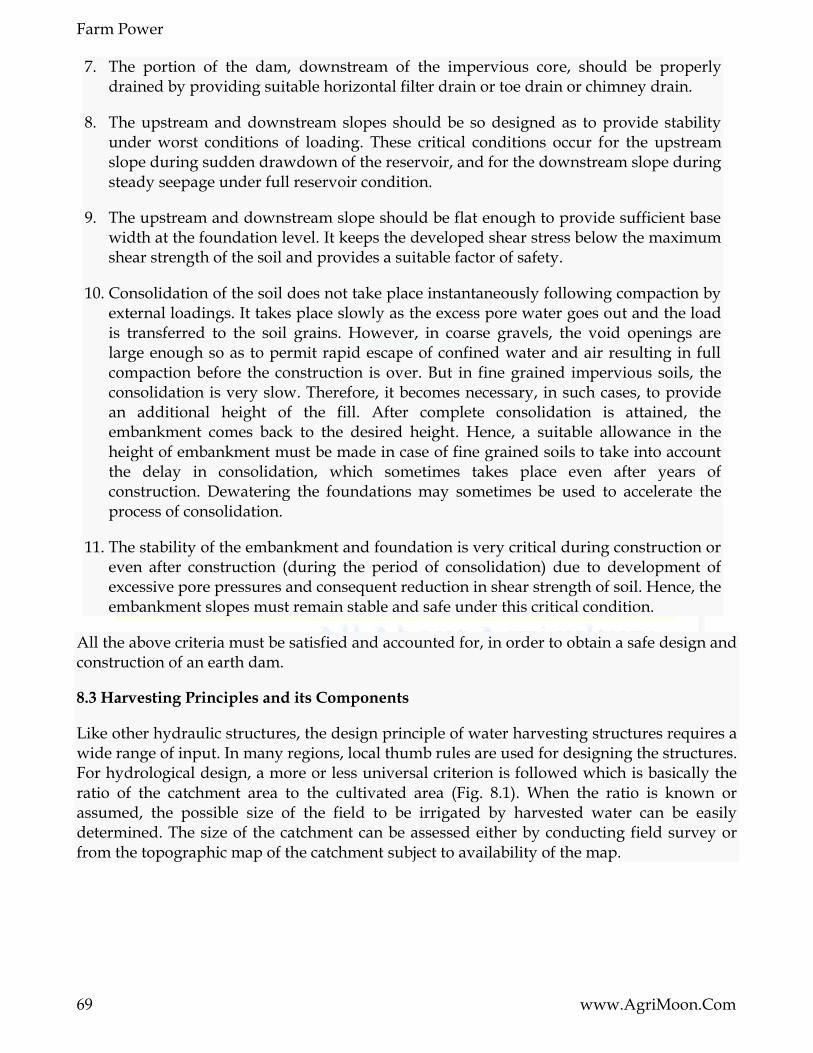
Farm Power
69 www.AgriMoon.Com
7. The portion of the dam, downstream of the impervious core, should be properly drained by providing suitable horizontal filter drain or toe drain or chimney drain.
8. The upstream and downstream slopes should be so designed as to provide stability under worst conditions of loading. These critical conditions occur for the upstream slope during sudden drawdown of the reservoir, and for the downstream slope during steady seepage under full reservoir condition.
9. The upstream and downstream slope should be flat enough to provide sufficient base width at the foundation level. It keeps the developed shear stress below the maximum shear strength of the soil and provides a suitable factor of safety.
10. Consolidation of the soil does not take place instantaneously following compaction by external loadings. It takes place slowly as the excess pore water goes out and the load is transferred to the soil grains. However, in coarse gravels, the void openings are large enough so as to permit rapid escape of confined water and air resulting in full compaction before the construction is over. But in fine grained impervious soils, the consolidation is very slow. Therefore, it becomes necessary, in such cases, to provide an additional height of the fill. After complete consolidation is attained, the embankment comes back to the desired height. Hence, a suitable allowance in the height of embankment must be made in case of fine grained soils to take into account the delay in consolidation, which sometimes takes place even after years of construction. Dewatering the foundations may sometimes be used to accelerate the process of consolidation.
11. The stability of the embankment and foundation is very critical during construction or even after construction (during the period of consolidation) due to development of excessive pore pressures and consequent reduction in shear strength of soil. Hence, the embankment slopes must remain stable and safe under this critical condition.
All the above criteria must be satisfied and accounted for, in order to obtain a safe design and construction of an earth dam.
8.3 Harvesting Principles and its Components
Like other hydraulic structures, the design principle of water harvesting structures requires a wide range of input. In many regions, local thumb rules are used for designing the structures. For hydrological design, a more or less universal criterion is followed which is basically the ratio of the catchment area to the cultivated area (Fig. 8.1). When the ratio is known or assumed, the possible size of the field to be irrigated by harvested water can be easily determined. The size of the catchment can be assessed either by conducting field survey or from the topographic map of the catchment subject to availability of the map.
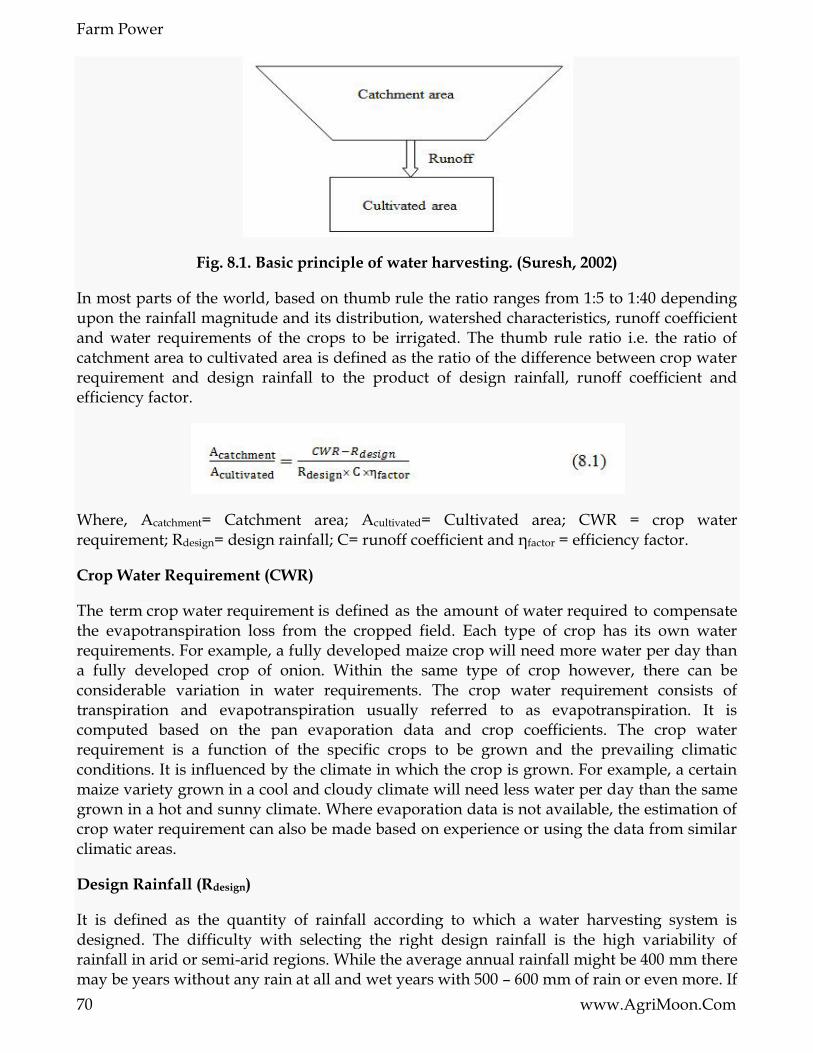
Farm Power
70 www.AgriMoon.Com
Fig. 8.1. Basic principle of water harvesting. (Suresh, 2002)
In most parts of the world, based on thumb rule the ratio ranges from 1:5 to 1:40 depending upon the rainfall magnitude and its distribution, watershed characteristics, runoff coefficient and water requirements of the crops to be irrigated. The thumb rule ratio i.e. the ratio of catchment area to cultivated area is defined as the ratio of the difference between crop water requirement and design rainfall to the product of design rainfall, runoff coefficient and efficiency factor.
Where, Acatchment= Catchment area; Acultivated= Cultivated area; CWR = crop water requirement; Rdesign= design rainfall; C= runoff coefficient and ηfactor = efficiency factor.
Crop Water Requirement (CWR)
The term crop water requirement is defined as the amount of water required to compensate the evapotranspiration loss from the cropped field. Each type of crop has its own water requirements. For example, a fully developed maize crop will need more water per day than a fully developed crop of onion. Within the same type of crop however, there can be considerable variation in water requirements. The crop water requirement consists of transpiration and evapotranspiration usually referred to as evapotranspiration. It is computed based on the pan evaporation data and crop coefficients. The crop water requirement is a function of the specific crops to be grown and the prevailing climatic conditions. It is influenced by the climate in which the crop is grown. For example, a certain maize variety grown in a cool and cloudy climate will need less water per day than the same grown in a hot and sunny climate. Where evaporation data is not available, the estimation of crop water requirement can also be made based on experience or using the data from similar climatic areas.
Design Rainfall (Rdesign)
It is defined as the quantity of rainfall according to which a water harvesting system is designed. The difficulty with selecting the right design rainfall is the high variability of rainfall in arid or semi-arid regions. While the average annual rainfall might be 400 mm there may be years without any rain at all and wet years with 500 – 600 mm of rain or even more. If
Farm Power
71 www.AgriMoon.Com
the actual rainfall is less than the design rainfall, the catchment area will not produce enough runoff to satisfy the crop water requirements; if the actual rainfall exceeds the design rainfall there will be too much runoff which may cause damage to the water harvesting structure. It is also expressed as the rainfall amount which may be expected during a rainy season with a probability of occurrence of 33%. The water supply is said to be inadequate if the rainfall in a given season does not exceed the design rainfall. On the other hand, when rainfall in a rainy season exceeds the design rainfall, it is called surplus water and required to be drained out from the crop area or harvested for reuse in during dry spells.
Runoff Coefficient
It denotes the percent of rainfall which flows down the slope as surface runoff. The proportion of total rainfall which becomes runoff is called the runoff coefficient. A runoff coefficient of 0.20 means 20% of all rainfall during the growing season becomes runoff. Every individual rainstorm has its own runoff coefficient. However, the seasonal or annual runoff coefficient is important for the design of a water harvesting system. It is a function of degree of land slope, soil type and geology, vegetative cover, antecedent rain and rainfall intensity. he coefficient can also be derived from the rainfall and stream flow data.
Efficiency Factor
The runoff water from the catchment area is collected on the cultivated area and infiltrates into the soil. Not all the ponded runoff water can be used by the crop because some of the water is lost by evaporation and deep percolation. The utilization of the harvested water by the crop is called the efficiency of the water harvesting system and is expressed as an efficiency factor. An efficiency factor of 0.75 means 75% of the harvested water is actually used by the crop. The remaining 25% is lost. Efficiency is higher when the cultivated area is leveled. As a rule of thumb, the efficiency factor ranges from 0.5 to 0.75. When the measured data are not available, the only way to estimate the factor is on the basis of experience: trial and error. It is a factor, determined by taking into account the difference of rainfall pattern and the rate of water consumption by the crop.
Farm Power
72 www.AgriMoon.Com
Lesson 9 Basic Design Concept II
9.1 Catchment and Reservoir Yield
Total yearly runoff, expressed as the volume of water passing through the outlet point of the catchment, is thus known as the catchment yield, and is expressed in Mm3 or M.ha-m. Generally, a period of one year is considered for determining the catchment yield.
The annual yield of the catchment up to the site of a reservoir, located at the given point along a river, will thus indicate the quantum of water that will annually enter the reservoir, and will thus help in designing the capacity of the reservoir. This will also help to fix the outflows, which are dependent upon the inflows and the reservoir losses.
The amount of water that can be drawn from a reservoir, in any specified time interval, called the reservoir yield, naturally depends upon the inflow into the reservoir and the reservoir losses, consisting of reservoir leakage and reservoir evaporation.
The annual inflow to the reservoir, i.e. the catchment yield, is represented by the mass curve of inflow; whereas, the outflow from the reservoir, called the reservoir yield, is represented by the mass demand line or the mass curve of outflow. Both these curves decide the reservoir capacity, provided the reservoir losses are ignored or separately accounted.
The inflows to the reservoir are however, quite susceptible to variations in land use and land cover changes in the catchment in different years, and may, therefore, vary throughout the prospective life of the reservoir. The past available data of rainfall or runoff in the catchment is, therefore, used to work out the optimum value of the catchment yield. Say, for example, in the past available records of say, 35 years, the minimum yield from the catchment in the worst rainfall year may be as low as say, 100 M.ha-m; whereas the maximum yield in the best rainfall year may be as high as say, 200 M.ha-m. The question then arises, whether the reservoir capacity should correspond to 100 or 200 M.ha-m yield . If the reservoir capacity is provided corresponding to 100 M.ha-m yield, then eventually the reservoir will be filled up every year with a dependability of 100%; but if the capacity is provided corresponding to 200 M.ha-m yield, then eventually the reservoir will be filled up only in the best rainfall year (i.e. once in 35 years) with a dependability of about ×100=3%.
In order to obtain a reasonable agreement, an intermediate dependability percentage value, such as 50 to 75%, may be used to compute the dependable yield or the design yield. The yield, which corresponds to the worst or the most critical year on record, however is called the firm yield or the safe yield. Water available in excess of the firm yield during years of higher inflows, is designated as the secondary yield. Hydropower may be developed from such secondary water. The arithmetic average of the firm yield and the secondary yield is called the average yield.
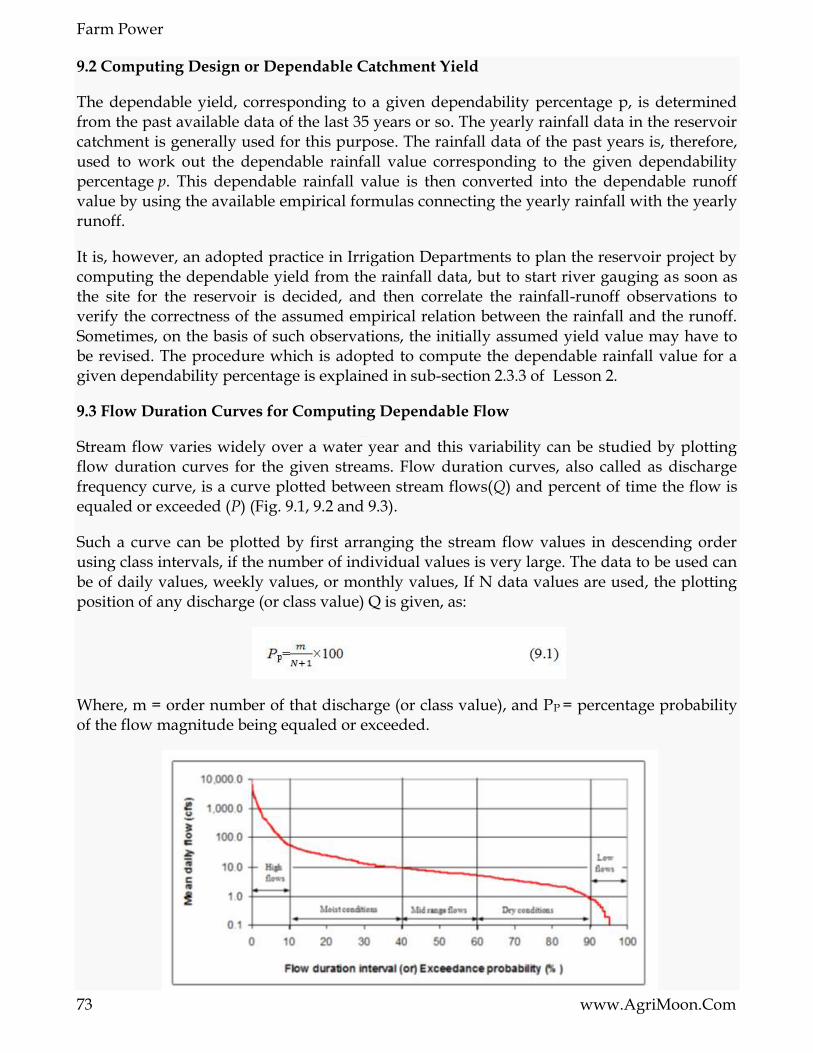
Farm Power
73 www.AgriMoon.Com
9.2 Computing Design or Dependable Catchment Yield
The dependable yield, corresponding to a given dependability percentage p, is determined from the past available data of the last 35 years or so. The yearly rainfall data in the reservoir catchment is generally used for this purpose. The rainfall data of the past years is, therefore, used to work out the dependable rainfall value corresponding to the given dependability percentage p. This dependable rainfall value is then converted into the dependable runoff value by using the available empirical formulas connecting the yearly rainfall with the yearly runoff.
It is, however, an adopted practice in Irrigation Departments to plan the reservoir project by computing the dependable yield from the rainfall data, but to start river gauging as soon as the site for the reservoir is decided, and then correlate the rainfall-runoff observations to verify the correctness of the assumed empirical relation between the rainfall and the runoff. Sometimes, on the basis of such observations, the initially assumed yield value may have to be revised. The procedure which is adopted to compute the dependable rainfall value for a given dependability percentage is explained in sub-section 2.3.3 of Lesson 2.
9.3 Flow Duration Curves for Computing Dependable Flow
Stream flow varies widely over a water year and this variability can be studied by plotting flow duration curves for the given streams. Flow duration curves, also called as discharge frequency curve, is a curve plotted between stream flows(Q) and percent of time the flow is equaled or exceeded (P) (Fig. 9.1, 9.2 and 9.3).
Such a curve can be plotted by first arranging the stream flow values in descending order using class intervals, if the number of individual values is very large. The data to be used can be of daily values, weekly values, or monthly values, If N data values are used, the plotting position of any discharge (or class value) Q is given, as:
Where, m = order number of that discharge (or class value), and PP = percentage probability of the flow magnitude being equaled or exceeded.
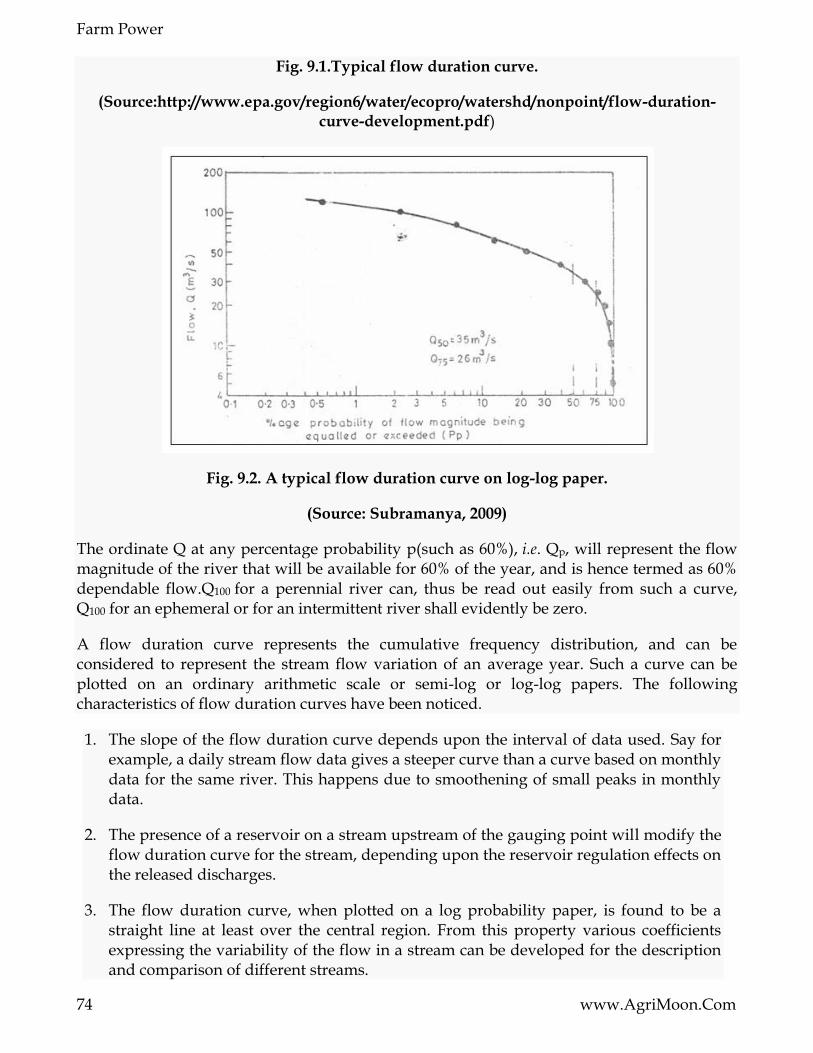
Farm Power
74 www.AgriMoon.Com
Fig. 9.1.Typical flow duration curve.
(Source:http://www.epa.gov/region6/water/ecopro/watershd/nonpoint/flow-duration-curve-development.pdf)
Fig. 9.2. A typical flow duration curve on log-log paper.
(Source: Subramanya, 2009)
The ordinate Q at any percentage probability p(such as 60%), i.e. Qp, will represent the flow magnitude of the river that will be available for 60% of the year, and is hence termed as 60% dependable flow.Q100 for a perennial river can, thus be read out easily from such a curve, Q100 for an ephemeral or for an intermittent river shall evidently be zero.
A flow duration curve represents the cumulative frequency distribution, and can be considered to represent the stream flow variation of an average year. Such a curve can be plotted on an ordinary arithmetic scale or semi-log or log-log papers. The following characteristics of flow duration curves have been noticed.
1. The slope of the flow duration curve depends upon the interval of data used. Say for example, a daily stream flow data gives a steeper curve than a curve based on monthly data for the same river. This happens due to smoothening of small peaks in monthly data.
2. The presence of a reservoir on a stream upstream of the gauging point will modify the flow duration curve for the stream, depending upon the reservoir regulation effects on the released discharges.
3. The flow duration curve, when plotted on a log probability paper, is found to be a straight line at least over the central region. From this property various coefficients expressing the variability of the flow in a stream can be developed for the description and comparison of different streams.
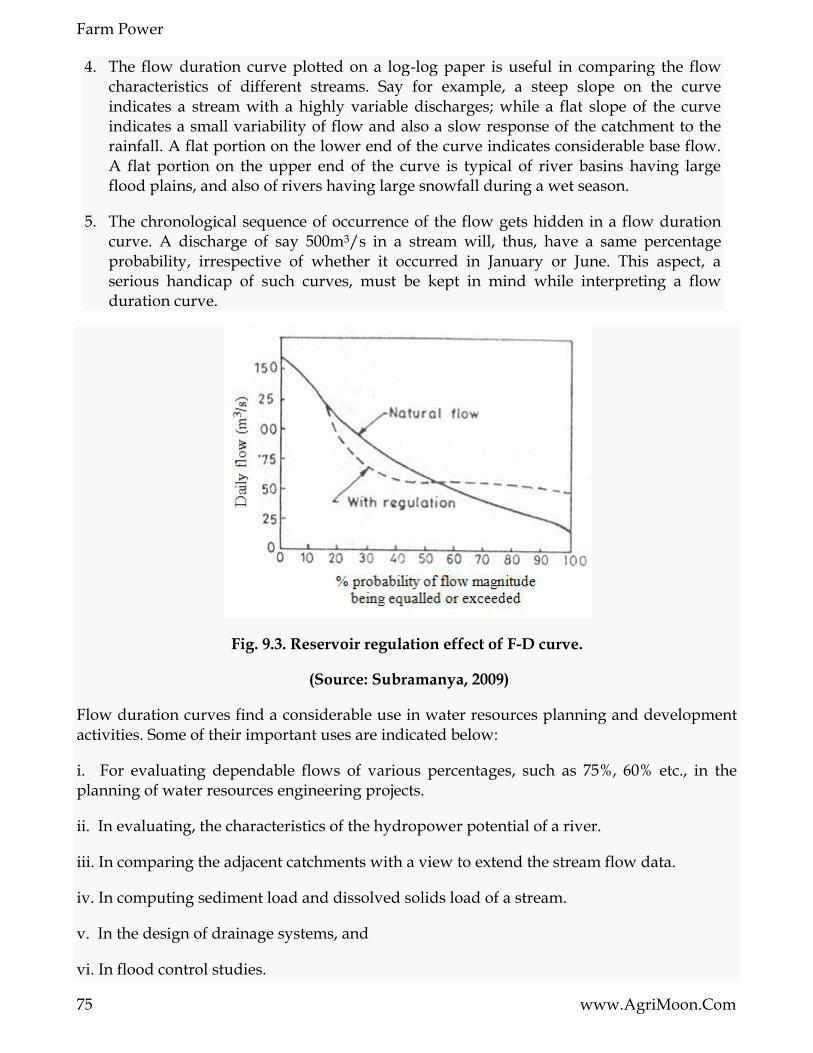
Farm Power
75 www.AgriMoon.Com
4. The flow duration curve plotted on a log-log paper is useful in comparing the flow characteristics of different streams. Say for example, a steep slope on the curve indicates a stream with a highly variable discharges; while a flat slope of the curve indicates a small variability of flow and also a slow response of the catchment to the rainfall. A flat portion on the lower end of the curve indicates considerable base flow. A flat portion on the upper end of the curve is typical of river basins having large flood plains, and also of rivers having large snowfall during a wet season.
5. The chronological sequence of occurrence of the flow gets hidden in a flow duration curve. A discharge of say 500m3/s in a stream will, thus, have a same percentage probability, irrespective of whether it occurred in January or June. This aspect, a serious handicap of such curves, must be kept in mind while interpreting a flow duration curve.
Fig. 9.3. Reservoir regulation effect of F-D curve.
(Source: Subramanya, 2009)
Flow duration curves find a considerable use in water resources planning and development activities. Some of their important uses are indicated below:
i. For evaluating dependable flows of various percentages, such as 75%, 60% etc., in the planning of water resources engineering projects.
ii. In evaluating, the characteristics of the hydropower potential of a river.
iii. In comparing the adjacent catchments with a view to extend the stream flow data.
iv. In computing sediment load and dissolved solids load of a stream.
v. In the design of drainage systems, and
vi. In flood control studies.
Farm Power
76 www.AgriMoon.Com
Lesson 10 Design of Dam Components
Failure of a number of earthen dams is due to faulty design. The design of different components of earthen dam has been narrated in this lesson. This will help in better understanding of design of dams and dam failures.
A dam exceeding 15m in height above deepest river bed level is defined as large dam. Also a dam in between 10 to 15 m height is termed as large dam if the volume of earth dam exceeds 0.75 million cum. and storage exceeds one million cum. or the maximum flood discharge exceeds 2000 m3/s. A dam not satisfying the above criterion of large dam is termed as small dam.
Design of Earthen Dam Components
The preliminary design of an earthen dam is done on the basis of past experience on similar types of dams. The empirical formulae are also used for the purpose. Design of the following components of an earthen dam is given prime importance before execution.
The main components of the earth dam are described below:
Top width
Free board
Cut-off trench
Central impervious core
Casing or outer shell
Internal drainage system and foundations
Slope protection
Surface drainage
Impervious blanket
Design of spillway
10.1 Top Width
The top width of earthen dam is decided based on the following points:
Nature of fill material used for construction and minimum allowable percolation limit through embankment at normal reservoir level.
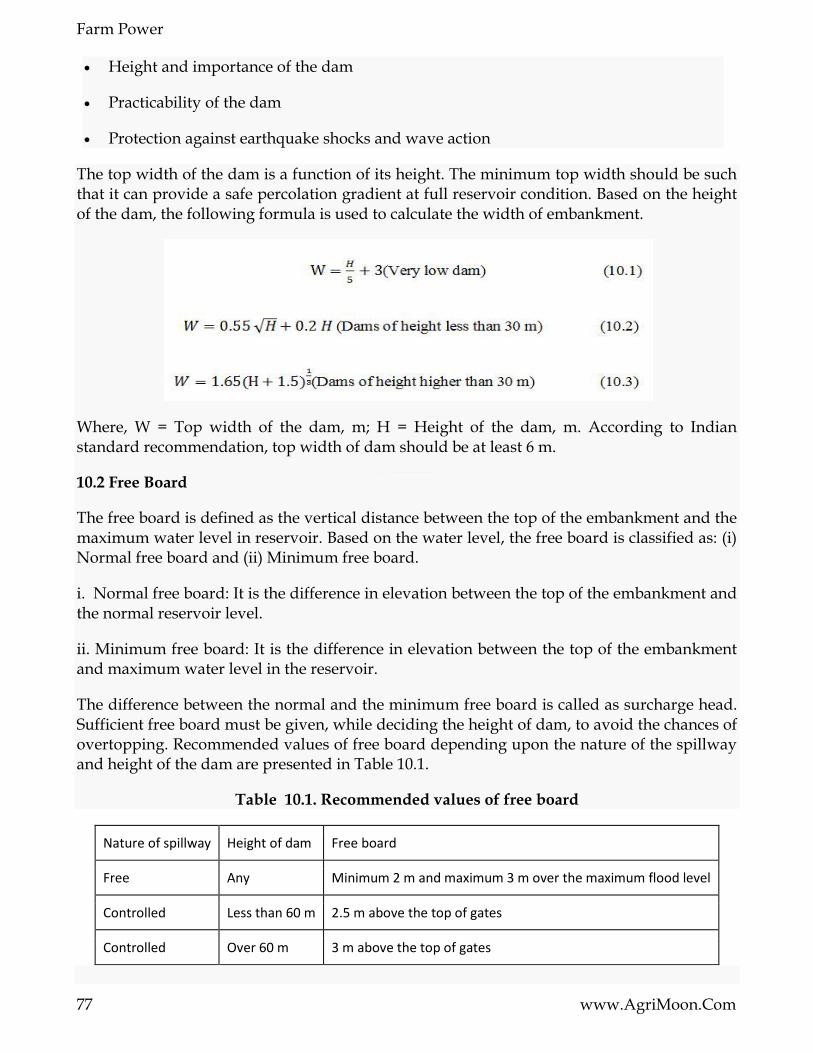
Farm Power
77 www.AgriMoon.Com
Height and importance of the dam
Practicability of the dam
Protection against earthquake shocks and wave action
The top width of the dam is a function of its height. The minimum top width should be such that it can provide a safe percolation gradient at full reservoir condition. Based on the height of the dam, the following formula is used to calculate the width of embankment.
Where, W = Top width of the dam, m; H = Height of the dam, m. According to Indian standard recommendation, top width of dam should be at least 6 m.
10.2 Free Board
The free board is defined as the vertical distance between the top of the embankment and the maximum water level in reservoir. Based on the water level, the free board is classified as: (i) Normal free board and (ii) Minimum free board.
i. Normal free board: It is the difference in elevation between the top of the embankment and the normal reservoir level.
ii. Minimum free board: It is the difference in elevation between the top of the embankment and maximum water level in the reservoir.
The difference between the normal and the minimum free board is called as surcharge head. Sufficient free board must be given, while deciding the height of dam, to avoid the chances of overtopping. Recommended values of free board depending upon the nature of the spillway and height of the dam are presented in Table 10.1.
Table 10.1. Recommended values of free board
Nature of spillway Height of dam Free board
Free Any Minimum 2 m and maximum 3 m over the maximum flood level
Controlled Less than 60 m 2.5 m above the top of gates
Controlled Over 60 m 3 m above the top of gates

Farm Power
78 www.AgriMoon.Com
10.3 Cutoff Trench
The main function of cutoff trench in earth fill dam is to reduce the loss of stored water in the reservoir, from the seepage flow through foundation and its abutment. Furthermore it also prevents the sub surface erosion caused by piping action. The type of cut off should be decided on the basis of detailed geological investigations. It is desirable to provide positive cut off. Where this is not possible, partial cut off with or without upstream impervious blanket may be provided. In any case, adequate drainage arrangements may be provided on the downstream. The following guidelines may be adopted for design of cut off.
The cut off shall be located such that its centre line should be within the base of impervious core and should be upstream of centre line of dam.
The positive cut off should be keyed at least to a depth of 0.4 m into continuous impervious sub-stratum or non-erodible rock formation.
A minimum bottom width of 4.0 metre is recommended.
Side slopes of at least 1:1 or flatter may be provided in case of overburden while 1/2:1 and 1/4:1 may be provided in soft rock and hard rock respectively.
The back fill material for cut off trench shall have same properties as those specified for impervious core.
The cut off in the flanks on either side should normally extend up to the top of impervious core.
If cut off trench is terminated in rock formation which is weathered or have cracks, joints and crevices; and if percolation test exhibit a lugeon value of more than 10(refer IS 6066-1984), then rock foundation below the bed of cut off trench should be grouted.
Most dams, homogenous or zoned, can benefit from the construction of a cutoff in the foundation. A cutoff will reduce seepage and improve stability. Whether stable clay or other material is being used, the cutoff trench must be excavated to a depth that will minimize all possible seepage. Ideally, the cutoff trench should be dug down to solid rock that extends to great depths. If underlying rock is fissured or uneven it can be cleaned off and concreted to offer a good surface on which the clay can be laid. For larger indentations or cracks, slush grouting should be used, which is a thick slurry mix of cement and water poured and broomed into the larger cracks and fissures before any concrete is laid to fill the remaining indentations and to offer an eventual mostly flat surface. For more even surfaces with smaller cracks, a cement wash (a weaker mix of cement and water to form a creamy texture) can be brushed across a surface to seal it and again establish a mostly flat surface layer.
Generally a minimum width of 4 m is recommended however, an adequate width of cutoff trench for small dams can be determined using following formula:
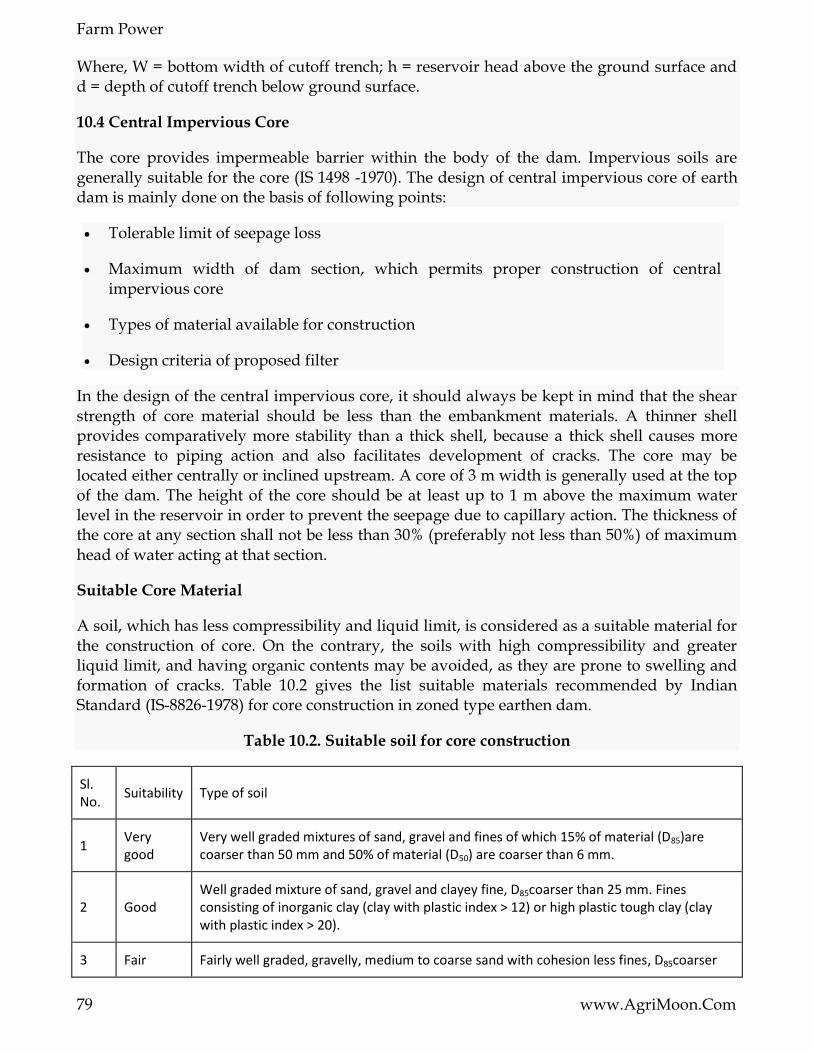
Farm Power
79 www.AgriMoon.Com
Where, W = bottom width of cutoff trench; h = reservoir head above the ground surface and d = depth of cutoff trench below ground surface.
10.4 Central Impervious Core
The core provides impermeable barrier within the body of the dam. Impervious soils are generally suitable for the core (IS 1498 -1970). The design of central impervious core of earth dam is mainly done on the basis of following points:
Tolerable limit of seepage loss
Maximum width of dam section, which permits proper construction of central impervious core
Types of material available for construction
Design criteria of proposed filter
In the design of the central impervious core, it should always be kept in mind that the shear strength of core material should be less than the embankment materials. A thinner shell provides comparatively more stability than a thick shell, because a thick shell causes more resistance to piping action and also facilitates development of cracks. The core may be located either centrally or inclined upstream. A core of 3 m width is generally used at the top of the dam. The height of the core should be at least up to 1 m above the maximum water level in the reservoir in order to prevent the seepage due to capillary action. The thickness of the core at any section shall not be less than 30% (preferably not less than 50%) of maximum head of water acting at that section.
Suitable Core Material
A soil, which has less compressibility and liquid limit, is considered as a suitable material for the construction of core. On the contrary, the soils with high compressibility and greater liquid limit, and having organic contents may be avoided, as they are prone to swelling and formation of cracks. Table 10.2 gives the list suitable materials recommended by Indian Standard (IS-8826-1978) for core construction in zoned type earthen dam.
Table 10.2. Suitable soil for core construction
Sl. No.
Suitability Type of soil
1 Very good
Very well graded mixtures of sand, gravel and fines of which 15% of material (D85)are coarser than 50 mm and 50% of material (D50) are coarser than 6 mm.
2 Good Well graded mixture of sand, gravel and clayey fine, D85coarser than 25 mm. Fines consisting of inorganic clay (clay with plastic index > 12) or high plastic tough clay (clay with plastic index > 20).
3 Fair Fairly well graded, gravelly, medium to coarse sand with cohesion less fines, D85coarser
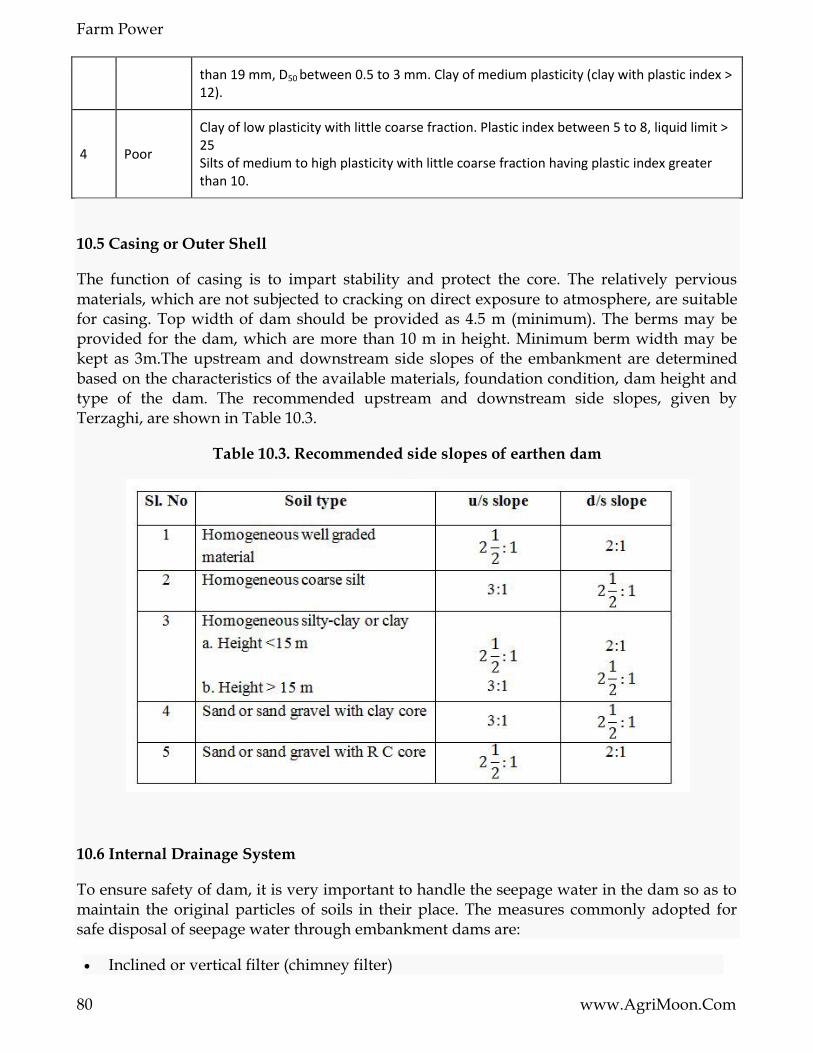
Farm Power
80 www.AgriMoon.Com
than 19 mm, D50 between 0.5 to 3 mm. Clay of medium plasticity (clay with plastic index > 12).
4 Poor
Clay of low plasticity with little coarse fraction. Plastic index between 5 to 8, liquid limit > 25 Silts of medium to high plasticity with little coarse fraction having plastic index greater than 10.
10.5 Casing or Outer Shell
The function of casing is to impart stability and protect the core. The relatively pervious materials, which are not subjected to cracking on direct exposure to atmosphere, are suitable for casing. Top width of dam should be provided as 4.5 m (minimum). The berms may be provided for the dam, which are more than 10 m in height. Minimum berm width may be kept as 3m.The upstream and downstream side slopes of the embankment are determined based on the characteristics of the available materials, foundation condition, dam height and type of the dam. The recommended upstream and downstream side slopes, given by Terzaghi, are shown in Table 10.3.
Table 10.3. Recommended side slopes of earthen dam
10.6 Internal Drainage System
To ensure safety of dam, it is very important to handle the seepage water in the dam so as to maintain the original particles of soils in their place. The measures commonly adopted for safe disposal of seepage water through embankment dams are:
Inclined or vertical filter (chimney filter)
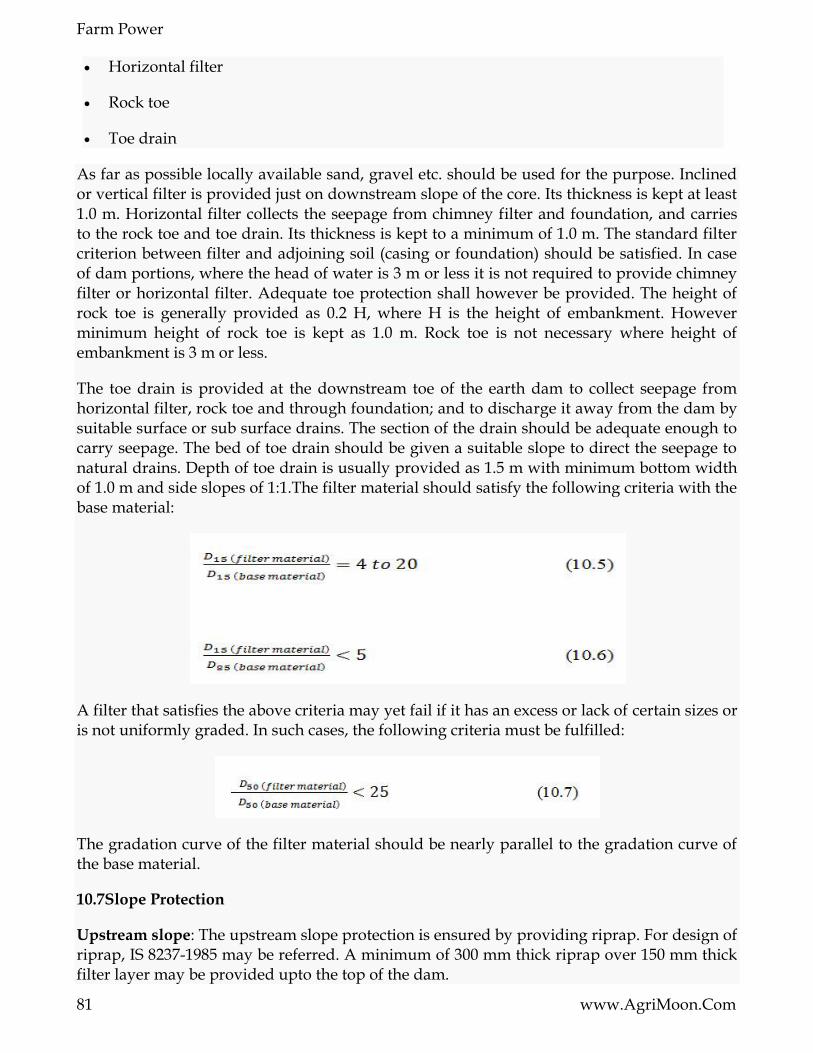
Farm Power
81 www.AgriMoon.Com
Horizontal filter
Rock toe
Toe drain
As far as possible locally available sand, gravel etc. should be used for the purpose. Inclined or vertical filter is provided just on downstream slope of the core. Its thickness is kept at least 1.0 m. Horizontal filter collects the seepage from chimney filter and foundation, and carries to the rock toe and toe drain. Its thickness is kept to a minimum of 1.0 m. The standard filter criterion between filter and adjoining soil (casing or foundation) should be satisfied. In case of dam portions, where the head of water is 3 m or less it is not required to provide chimney filter or horizontal filter. Adequate toe protection shall however be provided. The height of rock toe is generally provided as 0.2 H, where H is the height of embankment. However minimum height of rock toe is kept as 1.0 m. Rock toe is not necessary where height of embankment is 3 m or less.
The toe drain is provided at the downstream toe of the earth dam to collect seepage from horizontal filter, rock toe and through foundation; and to discharge it away from the dam by suitable surface or sub surface drains. The section of the drain should be adequate enough to carry seepage. The bed of toe drain should be given a suitable slope to direct the seepage to natural drains. Depth of toe drain is usually provided as 1.5 m with minimum bottom width of 1.0 m and side slopes of 1:1.The filter material should satisfy the following criteria with the base material:
A filter that satisfies the above criteria may yet fail if it has an excess or lack of certain sizes or is not uniformly graded. In such cases, the following criteria must be fulfilled:
The gradation curve of the filter material should be nearly parallel to the gradation curve of the base material.
10.7Slope Protection
Upstream slope: The upstream slope protection is ensured by providing riprap. For design of riprap, IS 8237-1985 may be referred. A minimum of 300 mm thick riprap over 150 mm thick filter layer may be provided upto the top of the dam.

Farm Power
82 www.AgriMoon.Com
Downstream slope: The downstream slope protection is ensured by turfing or riprap. It is usual practice to protect the downstream slope from rain by providing suitable turfing on the entire downstream slope from top to toe. For details of downstream slope protection, IS 8237-1985 may be referred.
10.8 Surface Drainage
For surface drainage of downstream slope, a system of open paved drains (chutes) along the sloping surface terminating in the longitudinal collecting drains at the junction of berm and slope shall be provided at 50 m centre to centre to drain the rain water. The section of drain may be trapezoidal having depth of 30 cm. From longitudinal collecting drain, the rain water is carried through 15cm diameter pipes placed at 50 m centre to centre into paved chutes on the downstream slope. Where no berm has been provided, the open paved drains should terminate in the downstream rock toe or toe drain.
10.9 Impervious Blanket
The horizontal impervious blanket is provided to increase the path of seepage when full cutoff is not practicable in pervious foundation. The impervious blanket shall be connected to the core of the dam. To avoid formation of crack, the material should not be highly plastic. A 300mm thick layer of random material over the blanket is recommended to prevent cracking due to exposure to atmosphere. As a general guideline, impervious blanket with a minimum thickness of 1.0 m and a minimum length of 5 times the maximum water head measured from upstream toe of core may be provided.
10.10Design of Spillway
Estimation of peak flood is required for spillway design (which is explained in subsequent chapters), the dimensions and physical characteristics of which are extremely important. If a suitable spillway of sufficient size is not available at a particular site, or would prove to be too expensive, it is advisable to move on to a better alternative site where spillway conditions can be met. On larger catchments (>5-8 km2), rock spillways are virtually essential. Therefore, good solid rock of adequate width must be available for all but the smallest dams. As a very rough guide at this stage and subject to re-assessment at the detailed design stage, a minimum width of 15 m at 1.5 m freeboard for a dam on a catchment of around 5 km2may prove suitable. However, advice from local engineers and experienced local people should be sought if hydrological data and/or design charts are not available. It is probable that more earth dams in southern and western African suffer problems through poor spillway design than for any other reason. If there is insufficient rock, the site should not be used for a dam.
Grass spillways, whether cut or natural, are really only suited to small catchments (i.e. up to 5 km2) and low velocity flows (certainly below 1 m/s) and even then may require continual maintenance throughout the life of the dam to prevent erosion from becoming too serious a problem. The ability of vegetation or soil to resist erosion is limited and maintenance of an even surface and uniform cover is very important. The stability of the channel as a whole will depend upon the stability of the most sparsely covered section and it is therefore wise to establish a good creeping grass cover throughout.
Farm Power
83 www.AgriMoon.Com
The grass cover condition will directly affect the channel‟s roughness coefficient, which in turn depends upon flow. A low flow will meet high resistance while a high flow will flatten the grass and thus meet much lower resistance. Maximum allowable non-erosive velocities are highest in grass spillways that have been planted to shorter creeping varieties such as kikuyu, couch and star grasses. These can establish a uniform low cover offering minimum resistance to flow and maximum protection to the soil below. However, where even normal flows are expected to constitute an erosion risk (when the flow is expected to continue during the dry season and/or over a period of several months or more), a drop-inlet overflow spillway should be planned for and located at the opposite end of the embankment to the main spillway and at an elevation on the upstream side of the dam slightly lower (usually 50-100 mm) than full supply level.
A mechanical spillway is provided in the embankment type pond to let out water from the storage in a regulated manner. To protect the embankment from over topping due to unexpected inflows into the storage, an emergency spillway is located on one end of the embankment. The bottom elevation of the emergency spillway should be maximum flood level expected for the selected frequency of runoff into the pond.
The dimensions of the emergency spillway for farm pond are determined from the runoff through it. If there is adequate capacity above the spillway for storage, a reduction in the peak flow for the design of the emergency spillway channels are designed on the basis of weir formula given earlier. Permanent structures are constructed to serve as mechanical spillways from farm pond. The drop spillway and the drop-inlet are the two structures which are commonly used. The drop spillway can handle higher discharges than the drop-inlet. However the drop inlets provide a better control over the water stored in the pond. The design and construction of these structures are same as in gully control structures. Some minor modifications in these structures are done when they are used in farm ponds. The drop structures constructed in the embankment of the pond is referred to as surplus weir. Sometimes a row of vertical pillars on the crest are constructed. When storage of additional water is desired, soil is filled between these pillars so as to block the water. The drop inlet spillway is also constructed as a simple pipe culvert, provisions of a control valve or a sliding head gate is provided in order to regulate the outflow of water. In case of ponds constructed for aquaculture purposes, outlet structures are needed for draining out the water as required.
Example 10.1 The peak rate of runoff expected from the catchment area of a tank is 4 cum. per second. Assuming no temporary storage, find the length of the surplus weir, if the depth of flow over is not to exceed 0.75m.
Solution: Using Francis formula for discharge through broad crested weirs
Where, Q = discharge, m3/s; L = length of weir, m; N= number of end contractions; and H = head of flow, m.
4 =1.84 (L- 0.1×2×0.75) 0.753/2
Farm Power
84 www.AgriMoon.Com
L=3.5 m (Ans)
10.11 Basic Design Requirements
Some of the basic design requirements are discussed below.
10.11.1 Safety against Overtopping
Sufficient spillway capacity should be provided to prevent overtopping.
The free board should be sufficient to prevent overtopping by waves. The minimum free board of 1.5m should be provided.
The free board should be sufficient to take into account the settlement of embankment and foundation.
10.11.2 Stability Analysis
The design of small embankment dam sections may be divided into the following three categories based upon the height of the embankment in its deepest portion.
i. where the height of embankment is 5m or less ii. where the height of embankment is 10 m or less, but more than 5 m iii. where the height of embankment is 15 m or less, but more than 10 m
For small dams under category (i) and (ii) above, the stability analysis may not be necessary. The minimum top width may be kept as 4.50 m. However the designer with his experience and judgement may decide the adequate side slopes where special technical or economic considerations may have to be taken into account.
Stability analysis may be carried out in accordance with IS 7894-1975 based upon the detailed foundation and borrow area investigation and laboratory testing if the soil strata below the dam seat consist of weak foundation and / or the height of embankment is more than 10 m. Weak foundation conditions include fissured clay, expansive soils, shale‟s, over-consolidated highly plastic clays, soft clays, dispersive soils etc. within the substratum in the dam seat.
Main problem of silt and clay foundations is stability. In addition to the obvious danger of bearing failure of foundations of silt and clay, the design must take into account effect of saturation of the foundations of the dam and appurtenant works by the reservoir.
Methods of Treatment
(a) To remove soils of low shearing strength
(b) To provide drainage of foundation to permit increase of strength during construction
(c) To reduce magnitude of average shearing stress along potential surface of sliding by flattening slopes of embankment
Farm Power
85 www.AgriMoon.Com
(d) Pockets of material substantially more compressible or lower in strength than the average, are usually removed.
The most practicable solution for foundation of saturated fine-grained soils is to flatten the slopes of embankment. Soils of low density are subjected to large settlements when saturated by the reservoir, although these soils have high dry strength in natural state. If proper measures are not taken to control excessive settlement, failure of dam may occur by differential settlement and foundation settlement .The required treatment of low density foundation would be dictated by the compression characteristics of the soil. Foundation consolidation will be achieved during construction.
10.11.3 Seepage Control and Safety against Internal Erosion
The seepage through the dam embankment and foundation should be such as to control piping, erosion, sloughing and excessive loss of water. Seepage control measures are required to control seepage through dam and foundation.
Zoning
If only one type of suitable material is readily available nearby, a homogeneous section is generally preferred. When the material available is impervious or semi pervious in nature, then a small quantity of pervious material is required as casing for protection against cracking. On the other hand if it is pervious, a thin impervious membrane is required to form a water barrier.
10.11.4 Stability at Junctions
Junctions of embankment dam with foundation, abutments, and masonry structures like overflow, non-overflow dams and outlets need special attention with reference to one or all of the following criteria.
Good bond between embankment dam and foundations
Adequate creep length at the contact plane
Protection of embankment dam slope against scouring action
Easy movement of traffic
Farm Power
86 www.AgriMoon.Com
Module 3: Seepage and Stability Analysis of Reservoir and Farm ponds
Lesson 11 Seepage through Dam
11.1 Definition and Basic Concept
11.1.1 Seepage through Earthen Dams
Wet areas downstream of the dams are not natural springs, rather seepage through or under the dam. Even if natural springs exist, they should be treated with suspicion and carefully observed. Flows from groundwater springs in existence prior to the reservoir would probably increase due to the pressure caused by the pool of water behind the dam.
All dams have some seepage as the impounded water seeks paths of least resistance through the dam and its foundation. Seepage becomes a concern when it carries sediments (silt particles) with it, and so, should be controlled to prevent erosion of the embankment or foundation or damage to concrete structures.
11.1.2 Detection of Seepage
Seepage can emerge anywhere on the downstream face, beyond the toe, or on the downstream abutments at elevations below normal pool. Seepage may vary in appearance from a soft wet area to a flowing spring. It may show up first as an area where the vegetation is lush and darker green. Cattails, reeds, mosses, and other marsh vegetation often become established in a seepage area. Another indication of seepage is the presence of rust coloured iron bacteria. Due to their nature, the bacteria are found more often where water is discharging from the ground than in surface water. Seepage sometimes makes inspection and maintenance difficult. It can also saturate and weaken the portions of the embankment and foundation, making the embankment susceptible to earth slides.
If the seepage forces are large enough, soil will be eroded from the foundation of the dam and deposited in the shape of a cone or boil around the outlet. When these boils appear, professional advice needs to be taken immediately. Seepage flow, when looks muddy due to carrying of sediment, is an evidence of piping below the foundation. It is a serious problem as far as safety of the dam is concerned. In case it is left unnoticed, it leads to failure of the dam. Piping can most often occur along a spillway or other conduit through the embankment, and these areas should be closely inspected. Sinkholes may develop on the surface of the embankment as internal erosion takes place. A whirlpool in the lake surface may follow a rapid and complete failure of the dam. Emergency procedures, including downstream evacuation, should be implemented immediately if any of these conditions are noticed.
Seepage can also develop under or downstream of the concrete structures such as chute spillways or headwalls. When the concrete structure does not have the provision of weep holes or relief drains to relieve the water pressure, the concrete structure may heave, rotate,
Farm Power
87 www.AgriMoon.Com
or crack. The effects of the freezing and thawing can amplify these problems. It should be noted that the water pressure behind or beneath structures may also be due to infiltration of surface water or spillway discharge, but should still be addressed.
A continuous or sudden drop in the normal lake level is another indication that seepage is occurring. In this case, one or more locations of flowing water are usually noted downstream from the dam. This condition, in itself, may not be a serious dam safety problem, but will require frequent and close monitoring through professional assistance.
11.1.3 Seepage Control
The need for seepage control in dams depends on the quantity, content, and location of the seepage. It is not usually attempted unless the seepage has lowered the pool level or is endangering the dam or appurtenant structures.
However, reducing seepage that occurs after the construction of the dam is difficult and expensive. Typical methods used to control the quantity of seepage are grouting and/or installation of an upstream blanket. Of these methods, grouting is probably the least effective and is most applicable to leakage zones in bedrock, abutments, and foundations. These methods must be designed and constructed under the supervision of a professional engineer having expertise in construction of dams.
Controlling the content of the seepage or preventing seepage flow from soil particles is extremely important. Modern design practice incorporates the control of seepage into the dam design through the use of cutoffs, internal filters, and adequate drainage provisions. Control at points of seepage exit can be accomplished after construction by installation of toe drains, relief wells, or inverted filters.
Weep holes and relief drains can be installed to relieve water pressure or drain seepage from behind or beneath concrete structures. These systems must be designed to prevent migration of soil particles but still allow the seepage to drain freely. The design of toe drains, relief wells, inverted filters, weep holes, or relief holes is to be made by an expert as regular monitoring of these features is critical.
11.1.4 Monitoring
Regular monitoring is essential to detect seepage and prevent dam failure. Knowledge of the dam's history is important to determine whether the seepage condition is in a steady or varying state. It is important to keep written records of points of seepage exit, quantity and content of flow, size of wet area, and type of vegetation for comparison. Photographs taken at the time of inspection are excellent records for understanding the gravity of seepage. All records should be kept with the Inspection and Maintenance Plan of the dam. The inspector should always look for the increase in flow and the evidence of soil particles carried with the flow as they indicate the seriousness of the problem.
Instruments may also be used to monitor seepage. Triangular weirs like V-notch can be used to measure flow rates and piezometers installed within the embankment may provide information about the saturation level or phreatic surface through the dam.
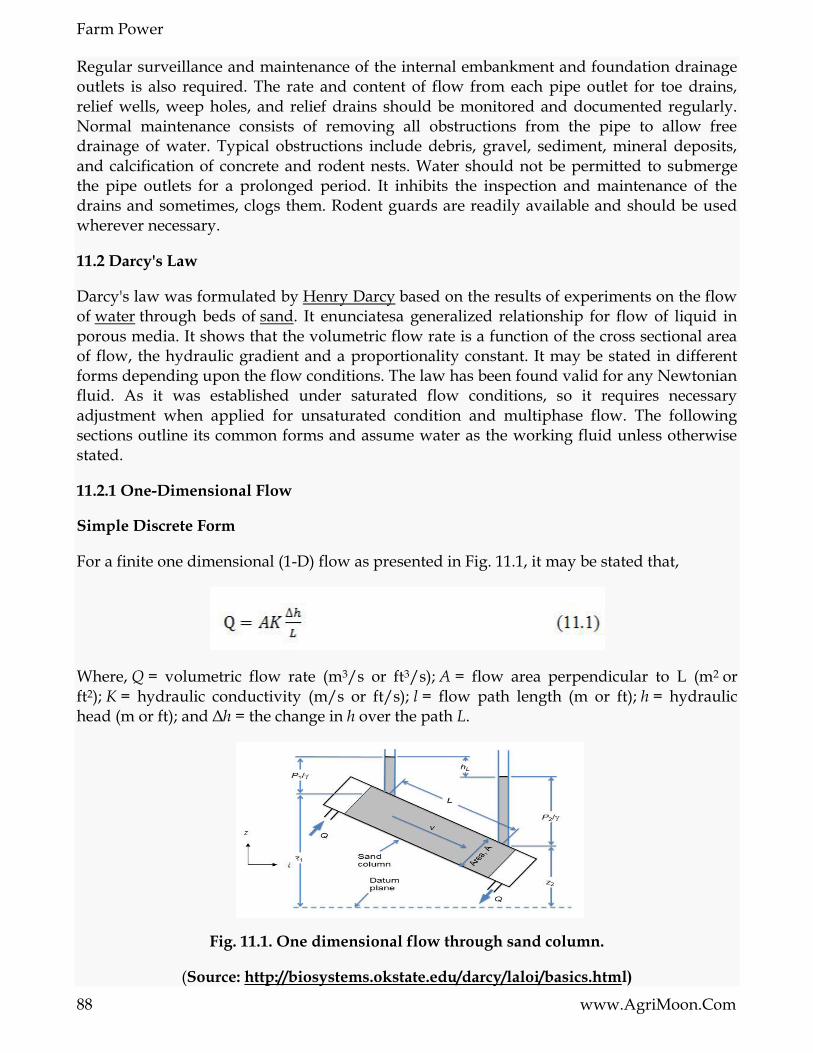
Farm Power
88 www.AgriMoon.Com
Regular surveillance and maintenance of the internal embankment and foundation drainage outlets is also required. The rate and content of flow from each pipe outlet for toe drains, relief wells, weep holes, and relief drains should be monitored and documented regularly. Normal maintenance consists of removing all obstructions from the pipe to allow free drainage of water. Typical obstructions include debris, gravel, sediment, mineral deposits, and calcification of concrete and rodent nests. Water should not be permitted to submerge the pipe outlets for a prolonged period. It inhibits the inspection and maintenance of the drains and sometimes, clogs them. Rodent guards are readily available and should be used wherever necessary.
11.2 Darcy's Law
Darcy's law was formulated by Henry Darcy based on the results of experiments on the flow of water through beds of sand. It enunciatesa generalized relationship for flow of liquid in porous media. It shows that the volumetric flow rate is a function of the cross sectional area of flow, the hydraulic gradient and a proportionality constant. It may be stated in different forms depending upon the flow conditions. The law has been found valid for any Newtonian fluid. As it was established under saturated flow conditions, so it requires necessary adjustment when applied for unsaturated condition and multiphase flow. The following sections outline its common forms and assume water as the working fluid unless otherwise stated.
11.2.1 One-Dimensional Flow
Simple Discrete Form
For a finite one dimensional (1-D) flow as presented in Fig. 11.1, it may be stated that,
Where, Q = volumetric flow rate (m3/s or ft3/s); A = flow area perpendicular to L (m2 or ft2); K = hydraulic conductivity (m/s or ft/s); l = flow path length (m or ft); h = hydraulic head (m or ft); and Δh = the change in h over the path L.
Fig. 11.1. One dimensional flow through sand column.
(Source: http://biosystems.okstate.edu/darcy/laloi/basics.html)
Farm Power
89 www.AgriMoon.Com
The hydraulic head, h, at a specific point is the sum of the pressure head and the elevation
Where, p = water pressure (N/m2); = unit weight of water (N/m3); = density of water (kg/m3);g = acceleration due to gravity (m/s2 ); and z = elevation (m or ft).
While Eq.11.2 is the usual form used in English units, Eq. 11.3 is the normal SI form of the equation. The hydraulic head is the height that water that would rise in a piezometer. Thus, Δh in Eq. 11.1 is simply the difference in height of water in piezometers placed at the inlet and the outlet (Δh = hinlet-houtlet). Substituting the value of, h, in Eq.11.3 into Eq.11.1 yields,
Eq. 11.4 is approximately the form used in Darcy‟s law to analyze the experimental data. Note that the flow is not a function of the absolute pressure or the elevation; rather it is only a function of the change in hydraulic head.
Differential Form
A more general form of the Eq.11.4 results when the limit of Δh with respect to the flow direction l, as the flow path L goes to zero. Applying that step to equations 11.1 and 11.4 yields,
The minus sign on the right hand term reflects that the hydraulic head always decreases in the direction of flow.
11.3 Flow Variables
11.3.1 Darcy Flux
The Darcy flux is defined as,
Farm Power
90 www.AgriMoon.Com
Where, q = Darcy flux (ms-1 or fts-1).
The Darcy flux is the volumetric flow per unit area. Substitution of equation 11.6 into 11.5 yields,
11.3.2 Seepage Velocity
While the Darcy flux has the units of velocity, it is not the velocity of the water in the pores. The solid matrix takes up some of the flow area. The average pore water velocity is termed as the seepage velocity, v, and is given by
Where, f = Porosity of the porous media. The maximum pore velocity is a function of the pore geometry and cannot be easily predicted except for regular shapes. In circular tubes, the maximum velocity is almost double of „v’.
11.3.3 Transmissivity
In saturated groundwater analysis with nearly horizontal flow, it is a common practice to combine the hydraulic conductivity and the thickness of the aquifer into a single variable.
Where, T = Transmissivity (m2s-1 or ft2s-1); and b = thickness of aquifer (m).
11.3.4 Permeability
When the fluid is other than water at standard conditions, the conductivity is replaced by the permeability of the media. The two properties are related by,
Where, k = permeability, (m2 or ft2); = fluid absolute viscosity, (N s/m2 or lb s/ft2); and = fluid kinematic viscosity, (m2/s or ft2/s).
Ideally, the permeability of a porous media is the same to different fluids. Thus, the flow of one fluid can be predicted from the measurement of a second with Eq.11.10. However in
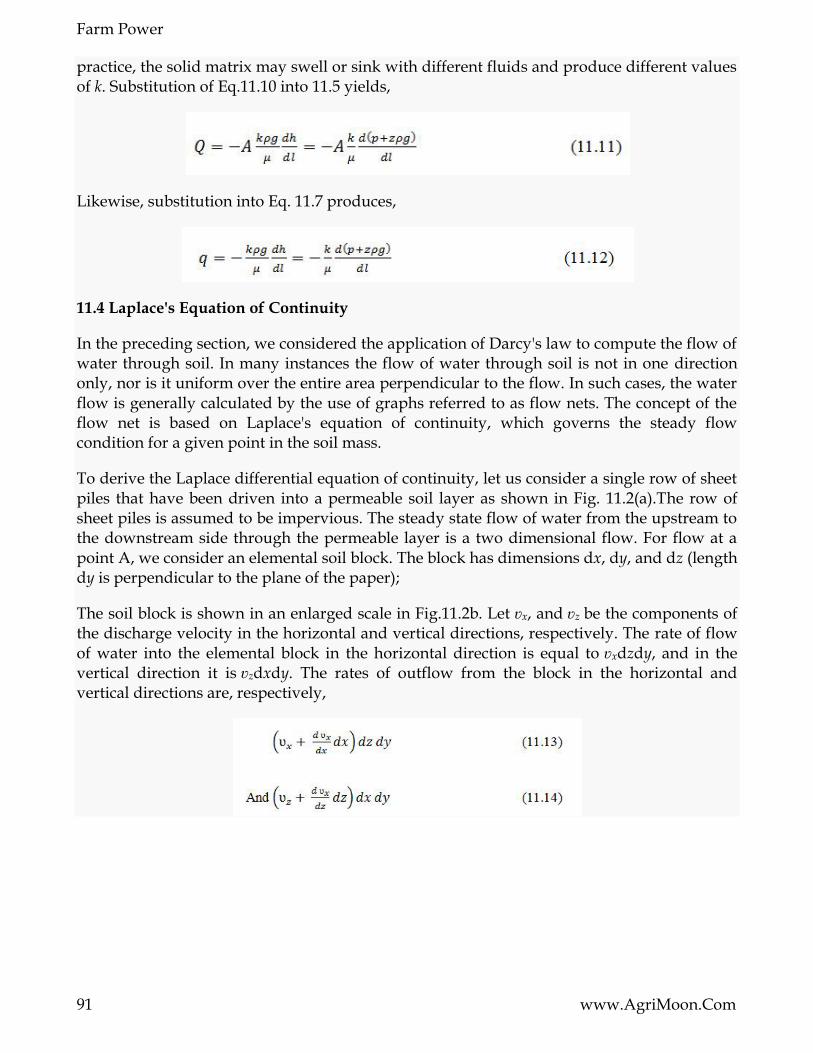
Farm Power
91 www.AgriMoon.Com
practice, the solid matrix may swell or sink with different fluids and produce different values of k. Substitution of Eq.11.10 into 11.5 yields,
Likewise, substitution into Eq. 11.7 produces,
11.4 Laplace's Equation of Continuity
In the preceding section, we considered the application of Darcy's law to compute the flow of water through soil. In many instances the flow of water through soil is not in one direction only, nor is it uniform over the entire area perpendicular to the flow. In such cases, the water flow is generally calculated by the use of graphs referred to as flow nets. The concept of the flow net is based on Laplace's equation of continuity, which governs the steady flow condition for a given point in the soil mass.
To derive the Laplace differential equation of continuity, let us consider a single row of sheet piles that have been driven into a permeable soil layer as shown in Fig. 11.2(a).The row of sheet piles is assumed to be impervious. The steady state flow of water from the upstream to the downstream side through the permeable layer is a two dimensional flow. For flow at a point A, we consider an elemental soil block. The block has dimensions dx, dy, and dz (length dy is perpendicular to the plane of the paper);
The soil block is shown in an enlarged scale in Fig.11.2b. Let ʋx, and ʋz be the components of the discharge velocity in the horizontal and vertical directions, respectively. The rate of flow of water into the elemental block in the horizontal direction is equal to ʋxdzdy, and in the vertical direction it is ʋzdxdy. The rates of outflow from the block in the horizontal and vertical directions are, respectively,
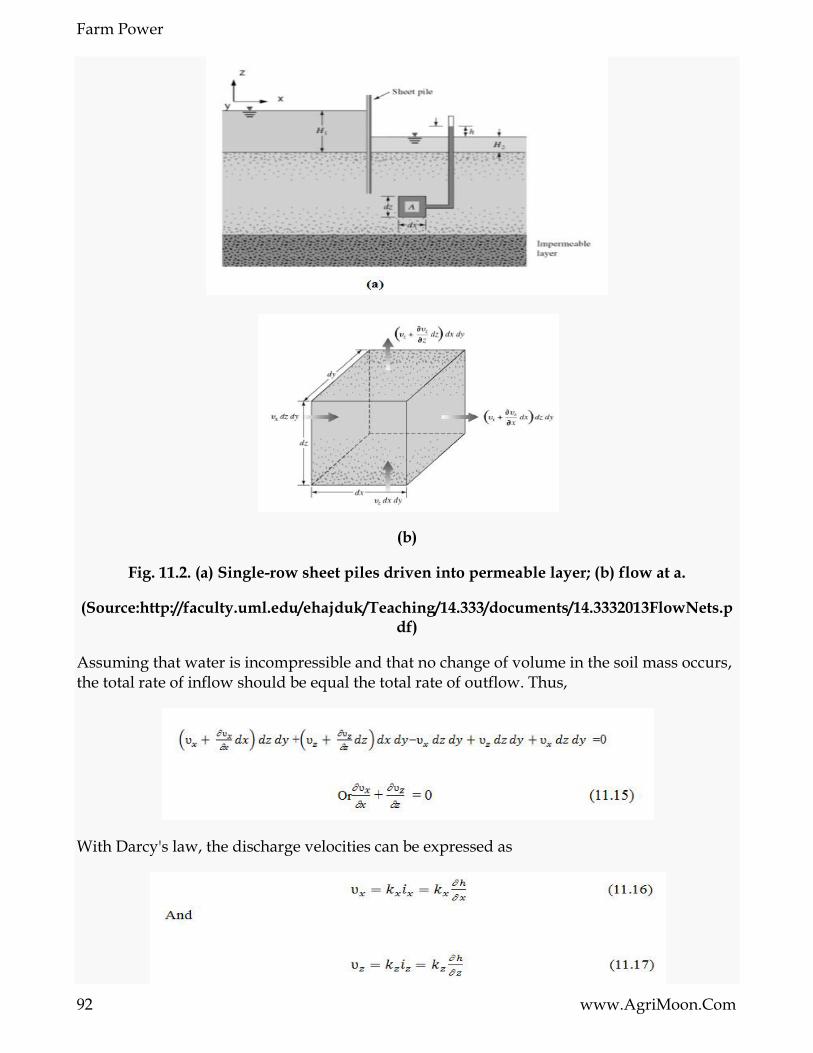
Farm Power
92 www.AgriMoon.Com
(b)
Fig. 11.2. (a) Single-row sheet piles driven into permeable layer; (b) flow at a.
(Source:http://faculty.uml.edu/ehajduk/Teaching/14.333/documents/14.3332013FlowNets.pdf)
Assuming that water is incompressible and that no change of volume in the soil mass occurs, the total rate of inflow should be equal the total rate of outflow. Thus,
With Darcy's law, the discharge velocities can be expressed as

Farm Power
93 www.AgriMoon.Com
Where, and are the hydraulic conductivities in the vertical and horizontal directions, respectively.
From Eqs.11.15, 11.16 and 11.17, we can write,
When the soil is isotropic i.e. kx = ky = kz, the preceding continuity equation for two-dimensional flow simplifies to:
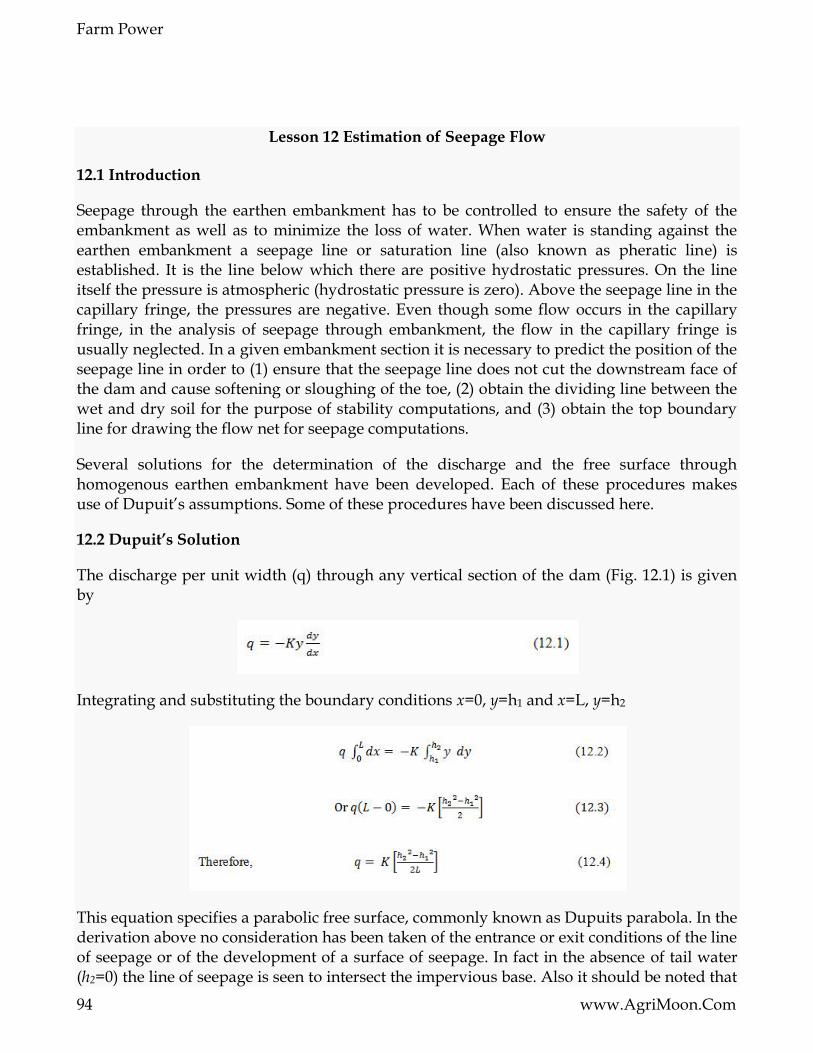
Farm Power
94 www.AgriMoon.Com
Lesson 12 Estimation of Seepage Flow
12.1 Introduction
Seepage through the earthen embankment has to be controlled to ensure the safety of the embankment as well as to minimize the loss of water. When water is standing against the earthen embankment a seepage line or saturation line (also known as pheratic line) is established. It is the line below which there are positive hydrostatic pressures. On the line itself the pressure is atmospheric (hydrostatic pressure is zero). Above the seepage line in the capillary fringe, the pressures are negative. Even though some flow occurs in the capillary fringe, in the analysis of seepage through embankment, the flow in the capillary fringe is usually neglected. In a given embankment section it is necessary to predict the position of the seepage line in order to (1) ensure that the seepage line does not cut the downstream face of the dam and cause softening or sloughing of the toe, (2) obtain the dividing line between the wet and dry soil for the purpose of stability computations, and (3) obtain the top boundary line for drawing the flow net for seepage computations.
Several solutions for the determination of the discharge and the free surface through homogenous earthen embankment have been developed. Each of these procedures makes use of Dupuit‟s assumptions. Some of these procedures have been discussed here.
12.2 Dupuit’s Solution
The discharge per unit width (q) through any vertical section of the dam (Fig. 12.1) is given by
Integrating and substituting the boundary conditions x=0, y=h1 and x=L, y=h2
This equation specifies a parabolic free surface, commonly known as Dupuits parabola. In the derivation above no consideration has been taken of the entrance or exit conditions of the line of seepage or of the development of a surface of seepage. In fact in the absence of tail water (h2=0) the line of seepage is seen to intersect the impervious base. Also it should be noted that
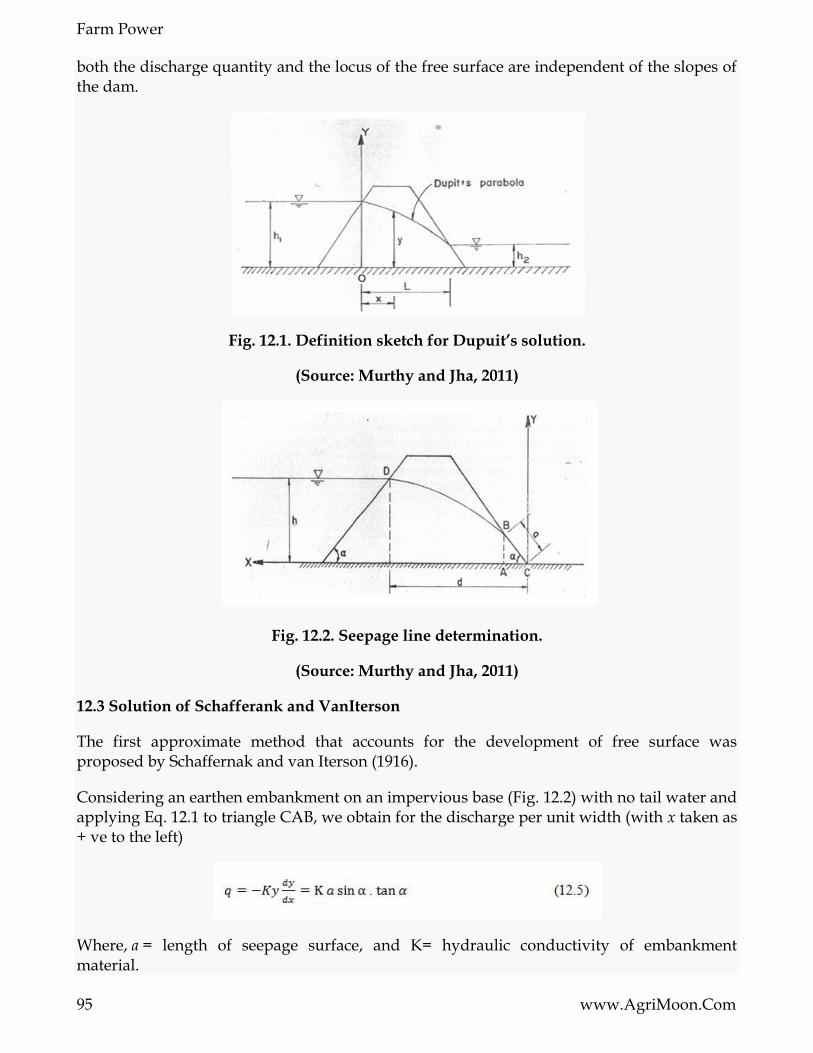
Farm Power
95 www.AgriMoon.Com
both the discharge quantity and the locus of the free surface are independent of the slopes of the dam.
Fig. 12.1. Definition sketch for Dupuit’s solution.
(Source: Murthy and Jha, 2011)
Fig. 12.2. Seepage line determination.
(Source: Murthy and Jha, 2011)
12.3 Solution of Schafferank and VanIterson
The first approximate method that accounts for the development of free surface was proposed by Schaffernak and van Iterson (1916).
Considering an earthen embankment on an impervious base (Fig. 12.2) with no tail water and applying Eq. 12.1 to triangle CAB, we obtain for the discharge per unit width (with x taken as + ve to the left)
Where, a = length of seepage surface, and K= hydraulic conductivity of embankment material.
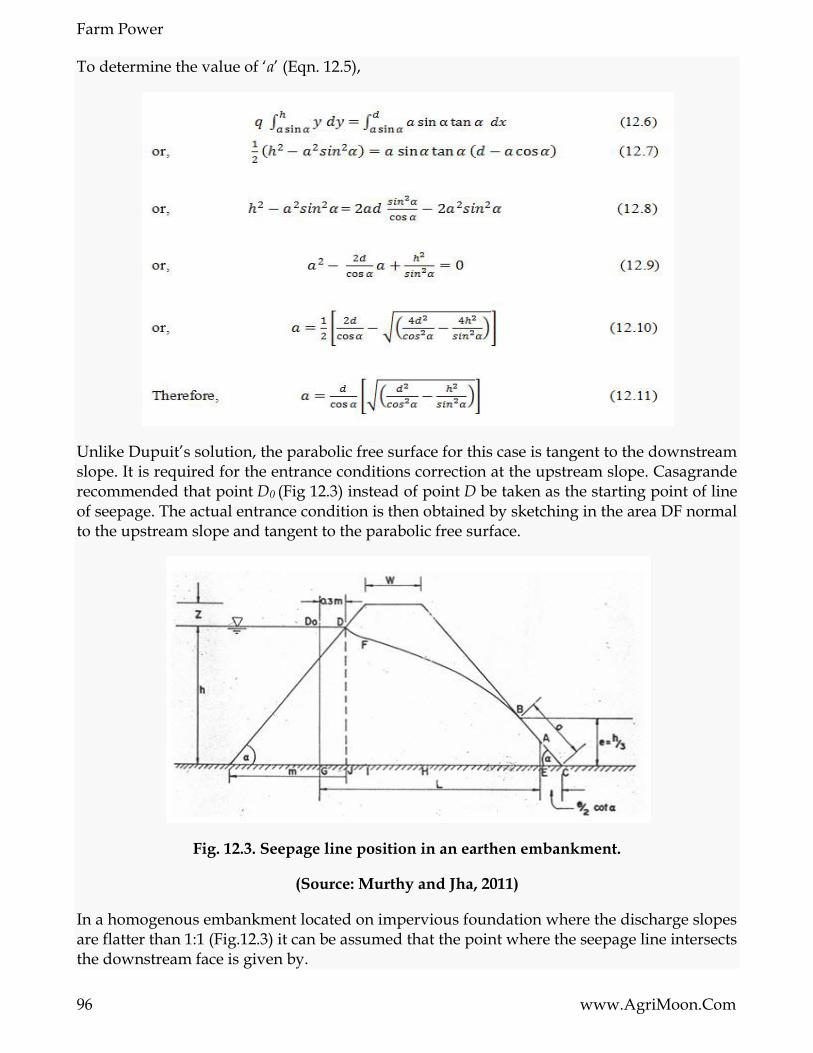
Farm Power
96 www.AgriMoon.Com
To determine the value of „a‟ (Eqn. 12.5),
Unlike Dupuit‟s solution, the parabolic free surface for this case is tangent to the downstream slope. It is required for the entrance conditions correction at the upstream slope. Casagrande recommended that point D0 (Fig 12.3) instead of point D be taken as the starting point of line of seepage. The actual entrance condition is then obtained by sketching in the area DF normal to the upstream slope and tangent to the parabolic free surface.
Fig. 12.3. Seepage line position in an earthen embankment.
(Source: Murthy and Jha, 2011)
In a homogenous embankment located on impervious foundation where the discharge slopes are flatter than 1:1 (Fig.12.3) it can be assumed that the point where the seepage line intersects the downstream face is given by.
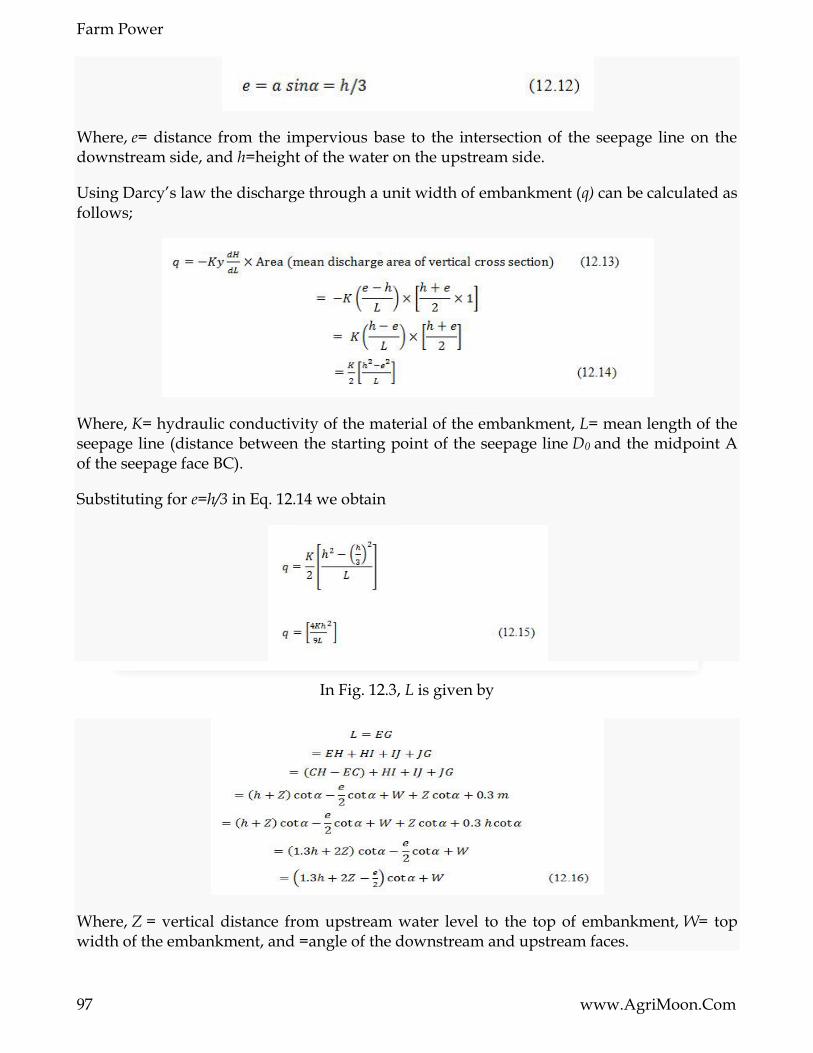
Farm Power
97 www.AgriMoon.Com
Where, e= distance from the impervious base to the intersection of the seepage line on the downstream side, and h=height of the water on the upstream side.
Using Darcy‟s law the discharge through a unit width of embankment (q) can be calculated as follows;
Where, K= hydraulic conductivity of the material of the embankment, L= mean length of the seepage line (distance between the starting point of the seepage line D0 and the midpoint A of the seepage face BC).
Substituting for e=h/3 in Eq. 12.14 we obtain
In Fig. 12.3, L is given by
Where, Z = vertical distance from upstream water level to the top of embankment, W= top width of the embankment, and =angle of the downstream and upstream faces.

Farm Power
98 www.AgriMoon.Com
When pervious shells are provided in the upstream and downstream sides, the positions of the seepage line are shown in Fig 12.4. The upstream portion will have little effect on the position on the line whereas the downstream portion will act as drain.
If instead of the impervious foundation, a considerable layer of relatively pervious material overlies the impervious layer, discharge take place through the pervious stratum down to the impervious stratum in the foundation. In such cases, a hydraulic gradient line is assumed and at least 1 to 1.2 m of cover over the hydraulic gradient is provided. The gradient line may be assumed as a straight line with a slope of 1:1 in impermeable clay varying to 1:12 in sandy soil. In order to safely dispose the seepage water, toe drains or filters (Fig. 12.5) are provided.
Fig. 12.4. Seepage line in composite dam.
(Source: Murthy and Jha, 2011)
Fig. 12.5. Filter at the toe of the dam.
(Source: Murthy and Jha, 2011)
12.4 Freeboard and Wave Protections
Freeboard is the additional height of the dam provided as a safety factor to prevent overtopping due to unexpected runoff or by wave action. It is the vertical distance between the designed water elevation and the elevation of the top of the dam after settlement. This is also referred to as the net freeboard. The vertical distance between the crest of the mechanical spillway and the top of the dam is referred as the gross freeboard. The net free board should be sufficient to prevent the waves in the pond from reaching the top portion of the
Farm Power
99 www.AgriMoon.Com
embankment where they can cause damage. Wave heights for moderate sized reservoirs are determined using Hawksley‟s formula:
h=0.014(Dm)1/2 (12.17)
Where, h=wave height from trough to crest for maximum wind velocity in m, and Dm=fetch or exposure in m.
In addition to providing enough freeboard from wave height point of view, precautions are taken to protect the dam from wave damage. There are several methods for the purpose and the choice of the method depends on whether the water level remains fairly constant or fluctuates.
Vegetative and rip-rap are the methods used for controlling erosion by waves at the upstream side of the dam. Vegetative methods consist of establishing a thick grass cover on the slope. This is useful when wave action is not severe. If the water level in the pond remains fairly at a constant level, a berm of 2 to 3 m wide at this level controls wave action. Booms consist of a single or double line of logs chained together and suitability anchored are also used. They float on water very near the embankment and break the wave action. Rip-rap consists of loose stones or concrete blocks placed on the side of the embankment facing the water. Rip-rap is an effective method of protection from wave action. The layer of stones should be about 25 cm thick. Rip-rap could be made continuous upto the toe of the dam or a berm is to be provided at the place where the rip-rap terminates below the water level.
12.5 Seepage Charts
Seepage charts have been developed by the M. W. Stello (1987) (also known as Stello's seepage charts) basically as a practitioner's tool for rapidly estimating seepage quantities for both homogeneous and zoned embankments. The charts have been developed based on a computer program using the method of fragments. The method of fragments is an approximate method of seepage analysis and can be used for determining seepage quantities and the location of the phreatic surface for embankments with varying side slopes, heights, and crest widths. The method lends itself readily to computer application. The charts are applicable for any height of embankment with varying upstream, core, and downstream slopes, different core and shell permeabilities, and different crest widths and pool elevations. The quantities of seepage based on the charts give an average of 5%error as compared to published flow net solutions. Considering the profession's inability to estimate permeability accurately, the charts give very good results for rapid checks on seepage quantities and the location of the phreatic surface. The charts may be used as an aid in the construction of the actual flow net. A method is also helps to estimate seepage quantities for upstream sloping core embankments.
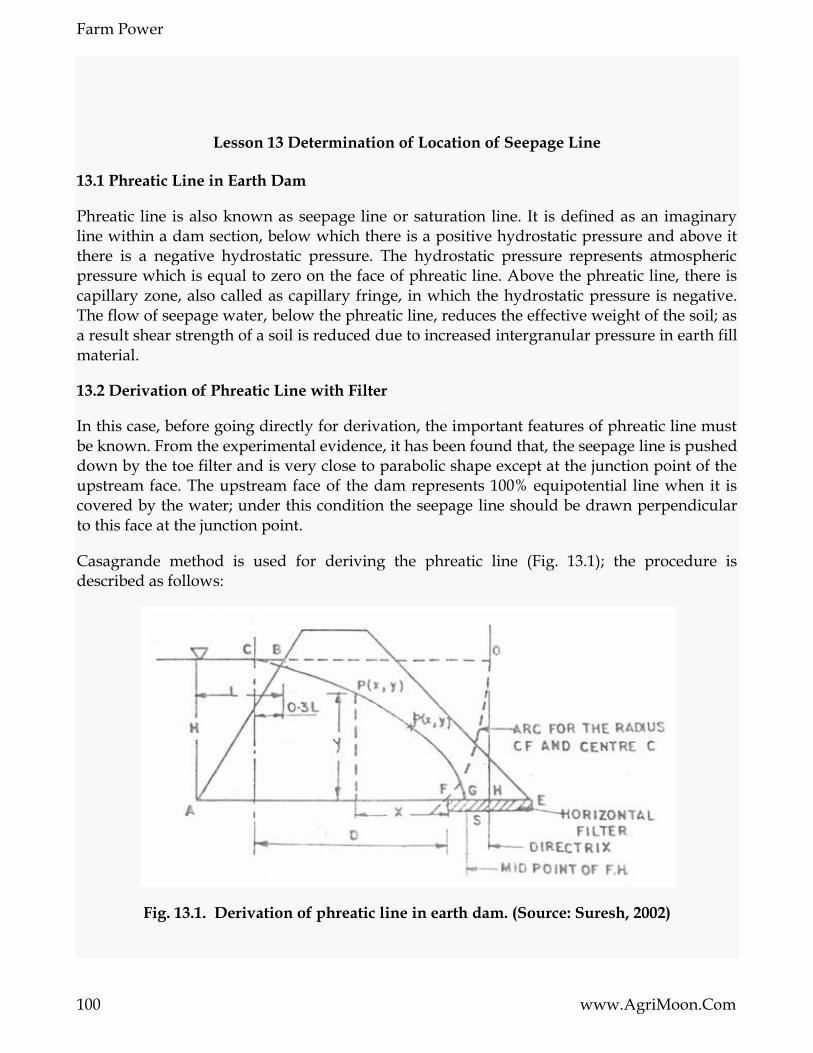
Farm Power
100 www.AgriMoon.Com
Lesson 13 Determination of Location of Seepage Line
13.1 Phreatic Line in Earth Dam
Phreatic line is also known as seepage line or saturation line. It is defined as an imaginary line within a dam section, below which there is a positive hydrostatic pressure and above it there is a negative hydrostatic pressure. The hydrostatic pressure represents atmospheric pressure which is equal to zero on the face of phreatic line. Above the phreatic line, there is capillary zone, also called as capillary fringe, in which the hydrostatic pressure is negative. The flow of seepage water, below the phreatic line, reduces the effective weight of the soil; as a result shear strength of a soil is reduced due to increased intergranular pressure in earth fill material.
13.2 Derivation of Phreatic Line with Filter
In this case, before going directly for derivation, the important features of phreatic line must be known. From the experimental evidence, it has been found that, the seepage line is pushed down by the toe filter and is very close to parabolic shape except at the junction point of the upstream face. The upstream face of the dam represents 100% equipotential line when it is covered by the water; under this condition the seepage line should be drawn perpendicular to this face at the junction point.
Casagrande method is used for deriving the phreatic line (Fig. 13.1); the procedure is described as follows:
Fig. 13.1. Derivation of phreatic line in earth dam. (Source: Suresh, 2002)

Farm Power
101 www.AgriMoon.Com
a) Let the phreatic line is assumed to be a base parabola with its focus at point F, i.e. at the starting point of the filter, FE.
b) AB is the upstream face of the earth dam and L is the horizontal projection of face AB on the water surface. Measure the distance BC equal to 0.3L. Count point C as a starting point of base of parabola.
c) For deciding the position of directrix of the parabola, the principle which states that every point of the parabola is at equidistance from the focus as well as directrix. Hence, considering C as a center and CF as radius, an arc is drawn which cut the horizontal line CB at point O. Since CO = CF, hence vertical line OH will be directrix of parabola.
d) The last point G of the parabola will fall at the middle of the points F and H.
e) The intermediate points of parabola are located on the principle that their distance from the focus and directrix are the same. Here to locate the point P as an intermediate point, a vertical line DP is drawn at any distance x from the F. Now considering the distance DH as radius with F as a center, an arc is drawn which cuts the vertical DP at point P.
f) Now all there obtained points are joined by free hand to get the base parabola. However, this needs to be corrected at the entry point, for the feature that phreatic line must be started from the point B only, not from C. It should be sketched perpendicular to the upstream face AB, as it is 100 percent equipotential line. Now phreatic line is sketched by free hand in such way that, it should be perpendicular to face AB and meets to rest of the points of the parabola tangentially. In addition, the base parabola should also be met perpendicular, to the downstream face of the dam at point G.
13.3 Equation of Parabola
The equation of base parabola can be derived from its basic properties i.e. the distance of any point P(x, y) on the parabola from its focus is the same as the distance of the point P(x, y) from directrix.
Thus we have,
Where, s = focal distance (FH)
From equation 13.1,
Farm Power
102 www.AgriMoon.Com
This is the desired equation of base parabola.
For deriving the expression of discharge (q) for the earth dam equipped with horizontal filter, the Darcy's law is used. According to which, the discharge (q) through vertical section PD, is equal to:
Partial differentiation of Eqn.13.2, resulted
Substituting the value of in Eqn. 13.3, the rate of seepage flow through the dam is given by:
This is the expression for computing the rate of seepage discharge through the body of earthen dam, in terms of focal distance s. The distance s can be determined either graphically or analytically. Considering C as co-ordinate, the value of s can be obtained as:
From Eqn: 13.1
At point C, x = D and y = H
By using this equation, if the value of coefficient of permeability (k) and focal distance (s) are known, the discharge (q) can be calculated. This gives an accurate value of seepage rate and is applicable to such dams, which are provided with horizontal drainage (filter) system but can also be used for other types of dam section.
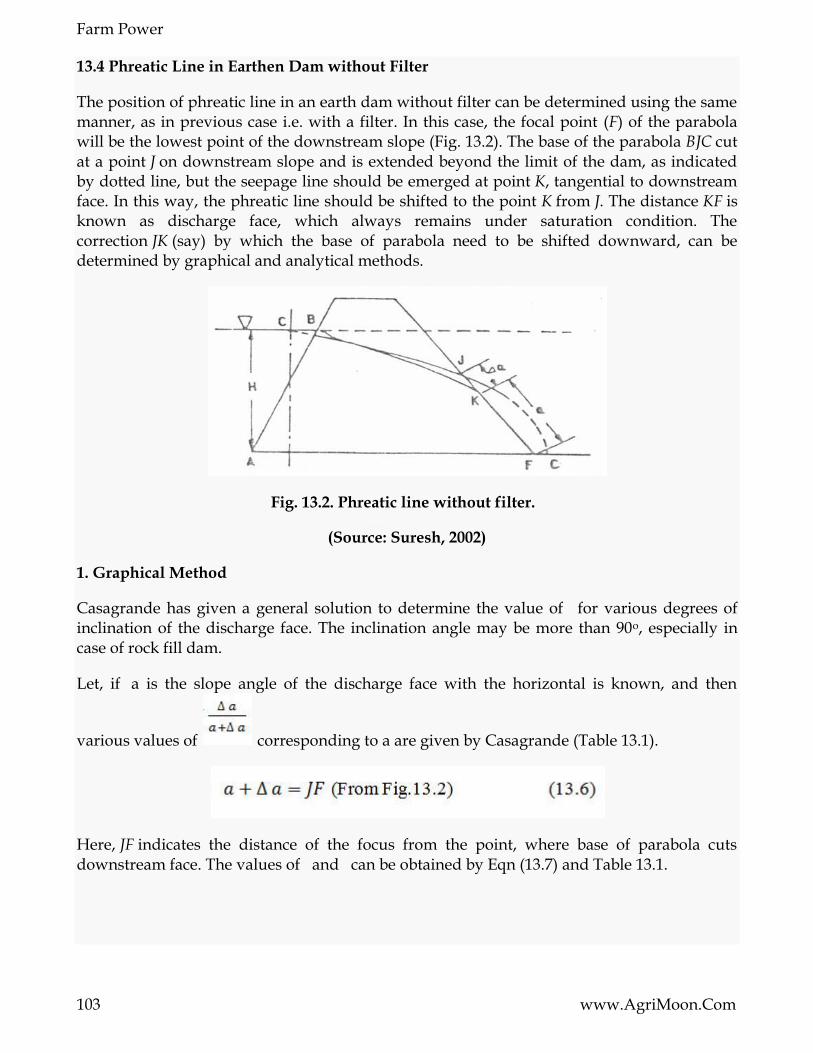
Farm Power
103 www.AgriMoon.Com
13.4 Phreatic Line in Earthen Dam without Filter
The position of phreatic line in an earth dam without filter can be determined using the same manner, as in previous case i.e. with a filter. In this case, the focal point (F) of the parabola will be the lowest point of the downstream slope (Fig. 13.2). The base of the parabola BJC cut at a point J on downstream slope and is extended beyond the limit of the dam, as indicated by dotted line, but the seepage line should be emerged at point K, tangential to downstream face. In this way, the phreatic line should be shifted to the point K from J. The distance KF is known as discharge face, which always remains under saturation condition. The correction JK (say) by which the base of parabola need to be shifted downward, can be determined by graphical and analytical methods.
Fig. 13.2. Phreatic line without filter.
(Source: Suresh, 2002)
1. Graphical Method
Casagrande has given a general solution to determine the value of for various degrees of inclination of the discharge face. The inclination angle may be more than 90o, especially in case of rock fill dam.
Let, if a is the slope angle of the discharge face with the horizontal is known, and then
various values of corresponding to a are given by Casagrande (Table 13.1).
Here, JF indicates the distance of the focus from the point, where base of parabola cuts downstream face. The values of and can be obtained by Eqn (13.7) and Table 13.1.
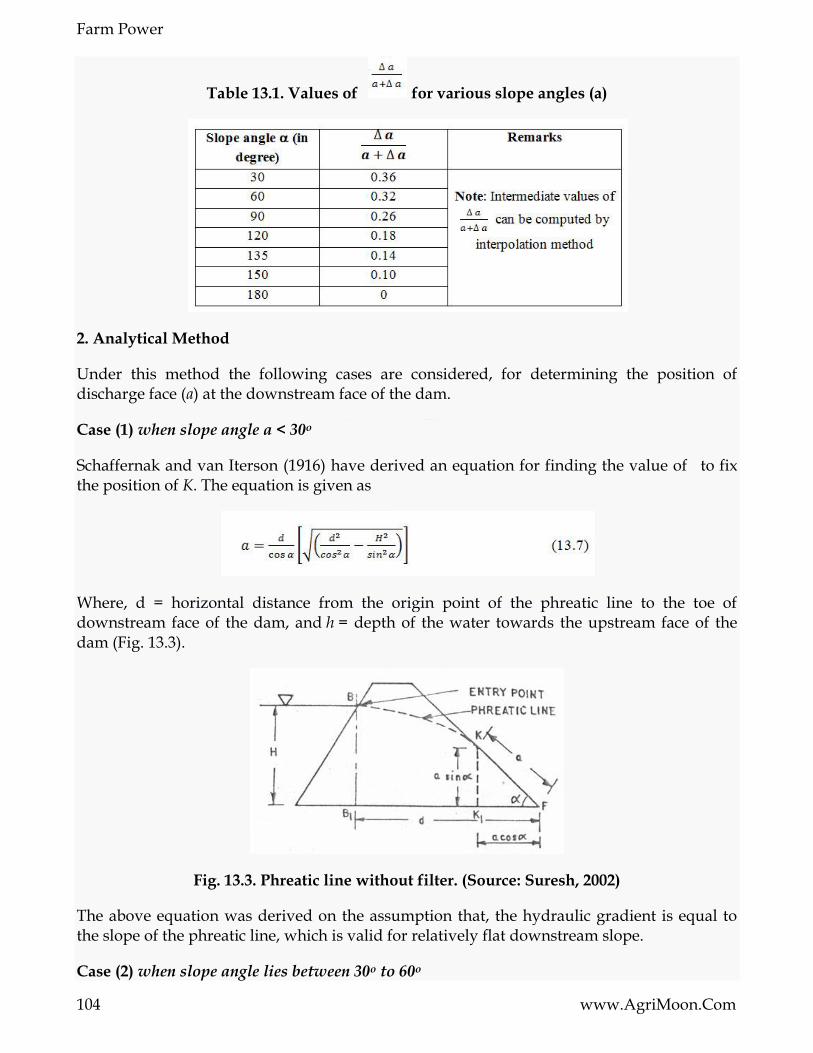
Farm Power
104 www.AgriMoon.Com
Table 13.1. Values of for various slope angles (a)
2. Analytical Method
Under this method the following cases are considered, for determining the position of discharge face (a) at the downstream face of the dam.
Case (1) when slope angle a < 30o
Schaffernak and van Iterson (1916) have derived an equation for finding the value of to fix the position of K. The equation is given as
Where, d = horizontal distance from the origin point of the phreatic line to the toe of downstream face of the dam, and h = depth of the water towards the upstream face of the dam (Fig. 13.3).
Fig. 13.3. Phreatic line without filter. (Source: Suresh, 2002)
The above equation was derived on the assumption that, the hydraulic gradient is equal to the slope of the phreatic line, which is valid for relatively flat downstream slope.
Case (2) when slope angle lies between 30o to 60o
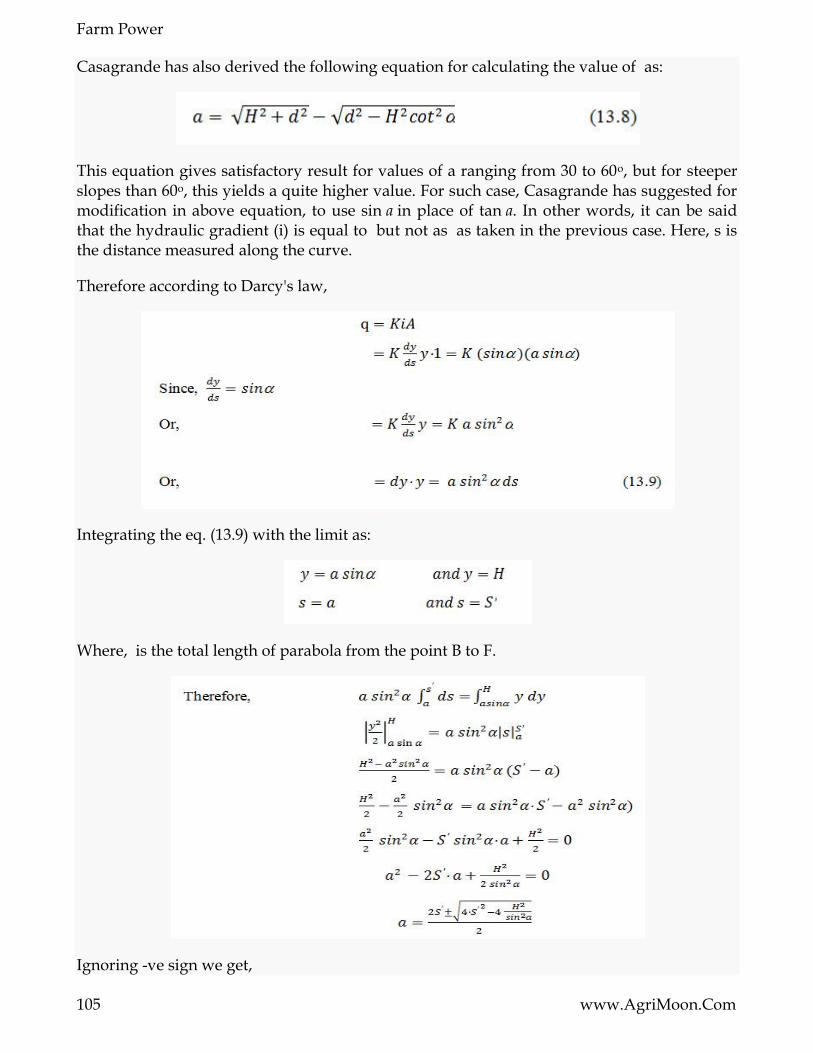
Farm Power
105 www.AgriMoon.Com
Casagrande has also derived the following equation for calculating the value of as:
This equation gives satisfactory result for values of a ranging from 30 to 60o, but for steeper slopes than 60o, this yields a quite higher value. For such case, Casagrande has suggested for modification in above equation, to use sin a in place of tan a. In other words, it can be said that the hydraulic gradient (i) is equal to but not as as taken in the previous case. Here, s is the distance measured along the curve.
Therefore according to Darcy's law,
Integrating the eq. (13.9) with the limit as:
Where, is the total length of parabola from the point B to F.
Ignoring -ve sign we get,

Farm Power
106 www.AgriMoon.Com
This is the required equation for computing the value of when slope angle a exceeds 60o.
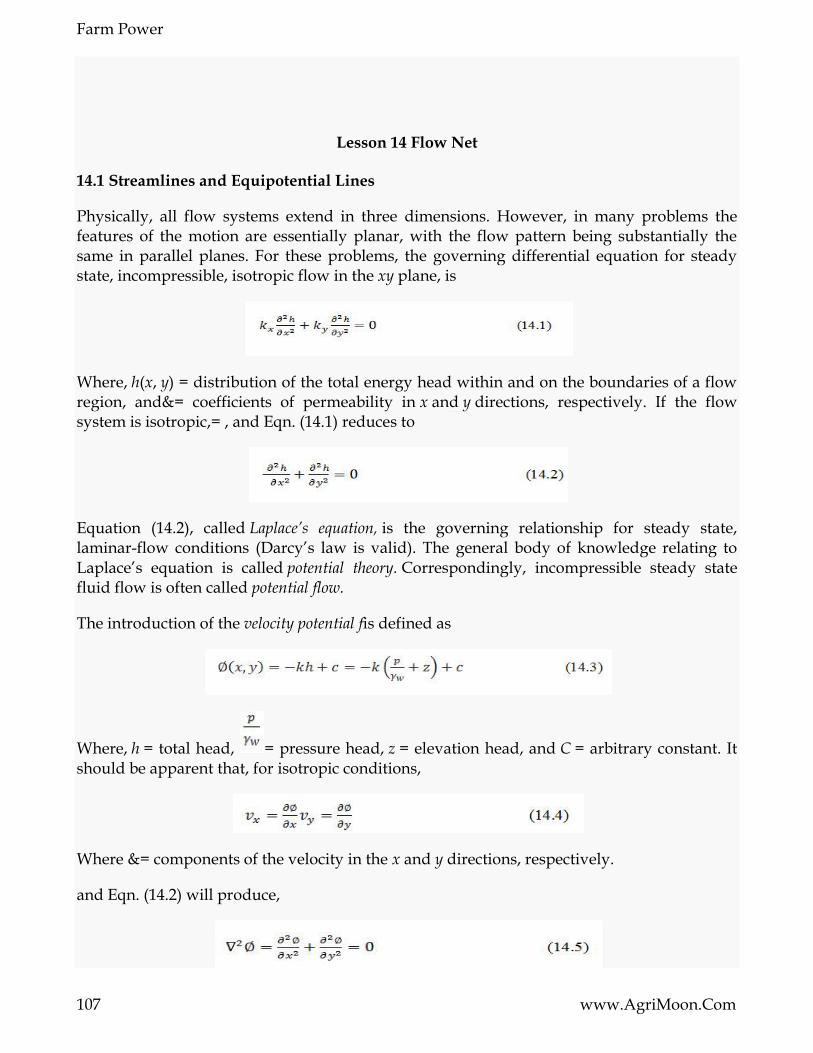
Farm Power
107 www.AgriMoon.Com
Lesson 14 Flow Net
14.1 Streamlines and Equipotential Lines
Physically, all flow systems extend in three dimensions. However, in many problems the features of the motion are essentially planar, with the flow pattern being substantially the same in parallel planes. For these problems, the governing differential equation for steady state, incompressible, isotropic flow in the xy plane, is
Where, h(x, y) = distribution of the total energy head within and on the boundaries of a flow region, and&= coefficients of permeability in x and y directions, respectively. If the flow system is isotropic,= , and Eqn. (14.1) reduces to
Equation (14.2), called Laplace’s equation, is the governing relationship for steady state, laminar-flow conditions (Darcy‟s law is valid). The general body of knowledge relating to Laplace‟s equation is called potential theory. Correspondingly, incompressible steady state fluid flow is often called potential flow.
The introduction of the velocity potential fis defined as
Where, h = total head, = pressure head, z = elevation head, and C = arbitrary constant. It should be apparent that, for isotropic conditions,
Where &= components of the velocity in the x and y directions, respectively.
and Eqn. (14.2) will produce,
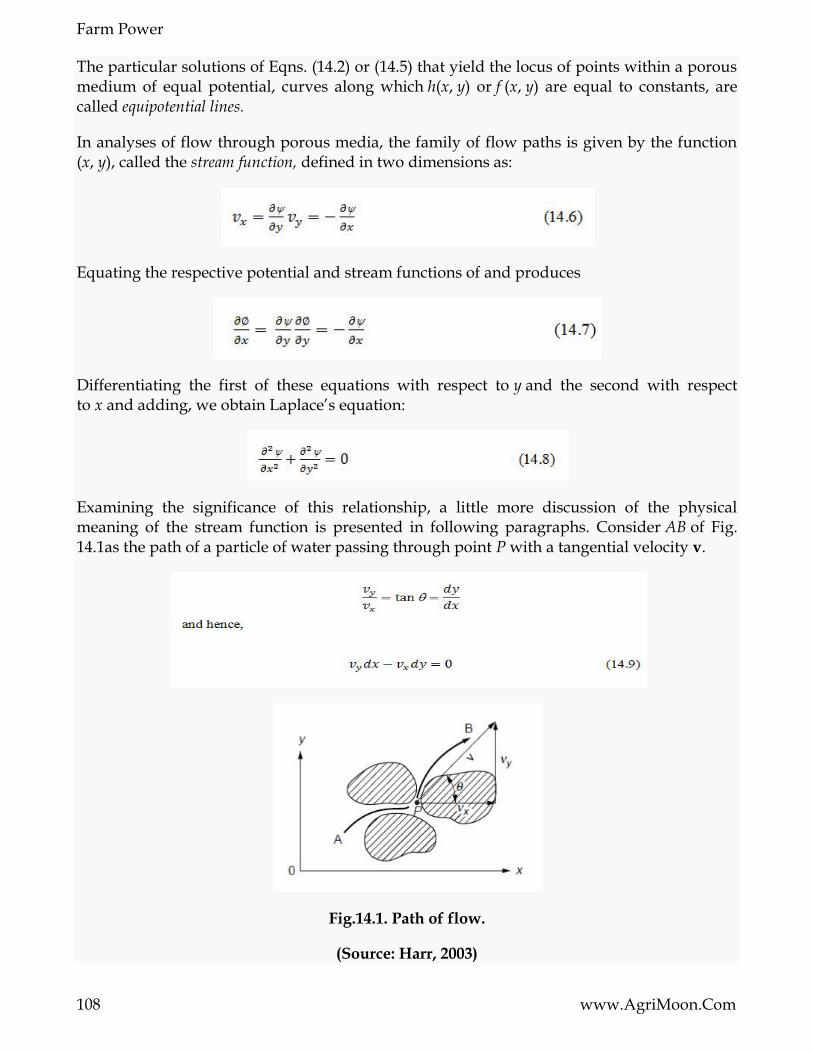
Farm Power
108 www.AgriMoon.Com
The particular solutions of Eqns. (14.2) or (14.5) that yield the locus of points within a porous medium of equal potential, curves along which h(x, y) or f (x, y) are equal to constants, are called equipotential lines.
In analyses of flow through porous media, the family of flow paths is given by the function (x, y), called the stream function, defined in two dimensions as:
Equating the respective potential and stream functions of and produces
Differentiating the first of these equations with respect to y and the second with respect to x and adding, we obtain Laplace‟s equation:
Examining the significance of this relationship, a little more discussion of the physical meaning of the stream function is presented in following paragraphs. Consider AB of Fig. 14.1as the path of a particle of water passing through point P with a tangential velocity v.
Fig.14.1. Path of flow.
(Source: Harr, 2003)
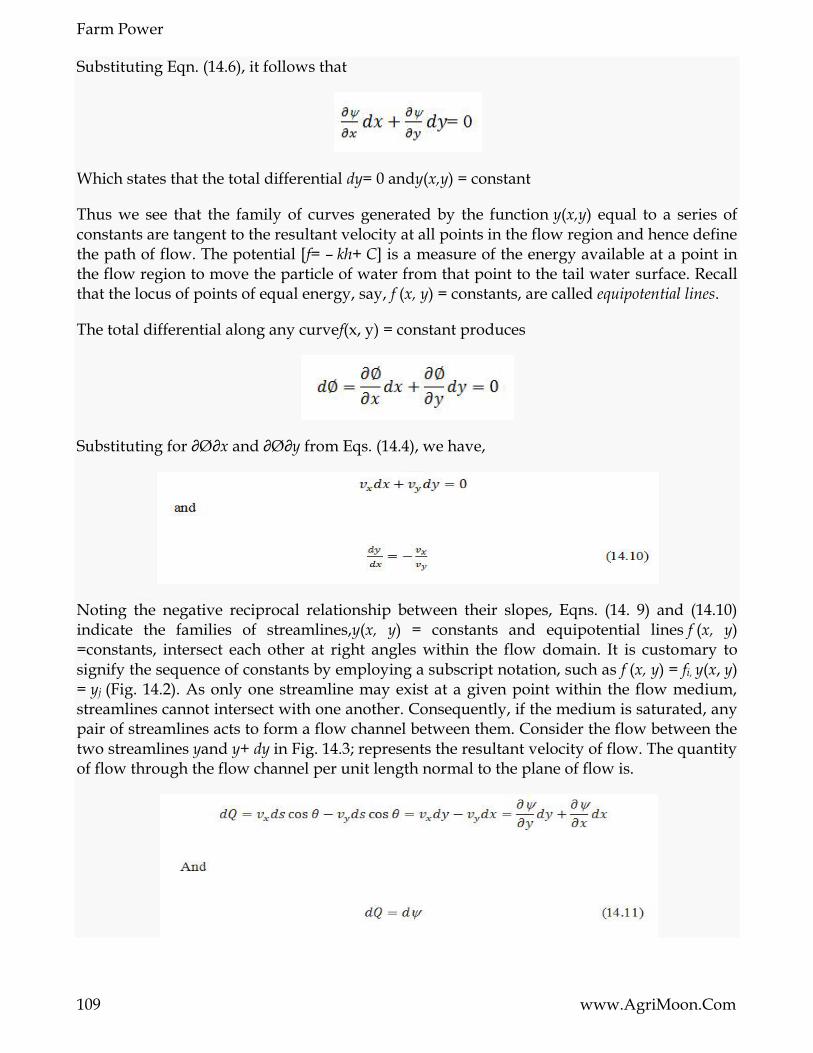
Farm Power
109 www.AgriMoon.Com
Substituting Eqn. (14.6), it follows that
Which states that the total differential dy= 0 andy(x,y) = constant
Thus we see that the family of curves generated by the function y(x,y) equal to a series of constants are tangent to the resultant velocity at all points in the flow region and hence define the path of flow. The potential [f= – kh+ C] is a measure of the energy available at a point in the flow region to move the particle of water from that point to the tail water surface. Recall that the locus of points of equal energy, say, f (x, y) = constants, are called equipotential lines.
The total differential along any curvef(x, y) = constant produces
Substituting for ∂Ø∂x and ∂Ø∂y from Eqs. (14.4), we have,
Noting the negative reciprocal relationship between their slopes, Eqns. (14. 9) and (14.10) indicate the families of streamlines,y(x, y) = constants and equipotential lines f (x, y) =constants, intersect each other at right angles within the flow domain. It is customary to signify the sequence of constants by employing a subscript notation, such as f (x, y) = fi, y(x, y) = yj (Fig. 14.2). As only one streamline may exist at a given point within the flow medium, streamlines cannot intersect with one another. Consequently, if the medium is saturated, any pair of streamlines acts to form a flow channel between them. Consider the flow between the two streamlines yand y+ dy in Fig. 14.3; represents the resultant velocity of flow. The quantity of flow through the flow channel per unit length normal to the plane of flow is.
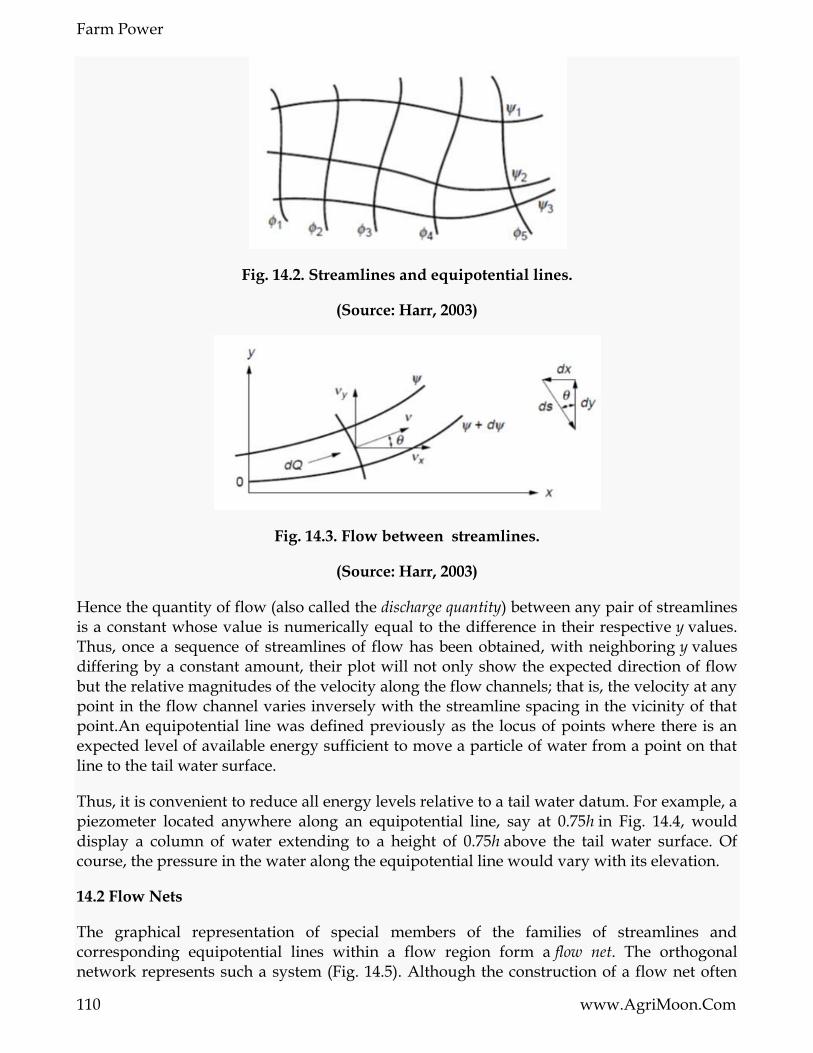
Farm Power
110 www.AgriMoon.Com
Fig. 14.2. Streamlines and equipotential lines.
(Source: Harr, 2003)
Fig. 14.3. Flow between streamlines.
(Source: Harr, 2003)
Hence the quantity of flow (also called the discharge quantity) between any pair of streamlines is a constant whose value is numerically equal to the difference in their respective y values. Thus, once a sequence of streamlines of flow has been obtained, with neighboring y values differing by a constant amount, their plot will not only show the expected direction of flow but the relative magnitudes of the velocity along the flow channels; that is, the velocity at any point in the flow channel varies inversely with the streamline spacing in the vicinity of that point.An equipotential line was defined previously as the locus of points where there is an expected level of available energy sufficient to move a particle of water from a point on that line to the tail water surface.
Thus, it is convenient to reduce all energy levels relative to a tail water datum. For example, a piezometer located anywhere along an equipotential line, say at 0.75h in Fig. 14.4, would display a column of water extending to a height of 0.75h above the tail water surface. Of course, the pressure in the water along the equipotential line would vary with its elevation.
14.2 Flow Nets
The graphical representation of special members of the families of streamlines and corresponding equipotential lines within a flow region form a flow net. The orthogonal network represents such a system (Fig. 14.5). Although the construction of a flow net often
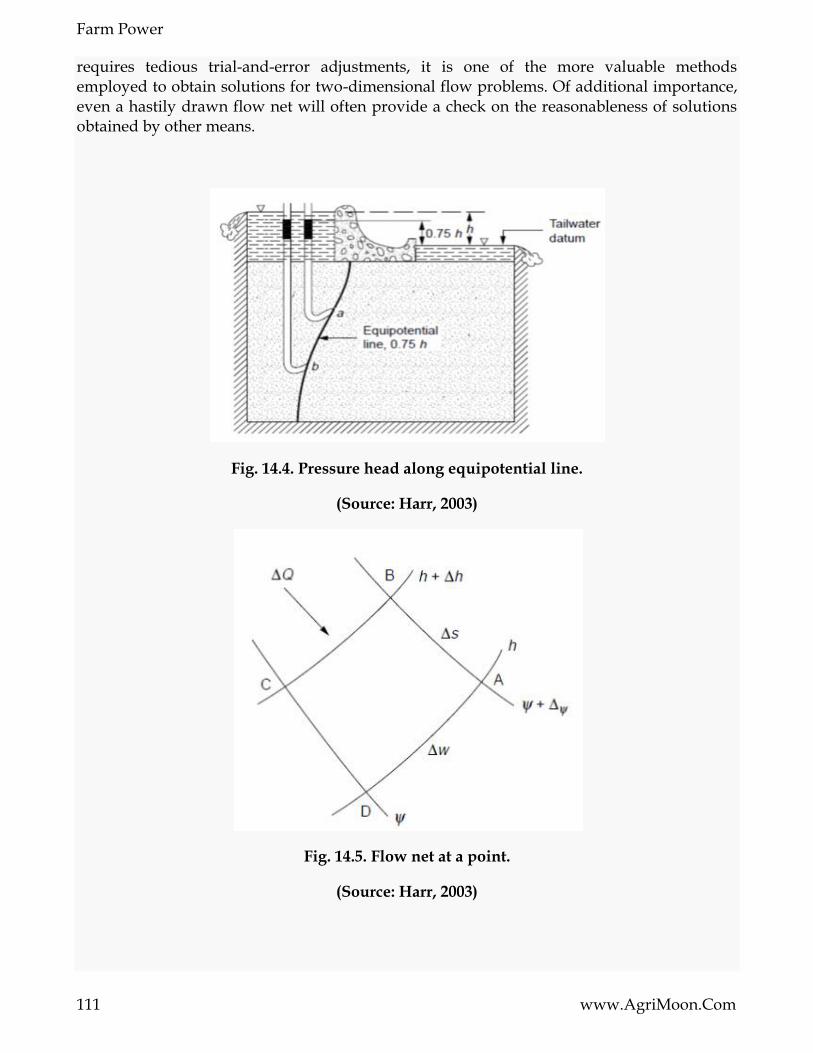
Farm Power
111 www.AgriMoon.Com
requires tedious trial-and-error adjustments, it is one of the more valuable methods employed to obtain solutions for two-dimensional flow problems. Of additional importance, even a hastily drawn flow net will often provide a check on the reasonableness of solutions obtained by other means.
Fig. 14.4. Pressure head along equipotential line.
(Source: Harr, 2003)
Fig. 14.5. Flow net at a point.
(Source: Harr, 2003)

Farm Power
112 www.AgriMoon.Com
14.3 Characteristics of Flow Nets
1. Flow lines or stream lines represent flow paths of particles of water.
2. Flow lines and equipotential line are orthogonal to each other.
3. The area between two flow lines is called a flow channel.
4. The rate of flow in a flow channel is constant.
5. Flow cannot occur across flow lines.
6. An equipotential line is a line joining points with the same head.
7. The velocity of flow is normal to the equipotential line.
8. The difference in head between two equipotential lines is called the potential drop or head loss (dh).
9. A flow line cannot intersect another flow line.
10. An equipotential line cannot intersect another equipotential line.
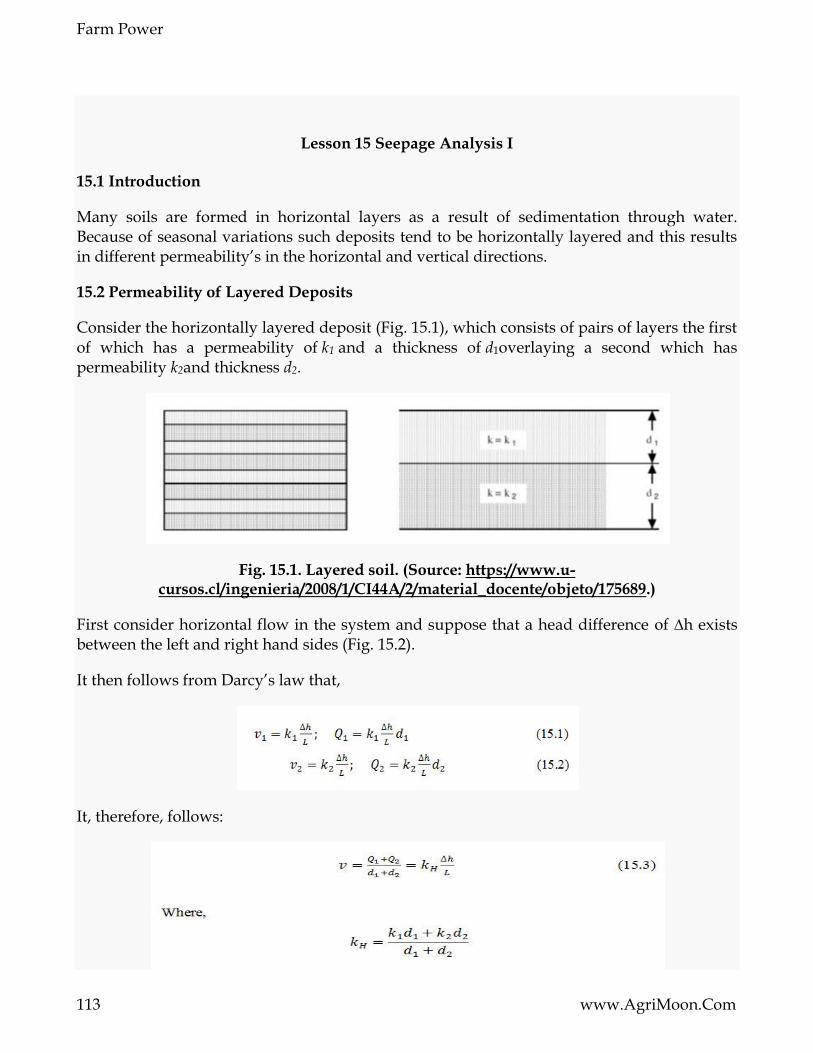
Farm Power
113 www.AgriMoon.Com
Lesson 15 Seepage Analysis I
15.1 Introduction
Many soils are formed in horizontal layers as a result of sedimentation through water. Because of seasonal variations such deposits tend to be horizontally layered and this results in different permeability‟s in the horizontal and vertical directions.
15.2 Permeability of Layered Deposits
Consider the horizontally layered deposit (Fig. 15.1), which consists of pairs of layers the first of which has a permeability of k1 and a thickness of d1overlaying a second which has permeability k2and thickness d2.
Fig. 15.1. Layered soil. (Source: https://www.u-cursos.cl/ingenieria/2008/1/CI44A/2/material_docente/objeto/175689.)
First consider horizontal flow in the system and suppose that a head difference of ∆h exists between the left and right hand sides (Fig. 15.2).
It then follows from Darcy‟s law that,
It, therefore, follows:
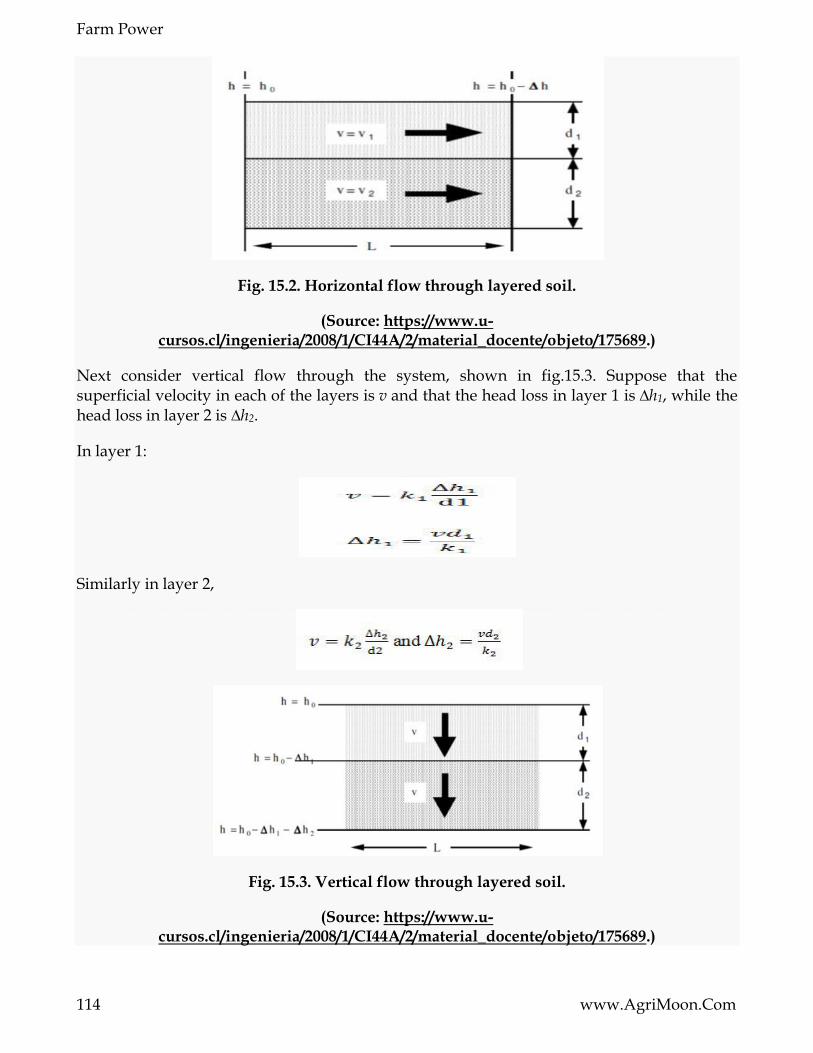
Farm Power
114 www.AgriMoon.Com
Fig. 15.2. Horizontal flow through layered soil.
(Source: https://www.u-cursos.cl/ingenieria/2008/1/CI44A/2/material_docente/objeto/175689.)
Next consider vertical flow through the system, shown in fig.15.3. Suppose that the superficial velocity in each of the layers is v and that the head loss in layer 1 is ∆h1, while the head loss in layer 2 is ∆h2.
In layer 1:
Similarly in layer 2,
Fig. 15.3. Vertical flow through layered soil.
(Source: https://www.u-cursos.cl/ingenieria/2008/1/CI44A/2/material_docente/objeto/175689.)

Farm Power
115 www.AgriMoon.Com
The total head loss across the system will be ∆h=∆h1+∆h2 and the hydraulic gradient will be given by,
For vertical flow Darcy's law gives,
Total head loss is, ∆h =, we can write,
15.3 Flow Nets for Soil with Anisotropic Permeability
Flow in a plane in an anisotropic material having a horizontal permeability kH and a vertical permeability, kv is governed by the equation:
The solution of this equation can be reduced to that of flow in an isotropic material by the following simple device. Introduce new variables defined as follows:
Dividing the equation by, the seepage equation then becomes
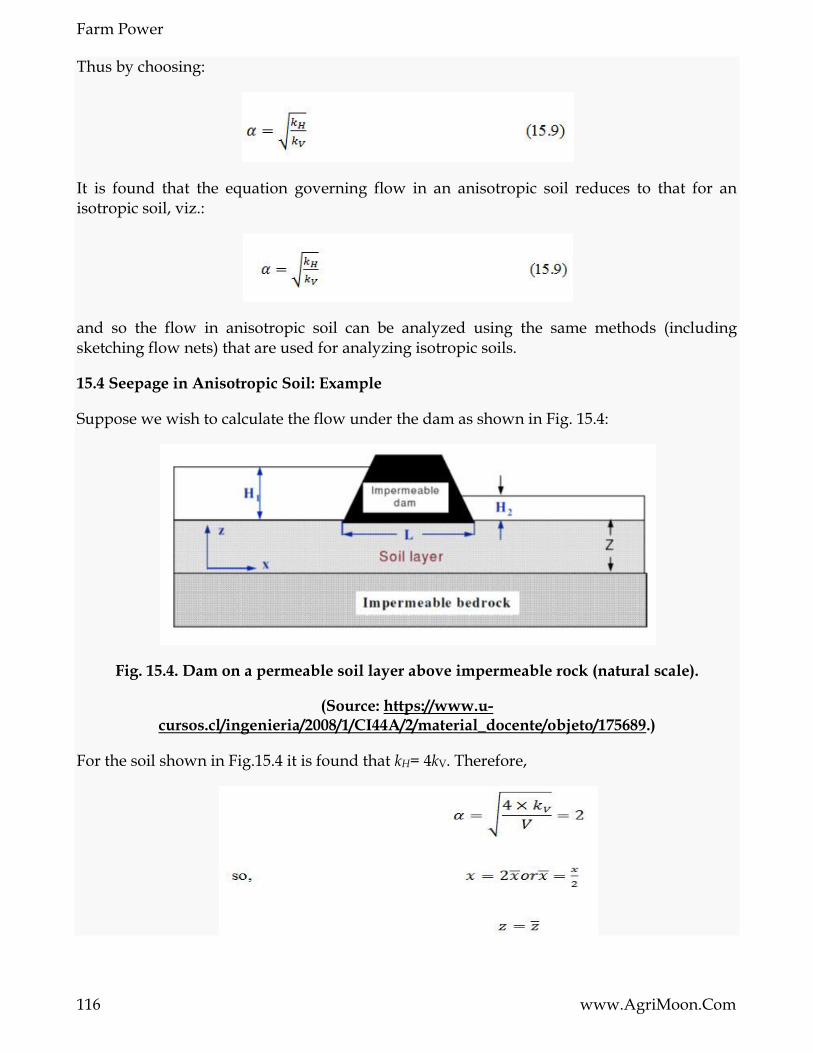
Farm Power
116 www.AgriMoon.Com
Thus by choosing:
It is found that the equation governing flow in an anisotropic soil reduces to that for an isotropic soil, viz.:
and so the flow in anisotropic soil can be analyzed using the same methods (including sketching flow nets) that are used for analyzing isotropic soils.
15.4 Seepage in Anisotropic Soil: Example
Suppose we wish to calculate the flow under the dam as shown in Fig. 15.4:
Fig. 15.4. Dam on a permeable soil layer above impermeable rock (natural scale).
(Source: https://www.u-cursos.cl/ingenieria/2008/1/CI44A/2/material_docente/objeto/175689.)
For the soil shown in Fig.15.4 it is found that kH= 4kV. Therefore,
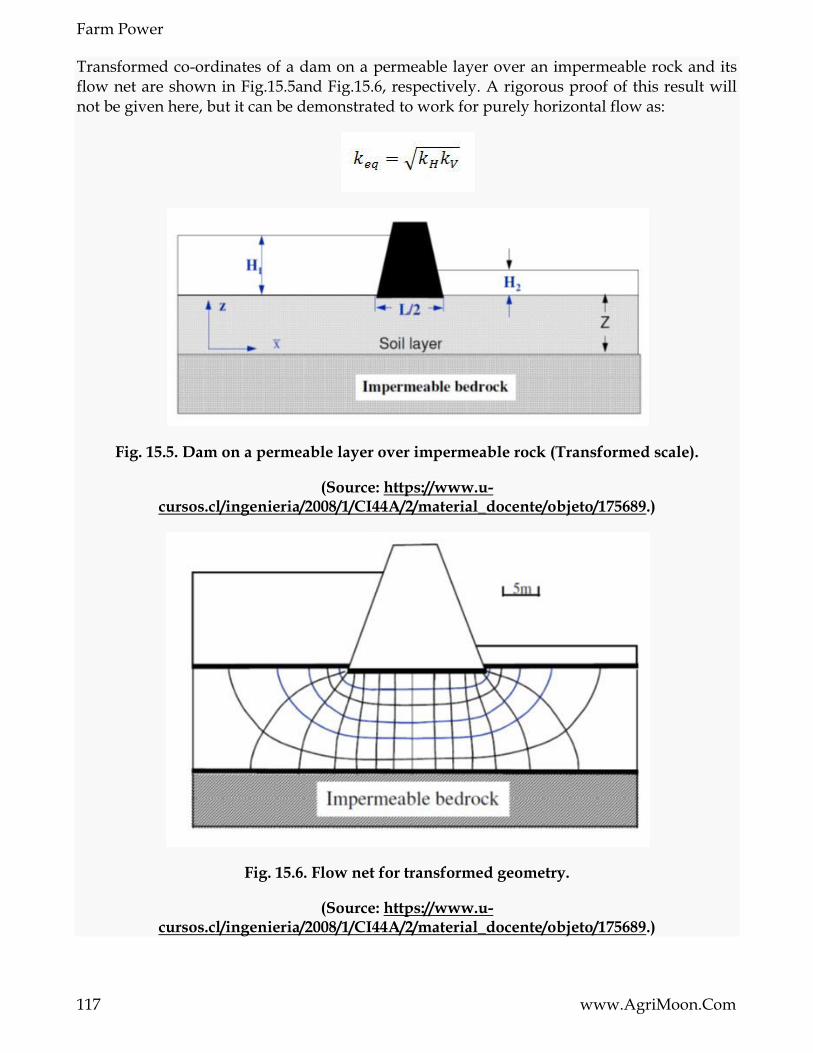
Farm Power
117 www.AgriMoon.Com
Transformed co-ordinates of a dam on a permeable layer over an impermeable rock and its flow net are shown in Fig.15.5and Fig.15.6, respectively. A rigorous proof of this result will not be given here, but it can be demonstrated to work for purely horizontal flow as:
Fig. 15.5. Dam on a permeable layer over impermeable rock (Transformed scale).
(Source: https://www.u-cursos.cl/ingenieria/2008/1/CI44A/2/material_docente/objeto/175689.)
Fig. 15.6. Flow net for transformed geometry.
(Source: https://www.u-cursos.cl/ingenieria/2008/1/CI44A/2/material_docente/objeto/175689.)

Farm Power
118 www.AgriMoon.Com
Figure 15.7 shows horizontal flow through anisotropic soil in natural and transformed scale.
Fig. 15.7. Horizontal flow through anisotropic soil.
(Source: https://www.u-cursos.cl/ingenieria/2008/1/CI44A/2/material_docente/objeto/175689.)
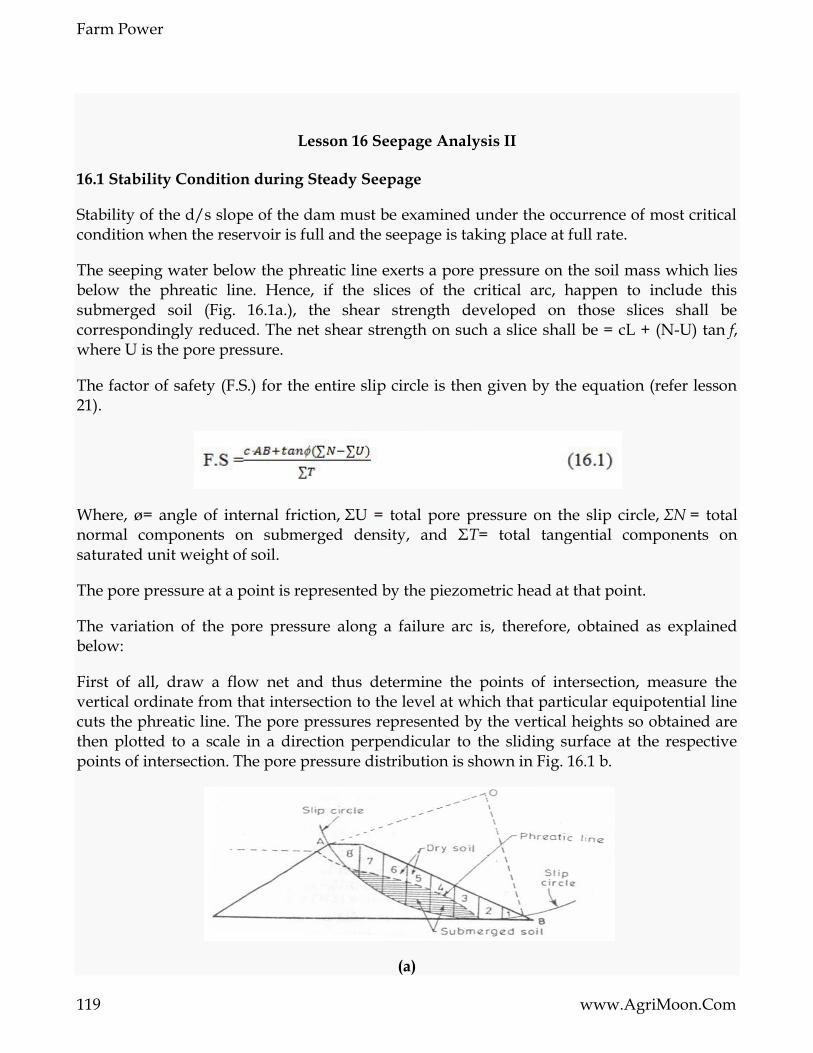
Farm Power
119 www.AgriMoon.Com
Lesson 16 Seepage Analysis II
16.1 Stability Condition during Steady Seepage
Stability of the d/s slope of the dam must be examined under the occurrence of most critical condition when the reservoir is full and the seepage is taking place at full rate.
The seeping water below the phreatic line exerts a pore pressure on the soil mass which lies below the phreatic line. Hence, if the slices of the critical arc, happen to include this submerged soil (Fig. 16.1a.), the shear strength developed on those slices shall be correspondingly reduced. The net shear strength on such a slice shall be = cL + (N-U) tan f, where U is the pore pressure.
The factor of safety (F.S.) for the entire slip circle is then given by the equation (refer lesson 21).
Where, ø= angle of internal friction, ΣU = total pore pressure on the slip circle, ΣN = total normal components on submerged density, and ΣT= total tangential components on saturated unit weight of soil.
The pore pressure at a point is represented by the piezometric head at that point.
The variation of the pore pressure along a failure arc is, therefore, obtained as explained below:
First of all, draw a flow net and thus determine the points of intersection, measure the vertical ordinate from that intersection to the level at which that particular equipotential line cuts the phreatic line. The pore pressures represented by the vertical heights so obtained are then plotted to a scale in a direction perpendicular to the sliding surface at the respective points of intersection. The pore pressure distribution is shown in Fig. 16.1 b.
(a)
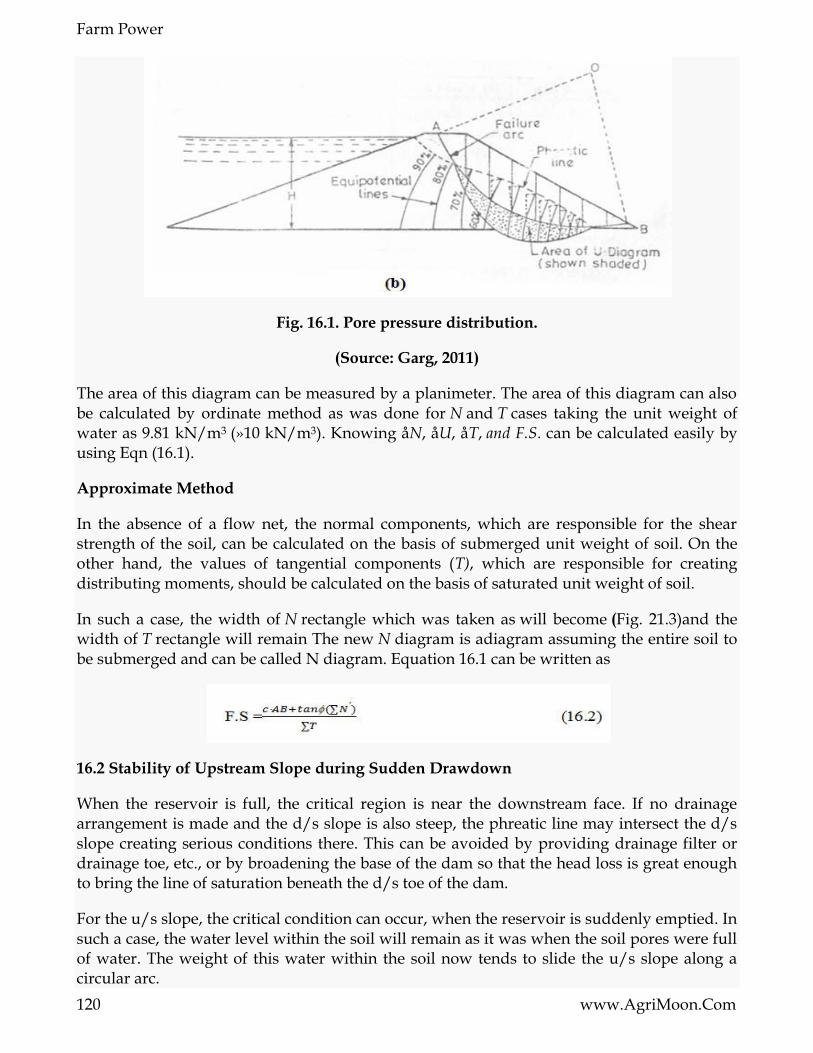
Farm Power
120 www.AgriMoon.Com
Fig. 16.1. Pore pressure distribution.
(Source: Garg, 2011)
The area of this diagram can be measured by a planimeter. The area of this diagram can also be calculated by ordinate method as was done for N and T cases taking the unit weight of water as 9.81 kN/m3 (»10 kN/m3). Knowing åN, åU, åT, and F.S. can be calculated easily by using Eqn (16.1).
Approximate Method
In the absence of a flow net, the normal components, which are responsible for the shear strength of the soil, can be calculated on the basis of submerged unit weight of soil. On the other hand, the values of tangential components (T), which are responsible for creating distributing moments, should be calculated on the basis of saturated unit weight of soil.
In such a case, the width of N rectangle which was taken as will become (Fig. 21.3)and the width of T rectangle will remain The new N diagram is adiagram assuming the entire soil to be submerged and can be called N diagram. Equation 16.1 can be written as
16.2 Stability of Upstream Slope during Sudden Drawdown
When the reservoir is full, the critical region is near the downstream face. If no drainage arrangement is made and the d/s slope is also steep, the phreatic line may intersect the d/s slope creating serious conditions there. This can be avoided by providing drainage filter or drainage toe, etc., or by broadening the base of the dam so that the head loss is great enough to bring the line of saturation beneath the d/s toe of the dam.
For the u/s slope, the critical condition can occur, when the reservoir is suddenly emptied. In such a case, the water level within the soil will remain as it was when the soil pores were full of water. The weight of this water within the soil now tends to slide the u/s slope along a circular arc.
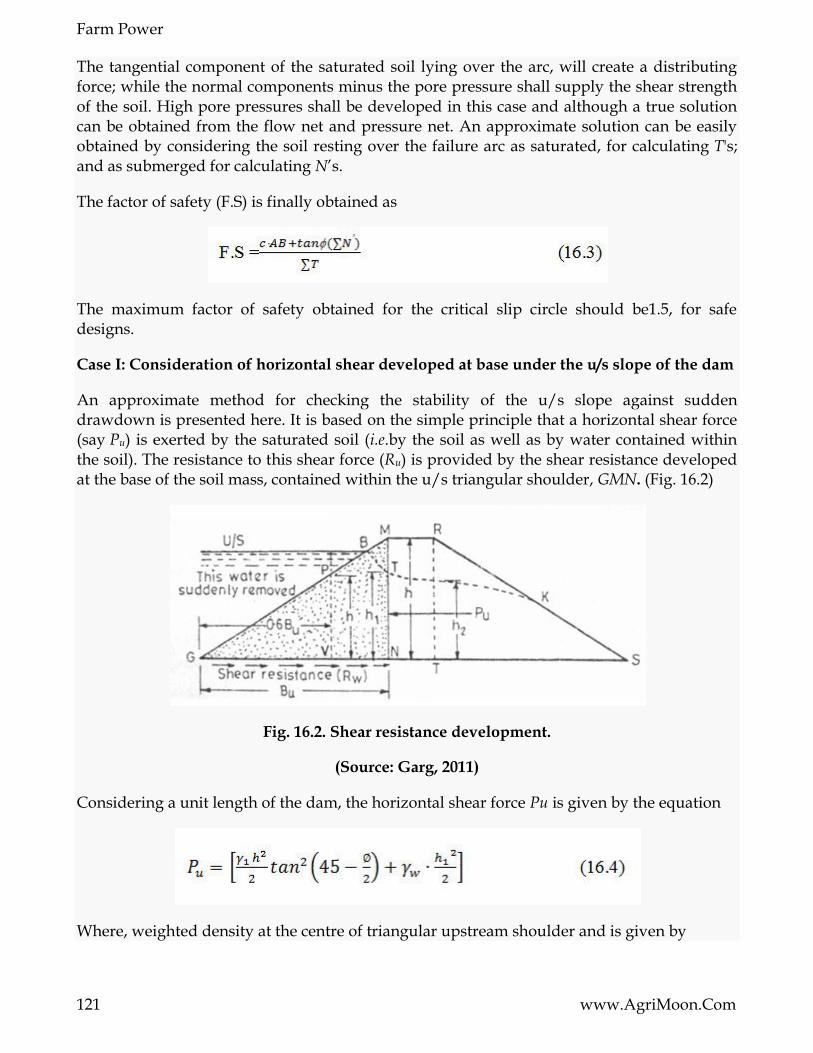
Farm Power
121 www.AgriMoon.Com
The tangential component of the saturated soil lying over the arc, will create a distributing force; while the normal components minus the pore pressure shall supply the shear strength of the soil. High pore pressures shall be developed in this case and although a true solution can be obtained from the flow net and pressure net. An approximate solution can be easily obtained by considering the soil resting over the failure arc as saturated, for calculating T's; and as submerged for calculating N‟s.
The factor of safety (F.S) is finally obtained as
The maximum factor of safety obtained for the critical slip circle should be1.5, for safe designs.
Case I: Consideration of horizontal shear developed at base under the u/s slope of the dam
An approximate method for checking the stability of the u/s slope against sudden drawdown is presented here. It is based on the simple principle that a horizontal shear force (say Pu) is exerted by the saturated soil (i.e.by the soil as well as by water contained within the soil). The resistance to this shear force (Ru) is provided by the shear resistance developed at the base of the soil mass, contained within the u/s triangular shoulder, GMN. (Fig. 16.2)
Fig. 16.2. Shear resistance development.
(Source: Garg, 2011)
Considering a unit length of the dam, the horizontal shear force Pu is given by the equation
Where, weighted density at the centre of triangular upstream shoulder and is given by
Farm Power
122 www.AgriMoon.Com
Shear resistance of u/s slope portion of the dam developed at base GN is given by
Where, W= weight of the u/s triangular shoulder of dam, and C=total cohesive force developed at base, GN.
If c is the unit cohesion of the dam soil, then where,= length GN.
The triangular profile of the u/s slope portion of dam has an area GBTN as the submerged soil (soil below the seepage line) and an area equal to BMT as dry area. The correct weight W will be equal to. These areas can be measured by a plainmeter. If the measuring of the areas is to be avoided, the entire area may be taken as submerged. By doing so, the weight W will be slightly reduced, and thus or Ru or F.S. will be slightly reduced. Hence the results obtained will be on a safer side.
In such a case,
Now Pu and Ru are known, the factor of safety against sliding can be easily calculated, using
It should be more than 1.5.
The factor of safety calculated above is with respect to average shear (av), which will be equal to

Farm Power
123 www.AgriMoon.Com
It has been found by photo-elastic studies that the maximum intensity of shear stress occurs at a distance 0.6 Bu from the heel (i.e.0.4Bu from the shoulder) and is equal to 1.4 times the average shear intensity.
Maximum shear stress induced
Which is developed at the point V (Fig. 16.2) such that GV=0.6 Bu.
The unit shearing resistance developed at this point V is given by
F.S at the point of the maximum shear
It should be more than 1.
Case II: Considerations of horizontal shear developed at base under the d/s slope of the dam
The stability of the d/s slope under steady seepage is generally tested with Swedish slip circle method. However, the F.S against the horizontal shear forces can be evaluated on the same principles as was done for the u/s slope in the previous paragraphs.
Fig. 16.3. Shear resistance development.
(Source: Garg, 2011)
Farm Power
124 www.AgriMoon.Com
With reference to Fig. 16.3, the horizontal shear force Pd, in this case, is given by
Where = weighted density at the centre of the triangular shoulder downstream, given by
Shear resistance Rd of d/s slope portion of dam, developed at base is given by
Where, W= weight of the d/s slope portion of dam, C=c× (Bd×1), where c is the unit cohesion.
The triangular profile of the d/s slope portion of dam (Fig. 16.3) has an area say A1 of dry soil above the seepage line and the area of submerged soil say A2 below the seepage lines. These areas can be measured by a planimeter and then,
If the measuring of the areas is to be avoided, the entire weight W may be calculated on the basis of submerged soil, as it will be on a still safer side. In that case,
Knowing Pd and Rd, the factor of safety against shear can be easily determined as
The factor of safety at the point of maximum shear can also be determined in the same manner as was explained for the u/s slope portion.
Farm Power
125 www.AgriMoon.Com
Lesson 17 Failure and Damages I
17.1 Nature and Importance
In recent years, dam safety draws increasing attention from the public. This is because floods resulting from dam or levee failures can lead to devastating disasters with tremendous loss of life and property, especially in densely populated areas. Obviously, analysis of dam failures is of critical importance for disasters prevention and mitigation. Hence, a robust understanding of the characteristics of dam failures (e.g., failure mode, cause, and key influence factors) is needed.
With respect to earth dams, the term “failure” is defined herein as an occurrence of excessive erosion or deformation of the embankment that may result in an uncontrolled release of reservoir water or damage to appurtenant structures. To assess the safety of a dam and the possibility of failure, the different potential failure mechanisms must be recognized. Failure mechanisms are grouped into four general categories (Fig. 17.1) slope stability, piping, overtopping, and foundation failures. By understanding these failure mechanisms, a geotechnical program of investigation, analysis, instrumentation, and monitoring can be developed to assess the safety of the dam with respect to each failure mechanism. Many dams and other earth-fill dams fail because of poor planning, investigation, design, construction practices, and maintenance.
17.2 Slope Stability Failures
Two forces act upon the soil mass within an embankment. The driving force, due to the weight of the soil, tends to move the soil mass down slope. The resisting force, due to the strength of the soil along the base of the soil mass, or “slip surface,” tends to hold the soil mass in place. If the driving force is greater than the resisting force, the soil mass will slide along the slip surface and a slope stability failure will occur. The potential for failure for a given soil mass is quantified in terms of the Factor of Safety, which is defined as the resisting force divided by the driving force. If the Factor of Safety is greater than 1.0, the soil mass will not slide.

Farm Power
126 www.AgriMoon.Com
Fig. 17.1. Failure mechanisms for earth dams.
(Source: http://www.eng.kufauniv.com)
Factors of Safety are typically calculated assuming that the soil mass is crescent-shaped and the slip surface is a circular arc. This type of failure surface is generally consistent with observations of historically observed slope stability failures and facilitates the use of computer programs in the analysis, although soil masses with non-circular slip surfaces may also be evaluated. By using a computer to calculate Factors of Safety for a number of different soil masses and slip surfaces, the lowest overall Factor of Safety can be automatically derived.
For earth dams, there are three types of slope stability failures: steady-state, seismic, and rapid-drawdown. For the steady-state case, failure occurs on the downstream side of the dam under conditions of steady-state seepage. This type of failure may occur as a result of an increase in pore water pressure in the dam. For the rapid-drawdown case, failure occurs on the upstream side of the embankment as a result of a sudden lowering of the reservoir level.
For the seismic case, the driving force on the soil mass increases due to horizontal earthquake force, while the resisting force may be reduced if portions of the embankment or foundation liquefy. Liquefaction can occur during an earthquake in loose, saturated, and sandy soils. During liquefaction, the soil particles are rearranged into a denser configuration, which tends to displace pore water. Since the pore water cannot vacate the pore spaces immediately, the pore water pressure temporarily increases. If this increase is sufficient, the soil particles become supported by the pore water, which has no shear strength. As a result, the shear strength of the soil approaches zero. When performing a seismic slope stability analysis, it may be found that at times during the earthquake when ground shaking is at a maximum, the Factor of Safety falls below 1.0 and some deformation occurs. A limited amount of

Farm Power
127 www.AgriMoon.Com
deformation (e.g. less than 2 or 3 m, depending on the height of the embankment) may be considered acceptable provided that there is no associated release of reservoir water.
17.3 Piping Failures
Properly designed earth dams are intended not to eliminate seepage completely, but to control seepage so that excessive water pressures within the embankment do not cause a steady-state slope stability failure. To control seepage, dams are often constructed with a core of fine-grained soil (to minimize seepage) flanked by zones of coarser-grained soil (to control seepage that does occur and prevent water pressure buildup). However, if measures are not taken to prevent the fine-grained soil particles from dislodging and seeping into the pore spaces of the coarse-grained soil, cavities can develop inside the dam. Cracks can also develop within the dam due to differential settlement within the embankment, especially if the depth to bedrock is highly variable. The cavities and cracks can act as preferential conduits for water to flow freely through the dam and erode the dam from the inside out. This phenomenon, referred to as “piping,” can cause a dam to fail suddenly and catastrophically. Cracks and fissures, high-permeability strata, and Karst features in the foundation and abutments may also act as preferential conduits and contribute to piping.
17.4 Overtopping Failures
Dams are designed with principal and emergency spillways to control the maximum reservoir elevation and prevent the reservoir from flowing over the top of the dam, or “overtopping.” Overtopping may occur when the spillways are not adequately designed, or if they become obstructed and cease to function.
Overtopping can cause large amounts of erosion on the down slope side of the dam, which may compromise the stability of the dam.
17.5 Foundation Failures
When a new dam is constructed, the underlying foundation materials must bear a significant load due to the weight of the dam and reservoir. If the foundation consists of weak materials, such as soft clay, a foundation stability failure can occur, leading to significant deformation of the embankment. Failures may also occur under steady-state conditions in existing dams if a weak or permeable seam exists in the foundation. If seepage occurs along a seam, the elevated pore pressure and increased water content of the seam material may cause a reduction in strength along the seam. Piping within the seam may also be a contributing factor. Karts features may affect foundation capacity by allowing preferential flow, causing stress concentrations in the foundation rock, and presenting opportunities for limestone dissolution. Finally, liquefaction of granular soils during an earthquake may reduce the stability of the foundation.
Farm Power
128 www.AgriMoon.Com
Lesson 18 Failure and Damages II
18.1 Causes of Earthen Dam Failure
Earth dams are less rigid and hence more susceptible to failure. Every past failure of such a dam has contributed to an increase in the knowledge of the earth dam designers. Earthen dams may fail, like other engineering structures, due to improper designs, faulty constructions, lack of maintenance, etc. The various causes leading to the failure of earth dams can be grouped as: (1) Hydraulic failures, (2) Seepage failures, and (3) Structural failures.
18.1.1Hydraulic Failures
About 40% of earth dam failures have been attributed to these causes. The failure under this category may occur due to the following reasons:
(a) By over Topping
The water may overtop the dam, if the design flood and spillway capacity are under-estimated. Therefore, sufficient freeboard should be provided as an additional safety measure.
(b) Erosion of Upstream Face
The waves developed near the top water surface due to the winds, try to notch-out the soil from the upstream face and may even, sometimes, cause the slip of the upstream slope. Upstream stone pitching or riprap should, therefore, be provided to avoid such failures.
(c) Cracking Due to Frost Action
Frost in the upper portion of the dam may cause heaving and cracking of the soil with dangerous seepage and consequent failure. An additional freeboard allowance up to a maximum of say 1.5 m should, therefore, be provided for dams in areas of low temperatures.
(d) Erosion of Downstream Face by Gully Formation
Heavy rains falling directly over the downstream face and the erosive action of the moving water, may lead to the formation of gullies on the downstream face, ultimately leading to the dam failure. This can be avoided by proper maintenance, filling the cuts from time to time especially during rainy season, by grassing the slopes and by providing proper berms at suitable heights (Fig. 18.1), so that the water has not to flow for considerable distances. The proper drainage arrangements are made for the removal of the rain water collected on the horizontal berms. Since the provision of berms ensures the collection and removal of water before it acquires high downward velocities, the consequent erosion caused by the moving water (run off) is considerably reduced.

Farm Power
129 www.AgriMoon.Com
(e) Erosion of the D/s Toe
The d/s toe of the earth dam may get eroded due to two reasons, i.e. (i) the erosion due to cross currents that may come from the spillway; and (ii) the erosion due to tail water. This erosion of the toe can be avoided by providing a downstream slope pitching or a riprap up to a height slightly above the normal tail water depth. Side walls of the spillway must be sufficient height and length, as so to prevent the possibility of the cross flow towards the earthen embankment.
Fig. 18.1. Gully erosion control in embankment.
(Source: Garg, 2011)
18.1.2 Seepage Failures
Controlled seepage or limited uniform seepage is inevitable in all earth dams, and ordinarily it does not produce any harm. However, uncontrolled or concentrated seepage through the dam body or through its foundation may lead to piping is the progressive erosion and subsequent removal of the soil grains from within the body of the dam or the foundation of the dam. Sloughing is the progressive removal of soil from the wet downstream face. More than 1/3rd of the earth dams have failed because of these reasons.
(a) Piping through Foundations
Sometimes, when highly permeable cavities or fissures or strata of coarse sand or gravel are present in the foundation of the dam, water may start seeping at huge rates through them (Fig.18.2). This concentrated flow at a high gradient may erode the soil. This leads to increase in flow of water and soil, ultimately resulting in a rush of water and soil, thereby, creating hollows below the foundation. The dam may sink down into the hollow so formed, causing its failure.
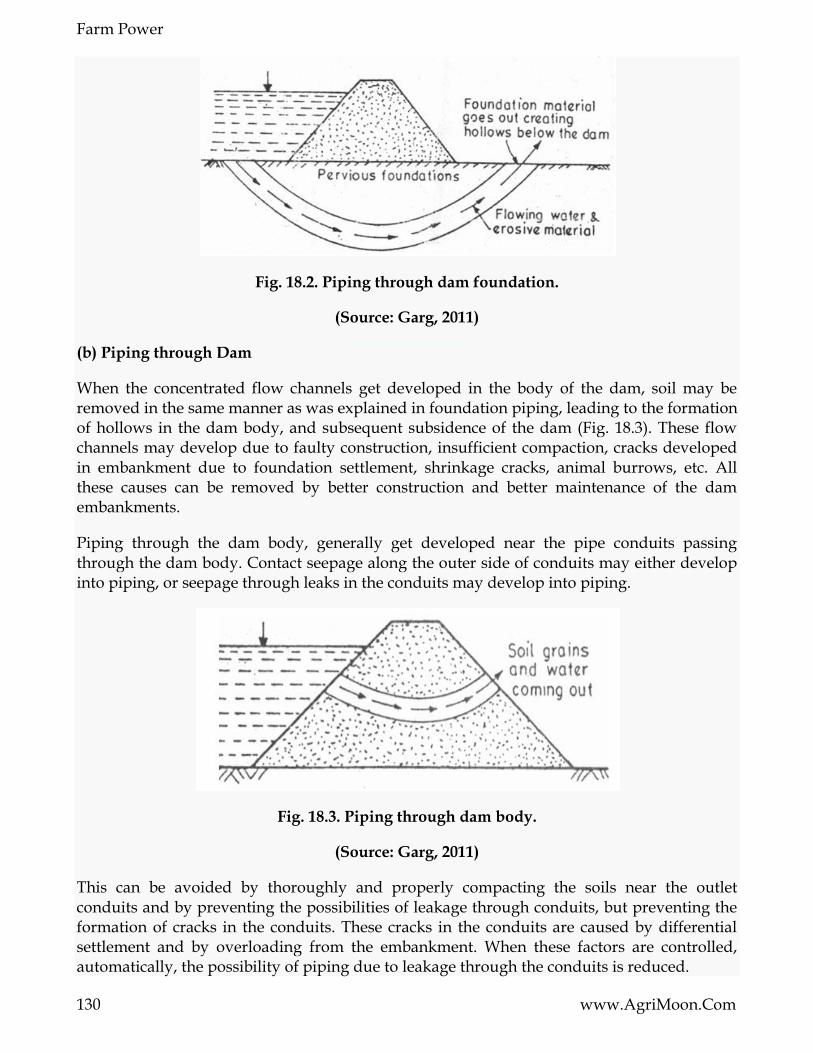
Farm Power
130 www.AgriMoon.Com
Fig. 18.2. Piping through dam foundation.
(Source: Garg, 2011)
(b) Piping through Dam
When the concentrated flow channels get developed in the body of the dam, soil may be removed in the same manner as was explained in foundation piping, leading to the formation of hollows in the dam body, and subsequent subsidence of the dam (Fig. 18.3). These flow channels may develop due to faulty construction, insufficient compaction, cracks developed in embankment due to foundation settlement, shrinkage cracks, animal burrows, etc. All these causes can be removed by better construction and better maintenance of the dam embankments.
Piping through the dam body, generally get developed near the pipe conduits passing through the dam body. Contact seepage along the outer side of conduits may either develop into piping, or seepage through leaks in the conduits may develop into piping.
Fig. 18.3. Piping through dam body.
(Source: Garg, 2011)
This can be avoided by thoroughly and properly compacting the soils near the outlet conduits and by preventing the possibilities of leakage through conduits, but preventing the formation of cracks in the conduits. These cracks in the conduits are caused by differential settlement and by overloading from the embankment. When these factors are controlled, automatically, the possibility of piping due to leakage through the conduits is reduced.
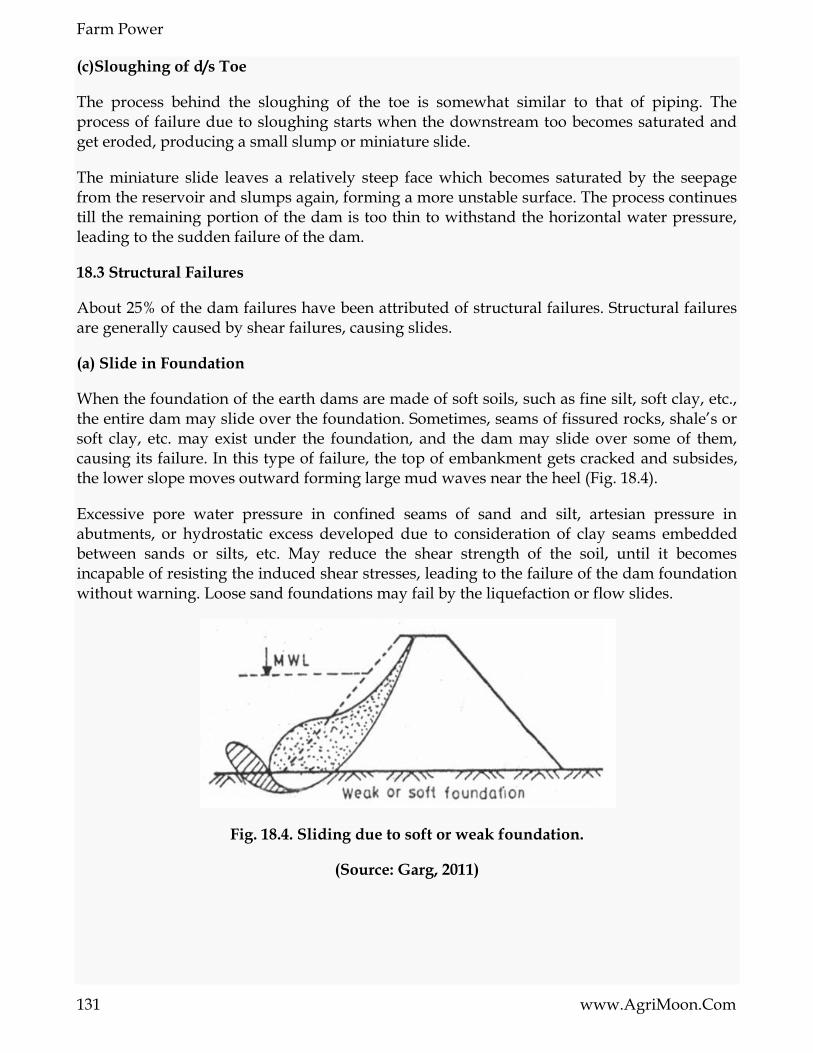
Farm Power
131 www.AgriMoon.Com
(c)Sloughing of d/s Toe
The process behind the sloughing of the toe is somewhat similar to that of piping. The process of failure due to sloughing starts when the downstream too becomes saturated and get eroded, producing a small slump or miniature slide.
The miniature slide leaves a relatively steep face which becomes saturated by the seepage from the reservoir and slumps again, forming a more unstable surface. The process continues till the remaining portion of the dam is too thin to withstand the horizontal water pressure, leading to the sudden failure of the dam.
18.3 Structural Failures
About 25% of the dam failures have been attributed of structural failures. Structural failures are generally caused by shear failures, causing slides.
(a) Slide in Foundation
When the foundation of the earth dams are made of soft soils, such as fine silt, soft clay, etc., the entire dam may slide over the foundation. Sometimes, seams of fissured rocks, shale‟s or soft clay, etc. may exist under the foundation, and the dam may slide over some of them, causing its failure. In this type of failure, the top of embankment gets cracked and subsides, the lower slope moves outward forming large mud waves near the heel (Fig. 18.4).
Excessive pore water pressure in confined seams of sand and silt, artesian pressure in abutments, or hydrostatic excess developed due to consideration of clay seams embedded between sands or silts, etc. May reduce the shear strength of the soil, until it becomes incapable of resisting the induced shear stresses, leading to the failure of the dam foundation without warning. Loose sand foundations may fail by the liquefaction or flow slides.
Fig. 18.4. Sliding due to soft or weak foundation.
(Source: Garg, 2011)
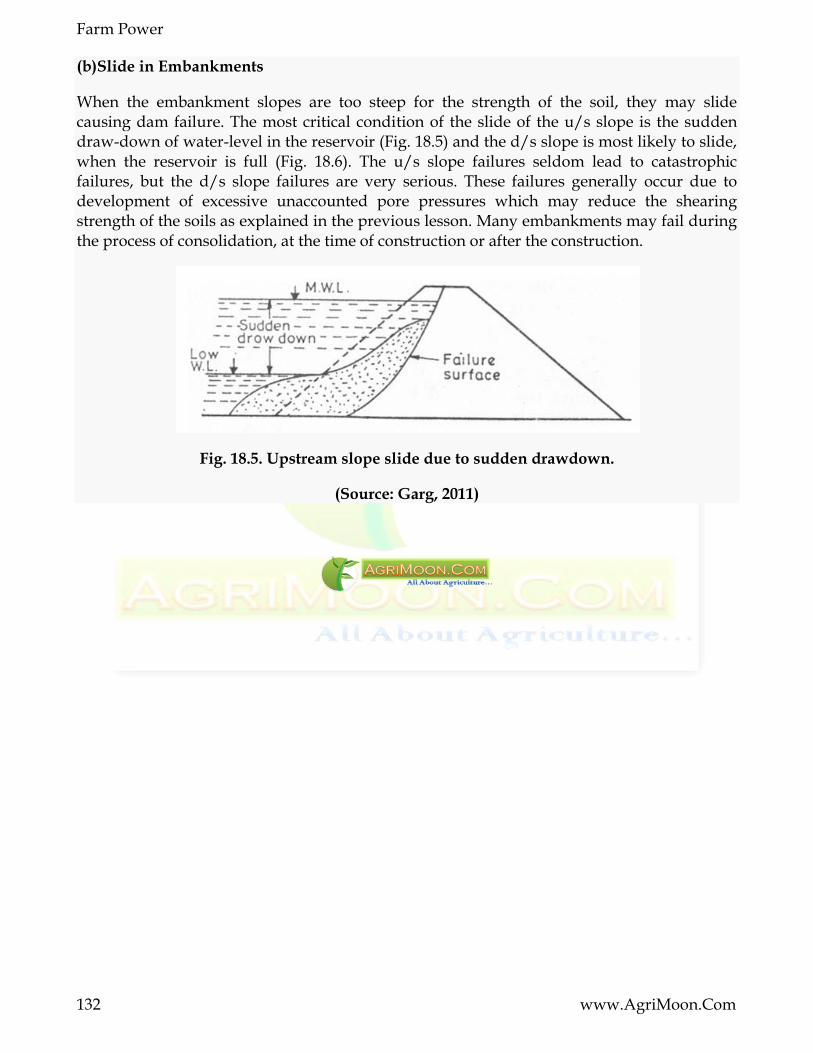
Farm Power
132 www.AgriMoon.Com
(b)Slide in Embankments
When the embankment slopes are too steep for the strength of the soil, they may slide causing dam failure. The most critical condition of the slide of the u/s slope is the sudden draw-down of water-level in the reservoir (Fig. 18.5) and the d/s slope is most likely to slide, when the reservoir is full (Fig. 18.6). The u/s slope failures seldom lead to catastrophic failures, but the d/s slope failures are very serious. These failures generally occur due to development of excessive unaccounted pore pressures which may reduce the shearing strength of the soils as explained in the previous lesson. Many embankments may fail during the process of consolidation, at the time of construction or after the construction.
Fig. 18.5. Upstream slope slide due to sudden drawdown.
(Source: Garg, 2011)

Farm Power
133 www.AgriMoon.Com
Lesson 19 Control of Seepage Using Drainage System
The water seeping through the body of the earthen dam or through the foundation of the earthen dam may prove harmful to the stability of the dam by causing softening and sloughing of the slopes due to development of pore pressures. It may also cause piping either through the body or through the foundation, and thus resulting in the failure of the dam.
19.1 Seepage Control through Embankments
Drainage filters called drains are generally provided in the form of (a) rock toe (b) horizontal blanket (c) chimney drain, etc., in order to control the seepage water. The provision of such filters reduces the pore pressure in the downstream portion of the dam and thus increases the stability of the dam, permitting steep slopes and thus affecting economy in construction. It also checks piping by migration of particles. These drain, consists of graded coarse material in which the seepage is collected and moved to a point where it can be safely discharged. In order to prevent movement of the fine material from the dam into the drain, the drain or filter material is graded from relatively fine on the periphery of the drain to course near the centre. A multi layered filter, generally called inverted filter or reverse filter is provided as per the criteria suggested by Terzaghi for the design of such filters. The various kinds of drains, which are commonly used are shown and described below.
19.1.1 Rock Toe or Toe Filter
The rock toe consists of stones of size usually varying from 15 to 20 cm (Fig. 19.1). A toe filter (graded in layers) is provided as a transition zone, between the homogeneous embankment fill and rock toe. Toe filter generally consists of three layers of fine sand, coarse sand, and gravel; as per the filter criteria requirements. The height of the rock toe is generally kept between 25 to 35% of reservoir head. The top of the rock toe must be sufficiently higher than the tail water depth, so as to prevent the wave action of the tail water.
Fig. 19.1. Rock Toe.
(Source: Garg, 2011)
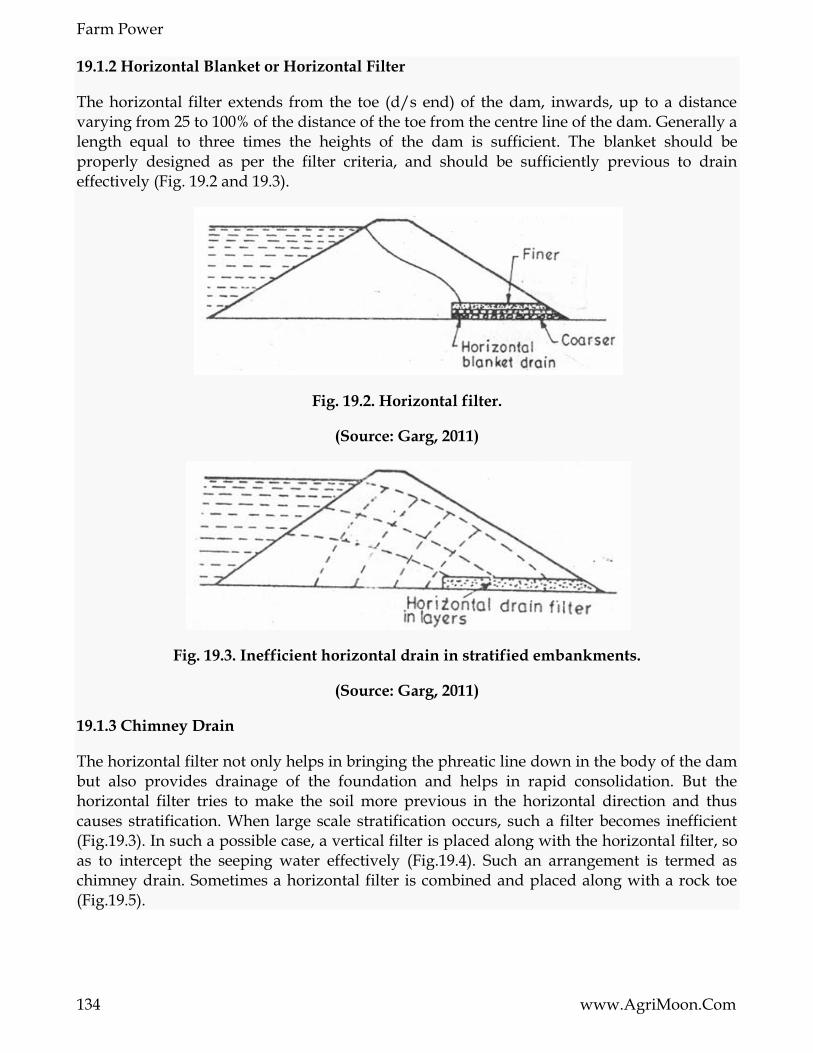
Farm Power
134 www.AgriMoon.Com
19.1.2 Horizontal Blanket or Horizontal Filter
The horizontal filter extends from the toe (d/s end) of the dam, inwards, up to a distance varying from 25 to 100% of the distance of the toe from the centre line of the dam. Generally a length equal to three times the heights of the dam is sufficient. The blanket should be properly designed as per the filter criteria, and should be sufficiently previous to drain effectively (Fig. 19.2 and 19.3).
Fig. 19.2. Horizontal filter.
(Source: Garg, 2011)
Fig. 19.3. Inefficient horizontal drain in stratified embankments.
(Source: Garg, 2011)
19.1.3 Chimney Drain
The horizontal filter not only helps in bringing the phreatic line down in the body of the dam but also provides drainage of the foundation and helps in rapid consolidation. But the horizontal filter tries to make the soil more previous in the horizontal direction and thus causes stratification. When large scale stratification occurs, such a filter becomes inefficient (Fig.19.3). In such a possible case, a vertical filter is placed along with the horizontal filter, so as to intercept the seeping water effectively (Fig.19.4). Such an arrangement is termed as chimney drain. Sometimes a horizontal filter is combined and placed along with a rock toe (Fig.19.5).

Farm Power
135 www.AgriMoon.Com
Fig. 19.4. Chimney drain in stratified embankments.
(Source: Garg, 2011)
Fig. 19.5. Horizontal filter combined with rock toe.
(Source: Garg, 2011)
19.2 Seepage Control through Foundations
The amount of water entering the pervious foundations can be controlled by adopting the following measures:
19.2.1 Impervious Cut-offs
Vertical impervious cut-offs made of concrete or sheet piles may be provided at the upstream end (i.e.at heel) of the earthen dam (Fig. 19.6). These cutoffs should, generally extend through the entire depth of the pervious foundation, so as to achieve effective control on the seeping water.
Fig. 19.6. Impervious cutoff.
(Source: Garg, 2011)

Farm Power
136 www.AgriMoon.Com
When the depth of the pervious foundation strata is very large, a cut-off, up to a lesser depth, called a partial cutoff may be provided. Such a cut-off reduces the seepage discharge by a smaller amount. So much so, that a 50% depth reduces the discharge by 65% or so.
19.2.2 Relief Wells and Drain Trenches
When large scale seepage takes place through the pervious foundation, overlain by a thin less pervious layer, there is a possibility that the water may boil up near the toe of the dam (Fig 19.7).
Fig. 19.7. Sand boiling phenomenon.
(Source: Garg, 2011)
Such a possibility can be controlled by constructing relief wells or drain trenches through the upper impervious layer (Fig. 19.8 and 19.9).
Fig. 19.8. Sand boiling phenomenon.
(Source: Garg, 2011)
So as to permit escape of seeping water, the possibility of sand boiling may also be controlled by providing d/s berms beyond the toe of the dam (Fig. 19.10). The weight of the overlying material, in such a case, is sufficient to resist the upward pressure and thus preventing the possibility of sand boiling. The provision of such berms also protects the d/s toe from possible sloughing due to seepage.

Farm Power
137 www.AgriMoon.Com
Fig. 19.9. Enlarge view of drain trench.
(Source: Garg, 2011)
Fig. 19.10. Provision of d/s berm.
(Source: Garg, 2011)
19.3 Design Criteria of Filters
The drainage filters must be designed in such a way that neither the embankment nor the foundation material can penetrate and clog the filters. The permeability or size of filter material should also be sufficient to carry the anticipated flow with an ample margin of safety. A rational approach to the design of filters has been provided by Terzaghi. According to him, the following filter criteria should be satisfied.
The embankment soil or the foundation soil surrounding the filter is known as base material. When the ratio of D15 of filter to D85 of base material does not exceed 4 to 5, base material is prevented from passing through the pores of the filter. Similarly, when the ratio of D15 of filter to D15 of base material is more than 5(between 5to 40), the seepage forces within the filter are controlled up to permissible small magnitudes.

Farm Power
138 www.AgriMoon.Com
Multilayered filters(generally 3 layers) consisting of materials of increasing permeability‟s from the bottom to top are, many a times, provided and are known as inverted filters. These filters are costly and should be avoided where possible. The minimum total thickness of filter is 1 m. However, if sufficient quantities of filter material are available at reasonable costs, thicker layers of filter may be provided. The thicker the layer, there is greater permissible deviation from the filter requirements.
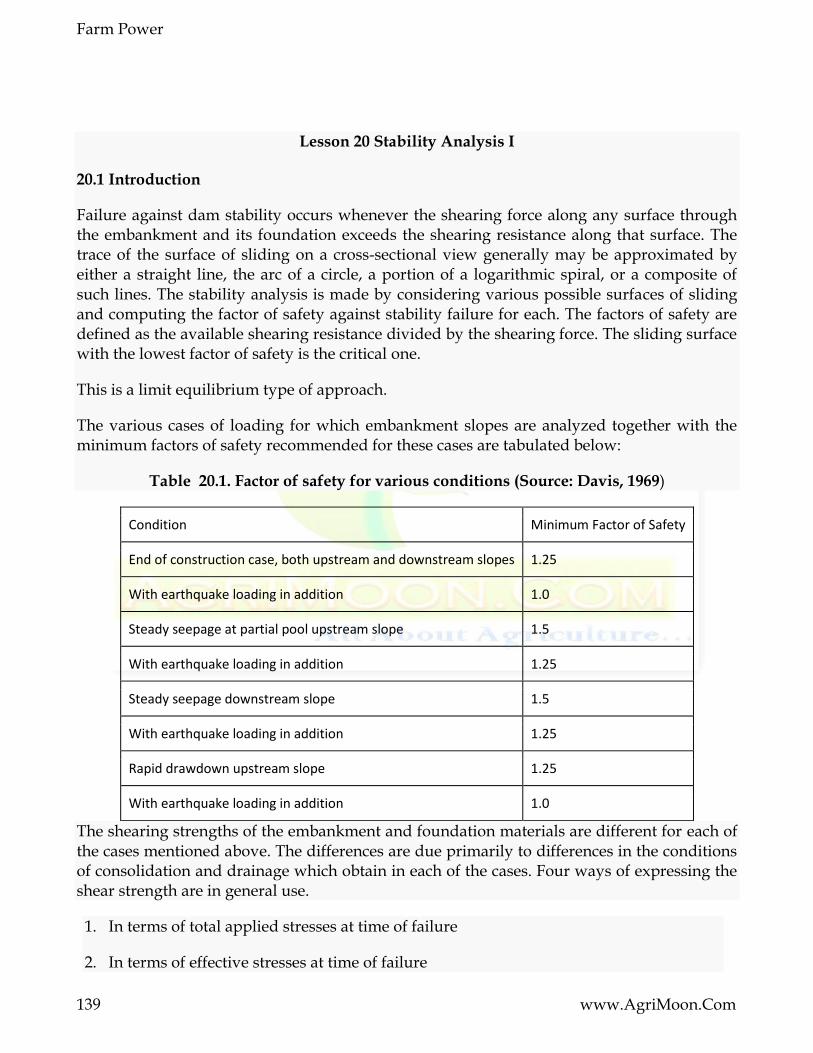
Farm Power
139 www.AgriMoon.Com
Lesson 20 Stability Analysis I
20.1 Introduction
Failure against dam stability occurs whenever the shearing force along any surface through the embankment and its foundation exceeds the shearing resistance along that surface. The trace of the surface of sliding on a cross-sectional view generally may be approximated by either a straight line, the arc of a circle, a portion of a logarithmic spiral, or a composite of such lines. The stability analysis is made by considering various possible surfaces of sliding and computing the factor of safety against stability failure for each. The factors of safety are defined as the available shearing resistance divided by the shearing force. The sliding surface with the lowest factor of safety is the critical one.
This is a limit equilibrium type of approach.
The various cases of loading for which embankment slopes are analyzed together with the minimum factors of safety recommended for these cases are tabulated below:
Table 20.1. Factor of safety for various conditions (Source: Davis, 1969)
Condition Minimum Factor of Safety
End of construction case, both upstream and downstream slopes 1.25
With earthquake loading in addition 1.0
Steady seepage at partial pool upstream slope 1.5
With earthquake loading in addition 1.25
Steady seepage downstream slope 1.5
With earthquake loading in addition 1.25
Rapid drawdown upstream slope 1.25
With earthquake loading in addition 1.0
The shearing strengths of the embankment and foundation materials are different for each of the cases mentioned above. The differences are due primarily to differences in the conditions of consolidation and drainage which obtain in each of the cases. Four ways of expressing the shear strength are in general use.
1. In terms of total applied stresses at time of failure
2. In terms of effective stresses at time of failure
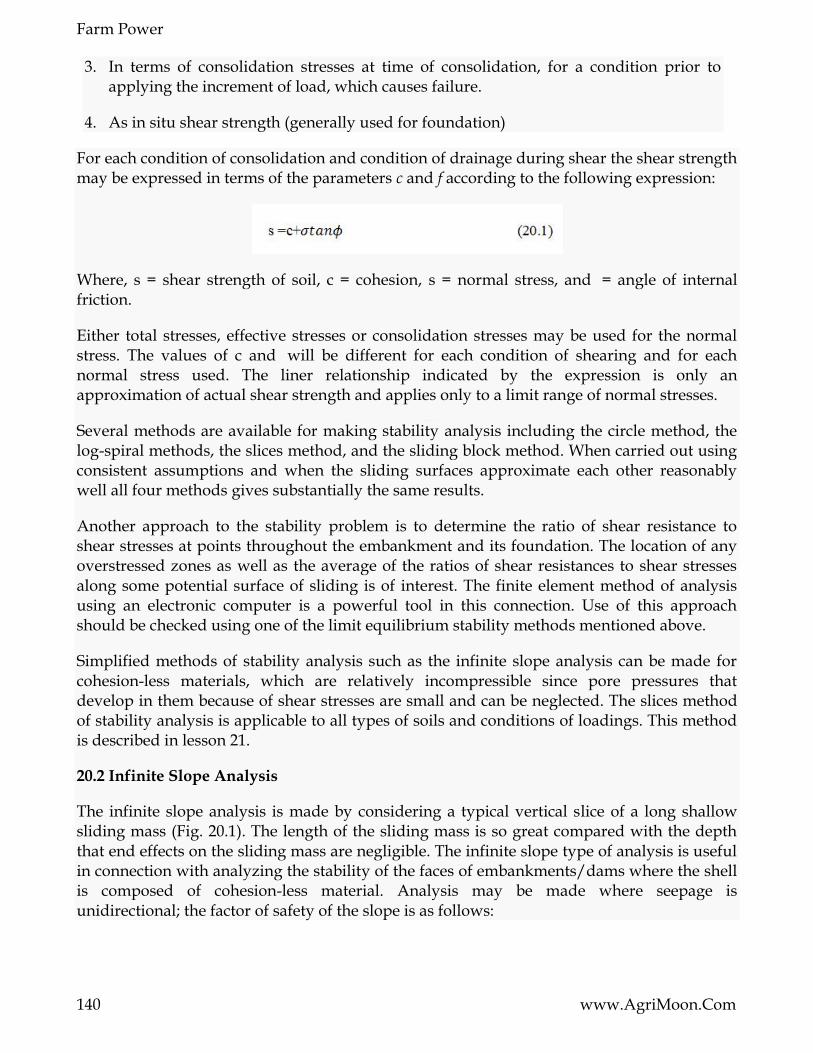
Farm Power
140 www.AgriMoon.Com
3. In terms of consolidation stresses at time of consolidation, for a condition prior to applying the increment of load, which causes failure.
4. As in situ shear strength (generally used for foundation)
For each condition of consolidation and condition of drainage during shear the shear strength may be expressed in terms of the parameters c and f according to the following expression:
Where, s = shear strength of soil, c = cohesion, s = normal stress, and = angle of internal friction.
Either total stresses, effective stresses or consolidation stresses may be used for the normal stress. The values of c and will be different for each condition of shearing and for each normal stress used. The liner relationship indicated by the expression is only an approximation of actual shear strength and applies only to a limit range of normal stresses.
Several methods are available for making stability analysis including the circle method, the log-spiral methods, the slices method, and the sliding block method. When carried out using consistent assumptions and when the sliding surfaces approximate each other reasonably well all four methods gives substantially the same results.
Another approach to the stability problem is to determine the ratio of shear resistance to shear stresses at points throughout the embankment and its foundation. The location of any overstressed zones as well as the average of the ratios of shear resistances to shear stresses along some potential surface of sliding is of interest. The finite element method of analysis using an electronic computer is a powerful tool in this connection. Use of this approach should be checked using one of the limit equilibrium stability methods mentioned above.
Simplified methods of stability analysis such as the infinite slope analysis can be made for cohesion-less materials, which are relatively incompressible since pore pressures that develop in them because of shear stresses are small and can be neglected. The slices method of stability analysis is applicable to all types of soils and conditions of loadings. This method is described in lesson 21.
20.2 Infinite Slope Analysis
The infinite slope analysis is made by considering a typical vertical slice of a long shallow sliding mass (Fig. 20.1). The length of the sliding mass is so great compared with the depth that end effects on the sliding mass are negligible. The infinite slope type of analysis is useful in connection with analyzing the stability of the faces of embankments/dams where the shell is composed of cohesion-less material. Analysis may be made where seepage is unidirectional; the factor of safety of the slope is as follows:
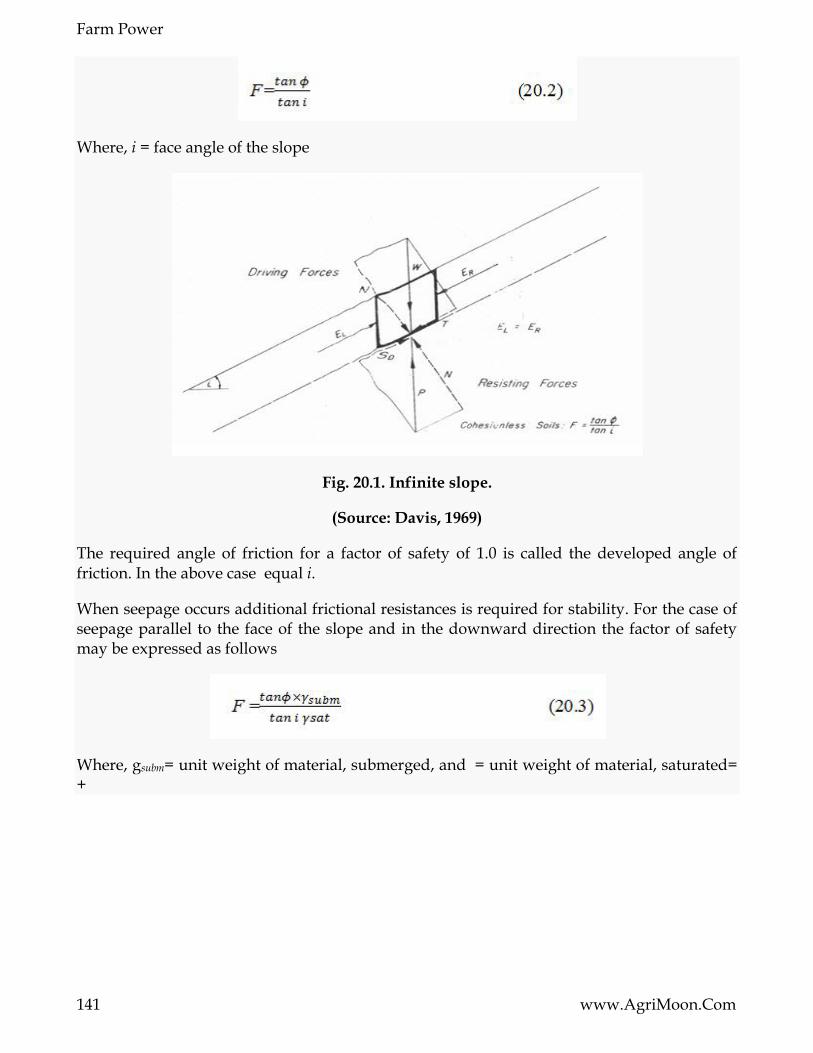
Farm Power
141 www.AgriMoon.Com
Where, i = face angle of the slope
Fig. 20.1. Infinite slope.
(Source: Davis, 1969)
The required angle of friction for a factor of safety of 1.0 is called the developed angle of friction. In the above case equal i.
When seepage occurs additional frictional resistances is required for stability. For the case of seepage parallel to the face of the slope and in the downward direction the factor of safety may be expressed as follows
Where, gsubm= unit weight of material, submerged, and = unit weight of material, saturated= +
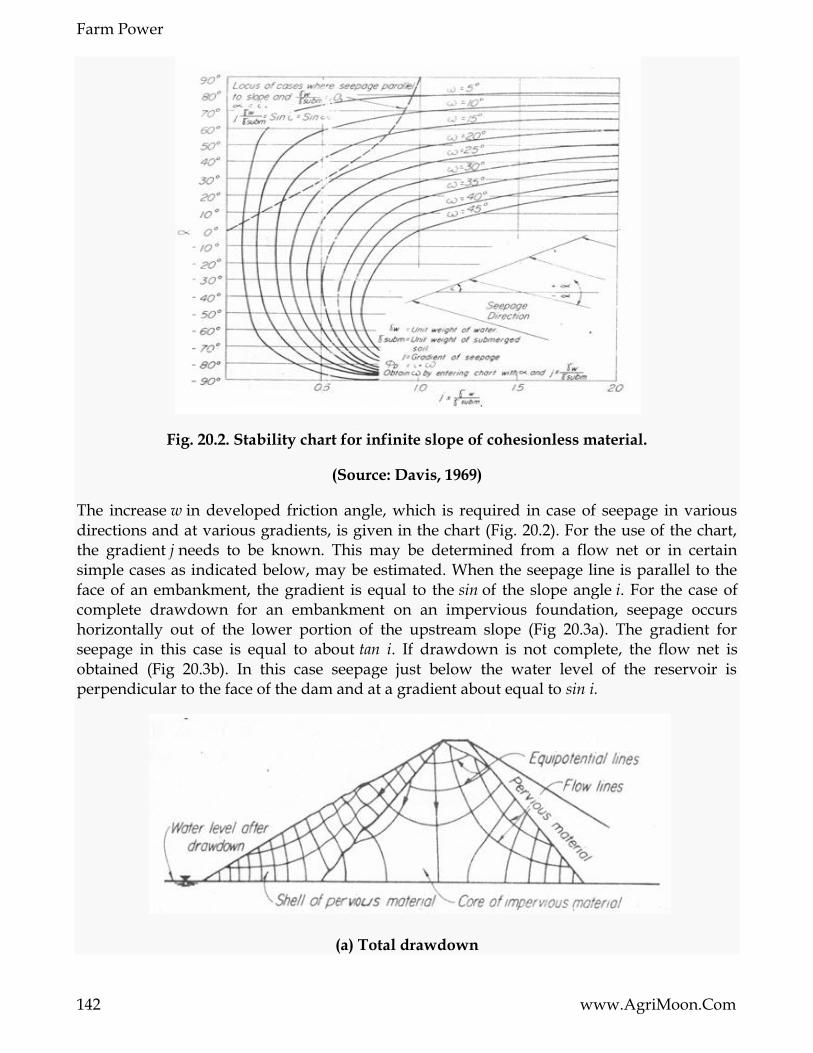
Farm Power
142 www.AgriMoon.Com
Fig. 20.2. Stability chart for infinite slope of cohesionless material.
(Source: Davis, 1969)
The increase w in developed friction angle, which is required in case of seepage in various directions and at various gradients, is given in the chart (Fig. 20.2). For the use of the chart, the gradient j needs to be known. This may be determined from a flow net or in certain simple cases as indicated below, may be estimated. When the seepage line is parallel to the face of an embankment, the gradient is equal to the sin of the slope angle i. For the case of complete drawdown for an embankment on an impervious foundation, seepage occurs horizontally out of the lower portion of the upstream slope (Fig 20.3a). The gradient for seepage in this case is equal to about tan i. If drawdown is not complete, the flow net is obtained (Fig 20.3b). In this case seepage just below the water level of the reservoir is perpendicular to the face of the dam and at a gradient about equal to sin i.
(a) Total drawdown

Farm Power
143 www.AgriMoon.Com
(b) partial drawdown
Fig. 20.3. Flow net in a dam with core of impervious material.
(Source: Davis, 1969)
When the gradient has been determined or estimated, the term j (/) as defined on the chart (Fig. 20.2) can be computed and with this value the chart can be entered. The required friction angle is obtained by adding the slope angle and the angle ω obtained from the chart. The letter value is read from the chart utilizing the family of curve which represents the anglew.
Fig. 20.2 indicates the locus of points representing cases where seepage is parallel to the slope and in a downward direction and (/) equals 1. These are the cases that correspond to Eqn. (20.3) for seepage parallel to the face of the slope.
Assuming that the gradient is equal to sin i, the most critical direction for seepage is upward at an angle α about equal to the angle of the slope i. For embankment with slopes flatter than about 15o, however, the factor of safety for a gradient equal to sin i is about the same whether seepage is downward parallel to the slope, horizontal or upward perpendicular to the slope. Vertical seepage whether upward or downward has no effect on the. Of course, if the upward seepage force equals the submerged weight of the soil, a quick condition develops. Also any upward seepage reduces the resistance of the element considered to driving forces other than the driving forces created by weight of the element itself as the force created by seismic acceleration.
20.3 Location of Critical Circles
Circular surfaces of sliding may be either toe circles, slope circles, or midpoint circles (Fig 20.5). In homogeneous material, toe circles are the critical circles for steep slopes. For flat slopes, midpoint circles are critical, but these may be restricted by the presence of strong stratum at shallow depth. The critical circle breaks out on the face of the slope (Fig. 20.5 d).
All the circles illustrated above are for the case where the crest of the dam is of limited width. The critical circle usually breaks out close to edge of the crest on the opposite side from the face being analyzed for stability. In non-homogenous material, the critical circle is located so that a maximum portion of its length passes through the lowest shear strength material. The lowest shear strength material may

Farm Power
144 www.AgriMoon.Com
Fig. 20.5. Stability Chart. (Source: Davis, 1969)
be the core of the dam or the foundation layer. To facilitate circular arc stability analyses where the face of the core is the lowest shear strength material, it is permissible to assume a virtual cross section of the dam where upstream face of the core has curved shape matching the circular arc surface under investigation.
Farm Power
145 www.AgriMoon.Com
Lesson 21 Stability Analysis II
21.1 Slices Method of Stability Analysis
The slices method stability analysis was introduced by Fellinius. In this analysis, the earth forces are considered having a direction that makes an angle with the vertical sides of the slices, as well as with the water forces acting on the sides of the slices. For example, in the case of analysis of a sloping core dam, there is appreciable difference in shear strength between the shell and core materials. The factor of safety computed neglecting earth forces on the sides of the slices is lower than that computed considering earth forces, and an unnecessarily conservative design result. The variation, considering earth forces on the sides of the slices, is necessary when it is desired to analyze the stress conditions point by point along the failure surface. An improper distribution of stresses results when the earth forces on the vertical sides of the slices are neglected. Its alternative is the assumption that lateral earth forces exist but their direction is parallel to the base of the slice.
The first step is to divide the sliding mass into a number of vertical slices. The sliding surface may be a circular arc or a combination of areas and straight lines. The number of slices chosen usually is about 8 to 10. This number is consistent with general accuracy of the method. Width of each slice need not to be uniform and the widths are adjusted so that the entire base of each slice is located on a single material.
The forces acting on a typical slice (Fig. 21.1) and consist of WT= total weight of the slice, EL, ER= earth forces on left and right hand vertical faces, respectively, UL, UR,UB= water forces on left and right hand vertical faces and bottom of slice, and P=resultant earth force on base of slice
The water forces are determined from water pressure diagrams on the sides and base of the slice determined from static water conditions if no seepage occurs or from flow nets if seepage occurs. The directions of water pressure are perpendicular to the surfaces on which they act. Sometimes a lateral force may be used, which is a combination of an earth force and a water force on the side of the slice. Pressures generated in the pore water by consolidation and shearing in the embankment are taken into consideration in various ways depending upon the method used for expressing shear strength.
The resultant force on the base of the slice P can be represented by a component N normal to the base of the slice and a component SD tangential to the base of the slice. The resultant force of N and N tanϕD is Pf. The tangential component can be separated into two parts, namely, N tanfD and cD (Fig.21.1).
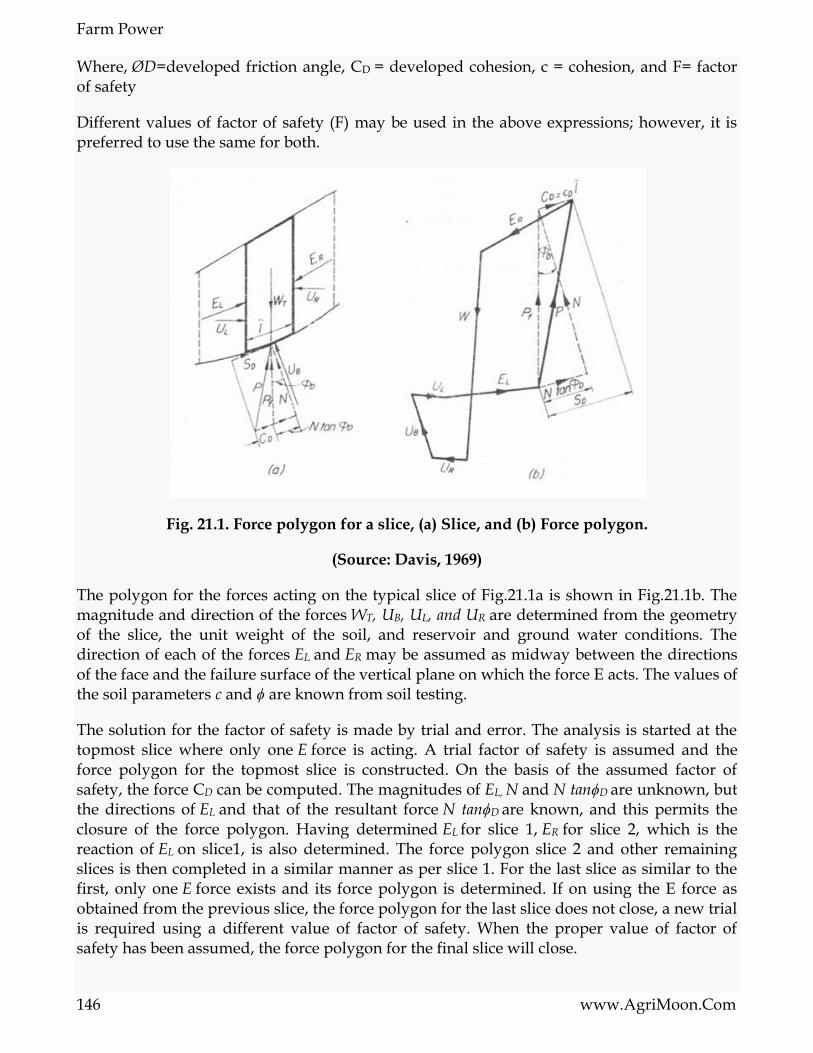
Farm Power
146 www.AgriMoon.Com
Where, ØD=developed friction angle, CD = developed cohesion, c = cohesion, and F= factor of safety
Different values of factor of safety (F) may be used in the above expressions; however, it is preferred to use the same for both.
Fig. 21.1. Force polygon for a slice, (a) Slice, and (b) Force polygon.
(Source: Davis, 1969)
The polygon for the forces acting on the typical slice of Fig.21.1a is shown in Fig.21.1b. The magnitude and direction of the forces WT, UB, UL, and UR are determined from the geometry of the slice, the unit weight of the soil, and reservoir and ground water conditions. The direction of each of the forces EL and ER may be assumed as midway between the directions of the face and the failure surface of the vertical plane on which the force E acts. The values of the soil parameters c and ϕ are known from soil testing.
The solution for the factor of safety is made by trial and error. The analysis is started at the topmost slice where only one E force is acting. A trial factor of safety is assumed and the force polygon for the topmost slice is constructed. On the basis of the assumed factor of safety, the force CD can be computed. The magnitudes of EL, N and N tanϕD are unknown, but the directions of EL and that of the resultant force N tanϕD are known, and this permits the closure of the force polygon. Having determined EL for slice 1, ER for slice 2, which is the reaction of EL on slice1, is also determined. The force polygon slice 2 and other remaining slices is then completed in a similar manner as per slice 1. For the last slice as similar to the first, only one E force exists and its force polygon is determined. If on using the E force as obtained from the previous slice, the force polygon for the last slice does not close, a new trial is required using a different value of factor of safety. When the proper value of factor of safety has been assumed, the force polygon for the final slice will close.
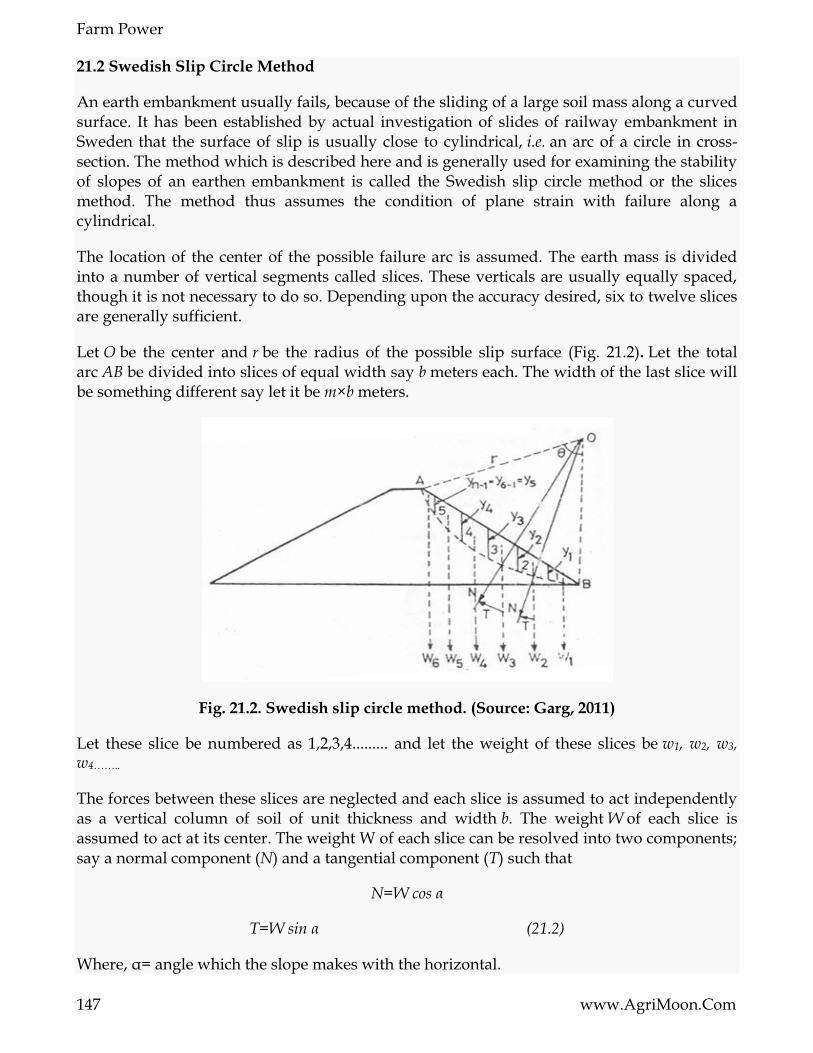
Farm Power
147 www.AgriMoon.Com
21.2 Swedish Slip Circle Method
An earth embankment usually fails, because of the sliding of a large soil mass along a curved surface. It has been established by actual investigation of slides of railway embankment in Sweden that the surface of slip is usually close to cylindrical, i.e. an arc of a circle in cross-section. The method which is described here and is generally used for examining the stability of slopes of an earthen embankment is called the Swedish slip circle method or the slices method. The method thus assumes the condition of plane strain with failure along a cylindrical.
The location of the center of the possible failure arc is assumed. The earth mass is divided into a number of vertical segments called slices. These verticals are usually equally spaced, though it is not necessary to do so. Depending upon the accuracy desired, six to twelve slices are generally sufficient.
Let O be the center and r be the radius of the possible slip surface (Fig. 21.2). Let the total arc AB be divided into slices of equal width say b meters each. The width of the last slice will be something different say let it be m×b meters.
Fig. 21.2. Swedish slip circle method. (Source: Garg, 2011)
Let these slice be numbered as 1,2,3,4......... and let the weight of these slices be w1, w2, w3, w4……..
The forces between these slices are neglected and each slice is assumed to act independently as a vertical column of soil of unit thickness and width b. The weight W of each slice is assumed to act at its center. The weight W of each slice can be resolved into two components; say a normal component (N) and a tangential component (T) such that
N=W cos α
T=W sin α (21.2)
Where, α= angle which the slope makes with the horizontal.
Farm Power
148 www.AgriMoon.Com
The normal component (N) will pass through the center of rotation (O) and hence does not create any moment on the slice. However, the tangential component (T) causes a distributing moment equal to (T ×r), where r is the radius of the slip circle. The tangential components of a few slices may create resisting moments; in that case T is considered as negative. The total distributing moment (Md) will be equal to the algebraic sum of all the individual tangential moments, i.e.
The resisting moment is supplied by the development of shearing resistances of the soil along the accrual surface AB. The magnitude of shear strength developed in each slice will depend upon the normal component (N) of that slice. Its magnitude will be
Where, c = unit cohesion, = curved length of the slice, and = angle of internal friction of soil.
This shear resistance is acting at a distance r from O and will provide a resisting moment
The total resisting moment over the entire arc AB
Where, = angle in degrees, formed by the arc AB at centre O.
Hence, the factor of safety (FS) against sliding is
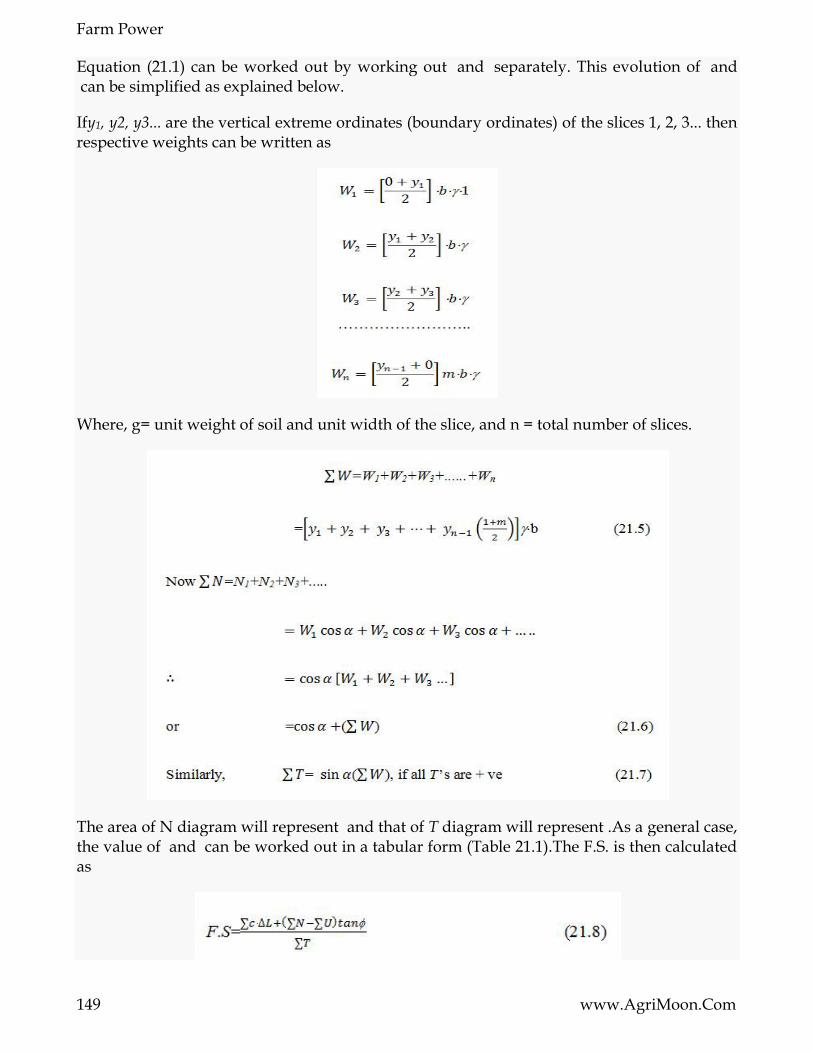
Farm Power
149 www.AgriMoon.Com
Equation (21.1) can be worked out by working out and separately. This evolution of and can be simplified as explained below.
Ify1, y2, y3... are the vertical extreme ordinates (boundary ordinates) of the slices 1, 2, 3... then respective weights can be written as
Where, g= unit weight of soil and unit width of the slice, and n = total number of slices.
The area of N diagram will represent and that of T diagram will represent .As a general case, the value of and can be worked out in a tabular form (Table 21.1).The F.S. is then calculated as

Farm Power
150 www.AgriMoon.Com
Fig. 21.3. Area of N and T diagram. (Source: Garg, 2011)
Table 21.1. Weight of slices, N and T Components (Source: Garg, 2011)
21.3 Location of the Centre of the Critical Slip Circle
In order to find out the worst case, numerous slip circles should be assumed and factor of safety (F.S) calculated for each circle, as explained earlier. The minimum factor of safety will be obtained for the critical slip circle. In order to reduce the number of trails, Fellenius has suggested a method of drawing a line (PQ), representing the locus of the critical slip circle.
The determination of line PQ for the d/s and u/s slopes of an embankment is shown in Fig. 21.4(a) and Fig. 21.4(b), respectively. The point Q is determined in such a way that its coordinates are from the toe (Fig. 21.4 a). The point P is obtained with the help of directional angles α1and α2 for various slopes (Table 21.2).

Farm Power
151 www.AgriMoon.Com
Fig. 21.4 (a). Locus of critical circle for d/s slope
(Source: Garg, 2011)
Fig. 21.4 (b). Locus of critical circle for u/s slope.
(Source: Garg, 2011)
Table 21.2. Directional angles against embankment slopes (Source: Garg, 2011)
Slope Directional angles
α1 in degrees α2 in degrees
1:1 2:1 3:1 4:1 5:1
27.5 25 25 25 25
37 35 35 35 35
After determining the locus of the critical slip circle, it can be drawn, keeping in view the following few points:
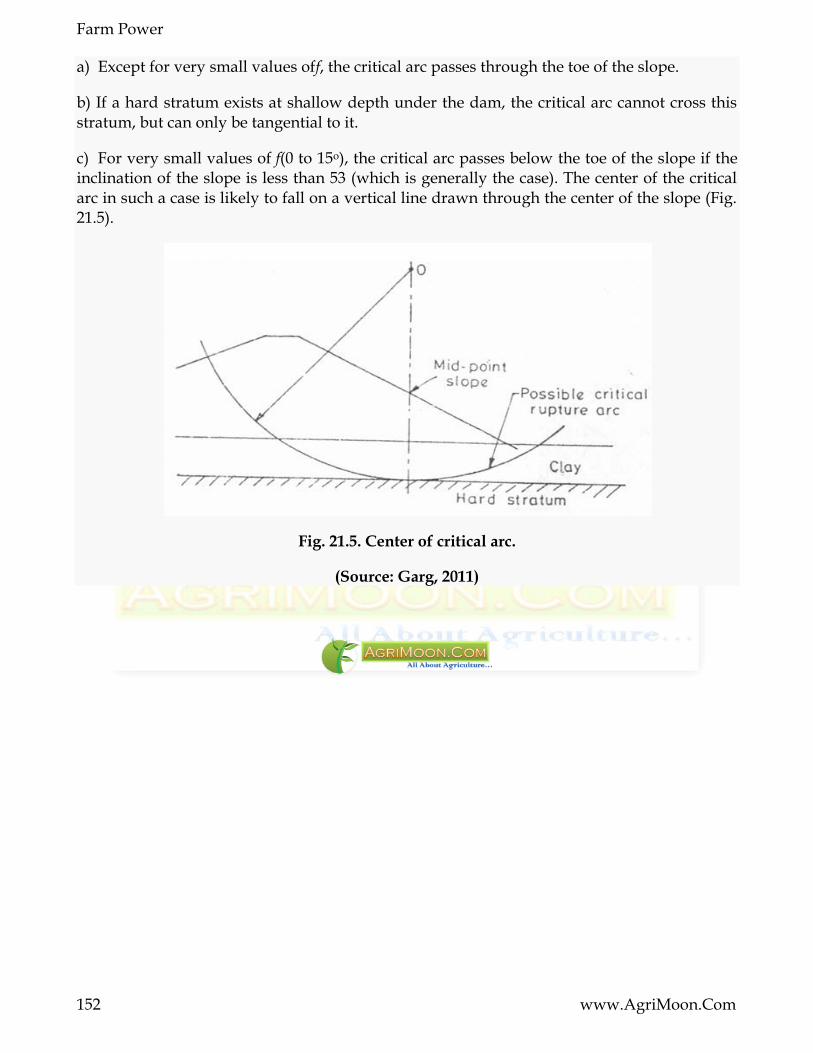
Farm Power
152 www.AgriMoon.Com
a) Except for very small values off, the critical arc passes through the toe of the slope.
b) If a hard stratum exists at shallow depth under the dam, the critical arc cannot cross this stratum, but can only be tangential to it.
c) For very small values of f(0 to 15o), the critical arc passes below the toe of the slope if the inclination of the slope is less than 53 (which is generally the case). The center of the critical arc in such a case is likely to fall on a vertical line drawn through the center of the slope (Fig. 21.5).
Fig. 21.5. Center of critical arc.
(Source: Garg, 2011)
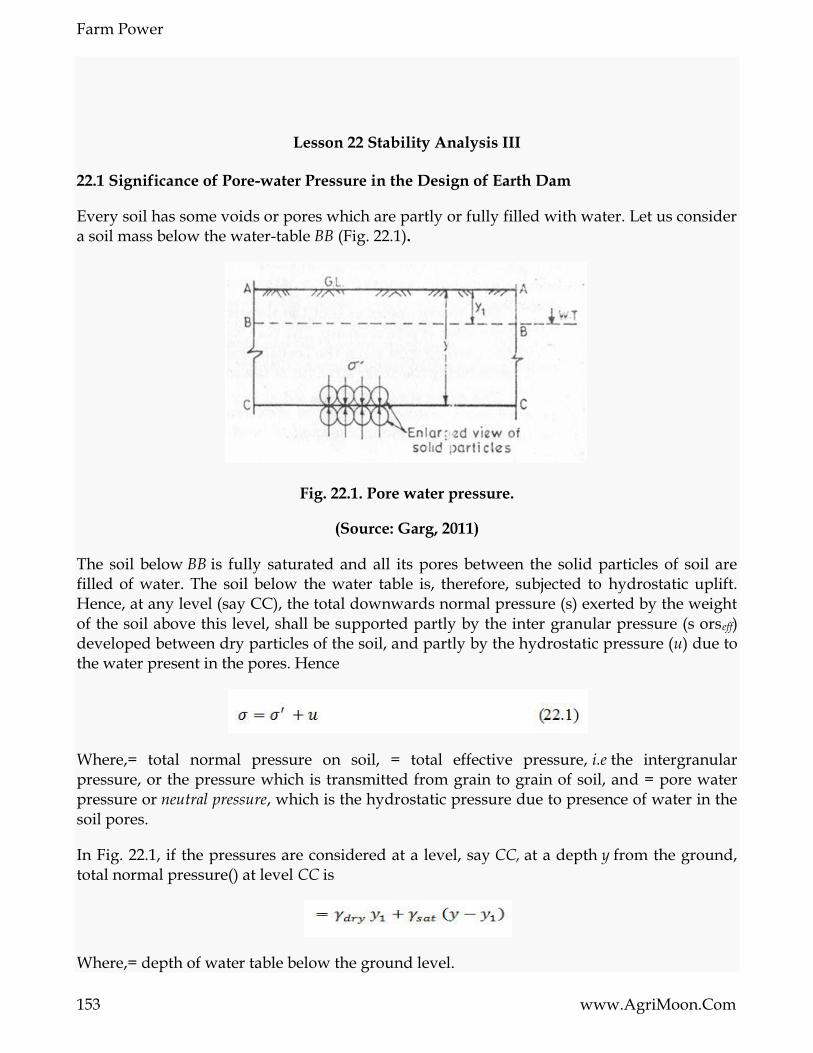
Farm Power
153 www.AgriMoon.Com
Lesson 22 Stability Analysis III
22.1 Significance of Pore-water Pressure in the Design of Earth Dam
Every soil has some voids or pores which are partly or fully filled with water. Let us consider a soil mass below the water-table BB (Fig. 22.1).
Fig. 22.1. Pore water pressure.
(Source: Garg, 2011)
The soil below BB is fully saturated and all its pores between the solid particles of soil are filled of water. The soil below the water table is, therefore, subjected to hydrostatic uplift. Hence, at any level (say CC), the total downwards normal pressure (s) exerted by the weight of the soil above this level, shall be supported partly by the inter granular pressure (s orseff) developed between dry particles of the soil, and partly by the hydrostatic pressure (u) due to the water present in the pores. Hence
Where,= total normal pressure on soil, = total effective pressure, i.e the intergranular pressure, or the pressure which is transmitted from grain to grain of soil, and = pore water pressure or neutral pressure, which is the hydrostatic pressure due to presence of water in the soil pores.
In Fig. 22.1, if the pressures are considered at a level, say CC, at a depth y from the ground, total normal pressure() at level CC is
Where,= depth of water table below the ground level.
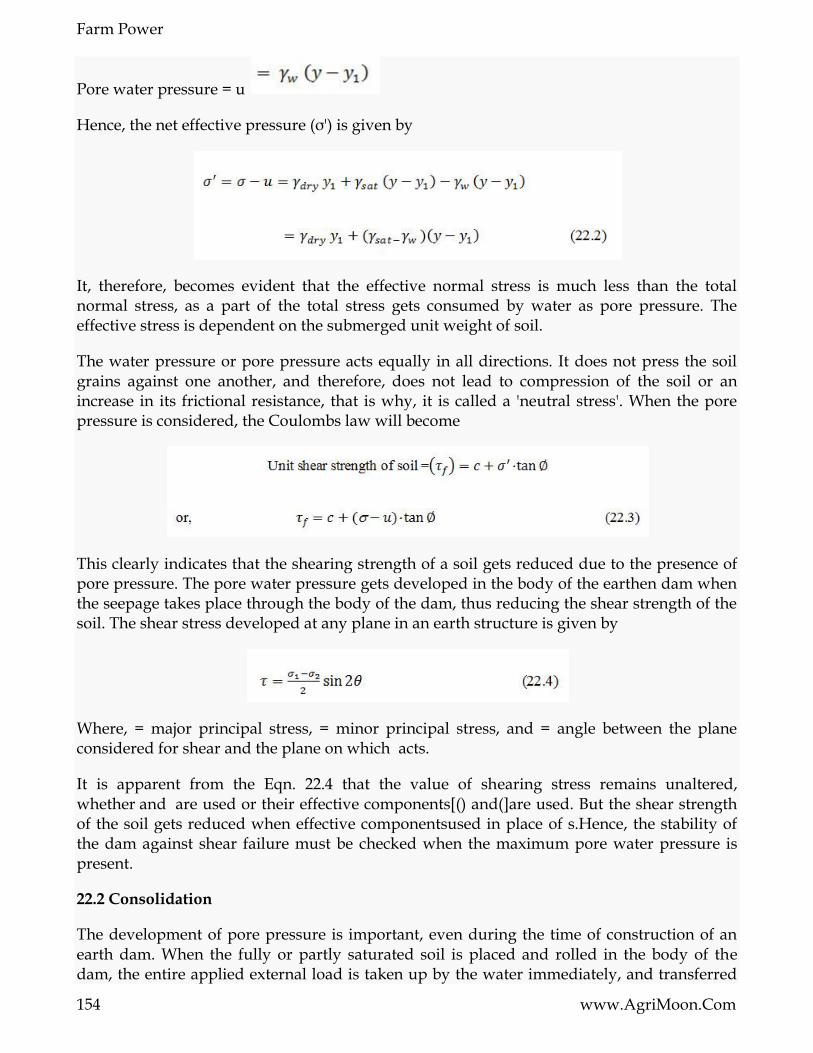
Farm Power
154 www.AgriMoon.Com
Pore water pressure = u
Hence, the net effective pressure (σ') is given by
It, therefore, becomes evident that the effective normal stress is much less than the total normal stress, as a part of the total stress gets consumed by water as pore pressure. The effective stress is dependent on the submerged unit weight of soil.
The water pressure or pore pressure acts equally in all directions. It does not press the soil grains against one another, and therefore, does not lead to compression of the soil or an increase in its frictional resistance, that is why, it is called a 'neutral stress'. When the pore pressure is considered, the Coulombs law will become
This clearly indicates that the shearing strength of a soil gets reduced due to the presence of pore pressure. The pore water pressure gets developed in the body of the earthen dam when the seepage takes place through the body of the dam, thus reducing the shear strength of the soil. The shear stress developed at any plane in an earth structure is given by
Where, = major principal stress, = minor principal stress, and = angle between the plane considered for shear and the plane on which acts.
It is apparent from the Eqn. 22.4 that the value of shearing stress remains unaltered, whether and are used or their effective components[() and(]are used. But the shear strength of the soil gets reduced when effective componentsused in place of s.Hence, the stability of the dam against shear failure must be checked when the maximum pore water pressure is present.
22.2 Consolidation
The development of pore pressure is important, even during the time of construction of an earth dam. When the fully or partly saturated soil is placed and rolled in the body of the dam, the entire applied external load is taken up by the water immediately, and transferred

Farm Power
155 www.AgriMoon.Com
to the soil afterwards. The pore water thus gets compressed, and if it is unable to drain out freely (due to low permeability of the soil) the pore pressure rises. This rise in pore pressure during compaction is known as hydrostatic excess pressure in pore water. It further reduces the shearing strength of the soil and hence, the stability of the soil. As the excess water drains out, more and more consolidation will take place, as this pressure will be transferred to soil grains and the shear strength will tend to achieve its normal value. Hence, the pore pressure temporarily reduces the shear strength of the soil during compaction by preventing full compaction. But the shear strength gets recovered after the compaction is over, as the pore water is ultimately squeezed out.
In highly compressible soils, having low coefficient of permeability and moisture content above its optimum moisture content this condition of hydrostatic excess becomes very serious. Such soils are, therefore, more liable to fail during construction.
Similarly, appreciable consolidation of soil may takes place in fine grained compressible soils like clay, even after the construction is over, though sufficient compaction was done during construction.
Due to these reasons, pore pressure observations are often made during the construction period of an earth dam. If the hydrostatic excess of pore pressure rises to a dangerous level, the construction may be stopped for some time till the excess water drains out and full natural compaction takes place. The construction may be restarted after this excess is either fully dissipated or reduced to a safe value. The shear failure of the soil of the dam or its foundation is, therefore, very much connected with the development of pore pressure in the body of the dam and in the foundation, and must be properly checked and accounted for.
22.3 Stability Charts
The stability chart presented in Fig. 20.5 (lesson 20) affords an accurate and simple method for determining the factor of safety against stability failure for a homogeneous dam and foundation in: (1) the dry condition, (2) the completely submerged condition, (3) the condition of seepage parallel to the face of slope, and (4) the condition of complete rapid drawdown from crown to toe for an embankment with negligible drainage. Approximate solution can be also made for non-homogeneous dams and for the condition of seepage not entirely parallel to the face of the slope and for the condition of rapid drawdown over part of the slope. The chart gives relationship between factor of safety F, height of slope H, angle of slope i, developed friction angle fD, and developed cohesion cD.

Farm Power
156 www.AgriMoon.Com
Lesson 23 Stability Analysis IV
23.1 Foundation Stability against Shear
Available silt and clay foundations below the base of an earth dam are sufficiently impervious, therefore, it is generally no necessity of providing any treatment against under-seepage and piping for such foundations. But these foundations are weak in shear and must be investigated. In order to keep the shear stress developed at the foundations, within limits, the embankment-slopes may have to be flattened or berms on either side may be provided. If the available foundations are of plastic or unconsolidated clays, their shear strength will be very less and the matter should be seriously and thoroughly investigated.
The method given below, for determining the factor of safety against the foundation shear, is an approximate method and is based on the assumption that a soil has an equivalent liquid unit weight which would produce the same shear stress as the soil itself.
Fig. 23.1. Shear force diagram.
(Source: Garg, 2011)
The total horizontal shear force, under a slope of the dam is equal to the difference between the lateral thrust on a vertical through the top shoulder of the slope and a vertical through the toe of the slope (Fig. 23.1).
Farm Power
157 www.AgriMoon.Com
Where, = depth of foundation soil below the dam base, overlying the hard stratum below it, = equivalent unit weight of dry soil in foundation and dam, = equivalent angle of internal friction, and and = unit cohesion and angle of internal friction for the soil in the foundation,
respectively. The term is known as equivalent liquid unit weight.
Now, the average shear stress at the base of the slope
Where, = base width below the slope.
The value of Bs will be equal to Bu for u/s slope and Bd for d/s slope. The minimum value will generate maximum stresses and hence, that particular slope should be considered, which gives the minimum value of . The slope which is less flat and is, therefore the worst slope.
Maximum shear stress has been found by photo-elastic studies to be 1.4 times the average stress and it occurs at a distance of 0.6 from the toe of the slope.
The unit shear resistance of the foundation soil below the toe at point G1
Where, is the unit weight of foundation soil and if the average value is given for impervious soils, that value may be used in the equation. But if there is a possibility of foundation soil getting submerged due to large scale seepage that may take place through the foundation soil, then the submerged density may be used in Eqn. 23.5.
Similarly, the unit shear resistance of the soil vertically below the upper point of the considered slope (say at point N1) is given by
Where, = equivalent unit weight of soil in the dam and foundation at the point N1, and &= dry densities or submerged densities depending upon the possibilities.
Farm Power
158 www.AgriMoon.Com
This should be greater than 1.5
The factor of safety (should be greater than unity) at the point of maximum shear (i.e. the point V1) must also be calculated as follows:
The unit shears resistance at this point V1
Where, = equivalent weight of soil in dam and foundation
23.2 Seismic Stability of Earth Dam
An investigation of the stress-strain state of earth-rock dams from the effect of seismic forces is one of the most important problems when designing dams in seismically active regions. Precisely, the behavior of the structure under the effect of seismic forces often determines the design of dams. One of the principal tasks when solving the problem of the seismic effect on an earth-rock dam is the selection of the design characteristics of the soils.
The seismic stability of earth dams is traditionally evaluated under the assumption of cylindrical surfaces of failure. In that case, it is assumed that if the dam withstood the design earthquake, then it would withstand such an earthquake a countless number of times. This assumption is preserved on changing to dynamic methods of solving the problem within the frameworks of elasticity theory and, moreover, many authors use this assumption even when taking plastic deformations into account. On the other hand, soil under dynamic loads have pronounced visco-plastic properties, and each seismic action, weak or strong, causes in the soil of the dam and foundation permanent deformations.
As a result, it is important to evaluate not only whether the dam will withstand a particular action but also how many such actions will occur without dangerous consequences for it.
For dams located in the high seismicity zone, the problem not only of the force of the seismic action but also the frequency of recurrence of the latter can be urgent. In that case, a seismic action even of less intensity but recurring often can sometimes prove to be dangerous. Of

Farm Power
159 www.AgriMoon.Com
course, it is necessary to bear in mind that with a decrease of the force of the action, the portion of the deviator of plastic deformation rapidly decreases and under small and frequently recurring actions the soil in the dam body ultimately begins to behave elastically. In that case, the structure ceases to draw nearer to the limit state. The direction of seismic action is of great significance, since in individual zones of the dam the main role can be played by the accumulation of volumetric compressive strains, which leads to strengthening of soil.

Farm Power
160 www.AgriMoon.Com
Lesson 24 Slope Protection
24.1 General Considerations
The slopes of earth embankments must be protected against erosion by wave action, rain wash, frost and wind action. Protection cannot economically be provided against the erosion which would occur if the dam were overtopped. A major cause of earth dam failures has been overtopping, therefore, care must be exercised that freeboard and spillway capacity are ample to prevent it.
24.2 Freeboard
Freeboard is the vertical distance between the maximum water surface of the spillway design flood and the crest of the dam. The vertical distance should be ample to prevent overtopping of the dam due to wind setup (rise in water level at dam due to wind blowing toward dam). The height of waves above pool level, and run-up of waves on the face of the dam is illustrated in Fig. 24.1.
Wind setup may be computed by the Zuider Zee formula:
Where, S = setup above normal pool level, ft; V = wind velocity, mph; F = fetch, miles; D = average depth of water, ft; and A= angle between direction of waves and normal to face of dam.
The height of waves may be computed using the Molitor-Stevenson equations given below.
Fig. 24.1. Freeboard.
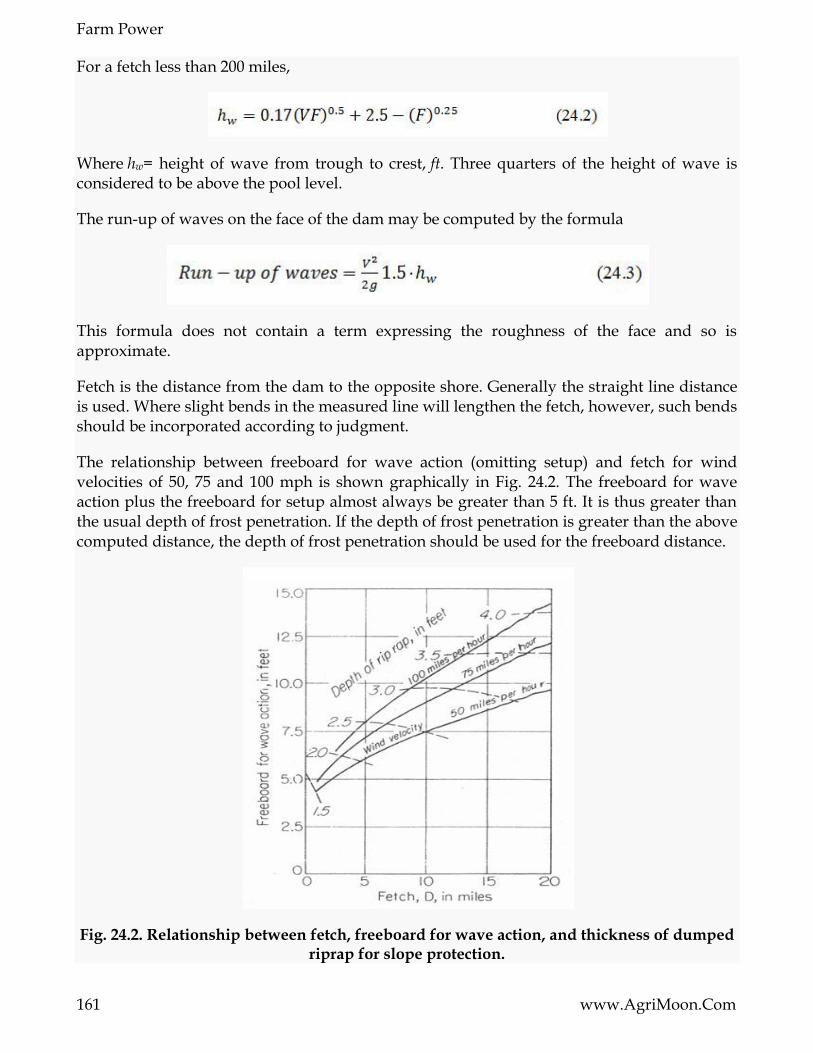
Farm Power
161 www.AgriMoon.Com
For a fetch less than 200 miles,
Where hw= height of wave from trough to crest, ft. Three quarters of the height of wave is considered to be above the pool level.
The run-up of waves on the face of the dam may be computed by the formula
This formula does not contain a term expressing the roughness of the face and so is approximate.
Fetch is the distance from the dam to the opposite shore. Generally the straight line distance is used. Where slight bends in the measured line will lengthen the fetch, however, such bends should be incorporated according to judgment.
The relationship between freeboard for wave action (omitting setup) and fetch for wind velocities of 50, 75 and 100 mph is shown graphically in Fig. 24.2. The freeboard for wave action plus the freeboard for setup almost always be greater than 5 ft. It is thus greater than the usual depth of frost penetration. If the depth of frost penetration is greater than the above computed distance, the depth of frost penetration should be used for the freeboard distance.
Fig. 24.2. Relationship between fetch, freeboard for wave action, and thickness of dumped riprap for slope protection.
Farm Power
162 www.AgriMoon.Com
The types of slope protection used on earth dams and levees vary from sod to several feet of dumped riprap. The choice of slope protection for a particular slope depends upon the type of erosive action against which the slope is to be protected and the frequency of attack. The discussion below takes up the various types of slope protection, which may be considered for the upstream and downstream faces of dam‟s levees.
24.3 Upstream Protection
The upstream slopes of dams are commonly protected with dumped riprap or its equivalent. The thickness of the riprap may vary from 1.5 to 5 ft, depending on the severity of wave action. Suggested values for thickness of riprap for various fetches and wind velocities are given in Fig. 24.2. The riprap should be founded on a filter designed. The thickness of the filter should be about 1 ft. The stone used for riprap should be hard and durable and be able to resist long exposure to weathering. Stone suitable for riprap generally should be able to pass the standard soundness tests used for concrete aggregate. However, occasionally rock which casehardens will not pass soundness tests and yet be satisfactory for riprap. Fifty percent of the stone by weight should have diameters about equal to the proposed thickness of riprap. The remaining 50 percent should be graded downward as quarry conditions permit for reasonable design of the underlying filter bed. The riprap should extend from the top of the dam to about 5 ft below the lowest normal pool level. To prevent raveling at the lower end, the riprap is usually abutted against a large stone embedded in the embankment. Also a berm is frequently located at the lower end of the riprap to assist in preventing raveling and to facilitate construction of the riprap. Where rock is expensive a layer of hand placed riprap about half the thickness of the dumped riprap may prove more economical, the cost of the additional labour required being compensated by the saving in quantity of rock used. Run-up of waves on the relatively smooth face of hand placed riprap is greater than on dumped rip-rap. Other alternatives, which may be considered where rock is expensive, are cast tetrahedron blocks of concrete, ceramic blocks or soil cement. Slope protection consisting of continuous concrete pavement has also been used occasionally.
From the observations it has been found that, the protection works of u/s slope, using concrete slab, are failed by about 36% cases, mainly because of non-providing of the filter below them.
24.4 Protection of Downstream Slope
The downstream face of an earth dam is usually protected with sod where the climate is suitable. In climates where sod cannot grow, a thin layer of stone or gravel riprap may be used. To develop a sod, 4 to 6 in. of topsoil is spread on the downstream face and the face seeded and strip-sodded. The grass or vine used for making the sod will depend on local conditions. Berms, which intercept the runoff, have at times been used on the face of the dam. Care must be exercised, however in designing and maintaining the berms to see that the water which they intercept is safely conducted away, otherwise, the berms may cause more difficulty than they prevent. Culverts are generally required at the intersection of the faces of the embankment with the abutments.
Where riprap is used on the downstream face, its thickness and permeability should be ample to conduct safely the rainwater flowing down the slope. The stability of such riprap

Farm Power
163 www.AgriMoon.Com
against sloughing caused by the seepage force of the rain wash can be analyzed using various methods. Where the downstream slopes of earth dams are subject to tail water, they should be protected by riprap.
Both the riverside and landside slopes of levees are commonly protected with sod. Where river currents would cause erosion of the sod, as at the outside of bends, dumped riprap slope protection or its equivalent may be used. Other types of slope protection that have been used on levees include articulate concrete mats, asphalt pavement and willow mats.

Farm Power
164 www.AgriMoon.Com
Module 4: Construction of Reservoir and Farm Ponds
Lesson 25 Construction
25.1 Introduction
After deciding the components and their dimensions, the next step begins is the construction of reservoir and/or farm pond. Further the site selection and location of the reservoir or farm pond in the selected site to be finished before the construction work begins. This lesson deals with the detail construction procedure.
25.2 Setting the Dam Site
This should be completed immediately prior to the start of construction to avoid unnecessary ground clearing and the loss of pegs and benchmarks. The dam centre line must be established with reference pegs, installed at each end of the centre line, a good distance from where construction will occur. If the original benchmark(s) is (are) not satisfactory another should be established on a permanent site within easy reference distance.
The centre line pegs should be installed at the ends of the embankment and at every change in ground level. For each change in ground level a mating peg (Fig.25.1) should be established by level or GPS on the opposite side of the valley, but still on the centre line.
At each peg on the centre line of the embankment, the distances of the toe pegs upstream and downstream are calculated and set out at right angles (Fig. 25.2). Unless it is a very small dam, it is advisable to make an extra allowance of 10 percent on the height of the embankment for future settlement.
If this is not done at this stage the process can become very tedious and time consuming, as pegs have to be offset from the toe peg or centre line at every construction level.
Fig. 25.1. Mating pegs. (Source: Stephen, 2010)
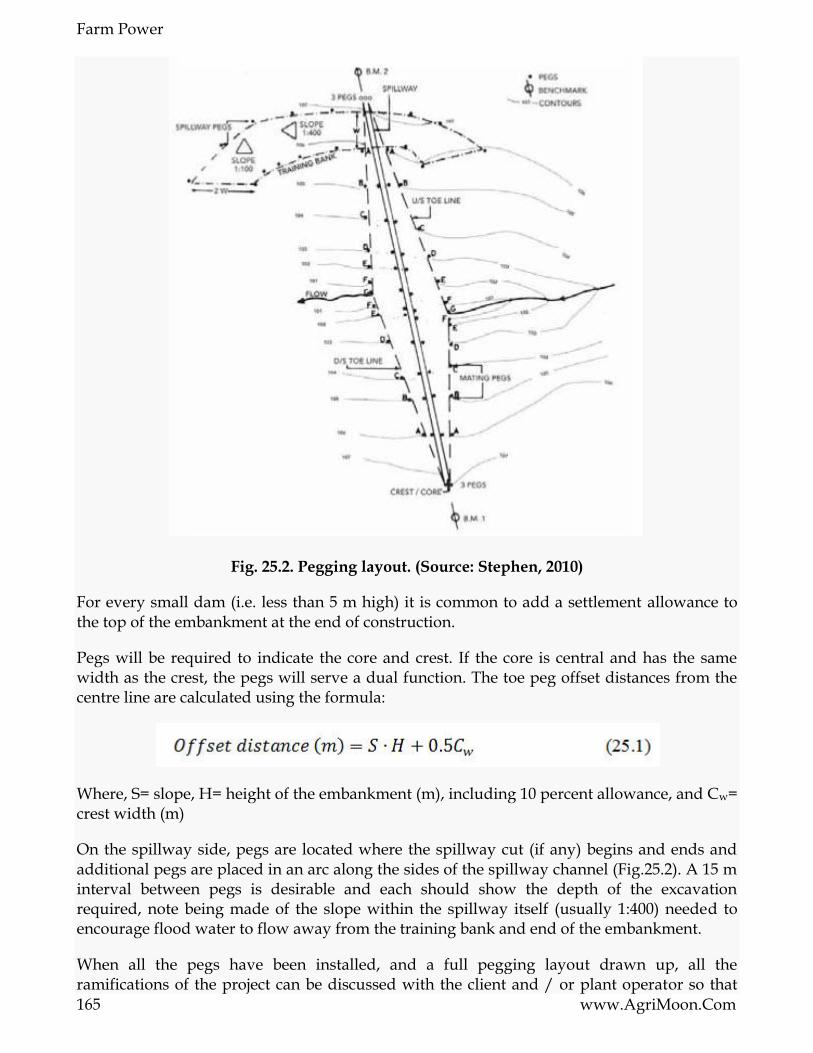
Farm Power
165 www.AgriMoon.Com
Fig. 25.2. Pegging layout. (Source: Stephen, 2010)
For every small dam (i.e. less than 5 m high) it is common to add a settlement allowance to the top of the embankment at the end of construction.
Pegs will be required to indicate the core and crest. If the core is central and has the same width as the crest, the pegs will serve a dual function. The toe peg offset distances from the centre line are calculated using the formula:
Where, S= slope, H= height of the embankment (m), including 10 percent allowance, and Cw= crest width (m)
On the spillway side, pegs are located where the spillway cut (if any) begins and ends and additional pegs are placed in an arc along the sides of the spillway channel (Fig.25.2). A 15 m interval between pegs is desirable and each should show the depth of the excavation required, note being made of the slope within the spillway itself (usually 1:400) needed to encourage flood water to flow away from the training bank and end of the embankment.
When all the pegs have been installed, and a full pegging layout drawn up, all the ramifications of the project can be discussed with the client and / or plant operator so that
Farm Power
166 www.AgriMoon.Com
any risk of error and opportunity for misunderstanding are minimized and use of equipment and efficiency maximized.
25.3 Compaction Equipment and Techniques
The compaction of soil is essential to increase the shear strength of a material to achieve high levels of embankment stability. A high degree of compaction will increase soil density by packing together soil particles with the expulsion of air voids. Comparing the shear strength with the moisture content for a given degree of compaction, it is found that the greatest shear strength is generally attained at moisture contents lower than saturation.
If the soil is too wet, the material becomes too soft and the shear stresses imposed on the soil during compaction are greater than the soils shear strength, so that compaction energy is dissipated largely in shearing without any appreciable increase in density.
If the soil is too dry, a material compacted in this condition will have a higher percentage of air spaces than a comparable soil compacted wet. It will take up moisture more easily and become more nearly saturated with consequent loss of strength and impermeability. A damp soil, properly layered and compacted with a minimum of air voids also reduces the tendency for settlement under steady and repeated loading.
In dam construction, following correct compaction techniques is probably as important as choosing the correct materials. Where laboratory analysis is not available the following guidelines should be adhered to:
The soil to be compacted must be damp but not too wet and it must be layered along the full length of the embankment in depths appropriate to the equipment used. Farm machinery (e.g. tractor tyres filled with water following a staggered track or small rollers) and hand methods are usually only sufficient to successfully compact layers 75-100 mm deep. Heavier plant such as sheep foot rollers (ideal for clayey soils), vibratory and smooth wheeled rollers (ideally for sandy soils) can work with layers up to 200 mm thick and obviously are preferable where large quantities and widths require compaction.
Where soil moisture content is low, borrow pit irrigation always results in a more uniform distribution of water in the soil to be compacted. It is also more economical than adding water to the construction surface and often assists working of the soil by the excavators. Time is saved on the embankment to avoid watering the surface between layers. Judicious planning with ripping and ploughing of the borrow area before irrigation and allowing the water to soak in over one or more days (depending on climate, soil type, and quantity of water applied) before excavation will assist the development of uniform moisture contents in the earth fill materials.
Always adopt compaction techniques that will reduce the gross depth of any layer by at least 25 percent.
Rollers
Farm Power
167 www.AgriMoon.Com
Ø Sheeps foot Rollers can compact layers of soil up to 200 mm deep gross (i.e. about 150 mm after compaction) and satisfactory densities can normally be obtained with 6-12 passes at a roller speed of 3-6 km/h when the soil moisture content is optimum. It is important to keep these rollers clean as soil collecting between the feet will reduce compacting ability. Sheep foot rollers are more effective than other rollers in compacting drier clay (but will require more passes) and will churn and blend the soil which is useful in distributing water throughout the construction surface when borrow pit irrigation is not possible.
Ø Vibrating Rollers are more suited to the compaction of sandy soils and where resulting very high densities are required. In dam construction their usefulness is usually limited to small scale work such as narrow cut off compaction, trench work and similar.
Ø Rammers and Plates are used under specialized work such as trenches, behind concrete and around pipe work.
Ø Smooth Wheeled Rollers are more efficient at reducing air-spaces and continue the compaction of lower layers of the embankment through new layers to a greater extent than comparable sheeps foot rollers. On similar layer depths and at the same speed, a smooth wheeled roller would probably require slightly fewer passes to obtain similar soil densities when compared with sheeps foot rollers. However, the latter often prove more appropriate in use for dam construction as their lighter weight and versatility allow them to be pulled by farm machinery on a variety of surfaces. On clay soils, smooth wheeled rollers can form seepage paths between the layers of soils laid on the embankment. If a sheep foot roller is not available to compact such soils, gross depth of clay layers should be reduced and final surfaces roughened (by harrowing or similar) to permit a good bonding between compacted layers.
25.4 Site Clearing and Preparation
Base of the Dam
All tree roots, grass roots, and topsoil must be removed. Once the trees have been removed the dam scoop or scraper can be used to remove about 100 mm of top soil which can then be left in a position from where it can be later retrieved to dress the completed embankment or other disturbed areas.
Borrow Areas
Borrow areas should have been demarcated according to its usefulness.
Sometime previous to the start of construction, if possible, analysis of soil samples being undertaken by a local soils laboratory. For smaller dams, a visual or rough physical assessment may suffice.
The high percentage organic material at top layer must be removed and put to one side for future use. Although borrow areas within the proposed reservoir are desirable, care must be used to make sure that permeable layers are not exposed by the removal of impermeable soil

Farm Power
168 www.AgriMoon.Com
above, as this process, if conducted close to the embankment, could lead to seepage problems later. Also no excavation should occur nearer than 10 m from the toe of the embankment.
Excavated soil (from the borrow pit) must be frequently monitored to check that its quality and moisture content has not changed and that it is still suitable for emplacement in the embankment. The core and cutoff trench require good quality clay. Compaction of the core and cutoff trench is important and the amount of compaction required in all sections will vary from site to site according to the soil quality. Generally drier and lower clay percentage soil requires more compaction and vice versa. Soils of around 20-30 percent clay are ideal as core material and those of lower percentage clay for the upstream shoulder.
25.5 Settlement
As the dam settles the crest should fall close to horizontal. It is important to check this by survey every few months in the first years of operation to ensure over or uneven settlement does not occur. If this does occur, remedial measures (filling by topsoil and grass is usually sufficient) will be required to restore the crest to its design level.
If proper and/or coarser soils are to be used, some increase in the settlement allowance considered at the setting out stage may be necessary. In most cases this increase should not be more than 15 percent overall.
25.6 Spillway
Natural spillways are generally best for all earth dams and farm ponds but often some degree of cut is required to obtain the necessary design slopes. In all cases the movement of machinery over the spillway area should be minimized to avoid over compaction of the existing soil, establishing track ways (which could lead to erosion later), and destroying any existing grass cover. Where a cut is required, it should be kept to a minimum and, unless unavoidable should not completely remove the topsoil. Depending on soil condition, sometimes additional depth is required to cut because of good quality topsoil and grass cover that will have to be placed once the desired profile has been attained. Any large volume spillway cut should be done at a time when the excavated material(if suitable) can be included with the material being moved to construct the main embankment or reserved to fill in borrow pits. Smaller volumes of cut material can usually be included in the training bank.
25.7 Embankment Constructing
The core/cutoff trench
As this is the most important part of any embankment, great care is necessary in the excavation, fill and use of material. Width and depth should have been determined at the design stage. Width (2 m minimum) will often depend on the equipment used in the excavation and also on the size of the dam.
The minimum depth necessary will depend on site conditions but in all excavations the cutoff trench must be taken down to good quality impermeable material such as clay or solid rock or to a minimum of three quarters of the dam‟s crest height. If rock is located and is generally good, it is permissible to fill any cracks or fissures with compacted clay or mortar,
Farm Power
169 www.AgriMoon.Com
provided they can be fully cleaned and traced to ensure seepage paths will not develop later. If an impermeable layer of sufficient thickness has not been reached and the trench depth is to the required 0.75H, the cutoff trench excavation can stop only if the material encountered is not of a coarse of gravelly nature (as often occurs in streambeds). If permeable material is found it is vital that the cutoff is taken through it to a depth sufficient to find more impermeable material.
Before backfilling, the excavation should be checked to ensure that the conditions above have been complied with. Short cuts taken at this stage can prove costly later and seepage through the embankment can become excessive if the correct depth into the correct material is not achieved. A little extra time and care in the excavation of the core is usually worthwhile.
Other requirements such as coffer dams, special compaction, dewatering equipment and safety provisions in the trench should be considered before excavation starts, to allow the work to be carried out efficiently. An assessment of the site condition, for example to ascertain groundwater levels, at the design stage would allow such special provisions to be included in the cost estimates.
Once the excavation has been checked and found satisfactory, backfilling can occur. The best clay soil should be used and compacted in layers no more than 75-100mm thick (50-75 mm is best), throughout the length of the trench.
Although compaction can be achieved by staggered wheel tracks (if tractors are used, fill the tyres with water), it may be more desirable to use hand labour and tamping devices (75-100 mm diameter wooden poles are usually sufficient) or towed equipment (where thicker layers are permissible), to obtain the high levels of compaction required. For broader cores, sheeps foot rollers or vibrating compacters may be more economical. Water browsers or irrigation equipment may be useful in assisting compaction.
Heap material or cracking clays are not recommended for core filling but if the former is used it should be chemically treated and in all cases kept as far as possible below the ground level sections of the core (which should remain wet throughout the year).
25.8 Embankment
Once of the cutoff has been brought up to ground level, the embankment can be constructed. If necessary and usually because of time limitations, it may prove prudent to construct the cutoff some time before the rest of the dam (i.e. during the previous dry season ensuring the works are protected from erosion).
The embankment can proceed with careful and continuous monitoring of the soil types being used to check that the right soil is placed in the appropriate section. The core is continued up through the centre of the wall as the other sections are placed. Because of the width involved, hand compaction may not be feasible and other methods will have to be used. As mentioned no layer should exceed the recommended depth and if the tractor/scraper operative proves incapable of maintaining such a standard, graders or labourers with shovels and rakes may be needed.
Farm Power
170 www.AgriMoon.Com
The removal of the soil from the borrow area can be assisted by ripping or irrigating the area involved (avoid over watering which could lead to traction problems). The latter is especially desirable for core and upstream sections where the soil, if used wet, may be more readily compacted.
At stages determined by the designer/supervisor the embankment as constructed should be surveyed to check that the slopes conform to design limits. If there is any variation, remedial measures will be necessary;
Ø If the slopes are too flat a berm could be constructed to allow an overall slope closer to the design.
Ø If the slopes are too steep, rectification is more difficult as, before earth can be placed to flatten the slopes, keys are required in the existing face to reduce the formation of slip surfaces between the older and newer material. In the latter case, although the slope may be corrected in this way the stability of the dam is never as good as it should be, since it is difficult to obtain the same compaction levels and cohesion as in the original structure
It is better, therefore, to avoid such problems by careful and frequent monitoring of the structures as it takes shape, especially at the beginning of the work when operators and other staff are more prone to make mistakes. Guide boards and pegs can assist at this time with boards cut to the correct angle to be laid on the slope with a spirit level or plumb bob to show horizontal or vertical.
When the embankment is at the correct height it must be surveyed to check in particular that the crest has been built slightly convex with more soil laid in the center where the most settlement will occur. The crest should have a slight slope (cross fall) towards the upstream side of the embankment to permit the safe drainage of rainwater to the reservoir rather than the downstream slope. Over the next few months, and finally after one year, the embankment should be rechecked to assess settlement and to allow the placement of soil at any sections that settle to below horizontal. The spillway should be checked to prove the design slopes were adhered to. If large flood flows occur, or are expected stone pitching or concreting of the end of the embankment and one or both sides of the spillway channel may be necessary to reduce the risk of erosion.
It is very important that good grass cover, preferably of creeping grass type, is established on both the embankment and the spillway before the likelihood of heavy rains. This could mean constructing most of the spillway before work on the embankment itself starts, ideally at the end of the previous rainy season when water for establishing grass is available.
The last soil layers to be laid on the embankment and on any spillway cut sections, should be of good quality topsoil so as to encourage rapid and dense grass growth, manuring and irrigation may prove beneficial. To minimize erosion caused by people and animals the embankment should be fenced and gated and, in some cases special protected pathways for watering livestock should be provided to keep animals well clear of sensitive areas. If erosion does occur particularly at the early stages, much time and effort can be saved by prompt remedial action. After any heavy rainstorm the dam should be inspected. Any rills or gullies
Farm Power
171 www.AgriMoon.Com
filled in and replanted with grass before the situation becomes too advanced. Where soil and grass cover is difficult to establish, wiring of the topsoil and vegetation may assist in re-turfing with suitable sods in any holes that occur.
25.9 Earth Work
25.9. 1 Investigations
Ideally, the entire earth fill should be drawn from within the reservoir area and, if required, from any cut spillway areas. The importance of a correct analytical approach to determine the various soil types for a zoned embankment cannot be stressed too much. Although using a soil laboratory is expensive, the results can more than repay the cost involved and, more often than not, will ensure the exclusion of doubtful material in the construction process. This approach will includes electing the soils to be used, laboratory testing and mechanical analysis (if such facilities are available) to ensure the selected materials are suitable and interpretation of the results of these tests by an experienced engineer or technician to permit the appropriate materials to be used.
At this investigatory stages possible borrow areas should be identified – initially by eye, trying to ascertain soil type from vegetation, visible soil, position on slope and so on. Preliminary exploration to determine suitable borrow areas for dam construction would:
Explore areas for large quantities of soil material for inclusion in the embankment and any training walls. Ideally trials should indicate at least 150 percent of the estimated material needed for the dam is available (i.e. to cater for losses and wastage and poorer than estimated materials being found) and that the haul distances are not excessive.
Explore areas for the provision of more specialized materials such as gravels (for drainage), aggregates (for concrete), filter materials, stone (for rip-rap or stone pitching) and high-quality clays for lining upstream surfaces and any canals. The section below provides basic details to follow in ascertaining the more favourable areas for investigation.
a) Soil Pits and Trenches
Dig soil pits and auger holes to assess the top and subsoil layers and the foundation condition in the embankment area. Auger holes dug on a grid to depths of 3 m throughout a potential source area will allow a general assessment of soil types to be made. A series of trial pits and trenches can then be dug in more promising are as to allow a visual assessment of the soil profile to be made in line with local soil coding and classification techniques. Samples can be taken for subsequent texture and laboratory analysis.
b) Texture Tests
Texture tests are carried out to determine soil types. Excluding stones and gravels, the mineral part of the soil is made up of particles in three size ranges such as: Clay (less than 0.002 mm diameter), Silt (0.002-0.05 mm diameter), and Sand (0.05-2.00 mm diameter).The relative proportions of sand, silt and clay are used to determine the textural class of a soil.
Farm Power
172 www.AgriMoon.Com
The internationally accepted United States Department of Agriculture (USDA) Texture Diagram is a useful tool for initially demarcating soils for dam building. The USDA system is widely used throughout the world.
Basically, the textural classification is: Any soil with more than 55% clay can be considered as „clay‟. „Sandy clay‟ is a soil with between 33 and 55% clay and up to 65%sand. A „sandy clay loam‟ has between 20 and 30% clay and up to80% sand and loam. Sands can be further defined according to the size of the grains (i.e. fine, medium, and coarse) in the sand fraction. Sands and clays, and combinations of them, are most suitable for earth dam construction. However, silty soils are unsuitable because of their inherent instability when wet and should not be included in any of the earthworks.
To precisely define textural classes requires laboratory techniques but, with experience and specific local knowledge, hand testing to determine texture can prove important for the initial stages of identifying appropriate earth fill materials. Clay soil areas can be demarcated in the field with the better soils (i.e. higher percentage clays) being reserved for the core and upstream shoulder of the embankment. Silts are often similar in both appearance and feel to wet clays when dry but can usually be differentiated when wet as the clay will exhibit sticky, plastic-like characteristics while silt has a silky, smooth feeling with a tendency to disperse. Hand-testing techniques involve the taking of a small sample of a soil usually in the hand not required for making notes – dampening it (avoid soaking it) and rolling it into a ball to examine its cohesive constituents.
Better quality clay can be manipulated into a thin strip without breaking up, rolled into a ball and dropped onto a flat surface from waist height without cracking unduly. Also, when cut it will exhibit a shiny, smooth surface.
c) Infiltration Tests
At this stage, preliminary infiltration tests to obtain an indication of the soil‟s permeability can be performed. The simplest way to carry out such tests involves filling auger holes or small pits with water, taking care not to over compact the soil within. A comparative evaluation of falling water levels over an area can then provide an indication of permeability and may indicate relative clay contents. Infiltration rings, which are used in the assessment of infiltration capacity for irrigation design purposes, can be used for the upper surface layers of soil.
d) Core and Cutoff Material
A soil is required that will limit the passage of water but not to such an extent that undesirable differential pressures could build up across and within the embankment.
The impermeability of the soil used will vary between localities, but some standardization of water tightness can be achieved through varying the degree of compaction involved. A more pervious material will require greater compaction and vice versa. Generally, soils containing a significant percentage of clay are ideal for the core but clays with a tendency to crack should be avoided. If the latter are used they should be carefully compacted, placed in lower
Farm Power
173 www.AgriMoon.Com
parts of the dam that are unlikely to dry out (such as in the cutoff trench) or covered by a gravel layer or topsoil with grass.
e) Other Embankment Materials
Semi-pervious materials such as sandy clays and clay loams with a proportion offines, such as clay or perhaps silt particles, are suitable for inclusion in the upstream shoulder. These will allow a limited passage of water and, in a properly constructed embankment, will resist slumping when wet. Where poorer soils are used, special attention to compaction techniques will have to be given to minimize the volume of air spaces in the soil and to maximize its stability when wet. Pervious materials such as coarser grained sand and gravels suitably washed and screened/sieved for size and grade are used in the downstream shoulder and sections of the embankment requiring drainage. Always seek specialist advice for use of these materials in drainage and filter works. These can often be better compacted dry or if only slightly damp. Once completed, a dry downstream face will prevent slippage and reduce risk of failure.
25.9.2 Soils
Within a river valley a cross-section of soils may be available. The valley sides, where less leaching has occurred, can provide soils with a higher proportion of clay. The more heavily leached areas can provide amounts of sands, gravels and/or silts. The streambed should be a source for silts, sands and gravels, the latter being useful for drains and concrete work. Of great economic importance is the need to find such materials close to the dam site, preferably within the reservoir area, and in large enough quantities to justify their removal. Avoid complete removal of impervious materials, as exposure of more permeable layers beneath could lead to seepage problems in later years due to under pressure of several metres of water. Investigation of proposed borrow areas is a necessary feature of any dam survey. This is carried out using auger holes, soil pits, boreholes and utilizing the existing features such as wells and animal burrows to gain an extensive knowledge of the area.
a) Clays
The best clay soil is always reserved for the core and cutoff and must be well compacted. Basically, the lower the clay percentage (to an arbitrary minimum as low as 3-5 percent), the more compaction and care in construction is required. The upstream shoulder does not require highly impermeable clays as these could lead to undesirable uplift pressures developing beneath this section of embankment. More permeable clays usually have a good crumb or granular structure and include the typical red (but not lateritic) soils and the lighter self-ploughing basalt soils with their ability to move topsoil (when dry and crumbly) down through cracks in the profile. Sandy clay soils are most suited for inclusion in this upstream section as they compact well, have much reduced seepage characteristics but do not allow the buildup of high soil–water pressures. Clays are not required in the downstream shoulder as it is essential that this section is free draining.
Farm Power
174 www.AgriMoon.Com
b) Silts
Avoid including silts in any section of the embankment. The lack of cohesion, poor structure, fine material and difficulty in compaction are their main drawbacks. A small proportion of silt is permissible, say in a silty-clay, but care must be taken in its use and application to ensure it is balanced with other soils and to keep percentage contents low. As they can be confused with fine clays, it is important to differentiate the two when testing for texture. Laboratory analysis may, therefore, be required.
c) Sands
A soil with a predominance of sand should not be used in dam construction. A sandy soil can be used in the downstream shoulder but should not be used elsewhere unless there is no alternative. If a sandy soil is used in the rest of the dam special attention must be paid to compaction, the best soil reserved for the core, and some consideration given to obtaining embankment water tightness by other means. Sands do have an important role in larger dams as a filter material.
d) Materials to Avoid
Should there be any question about a soil‟s suitability, it is safest to avoid using it. Some materials should never be used in dam construction, in particular the following:
Organic material (except when used to top dress the embankment and other parts of the dam site at the end of the construction period).
Decomposing material.
Material with a high proportion of mica, which forms slip surfaces in soils of low clay percentages.
Calcitic soils such as clays derived from limestone, which although generally stable, are usually very permeable.
Fine silts, which are unsuitable for any zone of the dam.
Schists and shales which, although often gravelly in texture, tend to disintegrate when wet. Schists may also contain a high proportion of mica.
Cracking clays that fracture when dry and may not seal up when wetted in time to prevent piping through them.
Sodic soils, which are fine clays with a high proportion of sodium. They are difficult to identify in the field, so any fine clay should be analysed.
Sodic Soils
Contact between a sodic soil and water leads to deflocculation occurring in the profile in which sodium has accumulated, entered the exchange complex and caused dispersion of the colloids. Consequently, reduction occurs in pore spaces affecting infiltration, permeability

Farm Power
175 www.AgriMoon.Com
and aeration. The pH and electrical conductivity (affected by soil salinity – sodium, magnesium and calcium being important) measured are in most cases high. Basically this leads to highly dispersive behavior when wet (i.e. as most dam soils would be) and thus these soils do not act at all like clays (which bond together when wet) and are completely unsuitable to use in any embankment. Any clays with a predominance of sodium (and, to a lesser extent, magnesium) among the exchangeable cations should be avoided as earthworks‟ materials.
Laboratory results will generally show exchangeable sodium percentage (ESP)\ values higher than 15 and pH in the range 8.5 to 10 although lime-free soils can show pH values as low as 6. Structure will have significantly deteriorated and compaction tests will indicate easily mobilized soils that are structurally unstable when wet and under load. The proportion of clay to exchangeable sodium will also be important in so much that a sandy-clay soil with lower ESP values (i.e. 8 or above) will prove more unstable than a clayey soil with a higher ESP value.
Sodic soils are virtually cohesion less when wet and are responsible for many catastrophic earth dam collapses. Such failures usually occur soon after first filling of a dam reservoir and it is normally not advisable to attempt repair work as the embankment and foundation may still have sodic areas as yet unaffected. If sodicity is suspected the best rule is not to use any of the soil concerned and avoid such areas when extending dam, core or foundation work. However, for soils with low levels of sodicity, chemical treatment with gypsum and higher levels of compaction to increase the in situ impermeability (i.e. to keep the sodic soils dryer than normal) may help maintain stability where such soils have inadvertently been included in earth fill materials. Drainage will also be important to lower the phreatic surface within the embankment and to reduce pore pressures.
25.9.3Mechanical Analysis
Mechanical analysis of soil samples to assess constituents, mineral content, compaction characteristics and to check for other factors such as mica, silt, sodicity, etc., that may make apparently good soil unsuitable, should be carried out. Correlation of these results, which accurately assess silt, clay, sand and other particles in a soil, with previous work will allow estimates to be made of earth fill available, over burden to be removed and unsuitable areas to be avoided. The importance of a correct analytical approach to determine the various soil types for a zoned embankment cannot be over stressed. Although using a soil laboratory is expensive, the results can more than repay the cost involved and, more often it will ensure the exclusion of doubtful material in the construction process.
25.9.4 Preliminary Volume of Earthworks
The volume of earth work can be estimated as follows:

Farm Power
176 www.AgriMoon.Com
Where, V= volume of earth work in m3, H= crest height (FSL + Free board) of the dam in m, L= length of the dam, at crest height H, in m (including spillway), C= crest width in m, and S= combined slope value.
For example if the slopes of the embankment are 1:2 and 1:1.75, then S is 3.75.This formula is based on a real equation for the cross-section and longitudinal section with the inclusion of an empirically developed adjustment factor. Again, it presents an idealized solution and as for the capacity formula should only be used at the preliminary survey stage. The formula is, however, reasonably accurate and if a general average figure is known for costs of earthworks, a cost for the total embankment can be derived.

Farm Power
177 www.AgriMoon.Com
Lesson 26 Operation and Maintenance of Water Harvesting System
26.1 Introduction
Many water harvesting projects have failed or experienced serious problems due to lack of an integrated approach during the planning process, especially during implementation, operation and maintenance of the system. Lack of maintenance is a common cause of failure of such schemes. It is often assumed that the beneficiaries will maintain the system once it is executed, but the stakeholders may not have the resources or skills needed to do so. Therefore, the operation and maintenance cost of the project must be taken into account at the planning stage so that the system will continue to function after the completion of the project.
Unfortunately, water harvesting techniques introduced through new projects often ignore indigenous practices prevailing in the project site. Consequently, the local people or the beneficiaries, unfamiliar with the advanced approaches, do not find any scope to be involved in any meaningful participation in planning and implementation process. Thus, where advanced approaches in water harvesting system are to be introduced, it becomes essential to train the local people on construction methods, operation and maintenance of the harvesting structures to ensure smooth and long term functioning of the system.
This chapter focuses on the operation and maintenance of the various water harvesting systems.
26.2 Implementing Water Harvesting Systems
Participation of beneficiaries in the entire process of planning, execution and monitoring of water harvesting projects and most importantly in implementation should be given top priority. It is so because the failure of the project is most likely without their involvement. Any water harvesting systems should possess three virtues in common such as:
It must cater to the needs of its beneficiaries
It should be accepted unanimously by the stakeholders
It should be sustainable and environment friendly.
The suitability of water harvesting system under a set of environmental and geophysical conditions depends upon the factors such as, most importantly, the cropping pattern and the socioeconomic and cultural status of the stakeholders. Besides participation of the people in planning and implementation process, the availability of labour and material for the project, accessibility of the site and distance from villages are the other factors to be taken into active consideration.

Farm Power
178 www.AgriMoon.Com
A consensus is required on the operation and maintenance aspects of these structures. Involvement of local administration and non-government organizations in implementation of the project plays an effective role through developing a collective responsibility.
Land tenure in rangelands varies from place to place. In some countries, apart from the existence of other forms of land tenure such as rented and private land ownership, the rangeland is largely public land. However, most of the rangeland is private tribal land in some other countries. There the community land is commonly overgrazed and little attention is given to sustainability.
Although rainfall is generally greater in mountainous areas than in the rangelands, these areas are generally less accessible and inhabitated by marginal and poor communities. The complex landscape consists of steep slopes, terraced croplands, sloping rangelands, and scattered patches of shrubs and trees. Most of the agriculture in these areas depends on direct rainfall. Irrigated agriculture takes place along the banks of the ephemeral streams that dissect the mountains. The main cause of land degradation here is due to water erosion.
Considerable progress has been made in identifying efficient water harvesting and water use schemes for both crop production and combating desertification. Constraints to the implementation and adaptation of these schemes include less familiarity of farmers with the technology, conflicts and disputes on water rights, land ownership; and lack of adequate characterization of rainfall, evapotranspiration and soil properties.
Water harvesting may be implemented by a farmer, a community or by public agencies. Micro-catchment water harvesting usually comes within individual farms. This is a simple and low-cost approach; however farmers may experience some difficulty in laying out contour lines required for installation of the structures. Macro-catchment water harvesting systems are to be implemented through a project authorized by the local community with the assistance and guidance from the government bodies. Large scale long slope and/or floodwater harvesting schemes generally need the intervention of public agencies. Such projects usually involve direct intervention of government organizations, machinery and hired labourers. Here the initial cost is relatively high. Moreover, such top-down approaches are rarely successfully. Most of the water harvesting projects implemented by this approach have failed and sometimes abandoned by the beneficiaries.
Projects involving farmers and local communities have been more successful than top-down projects. However, simple demonstrations, training, and extension services are required for effective implementation of such projects. The main advantage of the top-down approach is that it is quick and efficient in rehabilitating the degraded land. However, as noted earlier, the costs are high and large systems require expensive repairs that are beyond the resources of local people. It can be justified in areas with high rainfall, where less labour is available and a quick result is needed.
As a first step, all parties (farmers, community, authority, and government representatives) involved with the project should be engaged in a round-table-discussion to identify the best technical approaches for the locality. The plan of action developed should be simple enough for the people to implement. Furthermore, the water harvesting system itself must be

Farm Power
179 www.AgriMoon.Com
sustainable. The planner should be ready to listen and learn from the farmers. Sharing farmers views in the managerial role contributes to the success of the project.
26. 3 Considerations in Implementation
Water harvesting projects implemented without a complete integrated study prior to execution have been subjected to many technical errors in design and implementation. In many cases the techniques applied are inappropriate and do not meet the requirements of local conditions. Sometimes with appropriate techniques the installation process is observed to be inadequate or incomplete.
Some basic technical criteria that must be fulfilled while implementing water harvesting projects are:
Slope: The engineering structures required in a given situation increases as the slope increases. But, water harvesting is not recommended for the areas having slope steeper than 50% as it may not be economically viable.
Soils: The soil should be deep, neither saline nor sodic, and should be generally fertile. The major limitations are with limited soil depth and sandy soils which have a relatively high infiltration rate and low water holding capacity
Costs: The cost of a water harvesting project depends upon the amount of earth/stonework involved. Even when this is directly carried out by farmers, it should be considered as a standard for labour requirement to construct a system. Thus, the selected technique would become suitable to the farmers' affordability.
Other issues that must be addressed while implementing the water harvesting projects are reduction of maintenance and overall project cost. Some of them are discussed in the following section.
26.3.1 Over-Design and Under-Design Issues
Over-designing or under-designing may lead to the failure of the project. Overdesign increases project and maintenance costs which may result in abandonment of the project before its implementation. Although water harvesting has been practiced in some parts of the world for centuries, no such specific general rule or guideline is available on design issues except some limited design data. Even when the design data is available at a location, it lacks the ability to be transferred from one location to the other because of constraints imposed by local conditions.
The impacts of climate change across the globe such as longer dry spells and higher rainstorm intensities may require higher catchment; cropping area ratios and more solid (higher, broader and more compacted) earthen structures.
Farm Power
180 www.AgriMoon.Com
26.4 Operating Water Harvesting Systems
At the beginning of the project, a locally acceptable team involving mainly the project beneficiaries should be constituted to oversee the operation of the water harvesting system. The responsibility of this body should extend beyond the project phase. Guidelines and procedures for the operation and maintenance of all components of the water harvesting system should be developed for the earthen dikes and bunds, water storage structures, spillways, and diversion structures. Micro-catchment water harvesting systems should be inspected after every runoff-producing rainstorm so that any minor breaks in bunds can be promptly repaired.
For large scale flood water harvesting system there may be a need to create a local association to liaise with the government agency on issues pertaining to the project. This local institution may be supported by the government for a limited period of time and thereafter the association is expected to take over the full responsibility of operating and maintaining the project. All new water harvesting systems should be inspected often especially during the first one or two rainy seasons following construction. Treated catchment should be protected against damage by grazing animals. Silt and trash should be removed from the water conveyance and distribution systems and other storage facilities.
26.5 Maintaining Water Harvesting Systems
In many cases, it is observed that the operation and maintenance of water harvesting projects are not handed over to the beneficiaries instead the government agencies look after it. Maintenance of a water harvesting system requires daily observation to assess the effects of heavy rainfall, damage by animals, etc., and this is unlikely to be achieved when the responsibility lies in the hands of a government agency. Hence, it is necessary to hand over the responsibility of maintenance of the project to all the stakeholders. They should be made aware of the importance of regular maintenance for the long-term functioning of the system. In addition, they must contribute to ensure that such maintenance is conducted promptly and effectively.
26.6 Monitoring and Evaluation
Monitoring and evaluation of a project is essential to assess its performance, the extent to which it is meeting the design specifications, or the degree and causes of its success or failure. But it is rarely seen in case of water harvesting projects. However, monitoring and evaluation of water harvesting projects are essential to allow the operators to take remedial measures in time and ensure the effective operation of the project. For example, if it is monitored that the amount of runoff water has been overestimated, then the cropped area can be reduced to achieve the desired results. Further, the information gathered also enables all stakeholders to learn about the mistakes in approaches and creates scope for necessary modification or improvement in the future projects. This is a kind of rectification of errors in earlier approaches. Without monitoring, the mistakes get repeated in subsequent projects and the system does not improve.
Data pertaining to all aspects of the functioning of a project including technical performance of the structures, agricultural performance, environmental factors (rainfall, soil erosion, etc.);

Farm Power
181 www.AgriMoon.Com
and socioeconomic and cultural impacts need to be collected. For large projects using advanced technology like GIS, care must be taken while selecting monitoring sites along with ground truthing to enable one to obtain up to date information on the project evolution.
For orderliness in the collection and dissemination of water harvesting information, government agencies can be assigned with the responsibility of collecting, analyzing and storing data regularly from both ongoing and completed projects. For instance, following the failure of a project for some avoidable reasons, a team conducted a survey on monitoring and evaluation aspects of the collapsed project using a set of questionnaires. The response of the beneficiaries indicated that the issue of land tenure was the major attributable criterion for failure of the project. This problem could have been detected and avoided if a systematic monitoring and evaluation approach would have been carried out at the planning stage of the project.
Apart from the above, the project planners should ensure that all comprehensive reports of various phases of the project are kept protected. These reports can be used later for several purposes such as:
means of evaluating the degree of realization of the project objectives
to determine the accuracy of the project design assumptions and address any errors
source of information for planners and government establishments to plan the development need of the region; and
to evaluate the response of the local populace to the new system.
26.7 Extension and Training
Extension and training are some important steps for the success of a project. Training programmes need to be organised on the techniques used in a water harvesting project for the beneficiaries and field level extension workers. These programmes should run concurrently with the project implementation through project activities for practical demonstrations. In other words, such training programmes help in bringing together the project staff, extension agents, farmers, and pastoralists across the table and make them understand their responsibilities and complementary roles for the success of the project.

Farm Power
182 www.AgriMoon.Com
Module 5: Economic Analysis of Farm Pond and Reservoir
Lesson 27 Introduction to Economic Analysis
27.1 Introduction
Economic analysis is the most important parameter for determining the optimum size of farm pond. It is no doubt that a big size farm pond can meet the irrigation demand of the crops grown in the command areas in addition to meeting the other water needs during puddling of rice and before sowing of the winter crops. Obviously, an oversized farm pond is likely to incur a large investment which makes the project economically infeasible. On the other hand, a small size pond may not have enough water in it to meet the crop water demand as well as other demands in the command area. Thus, it is adjudged as an under-designed structure. It is observed that the total investment in a farm pond increases gradually with increase in the size of the pond. With increase in the size of the pond, the storage capacity of it increases with simultaneous decrease in the crop area. From economic point of view, initially the increase in the size of the farm pond would increase the benefit/profit from the land and the profit is expected to maximize at a particular size of the pond. If we go for farm pond beyond this size, the profit would decline gradually and at a certain stage it becomes negative as compared to the investment. The graph of net profit with size of the farm pond starts from a minimum and gradually rises to attain a peak and then declines (Fig. 27.1). The size of the farm pond corresponding to the peak of net profit represents the optimum size of the pond. It is so because of reduction in production due to decrease in crop area. The most economical size of the pond is decided based on the highest rate of return on investment. This particular size of the farm pond at which the net profit is maximum, is called as the optimum size. It is to be noted that most of the economic indicators like net profit, benefit-cost ratio and internal rate of return remain high for the optimum size of the farm pond, and payback period lies at its minimum.
Deriving the optimum size of farm pond starts with economic analysis of any assumed minimum size farm pond, say, 5 per cent of the farm area. Economic analysis should include both the cost involved in the pond and the net profit obtained due to application of supplemental irrigation each year. Thus, the analysis continues for the entire life span of the pond.

Farm Power
183 www.AgriMoon.Com
Fig. 27.1. Net profit from various sizes of lined OFP at different probability of exceedance. PE = probability of exceedance (Source: Sahoo, 2010)
Total sum of net profit at the end of the life span is compared with the total investment for drawing a conclusion pertaining to the economic viability of the project. Thus, the net profit of all higher sizes of the OFP above the assumed minimum size is analyzed and the size that gives the highest net profit is considered as the optimum size of the pond. It is to be noted that any other size, larger or smaller, than the optimum size would give less net profit and in some cases it may be negative also.
Present worth analysis has been recommended by many researchers to determine the optimum size of the farm pond in rainfed areas. In any economic analysis, all cash flows must be evaluated with respect to some reference time. In present worth analysis, all the cash flows (inflows and outflows) over the life span of the project are converted into an equivalent present value at the beginning using appropriate factors to account for interest and inflation. An economic analysis is often associated with preparing a balance sheet of fixed and variable costs in a system against the amount of return. While the fixed cost consists of the initial one time investment in the system, the variable cost includes the parameters those demand investment every year or at some recurrence interval during the life span of the project.
27.2 Initial Investment
Initial investment of OFP irrigation system, also called as fixed cost, includes the following components:
Construction cost of the pond.
Lining cost of the pond if lining is required and
Labour cost of lining (for lined pond).
Construction cost of ponds is estimated taking the volume of earth work into account. For a particular size of the pond with assumed depth and side slope, the dimensions of farm pond are computed as discussed in chapter --. Then the volume of the storage in the pond is computed using the prismoidal formula which gives the volume of earth work required. It is to be remembered that for same volume of earth work excavation, a pond having higher depth would require more cost of excavation than the pond with lower depth. This is because of the difficulty involved in excavating deeper soil profiles than shallower ones.

Farm Power
184 www.AgriMoon.Com
Consequently, more labour force is engaged in digging and then lifting of the soil material from a deeper pond. Similarly, the cost of excavation also depends on the type of soil. If the soil of the pond site is soft, then digging becomes easier and the cost of excavation is less. On the other hand, if the soil is hard and rocky surface is encountered, then excavation cost increases. The lining cost of the pond depends on the extent of area to be lined and the type of the lining materials. The prevailing rate of lining materials, their durability are to be taken into consideration while deciding the lining cost. Cost of brick masonry and polythene lining is more than the ordinary soil-cement or clay lining. The total labour cost/wages for lining the ponds again varies with the extent of area to be lined and the type of lining. Labour wage as per schedule of rates of the state or locality should be taken into consideration while preparing the estimate of the OFP irrigation system.
27.3 Variable Cost
Variable cost also called as annual operating cost includes the following costs:
Pond maintenance cost
Land lease cost
Irrigation cost to meet the irrigation supply from the pond to the crops
Cost of production of the crops under the command area of the pond.
Maintenance cost is used for annual repair and maintenance of the farm pond and its ancillary structures. De-silting of the farm pond; repair and maintenance of the spillways and embankments come under this category. Pond maintenance cost depends on the years of service of the pond, the operating environment and the quality of maintenance. In addition, there are substantial variations in the prices of the input materials and wages of the skilled personnel in maintenance. Annual maintenance cost should therefore be based on local data wherever and whenever possible. When the local data are not available then the annual maintenance cost of farm pond irrigation system can be assumed to be 2% of fixed cost of pond, as a rule of thumb. As the amount of initial investment varies with the pond sizes so, the maintenance cost is likely to vary as the pond size changes.
An on-farm pond, as the term dictates, means a pond in the farm or crop field. The farmer is used to grow crops in the same location before construction of the pond. Had this piece of land not diverted for OFP, it would have been used for growing crops. Thus, due to construction of the pond in the farm itself, the farmer is likely to get less production leading to decline in the net profit. It is similar to a situation when the farmer leases the land for some other purpose to someone else. In this case, the farmer charges the land lease cost on the leasee. The same principle applies here when a portion of the crop field is diverted for the OFP. The land lease cost is considered to have an unbiased economic analysis of the pond irrigation system. The existing lease rate of the land fixed by the Revenue Department of that locality is taken into consideration. This cost varies with the land type based on its utility. For example, the lease cost of a crop land is less than that of a homestead land.
Irrigation cost depends on the method of irrigation and volume of water to be supplied to the crop field. When pumps are used for lifting water from the OFP, the irrigation cost is the
Farm Power
185 www.AgriMoon.Com
pumping cost which includes the cost of energy and the conveying pipes. When drip and sprinkler systems are required for supplying irrigation water to the crops, the cost of the operating systems must be included in the irrigation cost. For various pond sizes, application of supplemental irrigation to crops grown in the command areas of the farm pond will be different and hence, irrigation cost will also be different.
The cost of production depends on the type and acreage of the crops in the command area of the pond. It also varies from region to region. Hence, the production cost of the crops prevailing in the locality must be considered. Production cost includes the cost of (i) agricultural inputs and (ii) field operations. While the inputs to the field are the seeds, fertilizers and pesticides etc., field operations include the (i) land preparation (ii) sowing/planting (iii) intercultural operation (iv) application of fertilizer and pesticide and (v) harvesting.
27.4 Annual Returns from Irrigation
It is obvious that crop yield show a positive response to the enhanced soil moisture effected due to the supplemental irrigation from the farm pond. Annual returns are the values of the increased yields of the crops due to supplemental irrigation. It is calculated by considering the minimum support price (MSP) of the grains/seeds and local market price of the by-products of the crops. When the returns from the pond through pisciculture and its embankment through growing creepers and other crops are taken into account, the annual return is converted to total annual returns. With increase in size of the farm pond, the amount of water available for supplemental irrigation to crops will increase leading to adequate soil moisture condition in the root-zone during the critical growth stages of the crops and obviously, better crop yield as discussed in Section 10.4. The increased yield from the increased size of farm pond is likely to fetch higher total annual returns from the land. Total annual return from a field with OFP irrigation is compared with that from a same size field under complete rainfed condition, the difference between them results in net annual return from the land.
27.5 Present worth Analysis
Present worth (PW) of a project is its fiscal value calculated in the beginning of the project. Present worth analysis is used to evaluate all the cash flows in order to account for the interest and inflation factor in investment. Cash flow in OFP irrigation system is divided into (a) cash inflow; and (b) cash outflow. The cash inflow includes total annual returns from irrigation and cash outflow includes initial investment and variable costs in the system. Annual cash inflows and outflows throughout the life period of the project are converted to their present worth using interest and inflation rate prevailing in the beginning of the project.
Cash Outflow
Present worth of cash outflow is computed taking into account the initial investment and the present worth of total variable cost.
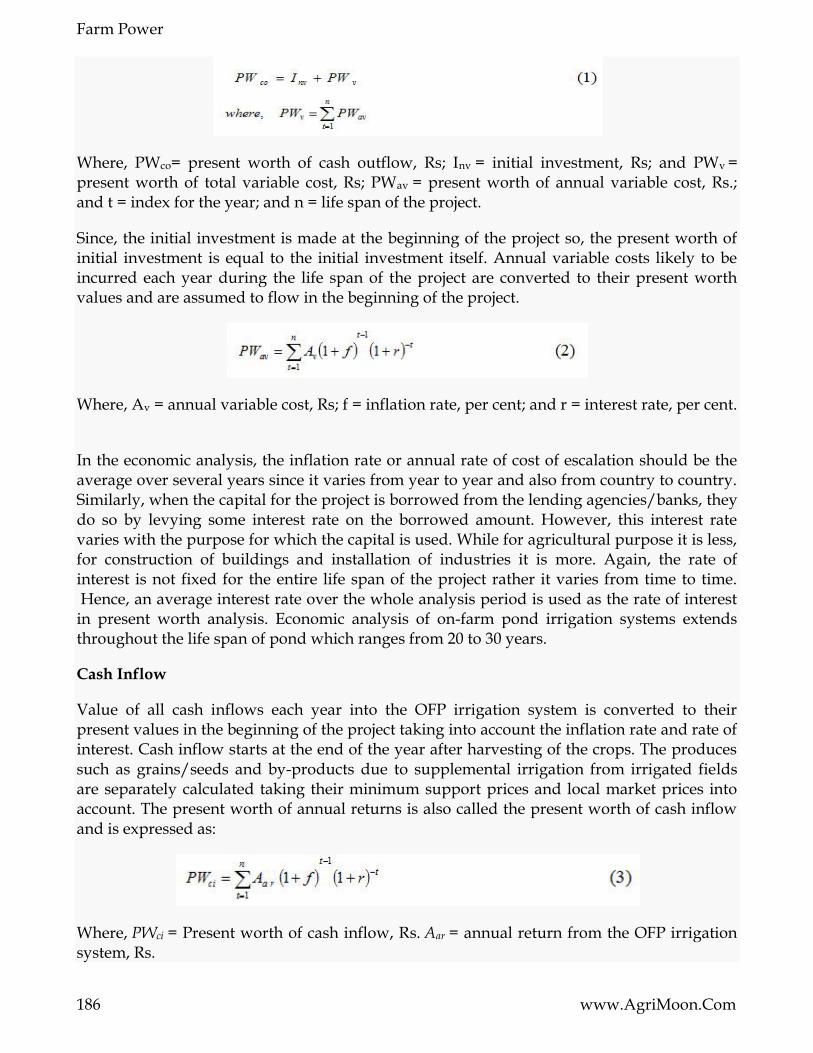
Farm Power
186 www.AgriMoon.Com
Where, PWco= present worth of cash outflow, Rs; Inv = initial investment, Rs; and PWv = present worth of total variable cost, Rs; PWav = present worth of annual variable cost, Rs.; and t = index for the year; and n = life span of the project.
Since, the initial investment is made at the beginning of the project so, the present worth of initial investment is equal to the initial investment itself. Annual variable costs likely to be incurred each year during the life span of the project are converted to their present worth values and are assumed to flow in the beginning of the project.
Where, Av = annual variable cost, Rs; f = inflation rate, per cent; and r = interest rate, per cent.
In the economic analysis, the inflation rate or annual rate of cost of escalation should be the average over several years since it varies from year to year and also from country to country. Similarly, when the capital for the project is borrowed from the lending agencies/banks, they do so by levying some interest rate on the borrowed amount. However, this interest rate varies with the purpose for which the capital is used. While for agricultural purpose it is less, for construction of buildings and installation of industries it is more. Again, the rate of interest is not fixed for the entire life span of the project rather it varies from time to time. Hence, an average interest rate over the whole analysis period is used as the rate of interest in present worth analysis. Economic analysis of on-farm pond irrigation systems extends throughout the life span of pond which ranges from 20 to 30 years.
Cash Inflow
Value of all cash inflows each year into the OFP irrigation system is converted to their present values in the beginning of the project taking into account the inflation rate and rate of interest. Cash inflow starts at the end of the year after harvesting of the crops. The produces such as grains/seeds and by-products due to supplemental irrigation from irrigated fields are separately calculated taking their minimum support prices and local market prices into account. The present worth of annual returns is also called the present worth of cash inflow and is expressed as:
Where, PWci = Present worth of cash inflow, Rs. Aar = annual return from the OFP irrigation system, Rs.

Farm Power
187 www.AgriMoon.Com
Lesson 28 Economic Indicators
In any economic analysis generally four main indicators are studied. These are discussed below:
28.1 Net Present Value
Net present value (NPV), also referred to as the bottom line or net income or net profit, is a measure of the profitability of a venture or project after accounting for all costs. This term results from the traditional appearance of an income statement which shows all allocated revenues and expenses over a specified period with the resulting summation on the bottom line of the report.
In simplistic terms, NPV is the money left over after paying all the expenses of an endeavor or a project. The accountant must itemize and allocate revenues and expenses properly to the specific working scope and context in which the term is applied. The acceptance or rejection of the project depends upon the fiscal value of NPV as under:
Thus, the NPV of the OFP irrigation project is computed as under:
Where, NPV = net present value of the OFP irrigation project, Rs.
28.2 Benefit Cost-ratio
Cost-benefit analysis is one of a set of formal tools of efficiency assessment. Efficiency assessment refers to analyses made for the purpose of identifying how to use scarce resources to obtain the greatest possible benefits of them. Cost-benefit analysis is a technique which is based on welfare economics. Benefit-cost ratio (BCR) is an indicator used in the formal discipline of cost-benefit analysis to summarize the overall value for money of a project. A BCR is the ratio of the benefits of a project, expressed in monetary terms, relative to its costs, also expressed in monetary terms. All benefits and costs should be expressed in discounted present values. The higher the BCR, the better is the investment. General rule of thumb is that if the benefit is higher than the cost, then it is wise to invest in the project. In OFP irrigation project, the BCR is expressed as:

Farm Power
188 www.AgriMoon.Com
BCR more than 1 suggests acceptance of the OFP irrigation system and less than 1 is the criterion for rejection. Among BCR values more than 1, the highest value is more acceptable.
The main steps of a cost-benefit analysis are as follows:
Develop measures or programmes intended to help reduce a certain problem.
Develop alternative policy options for the use of each measure or programme.
Describe a reference scenario (sometimes referred to as business-as-usual or the do-nothing alternative).
Identify relevant impacts of each measure or programme. There will usually be several relevant impacts.
Estimate the impacts of each measure or programme in “natural” units (physical terms) for each policy option.
Obtain estimates of the costs of each measure or programme for each policy option.
Convert estimated impacts to monetary terms, applying available valuations of these impacts.
Compare benefits and costs for each policy option for each measure or programme.
Identify options in which benefits are greater than costs.
Conduct a sensitivity analysis or a formal assessment of the uncertainty of estimated benefits and costs.
Recommend cost-effective policy options for implementation.
28.3 Internal Rate of Return
The Internal rate of return (IRR) is a rate of return on an investment. The IRR of an investment is the interest rate at which the net present value becomes zero. The IRR can be considered as the expected rate of growth to be generated in a project. It is an indicator of the efficiency, quality, and yield of an investment.
When IRR is below the rate of interest levied by the bank, the project should be rejected. This is in contrast with the net present value, which is an indicator of the value or magnitude of an investment. An investment is considered acceptable if its internal rate of return is greater than an established minimum acceptable rate of interest levied by the lending agency. Generally speaking, the higher a project's internal rate of return, the more desirable it is to

Farm Power
189 www.AgriMoon.Com
undertake the project. Internal rate of return (IRR) is computed as that interest at which the BCR value is just 1.0.
The „r‟ value in Eq. 3, for which the net present value becomes zero, is called the IRR of the investment. For example, the amount invested in a project (say Rs.1, 00,000/-) if would have been fixed in some bank or invested otherwise in share market, the bank or the share market returns back the amount with 10% (say) rate of interest. If the project where the amount is invested does not return back the amount with more than 10% rate of interest, then the project is rejected. In reverse if it is more than 10%, then it is accepted.
28.4 Payback Period
Payback period (PBP) is one of the simplest investment appraisal techniques. It is the time required to pay back the loan or the time at which the present worth of cash inflows equals or just exceeds the present value of cash outflow. The OFP irrigation system is accepted when the payback period is less than the life span of the OFP. Quicker the payback period, higher is the potential of the project.
Payback period is calculated by subtracting the present worth of annual net return year-wise from the initial investment starting from the first year. The year in which the annual net return exceeds the initial investment is considered as the payback period of the investment. The project is accepted subject to PBP less than the life span of the project otherwise the project is rejected.
The year in which the value in Eq. 4 becomes positive is assumed to be the payback period of the investment. For example, if Rs.1,00,000/- is invested initially in a project and the amount is paid back from the annual returns in 5 years, then the PBP of the project is 5 years.

Farm Power
190 www.AgriMoon.Com
Module 6: Miscellaneous Aspects on Reservoir and Farm Pond
Lesson 29 Water Quality of Harvested Water and Environmental Considerations
29.1 Introduction
Water is never found in pure state in nature. Essentially, all water contains substances derived from the natural environment and human activities. These constituents determine water quality. Water quality is a prime factor in determining the suitability of water supplied to satisfy the requirements of different uses. The quality of water in the ponds, lakes or reservoirs is influenced by the quality of runoff water entering into the pond, properties of the soil in the catchment and at the pond site; and any contaminants added to it due to human and animal activities.
Storing water in tanks, reservoirs poses quality and hygienic problems, especially in warmer climates. Thus water quality considerations differ between micro- and macro-catchment systems, and between systems with and without interim storage.
The implementation of water harvesting systems has numerous impacts on the environment e.g. on aquatic life and also on the spread of water related diseases.
29.2 Water Harvested for Human Consumption
Water for drinking purposes and other domestic uses must meet certain qualitative standards. World Health Organization (WHO) has prepared guidelines in 2004 for the provision of safe drinking water, including quality standards and information on the roles and responsibilities of various stakeholders involved in providing drinking water. However, the practical application of these requirements varies from place to place depending on the living standard of the community and type of water source.
The main water quality indicators of drinking water are characterized by their physical, chemical and biological parameters. The list of the main indicators/parameters includes:
Alkalinity
Colour of water
pH
Taste and odour
Dissolved salts (sodium, chloride, potassium, calcium, manganese, magnesium)
microorganisms such as fecal coliform bacteria (Escherichiacoli), Cryptosporidium, and Giardia lamblia
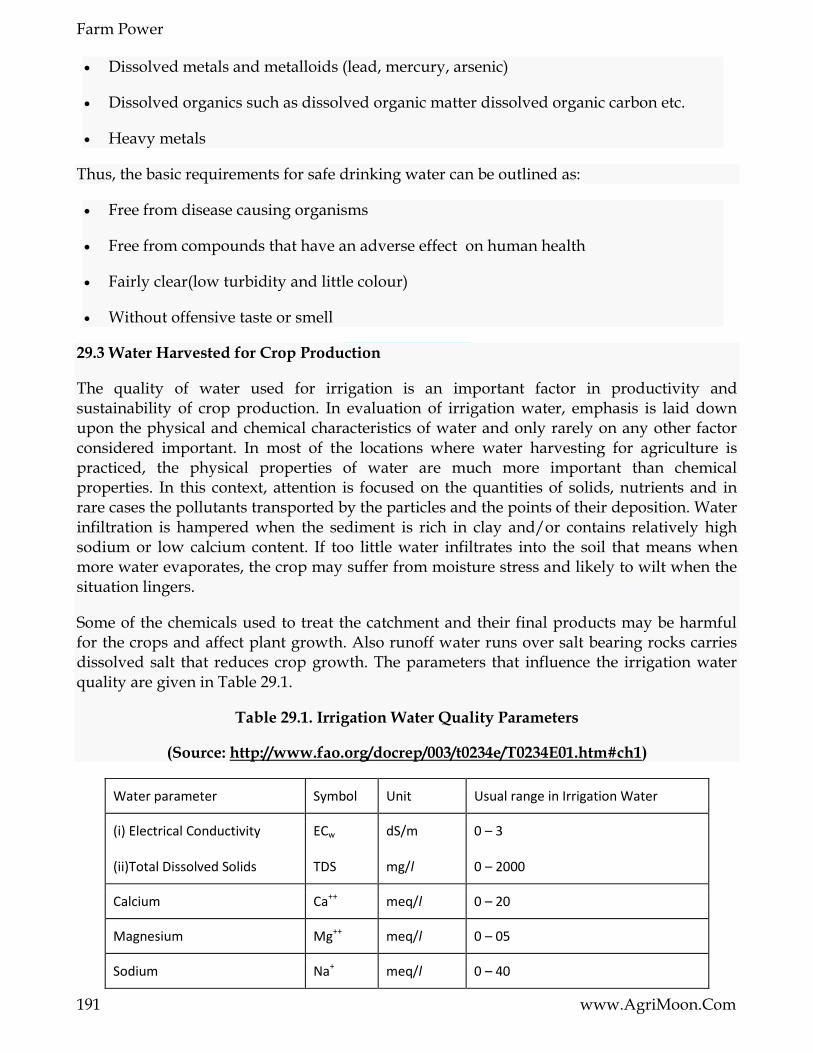
Farm Power
191 www.AgriMoon.Com
Dissolved metals and metalloids (lead, mercury, arsenic)
Dissolved organics such as dissolved organic matter dissolved organic carbon etc.
Heavy metals
Thus, the basic requirements for safe drinking water can be outlined as:
Free from disease causing organisms
Free from compounds that have an adverse effect on human health
Fairly clear(low turbidity and little colour)
Without offensive taste or smell
29.3 Water Harvested for Crop Production
The quality of water used for irrigation is an important factor in productivity and sustainability of crop production. In evaluation of irrigation water, emphasis is laid down upon the physical and chemical characteristics of water and only rarely on any other factor considered important. In most of the locations where water harvesting for agriculture is practiced, the physical properties of water are much more important than chemical properties. In this context, attention is focused on the quantities of solids, nutrients and in rare cases the pollutants transported by the particles and the points of their deposition. Water infiltration is hampered when the sediment is rich in clay and/or contains relatively high sodium or low calcium content. If too little water infiltrates into the soil that means when more water evaporates, the crop may suffer from moisture stress and likely to wilt when the situation lingers.
Some of the chemicals used to treat the catchment and their final products may be harmful for the crops and affect plant growth. Also runoff water runs over salt bearing rocks carries dissolved salt that reduces crop growth. The parameters that influence the irrigation water quality are given in Table 29.1.
Table 29.1. Irrigation Water Quality Parameters
(Source: http://www.fao.org/docrep/003/t0234e/T0234E01.htm#ch1)
Water parameter Symbol Unit Usual range in Irrigation Water
(i) Electrical Conductivity (ii)Total Dissolved Solids
ECw TDS
dS/m mg/l
0 – 3 0 – 2000
Calcium Ca++ meq/l 0 – 20
Magnesium Mg++ meq/l 0 – 05
Sodium Na+ meq/l 0 – 40
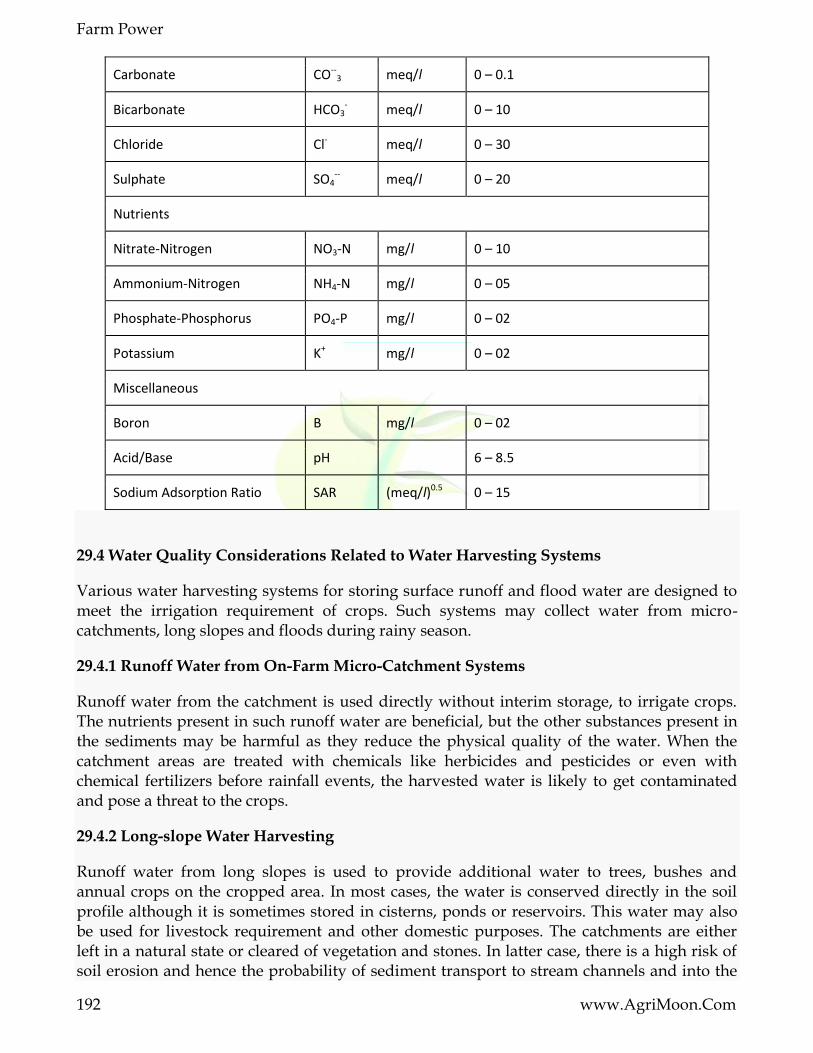
Farm Power
192 www.AgriMoon.Com
Carbonate CO--3 meq/l 0 – 0.1
Bicarbonate HCO3- meq/l 0 – 10
Chloride Cl- meq/l 0 – 30
Sulphate SO4-- meq/l 0 – 20
Nutrients
Nitrate-Nitrogen NO3-N mg/l 0 – 10
Ammonium-Nitrogen NH4-N mg/l 0 – 05
Phosphate-Phosphorus PO4-P mg/l 0 – 02
Potassium K+ mg/l 0 – 02
Miscellaneous
Boron B mg/l 0 – 02
Acid/Base pH
6 – 8.5
Sodium Adsorption Ratio SAR (meq/l)0.5 0 – 15
29.4 Water Quality Considerations Related to Water Harvesting Systems
Various water harvesting systems for storing surface runoff and flood water are designed to meet the irrigation requirement of crops. Such systems may collect water from micro-catchments, long slopes and floods during rainy season.
29.4.1 Runoff Water from On-Farm Micro-Catchment Systems
Runoff water from the catchment is used directly without interim storage, to irrigate crops. The nutrients present in such runoff water are beneficial, but the other substances present in the sediments may be harmful as they reduce the physical quality of the water. When the catchment areas are treated with chemicals like herbicides and pesticides or even with chemical fertilizers before rainfall events, the harvested water is likely to get contaminated and pose a threat to the crops.
29.4.2 Long-slope Water Harvesting
Runoff water from long slopes is used to provide additional water to trees, bushes and annual crops on the cropped area. In most cases, the water is conserved directly in the soil profile although it is sometimes stored in cisterns, ponds or reservoirs. This water may also be used for livestock requirement and other domestic purposes. The catchments are either left in a natural state or cleared of vegetation and stones. In latter case, there is a high risk of soil erosion and hence the probability of sediment transport to stream channels and into the
Farm Power
193 www.AgriMoon.Com
storage bodies is more. For small storage facilities, it may be possible to construct a sediment trap upstream of the reservoir. Most of the suspended sediments settle at the bottom of the trap and the clear surface water is directed towards the main storage facility. Part of the runoff water from the sediment trap may be lost due to evaporation but, in return entry of clean water increases the life of the storage structure. The best strategy for dealing with sediments is to prevent water and wind erosion. Provision of fencing or hedges around the ponds or reservoirs keeps animals and people away from direct contact of water. Sometimes direct drinking of water by animals from surface ponds contaminates the water.
29.4.3 Flood Water Harvesting
Flood water harvesting is commonly used to supply water to trees, bushes and annual crops. In a number of cases the water is stored in ponds and reservoirs. The water moves soil particles, which may carry nutrients as well as chemical pollutants. Sedimentation of distribution basins, canals and storage bodies is the consequent common problem because of large scale transportation of sediments with floodwater.
Deposition of sediments also changes the geometry of the section of ephemeral river beds. It reduces the channel cross section and also changes the hydraulic gradient. The effect is likely to spread along the upstream as well as the downstream of the section resulting in overflow at various sections along the bank during high flows. Banks may be eroded and the river bed may even change its course. During floods, large amount of sediment may be deposited on the floodplain, which may be beneficial in the long term but not desirable as far as the short term benefits are concerned. The more obvious problem produced by sediments is the loss of storage capacity of reservoirs. It is not uncommon for storage facilities to be completely filled with sediment within a few years of construction.
One efficient means to trap sediments is by constructing rock dikes across valleys to capture surface water. The sediments will settle and create a flat surface for growing crops, particularly trees with deep roots to reach the water stored in the trapped sediments. Stored water needs to be protected not only from evaporation and seepage loss but also from contamination. Contamination occurs mainly from human or other animal contact. Similarly stored water needs to be protected from disease vectors such as mosquitoes, files and mollusks.
29.5 Impacts on Downstream Ecosystems and Biodiversity
Usually aquatic flora and fauna develop in concert with existing water regimes. Implementing a water harvesting system alters the flow regime, which may cause some species to become stressed and die out. Other species that prefer the new flow regime will then colonize the riverbed and flood plain. These changes may be considered either desirable or undesirable based on their impact on the ecosystem. In most locations not only the aquatic species are adapted to the flow regime, but also the lifestyle of other species including humans is observed to be gradually fitting into the changing flow regime. In recent years it has been realized that many of the changes produced by significant modification flow regimes are undesirable. Downstream degradation of the aquatic flora and fauna produced by cutting off all flows will eventually be drastic and irreversible. Policies are being
Farm Power
194 www.AgriMoon.Com
formulated to reduce the changes in the flow regimes such that the general environment downstream will not be drastically modified.
In most of the situations, the aquatic environments are not sufficiently understood for developing appropriate guidelines. Post-development flows are being set at about 25% of the pre-development situation with similar variability, but this is an arbitrary figure which has no scientific basis. Presumably it will be adequate to support some species, while others will disappear. Environmental flows, the flows needed to sustain the naturally occurring species, are difficult to define and are currently the subject of scientific and political debates. For many streams, maintenance of the flows necessary to support the natural systems means virtually no development. In other regimes particularly in semi-arid and arid regions, very little is known about possible effects of developing the very limited water resources. These effects may not be immediately apparent, but in the long run they will be noticed, and by then it would probably be impossible to reverse the effects even if there is a desire to do so.
However, water harvesting projects can also contribute to higher levels of biodiversity through demarcation of small areas at various locations (each of about 100 m2) for the development and multiplication of natural flora by erecting fence around, prohibiting animal grazing and supplying harvested water.
29.5.1 Water-borne Diseases
Any form of water resources development through water harvesting intervention causes changes in natural conditions. Many of these changes offer opportunities for multiplication of disease vectors with devastating effects.
In regions where malaria, dengue fever or similar insect-transmitted diseases are endemic, storage of water on the surface needs to be accompanied by precautionary measures to prevent the water becoming a breeding site for these disease vectors. Where schistosomiasis is prevalent, measures must be taken to control the snail that is the intermediate host of the parasite.
It is important that planners, decision-makers and financiers take health issues into consideration when planning for any water resource development project. This will often require changes to the scheme and may raise the cost of the project. But with innovative ideas, the changes and the extra costs should not be very large. Examples are to be taken from other irrigation projects in regions where river blindness and schistosomiasis are endemic.
29.5.2Thermal Stratification
Thermal stratification refers to temperature differences in the water at various depths particularly in ponds or large lakes of depth greater than 2 m. Energy from solar radiation heats the surface layers and the heat is transferred to the lower layers by mixing with water and wind effects. However, warm water is lighter than cool water and wind induced circulation cannot mix them with deeper layers of cool water. This causes thermal stratification. The layer relatively warm surface water is known as the epilimnion, and the bottom layer of cooler water is known as the hypolimnion. The temperature changes rapidly
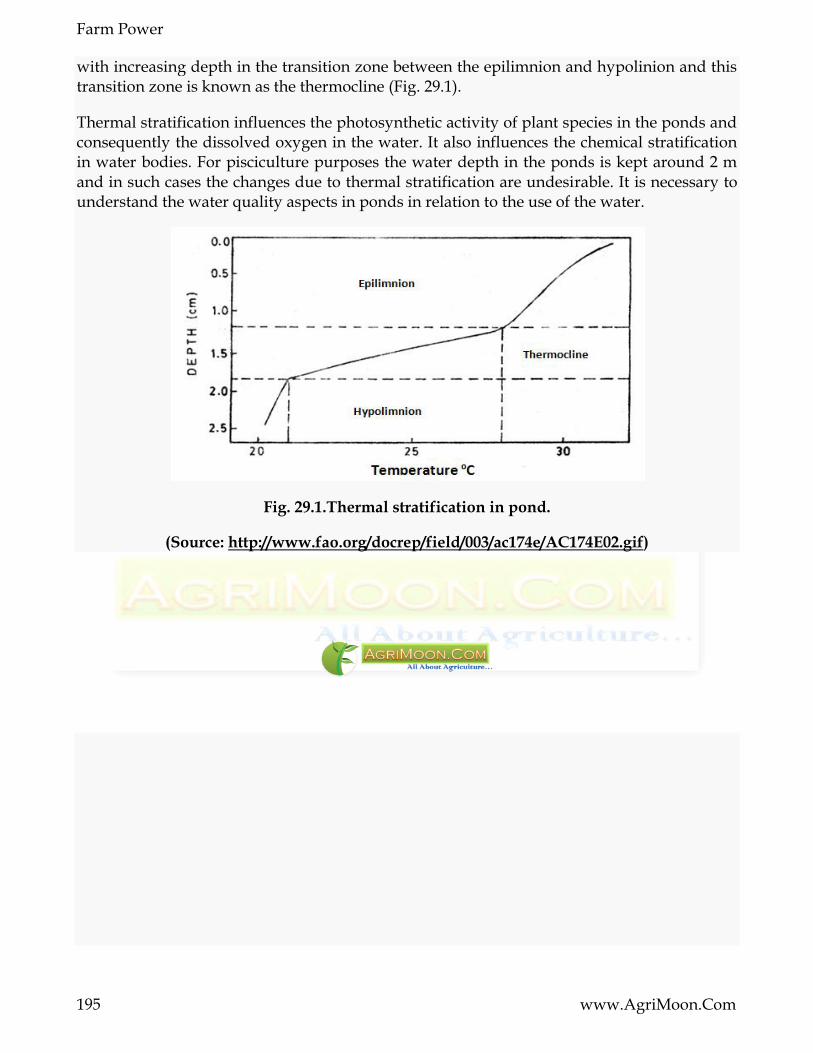
Farm Power
195 www.AgriMoon.Com
with increasing depth in the transition zone between the epilimnion and hypolinion and this transition zone is known as the thermocline (Fig. 29.1).
Thermal stratification influences the photosynthetic activity of plant species in the ponds and consequently the dissolved oxygen in the water. It also influences the chemical stratification in water bodies. For pisciculture purposes the water depth in the ponds is kept around 2 m and in such cases the changes due to thermal stratification are undesirable. It is necessary to understand the water quality aspects in ponds in relation to the use of the water.
Fig. 29.1.Thermal stratification in pond.
(Source: http://www.fao.org/docrep/field/003/ac174e/AC174E02.gif)
Farm Power
196 www.AgriMoon.Com
Lesson 30 Method to Reduce Seepage and Evaporation Losses
30.1 Introduction
The water harvested in the reservoir and farm ponds is a very scarce resource. All care should be taken to prevent any kind of loss of this harvested water. Two major forms of losses of this water are (i) evaporation losses and (ii) seepage losses. Estimate of evaporation across the country indicates that it is as high as 2000 mm per annum in the semi-arid tropics. Annual average value of the evaporation loss varies from 1400 to 1800 mm across major parts of the country; the value being highest in west Rajasthan, parts of Saurasthtra and Tamilnadu and lowest in coastal Mysore, Bihar plateau and eastern Madhya Pradesh. Reliable statistics reveals that about 70 M ha m of water, out of the total annual precipitation of 400 M ha m, evaporates from the water bodies and land surfaces of the country.
In this section, the methods to estimate the losses like seepage and evaporation and various measures to control them are discussed.
30.2 Evaporation Losses in Farm Pond
Evaporation is the process by which water is converted from its liquid form to its vapor form and thus transferred from land and water masses to the atmosphere. It is a natural process and occurs when solar radiation falls on a water body. The solar energy thus transmitted is acquired by water molecules which in turn gets separated and move upward causing evaporation. In the hydrologic cycle, evaporation plays a vital role in causing precipitation. Thus, in one hand it is required for precipitation which in turn builds up the water resources and on the other hand it causes huge losses of the scarce harvested water from farm ponds and other reservoirs. Evaporation loss from the small and shallow ponds/reservoirs is higher than the large and deep reservoirs. Sometimes it may be as high as 50% of the capacity of the reservoir. Ambient temperature, relative humidity and wind velocity are the factors other than the cross sectional geometry of the water harvesting structures responsible for enhancing the rate of evaporation. Hence, it is higher in summer months during March and June; and lower in winter months during October and February. Again, it is more pronounced in arid climate than a humid climate. As the cost involvement is higher in construction of the storage structures, it becomes essential to minimize such losses from water bodies.
30.3 Estimation of Evaporation
Various methods are used to estimate the rate of evaporation. Some of them are discussed below.
30.3.1 Analytical Method
Analytical methods to estimate the rate of evaporation are divided into two types. They are (i) water budget method and (ii) mass transfer method.

Farm Power
197 www.AgriMoon.Com
Water Budget Method
Water budget method is based on water balance approach in which various inflows and outflows to and from the farm pond are considered. The equation used to evaluate evaporation is:
Where, E = evaporation, Si and Sf= Initial and final storage in the farm pond respectively; R = Rainfall; SR =Runoff/surface inflow; Is= supplemental irrigation/surface outflow; and U = Underground inflow or outflow into or from the reservoir. The various terms used in above equation are expressed in terms of depth unit, generally in cm.
Surface run off generated from the crop field/catchment at the upstream is directed into the pond. So, it increases during rainfall events and decreases during irrigation intervals.
Mass Transfer Method
Mass transfer is the net movement of mass from one point, here the pond surface, to another, the atmosphere. Mass transfer occurs in many processes, such as absorption, evaporation, adsorption, drying, precipitation etc. The phrase is commonly used in engineering for physical processes that involve diffusive and convective transport of chemical species within physical systems.
In this method, the rate of evaporation is computed as:
where, K= von Karman constant 0.41;= density of air, g/cc; q2 and q1 are specific humidity at heights Z2 and Z1, respectively that are taken as 2 m and 1m, respectively above the water surface; and u2 and u1 are wind speeds, cm/s at heights Z2 and Z1, respectively.
30.3.2 Empirical Method
There are several empirical methods developed for computing evaporation loss. Most of these methods take into account the evaporation loss of the farm pond which in turn depends on temperature of air water interface, wind velocity, relative humidity and saturated vapour pressure of air.
30.3.3 Energy Budget Method
In this method, the rate of evaporation is computed as:
Farm Power
198 www.AgriMoon.Com
Where, R = H+ LE +G is given as:
where, R = net radiation flux received at the surface, cal/cm2; H= sensible heat flux, cal/cm2; LE= latent heat flux (L= Latent heat of vapourisation, cal/g and E as defined above); G= heat flux in the soil or water, cal/cm2; = Bowen ratio; Ts= temperature of water surface(C); T= air temperature (C); es= saturation vapour pressure at Ts, hectopascal (hpa); e= vapour pressure of air at T, hpa; and P= station level pressure, hpa.
Based on Penman‟s equation (1948), the Kohler-Nordenson-Fox equation describes evaporation from water bodies as the combination of water loss due to radiation heat energy and the aerodynamic removal of water vapor from a saturated surface.
The general form of the combination equation is described as:
Where, Δ= slope of the saturation vapour pressure curve at air temperature in inches of mercury per oF;=psychrometric constant in inches of mercury per oF; Rn=net radiation exchange, equivalent inches of water evaporated; and Ea= an empirically derived bulk transfer term. Ea is expressed as:
Where, f (u) = wind function; and (es-ed) = vapour pressure deficit.
It indicates that the evaporative water loss from water body can be minimized by means of obstructing the radiation heat energy coming on to the water surface and further reduction can be achieved by reducing the vapour pressure deficit or the wind speed in the microclimate.
30.3.4 Pan Evaporation Method
In this method, the rate of evaporation is measured by a pan evaporimeter. The ratio of evaporation loss measured by the evaporimeter to evaporation loss from reservoir on annual basis is constant and hardly varies from region to region. However, on short term basis, the ratio depends on a number of factors like heat storage of the evaporimeter or pan, its size and colour and above all, the depth of water in it. The evaporation loss from a pan is observed to be greater than that of the reservoir. As the size of the pan increases, the difference of the evaporation loss between the pan and the reservoir decreases. The rate of the evaporation in general, is observed to be more for deep buried pan with higher depth of water than shallow pans with less depth of water. Similarly, the evaporation from dark pans is greater than that from unpainted galvanized pans. The white coloured pan shows the least evaporation rate

Farm Power
199 www.AgriMoon.Com
among other coloured pans. Covering the pan with a screen helps to reduce the pan evaporation to the equivalent of that from a reservoir. The screen helps to maintain the pan temperature uniform throughout day and night and reduces turbulence at the water surface so as to maintain uniform rate of evaporation.
30.4 Selection of Site for Evaporimeter
While selecting the site for evaporimeter near the farm pond, the following points must be taken into consideration:
It should be very near to the reservoir
It must be placed on a level ground
There should not be any obstruction like trees, plants, buildings or walls nearby the pan. The distance between the pan and the nearby obstruction should not be less than 10 times the height of the obstruction.
The pan should not get submerged due to heavy rain or flood
It should be located at the windward side of the reservoir
It is better if the highest ground water level near the pan is below 2 m depth from the ground surface
The site of evaporimeter should be easily accessible
30.5 Types of Evaporimeters
Evaporation pan is a simple instrument used for measuring the amount of water lost by evaporation per unit surface area in a given time interval. The commonly used evaporation pans are discussed below.
a. B.I.S Class A Pan (modified)
Class A pan evaporimeter is standardized by Bureau of Indian Standards (B.I.S) for use in India. It consists of a large cylindrical pan of 1220 mm diameter and 255 mm deep. The material of the pan is made of 1 mm thick copper sheet tinned inside and painted white outside. It has a fixed point gauge for measurement of water level. It is covered with a wire mesh. The pan sits on a white painted square wooden platform of width 1225 mm and height 100 mm above the ground level. A stilling well is provided near the fixed point gauge for providing undisturbed water surface. A thermometer is fixed to the side of the pan to measure surface temperature of water. The pointer of the gauging instrument is fixed at the highest level of water to be maintained in the pan. This is known as the reference level of water in the pan. A graduated cylinder is used to measure the volume of water to be added to the pan that is lost by evaporation in a given time so that the water level reaches the reference level. Dividing the volume of water so added with the pan surface area gives depth of evaporation loss from the pan. In case of any rainfall during two consecutive readings, two
Farm Power
200 www.AgriMoon.Com
conditions may arise. The final level of water before taking the reading may be above or below the reference level. When it is above the reference level, water is removed from the pan to get back to the reference level. Depth of evaporation loss is determined by subtracting the depth of water removed from the depth of rainfall. On the contrary, when the water level is below the reference level, water is added into the pan to get back to the reference level. In this case the depth of evaporation loss is determined by adding the depth of water added to the depth of rainfall during the period. Dividing the depth of evaporation loss with the time period during which evaporation measurement is taken, evaporation rate is obtained. However, in order to obtain the evaporation loss from the free water surface of the pond or reservoir, a coefficient is used with the observed pan evaporation as presented in Table 30.1.
Table 30.1 Value of Coefficient for Various Pan Evaporation Rates (Source: Panigrahi, 2011)
Average evaporation rate of the pond/reservoir (mm/d) Value of coefficient
< 5 0.9 – 1.10
5 - 10 0.80
>10 0.65– 0.75
b. U.S. Weather Bureau Class A Land Pan
It is a circular pan made of galvanized iron or monel metal. It is 1210 mm in diameter and 255 mm in depth. The pan sits over a wooden open platform 150 mm height above the ground. The platform allows free wind circulation below the pan. A hook gauge is used to measure the evaporation loss of water from the pan. A coefficient of 0.70 is used to convert the pan evaporation to the pond evaporation.
c. Colorado Sunken Pan
It looks like top open cubical container made of an unpainted galvanized iron of 914 mm square and 457 mm deep. The pan is sunk in the ground till the rim remains 51 mm above the ground surface. The reference water level in the pan is maintained at or slightly below the ground level. A hook gauge is used to measure the depth of water lost as evaporation from the pan. The measurement can also be made with the help of fixed point gauge. The hook can read up to 0.02 mm. A coefficient of 0.78 is used to convert the pan evaporation to pond evaporation.
d. U.S. Geological Survey Floating Pan
Floating pan is developed to simulate the conditions similar to that of the surrounding water in a reservoir. The pan is of cubical shape and made of galvanized iron of 900 mm square and 450 mm deep. It is supported by drum floats in the middle of a raft of size 4.25m x 4.87m and set afloat in a lake with a view to simulate the characteristics of a large body of water body. The water level in the pan and that in the surrounding reservoir is kept at the same level
Farm Power
201 www.AgriMoon.Com
leaving a rim of 75 mm. Diagonal baffles are provided in the pan to reduce surging in the pan due to wave action. Wherever this pan is used, one U.S. Class A Land Pan is also installed near the floating pan to supplement the data during the missing period. The floating pan is less accessible for taking readings. Sometimes wind affects the accuracy in measurement since the waves formed by wind causes splashing of water. A coefficient of 0.80 is used to convert the pan evaporation to pond evaporation.
e. U.S. Weather Bureau Class A Floating Pan
It is a land pan but does not sit over a wooden open support. The water level inside the pan is maintained at 75 mm below the rim of the pan. Care is taken to maintain same level of water both inside and outside of the pan. A fixed index point is marked in the center of the pan. The quantity of water added to the pan to bring the water level reading up to this fixed index point gives the amount of water lost as evaporation from the pan.
30.6Reduction of Evaporation Loss from Pond
It is observed that the evaporation loss during summer months of May and June is 2-5 times more than that during winter months of December and January. Depending on location and prevailing climatic conditions, while the annual evaporation loss is maximum (300 cm) in Rajasthan, it is minimum (50 cm) in Jammu and Kashmir. Moreover, for the Indian subcontinent, annual evaporation loss from the reservoir ranges from 150-250 cm.
Evaporation is a surface phenomenon and hence, the first step to reduce evaporation loss can be achieved by reducing the surface area of the pond or the reservoir. For example, a pond with greater depth of stored water and lesser surface area would evaporate less as compared to a shallow pond with large surface area subject to both the ponds having same volume of stored water.
30.6.1 Vegetative Shade
An attempt to develop shade on the water surface by growing vegetation over the open surface of the water body is called vegetative shading. In this practice, the open surface of the pond is covered with canopy of creepers like bottle gourd (lagenaria siceraria), pumpkin, bitter gourd and cucumber etc. such that the surface water is shaded and prevented from the direct contact of sun light. The creepers are planted on the embankment and allowed to creep towards the center of the pond on a wooden platform laid across the pond. The platform is made of hardy plants like bamboo tied in a criss-cross manner. When the canopy growth covers the entire open surface of the pond, a shade is formed over the water surface and the sunlight coming onto the water is reflected back due to the albedo effect of the green leaves. Thus, the driving force for causing evaporation i.e. solar radiation is deflected and evaporation loss is reduced. This method of growing creepers on platform over the open surface of the pond is better than the attempt of reducing evaporation loss by growing floating aquatic plants as in case of latter the plants consume a lot of water from the pond to meet their transpiration requirements.

Farm Power
202 www.AgriMoon.Com
30.6.2 Monomolecular Film
It is a film of one molecule thick also called as monolayer. Chemicals either in the form of powder or solution is spread over the water surface which deflects the energy input of the sun as a result of which evaporation is reduced. Alcohols such as cetyl alcohol [CH3 (CH2)15OH] also called as hexadecanol and stearyl alcohol (octodecanol) are used to form a monomolecular film on contact with water which is sufficiently enduring in field conditions. The invisible film is non-toxic in nature and reduces evaporation by 50-60% at an average wind speed of 16.55 km/hr. The advantage of this film is that it is not opaque and so, does not restrict the path for movement of rainwater, oxygen and sun light through the water surface. However, the limitation of these monomolecular films is that they get diluted in water quickly and then become ineffective to reduce the evaporation of water.
30.6.3 Wind Breaks
Increased turbulence on the water surface is one of the factors to accelerate evaporation loss from the water body. Wind action is solely responsible for such turbulence on water surface. Hence, continuous wind or wind at high speed over the pond or reservoir is likely to increase the evaporation loss. In such cases, developing wind breaks, a physical barrier to oppose the wind blow, by growing tall trees at close spacing around farm pond is expected to minimize the turbulence effect and reduce the evaporation loss. But these wind breaks are useful only for small ponds. It is found out that a reduction of wind velocity by 25% can reduce the pond evaporation loss by only 5%. It indicates that the measure is not very much effective in reduction of evaporation loss.
30.6.4 Covering Pond Water with Shading Materials
Like vegetative shading, many other artificial materials or sheets can be used as effective barriers to prevent the direct sun light coming onto the water surface and thereby, reduce the evaporation loss. Such shading materials may be plastic films, thatches, paddy straw, sugarcane trash etc. When they are used to cover the water surface, the sun light cannot penetrate through and consequently, the evaporation loss is reduced. However, the effectiveness of the shading material in reducing evaporation from the pond depends on its quality and the percentage cover of the open surface area of the pond. Evaporation loss is likely to come down to minimum under complete coverage (100%) of the open surface and thus, partial coverage would have reduced effect on evaporation rate of the pond.
Some other shading materials used for reduction of evaporation loss are dye mixed with pond water, plastic mesh and sheet, polystyrene beads and sheet, white spheres and white butyl sheet etc. Out of these materials, polystyrene raft, plastic sheet and foamed butyl rubber are the best ones since they are reported to reduce the evaporation loss by more than 90%. However, these materials are very expensive and unlikely to make the project cost effective. Therefore, these materials are not applied for reducing evaporation loss from on-farm ponds instead they are used in drinking water projects to reduce evaporation loss.
Farm Power
203 www.AgriMoon.Com
30.7Seepage Losses in Farm Pond
Harvested water in on-farm ponds in water scarce areas is a precious commodity and care should be taken to conserve it for a longer period with minimum loss. Two major means of the loss of harvested water from such ponds are evaporation and seepage. Most of the ponds used for irrigation purpose are unlined and without any measure to reduce evaporation loss. However, the loss due to seepage is more pronounced than that due to evaporation. A study reveals that seepage loss in unlined ponds accounts for about 45% of the total storage and the evaporation loss accounts for only 25% (Guerra et al., 1990). This loss is significant when the pond is underlain by porous strata or when the bed material of the pond consists of coarse textured soil. Small farm ponds constructed in coarse texture soils; especially in arid and semi-arid regions are found to get dry completely just after the withdrawal of monsoon. However ponds constructed in heavy soils are found to have less seepage losses. In general the seepage loss in unlined small farm ponds depends upon the water table position below the ground surface, soil type at the site of excavation and hydraulic gradient available between the pond water level and water level of adjacent areas. It is observed that the seepage loss in newly constructed pond is very high and it decreases gradually with progress of time as silt deposition takes place in the pond.
30.8 Methods to Reduce Seepage Losses
Seepage loss from farm ponds can be reduced broadly by two ways. They are (i) reducing wetted surface area of the pond and (ii) using a cost effective sealant.
30.8.1 Reducing Wetted Surface Area of Pond
Seepage from the pond increases with increase in wetted area of a pond. Hence, special considerations must be given to minimize the wetted area per unit of storage capacity during design of the pond. This may be achieved by making the side slopes steep and/or decreasing the depth of the pond. In case of large ponds, division of the pond into two or more compartments also helps in reduction of seepage loss. By doing so the wetted area and top water surface area of the pond are considerably reduced resulting in reduction of seepage and evaporation loss, respectively, to a great extent.
30.8.2 Use of Sealants
A newly constructed pond has self-sealing property by deposition of silt. The runoff of the catchment carries some silt and clay which gets deposited in the side and bottom of the pond and clogs the pore spaces of the soil. Consequently, the flow through the side and bottom of the pond is reduced and seepage loss is checked. Studies conducted at Dehradun and Rajkot of India reveal that seepage from a newly dug out pond reduced to a very low rate due to silting in a period of 8 years. Silting also reduces seepage rate in brick lined pond.
A simple way to reduce water seepage, particularly if the pond bottom is very dry, hard and has open cracks in it, is to break the soil structure of the pond bottom before filling the pond with water. This is common practice is called puddling. It is accomplished through making the pond bottom saturated with water, allowing the water to be soaked into soil just enough to permit working and then, breaking the soil structure by puddling with a plough.
Farm Power
204 www.AgriMoon.Com
A number of sealants/lining materials are now available to reduce the seepage loss. Lining of the pond, though costly, can reduce the seepage loss and improve the effective storage of the pond. Different lining materials used to reduce the seepage loss are plastic film, soil cement lining, bitumen lining, clay lining, cow dung lining, brick cement lining etc. Lining with brick masonry or cement mortar lining is most expensive but effective among them. Lining for reduction of seepage losses is feasible only for small pond. Descriptions of a few lining materials used for seepage control in the pond are given below.
1. Clay Lining
Natural clay can be used for lining with varying degree of efficiency, especially when lower cost is desirable. Clay lining can be applied in two methods:(i)by placing a blanket of relatively impervious clay of 15-30 cm thick over or within the permeable bed and slides of the pond and(ii)by dispersing clay in the water to form clay mud and filter it out to seal off the pores in the permeable sides and bottom of the pond. Alkali soils having poor infiltration rates, if available in the vicinity of the pond can be preferred for lining to control seepage in farm ponds. Burnt clay tiles can also be used as lining material for reducing seepage loss. Percentage of saving of water due to seepage by these tiles is about 98.8% more than the earthen materials. Studies reveal that a lining of soil cement plaster at ratio 5:1 is ideal from the points of cost and efficiency. For good results, the mixture of soil and cement should be mixed well, laid out and compacted. It should be cured for seven days with moist soil cover. The limitation of this lining material is that,
it is not weather resistant
its life is comparatively short and
repair and maintenance cost is relatively higher.
2. Cement Concrete Lining
Cement concrete lining to reduce seepage loss is stronger and more stable than any other lining material. Though the initial investment for such lining is more, its repair and maintenance cost is very less and it gives long service. Concrete mixture usually recommended for lining is 1:3:4 (cement: sand: gravel) with 4–5 cm thickness. The sides and bottom of the structure should be compacted at suitable moisture content. When concrete hardens, it shrinks resulting in development of cracks. Apart from adequate curing, joints must be provided at a distance of 2 m in order to localize and control the cracks. Cement concrete lining can withstand higher velocity of flow (>2.5 m/sec) because of its greater resistance to erosion and is therefore preferred to any other type of lining.
3. Asphalt Lining
Asphalt also known as bitumen is sticky, black in colour and highly viscous liquid or semi-solid form of petroleum. It acts as a binding material in road construction. When it is mixed with sand and gravel, it forms asphalt concrete and this is used as a lining material in ponds. Asphalt concrete lining is cheaper than cement concrete lining. Its life span ranges from 10-20 years. There are two types of prefabricated asphalt melts found to be promising in seepage control. They are (i) Gunny (coarse sack cloth made of jute) reinforced asphalt melt and (ii)

Farm Power
205 www.AgriMoon.Com
Synthetic cloth reinforced asphalt melt. Between the two, the former has proved to be a better lining material in terms of reducing seepage loss from ponds.
4. Brick Lining
In brick lining, the bricks are joined together with soil cement plaster. It requires relatively less investment as compared to cement concrete ling. Brick lining is easier to construct and requires less technical knowledge. It requires less cement as compared to concrete lining and can be laid out without use of any machinery. However, it is not that effective in seepage control as compared to cement concrete lining.
5. Bentonite Lining
Bentonite is fine textured colloidal clay with as much as 90 per cent of montmorillonite. There are two types of bentonite; high swelling and low swelling. While sodium is the main constituent in high swelling bentonite, calcium makes it for low swelling one. When exposed to water, dried bentonite absorbs several times its own weight of water; at complete saturation, it swells as much as eight to twenty times its original dry volume. The dry bentonite is mixed with the top 15 cm soil layer thoroughly at a rate of 5 – 15 kg/m2. The advantages of bentonite lining are its low cost, easy installation procedure and long lasting solution to excessive seepage. Main disadvantages of this lining are listed below:
it is more laborious to apply than a butyl membrane
it can be disrupted by cattle or eroded by running water
burrowing animals such as crayfish or crabs can make rupture in such lining
bentonite treatment is not advisable in highly alkaline soils
6. Alkali Soil Lining
Application of alkali soil lining in small ponds is observed to be an effective lining material to reduce seepage loss. In this practice, a layer of alkali soil of about 5 cm thickness is spread on the sides and bottom of the pond for effective seepage control.
7. Soil Deflocculants
A deflocculant is a chemical additive to prevent a colloid from coming out of suspension. It is used to reduce viscosity or prevent flocculation and is sometimes called a dispersant. Soil deflocculants like sodium carbonate, sodium chloride, and tetrasodium polyphosphate and sodium tripolyphosphate are used for reducing permeability of pond surfaces. Sodium chloride and sodium polyphosphate perform effectively up to 6 and 8 months, respectively.
8. Gleization
When the pond bottom is too permeable, it is required to create an impervious biological plastic layer in the bottom and on the sides of the pond in order to reduce seepage loss. Such an impervious layer is called a gley, and the process of its formation is called gleization. Step by step procedure of gleization is as follows:
Farm Power
206 www.AgriMoon.Com
The pond bottom is prepared by clearing it of all vegetation, sticks, stones, rocks and filling all cracks, crevices and holes with well-compacted impervious soil.
Cleaned surface is completely covered with moist animal manure spread in an even layer about 10 cm thick.
The manure is covered completely with a layer of vegetal material, preferably broad leaves of banana. Dried grass, rice straw, soaked cardboard or paper, etc. can be used for this purpose.
A layer of soil about 10 cm thick is placed over the vegetal cover.
All the materials are moistened and compacted properly.
Fill up the pond with water slowly.
9. Chemical Sealants
U.S Bureau of Reclamation studied many chemicals including resins, silicones, linings but none was found suitable in seepage control. Even cationic asphalt emulsion, petroleum emulsion and resinous polymers were tested and found to be short lived and affected by wetting, drying and erosion.
10. Polythene Lining
Currently, low-density polyethylene (LDPE) sheets, cross laminated plastic tarpaulins of various thicknesses are widely used as lining materials in ponds to reduce seepage loss. Careful placing and burying of the polyethylene sheet under at least 15 cm thick soil layer gives full proof sealing and long expected life. LDPE lining is a cheap and effective measure for reducing seepage loss from unlined water harvesting structures. All India Coordinated Research Project for Dryland Agriculture, Hyderabad, India reported that 91% of seepage loss can be controlled by lining the tanks with LDPE sheets under brick load on the steps (Vijayalakshmi et al., 1982). Another study reveals that with 600 gauge LDPE sheet covered by 20 cm thick soil layer on sides and bottom the seepage loss reduced to 7 L m-2 day-1 (Gajriet al. 1983). Combination of LDPE sheet (800 gauge thickness) at the bottom and 75 mm thick brick cement lining on the sides of the pond can reduce the seepage loss from 520 to 12.71 L m-2 day-1 (Verma and Sarma, 1990).
However, it is important to note that before using any lining materials for seepage control in the pond, the economic analysis relating to the life of the pond and cost of lining materials must be taken into account. At the same time, the amount of irrigation water saved by reduction of seepage loss and use of the same in increasing the crop production and other associated benefits must also be considered to assess the economic feasibility of the technology.

Farm Power
207 www.AgriMoon.Com
Lesson 31 Runoff Inducement Methods
31.1 Introduction
The term water harvesting is used to describe the process by which water is collected from an area, that may have been modified or treated to increase surface runoff, and stored for use later. This chapter describes some of the methods and materials used to induce runoff in agricultural systems. Some general ideas and concepts are presented on runoff inducement techniques (such as surface modification, cover sheets, and soil surface treatment) that are feasible for use in arid and semi-arid regions of the world. The advantages and disadvantages, cost, and conditions favouring each method are also discussed.
31.2 Methods for Improving Runoff
The success of a water harvesting system depends mainly on the runoff efficiency of a catchment which can be defined as the runoff produced per unit rainfall on a given piece of land. The runoff efficiency of a runoff inducement method depends on land factors like vegetal cover interception, depression storage on land, infiltration rate of soil, antecedent soil moisture and precipitation factors like threshold quantity of rainfall, its intensity, amount and duration. Since manipulation of rainfall is a very difficult process, most runoff inducement methods are different ways and means of manipulating and modifying the land surface. Often the catchment area needs to be modified to increase surface runoff. Some of the methods followed in regard to increase the catchment runoff are through:
Modification of the topography or soil surface
Modification of the soil
Covering the surface with an impermeable layer
There is not a single technique or method that is best in all situations. The best techniques to use for the purpose are chosen depending on topography, soil condition, storage devices, labour, availability of treating/covering materials, and intended use of the water harvested. The cost of alternative water sources and the importance of water supply determine whether the costs involved are justified?
The total cost for preparing a catchment area includes two main items such as the cost of materials and the cost of labour. Some materials and installation techniques are labor-intensive but have relatively low capital costs. This type of techniques may be suitable for areas where labour is cheap. Other approaches may have high capital cost but require a minimum of labour, e.g. mechanized compaction. Such techniques may be appropriate in areas where labour cost is very high. Usually the water harvesting systems used in runoff farming are constructed from materials that are cheap, locally available, and handled easily.

Farm Power
208 www.AgriMoon.Com
31.2.1 Creating Shallow Channels
In long-slope water harvesting systems the yield of runoff water can be increased substantially by creating shallow channels within the catchment area. Depending on local conditions, the work involved can be done manually or by heavy machinery. Special care is needed to avoid soil erosion within those channels. The construction of small bunds perpendicular to the direction of flow slows down the running water, promotes sedimentation and reduces the erosion risk.
31.2.2 Clearing the Catchment
Clearing rocks and vegetation from the catchment area usually reduces infiltration rate and increases runoff. When the vegetation is removed the fine soil particles that are detached due to raindrop impact help seal the surface which results in reduced infiltration and increased runoff. Only some of the gravels, stones and vegetation need be cleared, with little modification to the topography or surface structure. Clearing the catchment in this way can be a very economical way of harvesting rainwater in arid lands if erosion is limited and low-cost hillside land is available. However if erosion is severe, soil conservation measures have to be selected that do not significantly reduce runoff water yield.
31.2.3 Smoothing the Soil Surface
The soil surface may be smoothed by removing small obstructions such as ridges and furrows across the slope of the land. In this method small amount of topographic modification is required. However, the labour requirement and use of machinery for the purpose of smoothing depend on the topography and soil conditions. Adoption of the method of smoothing the soil surface alone is not that efficient for runoff generation. Rather runoff efficiency improves by laying out a system of ditches and ridges in a fish-bone pattern on suitable slopes. These treatments are effective on suitable soil types with appropriate topography.
31.2.4 Compacting the Soil Surface
Compaction of the soil surface of the catchment reduces infiltration rate and increases runoff. The slopes are graded and compacted manually or mechanically. For manual compaction, a hand hammer may be used; mechanical compaction requires a tractor and rubber-tired roller or other compacting machinery, depending on field conditions and the area to be compacted.
Compacting and smoothing methods have been used successfully in roaded catchments in Western Australia. A roaded catchment is a water-harvesting structure designed to increase the amount of run-off from the catchment above a dam (Fig. 31.1). The „roads‟ of a roaded catchment are parallel ridges of earth with batters or side slopes that cause run-off to be directed into troughs or channels. The surface is lined with clay and compacted to make it smooth and impervious to reduce infiltration and increase run-off. In this area, an average annual rainfall of 500 mm is received during seven winter months. The surface layers of the soil are sandy, while the subsoil is clayey. The sand is moved into rows, exposing the clay. This is then shaped and spread to cover the whole surface. The ridges discharge induced runoff water into a channel which conducts it to a tank. The major advantage of this method
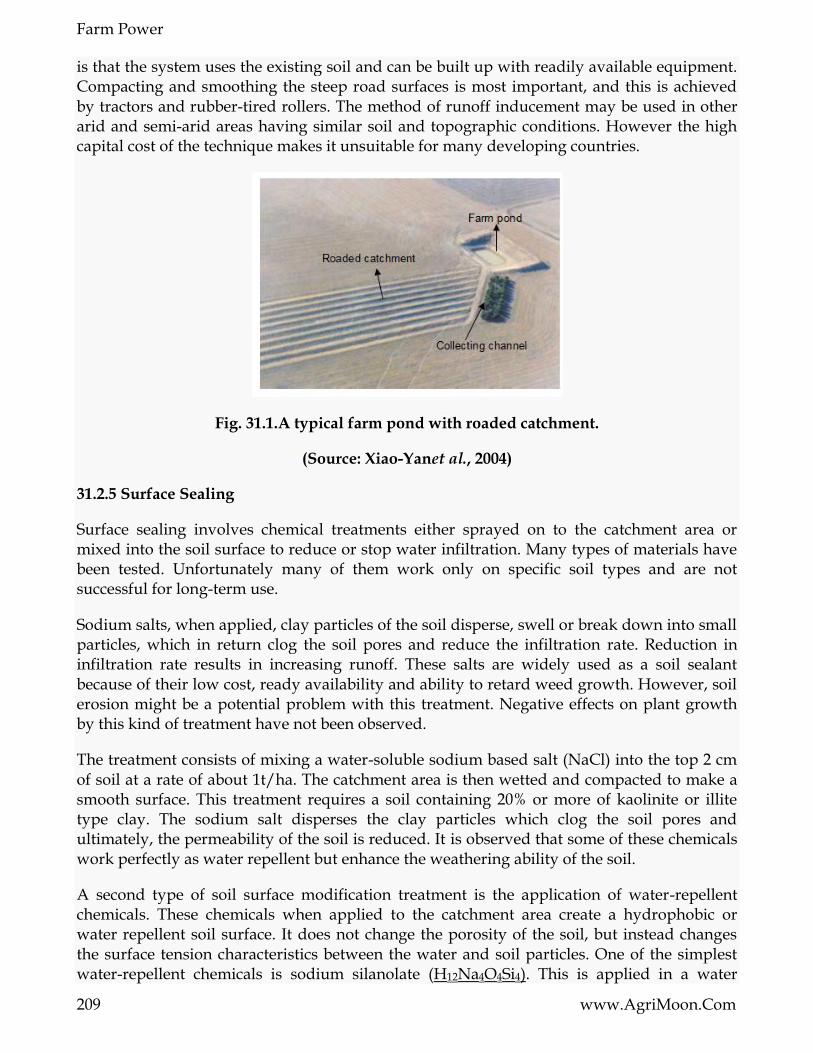
Farm Power
209 www.AgriMoon.Com
is that the system uses the existing soil and can be built up with readily available equipment. Compacting and smoothing the steep road surfaces is most important, and this is achieved by tractors and rubber-tired rollers. The method of runoff inducement may be used in other arid and semi-arid areas having similar soil and topographic conditions. However the high capital cost of the technique makes it unsuitable for many developing countries.
Fig. 31.1.A typical farm pond with roaded catchment.
(Source: Xiao-Yanet al., 2004)
31.2.5 Surface Sealing
Surface sealing involves chemical treatments either sprayed on to the catchment area or mixed into the soil surface to reduce or stop water infiltration. Many types of materials have been tested. Unfortunately many of them work only on specific soil types and are not successful for long-term use.
Sodium salts, when applied, clay particles of the soil disperse, swell or break down into small particles, which in return clog the soil pores and reduce the infiltration rate. Reduction in infiltration rate results in increasing runoff. These salts are widely used as a soil sealant because of their low cost, ready availability and ability to retard weed growth. However, soil erosion might be a potential problem with this treatment. Negative effects on plant growth by this kind of treatment have not been observed.
The treatment consists of mixing a water-soluble sodium based salt (NaCl) into the top 2 cm of soil at a rate of about 1t/ha. The catchment area is then wetted and compacted to make a smooth surface. This treatment requires a soil containing 20% or more of kaolinite or illite type clay. The sodium salt disperses the clay particles which clog the soil pores and ultimately, the permeability of the soil is reduced. It is observed that some of these chemicals work perfectly as water repellent but enhance the weathering ability of the soil.
A second type of soil surface modification treatment is the application of water-repellent chemicals. These chemicals when applied to the catchment area create a hydrophobic or water repellent soil surface. It does not change the porosity of the soil, but instead changes the surface tension characteristics between the water and soil particles. One of the simplest water-repellent chemicals is sodium silanolate (H12Na4O4Si4). This is applied in a water

Farm Power
210 www.AgriMoon.Com
solution and forms a water-repellent layer 1-2 cm deep with an effective life of 3-5 years. The treatment does not provide any soil stabilization; hence wind and water erosion can be a problem. It is not suitable for soils containing clay more than 15%.
Another water repellent treatment consists of spraying molten, refined, low melting point paraffin wax onto the prepared soil surface. The wax is initially deposited as a thin layer on the surface. As the sun heats the surface, the wax partially melts and moves deeper into the soil, coating each individual soil particle with a thin wax layer and rendering the soil water repellent. This treatment is best suited to soil containing clay less than 20% and on catchment sites where the soil temperature will exceed the melting point of the wax during part of the year. Wax-treated plots yield on an average 90% of the rainfall as runoff as compared to 30-40% from untreated plots. However the paraffin wax does not provide significant soil stabilization and the treatment is susceptible to water and wind erosion.
To overcome the difficulties of using paraffin wax in inducing runoff, the wax may be emulsified by using low-cost additives. The emulsified wax can be applied easily to catchment plots using a small sprayer. The use of the wax thus helps increase the amount of runoff from small plots.
31.2.6 Impermeable Coverings
Instead of making the soil itself the water-shedding surface, it may be better in some situations to cover it with a waterproof layer. Low and high density plastic films and other thin sheeting materials including butyl rubber, asphalt membranes, and highway surfaces have been investigated as potential soil coverings for water harvesting catchments. Bitumen or asphalt are best suited to fine sandy soils, but have an effective life of only 2-5 years. However, the thin film coverings are susceptible to damage by wind and/or sunlight. Partial covering of the ground with plastic sheets around trees also contributes to evaporation reduction and increase in rainwater collection.
One of the simpler techniques of utilizing low cost sheets of plastic or tar felting sheets used in roofing is to place a shallow layer of clean gravel on the sheet after it has been positioned on the catchment surface. The sheets of plastic or the tar paper provide the waterproof membrane and the gravel protects it from wind and sun. An efficient runoff producing catchment surface can also be made by covering asphalt with a better quality film of gravel layer on top. The asphalt layer helps binding the film of gravel to the catchment surface, while the film protects the asphalt from oxidation. This treatment requires periodic maintenance to ensure the sheeting remains covered with gravel. In such cases, the runoff is essentially 100% of all precipitations in excess of 2 mm. Such catchments, if carefully constructed and maintained, can last for 20 years. Windblown dust particles trapped in the gravel layer develops a potential seedbed for plants, which would otherwise negatively affect runoff efficiency. The treatment is relatively inexpensive subject to readily availability of clean gravel. Experiments conducted in the USA on the use of asphalt as catchment cover demonstrate the following:
Strong and durable catchments, for runoff inducement and water harvesting, can be constructed by spraying asphalt on the surface of loamy sand and sandy loam soils.
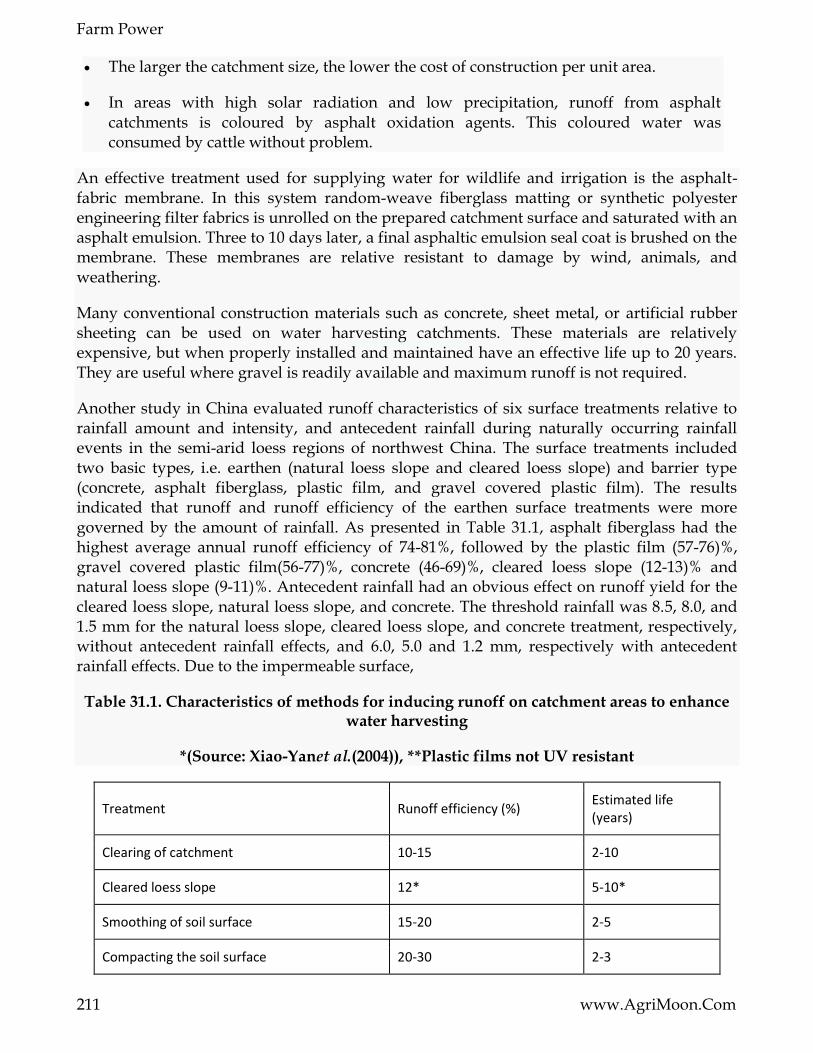
Farm Power
211 www.AgriMoon.Com
The larger the catchment size, the lower the cost of construction per unit area.
In areas with high solar radiation and low precipitation, runoff from asphalt catchments is coloured by asphalt oxidation agents. This coloured water was consumed by cattle without problem.
An effective treatment used for supplying water for wildlife and irrigation is the asphalt-fabric membrane. In this system random-weave fiberglass matting or synthetic polyester engineering filter fabrics is unrolled on the prepared catchment surface and saturated with an asphalt emulsion. Three to 10 days later, a final asphaltic emulsion seal coat is brushed on the membrane. These membranes are relative resistant to damage by wind, animals, and weathering.
Many conventional construction materials such as concrete, sheet metal, or artificial rubber sheeting can be used on water harvesting catchments. These materials are relatively expensive, but when properly installed and maintained have an effective life up to 20 years. They are useful where gravel is readily available and maximum runoff is not required.
Another study in China evaluated runoff characteristics of six surface treatments relative to rainfall amount and intensity, and antecedent rainfall during naturally occurring rainfall events in the semi-arid loess regions of northwest China. The surface treatments included two basic types, i.e. earthen (natural loess slope and cleared loess slope) and barrier type (concrete, asphalt fiberglass, plastic film, and gravel covered plastic film). The results indicated that runoff and runoff efficiency of the earthen surface treatments were more governed by the amount of rainfall. As presented in Table 31.1, asphalt fiberglass had the highest average annual runoff efficiency of 74-81%, followed by the plastic film (57-76)%, gravel covered plastic film(56-77)%, concrete (46-69)%, cleared loess slope (12-13)% and natural loess slope (9-11)%. Antecedent rainfall had an obvious effect on runoff yield for the cleared loess slope, natural loess slope, and concrete. The threshold rainfall was 8.5, 8.0, and 1.5 mm for the natural loess slope, cleared loess slope, and concrete treatment, respectively, without antecedent rainfall effects, and 6.0, 5.0 and 1.2 mm, respectively with antecedent rainfall effects. Due to the impermeable surface,
Table 31.1. Characteristics of methods for inducing runoff on catchment areas to enhance water harvesting
*(Source: Xiao-Yanet al.(2004)), **Plastic films not UV resistant
Treatment Runoff efficiency (%) Estimated life (years)
Clearing of catchment 10-15 2-10
Cleared loess slope 12* 5-10*
Smoothing of soil surface 15-20 2-5
Compacting the soil surface 20-30 2-3
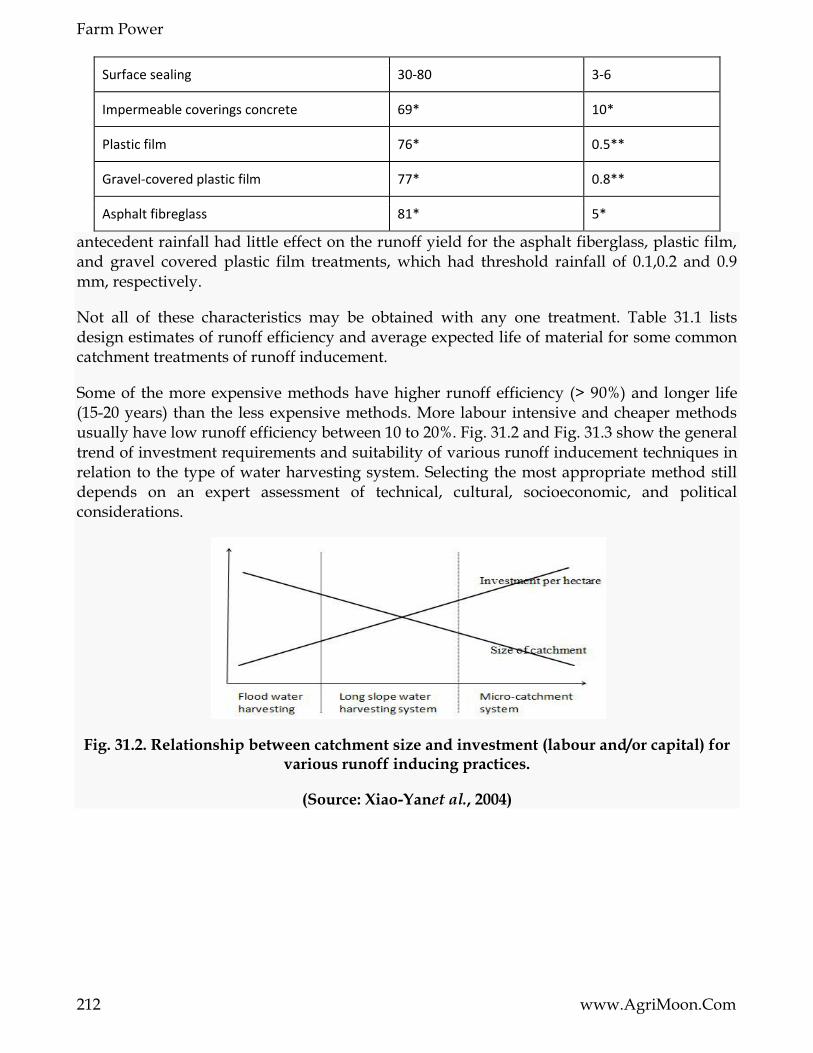
Farm Power
212 www.AgriMoon.Com
Surface sealing 30-80 3-6
Impermeable coverings concrete 69* 10*
Plastic film 76* 0.5**
Gravel-covered plastic film 77* 0.8**
Asphalt fibreglass 81* 5*
antecedent rainfall had little effect on the runoff yield for the asphalt fiberglass, plastic film, and gravel covered plastic film treatments, which had threshold rainfall of 0.1,0.2 and 0.9 mm, respectively.
Not all of these characteristics may be obtained with any one treatment. Table 31.1 lists design estimates of runoff efficiency and average expected life of material for some common catchment treatments of runoff inducement.
Some of the more expensive methods have higher runoff efficiency (> 90%) and longer life (15-20 years) than the less expensive methods. More labour intensive and cheaper methods usually have low runoff efficiency between 10 to 20%. Fig. 31.2 and Fig. 31.3 show the general trend of investment requirements and suitability of various runoff inducement techniques in relation to the type of water harvesting system. Selecting the most appropriate method still depends on an expert assessment of technical, cultural, socioeconomic, and political considerations.
Fig. 31.2. Relationship between catchment size and investment (labour and/or capital) for various runoff inducing practices.
(Source: Xiao-Yanet al., 2004)
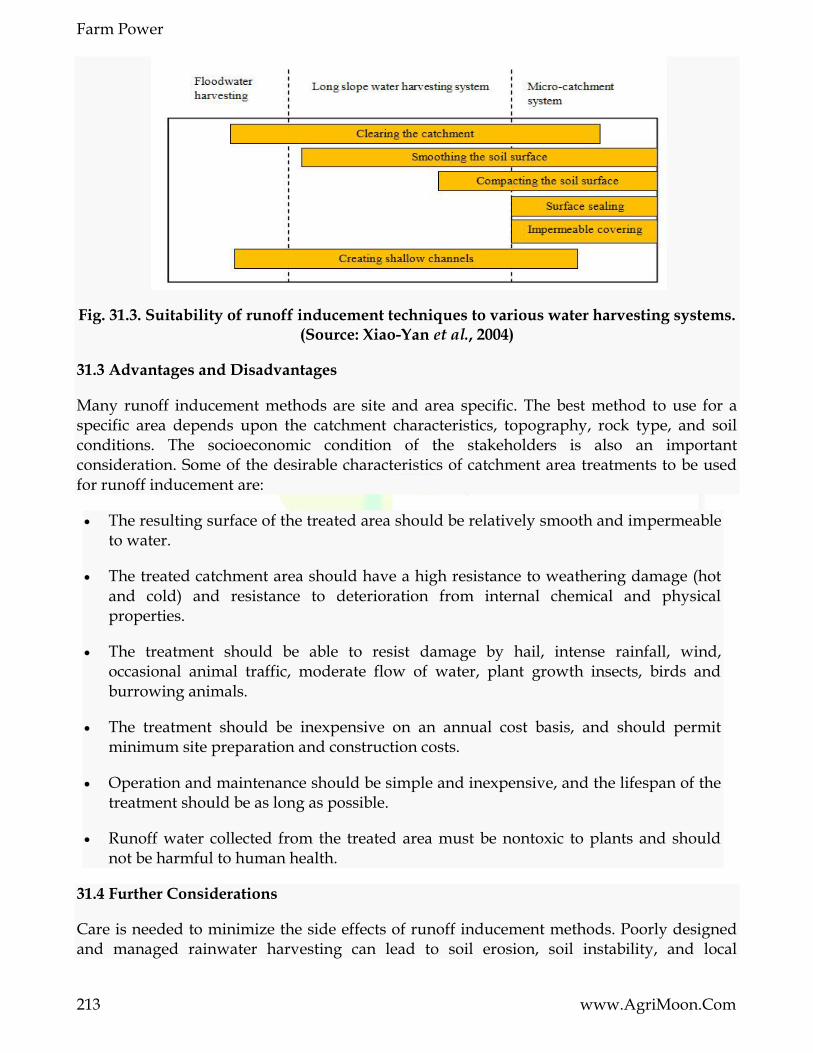
Farm Power
213 www.AgriMoon.Com
Fig. 31.3. Suitability of runoff inducement techniques to various water harvesting systems. (Source: Xiao-Yan et al., 2004)
31.3 Advantages and Disadvantages
Many runoff inducement methods are site and area specific. The best method to use for a specific area depends upon the catchment characteristics, topography, rock type, and soil conditions. The socioeconomic condition of the stakeholders is also an important consideration. Some of the desirable characteristics of catchment area treatments to be used for runoff inducement are:
The resulting surface of the treated area should be relatively smooth and impermeable to water.
The treated catchment area should have a high resistance to weathering damage (hot and cold) and resistance to deterioration from internal chemical and physical properties.
The treatment should be able to resist damage by hail, intense rainfall, wind, occasional animal traffic, moderate flow of water, plant growth insects, birds and burrowing animals.
The treatment should be inexpensive on an annual cost basis, and should permit minimum site preparation and construction costs.
Operation and maintenance should be simple and inexpensive, and the lifespan of the treatment should be as long as possible.
Runoff water collected from the treated area must be nontoxic to plants and should not be harmful to human health.
31.4 Further Considerations
Care is needed to minimize the side effects of runoff inducement methods. Poorly designed and managed rainwater harvesting can lead to soil erosion, soil instability, and local

Farm Power
214 www.AgriMoon.Com
flooding. However data on rainfall intensity, variability and hydro-geology are lacking in many developing countries, which hampers selection of the appropriate method.
Soil erosion is a constant concern and can be controlled if the slope is short and not too steep. Slope of the drainage area affects the quantity and quality of runoff. In long slope systems the most efficient water harvest is from a small, gently sloping catchment with good soil conditions (or from steep catchments with rocky surface).
A rainwater harvesting catchment must withstand weathering and occasional traffic. However most soil treatments have a limited lifespan and must be maintained and renewed periodically. They also require occasional maintenance because of cracking caused by unstable soil, oxidation and weathering; plants growing up through the ground cover or treated soil; and penetration by grazing animals.
Runoff water may be contaminated by the materials used to enhance runoff. If new materials are to be deployed, it should be done on small scale first, before this material is applied at large scale.
Dry-lands often have rich ecosystems, consisting of many species of flora, fauna, and microorganism. The preservation of this diversity must be taken into consideration when clearing sites for water harvesting.

Farm Power
215 www.AgriMoon.Com
Lesson 32 Other Water Harvesting Structures
32.1 Negarim Micro-catchments
Negarim micro-catchments are diamond shaped basins surrounded by small earth bunds with an infiltration pit in the lowest corner of each. Runoff is collected from within the basin and stored in the infiltration pit. Micro-catchments are mainly used for growing trees or bushes. This technique is appropriate for small scale tree planting in areas with moisture deficit problems. Besides harvesting water for the trees and plants, it simultaneously conserves soil. Negarim micro-catchments are neat and precise, and relatively easy to construct.
Fig. 32.1. Negarims under construction. (Source: Critchley, 1992)
32.1.1 Background
The word „Negarim‟ is derived from the Hebrew word for runoff i.e. „Neger‟. Negarim micro-catchments are the most well known form of all water harvesting systems. Although the first reports of such micro-catchments are from southern Tunisia, the technique has been developed in the Negev desert of Israel.
32.1.2 Technical Details
a. Suitability
Negarim micro-catchments are mainly used for growing tree in arid and semi-arid areas. Here the annual rainfall may be as low as 300-700 mm. The soil should be at least 1.5 m, but preferably 2 m, deep in order to ensure adequate root development and storage of the water harvested. Recommended land slope for such micro-catchments varies from 1 to 5%. The topography of the land need not be necessarily leveled and in case of uneven, a block of micro-catchments should be subdivided.

Farm Power
216 www.AgriMoon.Com
b. Overall Configuration
Each micro-catchment consists of a catchment area and an infiltration pit (cultivated area). The shape of each unit is normally square, but the appearance from above is of a network of diamond shapes with infiltration pits in the lowest corners (Figure 32.2).
Fig. 32.2. Negarim micro-catchments-field layout.
(Source: http://www.fao.org/docrep/u3160e/u3160e07.htm#TopOfPage)
c. Limitations
Negarim micro-catchments are well suited for hand construction as they cannot easily be mechanized. Once the trees are planted, it is not possible to operate and cultivate with machines between the tree lines.
d. Micro-catchment Size
The area of each unit is either determined on the basis of a calculation of the plant (tree) water requirement or, more usually, an estimate of this. Size of micro-catchments (per unit) normally range between 10 and 100 m2 depending on the species of tree to be planted but larger sizes are also feasible, particularly when more than one tree will be grown within one unit.
e. Design of Bunds
The bund height is primarily dependent on the prevailing ground slope and the selected size of the micro-catchment. It is recommended to construct bunds with a height of at least 25 cm in order to avoid the risk of over-topping and subsequent damage. Where the ground slope exceeds 2%, the bund height near the infiltration pit must be increased. The top of the bund should be at least 25 cm wide and side slopes should be at least in the range of 1:1 in order to reduce soil erosion during rainstorms. Whenever possible, the bunds should be provided with a grass cover since this is the best protection against erosion.
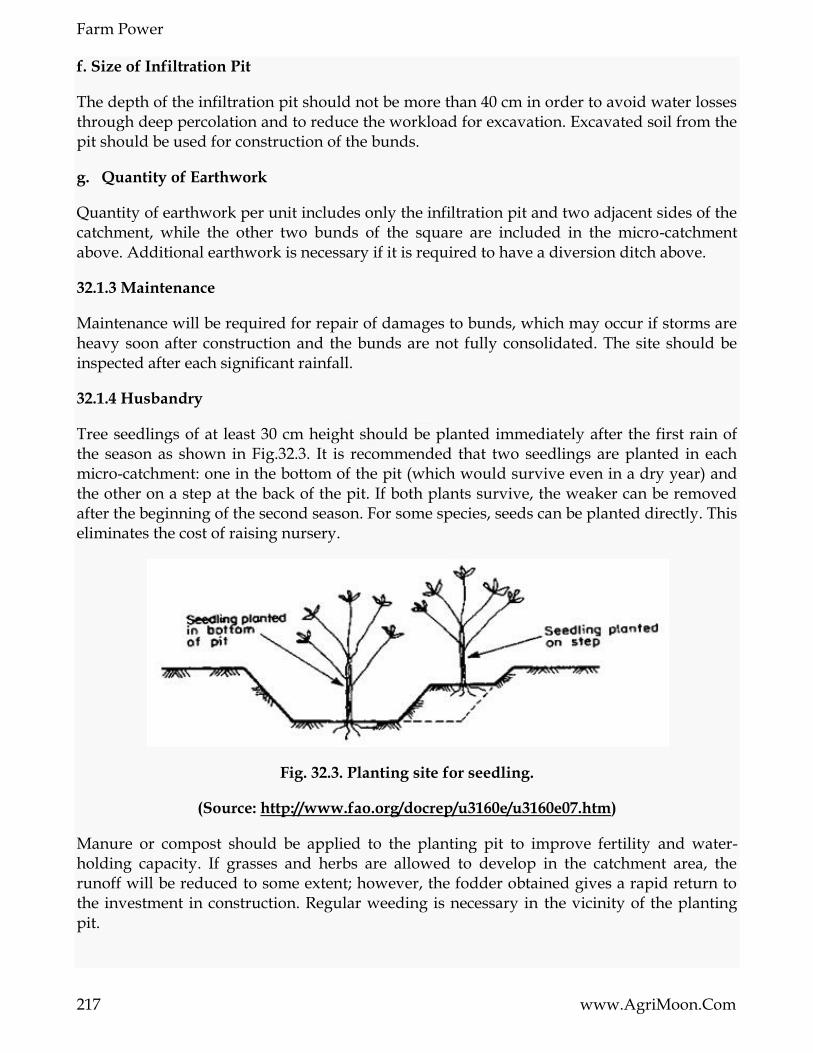
Farm Power
217 www.AgriMoon.Com
f. Size of Infiltration Pit
The depth of the infiltration pit should not be more than 40 cm in order to avoid water losses through deep percolation and to reduce the workload for excavation. Excavated soil from the pit should be used for construction of the bunds.
g. Quantity of Earthwork
Quantity of earthwork per unit includes only the infiltration pit and two adjacent sides of the catchment, while the other two bunds of the square are included in the micro-catchment above. Additional earthwork is necessary if it is required to have a diversion ditch above.
32.1.3 Maintenance
Maintenance will be required for repair of damages to bunds, which may occur if storms are heavy soon after construction and the bunds are not fully consolidated. The site should be inspected after each significant rainfall.
32.1.4 Husbandry
Tree seedlings of at least 30 cm height should be planted immediately after the first rain of the season as shown in Fig.32.3. It is recommended that two seedlings are planted in each micro-catchment: one in the bottom of the pit (which would survive even in a dry year) and the other on a step at the back of the pit. If both plants survive, the weaker can be removed after the beginning of the second season. For some species, seeds can be planted directly. This eliminates the cost of raising nursery.
Fig. 32.3. Planting site for seedling.
(Source: http://www.fao.org/docrep/u3160e/u3160e07.htm)
Manure or compost should be applied to the planting pit to improve fertility and water-holding capacity. If grasses and herbs are allowed to develop in the catchment area, the runoff will be reduced to some extent; however, the fodder obtained gives a rapid return to the investment in construction. Regular weeding is necessary in the vicinity of the planting pit.
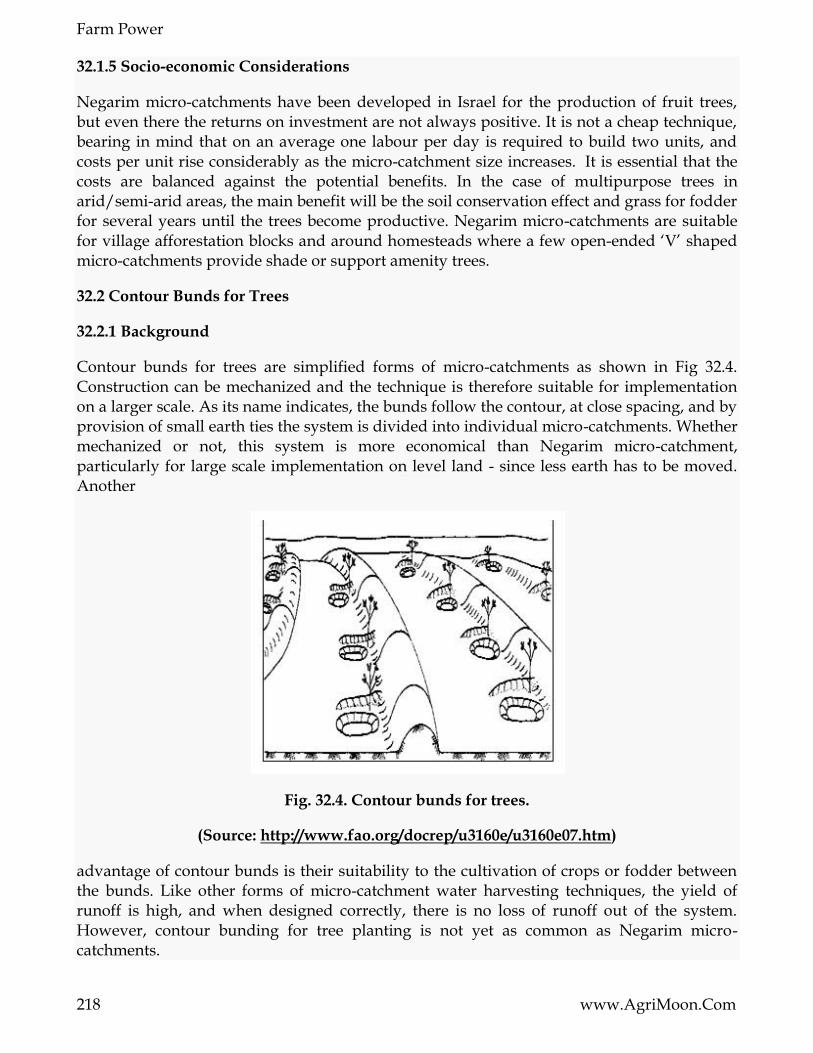
Farm Power
218 www.AgriMoon.Com
32.1.5 Socio-economic Considerations
Negarim micro-catchments have been developed in Israel for the production of fruit trees, but even there the returns on investment are not always positive. It is not a cheap technique, bearing in mind that on an average one labour per day is required to build two units, and costs per unit rise considerably as the micro-catchment size increases. It is essential that the costs are balanced against the potential benefits. In the case of multipurpose trees in arid/semi-arid areas, the main benefit will be the soil conservation effect and grass for fodder for several years until the trees become productive. Negarim micro-catchments are suitable for village afforestation blocks and around homesteads where a few open-ended „V‟ shaped micro-catchments provide shade or support amenity trees.
32.2 Contour Bunds for Trees
32.2.1 Background
Contour bunds for trees are simplified forms of micro-catchments as shown in Fig 32.4. Construction can be mechanized and the technique is therefore suitable for implementation on a larger scale. As its name indicates, the bunds follow the contour, at close spacing, and by provision of small earth ties the system is divided into individual micro-catchments. Whether mechanized or not, this system is more economical than Negarim micro-catchment, particularly for large scale implementation on level land - since less earth has to be moved. Another
Fig. 32.4. Contour bunds for trees.
(Source: http://www.fao.org/docrep/u3160e/u3160e07.htm)
advantage of contour bunds is their suitability to the cultivation of crops or fodder between the bunds. Like other forms of micro-catchment water harvesting techniques, the yield of runoff is high, and when designed correctly, there is no loss of runoff out of the system. However, contour bunding for tree planting is not yet as common as Negarim micro-catchments.
Farm Power
219 www.AgriMoon.Com
32.2.2 Technical Details
a. Suitability
Contour bunds for tree planting are recommended for semi-arid and arid areas receiving rainfall up to 200 and 750 mm, respectively. The soils must be at least 1.5 m and preferably 2 m deep to ensure adequate root development and water storage. The prevailing land slope may range between flat to 5%. Above all, the topography of the land should be leveled without rills or gullies.
b. Limitations
Contour bunds are not suitable for undulating or eroded lands as overtopping of excess water with subsequent breakage may occur at low spots.
c. Overall Configuration
The overall layout of contour bunds consists of a series of parallel, or nearly parallel, earth bunds approximately on the contour at a spacing of 5 to 10 m. The bunds are constructed with soil excavated from an adjacent parallel furrow on their upstream side. Small earth ties perpendicular to the bund on the upstream side subdivide the system into micro-catchments. Infiltration pits are excavated in the junction between ties and bunds. A diversion ditch protects the system wherever necessary.
d. Unit Micro-catchment Size
The size of micro-catchment per tree is estimated in the same way as for Negarim micro-catchments. However, the system is more flexible, because the micro-catchment size can be easily altered by adding or removing cross-ties within the fixed spacing of the bunds. Common sizes of micro-catchments are around 10-50 m2 for each tree.
e. Bund and Infiltration Pit Design
Bund heights may vary within the range of 20 - 40 cm depending on the prevailing slope. As bunds are often made by machine, the actual shape of the bund depends on the type of machine; whether for example a disc plough or a motor grader is used. It is recommended that the bund should not be less than 25 cm in height. Base width must be at least 75 cm. The configuration of the furrow upstream of the bund depends on the method of construction.
Bunds should be spaced at either 5 m or 10 m apart. Cross-ties should be at least 2 m long at spacing of 2 to 10 m. The exact size of each micro-catchment is defined based on the spacing between bunds and cross ties. It is recommended to provide 10 m spacing between the bunds on slopes of up to 0.5% and 5 m on steeper slopes. A common size of micro-catchment for multipurpose trees is 25 m2.
It corresponds to 10 m bund spacing with ties at 2.5 m spacing or 5 m bund-spacing with ties at 5 m spacing. Excavated soil from the infiltration pit is used to form the ties. The pit is excavated in the junction of the bund and the cross-tie. A pit size of dimension 80 cm x 80 cm and 40 cm deep is adequate.
Farm Power
220 www.AgriMoon.Com
32.2.3 Maintenance
Like Negarim micro-catchments, maintenance, in most cases, is limited to repair of damage to bunds early in the initial season. It is essential that any breaches, which are unlikely unless the scheme crosses existing rills, are repaired immediately followed by compaction. Damage is frequently caused if animals invade the plots. Grass should be allowed to develop on the bunds, thus assisting consolidation with their roots.
32.2.4 Husbandry
The majority of the husbandry factors noted under Negarim micro-catchments also apply to this system: there are, however, certain differences. Tree seedlings, of at least 30 cm height, should be planted immediately after the first runoff has been harvested. The seedlings are planted in the space between the infiltration pit and the cross-tie. It is advisable to plant an extra seedling in the bottom of the pit for the eventuality of a very dry year. Manure or compost can be added to the planting pit to improve fertility and water holding capacity.
32.2.5 Socio-economic Factors
Contour bunds for trees are mainly made by machine. The cost of bund construction is relatively low and implementation is faster, especially, where the plots are large and level and the kind of mechanization is well adapted. However, as with all mechanization in areas with limited resources, there is a question mark about future sustainability. Experience has shown that very often the machines come abruptly to a halt when the project itself ends.
32.3 Semi-circular Bunds
32.3.1 Background
Semi-circular bunds refer to earthen embankments in the shape of a semi-circle with the tips of the bunds on the contour. Semi-circular bunds, of varying dimensions, are used mainly for rangeland rehabilitation or fodder production. This technique is also useful for growing trees and shrubs and, in some cases, has been used for growing crops. Depending on the location, and the chosen catchment- cultivated area ratio, it may be a short slope or long slope catchment technique. The examples described here are short slope catchment systems.
Semi-circular bunds are recommended as a quick and easy method of improving rangelands in semi-arid areas. These are more efficient in terms of impounded area to bund volume than other equivalent structures such as trapezoidal bunds etc.
32.3.2 Technical Details
a. Suitability
Semi-circular bunds for rangeland improvement and fodder production are suitable for arid and semi-arid areas receiving up to 200 and 750 mm of rainfall per annum, respectively. The soils should not be too shallow or saline. The land slope should not be greater than 2%. In case of modified bund designs, the land slope can be up to 5%. A level topography is
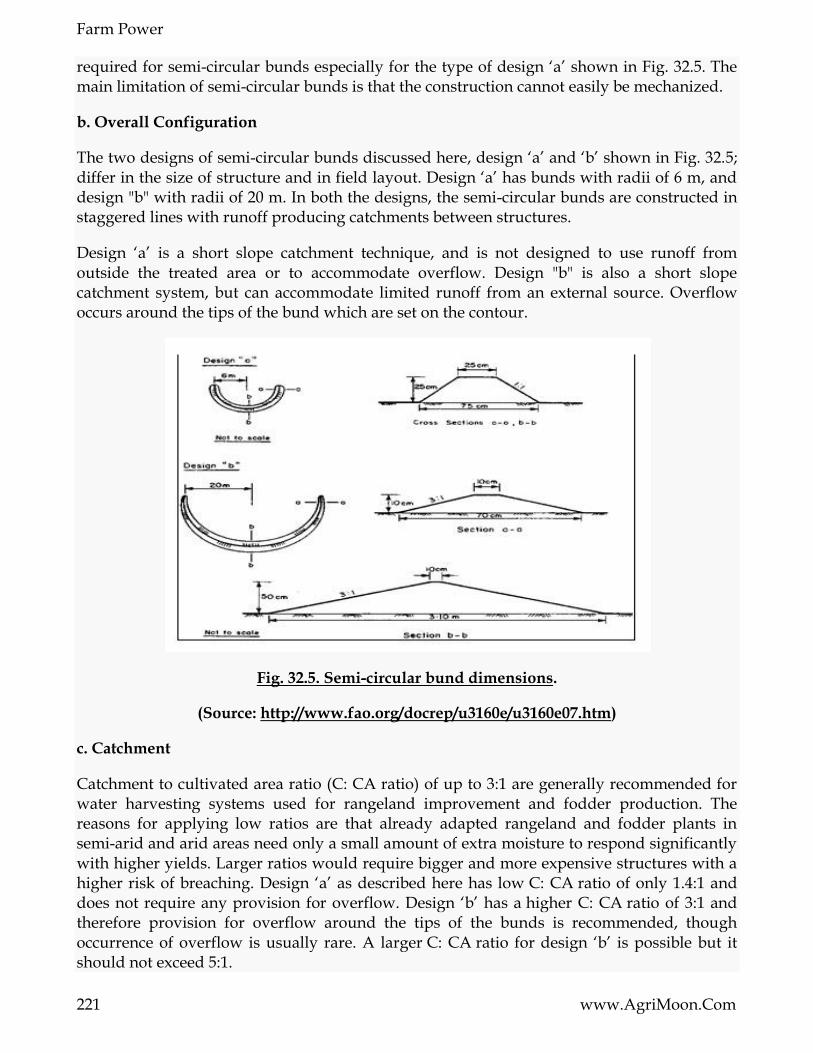
Farm Power
221 www.AgriMoon.Com
required for semi-circular bunds especially for the type of design „a‟ shown in Fig. 32.5. The main limitation of semi-circular bunds is that the construction cannot easily be mechanized.
b. Overall Configuration
The two designs of semi-circular bunds discussed here, design „a‟ and „b‟ shown in Fig. 32.5; differ in the size of structure and in field layout. Design „a‟ has bunds with radii of 6 m, and design "b" with radii of 20 m. In both the designs, the semi-circular bunds are constructed in staggered lines with runoff producing catchments between structures.
Design „a‟ is a short slope catchment technique, and is not designed to use runoff from outside the treated area or to accommodate overflow. Design "b" is also a short slope catchment system, but can accommodate limited runoff from an external source. Overflow occurs around the tips of the bund which are set on the contour.
Fig. 32.5. Semi-circular bund dimensions.
(Source: http://www.fao.org/docrep/u3160e/u3160e07.htm)
c. Catchment
Catchment to cultivated area ratio (C: CA ratio) of up to 3:1 are generally recommended for water harvesting systems used for rangeland improvement and fodder production. The reasons for applying low ratios are that already adapted rangeland and fodder plants in semi-arid and arid areas need only a small amount of extra moisture to respond significantly with higher yields. Larger ratios would require bigger and more expensive structures with a higher risk of breaching. Design „a‟ as described here has low C: CA ratio of only 1.4:1 and does not require any provision for overflow. Design „b‟ has a higher C: CA ratio of 3:1 and therefore provision for overflow around the tips of the bunds is recommended, though occurrence of overflow is usually rare. A larger C: CA ratio for design „b‟ is possible but it should not exceed 5:1.
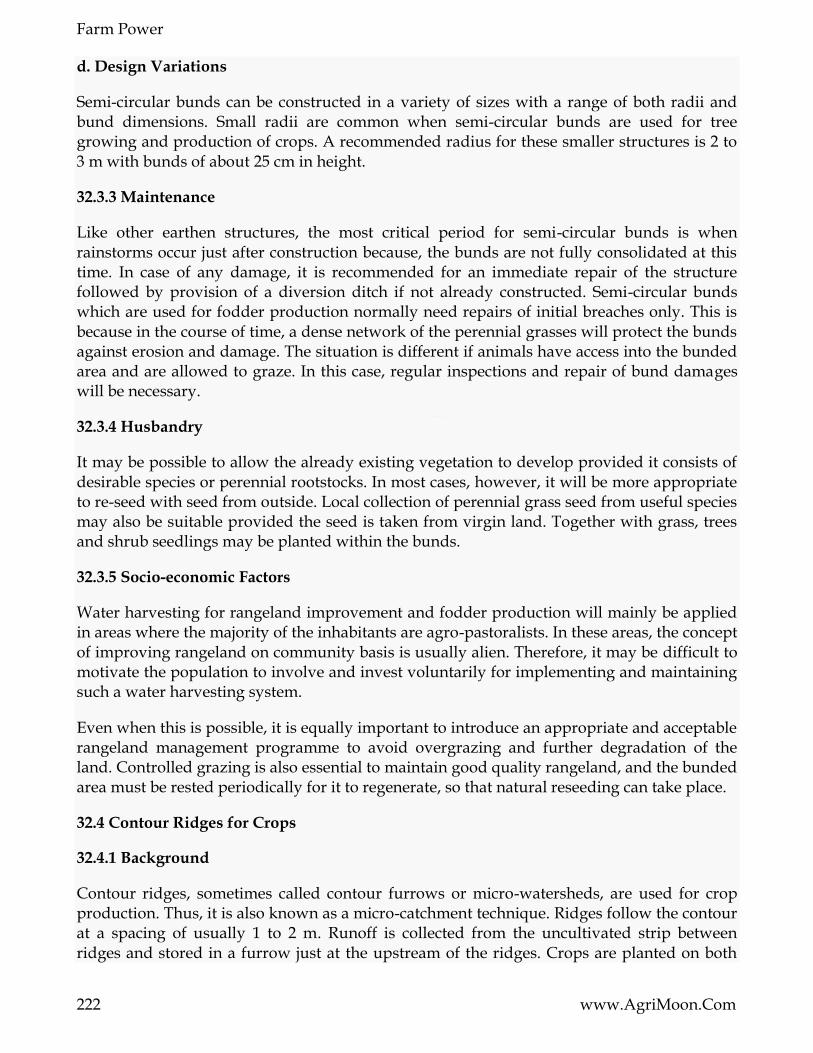
Farm Power
222 www.AgriMoon.Com
d. Design Variations
Semi-circular bunds can be constructed in a variety of sizes with a range of both radii and bund dimensions. Small radii are common when semi-circular bunds are used for tree growing and production of crops. A recommended radius for these smaller structures is 2 to 3 m with bunds of about 25 cm in height.
32.3.3 Maintenance
Like other earthen structures, the most critical period for semi-circular bunds is when rainstorms occur just after construction because, the bunds are not fully consolidated at this time. In case of any damage, it is recommended for an immediate repair of the structure followed by provision of a diversion ditch if not already constructed. Semi-circular bunds which are used for fodder production normally need repairs of initial breaches only. This is because in the course of time, a dense network of the perennial grasses will protect the bunds against erosion and damage. The situation is different if animals have access into the bunded area and are allowed to graze. In this case, regular inspections and repair of bund damages will be necessary.
32.3.4 Husbandry
It may be possible to allow the already existing vegetation to develop provided it consists of desirable species or perennial rootstocks. In most cases, however, it will be more appropriate to re-seed with seed from outside. Local collection of perennial grass seed from useful species may also be suitable provided the seed is taken from virgin land. Together with grass, trees and shrub seedlings may be planted within the bunds.
32.3.5 Socio-economic Factors
Water harvesting for rangeland improvement and fodder production will mainly be applied in areas where the majority of the inhabitants are agro-pastoralists. In these areas, the concept of improving rangeland on community basis is usually alien. Therefore, it may be difficult to motivate the population to involve and invest voluntarily for implementing and maintaining such a water harvesting system.
Even when this is possible, it is equally important to introduce an appropriate and acceptable rangeland management programme to avoid overgrazing and further degradation of the land. Controlled grazing is also essential to maintain good quality rangeland, and the bunded area must be rested periodically for it to regenerate, so that natural reseeding can take place.
32.4 Contour Ridges for Crops
32.4.1 Background
Contour ridges, sometimes called contour furrows or micro-watersheds, are used for crop production. Thus, it is also known as a micro-catchment technique. Ridges follow the contour at a spacing of usually 1 to 2 m. Runoff is collected from the uncultivated strip between ridges and stored in a furrow just at the upstream of the ridges. Crops are planted on both

Farm Power
223 www.AgriMoon.Com
sides of the furrow. The system is simple to construct either by hand or machine, and can be even less labour intensive than the conventional tilling of a plot.
The yield of runoff from the very short catchment lengths is extremely efficient. When these ridges are designed and constructed correctly, the loss of runoff water out of the system could be prevented completely. Uniform crop growth is another advantage of the system due to the fact that each plant has approximately the same contributing catchment area. However, the contour ridges for crops are not yet a widespread technique.
32.4.2 Technical Details
a. Suitability
Contour ridges for crop production may be recommended for those areas where, the mean annual rainfall is between 350 and 750 mm, soil is suitable for crop production, land slope ranges between flat and 5% and the land topography is leveled. Moreover, it is difficult to construct ridges by hand in areas with heavy and compacted soil. Also areas with rills and undulations are not suitable for contour ridges.
b. Limitations
Contour ridges are limited to areas with relatively high rainfall, as the amount of harvested runoff is comparatively small due to the small catchment area.
c. Overall Configuration
The overall layout consists of parallel or nearly parallel contour ridges approximately on the contour at a spacing of 1 to 2 m (Fig. 32.6). When the furrow is excavated, the dugout soil is placed downstream of the furrow to form a ridge. The furrow collects runoff from the catchment strip between ridges. Small earth-ties in the furrows are provided at frequent intervals to ensure an even storage of runoff. A diversion ditch may be necessary to protect the system against runoff from above.
Fig. 32.6.Contour ridges: field layout.
(Source: http://www.fao.org/docrep/u3160e/u3160e07.htm)
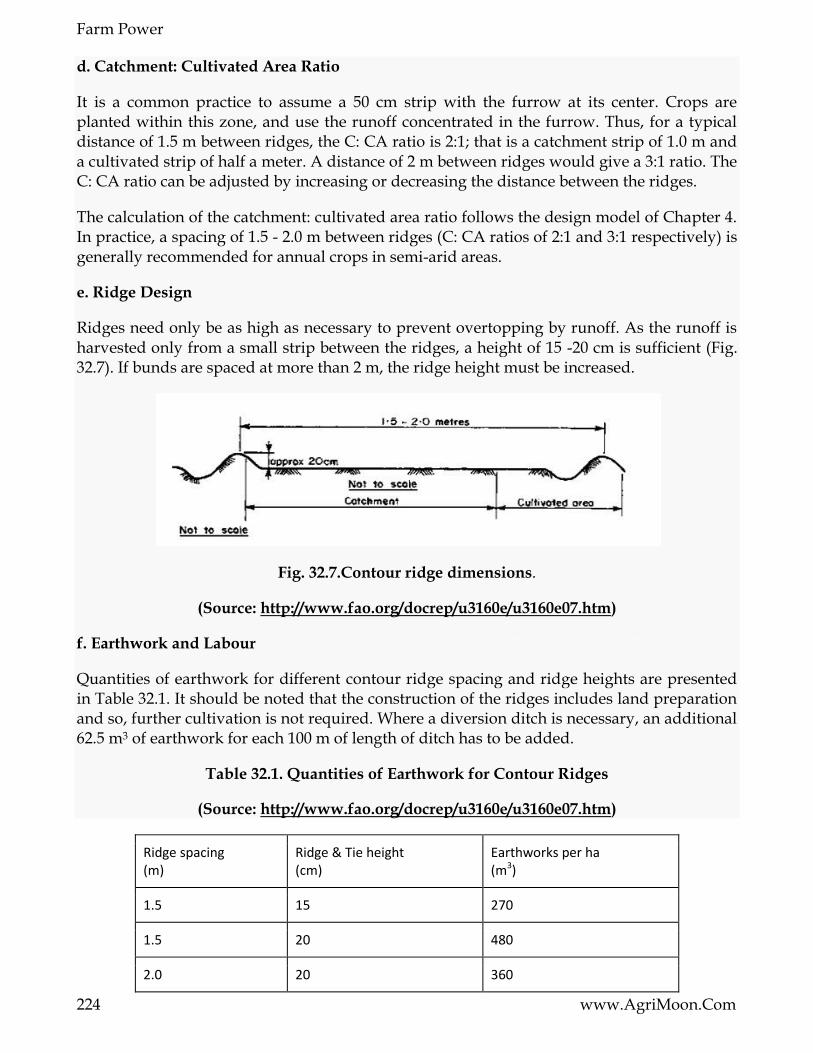
Farm Power
224 www.AgriMoon.Com
d. Catchment: Cultivated Area Ratio
It is a common practice to assume a 50 cm strip with the furrow at its center. Crops are planted within this zone, and use the runoff concentrated in the furrow. Thus, for a typical distance of 1.5 m between ridges, the C: CA ratio is 2:1; that is a catchment strip of 1.0 m and a cultivated strip of half a meter. A distance of 2 m between ridges would give a 3:1 ratio. The C: CA ratio can be adjusted by increasing or decreasing the distance between the ridges.
The calculation of the catchment: cultivated area ratio follows the design model of Chapter 4. In practice, a spacing of 1.5 - 2.0 m between ridges (C: CA ratios of 2:1 and 3:1 respectively) is generally recommended for annual crops in semi-arid areas.
e. Ridge Design
Ridges need only be as high as necessary to prevent overtopping by runoff. As the runoff is harvested only from a small strip between the ridges, a height of 15 -20 cm is sufficient (Fig. 32.7). If bunds are spaced at more than 2 m, the ridge height must be increased.
Fig. 32.7.Contour ridge dimensions.
(Source: http://www.fao.org/docrep/u3160e/u3160e07.htm)
f. Earthwork and Labour
Quantities of earthwork for different contour ridge spacing and ridge heights are presented in Table 32.1. It should be noted that the construction of the ridges includes land preparation and so, further cultivation is not required. Where a diversion ditch is necessary, an additional 62.5 m3 of earthwork for each 100 m of length of ditch has to be added.
Table 32.1. Quantities of Earthwork for Contour Ridges
(Source: http://www.fao.org/docrep/u3160e/u3160e07.htm)
Ridge spacing (m)
Ridge & Tie height (cm)
Earthworks per ha (m3)
1.5 15 270
1.5 20 480
2.0 20 360

Farm Power
225 www.AgriMoon.Com
32.4.3 Maintenance
If contour ridges are correctly laid out, it is unlikely that there will be any overtopping and breaching. Nevertheless if breaches do occur, the ridges or ties must be repaired immediately. The uncultivated catchment area between the ridges should be kept free of vegetation to ensure that the optimum amount of runoff flows into the furrows.
At the end of each season the original height of the ridges need to be restored. After two or three seasons, depending on the fertility status of the soils, it may be necessary to move the ridges down the slope by approximately one metre or more, which is likely to result in a fresh supply of nutrients to the plants.
32.4.4 Husbandry
The main crop (usually a cereal) is seeded at the upstream face of the ridge between the top of the ridge and the furrow as shown in Fig. 32.8. In this area, the plants have a greater depth of top soil. An intercrop, usually a legume, may be planted in front of the furrow. In this practice, it is recommended to reduce the plant population of the cereal crop to approximately 65% of the standard for conventional rainfed cultivation. Thus, the moisture available for less number of plants is more during the years of low rainfall. Weeding must be carried out regularly around the plants and within the catchment strip.
Fig. 32.8.Planting configuration in contour ridges.
(Source: http://www.fao.org/docrep/u3160e/u3160e07.htm)
32.4.5 Socio-economic Factors
Since the contour ridge technique implies a new tillage and planting method compared to conventional cultivation, farmers may be initially reluctant to accept this technique. Demonstration and motivation are therefore very much important. On the other hand, it is one of the simplest and cheapest methods of water harvesting. It can be implemented by the farmer using a hoe, at no or little extra cost. Alternatively it can be mechanized and a variety of implements can be used. When used by a farmer on his own land, the system does not create any conflicts of interest between the executants and the beneficiary.
Farm Power
226 www.AgriMoon.Com
32.5 Trapezoidal Bunds
32.5.1 Background
Trapezoidal bunds are used to enclose larger areas up to 1 ha and to impound larger amount of runoff which is harvested from an external or long slope catchment. The name is derived from the layout of the structure which is of trapezoidal shape. It consists of a base bund connected to two side bunds or wing walls which extend upstream at an angle of usually 1350. Crops are planted within the enclosed area. Overflow discharges around the tips of the wing walls. The concept is similar to the semi-circular bund technique. However, in this case three sides of a plot are enclosed by bunds while the fourth (upstream) side is left open to allow runoff to enter the field. Simple design and construction; and requirement of minimum maintenance are the main advantages of this technique.
32.5.2 Technical Details
a. Suitability
The trapezoidal bunds are also used for growing crops, trees and grass. Their most common application is for crop production in arid to semi-arid areas with soil of good constructional properties and annual rainfall of 250 - 500 mm. A soil of good constructional property has significant clay content and is non-cracking in nature. The topography of the area within the bunds should be made flat and the allowed land slope is from 0.25% - 1.5%, but most suitable when it is below 0.5%.
b. Limitations
This technique is limited to low ground slopes. Construction of trapezoidal bunds on slopes steeper than 1.5% is technically feasible, but involves large quantities of earthwork.
c. Overall Configuration
Each unit of trapezoidal bund consists of a base bund connected to two wing walls which extend upstream at an angle of 1350. The size of the enclosed area depends on the slope and can vary from 0.1 to 1 ha. Trapezoidal bunds may be constructed as single units or in sets. When several trapezoidal bunds are built in a set, they are arranged in a staggered configuration; units in lower lines intersect overflow from the bunds above. A common distance between the ends of adjacent bunds within the same row is 20 m and a spacing of 30 cm is maintained between the tips of the lower row and the base bunds of the upper row (Fig. 32.9). Of course, the spacing may vary based on the requirement of the site conditions. However, the staggered configuration, as shown in Fig. 32.9, should always be followed. It is not recommended to build more than two rows of trapezoidal bunds since the third or fourth row receives significantly less runoff.
d. Catchment: Cultivated Area (C: CA) Ratio
In this case it is important to determine the necessary catchment size for a required cultivated area. It is sometimes more appropriate to approach the problem the other way round, and determine the area and number of bunds which can be cultivated from an existing catchment.
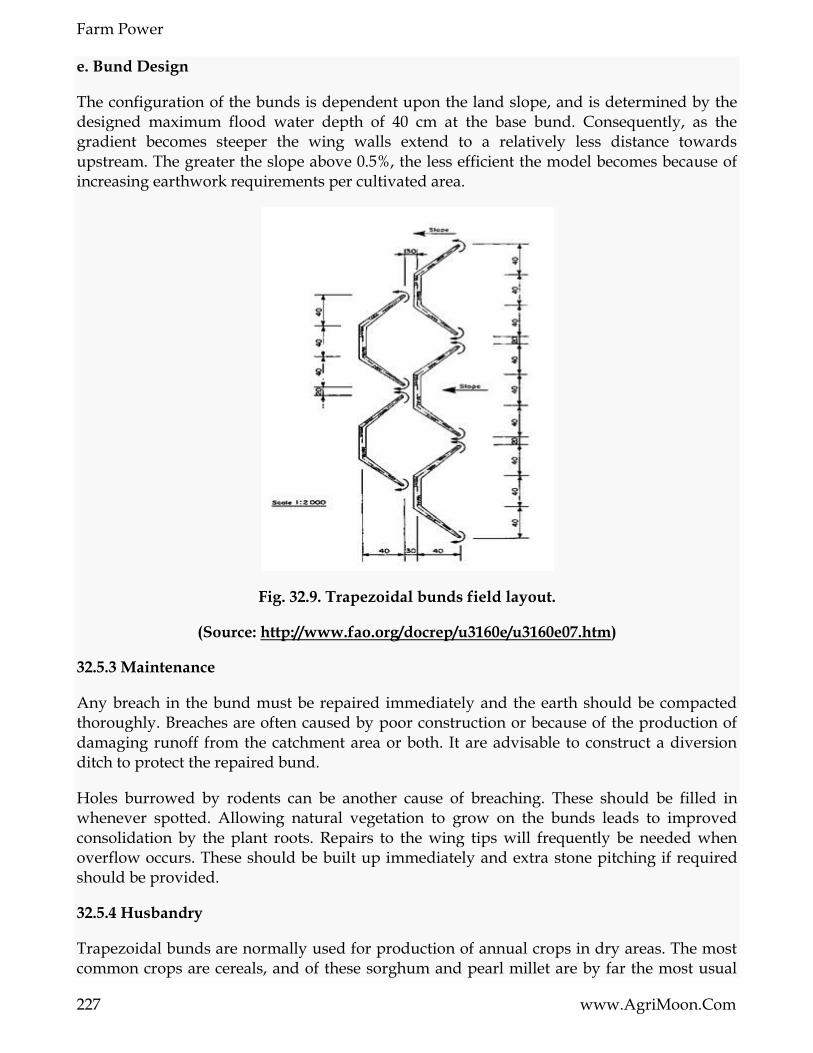
Farm Power
227 www.AgriMoon.Com
e. Bund Design
The configuration of the bunds is dependent upon the land slope, and is determined by the designed maximum flood water depth of 40 cm at the base bund. Consequently, as the gradient becomes steeper the wing walls extend to a relatively less distance towards upstream. The greater the slope above 0.5%, the less efficient the model becomes because of increasing earthwork requirements per cultivated area.
Fig. 32.9. Trapezoidal bunds field layout.
(Source: http://www.fao.org/docrep/u3160e/u3160e07.htm)
32.5.3 Maintenance
Any breach in the bund must be repaired immediately and the earth should be compacted thoroughly. Breaches are often caused by poor construction or because of the production of damaging runoff from the catchment area or both. It are advisable to construct a diversion ditch to protect the repaired bund.
Holes burrowed by rodents can be another cause of breaching. These should be filled in whenever spotted. Allowing natural vegetation to grow on the bunds leads to improved consolidation by the plant roots. Repairs to the wing tips will frequently be needed when overflow occurs. These should be built up immediately and extra stone pitching if required should be provided.
32.5.4 Husbandry
Trapezoidal bunds are normally used for production of annual crops in dry areas. The most common crops are cereals, and of these sorghum and pearl millet are by far the most usual
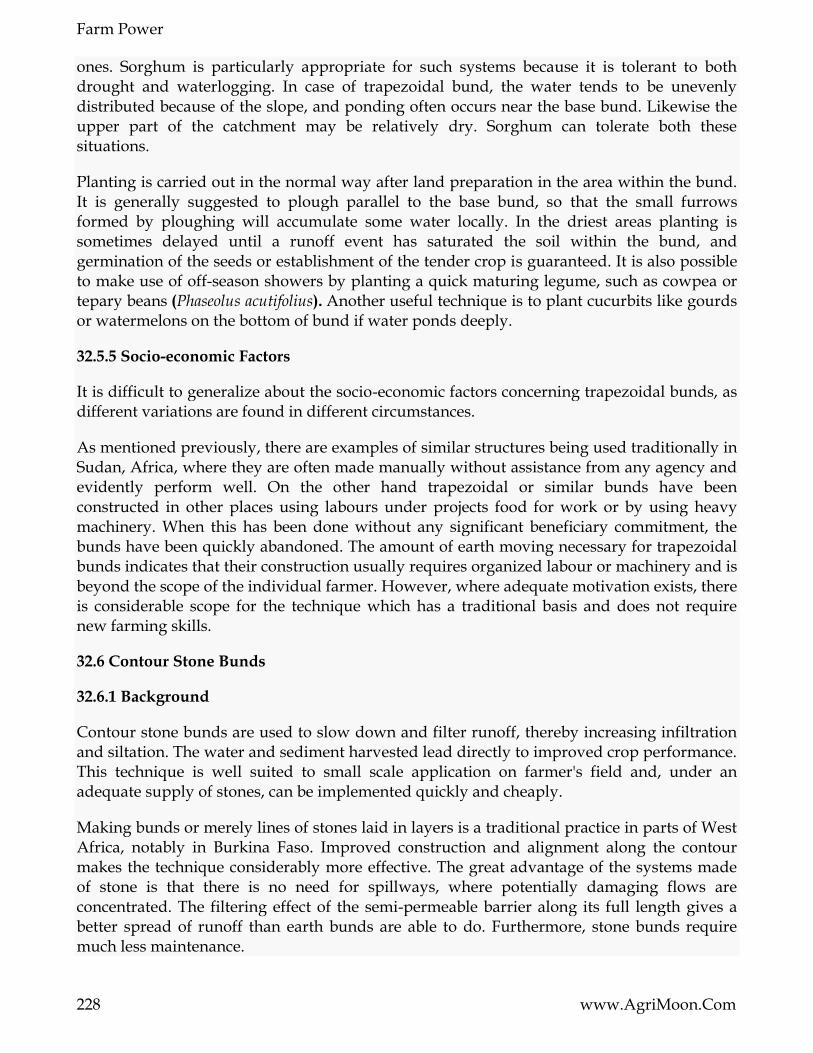
Farm Power
228 www.AgriMoon.Com
ones. Sorghum is particularly appropriate for such systems because it is tolerant to both drought and waterlogging. In case of trapezoidal bund, the water tends to be unevenly distributed because of the slope, and ponding often occurs near the base bund. Likewise the upper part of the catchment may be relatively dry. Sorghum can tolerate both these situations.
Planting is carried out in the normal way after land preparation in the area within the bund. It is generally suggested to plough parallel to the base bund, so that the small furrows formed by ploughing will accumulate some water locally. In the driest areas planting is sometimes delayed until a runoff event has saturated the soil within the bund, and germination of the seeds or establishment of the tender crop is guaranteed. It is also possible to make use of off-season showers by planting a quick maturing legume, such as cowpea or tepary beans (Phaseolus acutifolius). Another useful technique is to plant cucurbits like gourds or watermelons on the bottom of bund if water ponds deeply.
32.5.5 Socio-economic Factors
It is difficult to generalize about the socio-economic factors concerning trapezoidal bunds, as different variations are found in different circumstances.
As mentioned previously, there are examples of similar structures being used traditionally in Sudan, Africa, where they are often made manually without assistance from any agency and evidently perform well. On the other hand trapezoidal or similar bunds have been constructed in other places using labours under projects food for work or by using heavy machinery. When this has been done without any significant beneficiary commitment, the bunds have been quickly abandoned. The amount of earth moving necessary for trapezoidal bunds indicates that their construction usually requires organized labour or machinery and is beyond the scope of the individual farmer. However, where adequate motivation exists, there is considerable scope for the technique which has a traditional basis and does not require new farming skills.
32.6 Contour Stone Bunds
32.6.1 Background
Contour stone bunds are used to slow down and filter runoff, thereby increasing infiltration and siltation. The water and sediment harvested lead directly to improved crop performance. This technique is well suited to small scale application on farmer's field and, under an adequate supply of stones, can be implemented quickly and cheaply.
Making bunds or merely lines of stones laid in layers is a traditional practice in parts of West Africa, notably in Burkina Faso. Improved construction and alignment along the contour makes the technique considerably more effective. The great advantage of the systems made of stone is that there is no need for spillways, where potentially damaging flows are concentrated. The filtering effect of the semi-permeable barrier along its full length gives a better spread of runoff than earth bunds are able to do. Furthermore, stone bunds require much less maintenance.
Farm Power
229 www.AgriMoon.Com
Stone bunding techniques for water harvesting (as opposed to stone bunding for hillside terracing, a much more widespread technique) is very much developed in Yatenga Province of Burkina Faso. It has proved to be an effective technique based on its wide spread adaptation and easy in construction.
32.6.2 Technical Details
a. Suitability
Stone bunds for crop production recommended for arid and semi-arid areas receiving mean annual rainfall of 200 – 750 mm. The soil should be fit for crop production with even topography and land slope, preferably, less than 2%.Availability of stones in the nearby locality is a major criterion for stone bunds.
b. Overall Configuration
Stone bunds follow the contour, or the approximate contour, across fields or grazing land. The spacing between bunds ranges normally between 15 and 30 m depending largely on the amount of stone and labour available (Fig. 32.10). There is no need for diversion ditches or provision of spillways.
Fig. 32.10.Contour stone bund field layout.
(Source: http://www.fao.org/docrep/u3160e/u3160e07.htm)
c. Catchment: Cultivated Area Ratio
Contour stone bund is a long slope technique relying on an external catchment. Theoretical catchment: cultivated area (C: CA) ratios can be calculated using the formula given in the preceding chapter. Initially it is advisable to be conservative in estimation of areas which can be cultivated from any catchment. The area can be extended either down the slope or upstream in subsequent cropping seasons, if appropriate.
d. Bund Design
Although simple stone lines can be partially effective, an initial minimum bund height of 25 cm is recommended, with a base width of 35 - 40 cm. The bund should be set into a shallow trench, of 5 - 10 cm depth, which helps to prevent undermining by runoff. It is important to
Farm Power
230 www.AgriMoon.Com
note that a mixture of large and small stones is a better for stone bunds. A common error is to use only large stones, which allow runoff to flow freely through the gaps in-between. The bund should be constructed according to the "reverse filter" principle which states that the smaller stones are to be placed upstream of the larger ones to facilitate rapid siltation. Bund spacing of 20 m for slopes less than 1%, and 15 m for slopes between 1 - 2%, respectively, are recommended.
e. Design Variations
Where there is not enough stone readily available, stone lines can be used to form the framework of a system. Grass, or other vegetative material, is then planted immediately behind the lines and forms, over a period of time, a living barrier which has a similar effect to a stone bund. Alternatively, earthen contour bunds can be constructed, with stone spillways set into them.
32.6.3 Maintenance
During heavy runoff events, the stone bunds may be overtopped resulting in dislodgement of some stones. It should be replaced immediately. A more common requirement is to plug any small gaps with small stones or gravel where runoff forms a tunnel through.
Eventually stone bunds silt-up, and their water harvesting efficiency declines. It normally takes three seasons or more to happen, and occurs more rapidly where bunds are wider apart, and on steeper slopes. Bunds should be built up in these circumstances with less tightly packed stones, to reduce siltation, while maintaining the effect of slowing runoff. Alternatively grasses can be planted alongside the bund. The grass supplements the stone bund and effectively increases its height.
32.6.4 Husbandry
Stone bunds in West Africa are often used for rehabilitation of infertile and degraded land. In this context it is recommended that the bunds be supported by a further technique of planting pits. These pits, which are usually about 0.9 m apart, are up to 0.15 m deep and 0.30 m in diameter. Manure is placed in the pits to improve plant growth. The pits also concentrate local runoff which is especially useful at the germination and establishment phase.
As in the case of all cropping systems under water harvesting, an improved standard of general husbandry is important to make use of the extra water harvested. Manuring is very important in fertility management. Apart from it, early weeding is also essential in areas of stone bunding as late weeding is often a constraint to production.
32.6.5 Socio-economic Factors
On-farm stone bunding for crop production is quickly appreciated and adopted by farmers. The techniques involved, including simple surveying, can be easily learned. The amount of labour required is reasonable, and where groups are organized to work in turn on individual member's farms, fields can be transformed in a single day. The benefits of stone bunding are often clearly seen already in the first season and this helps to make the system popular.
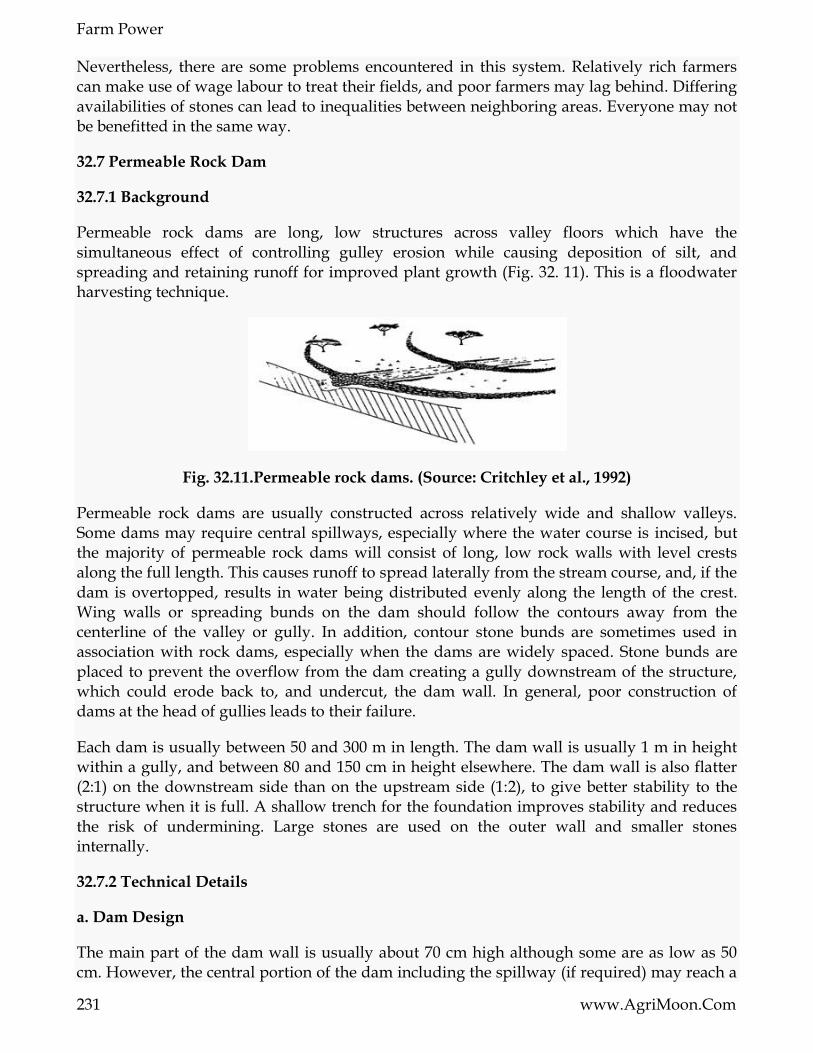
Farm Power
231 www.AgriMoon.Com
Nevertheless, there are some problems encountered in this system. Relatively rich farmers can make use of wage labour to treat their fields, and poor farmers may lag behind. Differing availabilities of stones can lead to inequalities between neighboring areas. Everyone may not be benefitted in the same way.
32.7 Permeable Rock Dam
32.7.1 Background
Permeable rock dams are long, low structures across valley floors which have the simultaneous effect of controlling gulley erosion while causing deposition of silt, and spreading and retaining runoff for improved plant growth (Fig. 32. 11). This is a floodwater harvesting technique.
Fig. 32.11.Permeable rock dams. (Source: Critchley et al., 1992)
Permeable rock dams are usually constructed across relatively wide and shallow valleys. Some dams may require central spillways, especially where the water course is incised, but the majority of permeable rock dams will consist of long, low rock walls with level crests along the full length. This causes runoff to spread laterally from the stream course, and, if the dam is overtopped, results in water being distributed evenly along the length of the crest. Wing walls or spreading bunds on the dam should follow the contours away from the centerline of the valley or gully. In addition, contour stone bunds are sometimes used in association with rock dams, especially when the dams are widely spaced. Stone bunds are placed to prevent the overflow from the dam creating a gully downstream of the structure, which could erode back to, and undercut, the dam wall. In general, poor construction of dams at the head of gullies leads to their failure.
Each dam is usually between 50 and 300 m in length. The dam wall is usually 1 m in height within a gully, and between 80 and 150 cm in height elsewhere. The dam wall is also flatter (2:1) on the downstream side than on the upstream side (1:2), to give better stability to the structure when it is full. A shallow trench for the foundation improves stability and reduces the risk of undermining. Large stones are used on the outer wall and smaller stones internally.
32.7.2 Technical Details
a. Dam Design
The main part of the dam wall is usually about 70 cm high although some are as low as 50 cm. However, the central portion of the dam including the spillway (if required) may reach a
Farm Power
232 www.AgriMoon.Com
maximum height of 2 m above the gully floor. The dam wall or spreader can extend up to 1000 m across the widest valley beds, but the lengths normally range from 50 to 300 m. The amount of stone used in the largest structures can be up to 2000 tonnes.
The dam wall is made of loose stone, carefully positioned, with larger boulders forming the framework and smaller stones packed in the middle like a sandwich. The side slopes are usually 3:1 or 2:1 (horizontal: vertical) on the downstream side, and 1:1 or 1:2 on the upstream side. With flatter side slopes, the structure is more stable, but more expensive.
For all soil types it is recommended to set the dam wall in an excavated trench of about 10 cm depth to prevent undermining by runoff waters. In erodible soils, it is advisable to place a layer of gravel, or at least smaller stones, in the trench.
b. Earthwork and Labour
The quantity of stone and the labour requirement for collection, transportation and construction depends on a number of factors and vary widely. The figures were calculated for a rock dam with an average cross section of 0.98 m2 (70 cm high, base width of 280 cm) and a length of 100 m. The vertical interval between dams is assumed to be 0.7 m, which defines the necessary spacing between adjacent dams.
Transport of stones from the collection site to the fields in the valley is the normal method. Considerable labour may be required to collect, and sometimes break, stone. Labour requirements, based on field estimates, are in the range of 0.5 m3 of stone per person per day excluding transport.
32.7.3 Maintenance
The design given above, with its low side slopes and wide base should not require any significant maintenance work provided the described construction method is carefully observed. It will tolerate some overtopping in heavy floods. Nevertheless there may be some stones washed off, which will require replacing, or tunneling of water beneath the bund which will need packing with small stones. No structure in any water harvesting system is entirely maintenance free and all damage, even small, should be repaired as soon as possible to prevent rapid deterioration.
32.7.4 Husbandry
Permeable rock dams improve conditions for plant growth by spreading water, where moisture availability is a limiting factor. In addition, sediment, which will build up behind the bund over the seasons, is rich in nutrients, and this will further improve the crop growth.
This technique is used exclusively for annual crops. In the sandy soils, which do not retain moisture for long, the most common crops are millet and groundnuts. As the soils become heavier, the crops change to sorghum and maize. Where soils are heavy and impermeable, waterlogging would affect most crops, and therefore rice is grown in these zones. Within one series of permeable rock dams, several species of crops may be grown, reflecting the variations in soil and drainage conditions.
Farm Power
233 www.AgriMoon.Com
32.7.5 Socio-economic Factors
The implementation of permeable rock dams raises several important socio-economic issues. Many of these are rather specific to this technique. This is because permeable rock dams are characterized by:
Large quantities of stone needed
Outside assistance often necessary for transport of stone
Limited number of direct beneficiaries
Construction is often determined by the people rather than the technicians
As the structures cannot be made by individual farmers, it is necessary for others to cooperate in construction. It would be ideal if a village committee can be formed to co-ordinate efforts and discuss the situation of priority sites and beneficiaries. It is unrealistic to expect implementation of such a programme without outside help for transport of stones, which should be provided free of charge to the beneficiaries. Long-term sustainability and replicability of the form of development would best be promoted if beneficiaries could establish revolving funds for the hire or purchase of transport.
32.7.6 Effectiveness of the Technology
Permeable rock dams provide a more effective and popular technique for controlling gully erosion than gabions. Permeable rock dams, in addition to the effective control of gullies, have resulted in considerable increase in crop yield behind the dams. Gullies are rehabilitated by the deposition of silt behind the dams, increasing the depth and quality of the soil immediately behind the dam as a result of the deposition of fertile silt. They have also improved the amount of moisture available for crops. Yields of sorghum from land restored with permeable rock dams range up to 1.9 t/ha compared with a yield of 1 t/ha from equivalent untreated land. Other crops planted behind permeable rock dams include rice (on heavy soils), pearl millet and peanuts.
a. Suitability
This technology is appropriate for regions with less than 700 mm annual rainfall, where gullies are being formed in productive land. It is particularly suited to valley floors with slopes of less than 2%, and where a local supply of stones and the means to transport them is available.
b. Environmental Benefits
The control of gulley formation and the encouragement of silt deposition can have positive effects on a river course and water quality.
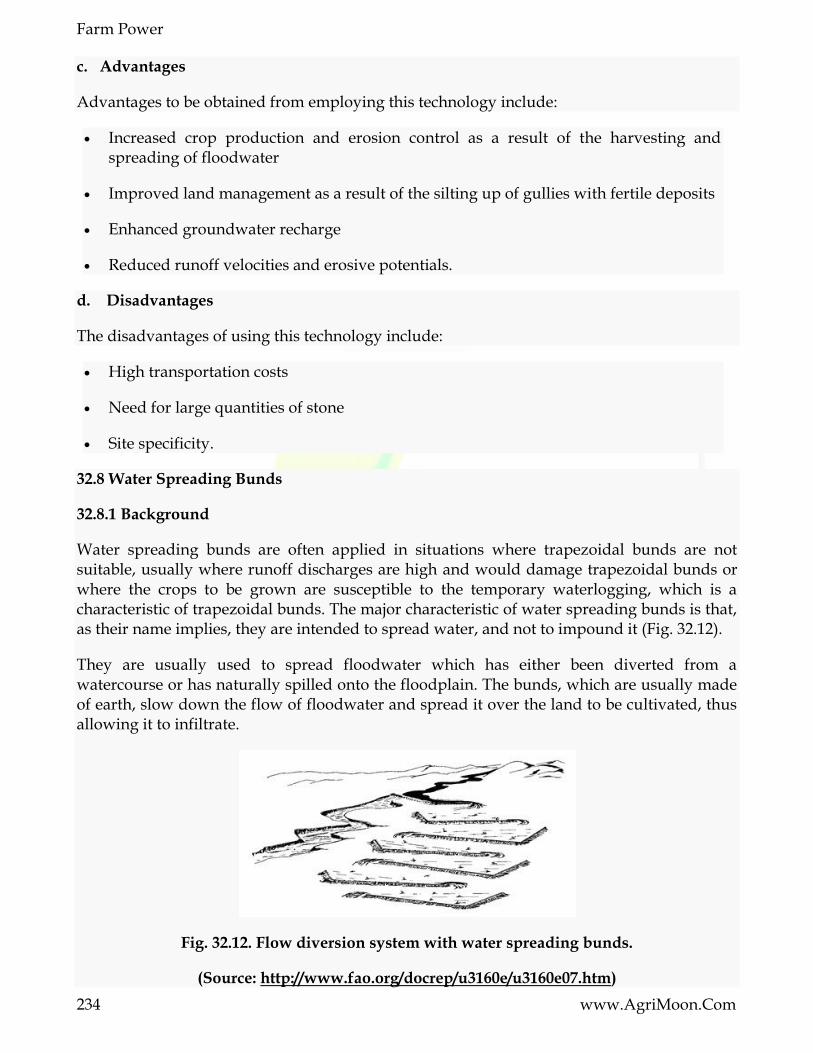
Farm Power
234 www.AgriMoon.Com
c. Advantages
Advantages to be obtained from employing this technology include:
Increased crop production and erosion control as a result of the harvesting and spreading of floodwater
Improved land management as a result of the silting up of gullies with fertile deposits
Enhanced groundwater recharge
Reduced runoff velocities and erosive potentials.
d. Disadvantages
The disadvantages of using this technology include:
High transportation costs
Need for large quantities of stone
Site specificity.
32.8 Water Spreading Bunds
32.8.1 Background
Water spreading bunds are often applied in situations where trapezoidal bunds are not suitable, usually where runoff discharges are high and would damage trapezoidal bunds or where the crops to be grown are susceptible to the temporary waterlogging, which is a characteristic of trapezoidal bunds. The major characteristic of water spreading bunds is that, as their name implies, they are intended to spread water, and not to impound it (Fig. 32.12).
They are usually used to spread floodwater which has either been diverted from a watercourse or has naturally spilled onto the floodplain. The bunds, which are usually made of earth, slow down the flow of floodwater and spread it over the land to be cultivated, thus allowing it to infiltrate.
Fig. 32.12. Flow diversion system with water spreading bunds.
(Source: http://www.fao.org/docrep/u3160e/u3160e07.htm)
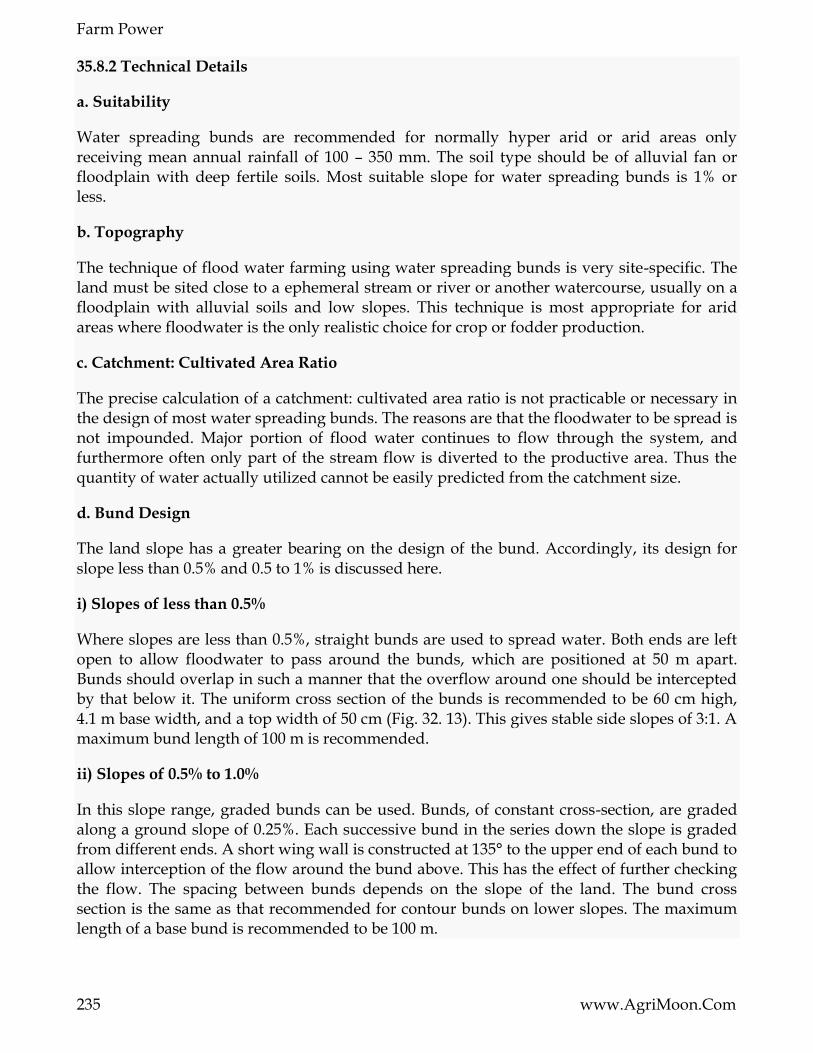
Farm Power
235 www.AgriMoon.Com
35.8.2 Technical Details
a. Suitability
Water spreading bunds are recommended for normally hyper arid or arid areas only receiving mean annual rainfall of 100 – 350 mm. The soil type should be of alluvial fan or floodplain with deep fertile soils. Most suitable slope for water spreading bunds is 1% or less.
b. Topography
The technique of flood water farming using water spreading bunds is very site-specific. The land must be sited close to a ephemeral stream or river or another watercourse, usually on a floodplain with alluvial soils and low slopes. This technique is most appropriate for arid areas where floodwater is the only realistic choice for crop or fodder production.
c. Catchment: Cultivated Area Ratio
The precise calculation of a catchment: cultivated area ratio is not practicable or necessary in the design of most water spreading bunds. The reasons are that the floodwater to be spread is not impounded. Major portion of flood water continues to flow through the system, and furthermore often only part of the stream flow is diverted to the productive area. Thus the quantity of water actually utilized cannot be easily predicted from the catchment size.
d. Bund Design
The land slope has a greater bearing on the design of the bund. Accordingly, its design for slope less than 0.5% and 0.5 to 1% is discussed here.
i) Slopes of less than 0.5%
Where slopes are less than 0.5%, straight bunds are used to spread water. Both ends are left open to allow floodwater to pass around the bunds, which are positioned at 50 m apart. Bunds should overlap in such a manner that the overflow around one should be intercepted by that below it. The uniform cross section of the bunds is recommended to be 60 cm high, 4.1 m base width, and a top width of 50 cm (Fig. 32. 13). This gives stable side slopes of 3:1. A maximum bund length of 100 m is recommended.
ii) Slopes of 0.5% to 1.0%
In this slope range, graded bunds can be used. Bunds, of constant cross-section, are graded along a ground slope of 0.25%. Each successive bund in the series down the slope is graded from different ends. A short wing wall is constructed at 135° to the upper end of each bund to allow interception of the flow around the bund above. This has the effect of further checking the flow. The spacing between bunds depends on the slope of the land. The bund cross section is the same as that recommended for contour bunds on lower slopes. The maximum length of a base bund is recommended to be 100 m.

Farm Power
236 www.AgriMoon.Com
Fig. 32.13.Bund dimensions.
(Source: http://www.fao.org/docrep/u3160e/u3160e07.htm)
32.8.3 Maintenance
As is the case in all water harvesting systems based on earth bunds, breaches are possible in the early stages of the first season, before consolidation has taken place. Thus, there must be planning for repair work whenever necessary and careful inspection after all runoff events. In subsequent seasons the risk of breaching is diminished, when the bunds have consolidated and been allowed to develop vegetation. The vegetation on bunds helps bind the soil together, and reduces direct rainfall damage to the structures. Nevertheless with systems which depend on floodwater, damaging floods will inevitably occur from time to time, and repairs may be needed at any stage.
32.8.4 Husbandry
Water spreading bunds are traditionally used for annual crops, and particularly cereals. Sorghum and millet are the most common. One particular feature of this system, when used in arid areas with erratic rainfall, is that sowing of the crop should be undertaken in response to flooding. The direct contribution by rainfall to growth is often very little. Seeds should be sown into residual moisture after a flood, which gives assurance of germination and early establishment. Further floods will bring the crop to maturity. However if the crop fails from lack of subsequent flooding or if it is buried by silt or sand, as sometimes happens, the cultivator should be prepared to replant. An opportunistic attitude is required. Because water spreading usually takes place on alluvial soils, soil fertility is rarely a constraint to crop production. Weed growth however tends to be more vigorous due to the favourable growing conditions, and thus early weeding is particularly important.
32.8.5 Socio-economic Factors
As the implementation of water spreading systems is a relatively large-scale exercise, consideration has to be given to community organization. One particular problem is that the site of the activity may be distant from the widely scattered homes of the beneficiaries.
A detailed comparison of earthwork and stonework required for various water harvesting systems is presented in Table 32.2.

Farm Power
237 www.AgriMoon.Com
Table 32.2. Earthwork/stonework for various water harvesting systems
(Source: http://www.fao.org/docrep/u3160e/u3160e07.htm)
→ System Name↓
Earthwork (m³/ha treated) Stonework (m3/ha treated)
Negarim micro-catchments (trees)
Contour bunds (trees)
Semi circular bunds (grass)
Contour ridges (crops)
Trapezoidal bunds (crops)
Water spreading bunds (crops)
Contour stone bunds (crops)
Permeable rock dams (crops)
Slope % (1) (2) (3) (4) (5) (8) (6) (7)
0.5 500 240 105 480 370 305 40 70
1.0 500 360 105 480 670 455 40 140
1.5 500 360 105 480 970 N/R* 40 208
2.0 500 360 210 480 N/R* N/R* 55 280
5.0 835 360 210 480 N/R* N/R* 55 N/R*
* Not recommended

******☺******
This Book Download From e-course of ICAR
Visit for Other Agriculture books, News,
Recruitment, Information, and Events at
www.agrimoon.com
Give FeedBack & Suggestion at [email protected]
Send a Massage for daily Update of Agriculture on WhatsApp
+91-7900 900 676
Disclaimer:
The information on this website does not warrant or assume any legal
liability or responsibility for the accuracy, completeness or usefulness of the
courseware contents.
The contents are provided free for noncommercial purpose such as teaching,
training, research, extension and self learning.
******☺******
Connect With Us: