residence time distribution in ideal reactors - uni · pdf fileresidence time distribution in...
TRANSCRIPT

Centre for Catalysis Research
Department of Chemical EngineeringUniversity of Cape Town • Rondebosch 7701
South Africa
Residence time distribution in ideal reactors
Linda H. CallananEric van Steen
1. Residence time2. When to determine RTD?3. How to determine RTD?4. Evaluation of RTD5. RTD of PFR/CSTR
Centre for Catalysis Research
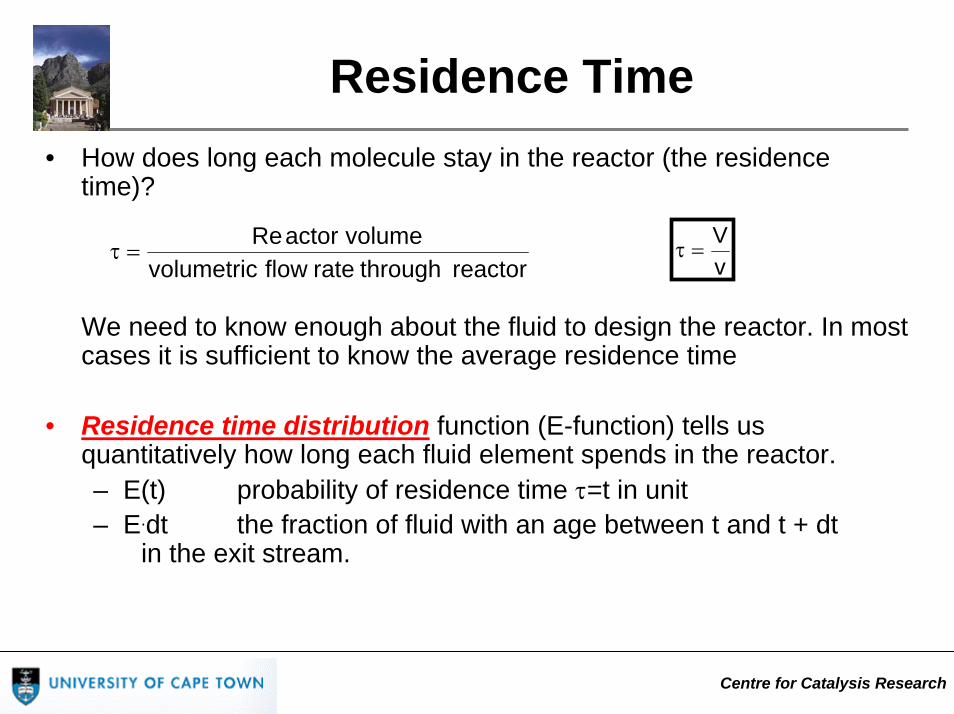
Residence Time• How does long each molecule stay in the reactor (the residence
time)?
We need to know enough about the fluid to design the reactor. In most cases it is sufficient to know the average residence time
• Residence time distribution function (E-function) tells us quantitatively how long each fluid element spends in the reactor.– E(t) probability of residence time τ=t in unit– E.dt the fraction of fluid with an age between t and t + dt
in the exit stream.
vV
=τreactor through rateflow volumetric
volume actorRe=τ
Centre for Catalysis Research
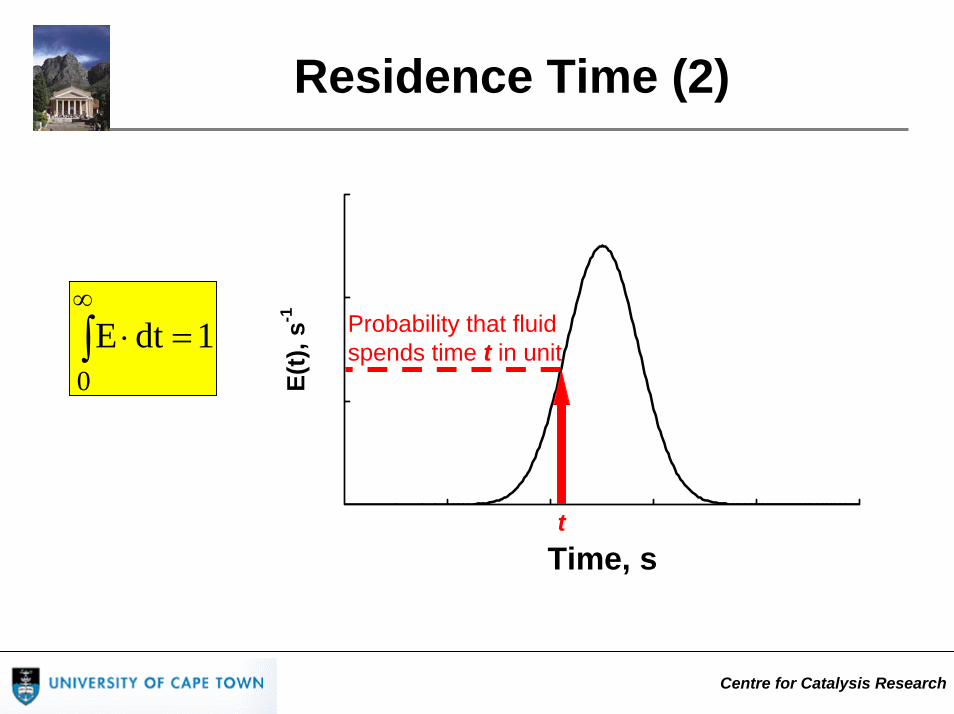
Residence Time (2)
Time, s
E(t),
s-1
t
Probability that fluidspends time t in unit1dtE
0=⋅∫
∞

Centre for Catalysis Research
When to determine RTD?
• Laboratory reactors:typically assumed to be idealsometimes deviations determined experimentally
• Pilot-scale reactorsTake into account non-ideality of real reactors in scale-up
• Demonstration unitsTake into account non-ideality of real reactors in scale-up
• Production unitsTest to investigate observed non-design behaviour of unit(s)

Centre for Catalysis Research
When to determine RTD?
• Basic reactor design Assume ideal flow behaviour (complete back mixing CSTRno back mixing PFR)
• Deviation from the ideal can be considerable.
• Causes of non-ideal flow:– Channelling – Recycling– Bypassing– Stagnant zones
O. Levenspiel, “Chemical Reaction Engineering,” 2nd Ed., John Wiley & Sons, 1972, pp 254

Centre for Catalysis Research
How to determine RTD?
• The RTD is determined by injecting a tracer into the feed stream of a reactor and measuring its concentration in the outlet stream.
• The tracer can take various forms, but must have certain properties:– Inert (Not allowed to react with other components in the reactor feed)– Easily measurable
• Examples of tracers include– Chemical molecules or atoms– Radioactive molecules– Energy (temperature)

Centre for Catalysis Research
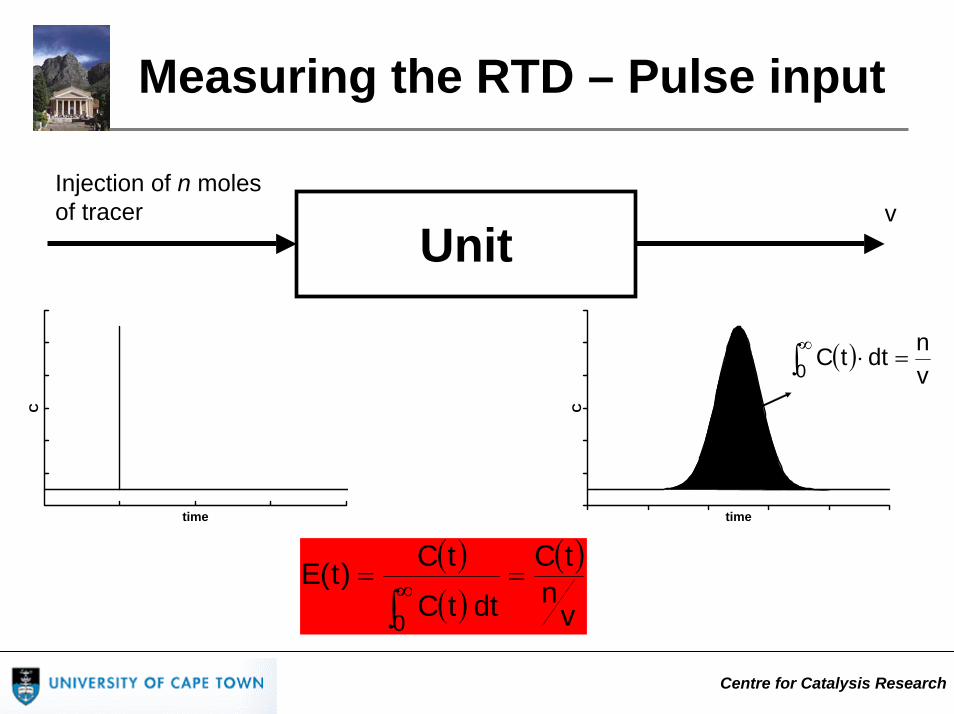
Measuring the RTD
•The are two methods for determining the residence time distribution :
•Pulse inputA finite amount of an inert tracer is injected at t=0 into a feed stream in a short period of time. The outlet concentration is measured as a function of time.
•Step inputThe concentration of the tracer is increased at t=0. The change in the concentration in the outlet is measured as a function of time
Centre for Catalysis Research
Measuring the RTD – Pulse input
Injection of n molesof tracer
Unitv
time
C
( )vndttC0 =⋅∫
∞
( )( )
( )
vn
tC
dttC
tC)t(E0
==∫∞
time
C

Centre for Catalysis Research
Measuring the RTD - step input
A constant amount of tracer is added to the feed stream.
–The F curve represents the fraction of fluid exiting the reactor that is younger than age t1:
( )⎩⎨⎧
≥<
=0t)ttancons(C0t0
tCo
0
( )0CtC)t(F =
step0C)t(C
dtd
dtdF)t(E ⎥
⎦
⎤⎢⎣
⎡==E curve is the differential of the F curve
The F curve0
0.5
1
0 10 20 30 40Time
F
Centre for Catalysis Research
Measuring the RTD
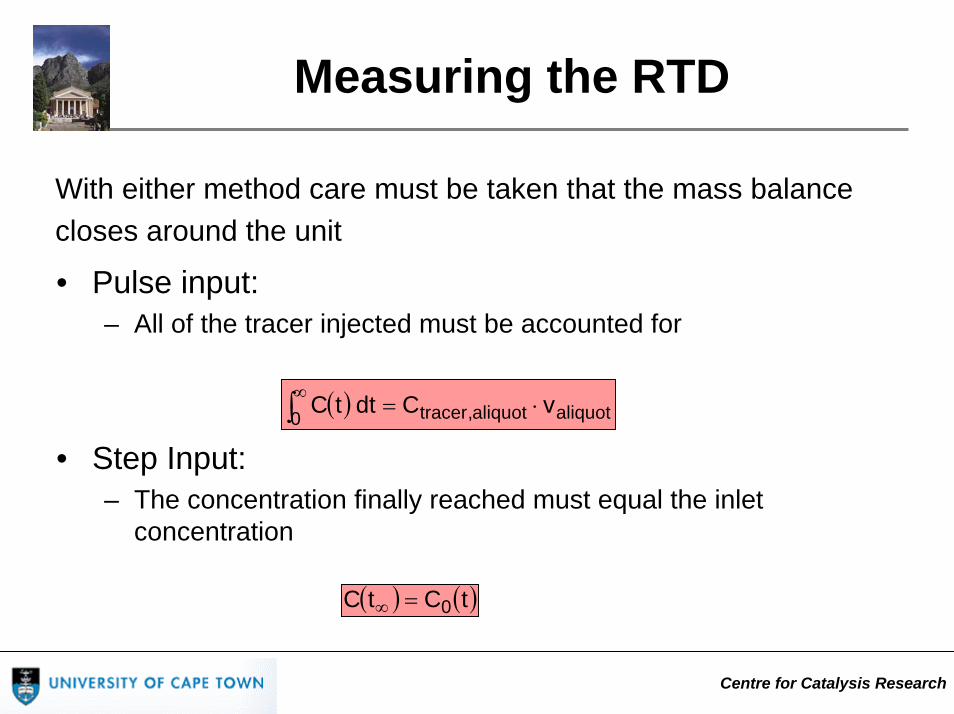
• Pulse input:– All of the tracer injected must be accounted for
• Step Input: – The concentration finally reached must equal the inlet
concentration
( ) ( )tCtC 0=∞
( ) aliquotaliquot,tracer0 vCdttC ⋅=∫∞
With either method care must be taken that the mass balance closes around the unit
Centre for Catalysis Research
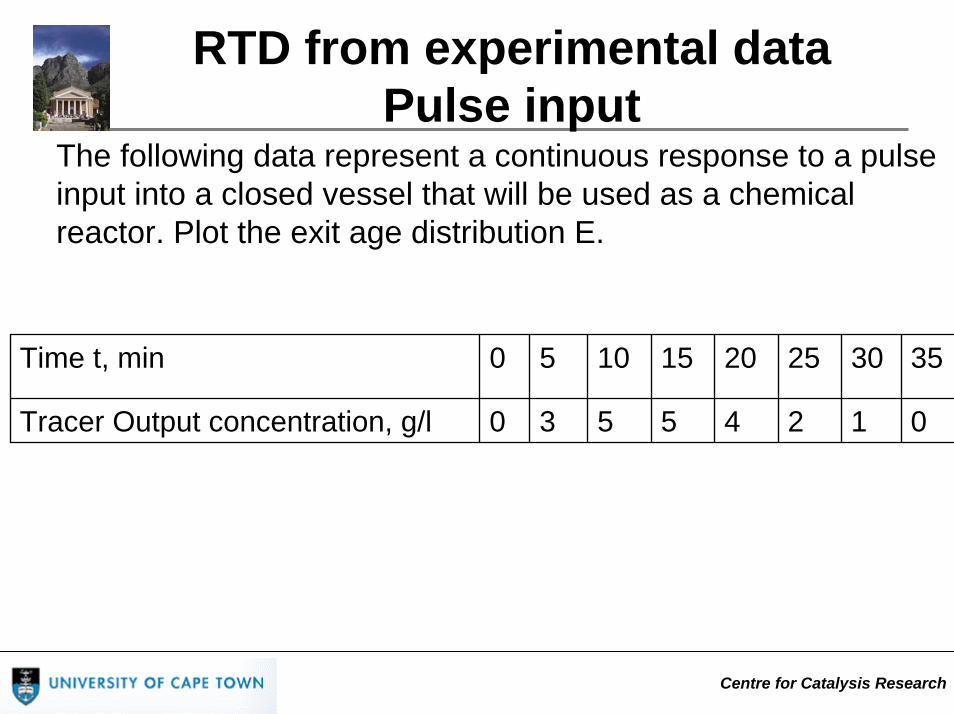
RTD from experimental dataPulse input
The following data represent a continuous response to a pulse input into a closed vessel that will be used as a chemical reactor. Plot the exit age distribution E.
Time t, min 0 5 10 15 20 25 30 35
Tracer Output concentration, g/l 0 3 5 5 4 2 1 0

Centre for Catalysis Research
Use trapezoidal rule to improve accuracy
Time t, min
Ctracer g/l Cavg ∆t Cavg * ∆t E Eavg Eavg * ∆t
0 0 1.5 5 7.5 0 0.015 0.0755 3 4 5 20 0.03 0.04 0.2
10 5 5 5 25 0.05 0.05 0.2515 5 4.5 5 22.5 0.05 0.045 0.22520 4 3 5 15 0.04 0.03 0.1525 2 1.5 5 7.5 0.02 0.015 0.07530 1 0.5 5 2.5 0.01 0.005 0.02535 0 0
Q: 100 Sum: 1
RTD from experimental dataPulse input
Check results by integrating E*dt

Centre for Catalysis Research
RTD from experimental dataPulse input
0
0.02
0.04
0.06
0 10 20 30 40
Time, min
E(t)

Centre for Catalysis Research
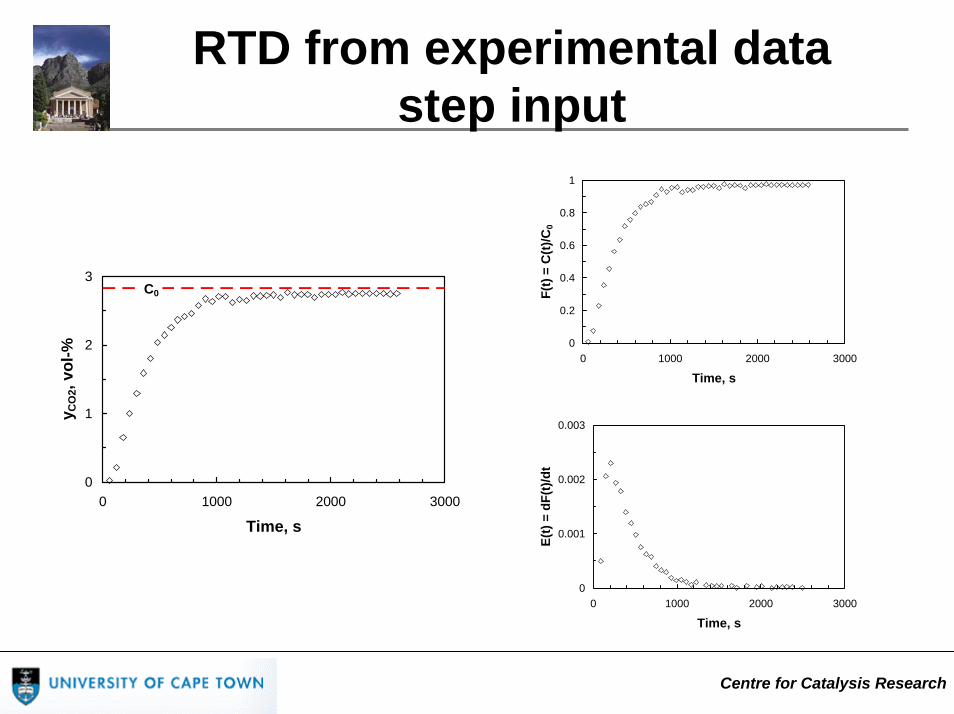
RTD from experimental datastep input
Berty reactor
Centre for Catalysis Research
RTD from experimental datastep input
0
0.2
0.4
0.6
0.8
1
0 1000 2000 3000
Time, s
F(t)
= C
(t)/C
0
0
1
2
3
0 1000 2000 3000
Time, s
y CO
2, vo
l-%
C0
0
0.001
0.002
0.003
0 1000 2000 3000
Time, s
E(t)
= dF
(t)/d
t
Centre for Catalysis Research
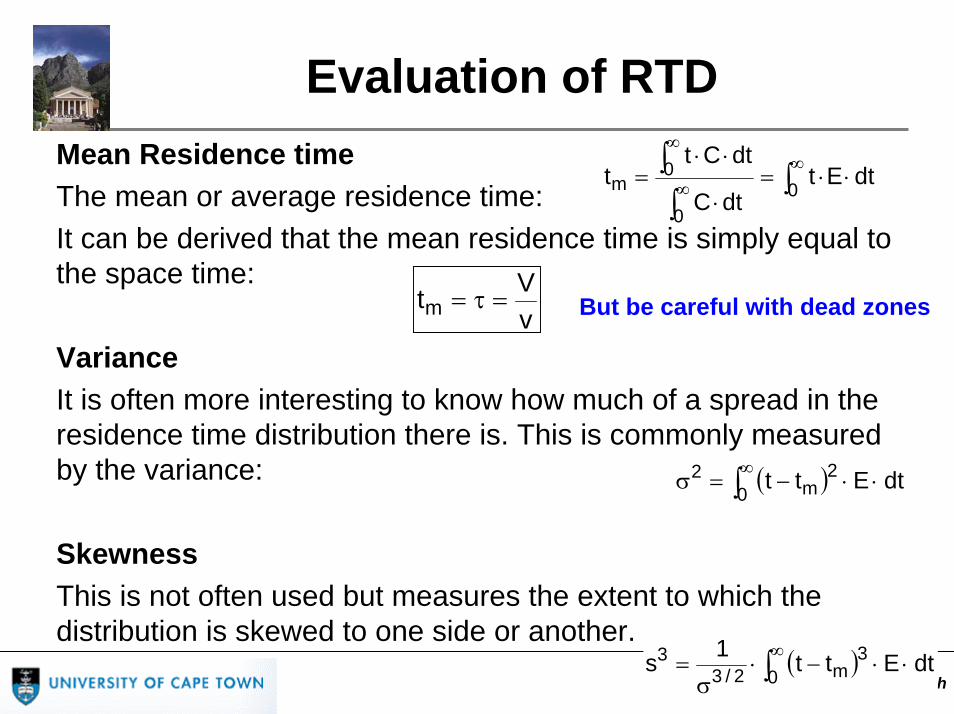
Evaluation of RTD
∫∫∫ ∞∞
∞
⋅⋅=⋅
⋅⋅= 0
0
0m dtEt
dtC
dtCtt
( )∫∞
⋅⋅−=σ 02
m2 dtEtt
Mean Residence timeThe mean or average residence time:It can be derived that the mean residence time is simply equal to the space time:
VarianceIt is often more interesting to know how much of a spread in theresidence time distribution there is. This is commonly measured by the variance:
SkewnessThis is not often used but measures the extent to which the distribution is skewed to one side or another.
vVtm =τ= But be careful with dead zones
( )∫∞
⋅⋅−⋅σ
= 03
m2/33 dtEtt1s

Centre for Catalysis Research
RTD in Ideal ReactorsPlug flow reactors (PFR)
For perfect plug flow, all molecules spend exactly the same amount of time in the reactor (simplest type of reactor to consider).
The residence time distribution follows a Dirac delta function:
( ) ( )
( )⎩⎨⎧
=∞≠
=δ
τ−δ=
0xwhen0xwhen0
x
ttE
O. Levenspiel, “Chemical Reaction Engineering,” 2nd Ed., John Wiley & Sons, 1972
Centre for Catalysis Research
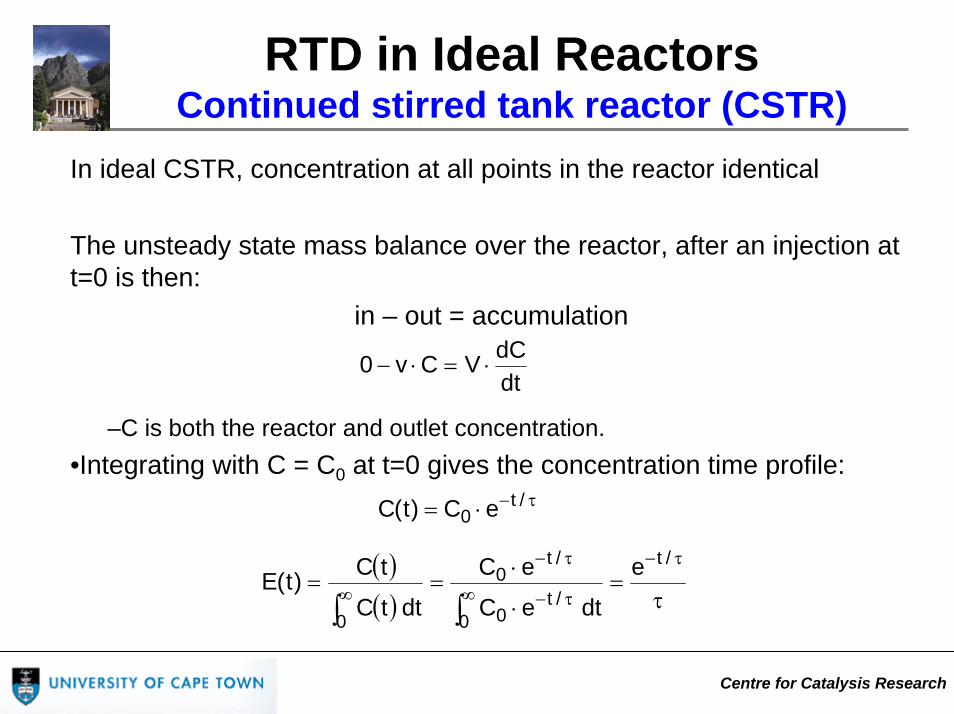
RTD in Ideal ReactorsContinued stirred tank reactor (CSTR)
In ideal CSTR, concentration at all points in the reactor identical
The unsteady state mass balance over the reactor, after an injection at t=0 is then:
in – out = accumulation
–C is both the reactor and outlet concentration.•Integrating with C = C0 at t=0 gives the concentration time profile:
dtdCVCv0 ⋅=⋅−
τ−⋅= /t0 eC)t(C
( )( ) τ
=⋅
⋅==
τ−
∞ τ−
τ−
∞∫∫
/t
0/t
0
/t0
0
e
dteC
eC
dttC
tC)t(E

Centre for Catalysis Research
RTD in Ideal ReactorsContinued stirred tank reactor (CSTR)
Characteristics of E-curve:Area 1Intercept: 1/τ
O. Levenspiel, “Chemical Reaction Engineering,” 2nd Ed., John Wiley & Sons, 1972,

Centre for Catalysis Research
RTD in Ideal ReactorsTank in series model
C0v0
C1v1
C2v2
C3v3
V1 V2 V3
A reactor can often be considered as a series of perfectly mixedzones (tanks) with the fluid moving from one zone to the next.
Typically, the zones are assumed to be equally sized
PFR can be viewed as an infinite number of CSTRs in series
Centre for Catalysis Research
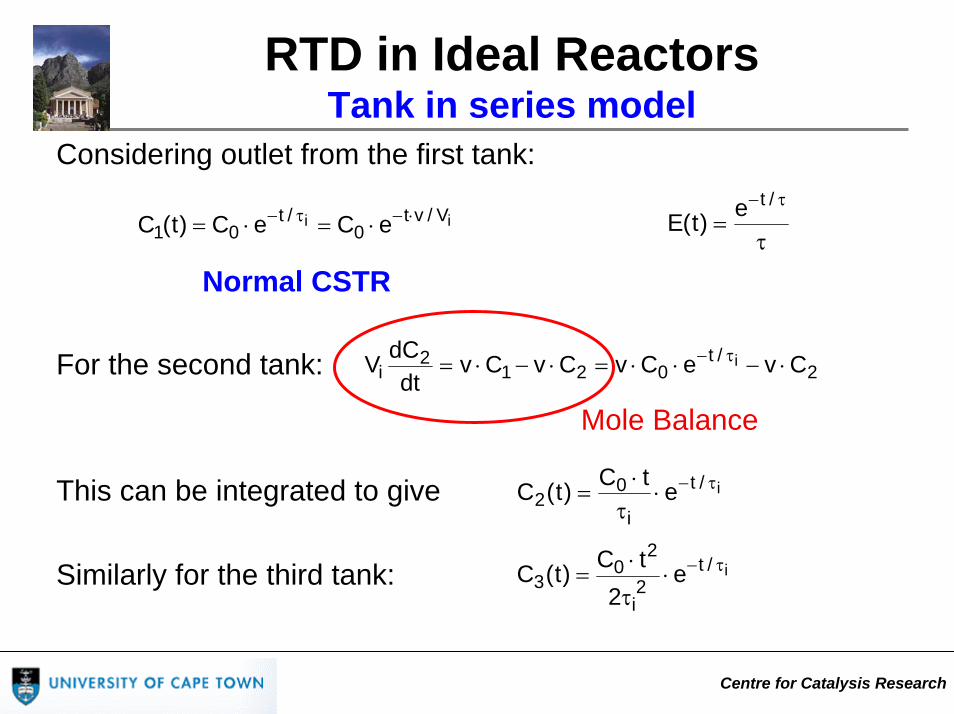
RTD in Ideal ReactorsTank in series model
Considering outlet from the first tank:
For the second tank:
This can be integrated to give
Similarly for the third tank:
ii V/vt0
/t01 eCeC)t(C ⋅−τ− ⋅=⋅=
τ=
τ− /te)t(E
Normal CSTR
2/t
0212
i CveCvCvCvdt
dCV i ⋅−⋅⋅=⋅−⋅= τ−
Mole Balance
i/t
i
02 etC)t(C τ−⋅
τ⋅
=
i/t2i
20
3 e2
tC)t(C τ−⋅τ
⋅=
Centre for Catalysis Research
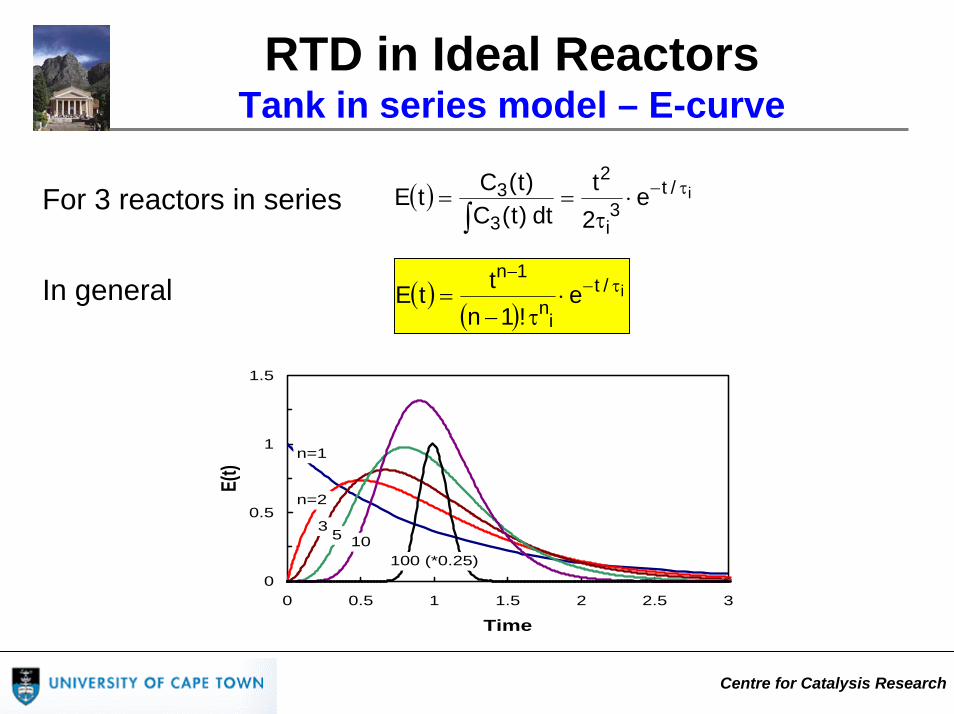
RTD in Ideal ReactorsTank in series model – E-curve
( ) i/t3i
2
3
3 e2t
dt)t(C)t(CtE τ−⋅
τ==
∫For 3 reactors in series
( )( )
i/t
in
1ne
!1nttE τ−−
⋅τ−
=In general
0
0.5
1
1.5
0 0.5 1 1.5 2 2.5 3
Time
E(t)
n=1
n=2
3 5 10100 (*0.25)
Centre for Catalysis Research
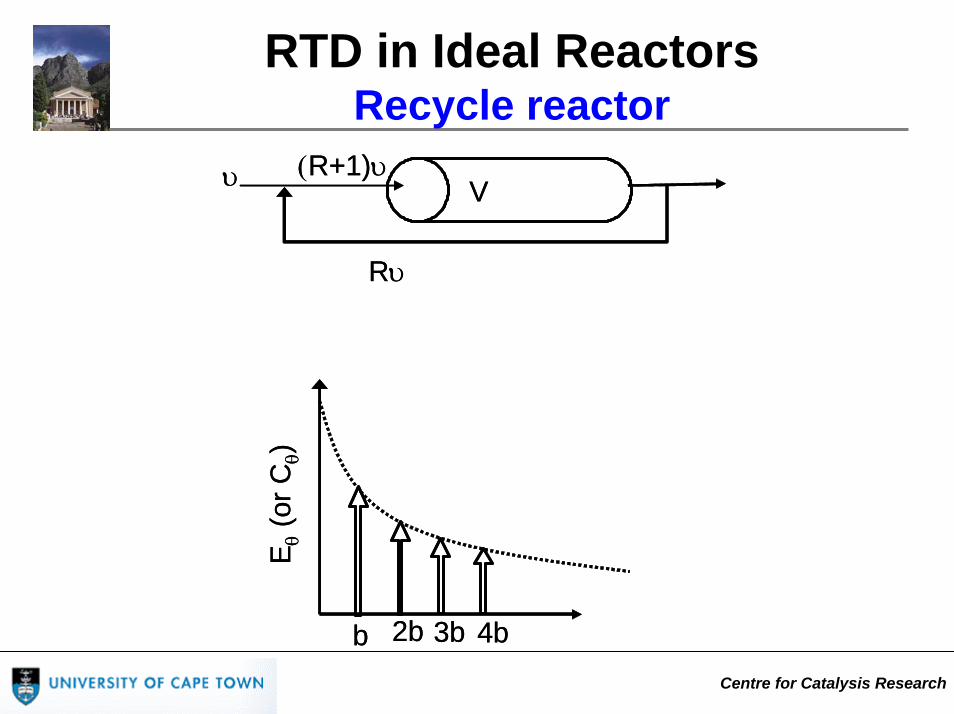
RTD in Ideal ReactorsRecycle reactor
E θ(o
r Cθ)
Rυ
(R+1)υυ V
b 2b 3b 4b
E θ(o
r Cθ)
Rυ
(R+1)υυ V
b 2b 3b 4b
Centre for Catalysis Research
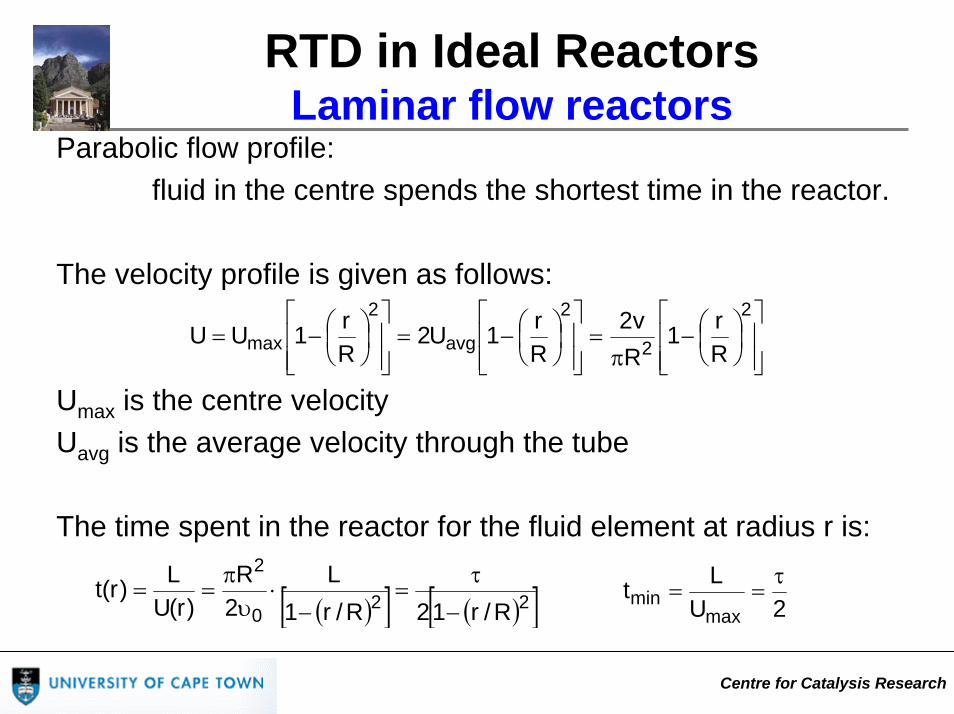
Parabolic flow profile: fluid in the centre spends the shortest time in the reactor.
The velocity profile is given as follows:
Umax is the centre velocityUavg is the average velocity through the tube
The time spent in the reactor for the fluid element at radius r is:
⎥⎥⎦
⎤
⎢⎢⎣
⎡⎟⎠⎞
⎜⎝⎛−
π=
⎥⎥⎦
⎤
⎢⎢⎣
⎡⎟⎠⎞
⎜⎝⎛−=
⎥⎥⎦
⎤
⎢⎢⎣
⎡⎟⎠⎞
⎜⎝⎛−=
2
2
2
avg
2
max Rr1
Rv2
Rr1U2
Rr1UU
( )[ ] ( )[ ]220
2
R/r12R/r1L
2R
)r(UL)r(t
−
τ=
−⋅
υπ
==2U
Ltmax
minτ
==
RTD in Ideal ReactorsLaminar flow reactors

Centre for Catalysis Research
RTD in Ideal ReactorsLaminar flow reactors
The fraction of fluid moving through the shell between r and (r + ∆r) is:
E-curve for laminar flow (see e.g. Fogler 13.4.3)
00 vdrr2)r(U
vdv π
=
⎪⎪⎩
⎪⎪⎨
⎧
τ≥
τ
τ<
=
2t
t2
2t0
)t(E
3
2E
(t)
τ2

Centre for Catalysis Research
Segregation Model Conversion from tracer information
Valid for linear processes: Each fluid element does not react with any other
Mixing occurs as late as possible (at the reactor exit)A number of flow patterns may give the same RTD curve.This is not a problem with linear processes, as all will give the same conversion.
⎟⎟⎟⎟⎟
⎠
⎞
⎜⎜⎜⎜⎜
⎝
⎛
+
⋅
⎟⎟⎟⎟⎟
⎠
⎞
⎜⎜⎜⎜⎜
⎝
⎛
+
=⎟⎟⎟
⎠
⎞
⎜⎜⎜
⎝
⎛
∑
dttandtbetween
ageofstreamexitoffraction
dttandtbetweenageof
elementinleftttanreacof.conc
streamexitinionconcentrat
mean
elementsexitAll
∫∞=
=0t element,AA dtECC [H. Scott Fogler, “Elements of
Chemical reaction Engineering” 4th
Ed., Prentice Hall, 2006]

Centre for Catalysis Research
Types of Reactions
Irreversible first order reaction:
Reversible first order reaction:
Successive first order reactions: A R P
These equations can then be solved if E is known.
tk0,Aelement,A
0,A
element,A eCCortkC
Cln ⋅−=⋅−=
∫∞=
⋅−= 0ttk
0,AA dtEeCC
[ ]∫∞=
⋅−+−= 0tX/tk
AeAe0,AA dtEeXX1CC Ae
[ ]∫∞=
⋅−⋅− −−⋅
= 0ttktk
12
10,AR dtEee
kkkC
C 21