residential parking provision in new...
TRANSCRIPT
Heading goes here
Sub-heading text goes here
Text page Style 1 body copy goes here.
Residential Parking Provision in New Developments Travel in London Research Report
MAYOR OF LONDON Transport for London
Transport for London

©Transport for London 2012
All rights reserved. Reproduction permitted for research, private study and internal circulation within an organisation. Extracts may be reproduced providing the source is acknowledged.
Disclaimer
This publication is intended to provide accurate information. However, TfL and the authors accept no liability or responsibility for any errors or omissions or for any damage or loss arising from use of the information provided.
Contents
Introduction .......................................................................................................................... 1
Executive Summary ............................................................................................................... 3
Chapter 1 Survey methodology and Sample characteristics .................................................. 8
Chapter 2 Car ownership and parking levels ....................................................................... 13
Chapter 3 What factors influence the choice to own a car? ................................................ 22
Chapter 4 How much are cars used? .................................................................................. 32
Chapter 5 Comparison between new developments and London....................................... 43
Chapter 6 Attitudes to car ownership, use and parking ...................................................... 51
Annex 1 Boroughs’ residential parking standards ............................................................. 65
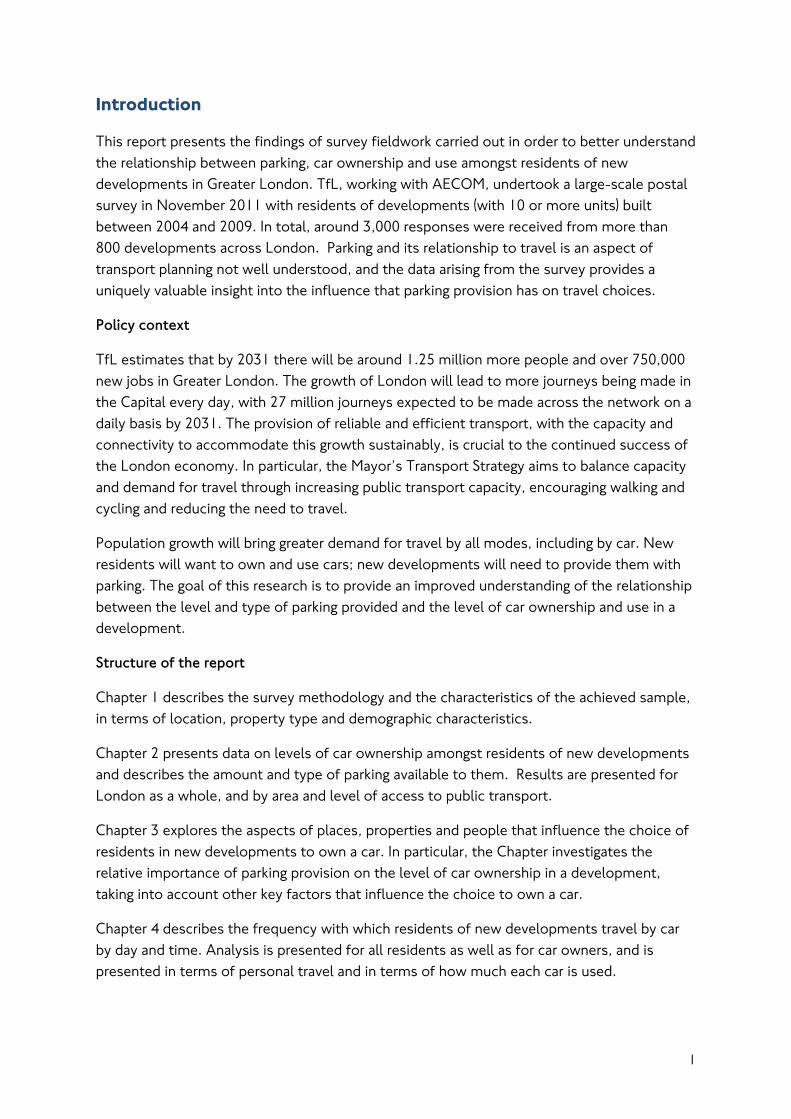
Introduction
This report presents the findings of survey fieldwork carried out in order to better understand the relationship between parking, car ownership and use amongst residents of new developments in Greater London. TfL, working with AECOM, undertook a large-scale postal survey in November 2011 with residents of developments (with 10 or more units) built between 2004 and 2009. In total, around 3,000 responses were received from more than 800 developments across London. Parking and its relationship to travel is an aspect of transport planning not well understood, and the data arising from the survey provides a uniquely valuable insight into the influence that parking provision has on travel choices.
Policy context
TfL estimates that by 2031 there will be around 1.25 million more people and over 750,000 new jobs in Greater London. The growth of London will lead to more journeys being made in the Capital every day, with 27 million journeys expected to be made across the network on a daily basis by 2031. The provision of reliable and efficient transport, with the capacity and connectivity to accommodate this growth sustainably, is crucial to the continued success of the London economy. In particular, the Mayor’s Transport Strategy aims to balance capacity and demand for travel through increasing public transport capacity, encouraging walking and cycling and reducing the need to travel.
Population growth will bring greater demand for travel by all modes, including by car. New residents will want to own and use cars; new developments will need to provide them with parking. The goal of this research is to provide an improved understanding of the relationship between the level and type of parking provided and the level of car ownership and use in a development.
Structure of the report
Chapter 1 describes the survey methodology and the characteristics of the achieved sample, in terms of location, property type and demographic characteristics.
Chapter 2 presents data on levels of car ownership amongst residents of new developments and describes the amount and type of parking available to them. Results are presented for London as a whole, and by area and level of access to public transport.
Chapter 3 explores the aspects of places, properties and people that influence the choice of residents in new developments to own a car. In particular, the Chapter investigates the relative importance of parking provision on the level of car ownership in a development, taking into account other key factors that influence the choice to own a car.
Chapter 4 describes the frequency with which residents of new developments travel by car by day and time. Analysis is presented for all residents as well as for car owners, and is presented in terms of personal travel and in terms of how much each car is used.
1
Chapter 5 compares the characteristics of residents of new developments, as identified in this survey, with the total London population, based upon data from TfL’s London Travel Demand Survey.
Finally, Chapter 6 describes the attitudes of respondents towards aspects of their home, local area and travel patterns. Topics covered include parking and travel by car, public transport, and active modes. The Chapter also describes what aspects of travel and accessibility respondents took into account when choosing where to live.
A table presenting parking standards as they currently apply to residential development in London’s boroughs is presented as Annex 1. The data was drawn from a desktop study of boroughs’ Local Development Frameworks and Unitary Development Plans. Note that these standards may not have been in place throughout the period under consideration (2004 to 2009).
2
Executive Summary
Purpose of the report
TfL estimates that by 2031 there will be around 1.25 million more people and over 750,000 new jobs in Greater London. The growth of London will lead to more journeys being made in the Capital every day, with 27 million journeys expected to be made across the network on a daily basis by 2031. The provision of reliable and efficient transport, with the capacity and connectivity to accommodate this growth sustainably, is crucial to the London economy. The Mayor’s Transport Strategy aims to balance capacity and demand through increasing public transport capacity, encouraging walking and cycling and reducing the need to travel.
Population growth will bring greater demand for travel by all modes, including by car. New residents will want to own and use cars; new developments will need to provide them with parking. The goal of this research is to provide an improved understanding of the relationship between the level and type of parking provided and the level of car ownership and use in a development.
Fieldwork summary
In order to better understand the relationship between parking, car ownership and use, TfL undertook a large-scale postal survey in November 2011 with residents of developments (with 10 or more units) built between 2004 and 2009. In total, around 3,000 responses were received from more than 800 developments across London. Two thirds of respondents were residents of Outer London, many living in areas with low access to public transport; one third were residents of Inner London and typically lived in areas with better public transport provision. The characteristics of the sample in terms of area and public transport access were representative of the distribution of the resident population in new developments.
Key findings
Residents of new developments were more likely to own a car than London residents as a whole and were also more likely to have access to off-street parking
Two thirds of residents of new developments have access to a car and car ownership is higher in Outer than Inner London (73 per cent and 52 per cent respectively). Across London, 72 per cent of vehicles owned by residents of new developments are parked off-street. The amount of parking provided is lower on average in developments with better public transport access and in developments containing flats, particularly conversions. However, parking provision is consistently higher in Outer than Inner London developments with the same level of public transport access or the same type of properties. Notably, residents of new developments were more likely to own a car than London residents as a whole and were also more likely to have access to off-street parking. This is particularly striking given that residents of new developments were more likely to live in a flat and less likely to live in a house than the general London population.
3
The average number of cars per household rises as public transport accessibility decreases. Developments in parts of Outer London with the best access to public transport have lower car ownership levels than parts of Inner London with the least public transport access.
A number of factors influence whether or not a household is likely to own a car. A regression analysis identified the key factors influencing car ownership to be tenure, housing type, household structure, working status, area and access to public transport, level of parking provision, and car club membership. In particular, car ownership rises where:
• Public transport accessibility decreases; or
• Household income rises; or
• The number of adults in the household increases and, in Outer London, where there are children in the household; or
• There are more home owners than renters, particularly those living in social housing.
Car ownership is also higher amongst those living in new-build houses than flats, and higher amongst those living in purpose-built flats than converted flats.
In every segment, and particularly in Inner London, there remains a group who choose not to own a car. Even in the highest income bracket (£100,000 or more), car ownership is only just over the London average, at 71 per cent. In parts of Outer London with the lowest access to public transport, 22 per cent of residents of new developments live without a car and 14 per cent of two-parent families with children in Outer London don’t have a car.
For all groups, and in all areas, people living in developments with more parking available had higher levels of car ownership than people living in developments with less parking.
Figure E1 overleaf shows the relationship between parking provision, car ownership and other key factors influencing the choice to own a car. This survey found a strong relationship between the level of parking provision and car ownership. Households living in developments with up to 0.5 parking spaces per unit are significantly less likely to own a car than those living in developments with more than 0.5 spaces per unit. For all groups, and in all areas, people living in developments with more parking available had higher levels of car ownership than people living in developments with less parking. For example, income is a key determinant of car ownership. Nevertheless, 83 per cent of people with a high income in developments with over 0.5 spaces per unit have a car compared to 56 per cent of the same income group with less parking available.
4
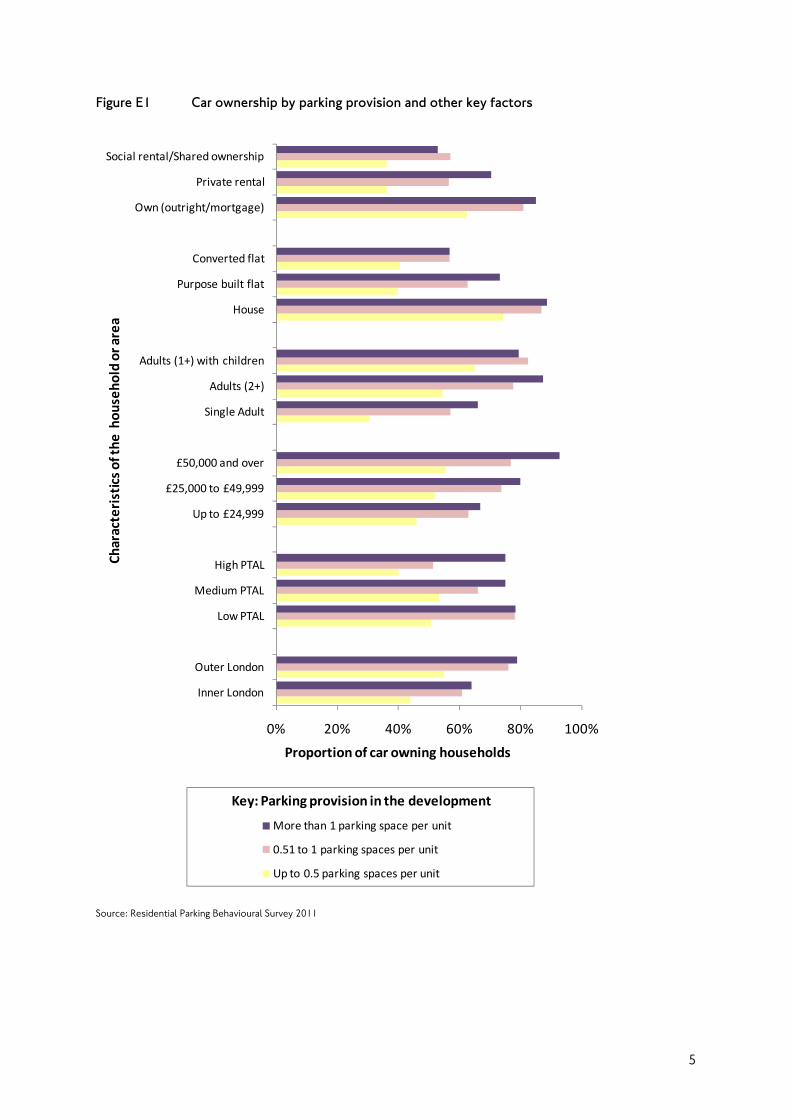
Figure E1 Car ownership by parking provision and other key factors
0% 20% 40% 60% 80% 100%
Inner London
Outer London
Low PTAL
Medium PTAL
High PTAL
Up to £24,999
£25,000 to £49,999
£50,000 and over
Single Adult
Adults (2+)
Adults (1+) with children
House
Purpose built flat
Converted flat
Own (outright/mortgage)
Private rental
Social rental/Shared ownership
Proportion of car owning households
More than 1 parking space per unit
0.51 to 1 parking spaces per unit
Up to 0.5 parking spaces per unit
Characteristicsof th
e hou
seho
ld or area
Key: Parking provision in the development
Source: Residential Parking Behavioural Survey 2011
5

People choose a home that meets their needs; there is a close relationship between the importance attached to parking and satisfaction with the quality of parking in the local area.
The availability of parking is a factor in many people’s decision on where to live, alongside access to public transport, distance travelled to work and access to local shops, facilities and services. Parking availability is more important to Outer Londoners than Inner Londoners and, as would be expected, more important to car owners. Outer London residents are more satisfied with the availability of on- and off-street parking for residents and visitors where they live, with a third of Inner London residents considering the availability of off-street parking in their area to be very poor. In general, there was a close relationship between the importance attached to aspects of parking and satisfaction, with residents having selected a home and area that could meet their needs.
People who have cars use them: in both Inner and Outer London, car owners use their cars frequently at all times of day, including during the busiest peak periods.
Across London, 74 per cent of car owners make a car (as driver) journey at least once a week. In general, the relationship between area, public transport access and frequency of car travel amongst car owners is weak, although it is evident that car owners in Outer London are more likely to travel by car (as driver) five days week or more than car owners in Inner London.
Car owners use their cars at all times of day including the weekday peak. A quarter of Inner London car owners use their cars five or more times a week during the weekday peak and 44 per cent use their car at least once a week at this time. In Outer London, two thirds of car owners use their car at least once week including one third who use their car at least five times a week at this time. Around two thirds of car owners use their car every weekend, and most use their car at least one weekend in two.
Overall, developments with more parking contain more car owners and generate more car journeys than developments with less parking provided
The frequency of travel by car (as driver) amongst car owners is essentially unaffected by the level of parking provided – three quarters of car owners travel by car (as driver) at least once a week regardless of the level of parking provision in their development. This is despite the fact that developments with low parking provision tend to be in Inner London and in locations with the highest public transport accessibility.
However, the frequency of travel by car for all residents of new developments (including car owners and those without a car) increases as the level of parking provided rises. In developments with less than 0.5 spaces per unit, 58 per cent of respondents had travelled by car in the previous year, compared to 76 per cent of those living in developments with more than 1 parking
6
It is clear from this evidence that developments with more parking produce more car travel than developments with less parking, even where the development is similar in other aspects, for example in terms of the characteristics of residents and the local area.
Conclusion
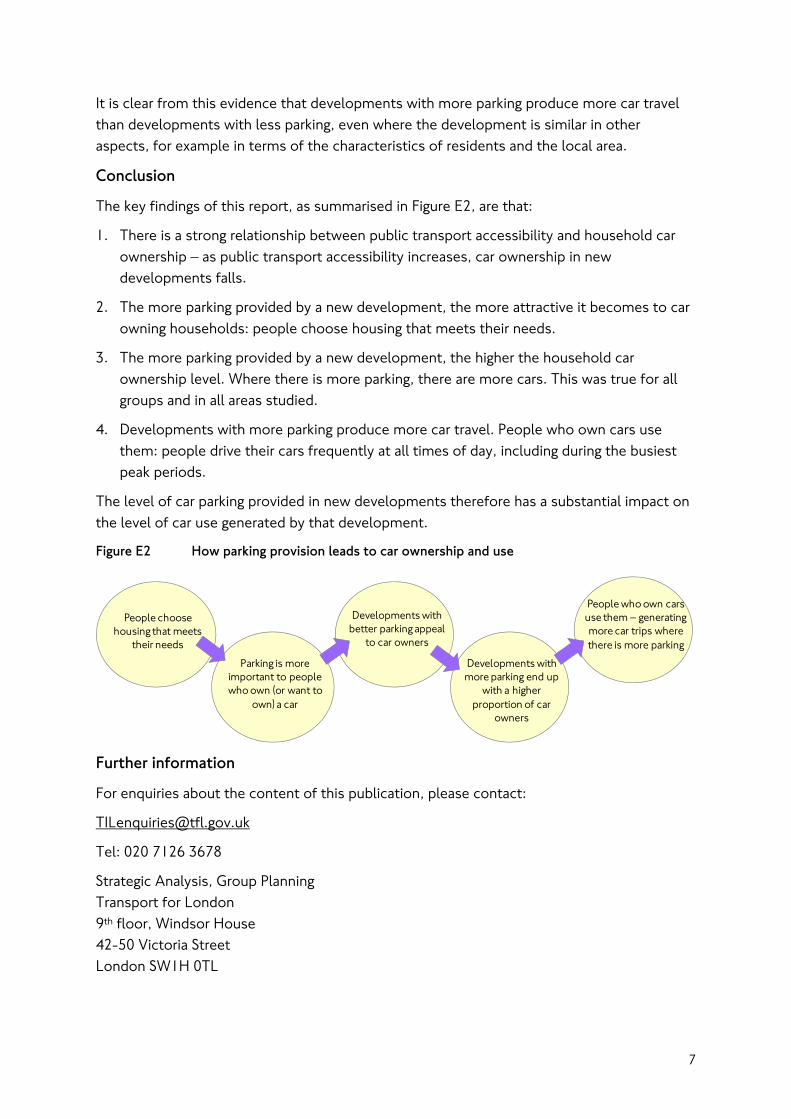
The key findings of this report, as summarised in Figure E2, are that:
1. There is a strong relationship between public transport accessibility and household car ownership – as public transport accessibility increases, car ownership in new developments falls.
2. The more parking provided by a new development, the more attractive it becomes to car owning households: people choose housing that meets their needs.
3. The more parking provided by a new development, the higher the household car ownership level. Where there is more parking, there are more cars. This was true for all groups and in all areas studied.
4. Developments with more parking produce more car travel. People who own cars use them: people drive their cars frequently at all times of day, including during the busiest peak periods.
The level of car parking provided in new developments therefore has a substantial impact on the level of car use generated by that development.
Figure E2 How parking provision leads to car ownership and use
Parking is more important to people who own (or want to
own) a car
People choose housing that meets
their needs
Developments with more parking end up
with a higher proportion of car
owners
Developments with better parking appeal
to car owners
People who own cars use them – generating more car trips where there is more parking
Further information
For enquiries about the content of this publication, please contact:
Tel: 020 7126 3678
Strategic Analysis, Group Planning Transport for London 9th floor, Windsor House 42-50 Victoria Street London SW1H 0TL
7
Chapter 1 Survey methodology and Sample characteristics
Introduction
This Section describes the survey methodology and the characteristics of the achieved sample, in terms of location, property type and demographic characteristics. There is very limited information available outside of this survey about the characteristics of the population living in new developments; this limits the extent to which comparisons can be made between the achieved sample and the population from which it is drawn. Nevertheless, where possible, comparisons have been made, in particular between the distribution of the sample by area and access to public transport.
Survey methodology
A travel behavioural survey of residents living in new developments in London was undertaken by AECOM on behalf of TfL in November 2011. The survey was conducted using a self completion questionnaire and respondents had the option to mail back the paper version using the freepost envelope provided or fill in the survey online. The survey was sent to 30,000 residents in developments with 10 or more units built in London in the period between 2004 and 2009.
The sample was stratified by location (Inner/Outer London) and public transport access using the Public Transport Accessibility Level (PTAL). Three levels of access to public transport were used: ‘Low’ for PTAL 1a, 1b and 2, ‘Medium’ for PTAL 3 and 4 and ‘High’ for PTAL 5, 6a and 6b.
Overall 3,022 responses were received from 839 developments across London giving a response rate of 10 per cent, which is typical of surveys of this type. The map in Figure 1.1 shows the distribution of respondents across London.
8
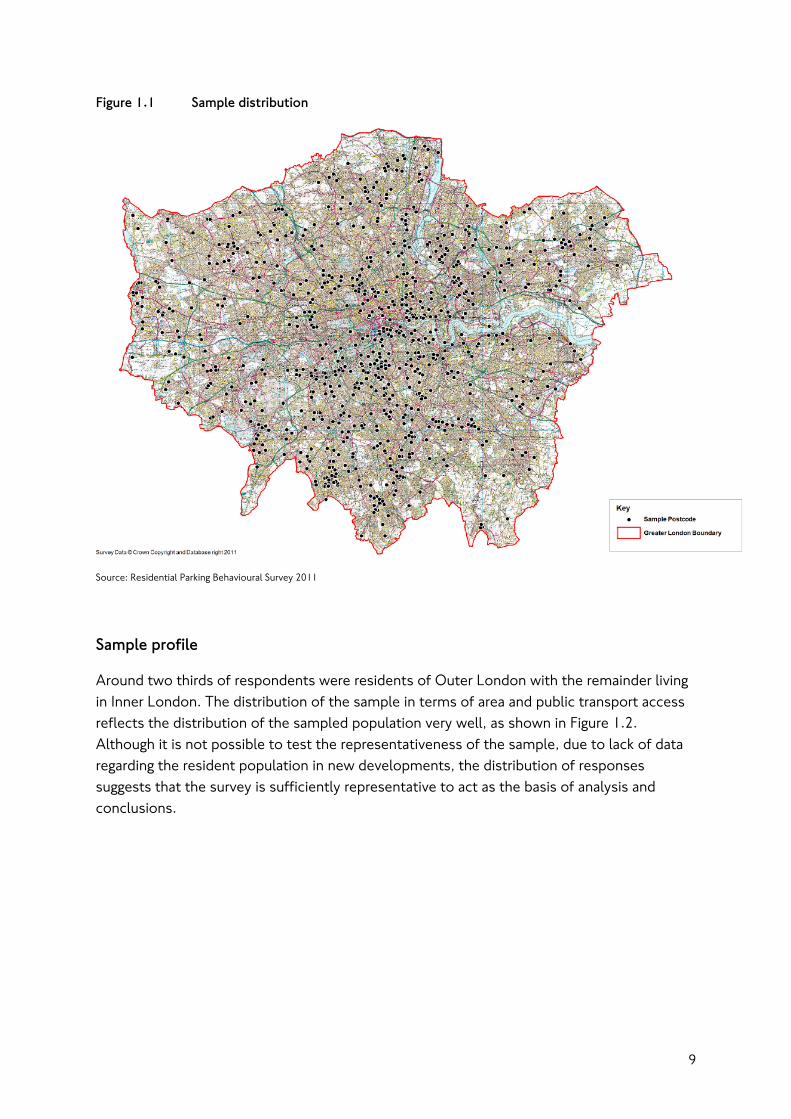
Figure 1.1 Sample distribution
Source: Residential Parking Behavioural Survey 2011
Sample profile
Around two thirds of respondents were residents of Outer London with the remainder living in Inner London. The distribution of the sample in terms of area and public transport access reflects the distribution of the sampled population very well, as shown in Figure 1.2. Although it is not possible to test the representativeness of the sample, due to lack of data regarding the resident population in new developments, the distribution of responses suggests that the survey is sufficiently representative to act as the basis of analysis and conclusions.
9
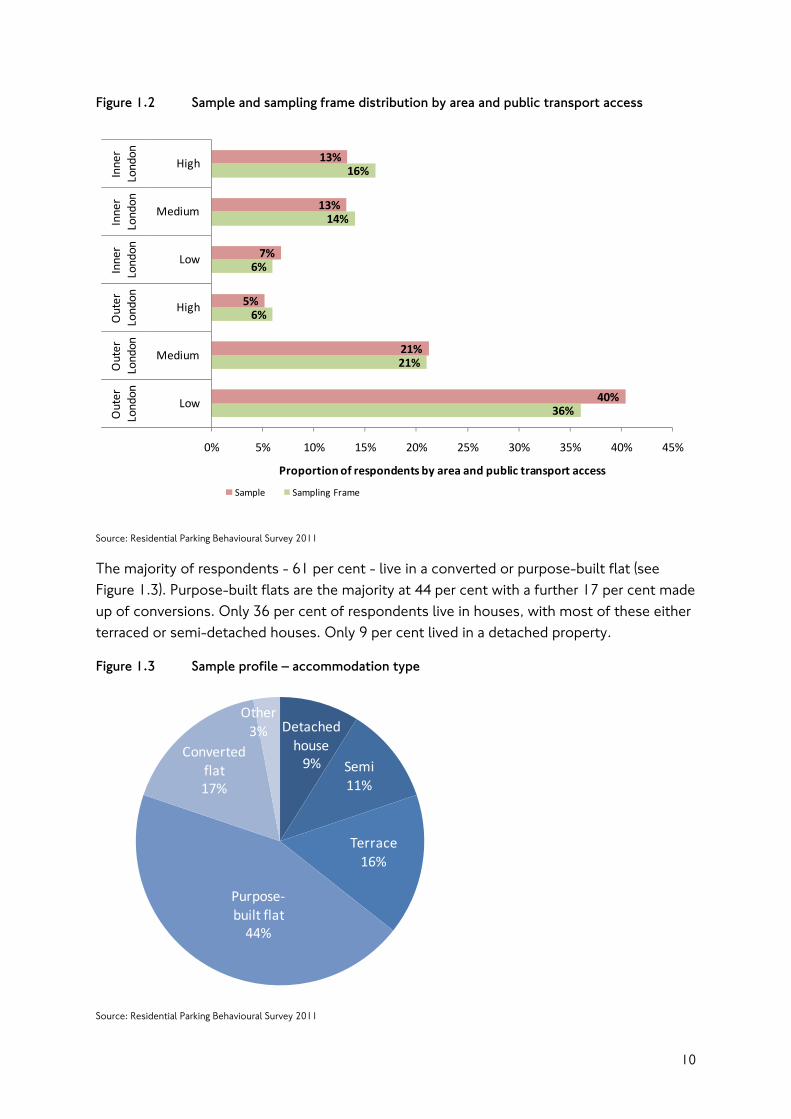
Figure 1.2 Sample and sampling frame distribution by area and public transport access
36%
21%
6%
6%
14%
16%
40%
21%
5%
7%
13%
13%
0% 5% 10% 15% 20% 25% 30% 35% 40% 45%
Low
Medium
High
Low
Medium
High
Outer
London
Outer
London
Outer
London
Inner
London
Inner
London
Inner
London
Proportion of respondents by area and public transport access
Sample Sampling Frame
Source: Residential Parking Behavioural Survey 2011
The majority of respondents - 61 per cent - live in a converted or purpose-built flat (see Figure 1.3). Purpose-built flats are the majority at 44 per cent with a further 17 per cent made up of conversions. Only 36 per cent of respondents live in houses, with most of these either terraced or semi-detached houses. Only 9 per cent lived in a detached property.
Figure 1.3 Sample profile – accommodation type
Detached house9% Semi
11%
Terrace16%
Purpose‐built flat44%
Converted flat17%
Other3%
Source: Residential Parking Behavioural Survey 2011
10
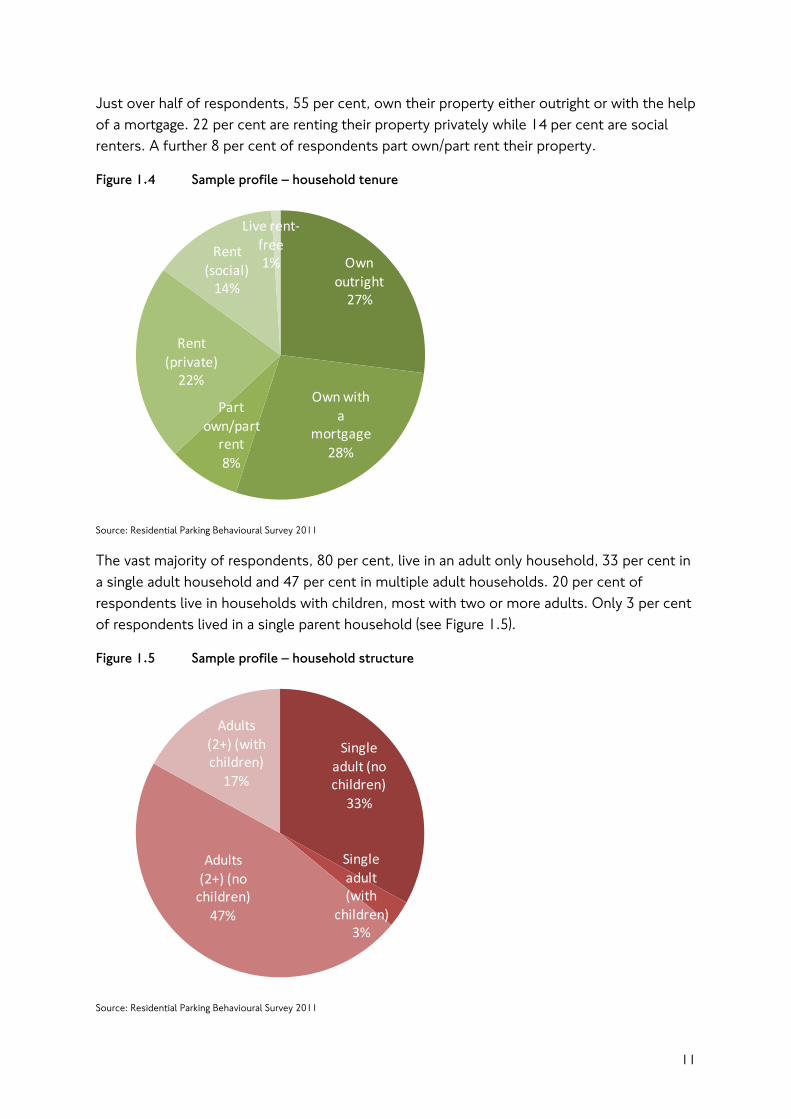
Just over half of respondents, 55 per cent, own their property either outright or with the help of a mortgage. 22 per cent are renting their property privately while 14 per cent are social renters. A further 8 per cent of respondents part own/part rent their property.
Figure 1.4 Sample profile – household tenure
Own outright27%
Own with a
mortgage28%
Part own/part rent8%
Rent (private)22%
Rent (social)14%
Live rent‐free1%
Source: Residential Parking Behavioural Survey 2011
The vast majority of respondents, 80 per cent, live in an adult only household, 33 per cent in a single adult household and 47 per cent in multiple adult households. 20 per cent of respondents live in households with children, most with two or more adults. Only 3 per cent of respondents lived in a single parent household (see Figure 1.5).
Figure 1.5 Sample profile – household structure
Single adult (no children)33%
Single adult (with
children)3%
Adults (2+) (no children)47%
Adults (2+) (with children)17%
Source: Residential Parking Behavioural Survey 2011
11
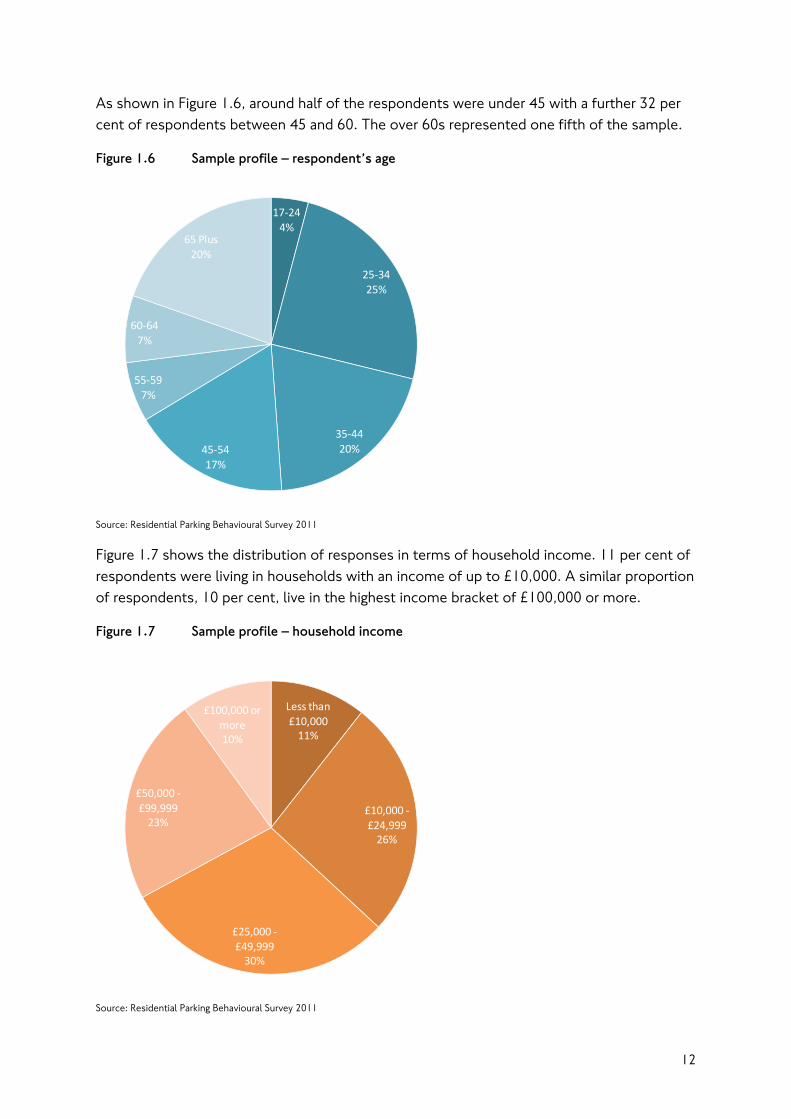
As shown in Figure 1.6, around half of the respondents were under 45 with a further 32 per cent of respondents between 45 and 60. The over 60s represented one fifth of the sample.
Figure 1.6 Sample profile – respondent’s age
17‐244%
25‐3425%
35‐4420%45‐54
17%
55‐597%
60‐647%
65 Plus20%
Source: Residential Parking Behavioural Survey 2011
Figure 1.7 shows the distribution of responses in terms of household income. 11 per cent of respondents were living in households with an income of up to £10,000. A similar proportion of respondents, 10 per cent, live in the highest income bracket of £100,000 or more.
Figure 1.7 Sample profile – household income
Less than £10,00011%
£10,000 ‐£24,99926%
£25,000 ‐£49,99930%
£50,000 ‐£99,99923%
£100,000 or more10%
Source: Residential Parking Behavioural Survey 2011
12
Chapter 2 Car ownership and parking levels
Introduction
This Section presents data on levels of car ownership amongst residents of new developments and describes the amount and type of parking available to them. Results are presented for London as a whole, and by area and level of access to public transport. Comparisons are also made between the parking availability in different types of housing. Key findings
Car ownership
• Two thirds of residents of new developments in London have access to a car, including 19 per cent who have two or more cars. Car ownership is higher in Outer than Inner London (73 and 52 per cent respectively).
Parking provision
• Just over a fifth of respondents lived in developments with less than 0.5 parking spaces per unit, 45 per cent in developments with between 0.51 and 1 space per unit and the remaining third in developments with more than 1 space per unit.
• The amount of parking provided is lower on average in developments with better public transport access and in developments containing flats, particularly conversions. However, parking provision is consistently higher in Outer London than Inner London developments with the same level of public transport access or the same type of properties.
• Across London, 72 per cent of vehicles owned by residents of new developments are parked off-street. A higher proportion of vehicles in Outer London than Inner London are parked off-street (77 per cent compared to 56 per cent). The proportion of vehicles parked off-street is highest in parts of Outer London with the lowest public transport access.
• In Inner London, people living in purpose-built flats are more likely to park off-street (61 per cent) than residents of converted flats (51 per cent) or houses (52 per cent).
• In Outer London, residents of all property types are more likely to be able to park off-street. Residents of purpose-built flats and houses are more likely to be able to park off-street than residents of converted flats (82 per cent and 80 per cent respectively compared to 68 per cent).
13
Car ownership levels
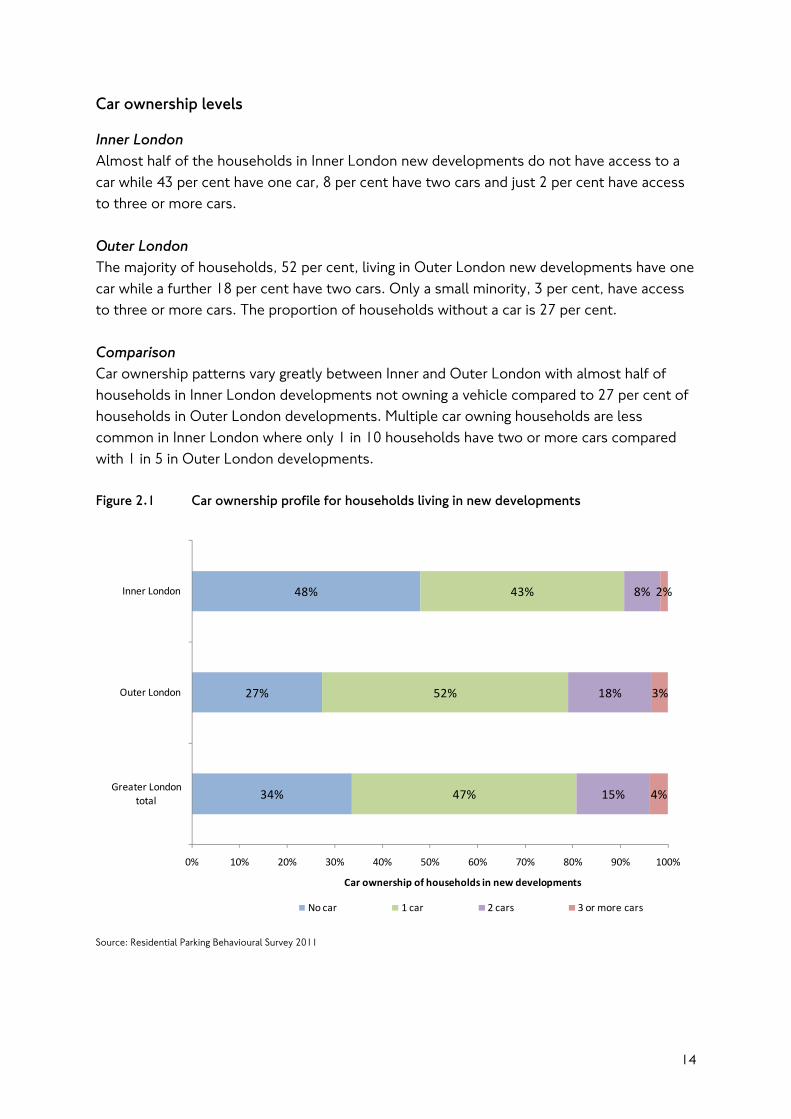
Inner London Almost half of the households in Inner London new developments do not have access to a car while 43 per cent have one car, 8 per cent have two cars and just 2 per cent have access to three or more cars. Outer London The majority of households, 52 per cent, living in Outer London new developments have one car while a further 18 per cent have two cars. Only a small minority, 3 per cent, have access to three or more cars. The proportion of households without a car is 27 per cent. Comparison Car ownership patterns vary greatly between Inner and Outer London with almost half of households in Inner London developments not owning a vehicle compared to 27 per cent of households in Outer London developments. Multiple car owning households are less common in Inner London where only 1 in 10 households have two or more cars compared with 1 in 5 in Outer London developments. Figure 2.1 Car ownership profile for households living in new developments
34%
27%
48%
47%
52%
43%
15%
18%
8%
4%
3%
2%
0% 10% 20% 30% 40% 50% 60% 70% 80% 90% 100%
Greater London total
Outer London
Inner London
Car ownership of households in new developments
No car 1 car 2 cars 3 or more cars Source: Residential Parking Behavioural Survey 2011
14
Level of parking provision
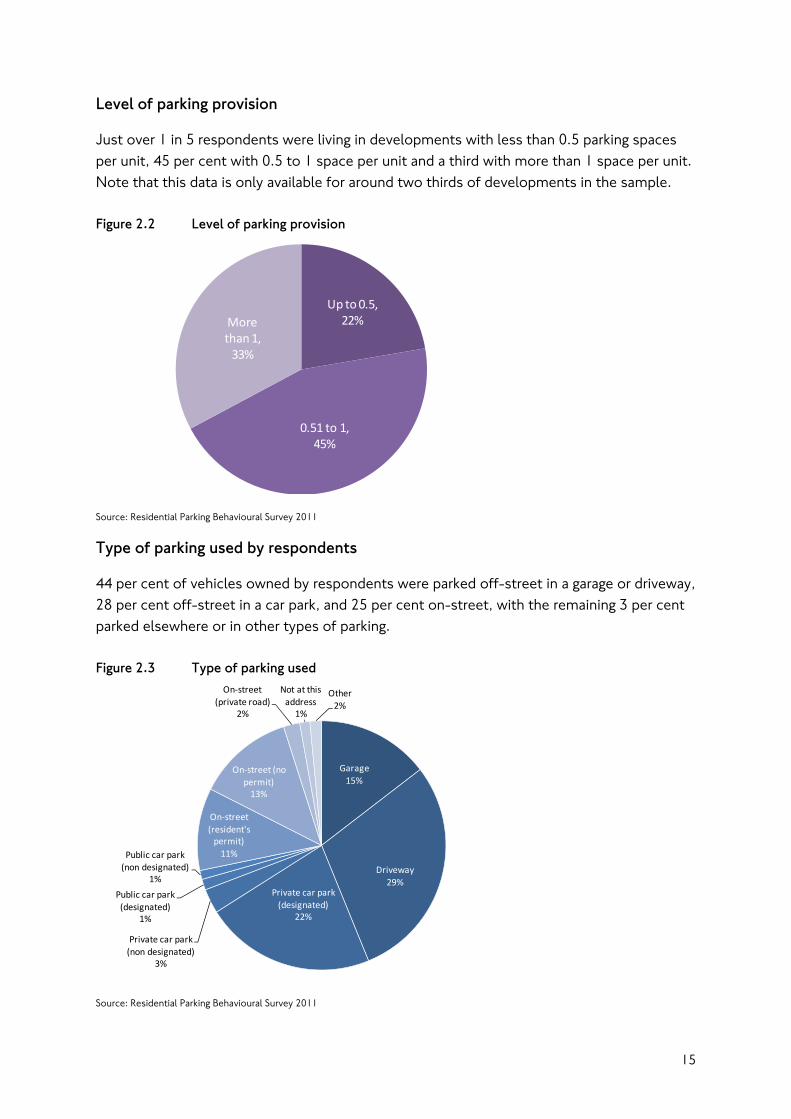
Just over 1 in 5 respondents were living in developments with less than 0.5 parking spaces per unit, 45 per cent with 0.5 to 1 space per unit and a third with more than 1 space per unit. Note that this data is only available for around two thirds of developments in the sample. Figure 2.2 Level of parking provision
Up to 0.5, 22%
0.51 to 1, 45%
More than 1, 33%
Source: Residential Parking Behavioural Survey 2011
Type of parking used by respondents
44 per cent of vehicles owned by respondents were parked off-street in a garage or driveway, 28 per cent off-street in a car park, and 25 per cent on-street, with the remaining 3 per cent parked elsewhere or in other types of parking. Figure 2.3 Type of parking used
Garage15%
Driveway29%
Private car park (designated)
22%
Private car park (non designated)
3%
Public car park (designated)
1%
Public car park (non designated)
1%
On‐street (resident's permit)11%
On‐street (no permit)13%
On‐street (private road)
2%
Not at this address1%
Other2%
Source: Residential Parking Behavioural Survey 2011
15
Parking provision by area and access to public transport
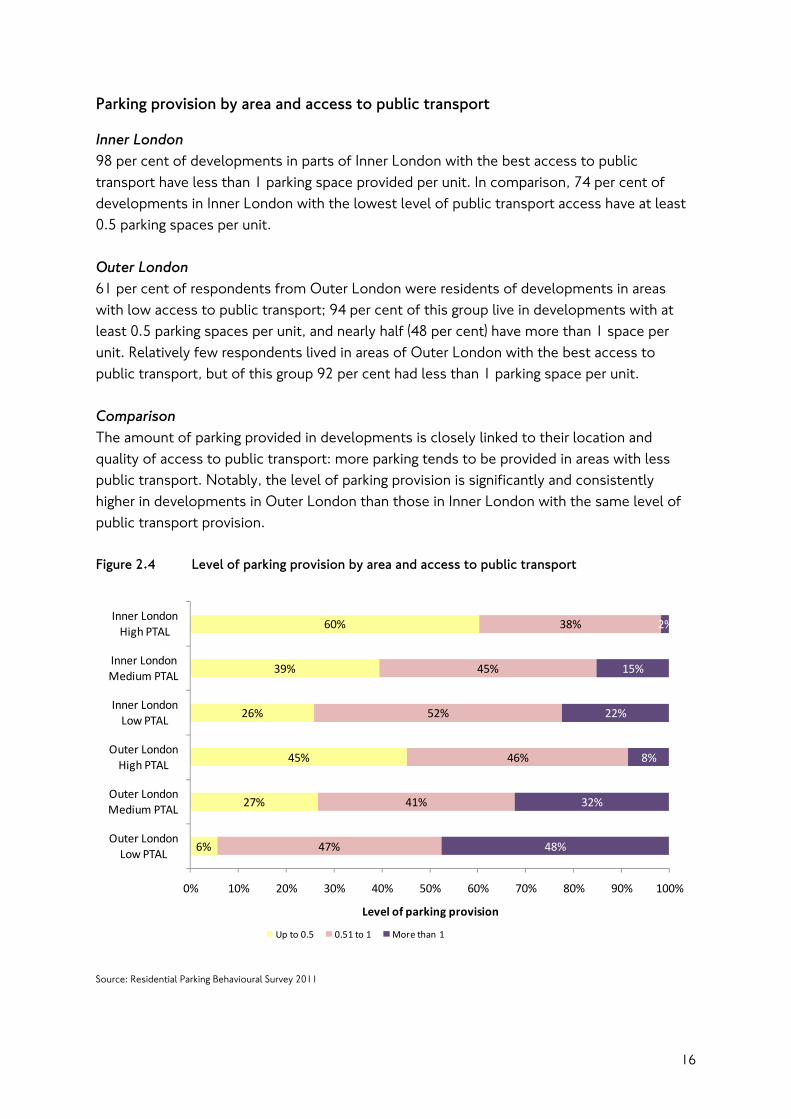
Inner London 98 per cent of developments in parts of Inner London with the best access to public transport have less than 1 parking space provided per unit. In comparison, 74 per cent of developments in Inner London with the lowest level of public transport access have at least 0.5 parking spaces per unit. Outer London 61 per cent of respondents from Outer London were residents of developments in areas with low access to public transport; 94 per cent of this group live in developments with at least 0.5 parking spaces per unit, and nearly half (48 per cent) have more than 1 space per unit. Relatively few respondents lived in areas of Outer London with the best access to public transport, but of this group 92 per cent had less than 1 parking space per unit. Comparison The amount of parking provided in developments is closely linked to their location and quality of access to public transport: more parking tends to be provided in areas with less public transport. Notably, the level of parking provision is significantly and consistently higher in developments in Outer London than those in Inner London with the same level of public transport provision. Figure 2.4 Level of parking provision by area and access to public transport
6%
27%
45%
26%
39%
60%
47%
41%
46%
52%
45%
38%
48%
32%
8%
22%
15%
2%
0% 10% 20% 30% 40% 50% 60% 70% 80% 90% 100%
Outer LondonLow PTAL
Outer LondonMedium PTAL
Outer LondonHigh PTAL
Inner LondonLow PTAL
Inner LondonMedium PTAL
Inner LondonHigh PTAL
Level of parking provision
Up to 0.5 0.51 to 1 More than 1
Source: Residential Parking Behavioural Survey 2011
16
Parking provision by housing type
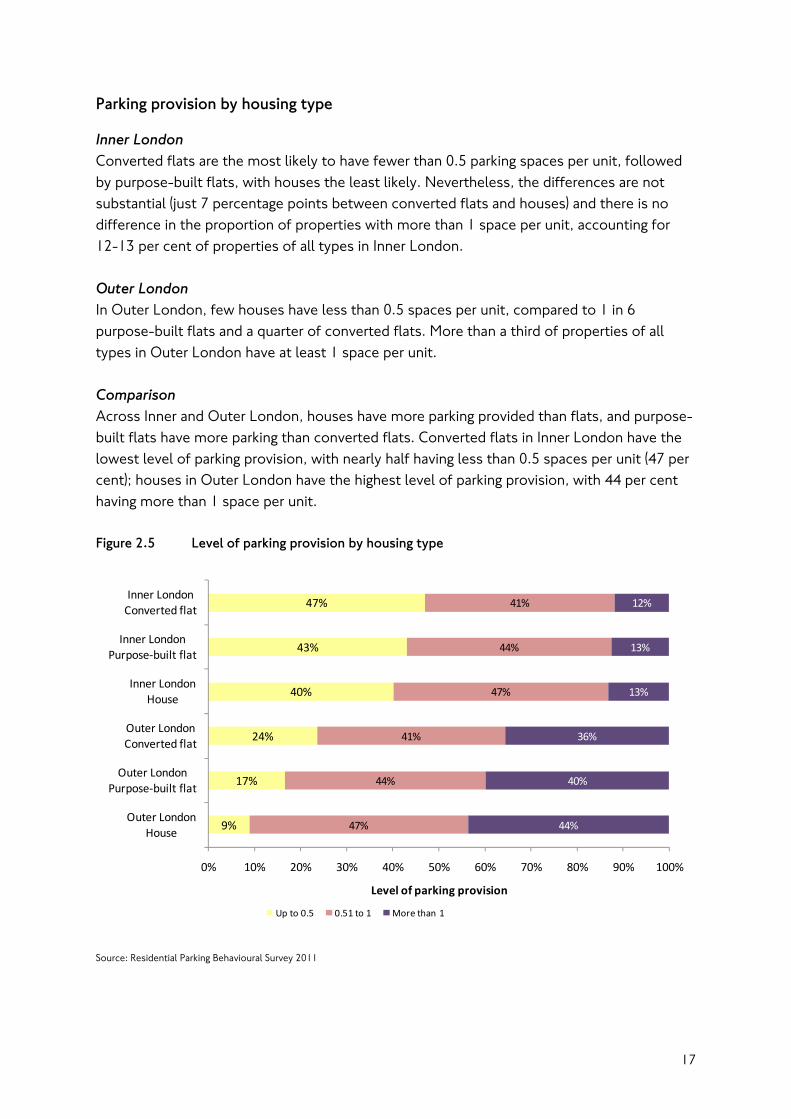
Inner London Converted flats are the most likely to have fewer than 0.5 parking spaces per unit, followed by purpose-built flats, with houses the least likely. Nevertheless, the differences are not substantial (just 7 percentage points between converted flats and houses) and there is no difference in the proportion of properties with more than 1 space per unit, accounting for 12-13 per cent of properties of all types in Inner London. Outer London In Outer London, few houses have less than 0.5 spaces per unit, compared to 1 in 6 purpose-built flats and a quarter of converted flats. More than a third of properties of all types in Outer London have at least 1 space per unit. Comparison Across Inner and Outer London, houses have more parking provided than flats, and purpose-built flats have more parking than converted flats. Converted flats in Inner London have the lowest level of parking provision, with nearly half having less than 0.5 spaces per unit (47 per cent); houses in Outer London have the highest level of parking provision, with 44 per cent having more than 1 space per unit. Figure 2.5 Level of parking provision by housing type
9%
17%
24%
40%
43%
47%
47%
44%
41%
47%
44%
41%
44%
40%
36%
13%
13%
12%
0% 10% 20% 30% 40% 50% 60% 70% 80% 90% 100%
Outer LondonHouse
Outer LondonPurpose‐built flat
Outer LondonConverted flat
Inner LondonHouse
Inner LondonPurpose‐built flat
Inner LondonConverted flat
Level of parking provision
Up to 0.5 0.51 to 1 More than 1
Source: Residential Parking Behavioural Survey 2011
17
Where are vehicles parked?
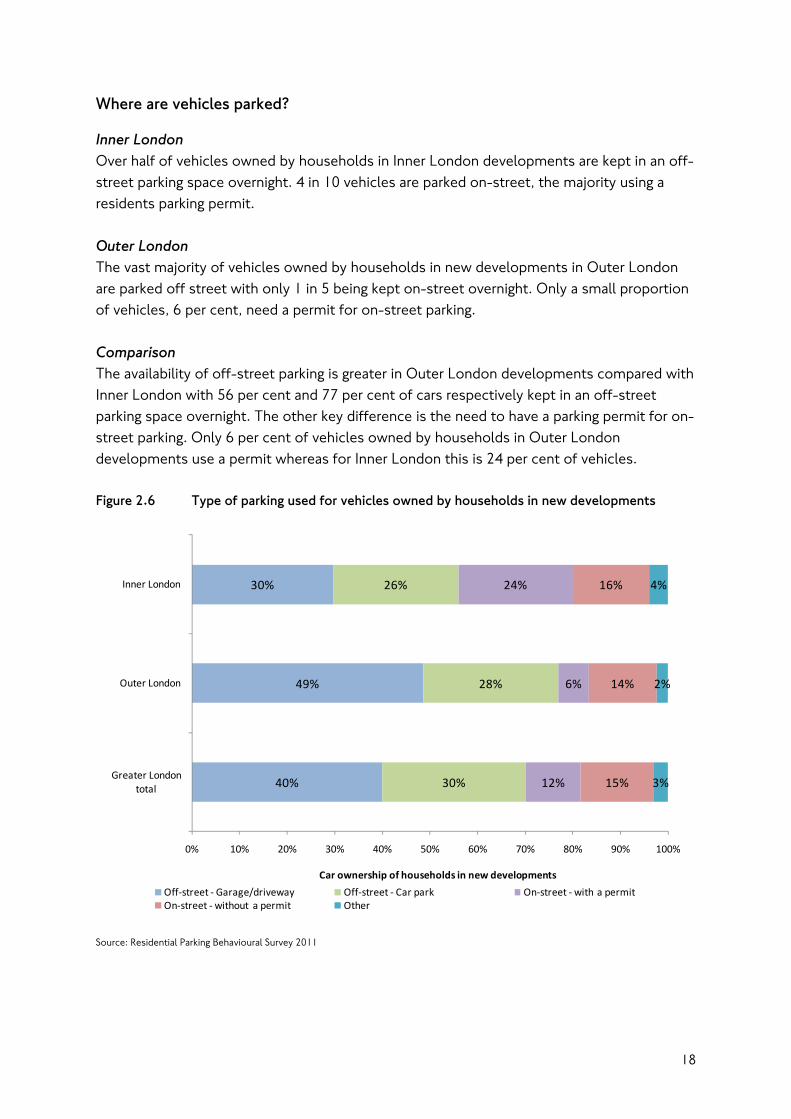
Inner London Over half of vehicles owned by households in Inner London developments are kept in an off-street parking space overnight. 4 in 10 vehicles are parked on-street, the majority using a residents parking permit. Outer London The vast majority of vehicles owned by households in new developments in Outer London are parked off street with only 1 in 5 being kept on-street overnight. Only a small proportion of vehicles, 6 per cent, need a permit for on-street parking. Comparison The availability of off-street parking is greater in Outer London developments compared with Inner London with 56 per cent and 77 per cent of cars respectively kept in an off-street parking space overnight. The other key difference is the need to have a parking permit for on-street parking. Only 6 per cent of vehicles owned by households in Outer London developments use a permit whereas for Inner London this is 24 per cent of vehicles. Figure 2.6 Type of parking used for vehicles owned by households in new developments
40%
49%
30%
30%
28%
26%
12%
6%
24%
15%
14%
16%
3%
2%
4%
0% 10% 20% 30% 40% 50% 60% 70% 80% 90% 100%
Greater London total
Outer London
Inner London
Car ownership of households in new developments
Off‐street ‐ Garage/driveway Off‐street ‐ Car park On‐street ‐with a permitOn‐street ‐without a permit Other
Source: Residential Parking Behavioural Survey 2011
18
Type of parking by area and access to public transport
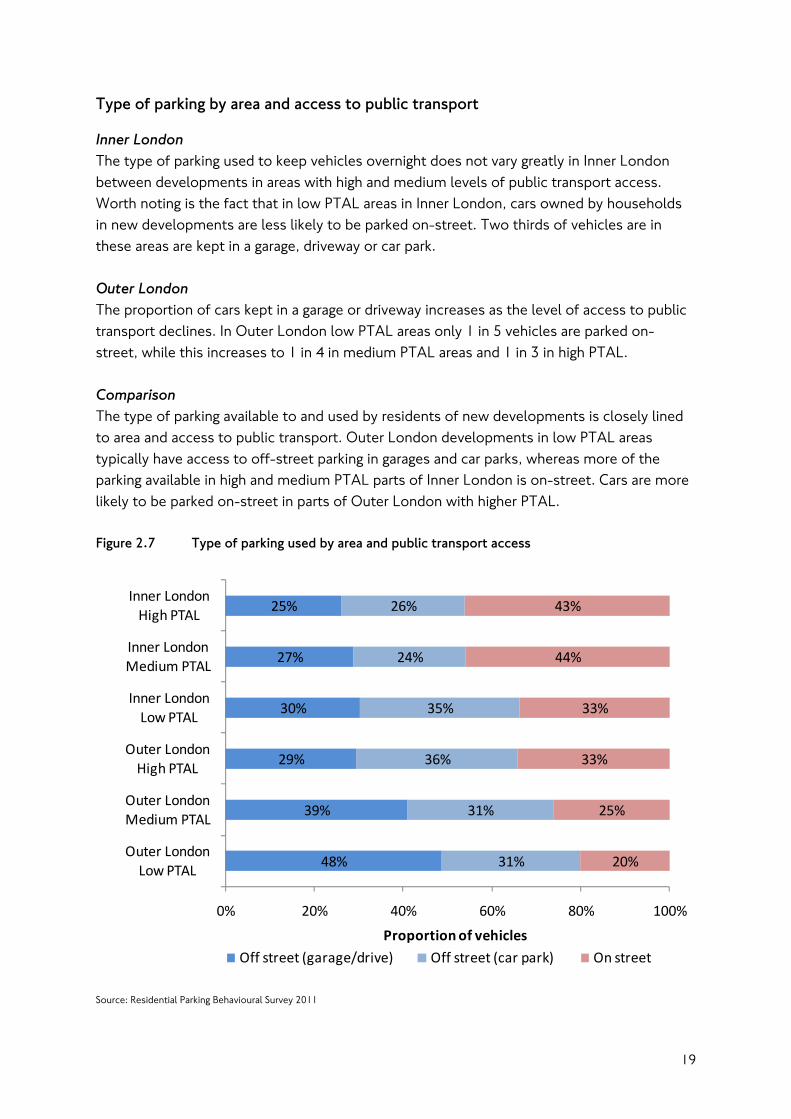
Inner London The type of parking used to keep vehicles overnight does not vary greatly in Inner London between developments in areas with high and medium levels of public transport access. Worth noting is the fact that in low PTAL areas in Inner London, cars owned by households in new developments are less likely to be parked on-street. Two thirds of vehicles are in these areas are kept in a garage, driveway or car park. Outer London The proportion of cars kept in a garage or driveway increases as the level of access to public transport declines. In Outer London low PTAL areas only 1 in 5 vehicles are parked on-street, while this increases to 1 in 4 in medium PTAL areas and 1 in 3 in high PTAL. Comparison The type of parking available to and used by residents of new developments is closely lined to area and access to public transport. Outer London developments in low PTAL areas typically have access to off-street parking in garages and car parks, whereas more of the parking available in high and medium PTAL parts of Inner London is on-street. Cars are more likely to be parked on-street in parts of Outer London with higher PTAL. Figure 2.7 Type of parking used by area and public transport access
48%
39%
29%
30%
27%
25%
31%
31%
36%
35%
24%
26%
20%
25%
33%
33%
44%
43%
0% 20% 40% 60% 80% 100%
Outer London Low PTAL
Outer London Medium PTAL
Outer London High PTAL
Inner London Low PTAL
Inner London Medium PTAL
Inner London High PTAL
Proportion of vehicles
Off street (garage/drive) Off street (car park) On street
Source: Residential Parking Behavioural Survey 2011
19
Type of parking by housing type
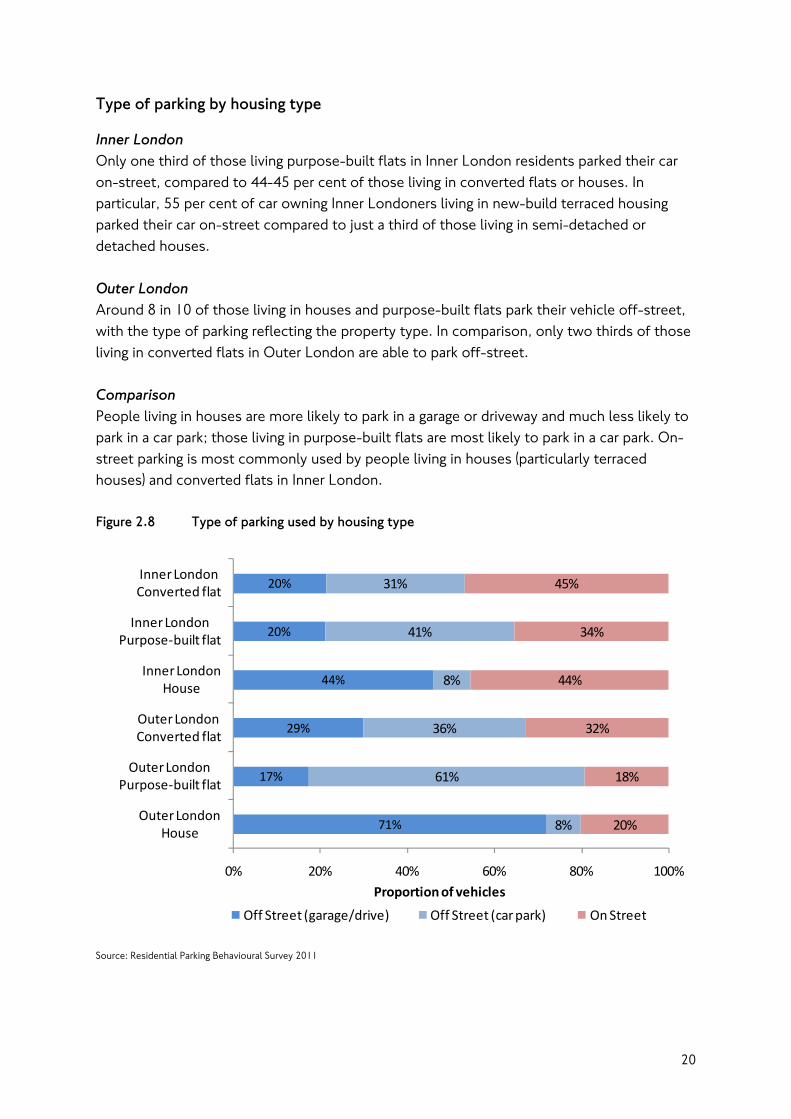
Inner London Only one third of those living purpose-built flats in Inner London residents parked their car on-street, compared to 44-45 per cent of those living in converted flats or houses. In particular, 55 per cent of car owning Inner Londoners living in new-build terraced housing parked their car on-street compared to just a third of those living in semi-detached or detached houses. Outer London Around 8 in 10 of those living in houses and purpose-built flats park their vehicle off-street, with the type of parking reflecting the property type. In comparison, only two thirds of those living in converted flats in Outer London are able to park off-street. Comparison People living in houses are more likely to park in a garage or driveway and much less likely to park in a car park; those living in purpose-built flats are most likely to park in a car park. On-street parking is most commonly used by people living in houses (particularly terraced houses) and converted flats in Inner London. Figure 2.8 Type of parking used by housing type
71%
17%
29%
44%
20%
20%
8%
61%
36%
8%
41%
31%
20%
18%
32%
44%
34%
45%
0% 20% 40% 60% 80% 100%
Outer LondonHouse
Outer LondonPurpose‐built flat
Outer LondonConverted flat
Inner LondonHouse
Inner LondonPurpose‐built flat
Inner LondonConverted flat
Proportion of vehicles
Off Street (garage/drive) Off Street (car park) On Street
Source: Residential Parking Behavioural Survey 2011
20
Type of parking by number of vehicles in the household
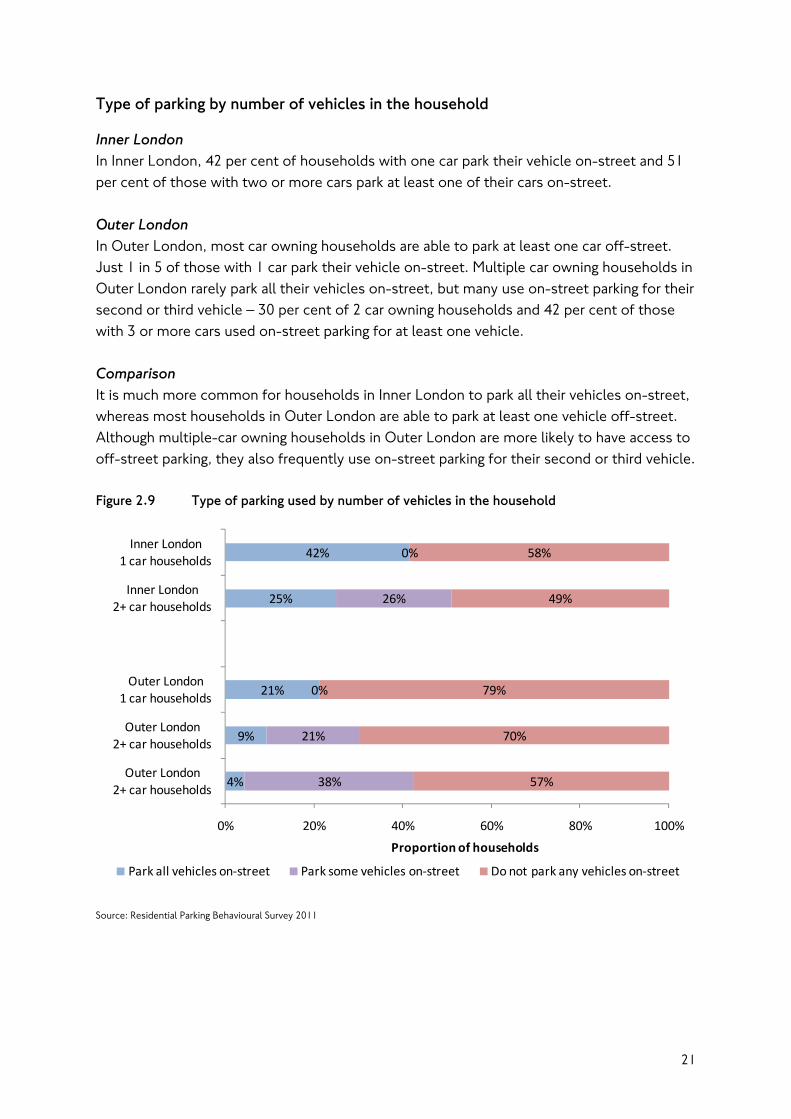
Inner London In Inner London, 42 per cent of households with one car park their vehicle on-street and 51 per cent of those with two or more cars park at least one of their cars on-street. Outer London In Outer London, most car owning households are able to park at least one car off-street. Just 1 in 5 of those with 1 car park their vehicle on-street. Multiple car owning households in Outer London rarely park all their vehicles on-street, but many use on-street parking for their second or third vehicle – 30 per cent of 2 car owning households and 42 per cent of those with 3 or more cars used on-street parking for at least one vehicle. Comparison It is much more common for households in Inner London to park all their vehicles on-street, whereas most households in Outer London are able to park at least one vehicle off-street. Although multiple-car owning households in Outer London are more likely to have access to off-street parking, they also frequently use on-street parking for their second or third vehicle. Figure 2.9 Type of parking used by number of vehicles in the household
4%
9%
21%
25%
42%
38%
21%
0%
26%
0%
57%
70%
79%
49%
58%
0% 20% 40% 60% 80% 100%
Outer London2+ car households
Outer London2+ car households
Outer London1 car households
Inner London2+ car households
Inner London1 car households
Proportion of households
Park all vehicles on‐street Park some vehicles on‐street Do not park any vehicles on‐street
Source: Residential Parking Behavioural Survey 2011
21
Chapter 3 What factors influence the choice to own a car?
Introduction
This Section describes the aspects of places, properties and people that influence the choice of residents in new developments to own a car. In particular, the Section explores the relative importance of parking provision on the level of car ownership in a development, taking into account other key factors that influence the choice to own a car. In addition to multivariate analysis of the dataset, a multiple regression analysis is presented investigating which characteristics of the sample population and local area are associated with whether households own a car or van.
Key findings
• The average number of cars per household rises as public transport accessibility decreases. Developments in parts of Outer London with the best access to public transport have lower car ownership levels than parts of Inner London with the least public transport access.
• As household income rises, car ownership increases. Car ownership levels are higher for all income groups in Outer London; in Inner London, even amongst those in the highest income groups, a significant minority choose to live without a car.
• Car ownership is higher in households with more than one adult than in single adult households. In Inner London, but not in Outer London, the presence of children in a household also increases the likelihood of having a car.
• Car ownership is higher amongst those living in new-build houses than flats, and higher amongst those living in purpose-built flats than converted flats.
• Home owners are more likely to own a car than those renting their home, and private renters are more likely to own a car than social renters.
• Households living in developments with up to 0.5 parking spaces per unit are significantly less likely to own a car than those living in developments with more than 0.5 spaces per unit.
• Analysis has been carried out to explore the influence of parking provision on car ownership in comparison with other factors. This found that, for all groups and in all areas, people living in developments with more parking available had higher levels of car ownership than people living in developments with less parking.
• For example, income is considered a key determinant of car ownership. Nevertheless, 83 per cent of people with a high income in developments with over 0.5 spaces per unit have a car compared to 56 per cent of the same income group with less parking available.
• Similarly, a regression analysis identified key factors influencing car ownership to be tenure, housing type, household structure, working status, area and access to public transport, level of parking provision, and car club membership.
22
Car ownership by area and access to public transport
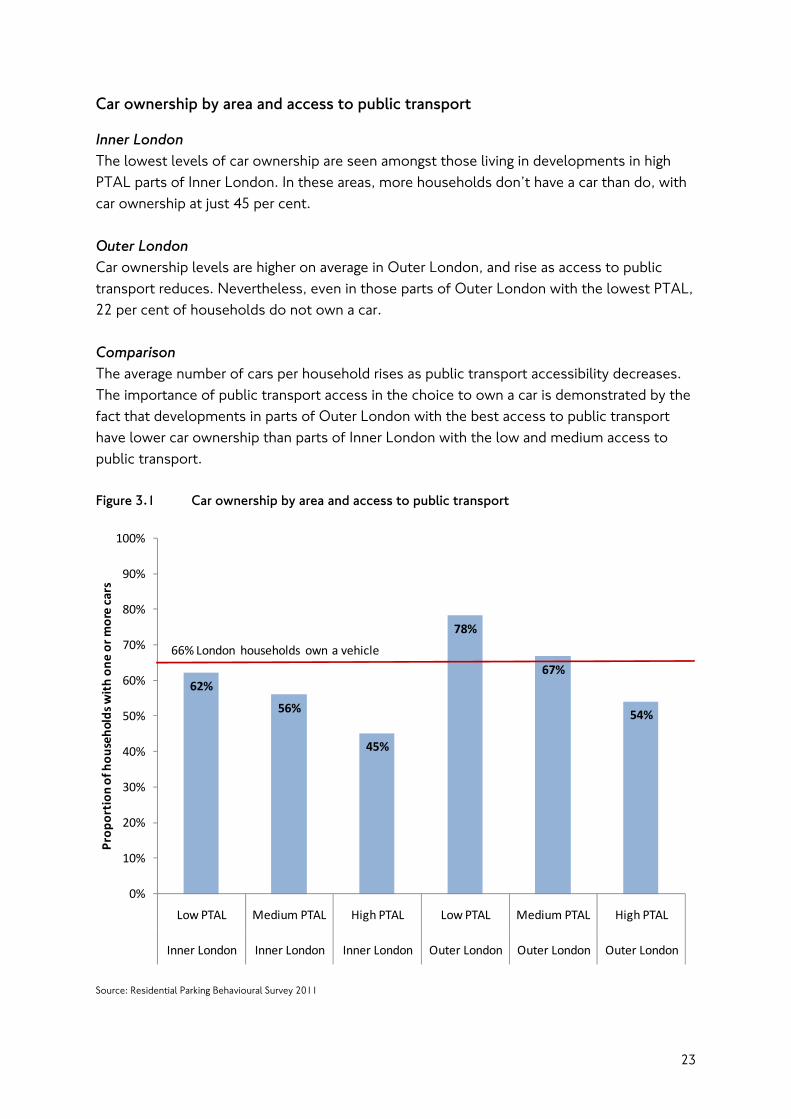
Inner London The lowest levels of car ownership are seen amongst those living in developments in high PTAL parts of Inner London. In these areas, more households don’t have a car than do, with car ownership at just 45 per cent. Outer London Car ownership levels are higher on average in Outer London, and rise as access to public transport reduces. Nevertheless, even in those parts of Outer London with the lowest PTAL, 22 per cent of households do not own a car. Comparison The average number of cars per household rises as public transport accessibility decreases. The importance of public transport access in the choice to own a car is demonstrated by the fact that developments in parts of Outer London with the best access to public transport have lower car ownership than parts of Inner London with the low and medium access to public transport. Figure 3.1 Car ownership by area and access to public transport
62%
56%
45%
78%
67%
54%
0%
10%
20%
30%
40%
50%
60%
70%
80%
90%
100%
Low PTAL Medium PTAL High PTAL Low PTAL Medium PTAL High PTAL
Inner London Inner London Inner London Outer London Outer London Outer London
Prop
ortion
of h
ouseho
lds w
ith on
e or more cars
66% London households own a vehicle
Source: Residential Parking Behavioural Survey 2011
23
Car ownership by income
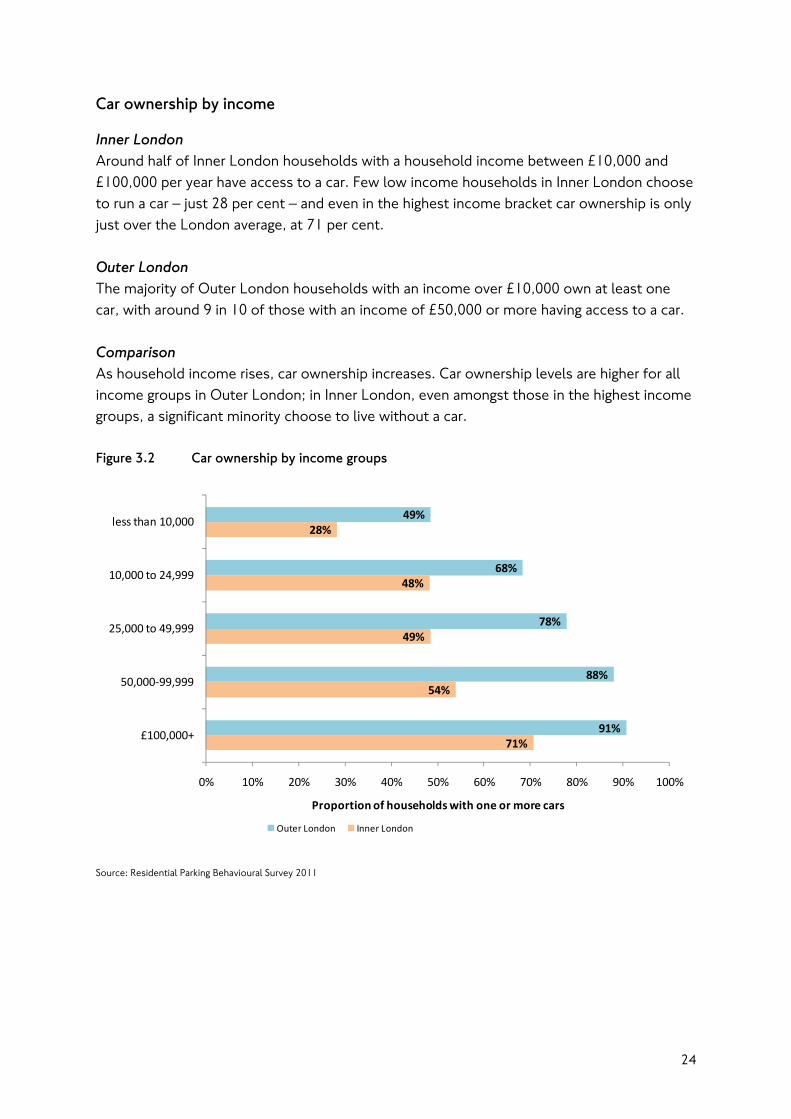
Inner London Around half of Inner London households with a household income between £10,000 and £100,000 per year have access to a car. Few low income households in Inner London choose to run a car – just 28 per cent – and even in the highest income bracket car ownership is only just over the London average, at 71 per cent. Outer London The majority of Outer London households with an income over £10,000 own at least one car, with around 9 in 10 of those with an income of £50,000 or more having access to a car. Comparison As household income rises, car ownership increases. Car ownership levels are higher for all income groups in Outer London; in Inner London, even amongst those in the highest income groups, a significant minority choose to live without a car. Figure 3.2 Car ownership by income groups
71%
54%
49%
48%
28%
91%
88%
78%
68%
49%
0% 10% 20% 30% 40% 50% 60% 70% 80% 90% 100%
£100,000+
50,000‐99,999
25,000 to 49,999
10,000 to 24,999
less than 10,000
Proportion of households with one or more cars
Outer London Inner London
Source: Residential Parking Behavioural Survey 2011
24
Car ownership by household structure
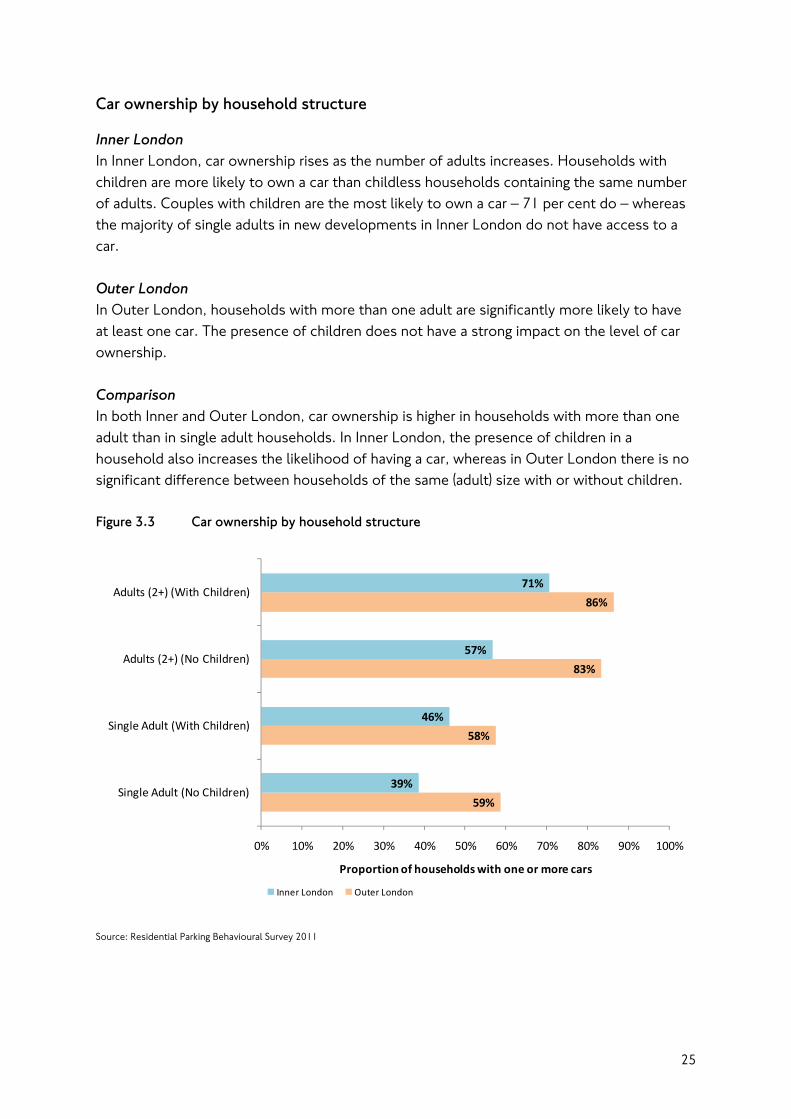
Inner London In Inner London, car ownership rises as the number of adults increases. Households with children are more likely to own a car than childless households containing the same number of adults. Couples with children are the most likely to own a car – 71 per cent do – whereas the majority of single adults in new developments in Inner London do not have access to a car. Outer London In Outer London, households with more than one adult are significantly more likely to have at least one car. The presence of children does not have a strong impact on the level of car ownership. Comparison In both Inner and Outer London, car ownership is higher in households with more than one adult than in single adult households. In Inner London, the presence of children in a household also increases the likelihood of having a car, whereas in Outer London there is no significant difference between households of the same (adult) size with or without children. Figure 3.3 Car ownership by household structure
59%
58%
83%
86%
39%
46%
57%
71%
0% 10% 20% 30% 40% 50% 60% 70% 80% 90% 100%
Single Adult (No Children)
Single Adult (With Children)
Adults (2+) (No Children)
Adults (2+) (With Children)
Proportion of households with one or more cars
Inner London Outer London
Source: Residential Parking Behavioural Survey 2011
25
Car ownership by accommodation type
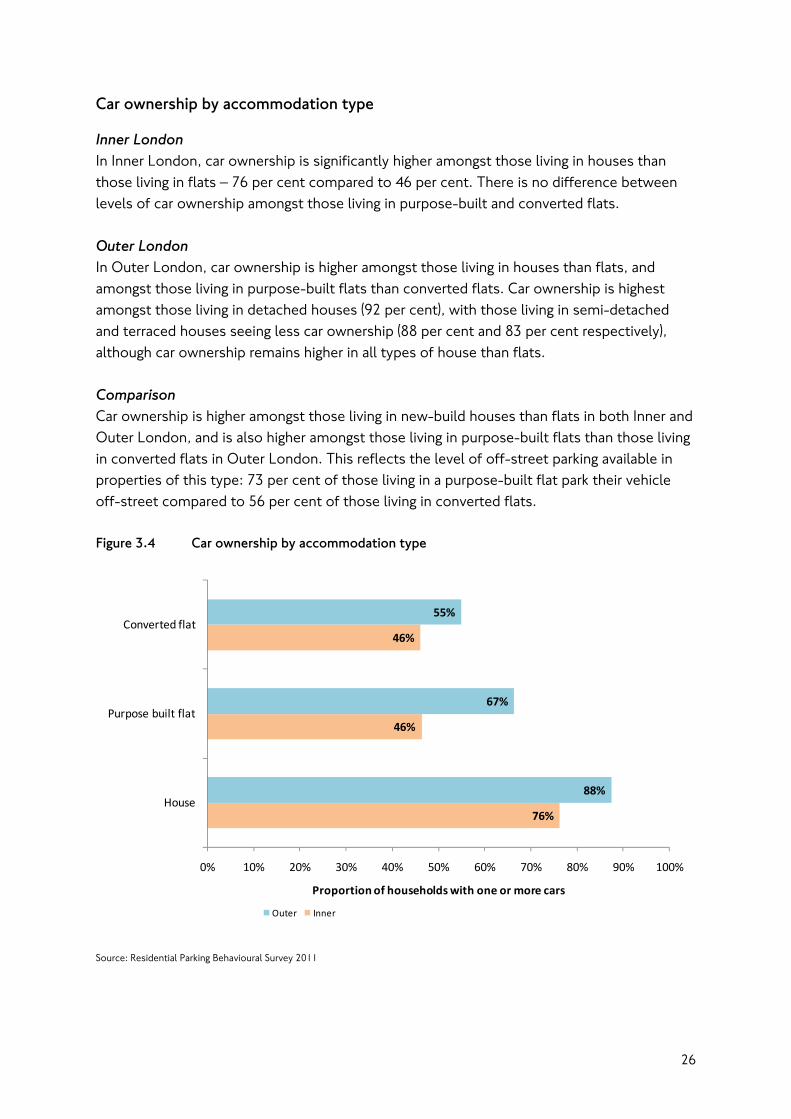
Inner London In Inner London, car ownership is significantly higher amongst those living in houses than those living in flats – 76 per cent compared to 46 per cent. There is no difference between levels of car ownership amongst those living in purpose-built and converted flats. Outer London In Outer London, car ownership is higher amongst those living in houses than flats, and amongst those living in purpose-built flats than converted flats. Car ownership is highest amongst those living in detached houses (92 per cent), with those living in semi-detached and terraced houses seeing less car ownership (88 per cent and 83 per cent respectively), although car ownership remains higher in all types of house than flats. Comparison Car ownership is higher amongst those living in new-build houses than flats in both Inner and Outer London, and is also higher amongst those living in purpose-built flats than those living in converted flats in Outer London. This reflects the level of off-street parking available in properties of this type: 73 per cent of those living in a purpose-built flat park their vehicle off-street compared to 56 per cent of those living in converted flats. Figure 3.4 Car ownership by accommodation type
76%
46%
46%
88%
67%
55%
0% 10% 20% 30% 40% 50% 60% 70% 80% 90% 100%
House
Purpose built flat
Converted flat
Proportion of households with one or more cars
Outer Inner
Source: Residential Parking Behavioural Survey 2011
26
Car ownership by household tenure
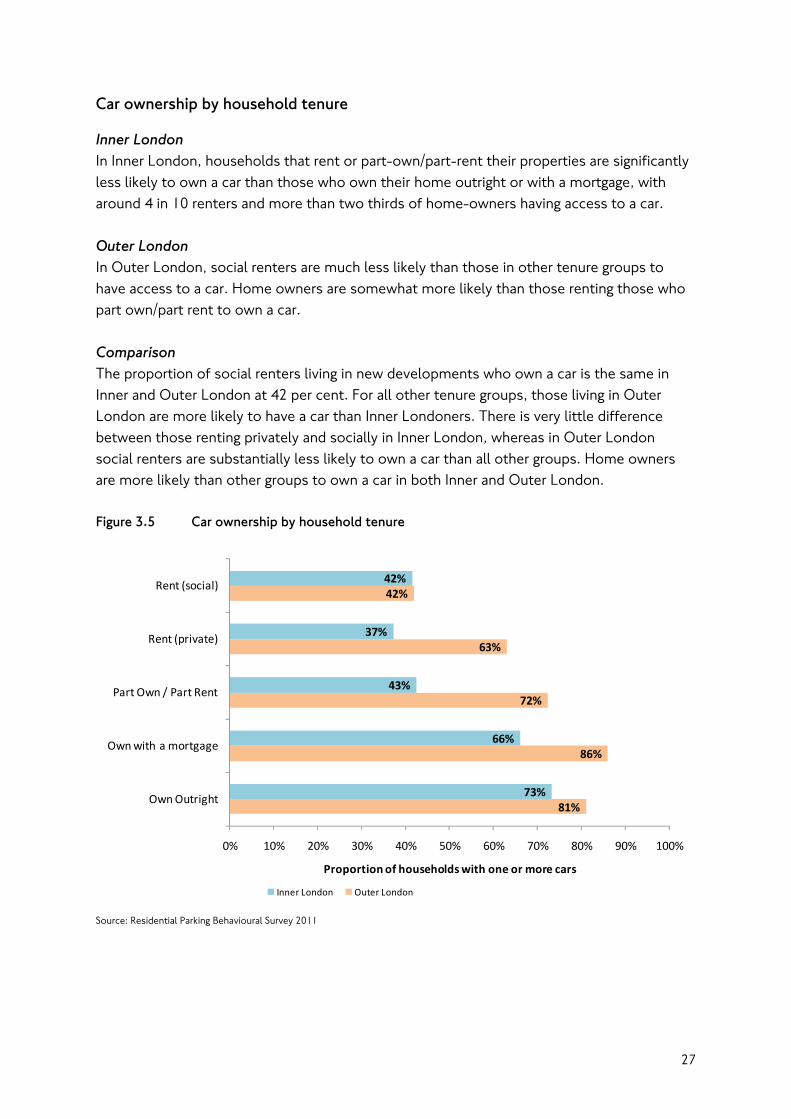
Inner London In Inner London, households that rent or part-own/part-rent their properties are significantly less likely to own a car than those who own their home outright or with a mortgage, with around 4 in 10 renters and more than two thirds of home-owners having access to a car. Outer London In Outer London, social renters are much less likely than those in other tenure groups to have access to a car. Home owners are somewhat more likely than those renting those who part own/part rent to own a car. Comparison The proportion of social renters living in new developments who own a car is the same in Inner and Outer London at 42 per cent. For all other tenure groups, those living in Outer London are more likely to have a car than Inner Londoners. There is very little difference between those renting privately and socially in Inner London, whereas in Outer London social renters are substantially less likely to own a car than all other groups. Home owners are more likely than other groups to own a car in both Inner and Outer London. Figure 3.5 Car ownership by household tenure
81%
86%
72%
63%
42%
73%
66%
43%
37%
42%
0% 10% 20% 30% 40% 50% 60% 70% 80% 90% 100%
Own Outright
Own with a mortgage
Part Own / Part Rent
Rent (private)
Rent (social)
Proportion of households with one or more cars
Inner London Outer London
Source: Residential Parking Behavioural Survey 2011
27
Car ownership by parking provision
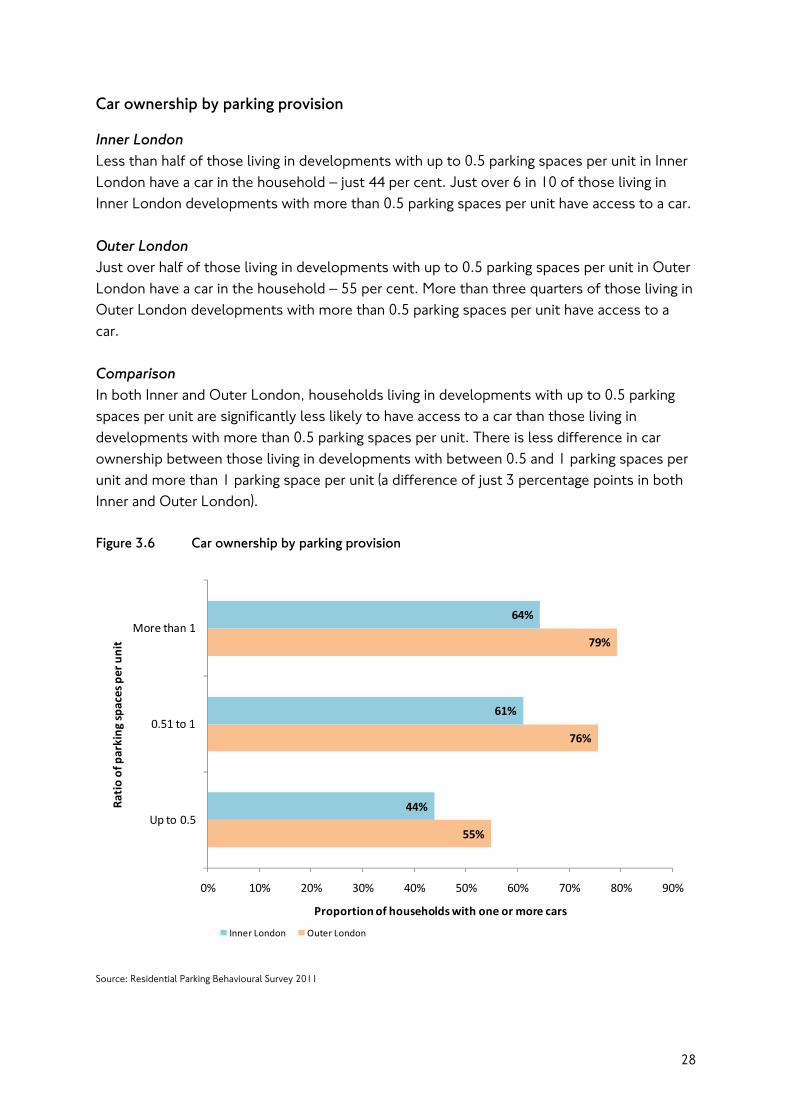
Inner London Less than half of those living in developments with up to 0.5 parking spaces per unit in Inner London have a car in the household – just 44 per cent. Just over 6 in 10 of those living in Inner London developments with more than 0.5 parking spaces per unit have access to a car. Outer London Just over half of those living in developments with up to 0.5 parking spaces per unit in Outer London have a car in the household – 55 per cent. More than three quarters of those living in Outer London developments with more than 0.5 parking spaces per unit have access to a car. Comparison In both Inner and Outer London, households living in developments with up to 0.5 parking spaces per unit are significantly less likely to have access to a car than those living in developments with more than 0.5 parking spaces per unit. There is less difference in car ownership between those living in developments with between 0.5 and 1 parking spaces per unit and more than 1 parking space per unit (a difference of just 3 percentage points in both Inner and Outer London). Figure 3.6 Car ownership by parking provision
55%
76%
79%
44%
61%
64%
0% 10% 20% 30% 40% 50% 60% 70% 80% 90%
Up to 0.5
0.51 to 1
More than 1
Proportion of households with one or more cars
Ratio of parking
spaces per unit
Inner London Outer London
Source: Residential Parking Behavioural Survey 2011
28
Car ownership by parking provision and other key factors
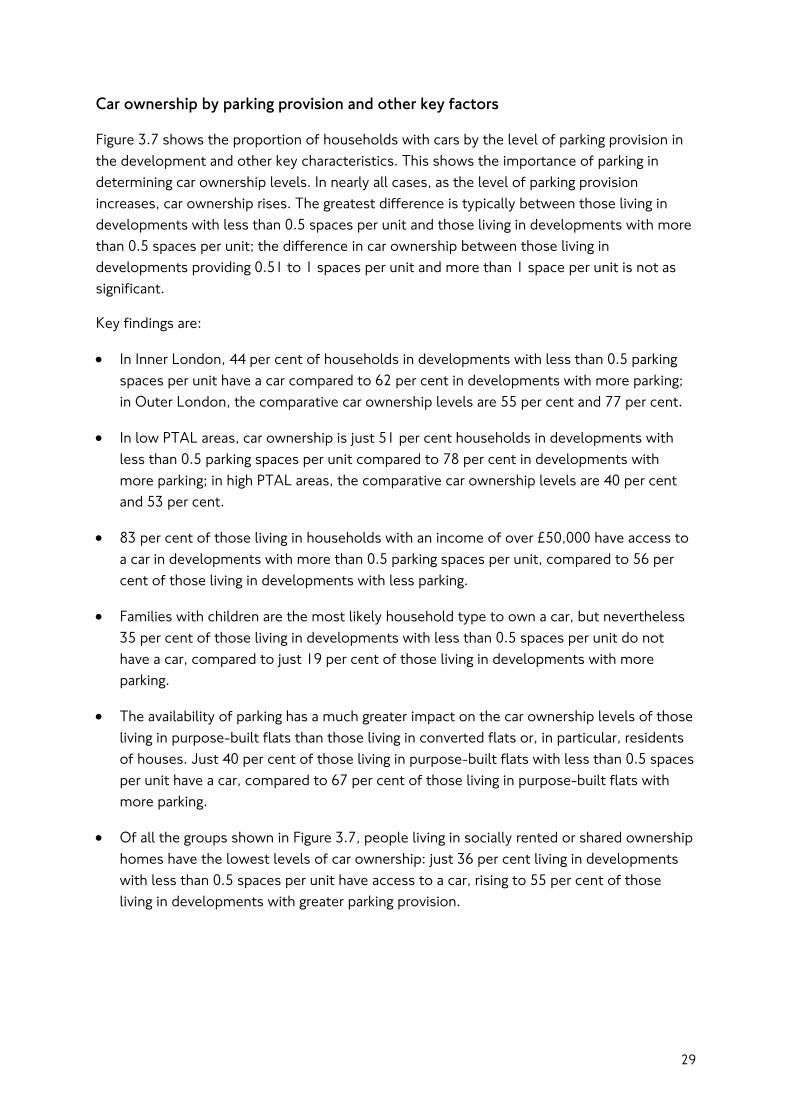
Figure 3.7 shows the proportion of households with cars by the level of parking provision in the development and other key characteristics. This shows the importance of parking in determining car ownership levels. In nearly all cases, as the level of parking provision increases, car ownership rises. The greatest difference is typically between those living in developments with less than 0.5 spaces per unit and those living in developments with more than 0.5 spaces per unit; the difference in car ownership between those living in developments providing 0.51 to 1 spaces per unit and more than 1 space per unit is not as significant.
Key findings are:
• In Inner London, 44 per cent of households in developments with less than 0.5 parking spaces per unit have a car compared to 62 per cent in developments with more parking; in Outer London, the comparative car ownership levels are 55 per cent and 77 per cent.
• In low PTAL areas, car ownership is just 51 per cent households in developments with less than 0.5 parking spaces per unit compared to 78 per cent in developments with more parking; in high PTAL areas, the comparative car ownership levels are 40 per cent and 53 per cent.
• 83 per cent of those living in households with an income of over £50,000 have access to a car in developments with more than 0.5 parking spaces per unit, compared to 56 per cent of those living in developments with less parking.
• Families with children are the most likely household type to own a car, but nevertheless 35 per cent of those living in developments with less than 0.5 spaces per unit do not have a car, compared to just 19 per cent of those living in developments with more parking.
• The availability of parking has a much greater impact on the car ownership levels of those living in purpose-built flats than those living in converted flats or, in particular, residents of houses. Just 40 per cent of those living in purpose-built flats with less than 0.5 spaces per unit have a car, compared to 67 per cent of those living in purpose-built flats with more parking.
• Of all the groups shown in Figure 3.7, people living in socially rented or shared ownership homes have the lowest levels of car ownership: just 36 per cent living in developments with less than 0.5 spaces per unit have access to a car, rising to 55 per cent of those living in developments with greater parking provision.
29
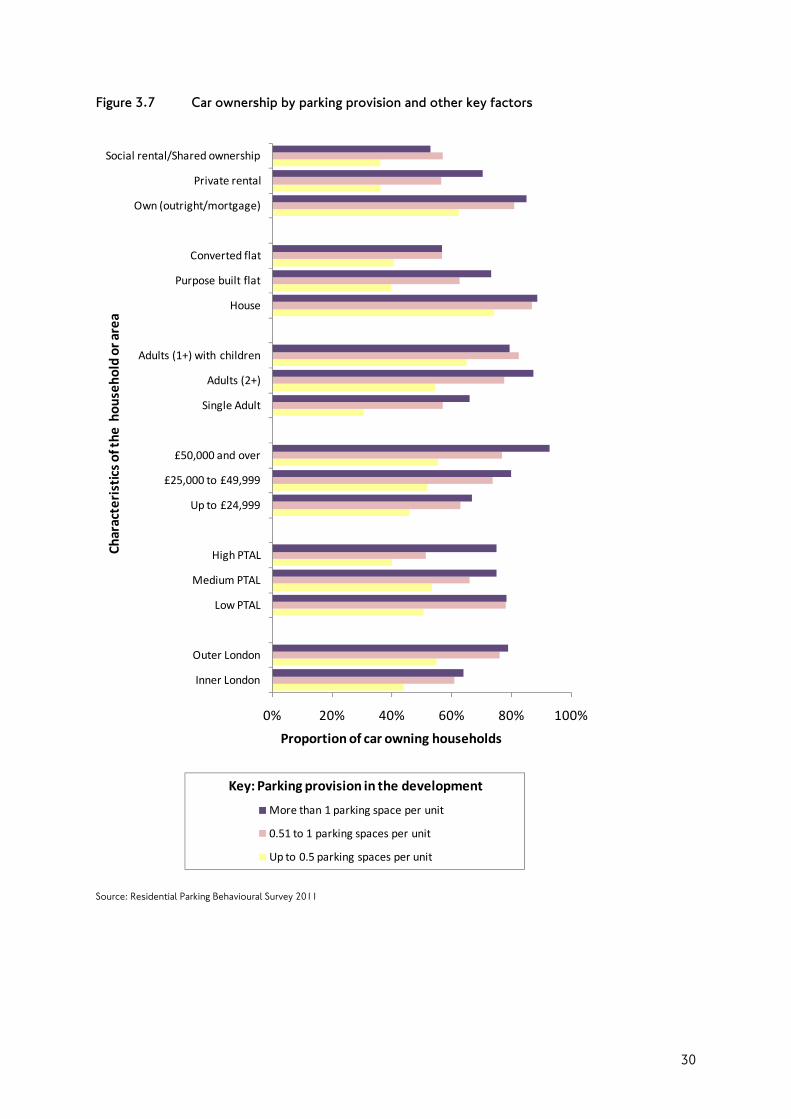
Figure 3.7 Car ownership by parking provision and other key factors
0% 20% 40% 60% 80% 100%
Inner London
Outer London
Low PTAL
Medium PTAL
High PTAL
Up to £24,999
£25,000 to £49,999
£50,000 and over
Single Adult
Adults (2+)
Adults (1+) with children
House
Purpose built flat
Converted flat
Own (outright/mortgage)
Private rental
Social rental/Shared ownership
Proportion of car owning households
More than 1 parking space per unit
0.51 to 1 parking spaces per unit
Up to 0.5 parking spaces per unit
Characteristicsof th
e hou
seho
ld or area
Key: Parking provision in the development
Source: Residential Parking Behavioural Survey 2011
30
Influences on car ownership – regression analysis
Multiple regression analysis has been carried out to investigate which characteristics of the sample population and local area (the independent or predictive variables) are associated with whether households own a car or van. As the dependent variable is binary (people either own a car or they don’t), a binary logistic regression technique has been used. The goodness of fit of the model was assessed using the McFadden Rho Squared Statistic and was found to be 0.24. This is regarded as a good fit.
The findings of the regression analysis largely reflect those presented earlier in this chapter, with key factors shown to be tenure, housing type, household structure, working status, area and access to public transport, level of parking provision, and car club membership.
Key findings of the regression analysis were:
• People renting or part renting their home were less likely to own a car, with social renters were nearly four times less likely, people renting privately nearly three times less likely, and people part renting/part buying their property just over two times less likely to own a car.
• People living in flats were less likely to own a car, with those living in purpose-built flats two times less likely and those living in converted flats nearly three times less likely to own a car.
• Single adult households were more than twice as likely not to own a car and households with children nearly one and a half times more likely to own a car.
• People not in work, because they were unemployed, studying or retired, were at least two times less likely to own a car.
• Residents of Outer London were 1.7 times more likely to own a car. Residents of areas with better access to public transport were less likely to own a car, with residents of high PTAL areas nearly twice as likely not to own a car.
• Residents of developments with less than 0.5 parking spaces per unit were 1.7 times less likely to own a car.
• Car club members were nearly six times less likely to own a car. However, the overall impact of car clubs on car ownership levels in the sample was small, as only 4 per cent of respondents were members of a car club.
31
Chapter 4 How much are cars used?
Introduction
This Section describes the frequency with which residents of new developments travel by car. Analysis is presented for all residents as well as for car owners, and is presented in terms of personal travel and in terms of how much each car is used. Finally, the Section includes patterns of car travel by those living in different areas and at different days and times.
Key findings
Comparison of car travel patterns for car owners and non-car owners
• Outer London residents of new developments are considerably more likely than Inner Londoners to travel by car (as driver) overall, taking into account the travel patterns of car owners and non-car owners. However, a significant minority never do so even in parts of the region with the lowest public transport access.
• Across London, around nine in ten car owners ever make a journey by car (as driver) and between 66 and 79 per cent make a car (as driver) journey at least once a week. In general, the relationship between area, public transport access and frequency of car travel amongst car owners is weak, although it is evident that car owners in Outer London are more likely to travel by car (as driver) five days week or more than car owners in Inner London.
• A similar pattern is visible in the usage patterns of cars. There is no clear pattern in the relationship between area, access to public transport and the usage of cars once a week or more, but cars owned by residents of Outer London are more likely to be used five times a week or more than those owned by Inner London residents.
• In combination, these findings suggest that the higher level of car travel in Outer London is caused in part by a higher proportion of car owners travelling by car every day or nearly every day, but also largely by the fact that a higher proportion of Outer London residents have access to a car.
Car travel amongst car owners by time of day
• People who have cars use them. In both Inner and Outer London, car owners use their cars frequently at all times of day, including during the busiest peak periods.
• A quarter of Inner London car owners use their cars five or more times a week during the weekday peak and 44 per cent use their car at least once a week at this time. In Outer London, two thirds of car owners use their car at least once week including one third who use their car at least five times a week at this time.
• Around two thirds of car owners use their car every weekend, and most use their car at least one weekend in two.
32
Relationship between car travel and parking provision
• The frequency of travel by car for residents of new developments (including car owners and those without a car) increases as the level of parking provided rises. In developments with less than 0.5 spaces per unit, 58 per cent of respondents had travelled by car in the previous year, compared to 76 per cent of those living in developments with more than 1 parking space per unit.
• However, frequency of travel by car (as driver) amongst car owners is essentially unaffected by the level of parking provided – three quarters of car owners travel by car (as driver) at least once a week regardless of the level of parking provision in their development. This is despite the fact that developments with low parking provision tend to be in Inner London and in locations with the highest public transport accessibility.
• Developments with less parking produce less car travel, but car owners travel with the same frequency regardless of where they live, therefore, where there are more car owning households, there is more travel generated by the development.
33
Frequency of travel by car by area of residence and access to public transport
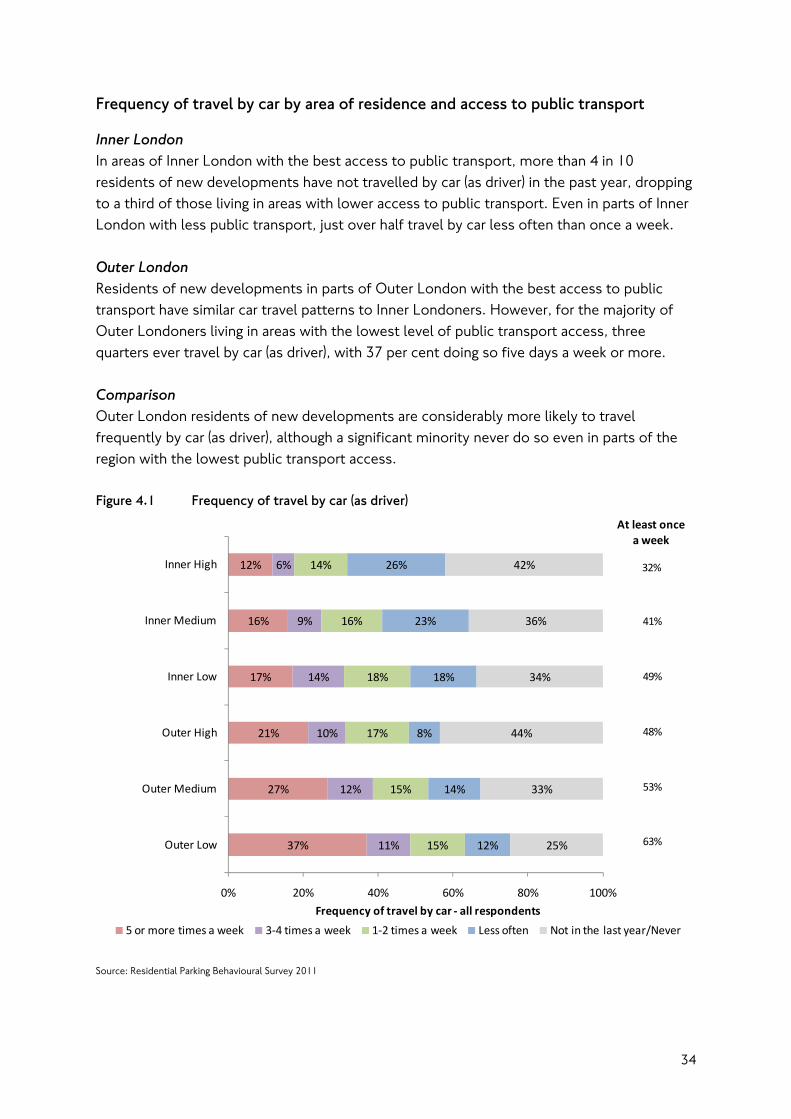
Inner London In areas of Inner London with the best access to public transport, more than 4 in 10 residents of new developments have not travelled by car (as driver) in the past year, dropping to a third of those living in areas with lower access to public transport. Even in parts of Inner London with less public transport, just over half travel by car less often than once a week. Outer London Residents of new developments in parts of Outer London with the best access to public transport have similar car travel patterns to Inner Londoners. However, for the majority of Outer Londoners living in areas with the lowest level of public transport access, three quarters ever travel by car (as driver), with 37 per cent doing so five days a week or more. Comparison Outer London residents of new developments are considerably more likely to travel frequently by car (as driver), although a significant minority never do so even in parts of the region with the lowest public transport access. Figure 4.1 Frequency of travel by car (as driver)
37%
27%
21%
17%
16%
12%
11%
12%
10%
14%
9%
6%
15%
15%
17%
18%
16%
14%
12%
14%
8%
18%
23%
26%
25%
33%
44%
34%
36%
42%
0% 20% 40% 60% 80% 100%
Outer Low
Outer Medium
Outer High
Inner Low
Inner Medium
Inner High
Frequency of travel by car ‐ all respondents
5 or more times a week 3‐4 times a week 1‐2 times a week Less often Not in the last year/Never
32%
63%
53%
48%
49%
41%
At least once a week
Source: Residential Parking Behavioural Survey 2011
34
Frequency of travel by car and level of usage of cars – car owners
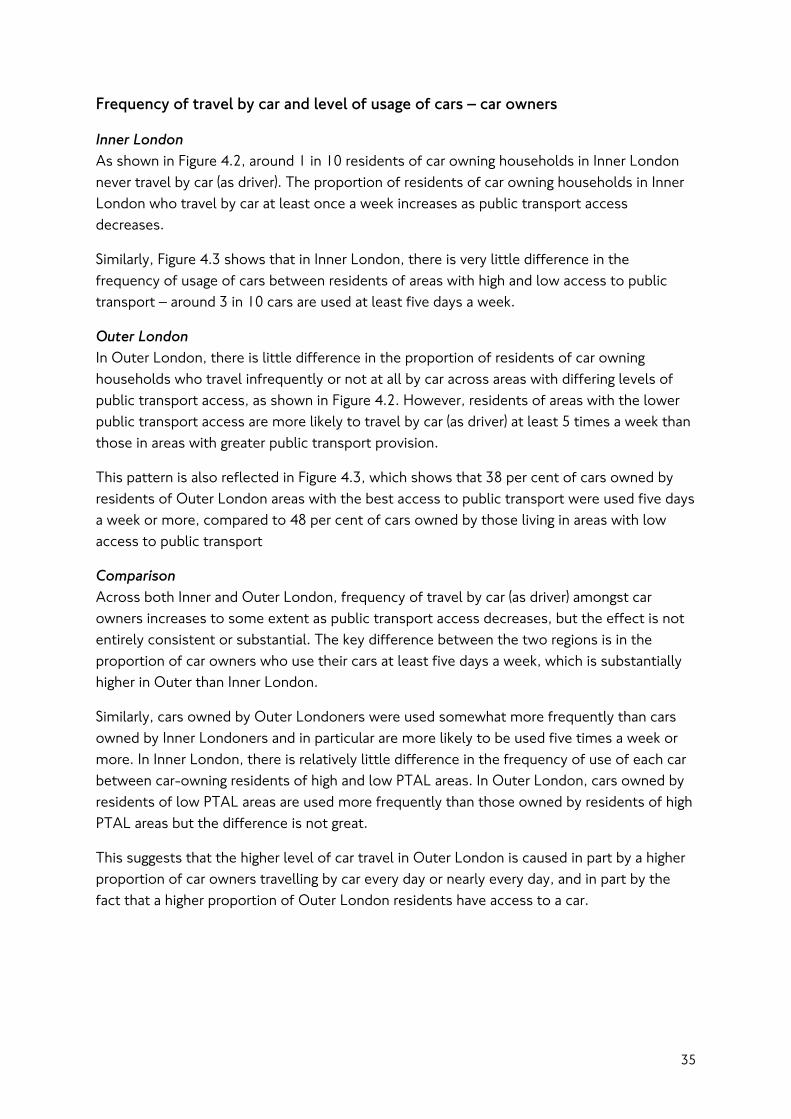
Inner London As shown in Figure 4.2, around 1 in 10 residents of car owning households in Inner London never travel by car (as driver). The proportion of residents of car owning households in Inner London who travel by car at least once a week increases as public transport access decreases.
Similarly, Figure 4.3 shows that in Inner London, there is very little difference in the frequency of usage of cars between residents of areas with high and low access to public transport – around 3 in 10 cars are used at least five days a week.
Outer London In Outer London, there is little difference in the proportion of residents of car owning households who travel infrequently or not at all by car across areas with differing levels of public transport access, as shown in Figure 4.2. However, residents of areas with the lower public transport access are more likely to travel by car (as driver) at least 5 times a week than those in areas with greater public transport provision.
This pattern is also reflected in Figure 4.3, which shows that 38 per cent of cars owned by residents of Outer London areas with the best access to public transport were used five days a week or more, compared to 48 per cent of cars owned by those living in areas with low access to public transport
Comparison Across both Inner and Outer London, frequency of travel by car (as driver) amongst car owners increases to some extent as public transport access decreases, but the effect is not entirely consistent or substantial. The key difference between the two regions is in the proportion of car owners who use their cars at least five days a week, which is substantially higher in Outer than Inner London.
Similarly, cars owned by Outer Londoners were used somewhat more frequently than cars owned by Inner Londoners and in particular are more likely to be used five times a week or more. In Inner London, there is relatively little difference in the frequency of use of each car between car-owning residents of high and low PTAL areas. In Outer London, cars owned by residents of low PTAL areas are used more frequently than those owned by residents of high PTAL areas but the difference is not great.
This suggests that the higher level of car travel in Outer London is caused in part by a higher proportion of car owners travelling by car every day or nearly every day, and in part by the fact that a higher proportion of Outer London residents have access to a car.
35
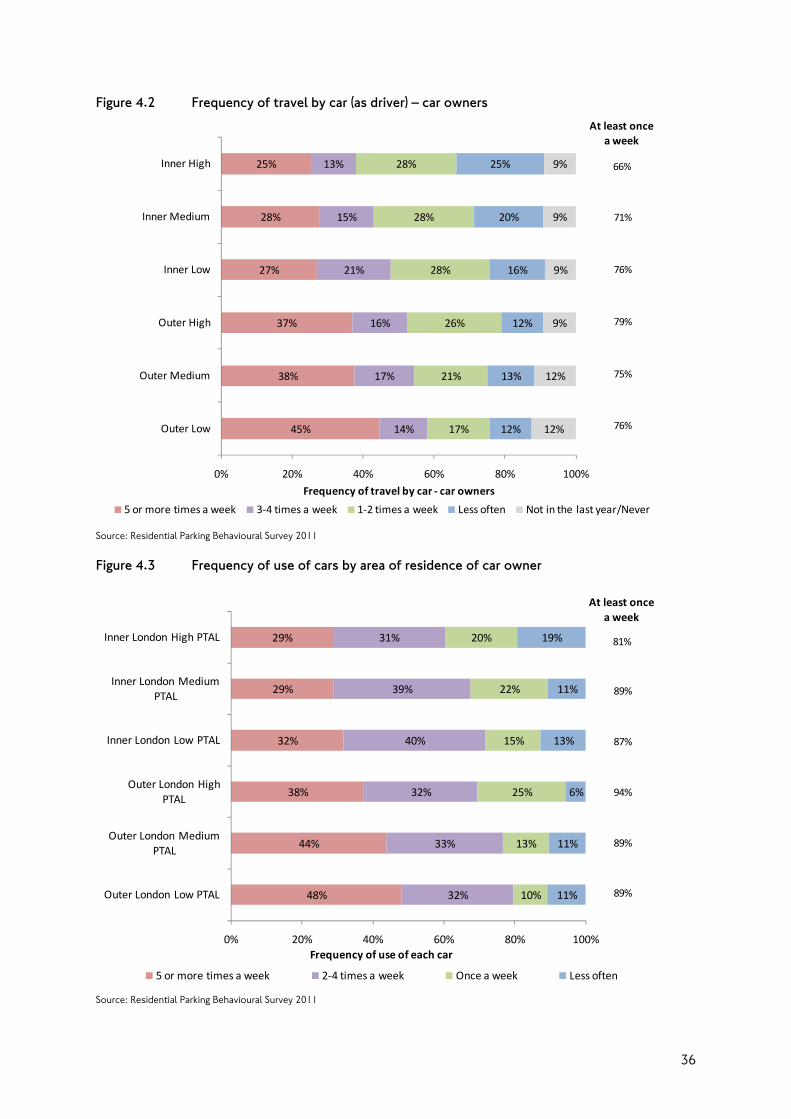
Figure 4.2 Frequency of travel by car (as driver) – car owners
45%
38%
37%
27%
28%
25%
14%
17%
16%
21%
15%
13%
17%
21%
26%
28%
28%
28%
12%
13%
12%
16%
20%
25%
12%
12%
9%
9%
9%
9%
0% 20% 40% 60% 80% 100%
Outer Low
Outer Medium
Outer High
Inner Low
Inner Medium
Inner High
Frequency of travel by car ‐ car owners
5 or more times a week 3‐4 times a week 1‐2 times a week Less often Not in the last year/Never
66%
76%
75%
79%
76%
71%
At least once a week
Source: Residential Parking Behavioural Survey 2011
Figure 4.3 Frequency of use of cars by area of residence of car owner
48%
44%
38%
32%
29%
29%
32%
33%
32%
40%
39%
31%
10%
13%
25%
15%
22%
20%
11%
11%
6%
13%
11%
19%
0% 20% 40% 60% 80% 100%
Outer London Low PTAL
Outer London Medium PTAL
Outer London High PTAL
Inner London Low PTAL
Inner London Medium PTAL
Inner London High PTAL
Frequency of use of each car
5 or more times a week 2‐4 times a week Once a week Less often
81%
89%
89%
94%
87%
89%
At least oncea week
Source: Residential Parking Behavioural Survey 2011
36
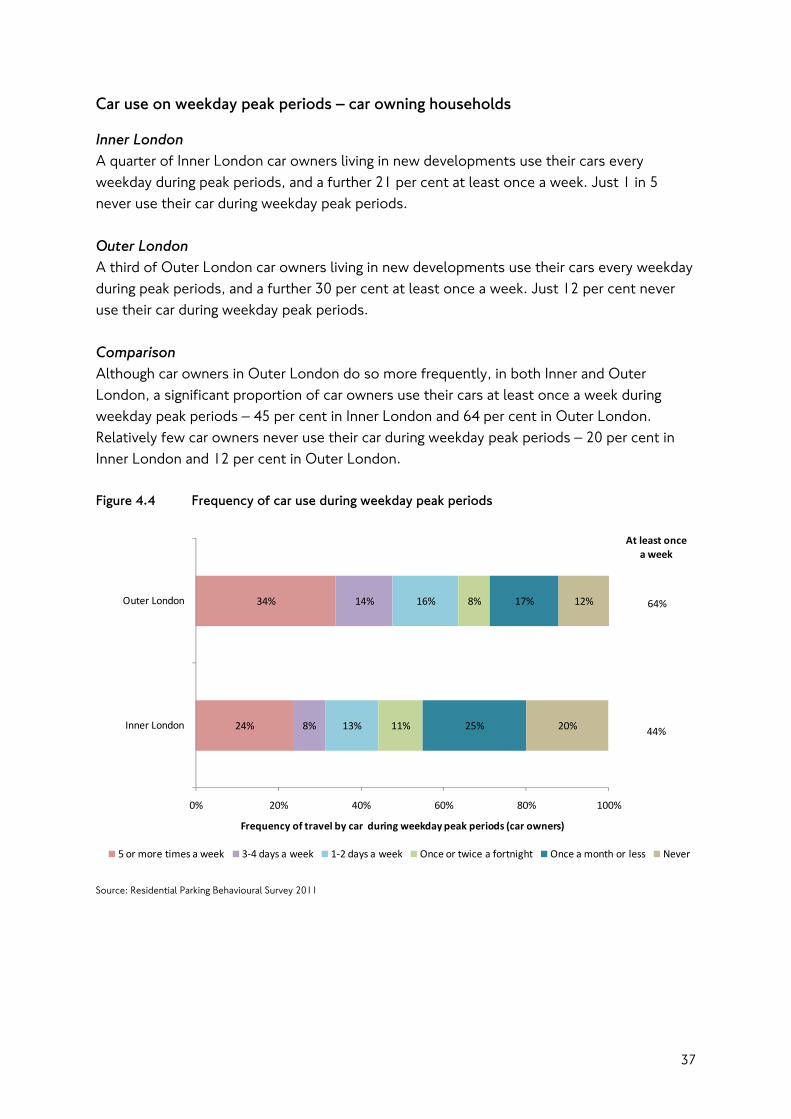
Car use on weekday peak periods – car owning households
Inner London A quarter of Inner London car owners living in new developments use their cars every weekday during peak periods, and a further 21 per cent at least once a week. Just 1 in 5 never use their car during weekday peak periods. Outer London A third of Outer London car owners living in new developments use their cars every weekday during peak periods, and a further 30 per cent at least once a week. Just 12 per cent never use their car during weekday peak periods. Comparison Although car owners in Outer London do so more frequently, in both Inner and Outer London, a significant proportion of car owners use their cars at least once a week during weekday peak periods – 45 per cent in Inner London and 64 per cent in Outer London. Relatively few car owners never use their car during weekday peak periods – 20 per cent in Inner London and 12 per cent in Outer London. Figure 4.4 Frequency of car use during weekday peak periods
24%
34%
8%
14%
13%
16%
11%
8%
25%
17%
20%
12%
0% 20% 40% 60% 80% 100%
Inner London
Outer London
Frequency of travel by car during weekday peak periods (car owners)
5 or more times a week 3‐4 days a week 1‐2 days a week Once or twice a fortnight Once a month or less Never
At least once a week
44%
64%
Source: Residential Parking Behavioural Survey 2011
37
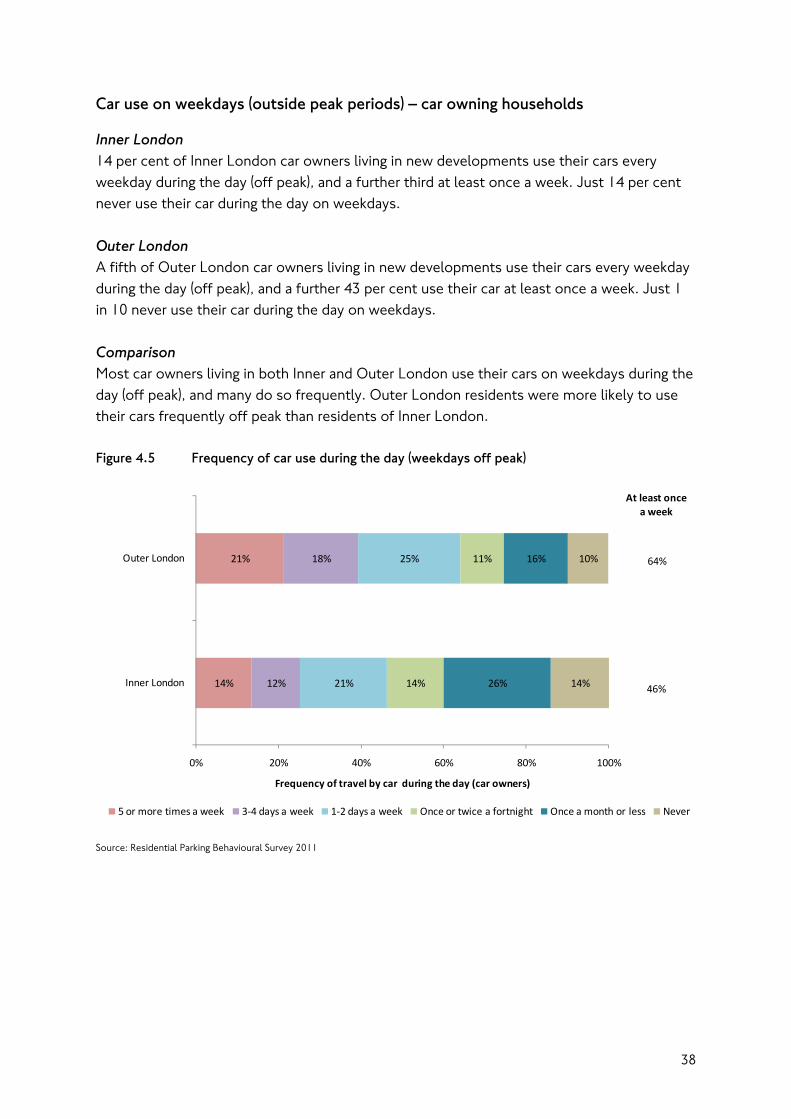
Car use on weekdays (outside peak periods) – car owning households
Inner London 14 per cent of Inner London car owners living in new developments use their cars every weekday during the day (off peak), and a further third at least once a week. Just 14 per cent never use their car during the day on weekdays. Outer London A fifth of Outer London car owners living in new developments use their cars every weekday during the day (off peak), and a further 43 per cent use their car at least once a week. Just 1 in 10 never use their car during the day on weekdays. Comparison Most car owners living in both Inner and Outer London use their cars on weekdays during the day (off peak), and many do so frequently. Outer London residents were more likely to use their cars frequently off peak than residents of Inner London. Figure 4.5 Frequency of car use during the day (weekdays off peak)
14%
21%
12%
18%
21%
25%
14%
11%
26%
16%
14%
10%
0% 20% 40% 60% 80% 100%
Inner London
Outer London
Frequency of travel by car during the day (car owners)
5 or more times a week 3‐4 days a week 1‐2 days a week Once or twice a fortnight Once a month or less Never
At least once a week
46%
64%
Source: Residential Parking Behavioural Survey 2011
38
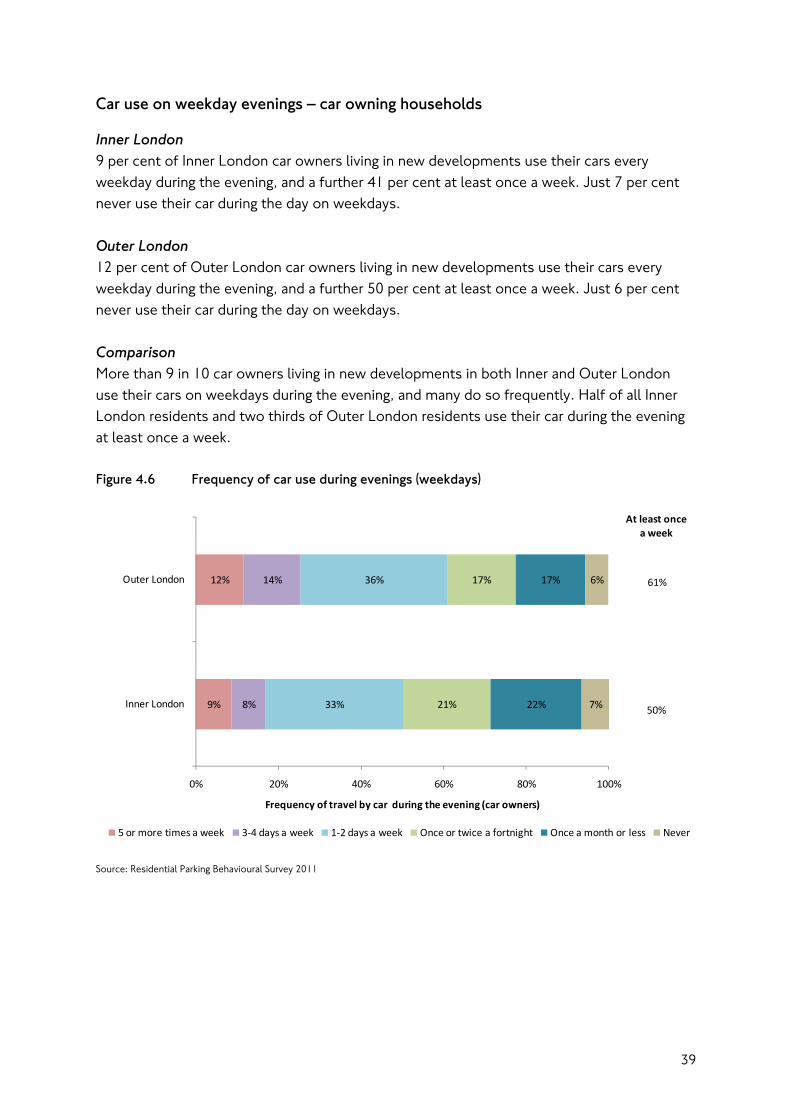
Car use on weekday evenings – car owning households
Inner London 9 per cent of Inner London car owners living in new developments use their cars every weekday during the evening, and a further 41 per cent at least once a week. Just 7 per cent never use their car during the day on weekdays. Outer London 12 per cent of Outer London car owners living in new developments use their cars every weekday during the evening, and a further 50 per cent at least once a week. Just 6 per cent never use their car during the day on weekdays. Comparison More than 9 in 10 car owners living in new developments in both Inner and Outer London use their cars on weekdays during the evening, and many do so frequently. Half of all Inner London residents and two thirds of Outer London residents use their car during the evening at least once a week. Figure 4.6 Frequency of car use during evenings (weekdays)
9%
12%
8%
14%
33%
36%
21%
17%
22%
17%
7%
6%
0% 20% 40% 60% 80% 100%
Inner London
Outer London
Frequency of travel by car during the evening (car owners)
5 or more times a week 3‐4 days a week 1‐2 days a week Once or twice a fortnight Once a month or less Never
At least once a week
50%
61%
Source: Residential Parking Behavioural Survey 2011
39
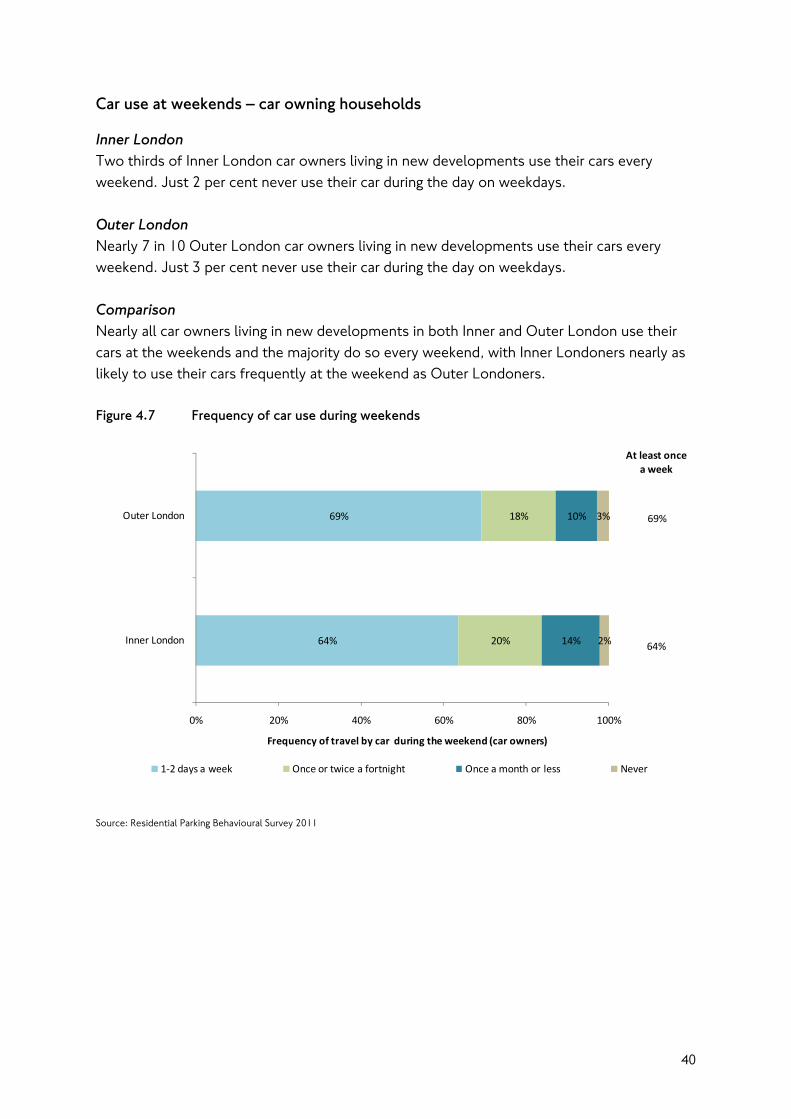
Car use at weekends – car owning households
Inner London Two thirds of Inner London car owners living in new developments use their cars every weekend. Just 2 per cent never use their car during the day on weekdays. Outer London Nearly 7 in 10 Outer London car owners living in new developments use their cars every weekend. Just 3 per cent never use their car during the day on weekdays. Comparison Nearly all car owners living in new developments in both Inner and Outer London use their cars at the weekends and the majority do so every weekend, with Inner Londoners nearly as likely to use their cars frequently at the weekend as Outer Londoners. Figure 4.7 Frequency of car use during weekends
64%
69%
20%
18%
14%
10%
2%
3%
0% 20% 40% 60% 80% 100%
Inner London
Outer London
Frequency of travel by car during the weekend (car owners)
1‐2 days a week Once or twice a fortnight Once a month or less Never
At least once a week
64%
69%
Source: Residential Parking Behavioural Survey 2011
40
Car use by level of parking provision
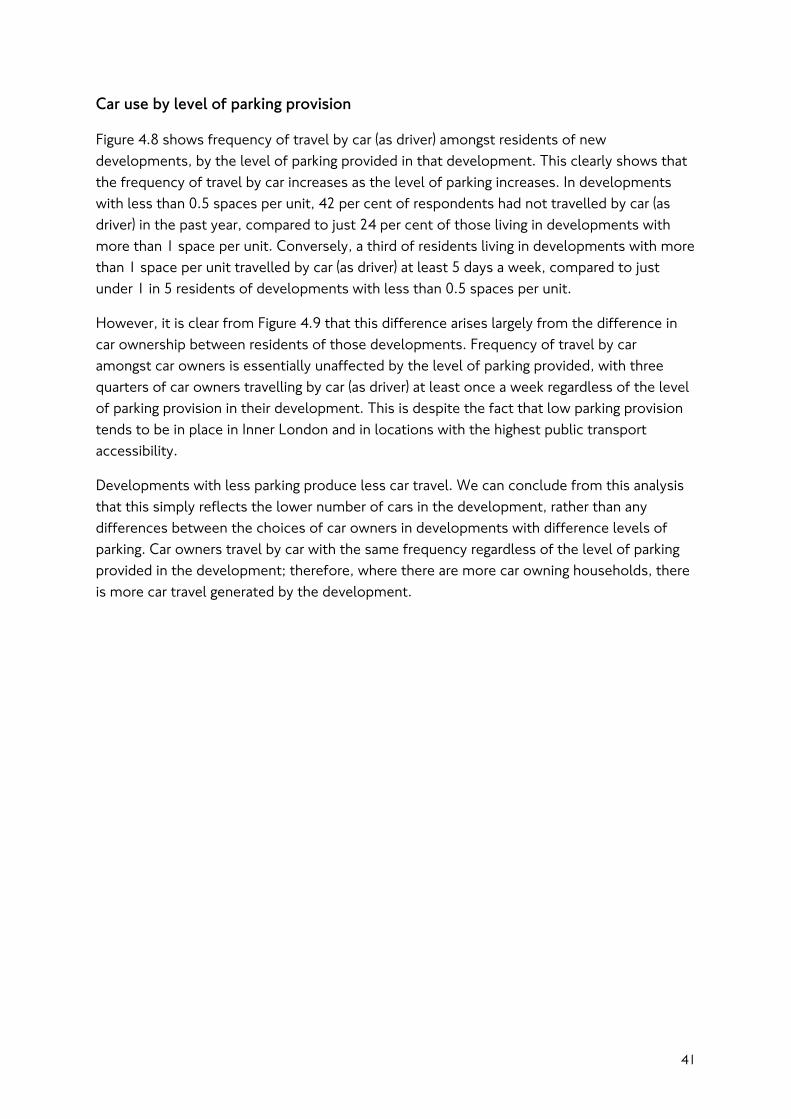
Figure 4.8 shows frequency of travel by car (as driver) amongst residents of new developments, by the level of parking provided in that development. This clearly shows that the frequency of travel by car increases as the level of parking increases. In developments with less than 0.5 spaces per unit, 42 per cent of respondents had not travelled by car (as driver) in the past year, compared to just 24 per cent of those living in developments with more than 1 space per unit. Conversely, a third of residents living in developments with more than 1 space per unit travelled by car (as driver) at least 5 days a week, compared to just under 1 in 5 residents of developments with less than 0.5 spaces per unit.
However, it is clear from Figure 4.9 that this difference arises largely from the difference in car ownership between residents of those developments. Frequency of travel by car amongst car owners is essentially unaffected by the level of parking provided, with three quarters of car owners travelling by car (as driver) at least once a week regardless of the level of parking provision in their development. This is despite the fact that low parking provision tends to be in place in Inner London and in locations with the highest public transport accessibility.
Developments with less parking produce less car travel. We can conclude from this analysis that this simply reflects the lower number of cars in the development, rather than any differences between the choices of car owners in developments with difference levels of parking. Car owners travel by car with the same frequency regardless of the level of parking provided in the development; therefore, where there are more car owning households, there is more car travel generated by the development.
41
Figure 4.8 Frequency of travel by car (as driver) by level of parking provision
19%
28%
34%
10%
11%
10%
12%
17%
17%
17%
14%
15%
42%
30%
24%
0% 20% 40% 60% 80% 100%
Up to 0.5
0.51 to 1
More than 1
Frequency of travel by car ‐ all respondents
5 or more times a week 3‐4 times a week 1‐2 times a week Less often Not in the last year
62%
41%
56%
At least once a week
Source: Residential Parking Behavioural Survey 2011
Figure 4.9 Frequency of travel by car (as driver) by level of parking provision – car owners
37%
37%
42%
17%
15%
13%
21%
23%
20%
13%
13%
14%
12%
12%
11%
0% 20% 40% 60% 80% 100%
Up to 0.5
0.51 to 1
More than 1
Frequency of travel by car ‐ car owners
5 or more times a week 3‐4 times a week 1‐2 times a week Less often Not in the last year
75%
75%
75%
At least once a week
Source: Residential Parking Behavioural Survey 2011
42

Chapter 5 Comparison between new developments and London
Introduction
This Section compares the characteristics of residents of new developments, as identified in this survey, with the total London population, based upon data from TfL’s London Travel Demand Survey. This survey constitutes the best data available about the characteristics of people living in new developments as no population-level data is available. It is reasonable to assume that the characteristics of those living in new developments may differ from the characteristics of people living in all types of housing in London. Such differences do not imply that the survey sample is unrepresentative of the sample population; given the lack of data available, we cannot determine the representativeness of the survey sample beyond the analysis presented in Chapter 1, which demonstrates that the distribution of responses by area and public transport accessibility were in line with that of the sample population. The London Travel Demand Survey The London Travel Demand Survey (LTDS) is the main source of statistics about Londoners’ travel. It is an annual sample survey of 8,000 randomly selected households in London and the surrounding area (within the M25). The survey is conducted face-to-face with all members of the household (aged 5 plus) and includes a one-day travel diary. The data in LTDS have been expanded to represent the household population of Greater London. The data used in the comparative analysis relates to the survey year 2009/10. Key findings
• Residents of new developments were more likely to live in households with two or more adults and less likely to live in single adult households than London residents as a whole. They were also somewhat less likely to have children, although this effect was more pronounced in Outer London (20 per cent of households in new developments contain children compared to 29 per cent of all Outer London households).
• Residents of new developments were wealthier on average than London residents as whole, and this effect was particularly pronounced in Inner London where residents of new developments were more than twice as likely to have a household income of £50,000 or more (45 per cent compared to 20 per cent of all Inner Londoners).
• Residents of new developments were much more likely to live in a flat and less likely to live in a house, particularly a terraced house, than residents of London as a whole. This effect was particularly pronounced in Outer London.
43
• In Outer London, housing tenure patterns were fairly similar in new developments to the region as a whole. In Inner London, the pattern was quite different, largely reflecting the high proportion of Inner London residents who live in social housing (36 per cent). In comparison, relatively residents of new developments were living in social housing (16 per cent).
• Residents of new developments were more likely to own a car than London residents as a whole – 55 per cent in Inner London and 34 per cent in Outer London compared to 27 per cent of Inner Londoners and 48 per cent of Outer Londoners in the general population.
• Residents of new developments were more likely to have access to off-street parking than residents of London as a whole. This is particularly striking given that residents of new developments were more likely to live in a flat and less likely to live in a house.
44
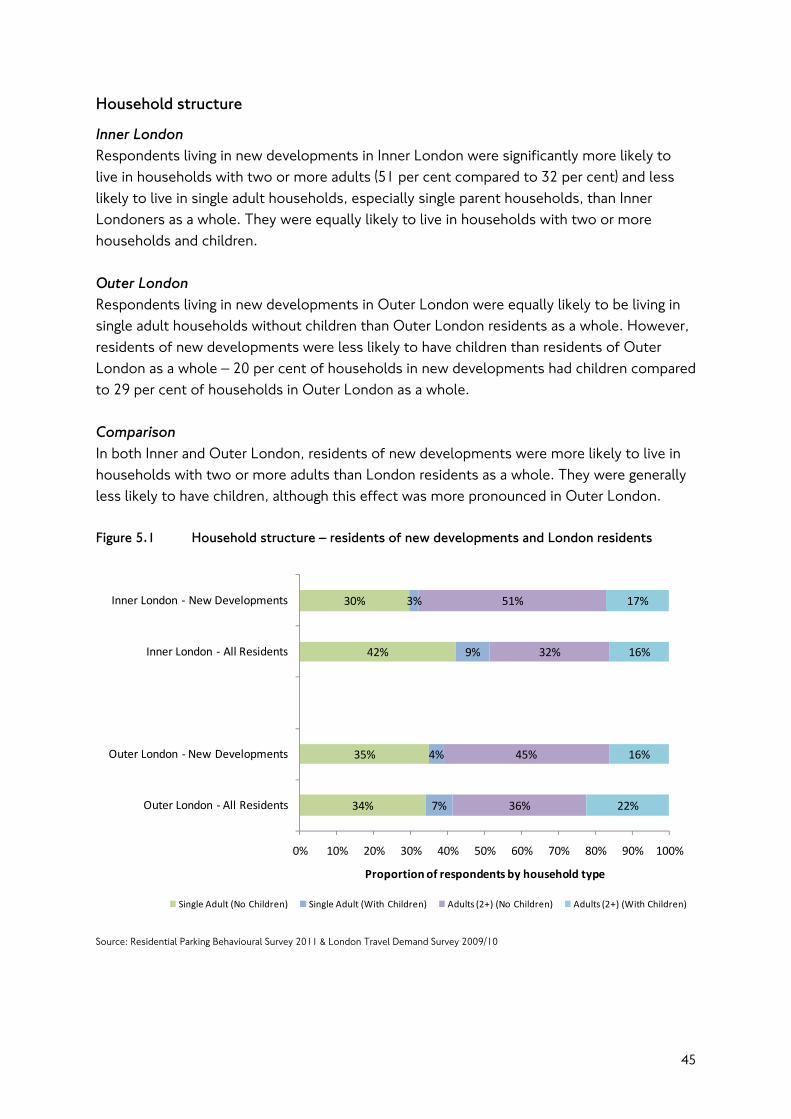
Household structure
Inner London Respondents living in new developments in Inner London were significantly more likely to live in households with two or more adults (51 per cent compared to 32 per cent) and less likely to live in single adult households, especially single parent households, than Inner Londoners as a whole. They were equally likely to live in households with two or more households and children. Outer London Respondents living in new developments in Outer London were equally likely to be living in single adult households without children than Outer London residents as a whole. However, residents of new developments were less likely to have children than residents of Outer London as a whole – 20 per cent of households in new developments had children compared to 29 per cent of households in Outer London as a whole. Comparison In both Inner and Outer London, residents of new developments were more likely to live in households with two or more adults than London residents as a whole. They were generally less likely to have children, although this effect was more pronounced in Outer London. Figure 5.1 Household structure – residents of new developments and London residents
34%
35%
42%
30%
7%
4%
9%
3%
36%
45%
32%
51%
22%
16%
16%
17%
0% 10% 20% 30% 40% 50% 60% 70% 80% 90% 100%
Outer London ‐ All Residents
Outer London ‐New Developments
Inner London ‐ All Residents
Inner London ‐ New Developments
Proportion of respondents by household type
Single Adult (No Children) Single Adult (With Children) Adults (2+) (No Children) Adults (2+) (With Children)
Source: Residential Parking Behavioural Survey 2011 & London Travel Demand Survey 2009/10
45
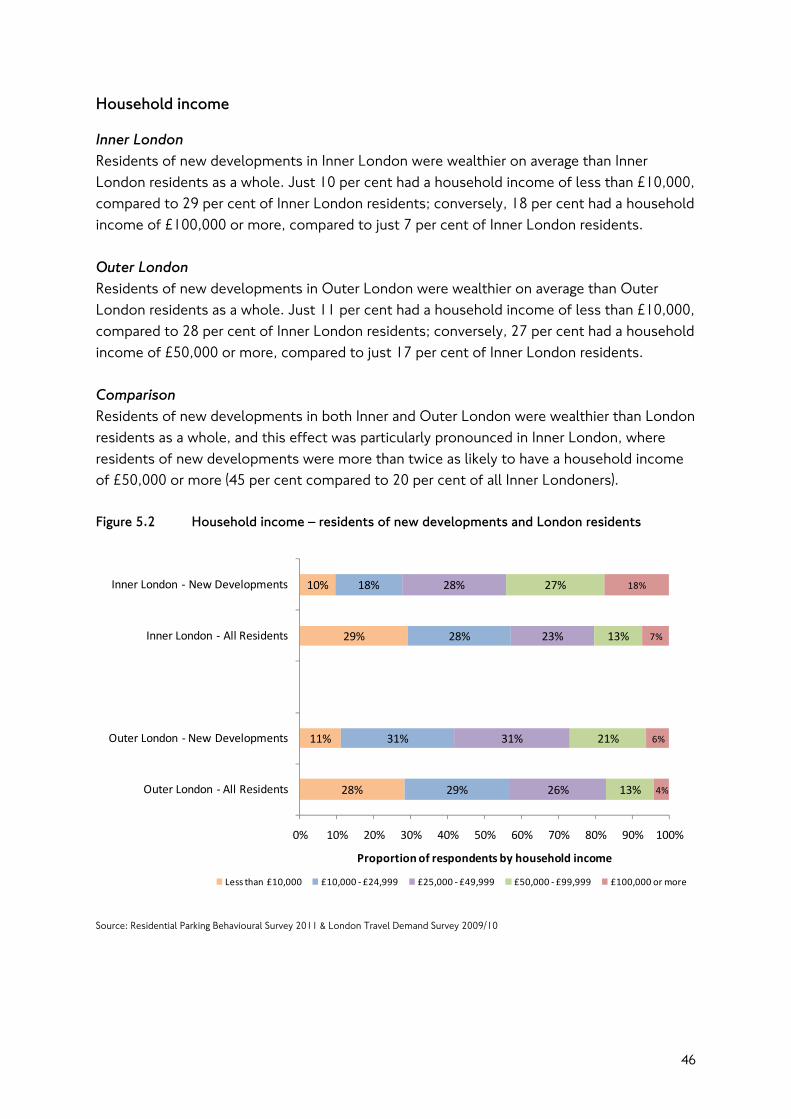
Household income
Inner London Residents of new developments in Inner London were wealthier on average than Inner London residents as a whole. Just 10 per cent had a household income of less than £10,000, compared to 29 per cent of Inner London residents; conversely, 18 per cent had a household income of £100,000 or more, compared to just 7 per cent of Inner London residents. Outer London Residents of new developments in Outer London were wealthier on average than Outer London residents as a whole. Just 11 per cent had a household income of less than £10,000, compared to 28 per cent of Inner London residents; conversely, 27 per cent had a household income of £50,000 or more, compared to just 17 per cent of Inner London residents. Comparison Residents of new developments in both Inner and Outer London were wealthier than London residents as a whole, and this effect was particularly pronounced in Inner London, where residents of new developments were more than twice as likely to have a household income of £50,000 or more (45 per cent compared to 20 per cent of all Inner Londoners). Figure 5.2 Household income – residents of new developments and London residents
28%
11%
29%
10%
29%
31%
28%
18%
26%
31%
23%
28%
13%
21%
13%
27%
4%
6%
7%
18%
0% 10% 20% 30% 40% 50% 60% 70% 80% 90% 100%
Outer London ‐ All Residents
Outer London ‐New Developments
Inner London ‐ All Residents
Inner London ‐ New Developments
Proportion of respondents by household income
Less than £10,000 £10,000 ‐ £24,999 £25,000 ‐ £49,999 £50,000 ‐ £99,999 £100,000 or more
Source: Residential Parking Behavioural Survey 2011 & London Travel Demand Survey 2009/10
46
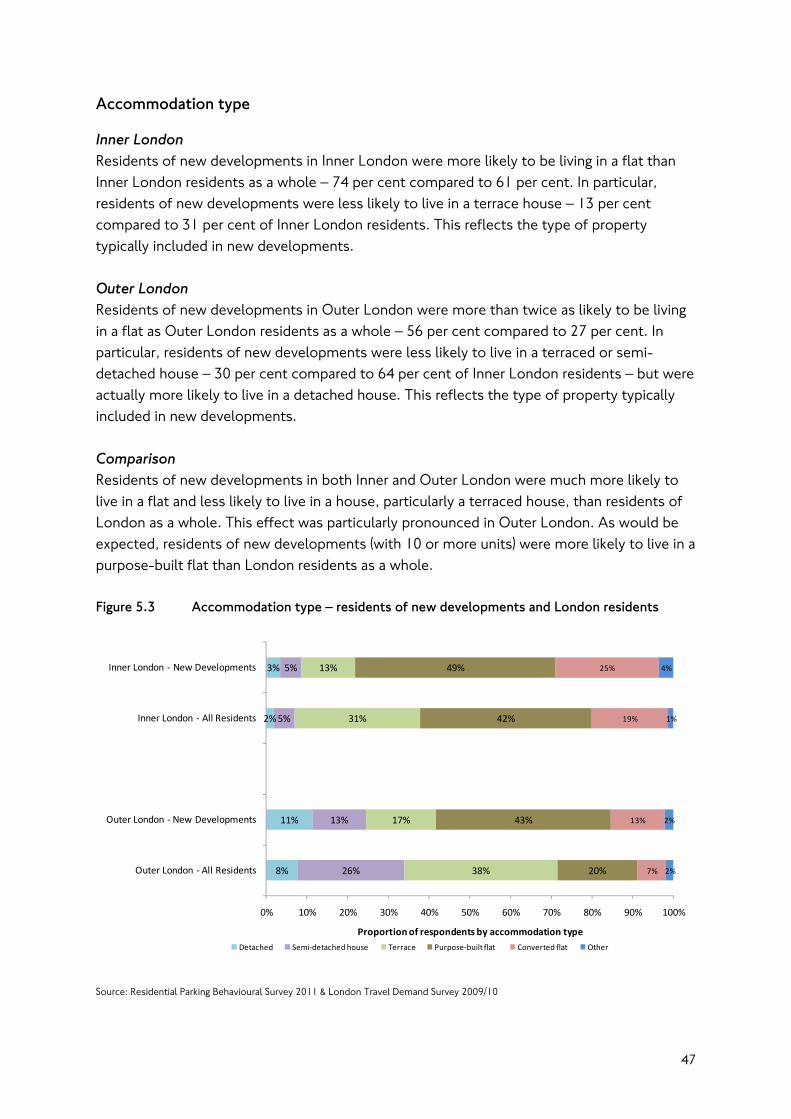
Accommodation type
Inner London Residents of new developments in Inner London were more likely to be living in a flat than Inner London residents as a whole – 74 per cent compared to 61 per cent. In particular, residents of new developments were less likely to live in a terrace house – 13 per cent compared to 31 per cent of Inner London residents. This reflects the type of property typically included in new developments. Outer London Residents of new developments in Outer London were more than twice as likely to be living in a flat as Outer London residents as a whole – 56 per cent compared to 27 per cent. In particular, residents of new developments were less likely to live in a terraced or semi-detached house – 30 per cent compared to 64 per cent of Inner London residents – but were actually more likely to live in a detached house. This reflects the type of property typically included in new developments. Comparison Residents of new developments in both Inner and Outer London were much more likely to live in a flat and less likely to live in a house, particularly a terraced house, than residents of London as a whole. This effect was particularly pronounced in Outer London. As would be expected, residents of new developments (with 10 or more units) were more likely to live in a purpose-built flat than London residents as a whole. Figure 5.3 Accommodation type – residents of new developments and London residents
8%
11%
2%
3%
26%
13%
5%
5%
38%
17%
31%
13%
20%
43%
42%
49%
7%
13%
19%
25%
2%
2%
1%
4%
0% 10% 20% 30% 40% 50% 60% 70% 80% 90% 100%
Outer London ‐ All Residents
Outer London ‐ New Developments
Inner London ‐ All Residents
Inner London ‐ New Developments
Proportion of respondents by accommodation typeDetached Semi‐detached house Terrace Purpose‐built flat Converted flat Other
Source: Residential Parking Behavioural Survey 2011 & London Travel Demand Survey 2009/10
47
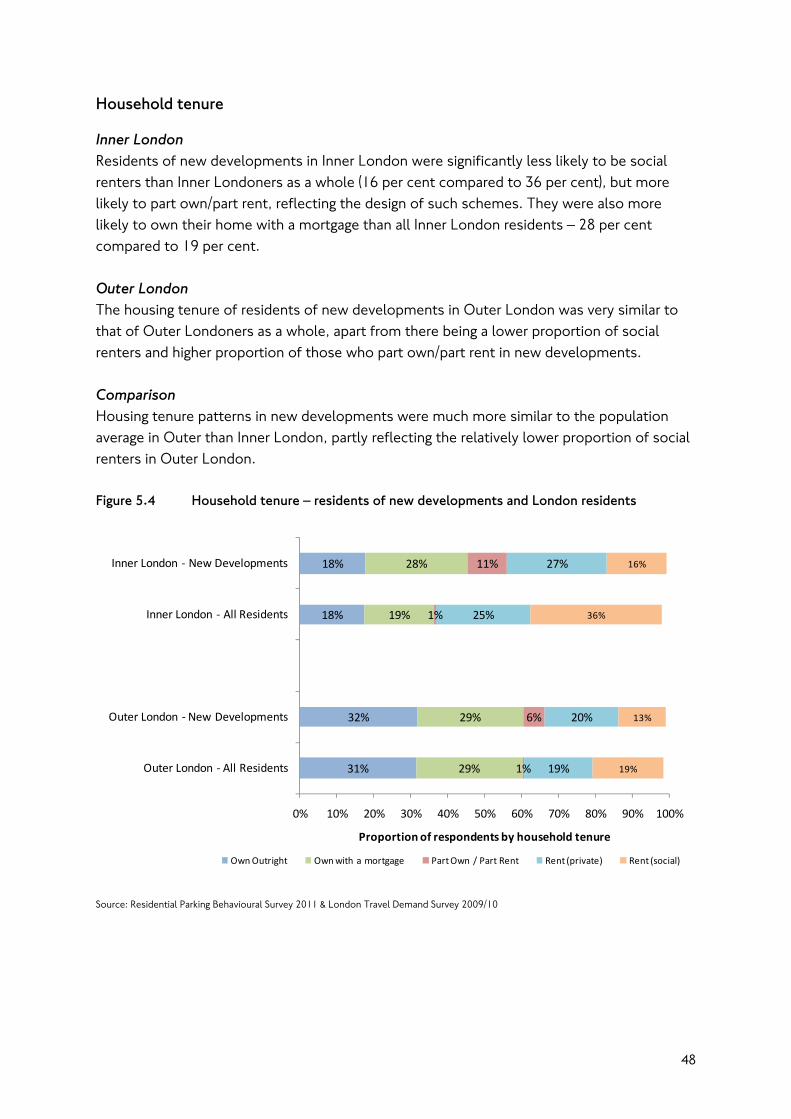
Household tenure
Inner London Residents of new developments in Inner London were significantly less likely to be social renters than Inner Londoners as a whole (16 per cent compared to 36 per cent), but more likely to part own/part rent, reflecting the design of such schemes. They were also more likely to own their home with a mortgage than all Inner London residents – 28 per cent compared to 19 per cent. Outer London The housing tenure of residents of new developments in Outer London was very similar to that of Outer Londoners as a whole, apart from there being a lower proportion of social renters and higher proportion of those who part own/part rent in new developments. Comparison Housing tenure patterns in new developments were much more similar to the population average in Outer than Inner London, partly reflecting the relatively lower proportion of social renters in Outer London. Figure 5.4 Household tenure – residents of new developments and London residents
31%
32%
18%
18%
29%
29%
19%
28%
1%
6%
1%
11%
19%
20%
25%
27%
19%
13%
36%
16%
0% 10% 20% 30% 40% 50% 60% 70% 80% 90% 100%
Outer London ‐ All Residents
Outer London ‐New Developments
Inner London ‐ All Residents
Inner London ‐ New Developments
Proportion of respondents by household tenure
Own Outright Own with a mortgage Part Own / Part Rent Rent (private) Rent (social)
Source: Residential Parking Behavioural Survey 2011 & London Travel Demand Survey 2009/10
48
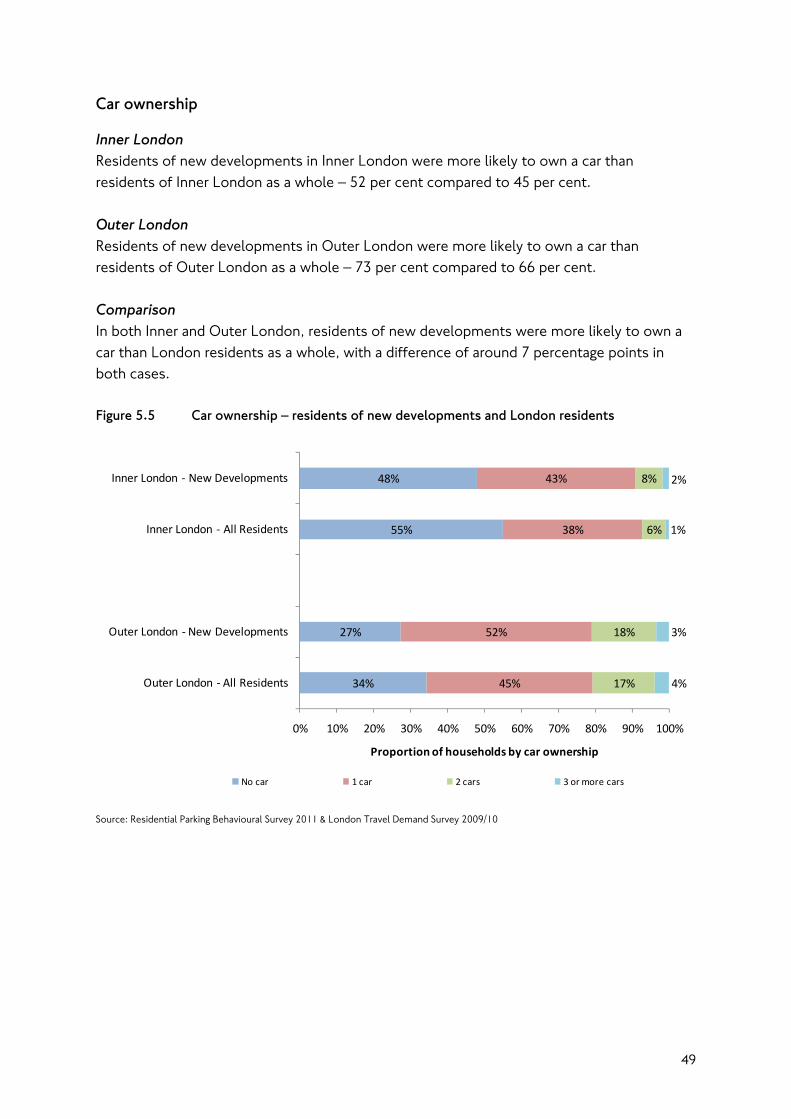
Car ownership
Inner London Residents of new developments in Inner London were more likely to own a car than residents of Inner London as a whole – 52 per cent compared to 45 per cent. Outer London Residents of new developments in Outer London were more likely to own a car than residents of Outer London as a whole – 73 per cent compared to 66 per cent. Comparison In both Inner and Outer London, residents of new developments were more likely to own a car than London residents as a whole, with a difference of around 7 percentage points in both cases. Figure 5.5 Car ownership – residents of new developments and London residents
34%
27%
55%
48%
45%
52%
38%
43%
17%
18%
6%
8%
4%
3%
1%
2%
0% 10% 20% 30% 40% 50% 60% 70% 80% 90% 100%
Outer London ‐ All Residents
Outer London ‐New Developments
Inner London ‐ All Residents
Inner London ‐ New Developments
Proportion of households by car ownership
No car 1 car 2 cars 3 or more cars
Source: Residential Parking Behavioural Survey 2011 & London Travel Demand Survey 2009/10
49
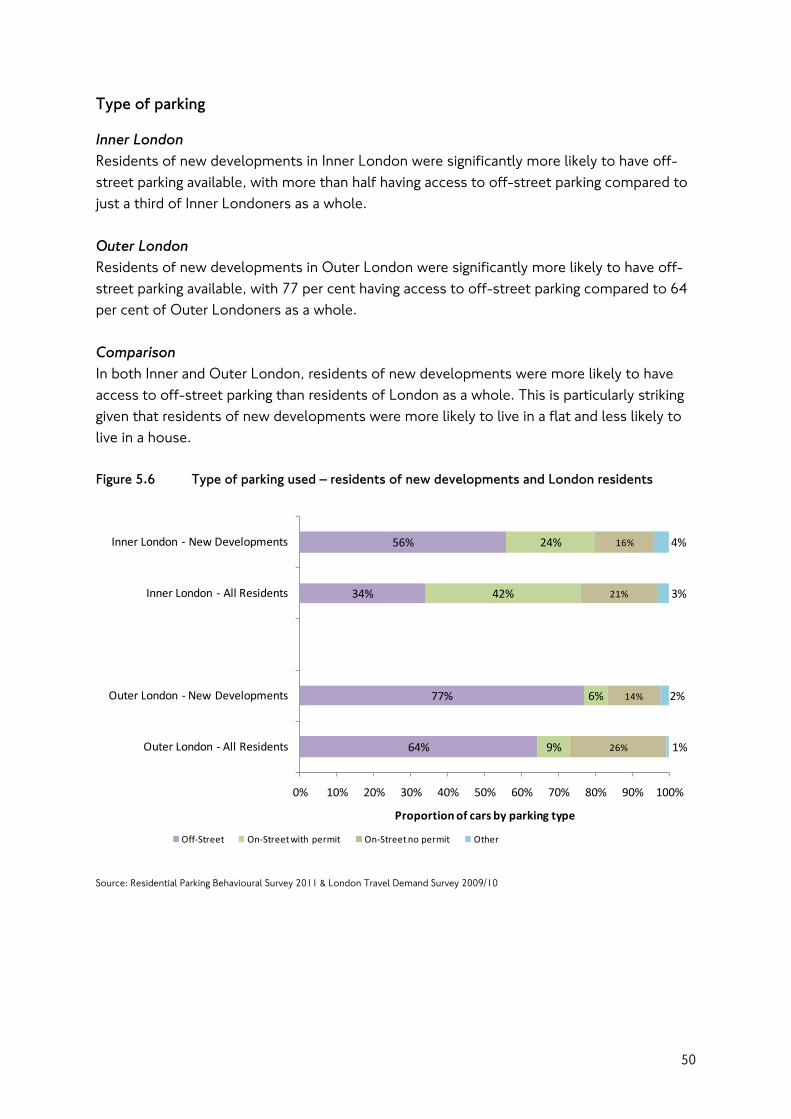
Type of parking
Inner London Residents of new developments in Inner London were significantly more likely to have off-street parking available, with more than half having access to off-street parking compared to just a third of Inner Londoners as a whole. Outer London Residents of new developments in Outer London were significantly more likely to have off-street parking available, with 77 per cent having access to off-street parking compared to 64 per cent of Outer Londoners as a whole. Comparison In both Inner and Outer London, residents of new developments were more likely to have access to off-street parking than residents of London as a whole. This is particularly striking given that residents of new developments were more likely to live in a flat and less likely to live in a house. Figure 5.6 Type of parking used – residents of new developments and London residents
64%
77%
34%
56%
9%
6%
42%
24%
26%
14%
21%
16%
1%
2%
3%
4%
0% 10% 20% 30% 40% 50% 60% 70% 80% 90% 100%
Outer London ‐ All Residents
Outer London ‐New Developments
Inner London ‐ All Residents
Inner London ‐ New Developments
Proportion of cars by parking type
Off‐Street On‐Street with permit On‐Street no permit Other
Source: Residential Parking Behavioural Survey 2011 & London Travel Demand Survey 2009/10
50
Chapter 6 Attitudes to car ownership, use and parking
Introduction
This Section describes the attitudes of respondents towards aspects of their home, local area and travel patterns. Topics covered include parking and travel by car, public transport, and active modes. The Section also describes what aspects of travel and accessibility respondents took into account when choosing where to live. Key findings
• Residents of new developments in Outer London were more than twice as likely as those in Outer London to say that their lifestyle was dependent on having a car. All of those who said their lifestyle was dependent on having a car did own a car, and around one in five of those who said their lifestyle was not dependent on having a car nonetheless did own a car.
• Just under half of car owners said that they were actively trying to reduce the amount they travel by car. Although Outer Londoners were more likely to say that they ‘just get in their car and go’, in both Inner and Outer London the majority of respondents did not agree with this statement.
• Key factors in deciding where to live are access to public transport and travel distance or time to work (particularly for Inner London residents). The availability of parking is more important to Outer London than Inner London residents and, as would be expected, more important to car owners.
• Outer London residents are more satisfied with the availability of on- and off-street parking for residents and visitors where they live. A third of Inner London residents consider the availability of off-street parking to be very poor. However, the majority of Inner London residents who said that off-street parking was a major influence when deciding where to live said that it was good. In general, there was a close relationship between the importance attached to aspects of parking and satisfaction, with residents having selected a home and area that could meet their needs.
• Only a minority of respondents agreed that the parking restrictions in their area are necessary, and car owners were less likely than non-car owners to agree with this statement.
• Most respondents said that they feel safe walking to and from their vehicle and just over half find it easy to park on-street in their local area.
51
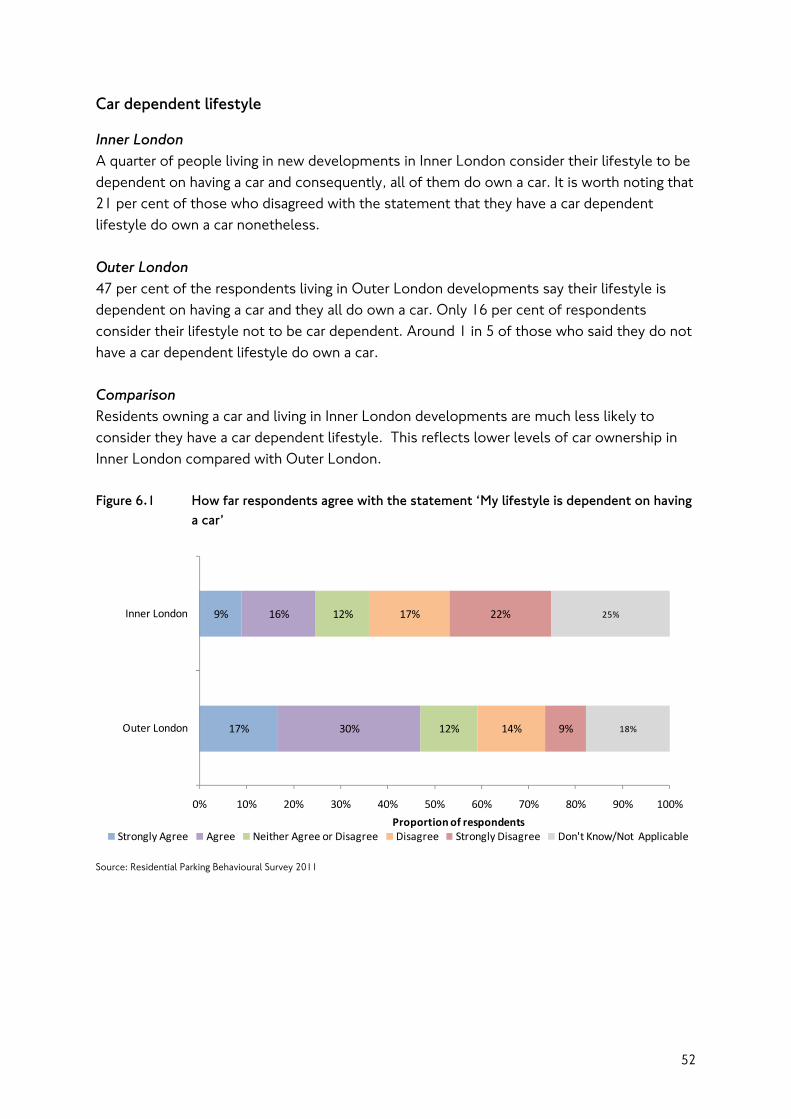
Car dependent lifestyle
Inner London A quarter of people living in new developments in Inner London consider their lifestyle to be dependent on having a car and consequently, all of them do own a car. It is worth noting that 21 per cent of those who disagreed with the statement that they have a car dependent lifestyle do own a car nonetheless. Outer London 47 per cent of the respondents living in Outer London developments say their lifestyle is dependent on having a car and they all do own a car. Only 16 per cent of respondents consider their lifestyle not to be car dependent. Around 1 in 5 of those who said they do not have a car dependent lifestyle do own a car. Comparison Residents owning a car and living in Inner London developments are much less likely to consider they have a car dependent lifestyle. This reflects lower levels of car ownership in Inner London compared with Outer London. Figure 6.1 How far respondents agree with the statement ‘My lifestyle is dependent on having
a car’
17%
9%
30%
16%
12%
12%
14%
17%
9%
22%
18%
25%
0% 10% 20% 30% 40% 50% 60% 70% 80% 90% 100%
Outer London
Inner London
Proportion of respondentsStrongly Agree Agree Neither Agree or Disagree Disagree Strongly Disagree Don't Know/Not Applicable
Source: Residential Parking Behavioural Survey 2011
52
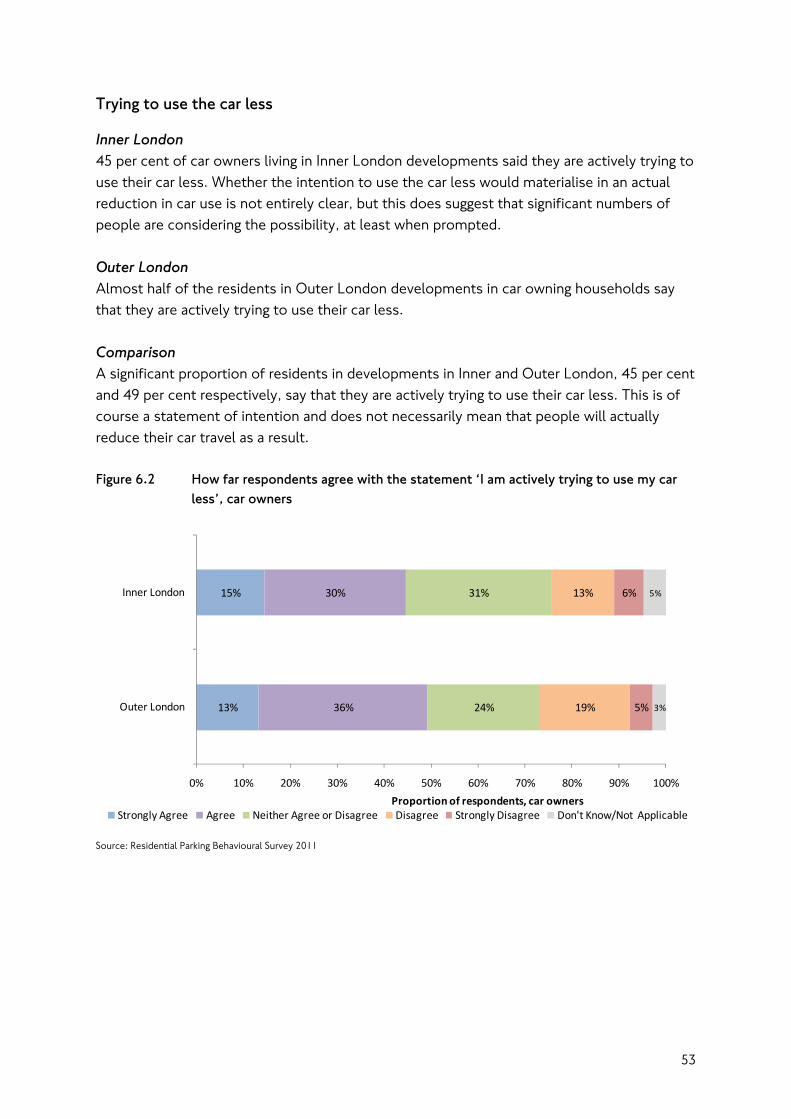
Trying to use the car less
Inner London 45 per cent of car owners living in Inner London developments said they are actively trying to use their car less. Whether the intention to use the car less would materialise in an actual reduction in car use is not entirely clear, but this does suggest that significant numbers of people are considering the possibility, at least when prompted. Outer London Almost half of the residents in Outer London developments in car owning households say that they are actively trying to use their car less. Comparison A significant proportion of residents in developments in Inner and Outer London, 45 per cent and 49 per cent respectively, say that they are actively trying to use their car less. This is of course a statement of intention and does not necessarily mean that people will actually reduce their car travel as a result. Figure 6.2 How far respondents agree with the statement ‘I am actively trying to use my car
less’, car owners
13%
15%
36%
30%
24%
31%
19%
13%
5%
6%
3%
5%
0% 10% 20% 30% 40% 50% 60% 70% 80% 90% 100%
Outer London
Inner London
Proportion of respondents, car ownersStrongly Agree Agree Neither Agree or Disagree Disagree Strongly Disagree Don't Know/Not Applicable
Source: Residential Parking Behavioural Survey 2011
53
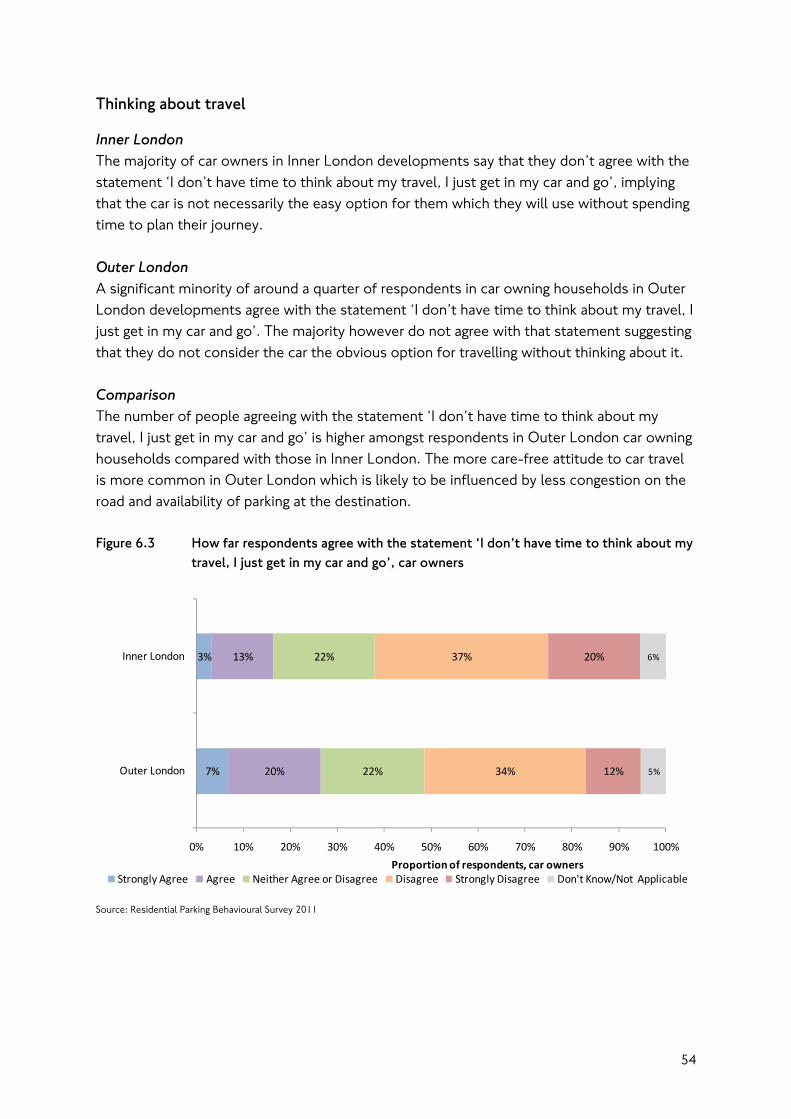
Thinking about travel
Inner London The majority of car owners in Inner London developments say that they don’t agree with the statement ‘I don’t have time to think about my travel, I just get in my car and go’, implying that the car is not necessarily the easy option for them which they will use without spending time to plan their journey. Outer London A significant minority of around a quarter of respondents in car owning households in Outer London developments agree with the statement ‘I don’t have time to think about my travel, I just get in my car and go’. The majority however do not agree with that statement suggesting that they do not consider the car the obvious option for travelling without thinking about it. Comparison The number of people agreeing with the statement ‘I don’t have time to think about my travel, I just get in my car and go’ is higher amongst respondents in Outer London car owning households compared with those in Inner London. The more care-free attitude to car travel is more common in Outer London which is likely to be influenced by less congestion on the road and availability of parking at the destination. Figure 6.3 How far respondents agree with the statement ‘I don’t have time to think about my
travel, I just get in my car and go’, car owners
7%
3%
20%
13%
22%
22%
34%
37%
12%
20%
5%
6%
0% 10% 20% 30% 40% 50% 60% 70% 80% 90% 100%
Outer London
Inner London
Proportion of respondents, car ownersStrongly Agree Agree Neither Agree or Disagree Disagree Strongly Disagree Don't Know/Not Applicable
Source: Residential Parking Behavioural Survey 2011
54
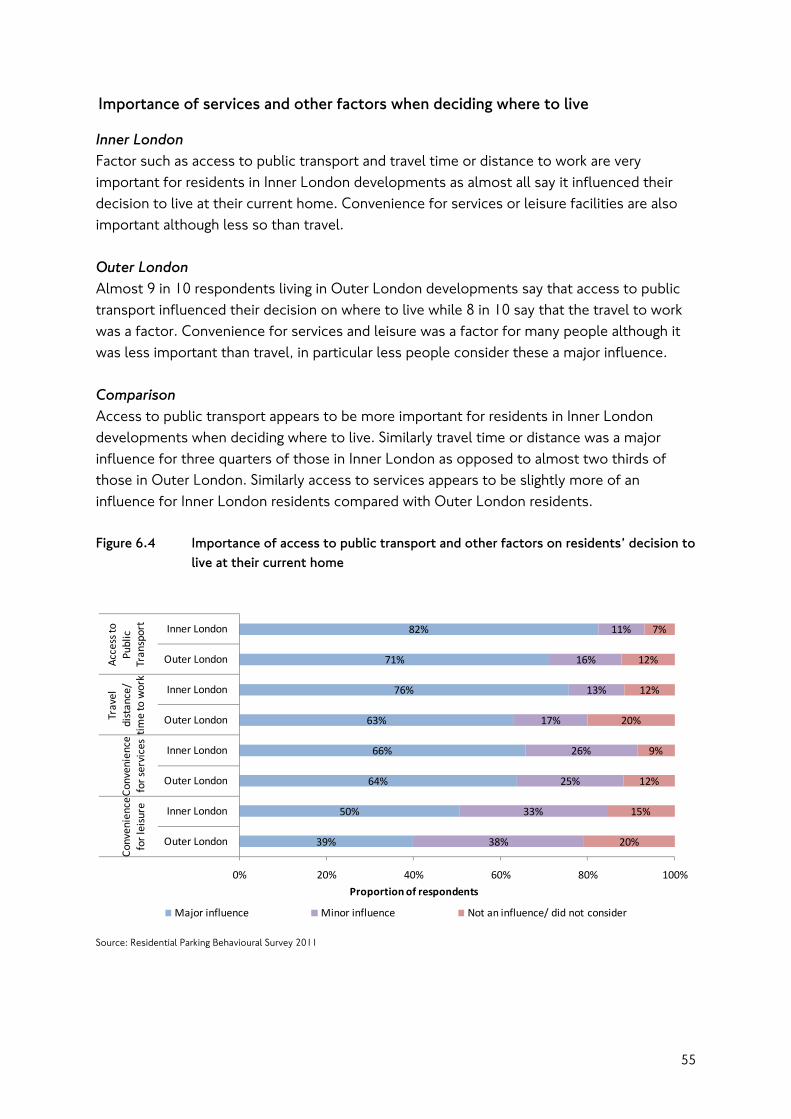
Importance of services and other factors when deciding where to live
Inner London Factor such as access to public transport and travel time or distance to work are very important for residents in Inner London developments as almost all say it influenced their decision to live at their current home. Convenience for services or leisure facilities are also important although less so than travel. Outer London Almost 9 in 10 respondents living in Outer London developments say that access to public transport influenced their decision on where to live while 8 in 10 say that the travel to work was a factor. Convenience for services and leisure was a factor for many people although it was less important than travel, in particular less people consider these a major influence. Comparison Access to public transport appears to be more important for residents in Inner London developments when deciding where to live. Similarly travel time or distance was a major influence for three quarters of those in Inner London as opposed to almost two thirds of those in Outer London. Similarly access to services appears to be slightly more of an influence for Inner London residents compared with Outer London residents. Figure 6.4 Importance of access to public transport and other factors on residents’ decision to
live at their current home
39%
50%
64%
66%
63%
76%
71%
82%
38%
33%
25%
26%
17%
13%
16%
11%
20%
15%
12%
9%
20%
12%
12%
7%
0% 20% 40% 60% 80% 100%
Outer London
Inner London
Outer London
Inner London
Outer London
Inner London
Outer London
Inner London
Convenience
for leisure
Convenience
for services
Travel
distance/
time to work
Access to
Public
Transport
Proportion of respondents
Major influence Minor influence Not an influence/ did not consider
Source: Residential Parking Behavioural Survey 2011
55
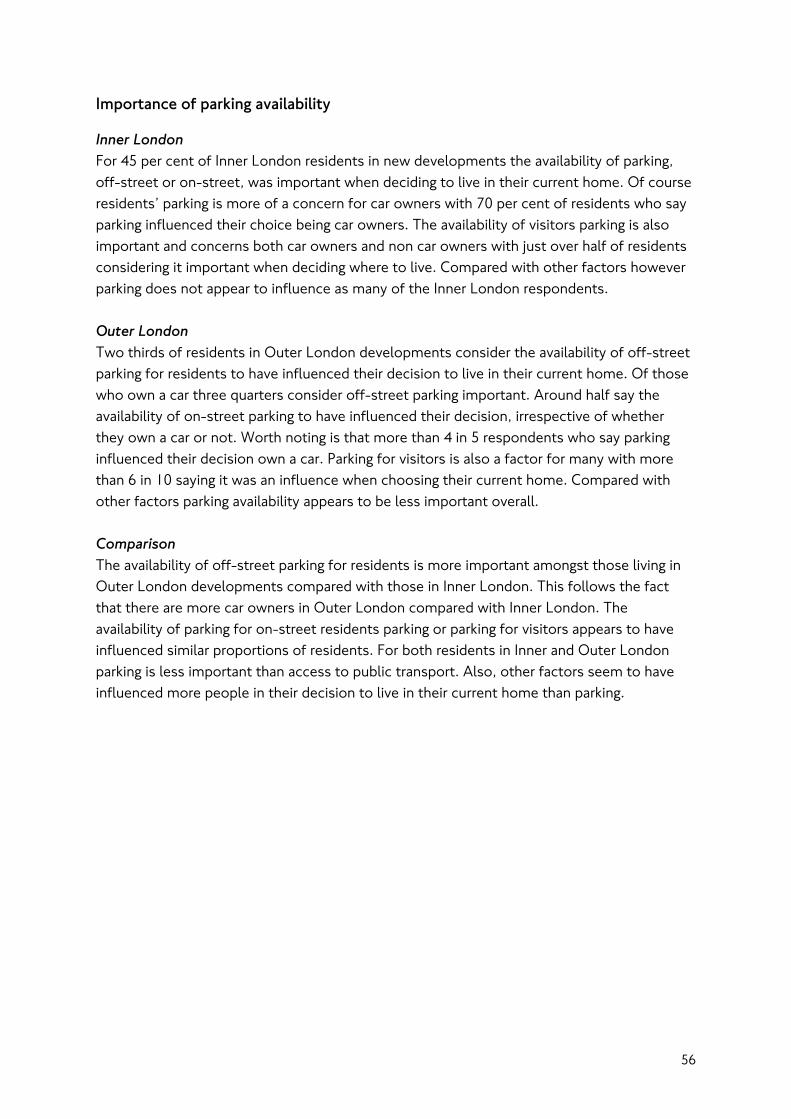
Importance of parking availability
Inner London For 45 per cent of Inner London residents in new developments the availability of parking, off-street or on-street, was important when deciding to live in their current home. Of course residents’ parking is more of a concern for car owners with 70 per cent of residents who say parking influenced their choice being car owners. The availability of visitors parking is also important and concerns both car owners and non car owners with just over half of residents considering it important when deciding where to live. Compared with other factors however parking does not appear to influence as many of the Inner London respondents. Outer London Two thirds of residents in Outer London developments consider the availability of off-street parking for residents to have influenced their decision to live in their current home. Of those who own a car three quarters consider off-street parking important. Around half say the availability of on-street parking to have influenced their decision, irrespective of whether they own a car or not. Worth noting is that more than 4 in 5 respondents who say parking influenced their decision own a car. Parking for visitors is also a factor for many with more than 6 in 10 saying it was an influence when choosing their current home. Compared with other factors parking availability appears to be less important overall. Comparison The availability of off-street parking for residents is more important amongst those living in Outer London developments compared with those in Inner London. This follows the fact that there are more car owners in Outer London compared with Inner London. The availability of parking for on-street residents parking or parking for visitors appears to have influenced similar proportions of residents. For both residents in Inner and Outer London parking is less important than access to public transport. Also, other factors seem to have influenced more people in their decision to live in their current home than parking.
56
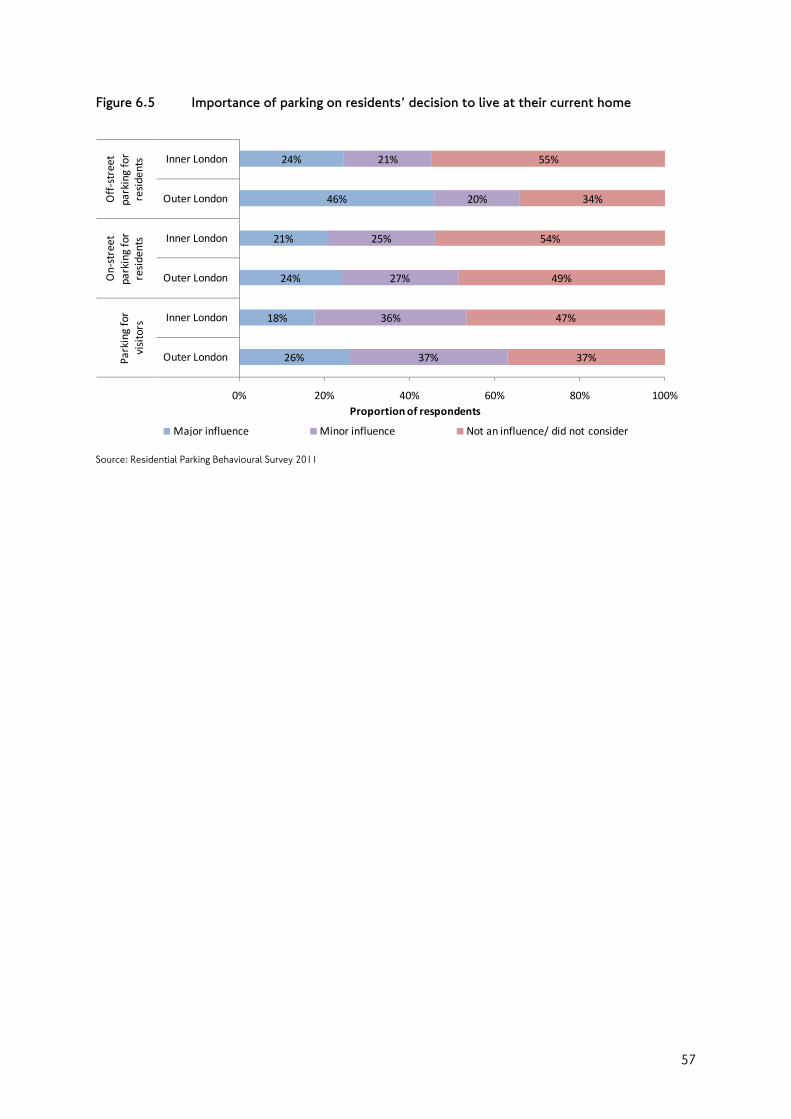
Figure 6.5 Importance of parking on residents’ decision to live at their current home
26%
18%
24%
21%
46%
24%
37%
36%
27%
25%
20%
21%
37%
47%
49%
54%
34%
55%
0% 20% 40% 60% 80% 100%
Outer London
Inner London
Outer London
Inner London
Outer London
Inner London
Parking for
visitors
On‐street
parking for
residents
Off‐street
parking for
residents
Proportion of respondents
Major influence Minor influence Not an influence/ did not consider
Source: Residential Parking Behavioural Survey 2011
57
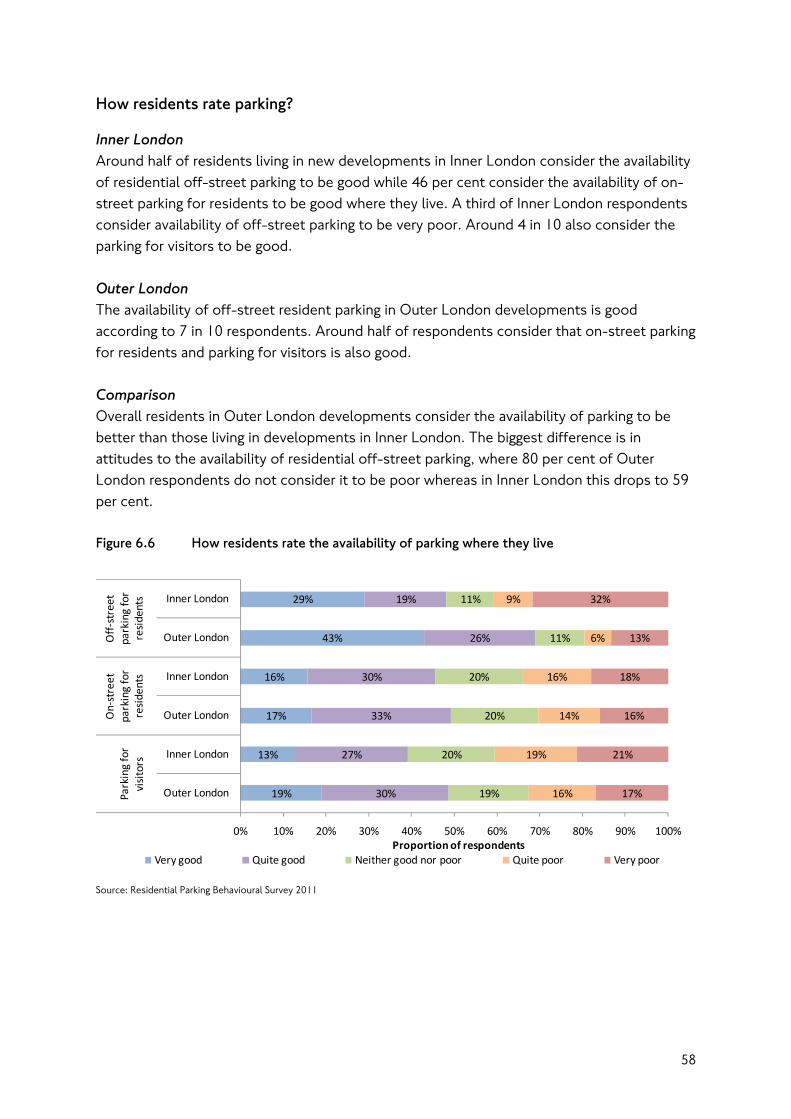
How residents rate parking?
Inner London Around half of residents living in new developments in Inner London consider the availability of residential off-street parking to be good while 46 per cent consider the availability of on-street parking for residents to be good where they live. A third of Inner London respondents consider availability of off-street parking to be very poor. Around 4 in 10 also consider the parking for visitors to be good. Outer London The availability of off-street resident parking in Outer London developments is good according to 7 in 10 respondents. Around half of respondents consider that on-street parking for residents and parking for visitors is also good. Comparison Overall residents in Outer London developments consider the availability of parking to be better than those living in developments in Inner London. The biggest difference is in attitudes to the availability of residential off-street parking, where 80 per cent of Outer London respondents do not consider it to be poor whereas in Inner London this drops to 59 per cent. Figure 6.6 How residents rate the availability of parking where they live
19%
13%
17%
16%
43%
29%
30%
27%
33%
30%
26%
19%
19%
20%
20%
20%
11%
11%
16%
19%
14%
16%
6%
9%
17%
21%
16%
18%
13%
32%
0% 10% 20% 30% 40% 50% 60% 70% 80% 90% 100%
Outer London
Inner London
Outer London
Inner London
Outer London
Inner London
Parking for
visitors
On‐street
parking for
residents
Off‐street
parking for
residents
Proportion of respondentsVery good Quite good Neither good nor poor Quite poor Very poor
Source: Residential Parking Behavioural Survey 2011
58
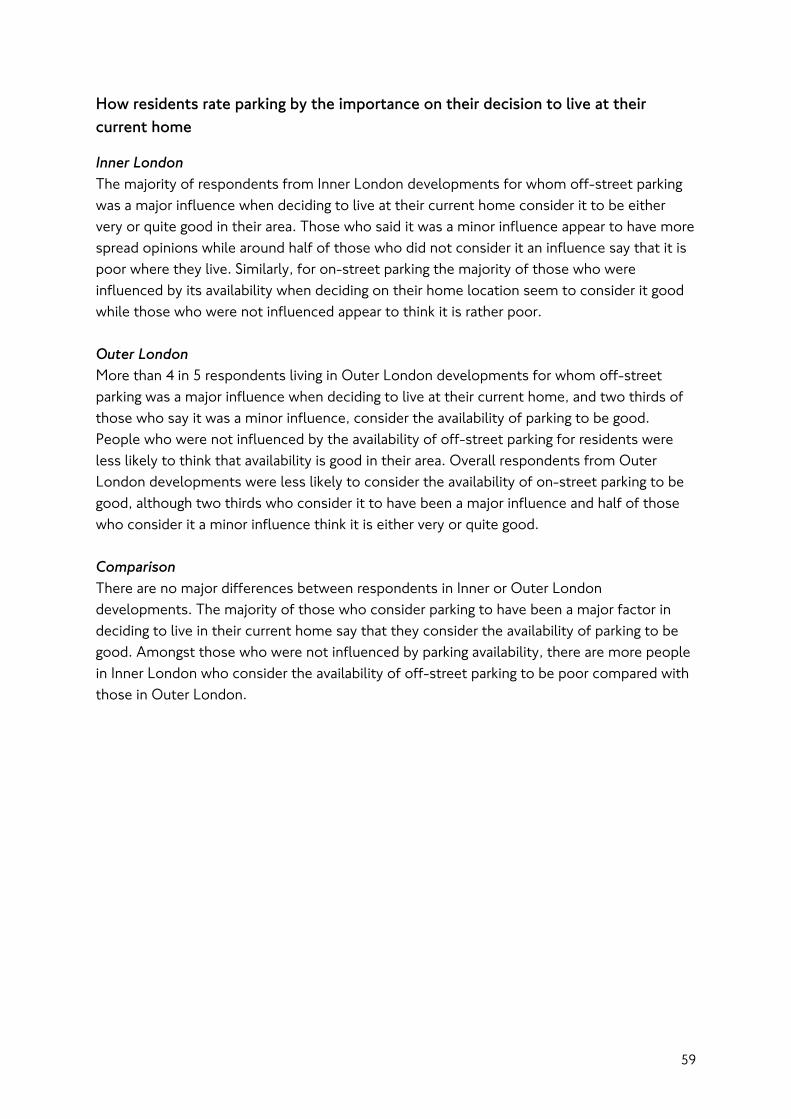
How residents rate parking by the importance on their decision to live at their current home
Inner London The majority of respondents from Inner London developments for whom off-street parking was a major influence when deciding to live at their current home consider it to be either very or quite good in their area. Those who said it was a minor influence appear to have more spread opinions while around half of those who did not consider it an influence say that it is poor where they live. Similarly, for on-street parking the majority of those who were influenced by its availability when deciding on their home location seem to consider it good while those who were not influenced appear to think it is rather poor. Outer London More than 4 in 5 respondents living in Outer London developments for whom off-street parking was a major influence when deciding to live at their current home, and two thirds of those who say it was a minor influence, consider the availability of parking to be good. People who were not influenced by the availability of off-street parking for residents were less likely to think that availability is good in their area. Overall respondents from Outer London developments were less likely to consider the availability of on-street parking to be good, although two thirds who consider it to have been a major influence and half of those who consider it a minor influence think it is either very or quite good. Comparison There are no major differences between respondents in Inner or Outer London developments. The majority of those who consider parking to have been a major factor in deciding to live in their current home say that they consider the availability of parking to be good. Amongst those who were not influenced by parking availability, there are more people in Inner London who consider the availability of off-street parking to be poor compared with those in Outer London.
59
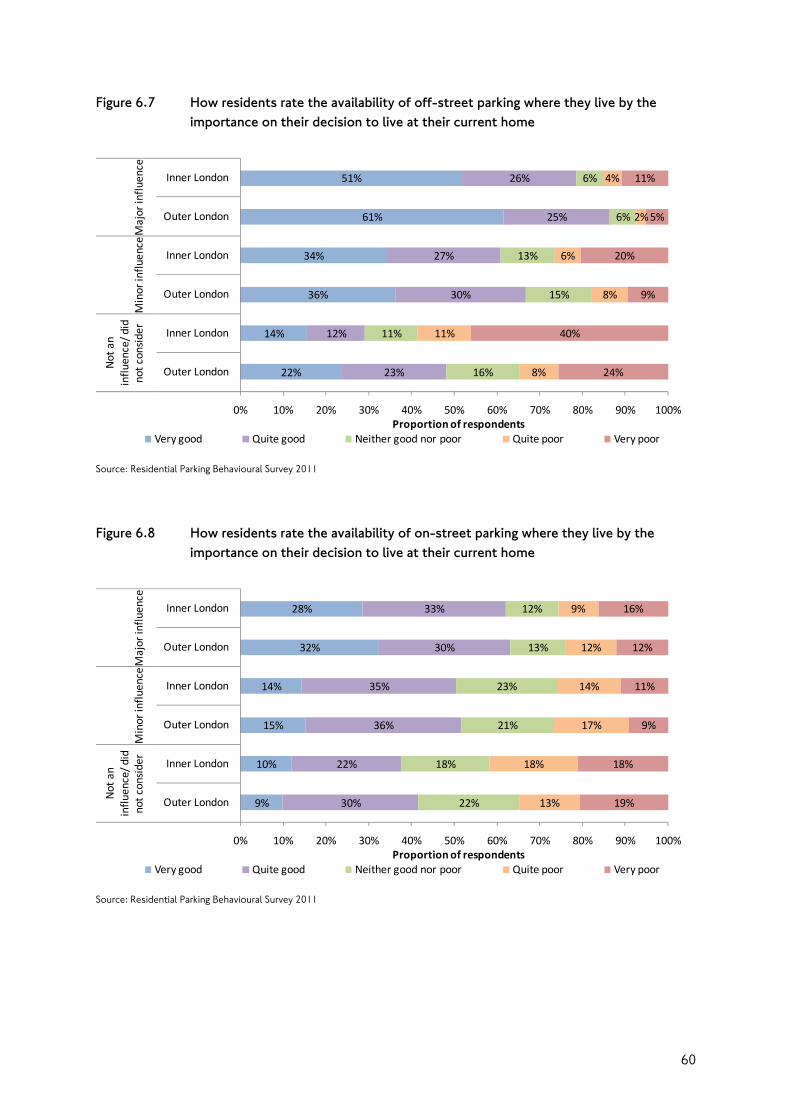
Figure 6.7 How residents rate the availability of off-street parking where they live by the importance on their decision to live at their current home
22%
14%
36%
34%
61%
51%
23%
12%
30%
27%
25%
26%
16%
11%
15%
13%
6%
6%
8%
11%
8%
6%
2%
4%
24%
40%
9%
20%
5%
11%
0% 10% 20% 30% 40% 50% 60% 70% 80% 90% 100%
Outer London
Inner London
Outer London
Inner London
Outer London
Inner London
Not an
influ
ence/ d
id
not consider
Minor influ
ence
Major influ
ence
Proportion of respondentsVery good Quite good Neither good nor poor Quite poor Very poor
Source: Residential Parking Behavioural Survey 2011
Figure 6.8 How residents rate the availability of on-street parking where they live by the importance on their decision to live at their current home
9%
10%
15%
14%
32%
28%
30%
22%
36%
35%
30%
33%
22%
18%
21%
23%
13%
12%
13%
18%
17%
14%
12%
9%
19%
18%
9%
11%
12%
16%
0% 10% 20% 30% 40% 50% 60% 70% 80% 90% 100%
Outer London
Inner London
Outer London
Inner London
Outer London
Inner London
Not an
influ
ence/ d
id
not consider
Minor influ
ence
Major influ
ence
Proportion of respondentsVery good Quite good Neither good nor poor Quite poor Very poor
Source: Residential Parking Behavioural Survey 2011
60

Availability of parking places
Inner London Almost a third of residents in Inner London developments think that there are plenty of places to park in the area they live in. This declines to 1 in 5 respondents who live in a car owning household in an Inner London development as they are more likely to have personal experience of the difficulty of finding parking in the area. Outer London Around a third of respondents living in Outer London developments believe that there are plenty of places to park in their local area. When considering only those living in car owning households the proportion declines slightly to 28 per cent of respondents. Comparison Overall there are no significant differences in the number of people who think there are plenty of places to park in their local area between residents of Inner and Outer London. Figure 6.9 How far respondents agree with the statement ‘There are plenty of places to park’
in their local area
8%
5%
11%
8%
20%
15%
25%
23%
14%
9%
19%
18%
19%
12%
24%
23%
12%
10%
16%
20%
1%
1%
5%
8%
0% 10% 20% 30% 40% 50% 60% 70% 80% 90% 100%
Outer London
Inner London
Outer London
Inner London
Car o
wning
households
All H
ouseholds
Proportion of respondentsStrongly Agree Agree Neither Agree or Disagree Disagree Strongly Disagree Don't Know/Not Applicable
Source: Residential Parking Behavioural Survey 2011
61
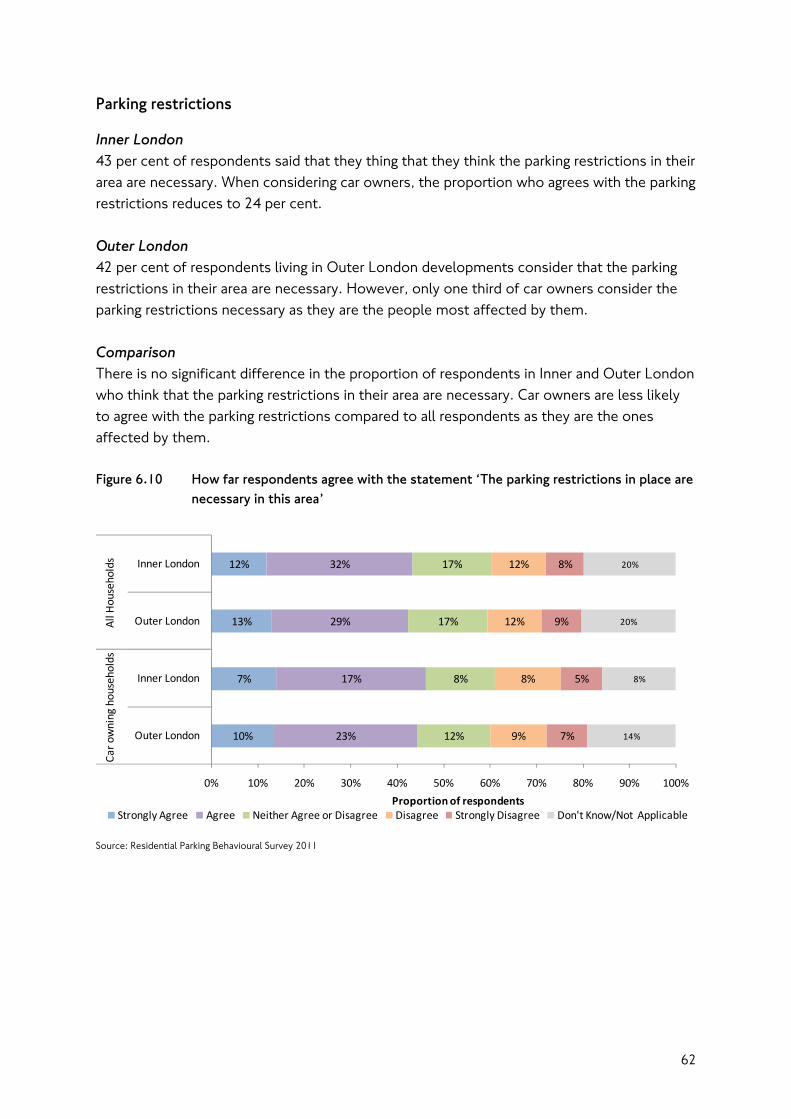
Parking restrictions
Inner London 43 per cent of respondents said that they thing that they think the parking restrictions in their area are necessary. When considering car owners, the proportion who agrees with the parking restrictions reduces to 24 per cent. Outer London 42 per cent of respondents living in Outer London developments consider that the parking restrictions in their area are necessary. However, only one third of car owners consider the parking restrictions necessary as they are the people most affected by them. Comparison There is no significant difference in the proportion of respondents in Inner and Outer London who think that the parking restrictions in their area are necessary. Car owners are less likely to agree with the parking restrictions compared to all respondents as they are the ones affected by them. Figure 6.10 How far respondents agree with the statement ‘The parking restrictions in place are
necessary in this area’
10%
7%
13%
12%
23%
17%
29%
32%
12%
8%
17%
17%
9%
8%
12%
12%
7%
5%
9%
8%
14%
8%
20%
20%
0% 10% 20% 30% 40% 50% 60% 70% 80% 90% 100%
Outer London
Inner London
Outer London
Inner London
Car o
wning
households
All H
ouseholds
Proportion of respondentsStrongly Agree Agree Neither Agree or Disagree Disagree Strongly Disagree Don't Know/Not Applicable
Source: Residential Parking Behavioural Survey 2011
62
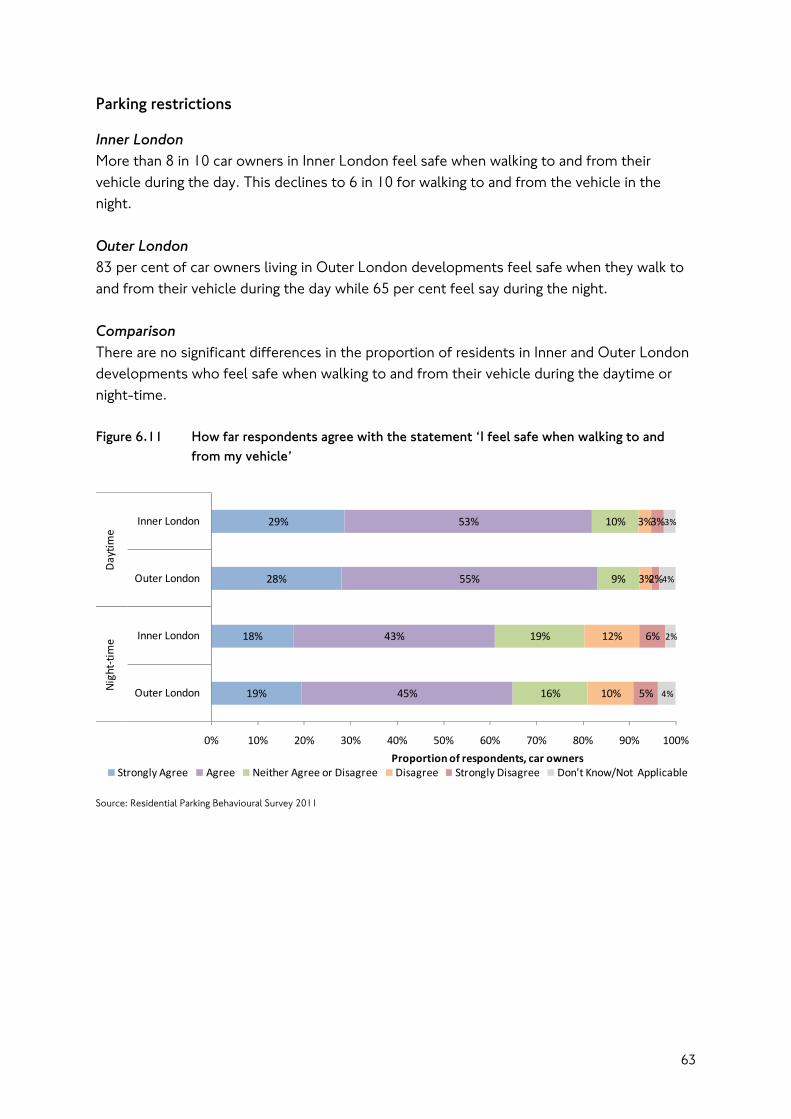
Parking restrictions
Inner London More than 8 in 10 car owners in Inner London feel safe when walking to and from their vehicle during the day. This declines to 6 in 10 for walking to and from the vehicle in the night. Outer London 83 per cent of car owners living in Outer London developments feel safe when they walk to and from their vehicle during the day while 65 per cent feel say during the night. Comparison There are no significant differences in the proportion of residents in Inner and Outer London developments who feel safe when walking to and from their vehicle during the daytime or night-time. Figure 6.11 How far respondents agree with the statement ‘I feel safe when walking to and
from my vehicle’
19%
18%
28%
29%
45%
43%
55%
53%
16%
19%
9%
10%
10%
12%
3%
3%
5%
6%
2%
3%
4%
2%
4%
3%
0% 10% 20% 30% 40% 50% 60% 70% 80% 90% 100%
Outer London
Inner London
Outer London
Inner London
Night‐tim
eDaytim
e
Proportion of respondents, car ownersStrongly Agree Agree Neither Agree or Disagree Disagree Strongly Disagree Don't Know/Not Applicable
Source: Residential Parking Behavioural Survey 2011
63
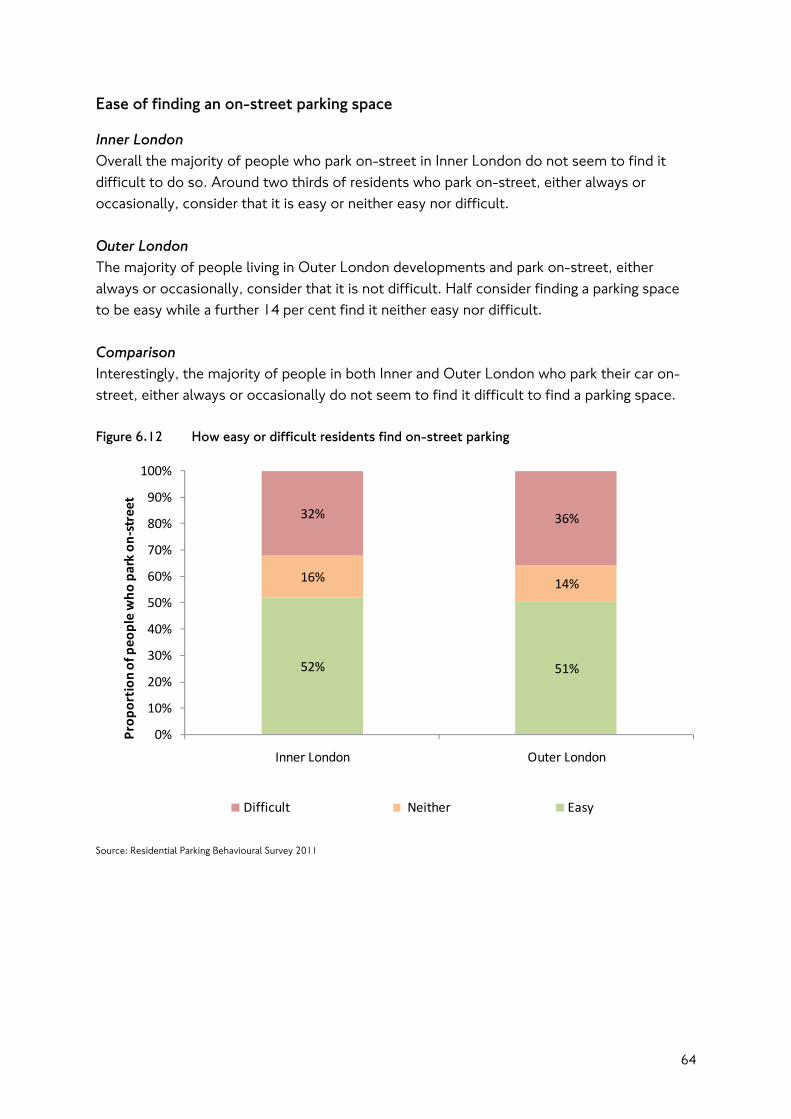
Ease of finding an on-street parking space
Inner London Overall the majority of people who park on-street in Inner London do not seem to find it difficult to do so. Around two thirds of residents who park on-street, either always or occasionally, consider that it is easy or neither easy nor difficult. Outer London The majority of people living in Outer London developments and park on-street, either always or occasionally, consider that it is not difficult. Half consider finding a parking space to be easy while a further 14 per cent find it neither easy nor difficult. Comparison Interestingly, the majority of people in both Inner and Outer London who park their car on-street, either always or occasionally do not seem to find it difficult to find a parking space. Figure 6.12 How easy or difficult residents find on-street parking
52% 51%
16% 14%
32% 36%
0%
10%
20%
30%
40%
50%
60%
70%
80%
90%
100%
Inner London Outer London
Prop
ortion
of p
eople who
park on
‐street
Difficult Neither Easy
Source: Residential Parking Behavioural Survey 2011
64
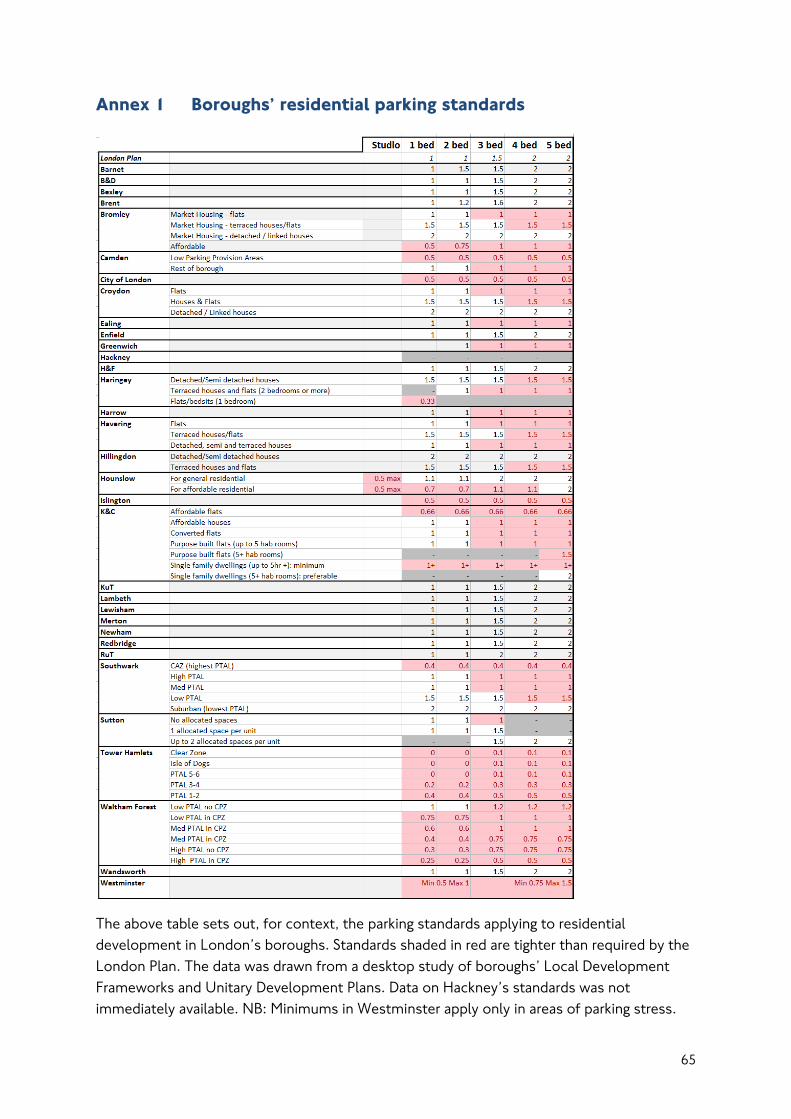
Annex 1 Boroughs’ residential parking standards
The above table sets out, for context, the parking standards applying to residential development in London’s boroughs. Standards shaded in red are tighter than required by the London Plan. The data was drawn from a desktop study of boroughs’ Local Development Frameworks and Unitary Development Plans. Data on Hackney’s standards was not immediately available. NB: Minimums in Westminster apply only in areas of parking stress.
65