residual market management summary is an is2017-6-16 · residual market management summary 2016...
TRANSCRIPT


901 Peninsula Corporate Circle
Boca Raton, Florida 33487-1362
Phone: 800- -123 (800-622-4123)
The Residual Market Management Summary 2016 .
Residual Market Management Summary is an
Residual Market Management Summary is
Residual Market Management Summary 2016
TABLE OF CONTENTS
TO OUR READERS: .............................................................................................................................................. 1
WHERE NCCI PROVIDES RESIDUAL MARKET SERVICES ......................................................................................... 2
OVERVIEW—PLAN AND POOL ADMINISTRATION HIGHLIGHTS ........................................................................... 3 PLAN ADMINISTRATION ....................................................................................................................................... 3
2017 Residual Market Assigned Carrier Conference ............................................................................................ 3 Voluntary Coverage Assistance Program ............................................................................................................. 3 Filings and Manuals .............................................................................................................................................. 3 Take‐Out Credit Program Update ........................................................................................................................ 5
POOL ADMINISTRATION ....................................................................................................................................... 5 Reinsurance Pools Results and Information ........................................................................................................ 6 Pool Quota Share Allocation Method .................................................................................................................. 6 Pool Data Online .................................................................................................................................................. 7 Pool Data Reporting Guidebook .......................................................................................................................... 7 Pool Uncollectible Premium System .................................................................................................................... 7
RESIDUAL MARKET RESULTS ............................................................................................................................... 8
SERVICING CARRIER OVERSIGHT PROCESS ......................................................................................................... 11
SERVICING CARRIER AUDIT INITIATIVES ............................................................................................................. 14
FINANCIAL AND ACTUARIAL RESULTS FOR 2016 ................................................................................................ 14 COMPARATIVE CALENDAR YEARS FINANCIAL ANALYSIS ............................................................................................... 15 COMPARATIVE POLICY YEARS FINANCIAL ANALYSIS .................................................................................................... 16 COMBINED CALENDAR YEARS OPERATING RESULTS ................................................................................................... 16 INDIVIDUAL POOLS CALENDAR YEAR OPERATING RESULTS ........................................................................................... 17 PREMIUM VOLUME AND TRUE GROWTH ................................................................................................................. 18 RESERVING ...................................................................................................................................................... 18
COMPARISON OF OPERATING EXPENSES FOR CALENDAR YEARS 2016, 2015, AND 2014 ..................................... 18
COMPARISON OF RESIDUAL MARKET WRITTEN PREMIUM TO TOTAL DIRECT WRITTEN PREMIUM ..................... 19
RESIDUAL MARKET SHARE ................................................................................................................................. 20
NET UNDERWRITING RESULTS—ALL POOLS SERVICED BY NCCI .......................................................................... 22
COMPARATIVE NUMBER OF RESIDUAL MARKET POLICIES ................................................................................. 23
RESIDUAL MARKET PREMIUM SIZE PROFILE ...................................................................................................... 24
PREMIUM SIZE PROFILES BY STATE .................................................................................................................... 24
CLASSIFICATIONS WITH LARGEST PREMIUM VOLUME ....................................................................................... 31
CLASSIFICATIONS WITH LARGEST POLICY COUNT ............................................................................................... 32
HAZARD GROUP DISTRIBUTION ......................................................................................................................... 32
PROJECTED ULTIMATE POLICY YEAR RESULTS BY STATE ..................................................................................... 33 AMOUNTS PROJECTED TO ULTIMATE ...................................................................................................................... 33
AVAILABLE RESIDUAL MARKET PROGRAMS ....................................................................................................... 40
2017 ASSIGNED CARRIERS ................................................................................................................................. 41
GLOSSARY OF RESIDUAL MARKET TERMS .......................................................................................................... 42

Residual Market Management Summary 2016 1
To Our Readers:
NCCI’s Residual Market Management Summary 2016 is the best source for obtaining facts and figures about workers compensation residual market plans and reinsurance pools that are serviced by the National Council on Compensation Insurance (NCCI). This report and previous years’ reports are available on our website, ncci.com.
For us, 2016 was another successful year based on all the key metrics used to evaluate the workers compensation residual markets managed by NCCI. This marks the fourth year in a row where the residual market premium, market share, and operating results have remained stable, which is a notable achievement given the potential for volatility in the residual markets.
The projected ultimate residual market written premium for Policy Year 2016 is $1.1 billion. This is a small decrease—$54 million—from 2015, and includes premium reported for the National Workers Compensation Reinsurance Pooling Mechanism, the New Mexico Workers’ Compensation Assigned Risk Pool, Massachusetts Workers’ Compensation Assigned Risk Pool, and Michigan Workers Compensation Placement Facility. The 2016 policy year premium estimate will change over the next few quarters as additional premiums and losses are reported by the assigned carriers. The residual market share of the overall workers compensation market is also down to 7.7% in 2016, due to the small decrease in residual market premium.
For all states combined, the operating results for 2016 are slightly worse than prior years but remain manageable. The 2016 results will also vary over the next few quarters as additional premium and losses are reported. Large losses played a significant part in the 2016 deficit. The $71 million estimated 2016 deficit is only 0.5% of voluntary workers compensation premium and is not a significant drag on the system.
NCCI’s customer satisfaction survey results show consistently high levels of approval from all residual market stakeholders. These results are driven by our dedicated staff, continuous improvement in our systems and processes, and transparent reporting on residual market operations on ncci.com. For example, in 2016 NCCI:
Implemented an enhanced Servicing Carrier Selection Process within NCCI’s SCSOSSM Service
Completed a rewrite of the Pool Uncollectible Premium System
Began a significant project to update NCCI’s RMAPS® Online Application Service
Continued research into residual market uncollectible premium issues
I am confident that these initiatives will continue to enhance residual market services. I am also grateful to the assigned carriers, state insurance regulators, and insurance producers who work with our NCCI staff to achieve these results.
After review of First Quarter 2017 information, barring any significant change in the workers compensation system, my expectation is that 2017 residual market premiums and market shares will remain at approximately the same level as that of 2016. These are key indicators that the workers compensation insurance market remains competitive and that the residual market is stable and manageable at this point in 2017.
Sincerely,
James R. Nau, CPCU, ARM, WCP, General Manager, Residual Markets, NCCI
2 Residual Market Management Summary 2016
Where NCCI Provides Residual Market Services
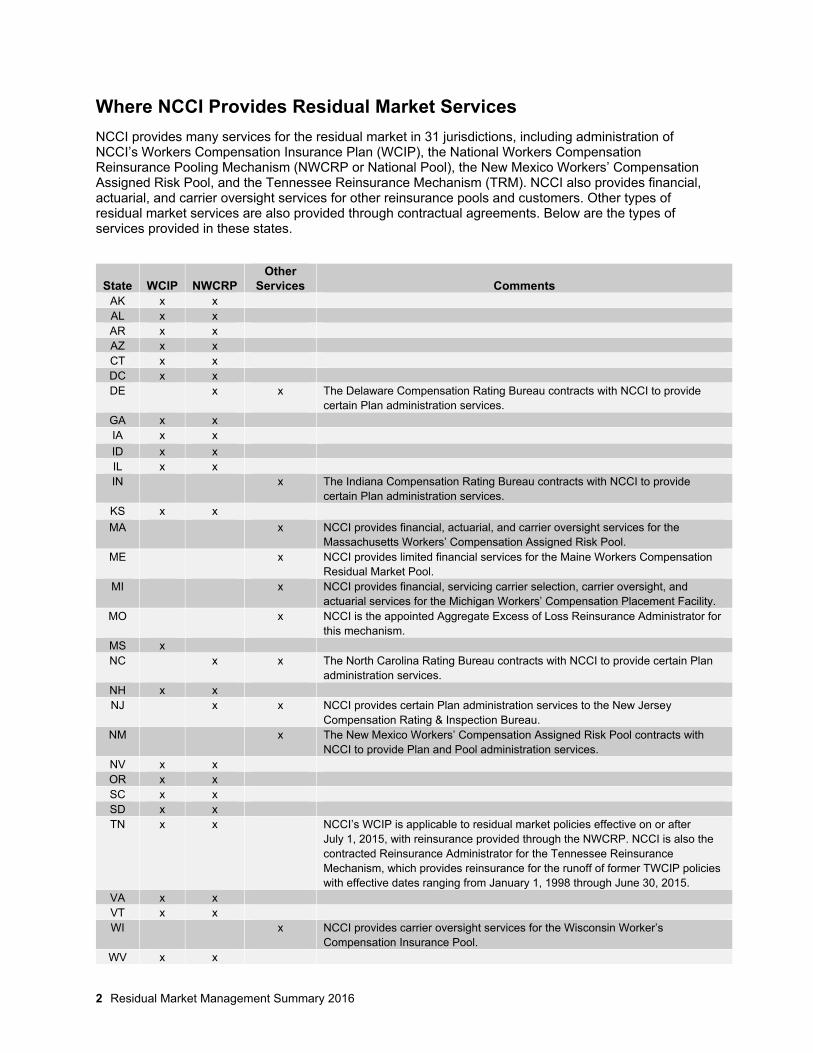
NCCI provides many services for the residual market in 31 jurisdictions, including administration of NCCI’s Workers Compensation Insurance Plan (WCIP), the National Workers Compensation Reinsurance Pooling Mechanism (NWCRP or National Pool), the New Mexico Workers’ Compensation Assigned Risk Pool, and the Tennessee Reinsurance Mechanism (TRM). NCCI also provides financial, actuarial, and carrier oversight services for other reinsurance pools and customers. Other types of residual market services are also provided through contractual agreements. Below are the types of services provided in these states.
State WCIP NWCRP Other
Services Comments AK x x AL x x AR x x AZ x x CT x x DC x x DE x x The Delaware Compensation Rating Bureau contracts with NCCI to provide
certain Plan administration services. GA x x IA x x
ID x x IL x x IN x The Indiana Compensation Rating Bureau contracts with NCCI to provide
certain Plan administration services. KS x x
MA x NCCI provides financial, actuarial, and carrier oversight services for the Massachusetts Workers’ Compensation Assigned Risk Pool.
ME x NCCI provides limited financial services for the Maine Workers Compensation Residual Market Pool.
MI x NCCI provides financial, servicing carrier selection, carrier oversight, and actuarial services for the Michigan Workers’ Compensation Placement Facility.
MO x NCCI is the appointed Aggregate Excess of Loss Reinsurance Administrator for this mechanism.
MS x NC x x The North Carolina Rating Bureau contracts with NCCI to provide certain Plan
administration services. NH x x NJ x x NCCI provides certain Plan administration services to the New Jersey
Compensation Rating & Inspection Bureau. NM x The New Mexico Workers’ Compensation Assigned Risk Pool contracts with
NCCI to provide Plan and Pool administration services. NV x x OR x x SC x x SD x x TN x x NCCI’s WCIP is applicable to residual market policies effective on or after
July 1, 2015, with reinsurance provided through the NWCRP. NCCI is also the contracted Reinsurance Administrator for the Tennessee Reinsurance Mechanism, which provides reinsurance for the runoff of former TWCIP policies with effective dates ranging from January 1, 1998 through June 30, 2015.
VA x x VT x x WI x NCCI provides carrier oversight services for the Wisconsin Worker’s
Compensation Insurance Pool. WV x x

Residual Market Management Summary 2016 3
Overview—Plan and Pool Administration Highlights
Plan Administration
NCCI and the assigned carriers have successfully managed the residual market during the last year. To put some of these results into perspective, here is a sampling of the overall application processing performance statistics from 2016:
Number of applications received = 123,487
Number of applications bound = 84,428
Percentage of applications submitted online nationally = 99.6%, exceeding our goal of 98%
Average processing time for online applications = 3.6 days
Average processing time for mail-in applications = 4.9 days
Other:
208,517 calls were fielded; calls increased by 17%
Producer workshops were held in five states: AL, AR, GA, FL, and IL
NCCI provides application processing, servicing carrier selection, and oversight and/or administrative services for its Workers Compensation Insurance Plans (WCIPs or Plans). NCCI provides these services for the assigned risk plans in 22 jurisdictions.
2017 Residual Market Assigned Carrier Conference
The annual Assigned Carrier Conference was held on February 8–10, 2017. The conference was a success based on attendance and an overall satisfaction rating of 9.37 out of 10.
Attendance at the conference is a requirement for becoming a servicing carrier or direct assignment carrier. The conference addressed a variety of topics including:
Application Trends
Actuarial Perspective
Current Trends in Cybersecurity
Key Issues Facing the States
Residual Market Trends
Servicing Carrier Selection Process
Status of the Residual Market
Please refer to ncci.com for the dates of next year’s conference.
For more information on the Assigned Carrier Conference, contact Chantel Weishaar at 561-893-3015 or [email protected].
Voluntary Coverage Assistance Program
NCCI’s Voluntary Coverage Assistance Program, VCAP® Service, applies to employers seeking coverage in the Workers Compensation Insurance Plans (WCIPs) administered by NCCI, and operates as a supplemental program to NCCI’s residual market application processing system, RMAPS® Online Application Service.
Developed as a depopulation tool, VCAP® Service helps producers and employers find voluntary workers compensation coverage as a last-chance effort prior to entering the residual market. VCAP® Service applies in AK, AL, AR, AZ, CT, DC, GA, ID, IL, KS, MS, NH, NM, NV, OR, SC, SD, TN, VT, and WV.
Operating results for 2016 include the following:
VCAP® Service redirected more than $7.4 million in premium from the residual market to the voluntary market
An approximate savings of $1,076,915 on 1,406 confirmed policies—or $766 per employer—was achieved, equaling a 15% savings per policy to the employer
For more information on VCAP® Service, contact Chantel Weishaar at 561-893-3015 or [email protected].
Filings and Manuals
Critical residual market rules are located in Rule 4 of NCCI’s Basic Manual for Workers Compensation and Employers Liability Insurance (Basic Manual). These NCCI rules include:
Rule 4-A—Workers Compensation Insurance Plan (WCIP)
Rule 4-B—Professional Employer Organization (PEO) Arrangements
Rule 4-C—Loss Sensitive Rating Plan

4 Residual Market Management Summary 2016
Rule 4-D—Voluntary Coverage Assistance Program (VCAP® Service)
Rule 4-E—Assigned Risk Adjustment Program (ARAP)
Rule 4-F—Take-Out Credit Program
Rule 4-G—Available Coverages
Rule 4-H—Producer Fees
Rule 4-I—Initial or Deposit Premium and Premium Installments
NCCI continues to monitor the residual market to determine future Plan enhancements. In 2016, NCCI worked on several filings that will impact the residual market including:
Elimination of Anniversary Rating Date (ARD) (effective May 1, 2017)
Establishment of Basic Manual Appendix G—Dispute Resolution Process (effective July 1, 2017)
Illinois Employee Leasing Arrangements/ PEO Arrangements (effective January 1, 2017)
For more information on residual market filings and manuals, contact Althea Keen at 561-893-3618 or [email protected].

Residual Market Management Summary 2016 5
NCCI Take-Out Credit Programs Calendar Year Credits
2014 2015 2016
State Policies
Credit Amount
($) Policies
Credit Amount
($) Policies
Credit Amount
($)
Alabama 226 2,338,136 203 2,256,851 207 3,229,280 Alaska 1,103 9,054,979 1,278 11,208,985 1,352 10,519,081 Arizona 405 8,182,025 975 12,535,201 1,628 16,211,185 Arkansas 819 5,459,180 970 8,078,125 1,150 8,696,501 Connecticut 1,039 9,980,809 1,040 12,600,687 1,247 13,490,270 District of Columbia 217 1,055,610 210 1,956,255 265 2,132,622 Georgia 1,004 15,432,361 1,219 19,311,961 1,405 21,973,384 Illinois 2,527 30,777,092 2,801 41,059,056 3,374 39,380,307 Iowa 845 9,664,798 944 11,374,715 976 11,052,347 Kansas 1,424 10,383,455 1,700 14,642,633 1,918 13,042,765 Mississippi 353 4,514,754 499 5,536,533 653 6,741,097 New Hampshire 757 4,238,551 709 6,533,126 875 6,905,655 New Mexico 290 4,618,912 333 4,534,443 417 4,095,533 Oregon 2,215 10,115,403 2,237 12,407,676 2,435 15,853,214 South Carolina 775 5,847,647 917 6,914,072 1,066 6,950,497 South Dakota 349 4,794,867 405 5,758,090 464 5,040,654 Tennessee 186 2,963,666 686 9,150,502 Vermont 743 3,070,374 663 4,403,884 718 5,550,569 Virginia 1,481 9,348,499 1,471 13,498,179 1,793 17,114,197 West Virginia 263 2,319,148 413 4,286,750 568 5,036,319 Totals 16,835 151,196,600 19,173 201,860,888 23,197 222,166,006
Take-Out Credit Program Update
NCCI’s Take-Out Credit (TOC) Program encourages the depopulation of the residual market. This is achieved by providing a credit incentive to participating Plan insurers for the removal of an employer from the residual market and replacement of coverage with a voluntary market policy. Credits are applied that reduce the amount of premium used in calculating the coverage provider’s reinsurance pooling mechanism participation base or direct assignment carrier quota in a given state.
In 2016, more than $222 million in credits were earned for policies removed from the residual market and placed in the voluntary market. This represents a 10% increase in credits earned over the previous year. These credits were derived from 23,197 policies and $193 million in qualifying premium.
In conjunction with its becoming the Plan Administrator for the state of Tennessee, effective July 1, 2015, NCCI filed and implemented the TOC Program as a depopulation tool for that state. As a result, the table above reflects 2015 and 2016 calendar year credits in Tennessee, with no such data in earlier years.
TOC Program rules and criteria are included in NCCI’s Basic Manual Rule 4-F. Please email [email protected] with any questions.
Pool Administration
NCCI provides accounting, actuarial, management, and administrative services for various reinsurance pooling mechanisms. During 2016, these pooling mechanisms provided reinsurance for the assigned risk plans in 27 jurisdictions, with 23 of these state plans being reinsured through the National Workers Compensation Reinsurance Association’s (NWCRA) quota share reinsurance pooling mechanism.
The NWCRA is responsible for all policymaking and oversight functions for the National Workers Compensation Reinsurance Pooling Mechanism (National Pool). The National Pool operates pursuant to the NWCRA Bylaws and quota share reinsurance agreements, under the direction of the NWCRA Board of Directors. The NWCRA contracts with NCCI for the provision of administrative and operational services.

6 Residual Market Management Summary 2016
Reinsurance Pools Results and Information
NCCI’s Reinsurance Pools Results and Information (RPRI) system on ncci.com provides Pool participants with the ability to view Pool-related data and download reports into Microsoft® Excel spreadsheets or PDFs.
RPRI contains reports and information for which NCCI acts as Pool Administrator or is contracted to provide financial reporting services. The Pools contained in RPRI are:
National Workers Compensation Reinsurance Pooling Mechanism
Massachusetts Workers’ Compensation Assigned Risk Pool
Michigan Workers’ Compensation Placement Facility
New Mexico Workers’ Compensation Assigned Risk Pool
Tennessee Reinsurance Mechanism
Pool participants can access their own operating results on an individual carrier level, group level, or aggregate level, as well as invoices and distribution notices, accident year data, and the Quarterly Summary of Operating Results circular.
RPRI also provides Pool participants with premium Call data, displaying components for written premium and premium credits used in the calculation of each participating company’s voluntary premium writings for the determination of quota share percentages. The premium ratio report provides data by state, year, industry premium totals, carrier premium totals, and the participation ratios (quota share). Other available information includes commutations and insolvencies, salvage and subrogation, and working fund advances.
Additional reports accessible to Pool participants through RPRI are Audited Financial Statements of the Pools, Pool Reserving Committee Meeting Agendas and Minutes, and the Annual Actuarial Report on Pool Reserves, along with the Statements of Actuarial Opinion. Also, the report on the reserve liabilities by state and policy year related to the participation of insolvent companies, as referenced in the Quarterly Summary of Operating Results circular, can be accessed, as well as a variance analysis tool that allows two quarters of comparison of carrier operating results by state and policy year.
Pool participants can sign up for emails that notify them when results become available on ncci.com and when invoices and distribution notices are due. Remittance information is also provided on RPRI.
For more information on RPRI, contact Andy Kondoleon at 561-893-3014 or [email protected].
To obtain access to RPRI, contact our Customer Service Center at 800-NCCI-123 (800-622-4123).
Pool Quota Share Allocation Method
The reinsurance pooling mechanisms serviced by NCCI are a collection of state-specific quota share reinsurance agreements, with each participating company being responsible, on an assumed reinsurance basis, for the actual financial results of the residual market policies reinsured through these various pooling mechanisms.
Each state and policy year represents a separate quota share reinsurance agreement. Each participating company’s quota share is based on its voluntary market share of direct workers compensation written premium (Annual Statement Statutory Page 14 basis) in each state during the calendar year corresponding to each policy year (e.g., Policy Year 2016 allocations based on Calendar Year 2016 market shares).
These reinsurance agreements are similar to quota share reinsurance agreements in the voluntary market, with the participating reinsurers continuing to receive assumption reports for their respective share of the reinsured activity until such time as all claims are closed. Until that time, the results that are reinsured by the participating companies are subject to change as a result of loss development and the incurring of contractual administrative and other expenses.
Allocations and distributions of operating results are made on a quarterly basis, approximately 75 days following the last day of each calendar quarter, representing assumed reinsurance transactions for participating companies in these reinsurance pooling mechanisms.

Residual Market Management Summary 2016 7
Pool Data Online
Servicing carriers for the NCCI-serviced reinsurance pooling mechanisms can use Pool Data Online (PDO) at ncci.com to electronically report residual market data such as:
Electronic Transmittal Record (NP-1) data
Financial Summary (NP-4) data
Expanded Financial (NPX) data
Large Loss Claims (LGL) data
Pool Data Online allows users to search, validate, import, create, view, and correct Pool data prior to each quarter’s reporting due date. This tool provides a view of NP-4 Financial Summary Data by Policy Year and the ability to generate an error report.
Data Manager Dashboard (DMD) provides individual servicing carrier users with the ability to monitor the quality and timeliness of their Pool data submissions by:
Tracking when data is received in relation to the due date
Monitoring the Error Status of NP-1, NP-4, NPX, and LGL submissions
Comparing and trending the volume of errors received from quarter to quarter
Identifying the top five edits for NP-1, NP-4, NPX, and LGL quarterly reporting
If you have any questions, contact NCCI’s Customer Service Center at 800-NCCI-123 (800-622-4123).
Pool Data Reporting Guidebook
NCCI’s Pool Data Reporting Guidebook provides the rules and requirements for servicing carrier reporting of residual market Pool data to NCCI. It contains coding values, record layouts, and reporting examples. The guidebook complements the compliance requirements in NCCI’s Servicing Carrier Reference Guide and provides a more efficient and effective data reporting resource for servicing carriers. You can access the Pool Data Reporting Guidebook from NCCI’s electronic Manuals Library on ncci.com.
For more information on the Pool Data Reporting Guidebook, contact NCCI’s Customer Service Center at 800-NCCI-123 (800-622-4123).
Pool Uncollectible Premium System
NCCI’s Pool Uncollectible Premium System (PUPS) is used by servicing carriers to submit uncollectible premium (NP-8 Data) to the reinsurance pooling mechanisms. Servicing carriers submit this data electronically using the NP-8 Record Layout or the online PUPS tool at ncci.com.
PUPS was rewritten in 2016, and while the new system’s core functionality remains the same, there are some enhancements:
Online NP-8 creation abilities for non-NCCI states
LSRP or Retro Transaction Reporting for National Pool States
New and enhanced reports
Overall updated look and feel
For more information about PUPS, contact Mary Ordoyne at 561-893-3007 or [email protected].

8 Residual Market Management Summary 2016
Residual Market Results
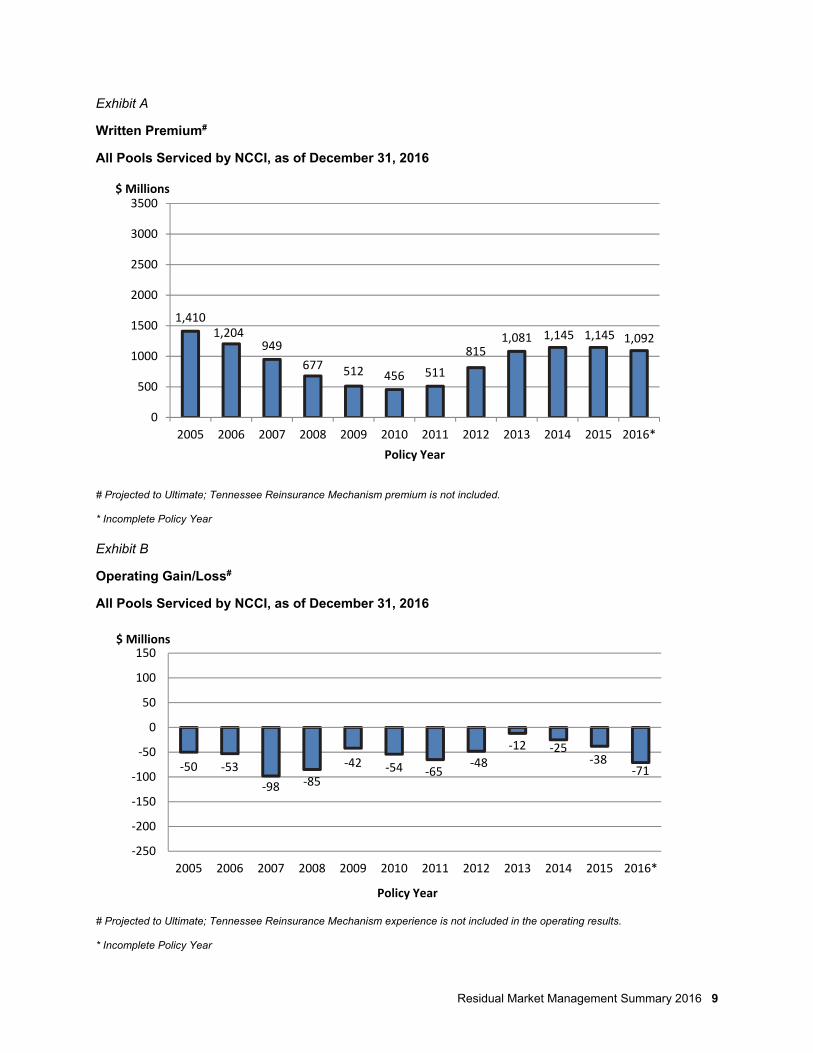
As shown in Exhibit A, Policy Year 2016 ultimate written premium for all reinsurance pooling mechanisms serviced by NCCI is projected to be $1.092 billion, representing a 4.6% decrease in premium volume from the projected levels of $1.145 billion for Policy Years 2014 and 2015.
After peaking at $1.5 billion in 2004, the residual market premium volume trended steadily downward in Policy Years 2006 through 2010, with a 20% average year-over-year decrease during this period. The Policy Year 2011 premium volume of $511 million, which represented a 12% increase over Policy Year 2010, broke this declining premium trend, and the premium growth continued in subsequent policy years. However, premium volume appears to have stabilized in the four most recent policy years.
These premium volumes and year-over-year changes include the effect of new policies, renewals, cancellations, nonrenewals, and premium-level changes. Estimates of “true growth” in residual market premium volume, which consider various economic factors and market conditions, are discussed separately in a later section of this report.
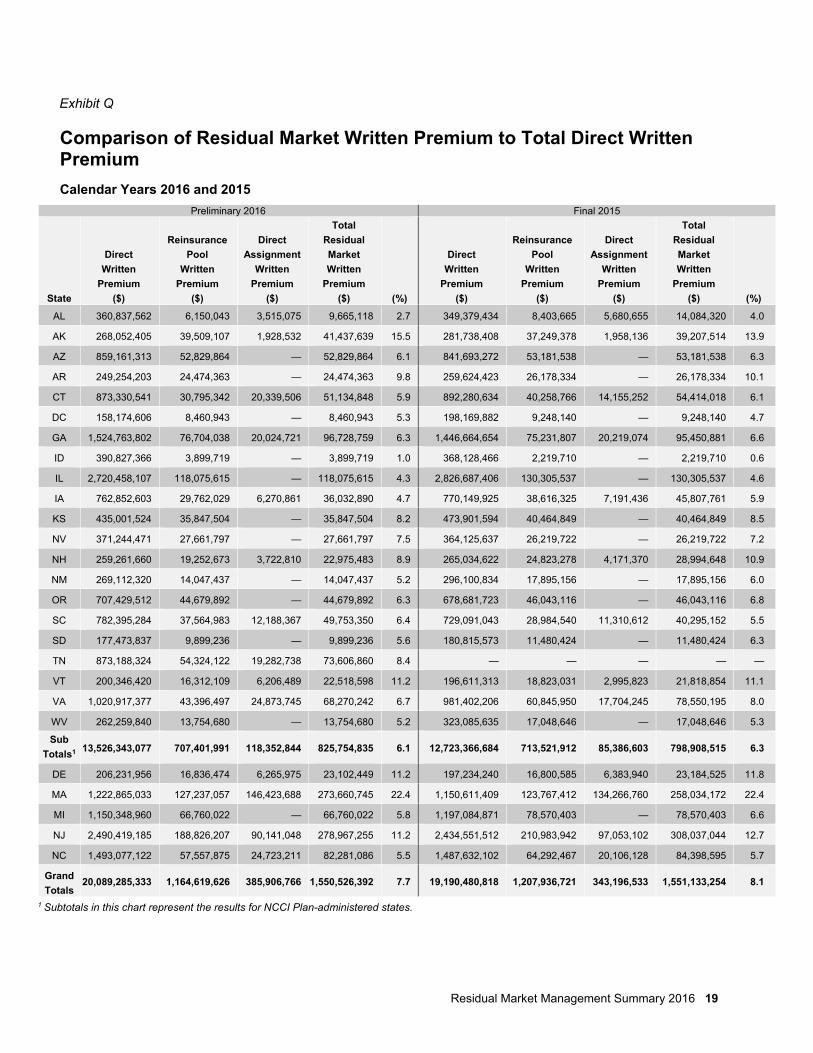
NCCI is projecting a residual market operating loss of $71 million for Policy Year 2016 (see Exhibit B) activity reinsured through these reinsurance pooling mechanisms. This is equivalent to a combined ratio of 106% (see Exhibit C). As reflected in Exhibit D, the residual market share of the total market direct written premium decreased to 6.1% for Calendar Year 2016, down from 6.3% for Calendar Year 2015, and 6.8% for Calendar Year 2014—for NCCI Plan-administered states.
Residual Market Management Summary 2016 9
Exhibit A
Written Premium#
All Pools Serviced by NCCI, as of December 31, 2016
# Projected to Ultimate; Tennessee Reinsurance Mechanism premium is not included.
* Incomplete Policy Year
Exhibit B
Operating Gain/Loss#
All Pools Serviced by NCCI, as of December 31, 2016
# Projected to Ultimate; Tennessee Reinsurance Mechanism experience is not included in the operating results.
* Incomplete Policy Year
1,4101,204
949
677 512 456 511
8151,081 1,145 1,145 1,092
0
500
1000
1500
2000
2500
3000
3500
2005 2006 2007 2008 2009 2010 2011 2012 2013 2014 2015 2016*
$ Millions
Policy Year
‐50 ‐53
‐98 ‐85
‐42 ‐54 ‐65‐48
‐12 ‐25‐38
‐71
‐250
‐200
‐150
‐100
‐50
0
50
100
150
2005 2006 2007 2008 2009 2010 2011 2012 2013 2014 2015 2016*
$ Millions
Policy Year

10 Residual Market Management Summary 2016
Exhibit C
Combined Ratio#
All Pools Serviced by NCCI, as of December 31, 2016
# Projected to Ultimate; Tennessee Reinsurance Mechanism experience is not included in the combined ratios.
* Incomplete Policy Year
Exhibit D
Residual Market Share
NCCI Plan States (Includes Direct Assignments)
Plan Premium as a Percentage of Direct Written Premium
* Preliminary
104 104 110 113 108 112 113106 101 102 103 106
0%
50%
100%
150%
2005 2006 2007 2008 2009 2010 2011 2012 2013 2014 2015 2016*
Policy Year
9.27.5
6.34.9 3.8 3.5 4.0
5.3 6.6 6.8 6.3 6.1
0%
5%
10%
15%
20%
25%
30%
2005 2006 2007 2008 2009 2010 2011 2012 2013 2014 2015 2016*
Calendar Year

Residual Market Management Summary 2016 11
Servicing Carrier Oversight Process
NCCI uses a comprehensive oversight program composed of four components to ensure that the servicing carriers are fulfilling their obligations to the Plans and Pools. This program ensures that the assigned carriers are on track to meet performance expectations from the moment they begin writing policies and servicing claims. NCCI manages the oversight program using the following four components:
Visitations
Servicing Carrier Operations Reporting (SCOR)
Self-Audits
On-Site Audits
Visitations—A visitation is conducted early in the process of underwriting policies and managing claims to provide a servicing carrier with a high-level synopsis of how it is handling the residual market business per NCCI’s Assigned Carrier Performance Standards (ACPS). NCCI reviews company procedures through internal control questionnaires and reviews a limited number of policies and claims to determine compliance with established standards of performance and any applicable bid enhancements.
The visitation is an opportunity to partner with the servicing carrier to help set expectations, review exceptions to the standard rules, and ensure that the carrier is on track by reviewing a small sampling of files and walking through company procedures. Visitations are completed during the first calendar year that a servicing carrier begins writing business in a state.
The visitation applies to new servicing carriers or existing servicing carriers that are writing new business because of selection through NCCI’s servicing carrier selection process. Results from the visitation are provided to the servicing carrier for informational purposes only.
SCOR—Servicing Carrier Operations Reporting (SCOR) is a program in which the National Pool servicing carriers submit aggregate data in key areas of performance on a quarterly or semiannual basis. The program ensures that servicing carriers are continuously meeting
the ACPS and can immediately address any deficient areas of performance instead of waiting for an annual self-audit or an on-site audit to take place.
Detailed reporting is required of new servicing carriers, those in run-off, or those servicing certain states. All other carriers submit a summary form, reporting only changes in procedures, staffing, or processing.
If a servicing carrier scores 10 or more percentage points below the established compliance threshold for any individual attribute, a corrective action plan must be submitted. As of December 31, 2016, six servicing carriers reported detailed SCOR results. Exhibit E indicates the number of data elements rated, most of which are rated at or above a “Satisfactory” level.
Self-Audits—The self-audit process is a Web-based application in which randomly selected policies and claims are reviewed. The carrier is required to respond to a series of standardized questions for each of the selected policies and claims. Carrier ratings are then determined for key attributes, which are specific areas of performance linked to individual performance standards as outlined in the established ACPS. The carrier is required to submit a corrective action plan for any attributes rated less than “Satisfactory.”
NCCI uses the self-audit process to determine a level of compliance with established standards of performance and applicable bid enhancements during the years in which an on-site audit is not conducted. It is applicable to all active and first-year run-off servicing carriers.
NCCI then verifies a sampling of the servicing carrier’s self-audit responses during the next on-site audit.
Exhibit F shows the overall ratings, which summarize all key attribute ratings for six National Pool servicing carrier self-audits in 2016. These ratings are used in the scoring of future servicing carrier bids.
On-Site Audits—On-site audits encompass a full-scope review of policies and claims handled by servicing carriers for various attributes outlined in NCCI’s established ACPS and any applicable bid enhancements.
12 Residual Market Management Summary 2016
The on-site audit program consists of two separate reviews. The Operational Performance Review ties results from underwriting, audit, loss prevention, claims, and billing directly to information contained in the policy and/or claim file to the ACPS. The NCCI Operational Performance Review measures both accuracy and timeliness on all performance standards.
The Reporting Requirements and Processing Procedures Review focuses on:
Accurate calculation and reporting of financial transactions to the appropriate reinsurance pooling mechanism
Timely and accurate reporting of data to the Plan and Pool Administrators
Adequacy of processing procedures and controls for handling assigned risk policies and claims
Ratings are provided and utilized as part of the scoring of future servicing carrier bids. The overall ratings for the six National Pool servicing carriers’ on-site audits conducted in 2016 are shown in Exhibit F.
Corrective programs that may result from the on-site audit process are:
Quantifications—Quantifications result from NCCI’s review of Pool-reported financial transactions. If a servicing carrier has misreported transactions to the Pool, then NCCI works with the carrier to identify the issue, address the cause of misreporting, and correct the reporting to the Pool.
Nine quantifications were completed during 2016, resulting in $167,365 in financial adjustments. Refer to Exhibit G for a four-year summary of quantification results.
Self-Assessments—The self-assessment process requires that the servicing carrier provide the status of the corrective actions resulting from the recommendations made during the on-site audit. This occurs about nine months after the on-site audit has concluded. NCCI reviews the servicing carrier’s self-assessment to ensure that the carrier has shown sufficient evidence that it has corrected the issue.
Remediation—The remediation program is a two-tiered performance management initiative that provides a progressive discipline for servicing carriers that have not demonstrated adequate performance for either the self-audit or the on-site audit. Servicing carriers not performing satisfactorily are required to have additional levels of reporting, oversight, and/or financial penalties imposed.
The remediation program is divided into two tiers: Tier One remediation is implemented
when a servicing carrier performs less than satisfactorily in certain ratable attributes, which are specific areas of performance linked to individual performance standards
Tier Two remediation is implemented when a servicing carrier scores less than satisfactorily on an overall aggregate basis
In specific situations, NCCI may conduct a re-audit, reduce a servicing carrier’s quota, or terminate the servicing carrier’s contract to write policies. In addition, the servicing carrier may lose its certification, thereby making it ineligible to qualify to bid until its performance is brought up to acceptable levels.
No National Pool carriers were assessed for either Tier One or Tier Two remediation in 2016. Refer to Exhibit H for a three-year summary of On-Site and Self-Audit Tier One remediation penalties.

Residual Market Management Summary 2016 13
Exhibit E
SCOR Results—National Pool Data
Elements Rated Below
Satisfactory
Number of Carriers
1st Quarter 2nd Quarter 3rd Quarter 4th Quarter
2014 2015 2016 2014 2015 2016 2014 2015 2016 2014 2015 2016
0 7 5 5 5 6 5 6 5 5 6 5 5
1 0 0 1 0 0 1 0 1 1 0 1 1
2 0 0 0 1 0 0 0 0 0 0 0 0 3 or more 0 0 0 0 0 0 0 0 0 0 0 0
Exhibit F
Servicing Carrier Overall Ratings—National Pool 2016 Self-Audit Overall Ratings Commendable Satisfactory Marginal Unsatisfactory Underwriting, Premium Audit, and Loss Prevention Performance Standards
5 1 0 0
Claims Performance Standards
5 1 0 0
2016 On-Site Audit Overall Ratings
Reporting Requirements and Procedures
N/A 6 0 0
Underwriting, Premium Audit, and Loss Prevention Performance Standards
1 0 0 0
Claims Performance Standards
5 1 0 0
Exhibit G
On-Site Audit Financial Quantifications—National Pool
Year
Financial Adjustment Pool/(Carrier)
($) 2013 435,199 2014 40,064 2015 13,188 2016 167,365 Total 655,816
Exhibit H
Tier One Remediation Penalties—National Pool 2016 2015 2014
On-Site Audit Number of Carriers 0 2 2
Amount $0 $2,000 $27,600 Self-Audit Number of Carriers 0 1 0 Amount $0 $80,000 $0
Total $0 $82,000 $27,600

14 Residual Market Management Summary 2016
Servicing Carrier Audit Initiatives
The Carrier Audit Services Department continuously evaluates the processes for the four audit components: visitations, SCOR (Servicing Carrier Operations Reporting), self-audits, and on-site audits.
Initiatives in 2016 Included:
Creation of new audit programs and internal control questions for serious claims testing. Serious claims testing will begin in 2017
Remote audits conducted using a secure and authorized connection to the servicing carriers’ networks and systems while still completing a quality review of the servicing carriers’ policies and claims
Improvements to the electronic work papers and summarization engines that are now included in the Carrier Audit Program (CAP)
Complete three-year review and overhaul of all audit programs, electronic work papers, and internal control questionnaires utilized as part of the on-site and remote audit process
Updates to CAP to add a new Self-Audit program for the Indiana servicing carriers
Financial and Actuarial Results for 2016
Comparative financial analyses and operating results for all Pools serviced by NCCI are shown in Exhibits I through L. The 2016 calendar year results for the reinsurance pools administered by NCCI reflect net operating gains for the National Workers’ Compensation Reinsurance Pool, the Michigan Workers’ Compensation Placement Facility, the New Mexico Workers’ Compensation Assigned Risk Pool, and the Massachusetts Workers’ Compensation Assigned Risk Pool (see Exhibits M through P).
The combined net operating gain for all pools managed by NCCI was approximately $171 million in Calendar Year 2016 compared with the net operating gain of $293 million for Calendar Year 2015.
National Pool results reflect an operating gain of $131 million compared with an operating gain of $252 million in the prior year (Exhibit M)
Massachusetts Pool results reflect an operating gain of $8 million compared with a loss of $6 million in the prior year (Exhibit N)
Michigan Pool results reflect an operating gain of $25 million compared with a gain of $34 million in the prior year (Exhibit O)
New Mexico Pool’s results reflect an operating gain of $7 million, compared with an operating gain of $13 million in the prior year (Exhibit P)

Residual Market Management Summary 2016 15
Comparative Calendar Years Financial Analysis Exhibit I All Pools Serviced by NCCI—Calendar Years 2016 and 2015 ($000s)
Calendar Year 2016 Quarterly Results Calendar Year
First Second Third Fourth 2016 2015 ($) ($) ($) ($) ($) ($) Premiums Written 278,346 300,792 258,787 259,973 1,097,898 1,170,721 Premiums Earned 274,160 300,419 269,436 277,386 1,121,401 1,161,220 Incurred Losses 168,652 195,811 48,023 177,404 589,890 480,926 Loss Ratio (%) 61.5 65.2 17.8 64.0 52.6 41.4 Paid Losses 168,393 191,075 190,239 184,342 734,049 684,343 ALAE for Black Lung 710 946 1,202 939 3,797 2,765 Servicing Carrier Allowance 70,437 76,824 61,920 63,052 272,233 303,322 Producer Fees 10,580 11,210 10,266 10,757 42,813 43,346 Administrative Expenses 3,205 3,733 3,285 3,526 13,749 13,396 Other Expenses 6,405 6,797 8,030 10,447 31,679 27,254 Net Underwriting Gain (Loss) 14,881 6,044 137,912 12,200 171,037 292,976 Investment Income 8 — 49 1 58 9 Net Operating Gain (Loss) 14,889 6,044 137,961 12,201 171,095 292,985 EBNR Premium Reserves (28,630) (17,046) (8,609) (18,430) (18,430) (14,884) Loss Ratio With EBNR (%) 64.8 62.8 17.3 66.3 52.8 41.5 Unearned Premiums 354,558 354,931 344,281 326,869 326,869 350,372 Outstanding Losses 3,195,908 3,186,529 3,175,136 3,152,395 3,152,395 3,175,530 IBNR 2,465,180 2,479,295 2,348,473 2,364,276 2,364,276 2,485,301 Cash Flow 19,334 11,153 (14,904) (12,150) 3,433 99,069 Uncollectible Premiums 20,214 18,201 18,917 20,067 77,399 59,913
Exhibit J All Pools Serviced by NCCI—Calendar Years 2015 and 2014 ($000s)
Calendar Year 2015 Quarterly Results Calendar Year
First Second Third Fourth 2015 2014
($) ($) ($) ($) ($) ($) Premiums Written 286,305 295,455 295,691 293,270 1,170,721 1,147,434 Premiums Earned 285,522 290,167 284,940 300,591 1,161,220 1,121,252 Incurred Losses 161,035 194,816 (67,188) 192,263 480,926 730,183 Loss Ratio (%) 56.4 67.1 (23.6) 64.0 41.4 65.1 Paid Losses 164,986 173,064 174,682 171,611 684,343 699,834 Loss Adjustment Expenses for Black Lung 593 684 785 703 2,765 2,815
Servicing Carrier Allowance 74,672 77,429 78,589 72,632 303,322 296,031
Producer Fees 10,363 10,875 11,282 10,826 43,346 43,310
Administrative Expenses 3,195 3,454 3,346 3,401 13,396 12,594
Other Expenses 6,128 4,668 11,421 5,037 27,254 28,606
Net Underwriting Gain (Loss) 30,129 (1,075) 247,490 16,432 292,976 10,528
Investment Income 1 5 3 — 9 23
Net Operating Gain (Loss) 30,130 (1,070) 247,493 16,432 292,985 10,551
EBNR Premium Reserves (26,101) (15,561) (7,829) (14,884) (14,884) (12,663)
Loss Ratio With EBNR (%) 59.2 64.8 (23.0) 65.5 41.5 65.5
Unearned Premiums 341,653 346,940 357,692 350,372 350,372 340,870
Outstanding Losses 3,152,449 3,132,454 3,136,046 3,175,530 3,175,530 3,142,374
IBNR 2,707,846 2,749,594 2,504,132 2,485,301 2,485,301 2,721,873
Cash Flow 26,962 25,970 16,374 29,763 99,069 67,082
Uncollectible Premiums 14,160 24,025 12,735 8,993 59,913 55,473

16 Residual Market Management Summary 2016
Exhibit K
Comparative Policy Years Financial Analysis
All Pools Serviced by NCCI—Policy Years 2016 and 2015 ($000s)
Policy Year (PY) 2016 Quarterly Results At December 31, 2016
First Second Third Fourth PY 2016 PY 2015
($) ($) ($) ($) ($) ($)
Premiums Written 184,259 251,029 249,186 257,883 942,357 1,170,994
Premiums Earned 44,957 129,767 189,229 251,535 615,488 1,170,994
Incurred Losses 33,415 103,531 145,150 182,760 464,856 817,816
Loss Ratio (%) 74.3 79.8 76.7 72.7 75.5 69.8
Paid Losses 936 11,447 20,095 36,919 69,397 279,920
Net Expenses 56,070 74,353 71,427 73,647 275,497 358,329
Net Operating Gain (Loss) (44,528) (48,117) (27,348) (4,872) (124,865) (5,151)
EBNR Premium Reserves — — — — — (18,430)
Loss Ratio With EBNR (%) 74.3 79.8 76.7 72.7 75.5 71.0
Unearned Premiums 139,302 260,564 320,520 326,869 326,869 —
Outstanding Losses 7,575 41,968 92,248 143,991 143,991 250,818
IBNR 24,904 82,595 157,370 251,468 251,468 287,077
Cash Flow 127,253 165,229 157,664 147,317 597,463 532,745
Uncollectible Premiums — 33 327 2,399 2,759 43,167
Exhibit L
Combined Calendar Years Operating Results
All Pools Serviced by NCCI—Calendar Years 2007–2016 ($000s)
Calendar Year
Written Premium
(%)
Increase (Decrease)
Previous Year (%)
Earned Premium
($)
Incurred Losses
($) Loss Ratio
(%)
Net Operating
Gain/(Loss) ($)
2016 1,097,898 (6.2) 1,121,401 589,890 52.6 171,095
2015 1,170,721 2.0 1,161,220 480,926 41.4 292,985
2014 1,147,434 7.8 1,121,252 730,183 65.1 10,551
2013 1,064,293 39.8 990,445 708,843 71.6 (67,367)
2012 761,541 59.5 681,977 448,494 65.8 (35,957)
2011 477,418 13.1 455,894 303,871 66.7 (58,263)
2010 422,218 (13.7) 446,613 462,126 103.5 (218,189)
2009 489,074 (34.7) 540,683 286,211 52.9 25,685
2008 748,762 (25.2) 817,820 443,504 54.2 71,086
2007 1,001,301 (20.2) 1,071,125 848,284 79.2 (144,525)

Residual Market Management Summary 2016 17
Individual Pools Calendar Year Operating Results Quarterly Comparison for Calendar Year 2016; Annual Comparison for Calendar Years 2016 and 2015 ($000s)
Exhibit M National Workers’ Compensation Reinsurance Pooling Mechanism*
Earned Premium Incurred Losses Loss Ratio Net Operating Gain/(Loss)
($) ($) (%) ($)
1st Quarter 2016 221,312 142,197 64.3 5,484
2nd Quarter 2016 249,913 167,595 67.1 365
3rd Quarter 2016 217,719 32,414 14.9 118,980
4th Quarter 2016 226,070 149,332 66.1 5,671
Calendar Year 2016 915,014 491,538 53.7 130,500
Calendar Year 2015 952,533 384,865 40.4 252,096 * Includes inactive pools merged with National Pool effective January 1, 1997.
Exhibit N Massachusetts Workers’ Compensation Assigned Risk Pool
Earned Premium Incurred Losses Loss Ratio Net Operating Gain/(Loss)
($) ($) (%) ($)
1st Quarter 2016 31,717 20,304 64.0 1,720
2nd Quarter 2016 30,499 17,597 57.7 2,975
3rd Quarter 2016 30,237 16,881 55.8 3,004
4th Quarter 2016 33,901 23,336 68.8 699
Calendar Year 2016 126,354 78,118 61.8 8,398
Calendar Year 2015 117,629 83,386 70.9 (5,828)
Exhibit O Michigan Workers’ Compensation Placement Facility
Earned Premium Incurred Losses Loss Ratio Net Operating
Gain/(Loss)
($) ($) (%) ($)
1st Quarter 2016 17,188 4,879 28.4 6,860
2nd Quarter 2016 17,199 9,652 56.1 2,118
3rd Quarter 2016 17,571 674 3.8 11,706
4th Quarter 2016 14,566 4,477 30.7 4,606
Calendar Year 2016 66,524 19,682 29.6 25,290
Calendar Year 2015 73,877 15,610 21.1 34,008
Exhibit P New Mexico Workers’ Compensation Assigned Risk Pool
Earned Premium Incurred Losses Loss Ratio Net Operating Gain/(Loss)
($) ($) (%) ($)
1st Quarter 2016 3,943 1,272 32.3 826
2nd Quarter 2016 2,807 968 34.5 587
3rd Quarter 2016 3,910 (1,946) (49.8) 4,272
4th Quarter 2016 2,848 259 9.1 1,225
Calendar Year 2016 13,508 553 4.1 6,910
Calendar Year 2015 17,182 (2,934) (17.1) 12,707

18 Residual Market Management Summary 2016
Premium Volume and True Growth
Pool premium volume changes are only part of the picture when measuring residual market growth from year to year. True residual market growth compares pool premium for the current and prior policy years at the same level of maturity (measured in quarters) and then adjusts for shifts in direct assignment volume, the impacts of premium level changes, and wage growth.
NCCI’s latest projections of adjusted premium volume changes indicate a 7% decrease from Policy Year 2015 to Policy Year 2016. This amount differs from the pool premium volume decrease of 5% shown in Exhibit A due to the adjustments described above.
Reserving
Reserving methodologies and indications are reviewed each quarter by NCCI. In addition, Pool Reserving Committees, composed of six insurance company actuaries, perform a quarterly peer review of NCCI methodologies and reserve recommendations for the reinsurance pools serviced by NCCI. These recommendations are then reviewed by the applicable Pool Board and/or Pool Administrators for final acceptance.
For carrier annual statement purposes, NCCI’s chief actuary issues a Statement of Actuarial Opinion on pool reserves. This certification encompasses all states with active pools serviced by NCCI, as well as all states within the National Pool.
The Policy Year 2016 combined ratio estimate for “All Pools” serviced by NCCI is 106%, which is slightly above the current estimate of Policy Year 2015 (see Exhibit C).
NCCI uses generally accepted actuarial standards of practice to book the respective pools’ loss reserves and believes that current reserve levels are adequate. However, estimates for “incomplete” policy years are likely to change as they mature.
NCCI calculates reserves on both an undiscounted and a discounted basis for pool participants. The amount of discount reflects the tabular discount for the indemnity portion of pension reserves.
Comparison of Operating Expenses for Calendar Years 2016, 2015, and 2014
Calendar Year 2016 operating expenses were $360 million compared with $387 million in Calendar Year 2015 and $381 million in Calendar Year 2014. As a percentage of premiums written, the expenses were 33% for all three calendar years. The largest component of the operating expenses is the servicing carrier allowance, which accounts for approximately 76% of these expenses in Calendar Year 2016.
The servicing carrier allowance in 2016 was $272 million compared with $303 million in 2015 and $296 million in 2014. This decrease is due to a 6% decrease in written premiums in 2016. Producer fees for Calendar Years 2016, 2015, and 2014 were $43 million for all three calendar years. Other expenses, which include servicing carrier indemnification expenses, collection costs, and other reimbursable expenses, increased to $32 million compared with $27 million in 2015 and $29 million in 2014.
The increase in Calendar Year 2016 “other expenses” is due to an increase in taxes and assessments that were reimbursed directly to servicing carriers. Administrative expenses were $14 million for Calendar Year 2016 and $13 million for Calendar Years 2015 and 2014.
Residual Market Management Summary 2016 19
Exhibit Q
Comparison of Residual Market Written Premium to Total Direct Written Premium
Calendar Years 2016 and 2015
1 Subtotals in this chart represent the results for NCCI Plan-administered states.
Preliminary 2016 Final 2015
State
Direct
Written
Premium
($)
Reinsurance
Pool
Written
Premium
($)
Direct
Assignment
Written
Premium
($)
Total
Residual
Market
Written
Premium
($) (%)
Direct
Written
Premium
($)
Reinsurance
Pool
Written
Premium
($)
Direct
Assignment
Written
Premium
($)
Total
Residual
Market
Written
Premium
($) (%)
AL 360,837,562 6,150,043 3,515,075 9,665,118 2.7 349,379,434 8,403,665 5,680,655 14,084,320 4.0
AK 268,052,405 39,509,107 1,928,532 41,437,639 15.5 281,738,408 37,249,378 1,958,136 39,207,514 13.9
AZ 859,161,313 52,829,864 — 52,829,864 6.1 841,693,272 53,181,538 — 53,181,538 6.3
AR 249,254,203 24,474,363 — 24,474,363 9.8 259,624,423 26,178,334 — 26,178,334 10.1
CT 873,330,541 30,795,342 20,339,506 51,134,848 5.9 892,280,634 40,258,766 14,155,252 54,414,018 6.1
DC 158,174,606 8,460,943 — 8,460,943 5.3 198,169,882 9,248,140 — 9,248,140 4.7
GA 1,524,763,802 76,704,038 20,024,721 96,728,759 6.3 1,446,664,654 75,231,807 20,219,074 95,450,881 6.6
ID 390,827,366 3,899,719 — 3,899,719 1.0 368,128,466 2,219,710 — 2,219,710 0.6
IL 2,720,458,107 118,075,615 — 118,075,615 4.3 2,826,687,406 130,305,537 — 130,305,537 4.6
IA 762,852,603 29,762,029 6,270,861 36,032,890 4.7 770,149,925 38,616,325 7,191,436 45,807,761 5.9
KS 435,001,524 35,847,504 — 35,847,504 8.2 473,901,594 40,464,849 — 40,464,849 8.5
NV 371,244,471 27,661,797 — 27,661,797 7.5 364,125,637 26,219,722 — 26,219,722 7.2
NH 259,261,660 19,252,673 3,722,810 22,975,483 8.9 265,034,622 24,823,278 4,171,370 28,994,648 10.9
NM 269,112,320 14,047,437 — 14,047,437 5.2 296,100,834 17,895,156 — 17,895,156 6.0
OR 707,429,512 44,679,892 — 44,679,892 6.3 678,681,723 46,043,116 — 46,043,116 6.8
SC 782,395,284 37,564,983 12,188,367 49,753,350 6.4 729,091,043 28,984,540 11,310,612 40,295,152 5.5
SD 177,473,837 9,899,236 — 9,899,236 5.6 180,815,573 11,480,424 — 11,480,424 6.3
TN 873,188,324 54,324,122 19,282,738 73,606,860 8.4 — — — — —
VT 200,346,420 16,312,109 6,206,489 22,518,598 11.2 196,611,313 18,823,031 2,995,823 21,818,854 11.1
VA 1,020,917,377 43,396,497 24,873,745 68,270,242 6.7 981,402,206 60,845,950 17,704,245 78,550,195 8.0
WV 262,259,840 13,754,680 — 13,754,680 5.2 323,085,635 17,048,646 — 17,048,646 5.3
Sub
Totals1 13,526,343,077 707,401,991 118,352,844 825,754,835 6.1 12,723,366,684 713,521,912 85,386,603 798,908,515 6.3
DE 206,231,956 16,836,474 6,265,975 23,102,449 11.2 197,234,240 16,800,585 6,383,940 23,184,525 11.8
MA 1,222,865,033 127,237,057 146,423,688 273,660,745 22.4 1,150,611,409 123,767,412 134,266,760 258,034,172 22.4
MI 1,150,348,960 66,760,022 — 66,760,022 5.8 1,197,084,871 78,570,403 — 78,570,403 6.6
NJ 2,490,419,185 188,826,207 90,141,048 278,967,255 11.2 2,434,551,512 210,983,942 97,053,102 308,037,044 12.7
NC 1,493,077,122 57,557,875 24,723,211 82,281,086 5.5 1,487,632,102 64,292,467 20,106,128 84,398,595 5.7
Grand
Totals 20,089,285,333 1,164,619,626 385,906,766 1,550,526,392 7.7 19,190,480,818 1,207,936,721 343,196,533 1,551,133,254 8.1

20 Residual Market Management Summary 2016
Exhibit R
Residual Market Share
Residual Market Written Premium as a Percentage of Total Direct Written Premium Calendar Years 2012–2016
State 20161
(%) 2015
(%) 2014
(%) 2013
(%) 2012
(%)
Alabama 2.7 4.0 4.5 4.3 3.6
Alaska 15.5 13.9 15.8 15.3 13.7
Arizona 6.1 6.3 7.0 6.6 4.3
Arkansas 9.8 10.1 10.4 10.1 8.5
Connecticut 5.9 6.1 6.6 6.5 5.1
District of Columbia
5.3 4.7 6.5 6.2 5.7
Georgia 6.3 6.6 6.6 5.5 5.0
Idaho 1.0 0.6 0.6 0.6 0.7
Illinois 4.3 4.6 5.1 5.3 4.3
Iowa 4.7 5.9 6.4 6.3 5.0
Kansas 8.2 8.5 10.4 10.7 9.0
Nevada 7.5 7.2 8.8 9.5 7.4
New Hampshire 8.9 10.9 10.9 10.3 8.1
New Mexico 5.2 6.0 7.0 5.6 3.7
Oregon 6.3 6.8 6.7 6.8 5.0
South Carolina 6.4 5.5 5.8 5.6 4.4
South Dakota 5.6 6.3 6.8 6.3 5.4
Tennessee2 8.4 — — — —
Vermont 11.2 11.1 11.0 11.1 8.5
Virginia 6.7 8.0 7.7 7.1 6.1
West Virginia 5.2 5.3 6.0 5.4 4.3
Subtotals3 6.1 6.3 6.8 6.6 5.3
Delaware 11.2 11.8 11.6 16.0 12.0
Massachusetts 22.4 22.4 21.7 19.9 18.0
Michigan 5.8 6.6 7.7 6.8 6.1
New Jersey 11.2 12.7 11.3 12.0 8.9
North Carolina 5.5 5.7 5.7 5.3 4.3
Grand Totals 7.7 8.1 8.2 8.0 6.5 1 2016 Preliminary. 2NCCI was named the Tennessee Plan Administrator on July 1, 2015.
3 Subtotals in this chart represent the market shares for NCCI Plan-administered states.

Residual Market Management Summary 2016 21
NCCI Plan-Administered States With Highest Residual Market Share
Calendar Years 2016 and 2015
Residual Market Written Premium as a Percentage of Total Direct Written Premium
CY 2016 Share* CY 2015 Share
* Preliminary
NCCI Plan-Administered States With Lowest Residual Market Share
Calendar Years 2016 and 2015
Residual Market Written Premium as a Percentage of Total Direct Written Premium
CY 2016 Share* CY 2015 Share
* Preliminary
15.5
11.29.8 8.9 8.4
13.9
11.1 10.9 10.18.5
0.0%
5.0%
10.0%
15.0%
20.0%
25.0%
AK VT AR NH TN AK VT NH AR KS
1.0
2.7
4.34.7
5.2
0.6
4.04.6 4.7
5.3
0.0%
2.0%
4.0%
6.0%
8.0%
10.0%
ID AL IL IA NM ID AL IL DC WV
States
States
22 Residual Market Management Summary 2016
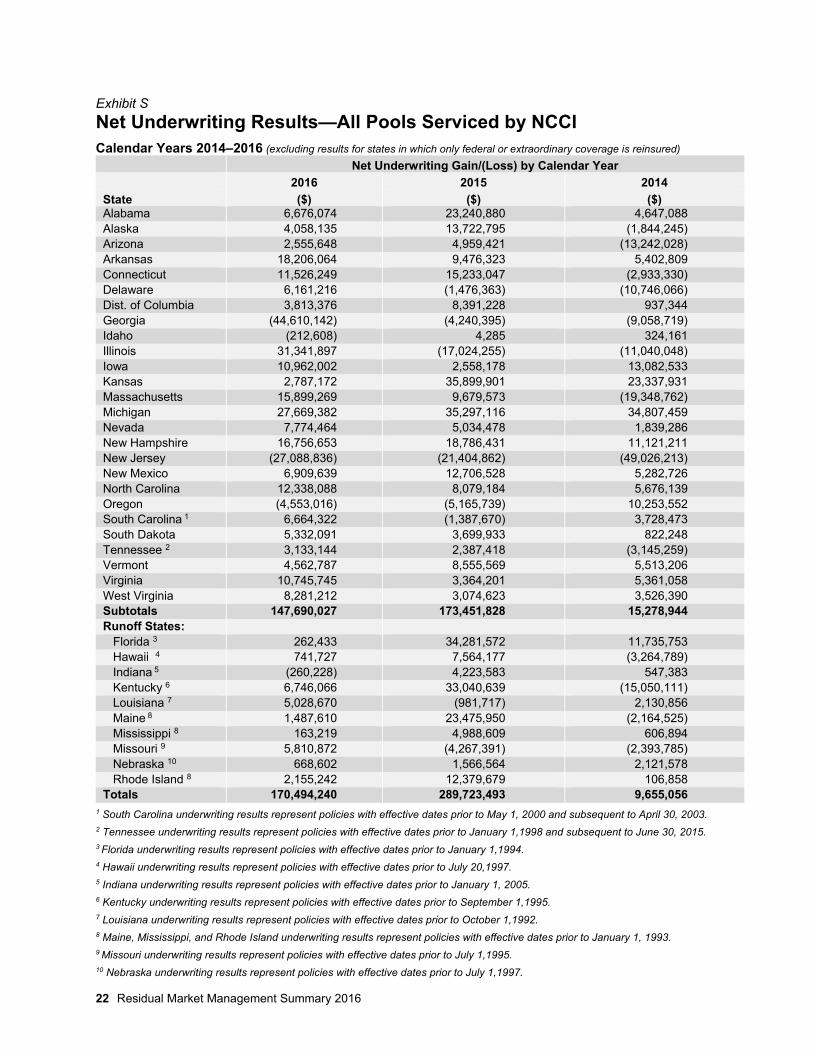
Exhibit S
Net Underwriting Results—All Pools Serviced by NCCI Calendar Years 2014–2016 (excluding results for states in which only federal or extraordinary coverage is reinsured)
Net Underwriting Gain/(Loss) by Calendar Year
2016 2015 2014
State ($) ($) ($) Alabama 6,676,074 23,240,880 4,647,088 Alaska 4,058,135 13,722,795 (1,844,245) Arizona 2,555,648 4,959,421 (13,242,028) Arkansas 18,206,064 9,476,323 5,402,809 Connecticut 11,526,249 15,233,047 (2,933,330) Delaware 6,161,216 (1,476,363) (10,746,066) Dist. of Columbia 3,813,376 8,391,228 937,344 Georgia (44,610,142) (4,240,395) (9,058,719) Idaho (212,608) 4,285 324,161 Illinois 31,341,897 (17,024,255) (11,040,048) Iowa 10,962,002 2,558,178 13,082,533 Kansas 2,787,172 35,899,901 23,337,931 Massachusetts 15,899,269 9,679,573 (19,348,762) Michigan 27,669,382 35,297,116 34,807,459 Nevada 7,774,464 5,034,478 1,839,286 New Hampshire 16,756,653 18,786,431 11,121,211 New Jersey (27,088,836) (21,404,862) (49,026,213) New Mexico 6,909,639 12,706,528 5,282,726 North Carolina 12,338,088 8,079,184 5,676,139 Oregon (4,553,016) (5,165,739) 10,253,552 South Carolina 1 6,664,322 (1,387,670) 3,728,473 South Dakota 5,332,091 3,699,933 822,248 Tennessee 2 3,133,144 2,387,418 (3,145,259) Vermont 4,562,787 8,555,569 5,513,206 Virginia 10,745,745 3,364,201 5,361,058 West Virginia 8,281,212 3,074,623 3,526,390 Subtotals 147,690,027 173,451,828 15,278,944 Runoff States: Florida 3 262,433 34,281,572 11,735,753 Hawaii 4 741,727 7,564,177 (3,264,789) Indiana 5 (260,228) 4,223,583 547,383 Kentucky 6 6,746,066 33,040,639 (15,050,111) Louisiana 7 5,028,670 (981,717) 2,130,856 Maine 8 1,487,610 23,475,950 (2,164,525) Mississippi 8 163,219 4,988,609 606,894 Missouri 9 5,810,872 (4,267,391) (2,393,785) Nebraska 10 668,602 1,566,564 2,121,578 Rhode Island 8 2,155,242 12,379,679 106,858 Totals 170,494,240 289,723,493 9,655,056
1 South Carolina underwriting results represent policies with effective dates prior to May 1, 2000 and subsequent to April 30, 2003. 2 Tennessee underwriting results represent policies with effective dates prior to January 1,1998 and subsequent to June 30, 2015. 3 Florida underwriting results represent policies with effective dates prior to January 1,1994. 4 Hawaii underwriting results represent policies with effective dates prior to July 20,1997. 5 Indiana underwriting results represent policies with effective dates prior to January 1, 2005. 6 Kentucky underwriting results represent policies with effective dates prior to September 1,1995. 7 Louisiana underwriting results represent policies with effective dates prior to October 1,1992. 8 Maine, Mississippi, and Rhode Island underwriting results represent policies with effective dates prior to January 1, 1993. 9 Missouri underwriting results represent policies with effective dates prior to July 1,1995. 10 Nebraska underwriting results represent policies with effective dates prior to July 1,1997.
Residual Market Management Summary 2016 23
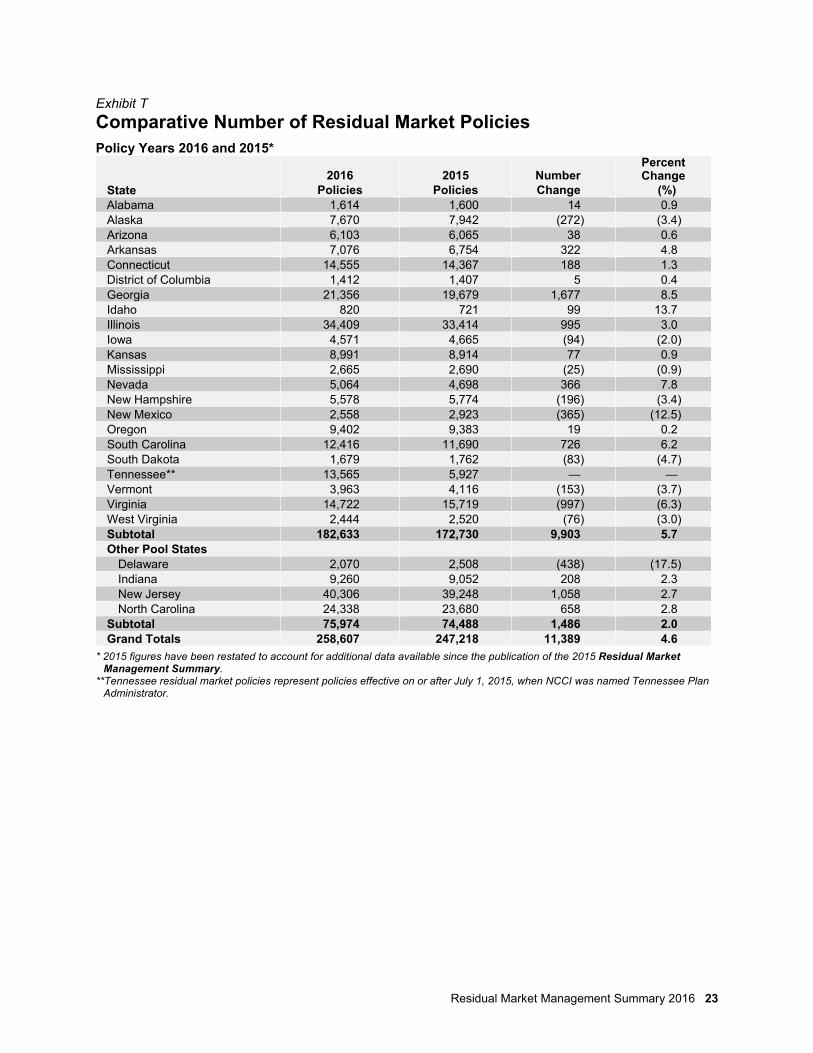
Exhibit T
Comparative Number of Residual Market Policies Policy Years 2016 and 2015*
State 2016
Policies 2015
Policies Number Change
Percent Change
(%) Alabama 1,614 1,600 14 0.9 Alaska 7,670 7,942 (272) (3.4) Arizona 6,103 6,065 38 0.6 Arkansas 7,076 6,754 322 4.8 Connecticut 14,555 14,367 188 1.3 District of Columbia 1,412 1,407 5 0.4 Georgia 21,356 19,679 1,677 8.5 Idaho 820 721 99 13.7 Illinois 34,409 33,414 995 3.0 Iowa 4,571 4,665 (94) (2.0) Kansas 8,991 8,914 77 0.9 Mississippi 2,665 2,690 (25) (0.9) Nevada 5,064 4,698 366 7.8 New Hampshire 5,578 5,774 (196) (3.4) New Mexico 2,558 2,923 (365) (12.5) Oregon 9,402 9,383 19 0.2 South Carolina 12,416 11,690 726 6.2 South Dakota 1,679 1,762 (83) (4.7) Tennessee** 13,565 5,927 — — Vermont 3,963 4,116 (153) (3.7) Virginia 14,722 15,719 (997) (6.3) West Virginia 2,444 2,520 (76) (3.0) Subtotal 182,633 172,730 9,903 5.7 Other Pool States
Delaware 2,070 2,508 (438) (17.5) Indiana 9,260 9,052 208 2.3 New Jersey 40,306 39,248 1,058 2.7 North Carolina 24,338 23,680 658 2.8
Subtotal 75,974 74,488 1,486 2.0 Grand Totals 258,607 247,218 11,389 4.6
* 2015 figures have been restated to account for additional data available since the publication of the 2015 Residual Market Management Summary.
**Tennessee residual market policies represent policies effective on or after July 1, 2015, when NCCI was named Tennessee Plan Administrator.

24 Residual Market Management Summary 2016
Exhibit U
Residual Market Premium Size Profile Policy Year 2016*
Premium Size ($) Policy Count
Total Percent of Policies
(%)
Estimated Annual Premium
($)
Total Percent of Premium
(%)
Average Premium
($) 0– 2,499 187,430 72.5 183,067,179 16.8 977
2,500– 4,999 29,905 11.6 106,260,076 9.7 3,553 5,000– 9,999 20,931 8.1 146,688,721 13.4 7,008
10,000– 19,999 11,259 4.4 155,469,619 14.2 13,808 20,000– 49,999 6,358 2.5 192,595,296 17.6 30,292 50,000– 99,999 1,793 0.7 123,024,695 11.3 68,614 100,000–199,999 677 0.3 91,859,176 8.4 135,686
200,000+ 254 0.1 92,505,472 8.5 364,195 Totals 258,607 100.0 1,091,470,234 100.0 4,221
* Total policy and estimated annual plan premium totals include servicing and direct assignment carriers for those states where NCCI provides Plan administration, Pool administration, or other services including policies cancelled short-term and the associated prorated premium. All premium totals in the state exhibits are estimated annual premiums because direct written premium is not available on an individual policy basis until 18 months after policy inception, according to NCCI’s Statistical Plan for Workers Compensation and Employers Liability Insurance.
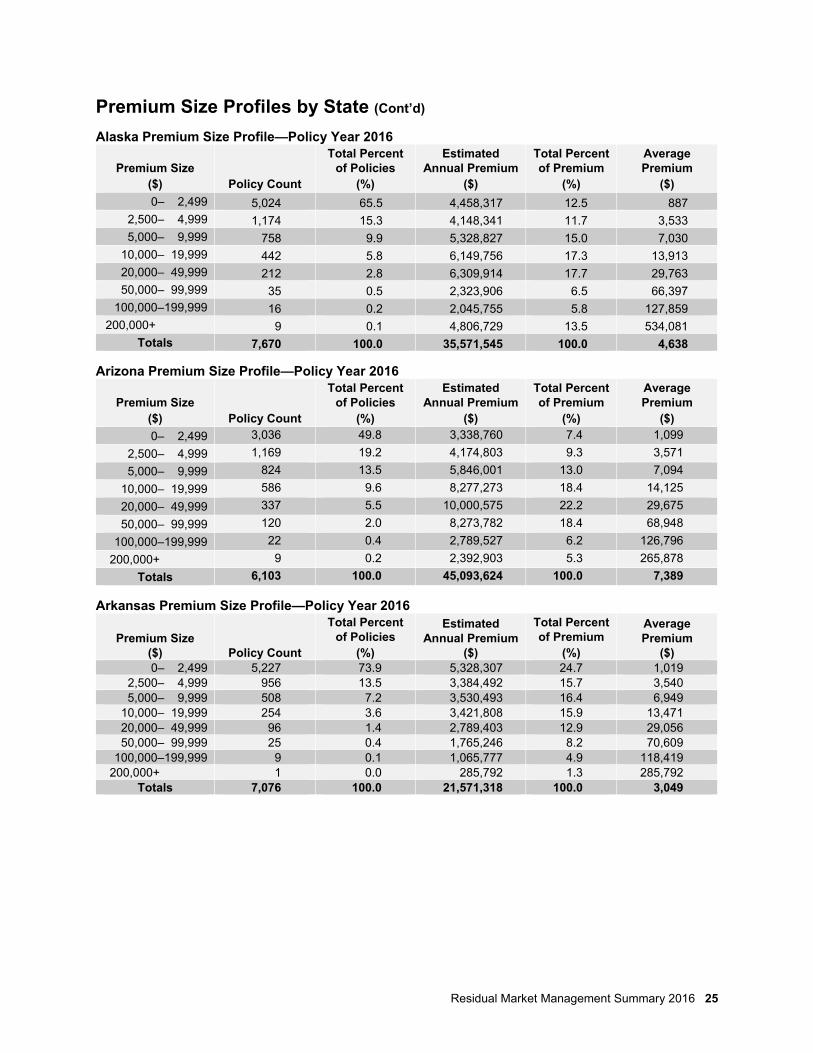
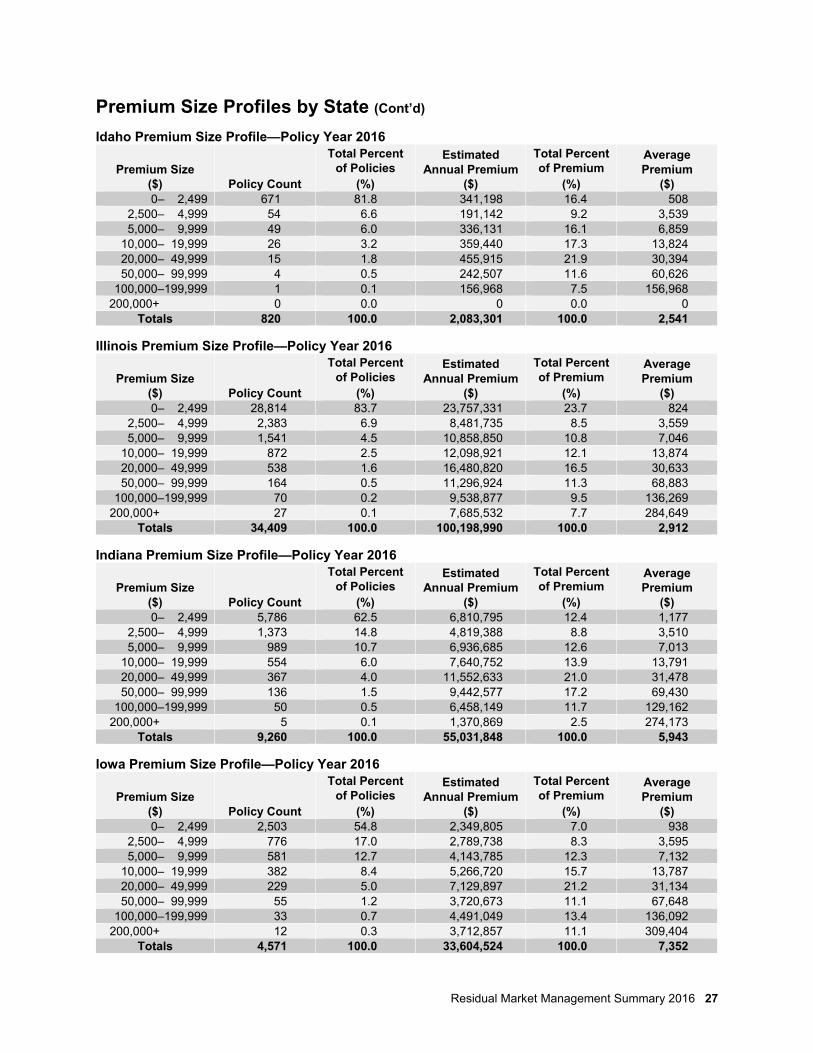
Premium Size Profiles by State
Policy Year 2016
Total policy and estimated annual Plan premium totals include servicing carrier assignments and direct assignment carriers for those states where NCCI provides Plan administration, Pool administration, or other services, including policies cancelled short-term and the associated prorated premium. The following state profile policy and premium totals were calculated using the dominant state theory for multistate policies.
Alabama Premium Size Profile—Policy Year 2016
Premium Size ($) Policy Count
Total Percent of Policies
(%)
Estimated Annual Premium
($)
Total Percent of Premium
(%)
Average Premium
($)
0– 2,499 1,086 67.3 1,337,701 14.2 1,231 2,500– 4,999 167 10.4 589,374 6.3 3,529 5,000– 9,999 155 9.6 1,102,437 11.7 7,112
10,000– 19,999 109 6.8 1,518,008 16.1 13,926 20,000– 49,999 74 4.6 2,130,037 22.6 28,784 50,000– 99,999 13 0.8 884,373 9.4 68,028 100,000–199,999 6 0.4 954,341 10.1 159,056
200,000+ 4 0.3 897,437 9.5 224,359 Totals 1,614 100.0 9,413,708 100.0 5,833
Residual Market Management Summary 2016 25
Premium Size Profiles by State (Cont’d)
Alaska Premium Size Profile—Policy Year 2016
Premium Size ($) Policy Count
Total Percent of Policies
(%)
Estimated Annual Premium
($)
Total Percent of Premium
(%)
Average Premium
($)
0– 2,499 5,024 65.5 4,458,317 12.5 887 2,500– 4,999 1,174 15.3 4,148,341 11.7 3,533 5,000– 9,999 758 9.9 5,328,827 15.0 7,030
10,000– 19,999 442 5.8 6,149,756 17.3 13,913 20,000– 49,999 212 2.8 6,309,914 17.7 29,763 50,000– 99,999 35 0.5 2,323,906 6.5 66,397 100,000–199,999 16 0.2 2,045,755 5.8 127,859
200,000+ 9 0.1 4,806,729 13.5 534,081 Totals 7,670 100.0 35,571,545 100.0 4,638
Arizona Premium Size Profile—Policy Year 2016
Premium Size ($) Policy Count
Total Percent of Policies
(%)
Estimated Annual Premium
($)
Total Percent of Premium
(%)
Average Premium
($)
0– 2,499 3,036 49.8 3,338,760 7.4 1,099
2,500– 4,999 1,169 19.2 4,174,803 9.3 3,571
5,000– 9,999 824 13.5 5,846,001 13.0 7,094
10,000– 19,999 586 9.6 8,277,273 18.4 14,125
20,000– 49,999 337 5.5 10,000,575 22.2 29,675
50,000– 99,999 120 2.0 8,273,782 18.4 68,948
100,000–199,999 22 0.4 2,789,527 6.2 126,796
200,000+ 9 0.2 2,392,903 5.3 265,878
Totals 6,103 100.0 45,093,624 100.0 7,389
Arkansas Premium Size Profile—Policy Year 2016
Premium Size ($) Policy Count
Total Percent of Policies
(%)
Estimated Annual Premium
($)
Total Percent of Premium
(%)
Average Premium
($) 0– 2,499 5,227 73.9 5,328,307 24.7 1,019
2,500– 4,999 956 13.5 3,384,492 15.7 3,540 5,000– 9,999 508 7.2 3,530,493 16.4 6,949
10,000– 19,999 254 3.6 3,421,808 15.9 13,471 20,000– 49,999 96 1.4 2,789,403 12.9 29,056 50,000– 99,999 25 0.4 1,765,246 8.2 70,609 100,000–199,999 9 0.1 1,065,777 4.9 118,419
200,000+ 1 0.0 285,792 1.3 285,792 Totals 7,076 100.0 21,571,318 100.0 3,049

26 Residual Market Management Summary 2016
Premium Size Profiles by State (Cont’d)
Connecticut Premium Size Profile—Policy Year 2016
Premium Size ($) Policy Count
Total Percent of Policies
(%)
Estimated Annual Premium
($)
Total Percent of Premium
(%)
Average Premium
($) 0– 2,499 12,089 83.1 13,699,962 28.7 1,133
2,500– 4,999 1,058 7.3 3,691,843 7.7 3,489 5,000– 9,999 667 4.6 4,607,651 9.7 6,908
10,000– 19,999 385 2.7 5,369,600 11.3 13,947 20,000– 49,999 230 1.6 7,166,160 15.0 31,157 50,000– 99,999 80 0.6 5,336,462 11.2 66,705 100,000–199,999 34 0.2 4,532,686 9.5 133,314
200,000+ 12 0.1 3,300,268 6.9 275,022 Totals 14,555 100.0 47,704,632 100.0 3,278
Delaware Premium Size Profile—Policy Year 2016
Premium Size ($) Policy Count
Total Percent of Policies
(%)
Estimated Annual Premium
($)
Total Percent of Premium
(%)
Average Premium
($) 0– 2,499 988 47.7 $1,470,365 8.0 $1,488
2,500– 4,999 446 21.5 $1,590,774 8.6 $3,567 5,000– 9,999 290 14.0 $1,983,078 10.8 $6,838
10,000– 19,999 177 8.6 $2,496,719 13.5 $14,106 20,000– 49,999 110 5.3 $3,563,822 19.3 $32,398 50,000– 99,999 35 1.7 $2,366,912 12.8 $67,626 100,000–199,999 14 0.7 $1,880,435 10.2 $134,317
200,000+ 10 0.5 $3,087,528 16.7 $308,753 Totals 2,070 100.0 $18,439,633 100.0 $8,908
District of Columbia Premium Size Profile—Policy Year 2016
Premium Size ($) Policy Count
Total Percent of Policies
(%)
Estimated Annual Premium
($)
Total Percent of Premium
(%)
Average Premium
($) 0– 2,499 982 69.6 829,056 11.5 844
2,500– 4,999 161 11.4 573,417 8.0 3,561 5,000– 9,999 106 7.5 740,723 10.3 6,987
10,000– 19,999 85 6.0 1,161,572 16.1 13,665 20,000– 49,999 57 4.0 1,832,185 25.4 32,143 50,000– 99,999 13 0.9 932,047 12.9 71,695 100,000–199,999 8 0.6 1,145,536 15.9 143,192
200,000+ 0 0.0 0 0.0 0 Totals 1,412 100.0 7,214,536 100.0 5,109
Georgia Premium Size Profile—Policy Year 2016
Premium Size ($) Policy Count
Total Percent of Policies
(%)
Estimated Annual Premium
($)
Total Percent of Premium
(%)
Average Premium
($) 0– 2,499 17,091 80.0 20,765,190 30.5 1,214
2,500– 4,999 1,892 8.9 6,636,009 9.7 3,507 5,000– 9,999 1,269 5.9 8,847,926 13.0 6,972
10,000– 19,999 648 3.0 8,940,732 13.1 13,797 20,000– 49,999 347 1.6 10,416,221 15.3 30,017 50,000– 99,999 70 0.3 4,875,659 7.2 69,652 100,000–199,999 29 0.1 3,830,770 5.6 132,095
200,000+ 10 0.1 3,825,433 5.6 382,543 Totals 21,356 100.0 68,137,940 100.0 3,191
Residual Market Management Summary 2016 27
Premium Size Profiles by State (Cont’d)
Idaho Premium Size Profile—Policy Year 2016
Premium Size ($) Policy Count
Total Percent of Policies
(%)
Estimated Annual Premium
($)
Total Percent of Premium
(%)
Average Premium
($) 0– 2,499 671 81.8 341,198 16.4 508
2,500– 4,999 54 6.6 191,142 9.2 3,539 5,000– 9,999 49 6.0 336,131 16.1 6,859
10,000– 19,999 26 3.2 359,440 17.3 13,824 20,000– 49,999 15 1.8 455,915 21.9 30,394 50,000– 99,999 4 0.5 242,507 11.6 60,626 100,000–199,999 1 0.1 156,968 7.5 156,968
200,000+ 0 0.0 0 0.0 0 Totals 820 100.0 2,083,301 100.0 2,541
Illinois Premium Size Profile—Policy Year 2016
Premium Size ($) Policy Count
Total Percent of Policies
(%)
Estimated Annual Premium
($)
Total Percent of Premium
(%)
Average Premium
($) 0– 2,499 28,814 83.7 23,757,331 23.7 824
2,500– 4,999 2,383 6.9 8,481,735 8.5 3,559 5,000– 9,999 1,541 4.5 10,858,850 10.8 7,046
10,000– 19,999 872 2.5 12,098,921 12.1 13,874 20,000– 49,999 538 1.6 16,480,820 16.5 30,633 50,000– 99,999 164 0.5 11,296,924 11.3 68,883 100,000–199,999 70 0.2 9,538,877 9.5 136,269
200,000+ 27 0.1 7,685,532 7.7 284,649 Totals 34,409 100.0 100,198,990 100.0 2,912
Indiana Premium Size Profile—Policy Year 2016
Premium Size ($) Policy Count
Total Percent of Policies
(%)
Estimated Annual Premium
($)
Total Percent of Premium
(%)
Average Premium
($) 0– 2,499 5,786 62.5 6,810,795 12.4 1,177
2,500– 4,999 1,373 14.8 4,819,388 8.8 3,510 5,000– 9,999 989 10.7 6,936,685 12.6 7,013
10,000– 19,999 554 6.0 7,640,752 13.9 13,791 20,000– 49,999 367 4.0 11,552,633 21.0 31,478 50,000– 99,999 136 1.5 9,442,577 17.2 69,430 100,000–199,999 50 0.5 6,458,149 11.7 129,162
200,000+ 5 0.1 1,370,869 2.5 274,173 Totals 9,260 100.0 55,031,848 100.0 5,943
Iowa Premium Size Profile—Policy Year 2016
Premium Size ($) Policy Count
Total Percent of Policies
(%)
Estimated Annual Premium
($)
Total Percent of Premium
(%)
Average Premium
($) 0– 2,499 2,503 54.8 2,349,805 7.0 938
2,500– 4,999 776 17.0 2,789,738 8.3 3,595 5,000– 9,999 581 12.7 4,143,785 12.3 7,132
10,000– 19,999 382 8.4 5,266,720 15.7 13,787 20,000– 49,999 229 5.0 7,129,897 21.2 31,134 50,000– 99,999 55 1.2 3,720,673 11.1 67,648
100,000–199,999 33 0.7 4,491,049 13.4 136,092 200,000+ 12 0.3 3,712,857 11.1 309,404
Totals 4,571 100.0 33,604,524 100.0 7,352

28 Residual Market Management Summary 2016
Premium Size Profiles by State (Cont’d)
Kansas Premium Size Profile—Policy Year 2016
Premium Size ($) Policy Count
Total Percent of Policies
(%)
Estimated Annual Premium
($)
Total Percent of Premium
(%)
Average Premium
($) 0– 2,499 6,539 72.7 5,763,680 20.0 881
2,500– 4,999 1,250 13.9 4,399,971 15.2 3,519 5,000– 9,999 674 7.5 4,696,539 16.3 6,968
10,000– 19,999 317 3.5 4,254,189 14.7 13,420 20,000– 49,999 149 1.7 4,396,133 15.2 29,504 50,000– 99,999 44 0.5 2,924,140 10.1 66,457 100,000–199,999 18 0.2 2,458,448 8.5 136,580
200,000+ 0 0.0 0 0.0 0 Totals 8,991 100.0 28,893,100 100.0 3,214
Mississippi Premium Size Profile—Policy Year 2016
Premium Size ($) Policy Count
Total Percent of Policies
(%)
Estimated Annual Premium
($)
Total Percent of Premium
(%)
Average Premium
($) 0– 2,499 1,590 59.7 1,879,976 11.1 1,182
2,500– 4,999 413 15.5 1,499,278 8.8 3,630 5,000– 9,999 306 11.5 2,173,105 12.8 7,101
10,000– 19,999 191 7.2 2,611,282 15.4 13,671 20,000– 49,999 107 4.0 3,207,545 18.9 29,977 50,000– 99,999 40 1.5 2,844,460 16.8 71,111 100,000–199,999 15 0.6 2,072,492 12.2 138,166
200,000+ 3 0.1 690,405 4.1 230,135 Totals 2,665 100.0 16,978,543 100.0 6,371
Nevada Premium Size Profile—Policy Year 2016
Premium Size ($) Policy Count
Total Percent of Policies
(%)
Estimated Annual Premium
($)
Total Percent of Premium
(%)
Average Premium
($) 0– 2,499 3,526 69.6 3,455,074 14.7 979
2,500– 4,999 634 12.5 2,267,619 9.7 3,576 5,000– 9,999 425 8.4 2,973,394 12.7 6,996
10,000– 19,999 284 5.6 3,998,409 17.0 14,078 20,000– 49,999 138 2.7 4,123,602 17.6 29,881 50,000– 99,999 34 0.7 2,359,309 10.1 69,391 100,000–199,999 15 0.3 2,104,111 9.0 140,274
200,000+ 8 0.2 2,193,326 9.3 274,165 Totals 5,064 100.0 23,474,844 100.0 4,636
New Hampshire Premium Size Profile—Policy Year 2016
Premium Size ($) Policy Count
Total Percent of Policies
(%)
Estimated Annual Premium
($)
Total Percent of Premium
(%)
Average Premium
($) 0– 2,499 4,095 73.4 3,761,503 18.4 918
2,500– 4,999 602 10.8 2,142,672 10.5 3,559 5,000– 9,999 454 8.1 3,177,372 15.5 6,998
10,000– 19,999 254 4.6 3,499,299 17.1 13,776 20,000– 49,999 133 2.4 4,026,522 19.7 30,274 50,000– 99,999 31 0.6 2,142,309 10.5 69,106 100,000–199,999 6 0.1 860,193 4.2 143,365
200,000+ 3 0.1 843,043 4.1 281,014 Totals 5,578 100.0 20,452,913 100.0 3,667

Residual Market Management Summary 2016 29
Premium Size Profiles by State (Cont’d)
New Jersey Premium Size Profile—Policy Year 2016
Premium Size ($) Policy Count
Total Percent of Policies
(%)
Estimated Annual Premium
($)
Total Percent of Premium
(%)
Average Premium
($) 0– 2,499 26,319 65.3 19,010,648 7.9 722
2,500– 4,999 4,995 12.4 17,920,741 7.5 3,588 5,000– 9,999 4,645 11.5 32,733,643 13.6 7,047
10,000– 19,999 2,265 5.6 31,110,646 13.0 13,735 20,000– 49,999 1,375 3.4 41,650,965 17.4 30,292 50,000– 99,999 425 1.1 29,040,804 12.1 68,331 100,000–199,999 182 0.5 25,388,553 10.6 139,498
200,000+ 100 0.2 43,031,075 17.9 430,311 Totals 40,306 100.0 239,887,075 100.0 5,952
New Mexico Premium Size Profile—Policy Year 2016
Premium Size ($) Policy Count
Total Percent of Policies
(%)
Estimated Annual Premium
($)
Total Percent of Premium
(%)
Average Premium
($) 0– 2,499 2,014 78.7 1,563,829 17.5 776
2,500– 4,999 199 7.8 703,798 7.9 3,536 5,000– 9,999 166 6.5 1,175,728 13.1 7,082
10,000– 19,999 98 3.8 1,338,142 14.9 13,654 20,000– 49,999 56 2.2 1,703,404 19.0 30,417 50,000– 99,999 17 0.7 1,181,762 13.2 69,515 100,000–199,999 7 0.3 1,027,237 11.5 146,748
200,000+ 1 0.0 268,225 3.0 268,225 Totals 2,558 100.0 8,962,125 100.0 3,504
North Carolina Premium Size Profile—Policy Year 2016
Premium Size ($) Policy Count
Total Percent of Policies
(%)
Estimated Annual Premium
($)
Total Percent of Premium
(%)
Average Premium
($) 0– 2,499 18,702 76.8 25,867,316 34.3 1,383
2,500– 4,999 2,823 11.6 10,070,002 13.3 3,567 5,000– 9,999 1,685 6.9 11,629,327 15.4 6,902
10,000– 19,999 728 3.0 10,129,860 13.4 13,915 20,000– 49,999 312 1.3 9,343,019 12.4 29,946 50,000– 99,999 65 0.3 4,520,519 6.0 69,546 100,000–199,999 18 0.1 2,305,632 3.1 128,091
200,000+ 5 0.0 1,609,024 2.1 321,805 Totals 24,338 100.0 75,474,699 100.0 3,101
Oregon Premium Size Profile—Policy Year 2016
Premium Size ($) Policy Count
Total Percent of Policies
(%)
Estimated Annual Premium
($)
Total Percent of Premium
(%)
Average Premium
($) 0– 2,499 6,615 70.4 4,439,102 12.0 671
2,500– 4,999 1,176 12.5 4,159,784 11.3 3,537 5,000– 9,999 801 8.5 5,545,436 15.0 6,923
10,000– 19,999 440 4.7 6,248,080 16.9 14,200 20,000– 49,999 284 3.0 8,332,614 22.6 29,340 50,000– 99,999 63 0.7 4,247,688 11.5 67,423 100,000–199,999 18 0.2 2,297,515 6.2 127,639
200,000+ 5 0.1 1,631,645 4.4 326,329 Totals 9,402 100.0 36,901,864 100.0 3,925

30 Residual Market Management Summary 2016
Premium Size Profiles by State (Cont’d)
South Carolina Premium Size Profile—Policy Year 2016
Premium Size ($) Policy Count
Total Percent of Policies
(%)
Estimated Annual Premium
($)
Total Percent of Premium
(%)
Average Premium
($) 0– 2,499 10,267 82.7 10,258,090 31.6 999
2,500– 4,999 1,052 8.5 3,700,871 11.4 3,517 5,000– 9,999 605 4.9 4,198,061 12.9 6,938
10,000– 19,999 269 2.2 3,665,516 11.3 13,626 20,000– 49,999 172 1.4 5,182,654 15.9 30,131 50,000– 99,999 34 0.3 2,266,931 7.0 66,674 100,000–199,999 12 0.1 1,539,790 4.7 128,315
200,000+ 5 0.0 1,706,197 5.3 341,239 Totals 12,416 100.0 32,518,110 100.0 2,619
South Dakota Premium Size Profile—Policy Year 2016
Premium Size ($) Policy Count
Total Percent of Policies
(%)
Estimated Annual Premium
($)
Total Percent of Premium
(%)
Average Premium
($) 0– 2,499 984 58.6 1,075,385 12.2 1,092
2,500– 4,999 294 17.5 1,057,214 12.0 3,595 5,000– 9,999 198 11.8 1,375,342 15.6 6,946
10,000– 19,999 122 7.3 1,653,851 18.8 13,556 20,000– 49,999 62 3.7 1,811,297 20.6 29,214 50,000– 99,999 13 0.8 857,759 9.7 65,981 100,000–199,999 5 0.3 699,256 7.9 139,851
200,000+ 1 0.1 278,726 3.2 278,726 Totals 1,679 100.0 8,808,830 100.0 5,246
Tennessee Premium Size Profile—Policy Year 2016
Premium Size ($) Policy Count
Total Percent of Policies
(%)
Estimated Annual Premium
($)
Total Percent of Premium
(%)
Average Premium
($) 0– 2,499 9,208 67.9 7,840,162 12.4 851
2,500– 4,999 1,835 13.5 6,503,684 10.3 3,544 5,000– 9,999 1,222 9.0 8,575,598 13.6 7,017
10,000– 19,999 732 5.4 9,925,011 15.7 13,558 20,000– 49,999 382 2.8 11,668,176 18.4 30,544 50,000– 99,999 129 1.0 8,910,698 14.1 69,075 100,000–199,999 44 0.3 6,271,788 9.9 142,540
200,000+ 13 0.1 3,595,744 5.7 276,595 Totals 13,565 100.0 63,290,861 100.0 4,666
Vermont Premium Size Profile—Policy Year 2016
Premium Size ($) Policy Count
Total Percent of Policies
(%)
Estimated Annual Premium
($)
Total Percent of Premium
(%)
Average Premium
($) 0– 2,499 2,625 66.2 2,547,573 13.2 970
2,500– 4,999 549 13.9 1,974,438 10.2 3,596 5,000– 9,999 375 9.5 2,684,413 13.9 7,158
10,000– 19,999 219 5.5 3,083,514 15.9 14,079 20,000– 49,999 150 3.8 4,431,732 22.9 29,544 50,000– 99,999 31 0.8 2,191,549 11.3 70,695 100,000–199,999 11 0.3 1,611,695 8.3 146,517
200,000+ 3 0.1 845,117 4.4 281,705 Totals 3,963 100.0 19,370,031 100.0 4,888
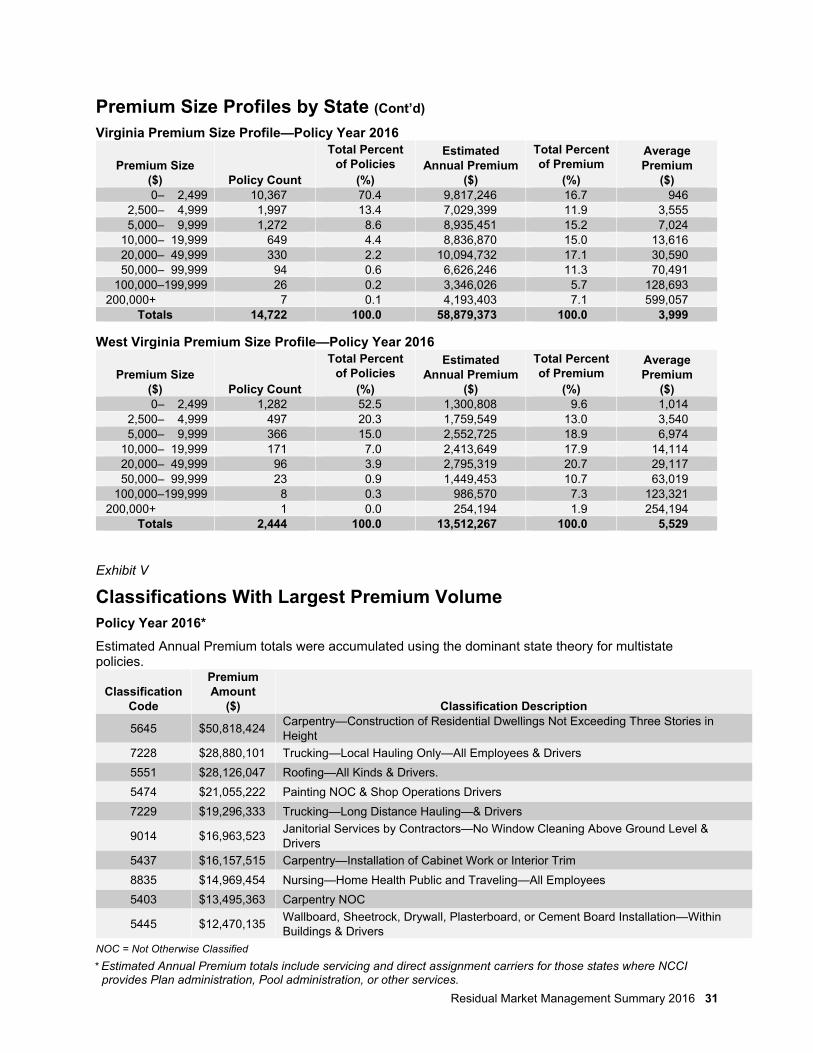
Residual Market Management Summary 2016 31
Premium Size Profiles by State (Cont’d) Virginia Premium Size Profile—Policy Year 2016
Premium Size ($) Policy Count
Total Percent of Policies
(%)
Estimated Annual Premium
($)
Total Percent of Premium
(%)
Average Premium
($) 0– 2,499 10,367 70.4 9,817,246 16.7 946
2,500– 4,999 1,997 13.4 7,029,399 11.9 3,555 5,000– 9,999 1,272 8.6 8,935,451 15.2 7,024
10,000– 19,999 649 4.4 8,836,870 15.0 13,616 20,000– 49,999 330 2.2 10,094,732 17.1 30,590 50,000– 99,999 94 0.6 6,626,246 11.3 70,491 100,000–199,999 26 0.2 3,346,026 5.7 128,693
200,000+ 7 0.1 4,193,403 7.1 599,057 Totals 14,722 100.0 58,879,373 100.0 3,999
West Virginia Premium Size Profile—Policy Year 2016
Premium Size ($) Policy Count
Total Percent of Policies
(%)
Estimated Annual Premium
($)
Total Percent of Premium
(%)
Average Premium
($) 0– 2,499 1,282 52.5 1,300,808 9.6 1,014
2,500– 4,999 497 20.3 1,759,549 13.0 3,540 5,000– 9,999 366 15.0 2,552,725 18.9 6,974
10,000– 19,999 171 7.0 2,413,649 17.9 14,114 20,000– 49,999 96 3.9 2,795,319 20.7 29,117 50,000– 99,999 23 0.9 1,449,453 10.7 63,019 100,000–199,999 8 0.3 986,570 7.3 123,321
200,000+ 1 0.0 254,194 1.9 254,194 Totals 2,444 100.0 13,512,267 100.0 5,529
Exhibit V
Classifications With Largest Premium Volume Policy Year 2016*
Estimated Annual Premium totals were accumulated using the dominant state theory for multistate policies.
Classification Code
Premium Amount
($) Classification Description
5645 $50,818,424 Carpentry—Construction of Residential Dwellings Not Exceeding Three Stories in Height
7228 $28,880,101 Trucking—Local Hauling Only—All Employees & Drivers
5551 $28,126,047 Roofing—All Kinds & Drivers.
5474 $21,055,222 Painting NOC & Shop Operations Drivers
7229 $19,296,333 Trucking—Long Distance Hauling—& Drivers
9014 $16,963,523 Janitorial Services by Contractors—No Window Cleaning Above Ground Level & Drivers
5437 $16,157,515 Carpentry—Installation of Cabinet Work or Interior Trim
8835 $14,969,454 Nursing—Home Health Public and Traveling—All Employees
5403 $13,495,363 Carpentry NOC
5445 $12,470,135 Wallboard, Sheetrock, Drywall, Plasterboard, or Cement Board Installation—Within Buildings & Drivers
NOC = Not Otherwise Classified
* Estimated Annual Premium totals include servicing and direct assignment carriers for those states where NCCI provides Plan administration, Pool administration, or other services.
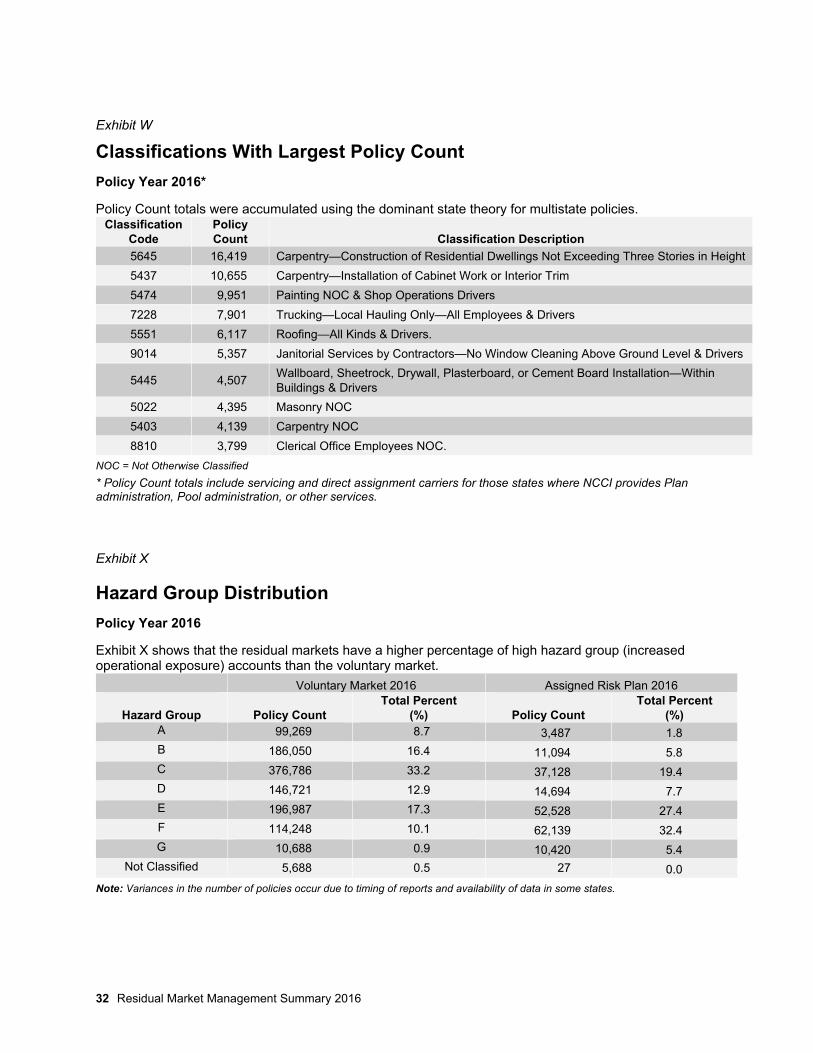
32 Residual Market Management Summary 2016
Exhibit W
Classifications With Largest Policy Count
Policy Year 2016*
Policy Count totals were accumulated using the dominant state theory for multistate policies. Classification
Code Policy Count Classification Description
5645 16,419 Carpentry—Construction of Residential Dwellings Not Exceeding Three Stories in Height
5437 10,655 Carpentry—Installation of Cabinet Work or Interior Trim
5474 9,951 Painting NOC & Shop Operations Drivers
7228 7,901 Trucking—Local Hauling Only—All Employees & Drivers
5551 6,117 Roofing—All Kinds & Drivers.
9014 5,357 Janitorial Services by Contractors—No Window Cleaning Above Ground Level & Drivers
5445 4,507 Wallboard, Sheetrock, Drywall, Plasterboard, or Cement Board Installation—Within Buildings & Drivers
5022 4,395 Masonry NOC
5403 4,139 Carpentry NOC
8810 3,799 Clerical Office Employees NOC.
NOC = Not Otherwise Classified
* Policy Count totals include servicing and direct assignment carriers for those states where NCCI provides Plan administration, Pool administration, or other services.
Exhibit X
Hazard Group Distribution
Policy Year 2016
Exhibit X shows that the residual markets have a higher percentage of high hazard group (increased operational exposure) accounts than the voluntary market.
Voluntary Market 2016 Assigned Risk Plan 2016
Hazard Group Policy Count Total Percent
(%) Policy Count Total Percent
(%) A 99,269 8.7 3,487 1.8 B 186,050 16.4 11,094 5.8 C 376,786 33.2 37,128 19.4 D 146,721 12.9 14,694 7.7 E 196,987 17.3 52,528 27.4 F 114,248 10.1 62,139 32.4 G 10,688 0.9 10,420 5.4
Not Classified 5,688 0.5 27 0.0
Note: Variances in the number of policies occur due to timing of reports and availability of data in some states.

Residual Market Management Summary 2016 33
Projected Ultimate Policy Year Results by State
Policy Years 2012–2016 (based on data reported to NCCI through December 31, 2016)
This exhibit shows premium, losses, and expenses in the following states reinsured through NCCI- serviced pools (excluding direct assignment experience):
Alabama Illinois North Carolina Alaska Iowa Oregon Arizona Kansas South Carolina Arkansas Massachusetts South Dakota Connecticut Michigan Tennessee Delaware Nevada Vermont District of Columbia New Hampshire Virginia Georgia New Jersey West Virginia Idaho New Mexico
All results shown in this section are projected to an ultimate basis. Estimates of ultimate losses may change as losses emerge, impacting the overall operating results. These results can change on a statewide basis, particularly for the recent policy years. In fact, due to the immaturity of Policy Year 2016 data, significant changes may occur.
The incurred losses and booked loss ratios shown do not include any Loss Adjustment Expense (LAE). The incurred losses equal written premium times booked loss ratio. The operating gain or loss does not include income earned on investments by participating companies. However, it does include the short-term interest income earned on investments by the Pool Administrator for the benefit of the Pool participating companies while in possession of the cash flow, pending settlement of the servicing carrier and participating company balances.
Amounts Projected to Ultimate
Policy Year Financial Results Through Fourth Quarter 2016 (Projected to Ultimate) ($000s)
Alabama
Policy Year Written Premium
($) Booked Loss Ratio
(%) Incurred Losses
($)
Net Operating Gain/(Loss)
($)
2016 6,157 54.9 3,380 712
2015 6,876 52.3 3,596 1,042
2014 7,797 41.8 3,259 1,962
2013 8,605 44.6 3,838 1,881
2012 6,685 51.4 3,436 846
Alaska
Policy Year Written Premium
($) Booked Loss Ratio
(%) Incurred Losses
($)
Net Operating Gain/(Loss)
($)
2016 38,538 84.8 32,680 (8,255)
2015 37,091 65.4 24,258 (645)
2014 40,164 54.7 21,970 3,434
2013 41,304 81.1 33,498 (7,831)
2012 35,141 44.3 15,567 5,666

34 Residual Market Management Summary 2016
Projected Ultimate Policy Year Results by State (Cont’d)
Arizona
Policy Year Written Premium
($) Booked Loss Ratio
(%) Incurred Losses
($)
Net Operating Gain/(Loss)
($)
2016 48,558 72.9 35,399 (4,225)
2015 52,916 73.4 38,840 (4,868)
2014 53,387 70.7 37,745 (3,737)
2013 47,312 74.2 35,106 (4,968)
2012 27,390 67.5 18,488 (1,624)
Arkansas
Policy Year Written Premium
($) Booked Loss Ratio
(%) Incurred Losses
($)
Net Operating Gain/(Loss)
($)
2016 23,863 59.9 14,294 1,763
2015 26,546 55.6 14,760 3,355
2014 24,936 34.8 8,678 7,994
2013 24,343 61.4 14,947 (613)
2012 19,556 100.7 19,693 (8,233)
Connecticut
Policy Year Written Premium
($) Booked Loss Ratio
(%) Incurred Losses
($)
Net Operating Gain/(Loss)
($)
2016 29,011 64.9 18,828 1,584
2015 39,484 62.3 24,599 1,568
2014 41,051 56.7 23,276 3,732
2013 35,494 72.2 25,627 (2,932)
2012 26,795 90.6 24,277 (9,408)
Delaware
Policy Year Written Premium
($) Booked Loss Ratio
(%) Incurred Losses
($)
Net Operating Gain/(Loss)
($)
2016 16,192 74.9 12,128 (1,310)
2015 17,688 110.6 19,563 (7,657)
2014 17,081 82.6 14,109 (2,690)
2013 21,638 95.0 20,556 (6,024)
2012 15,367 126.9 19,501 (9,519)

Residual Market Management Summary 2016 35
Projected Ultimate Policy Year Results by State (Cont’d)
District of Columbia
Policy Year Written Premium
($) Booked Loss Ratio
(%) Incurred Losses
($)
Net Operating Gain/(Loss)
($)
2016 7,689 49.9 3,837 1,171
2015 8,367 46.3 3,874 1,621
2014 10,283 69.7 7,167 (569)
2013 9,851 32.7 3,221 3,340
2012 7,502 39.3 2,948 1,679
Georgia
Policy Year Written Premium
($) Booked Loss Ratio
(%) Incurred Losses
($)
Net Operating Gain/(Loss)
($)
2016 63,207 114.8 72,562 (36,818)
2015 58,940 100.6 59,294 (25,061)
2014 55,749 92.6 51,624 (20,070)
2013 47,940 88.1 42,235 (16,108)
2012 32,780 87.6 28,715 (10,396)
Idaho
Policy Year Written Premium
($) Booked Loss Ratio
(%) Incurred Losses
($)
Net Operating Gain/(Loss)
($)
2016 3,094 109.8 3,397 (1,544)
2015 3,189 65.4 2,086 (123)
2014 2,131 49.8 1,061 153
2013 1,823 36.6 667 132
2012 1,664 36.3 604 134
Illinois
Policy Year Written Premium
($) Booked Loss Ratio
(%) Incurred Losses
($)
Net Operating Gain/(Loss)
($)
2016 111,325 69.9 77,816 2,772
2015 121,645 70.4 85,638 (2,883)
2014 128,974 61.7 79,577 7,687
2013 126,331 66.3 83,757 354
2012 106,649 81.6 87,026 (17,390)

36 Residual Market Management Summary 2016
Projected Ultimate Policy Year Results by State (Cont’d)
Iowa
Policy Year Written Premium
($) Booked Loss Ratio
(%) Incurred Losses
($)
Net Operating Gain/(Loss)
($)
2016 29,723 67.9 20,182 1,403
2015 35,873 68.4 24,537 1,690
2014 40,321 53.8 21,693 7,750
2013 46,532 53.4 24,848 7,212
2012 33,287 78.6 26,164 (3,334)
Kansas
Policy Year Written Premium
($) Booked Loss Ratio
(%) Incurred Losses
($)
Net Operating Gain/(Loss)
($)
2016 34,531 79.8 27,556 (3,629)
2015 39,981 60.3 24,109 4,490
2014 48,315 54.8 26,477 5,996
2013 50,008 46.5 23,254 9,982
2012 40,316 46.3 18,666 8,633
Massachusetts
Policy Year Written Premium
($) Booked Loss Ratio
(%) Incurred Losses
($)
Net Operating Gain/(Loss)
($)
2016 123,365 73.0 90,056 (12,694)
2015 121,459 73.0 88,665 (11,454)
2014 113,432 75.0 85,074 (13,422)
2013 94,390 59.0 55,690 4,833
2012 80,240 77.0 61,785 (11,953)
Michigan
Policy Year Written Premium
($) Booked Loss Ratio
(%) Incurred Losses
($)
Net Operating Gain/(Loss)
($)
2016 69,638 70.0 48,747 (383)
2015 72,041 60.0 43,225 6,808
2014 79,982 70.0 55,987 (440)
2013 75,401 62.0 46,749 5,617
2012 60,712 49.0 29,749 11,136

Residual Market Management Summary 2016 37
Projected Ultimate Policy Year Results by State (Cont’d)
Nevada
Policy Year Written Premium
($) Booked Loss Ratio
(%) Incurred Losses
($)
Net Operating Gain/(Loss)
($)
2016 27,397 64.9 17,781 1,923
2015 25,651 58.3 14,955 3,594
2014 29,791 61.7 18,381 1,838
2013 27,712 59.4 16,461 2,464
2012 21,789 60.4 13,161 1,694
New Hampshire
Policy Year Written Premium
($) Booked Loss Ratio
(%) Incurred Losses
($)
Net Operating Gain/(Loss)
($)
2016 18,407 64.9 11,946 300
2015 23,511 55.3 13,002 1,996
2014 25,110 53.8 13,509 2,760
2013 22,223 46.5 10,334 3,731
2012 16,536 34.2 5,655 4,829
New Jersey
Policy Year Written Premium
($) Booked Loss Ratio
(%) Incurred Losses
($)
Net Operating Gain/(Loss)
($)
2016 173,348 78.8 136,598 (11,216)
2015 183,395 79.4 145,616 (21,457)
2014 182,865 85.6 156,532 (33,665)
2013 166,201 82.1 136,451 (25,213)
2012 112,047 79.6 89,189 (15,802)
New Mexico
Policy Year Written Premium
($) Booked Loss Ratio
(%) Incurred Losses
($)
Net Operating Gain/(Loss)
($)
2016 12,148 75.0 9,111 (2,376)
2015 15,241 50.0 7,621 1,046
2014 18,851 40.0 7,540 3,519
2013 17,611 35.0 6,164 4,153
2012 10,106 36.0 3,638 1,476

38 Residual Market Management Summary 2016
Projected Ultimate Policy Year Results by State (Cont’d)
North Carolina
Policy Year Written Premium
($) Booked Loss Ratio
(%) Incurred Losses
($)
Net Operating Gain/(Loss)
($)
2016 53,524 69.9 37,413 530
2015 58,128 65.4 38,016 3,185
2014 55,302 64.7 35,780 3,114
2013 58,070 60.4 35,074 2,967
2012 41,757 60.4 25,221 2,122
Oregon
Policy Year Written Premium
($) Booked Loss Ratio
(%) Incurred Losses
($)
Net Operating Gain/(Loss)
($)
2016 42,000 69.9 29,358 (827)
2015 45,000 60.3 27,135 1,665
2014 42,287 84.6 35,775 (8,715)
2013 40,267 65.3 26,294 (1,083)
2012 29,074 60.4 17,561 666
South Carolina
Policy Year Written Premium
($) Booked Loss Ratio
(%) Incurred Losses
($)
Net Operating Gain/(Loss)
($)
2016 28,748 74.9 21,532 (3,746)
2015 25,577 75.4 19,285 (4,166)
2014 26,239 55.7 14,615 1,031
2013 24,590 77.2 18,984 (5,058)
2012 17,279 65.5 11,318 (2,141)
South Dakota
Policy Year Written Premium
($) Booked Loss Ratio
(%) Incurred Losses
($)
Net Operating Gain/(Loss)
($)
2016 9,957 64.9 6,462 100
2015 11,233 58.3 6,549 910
2014 11,599 57.7 6,693 1,009
2013 10,013 63.3 6,338 160
2012 8,943 42.3 3,783 1,790

Residual Market Management Summary 2016 39
Projected Ultimate Policy Year Results by State (Cont’d)
Tennessee*
Policy Year Written Premium
($) Booked Loss Ratio
(%) Incurred Losses
($)
Net Operating Gain/(Loss)
($)
2016 49,000 74.9 36,701 (3,871)
2015 25,000 70.4 17,600 (600)
2014 N/A N/A N/A N/A
2013 N/A N/A N/A N/A
2012 N/A N/A N/A N/A *Policies effective July 1, 2015, and subsequent.
Vermont
Policy Year Written Premium
($) Booked Loss Ratio
(%) Incurred Losses
($)
Net Operating Gain/(Loss)
($)
2016 15,868 59.9 9,505 2,037
2015 18,654 58.3 10,875 2,349
2014 17,422 52.8 9,199 3,152
2013 15,421 61.4 9,468 1,386
2012 11,823 58.4 6,905 792
Virginia
Policy Year Written Premium
($) Booked Loss Ratio
(%) Incurred Losses
($)
Net Operating Gain/(Loss)
($)
2016 42,656 65.1 27,769 4,534
2015 55,309 65.5 36,227 2,843
2014 54,252 65.7 35,644 1,872
2013 50,213 57.4 28,822 5,107
2012 36,706 71.5 26,245 (2,667)
West Virginia
Policy Year Written Premium
($) Booked Loss Ratio
(%) Incurred Losses
($)
Net Operating Gain/(Loss)
($)
2016 13,907 65.1 9,053 1,131
2015 16,697 55.4 9,250 3,172
2014 17,689 64.8 11,462 1,157
2013 17,320 43.2 7,482 4,900
2012 14,530 48.7 7,076 3,188

40 Residual Market Management Summary 2016
Available Residual Market Programs
As of June 1, 2017
State ARAP LSRP Merit
Rating Differential/ Surcharge
Premium Discount
Take-OutCredit
Other Programs
AK x x Alaska Residual Market Safe Workplace Incentive Program
Contracting Classification Premium Adjustment Program
AL x x x x x Drug-Free Workplace Premium Credit Program
AR x x x Tabular Adjustment Program Assigned Risk Alternate Preferred Plan Arkansas Alcohol and Drug Free Workplace Premium
Credit
AZ x x x x Arizona Alcohol- and Drug-Free Workplace Premium Credit
CT x x x x 1 x Contracting Classification Premium Adjustment Program
DC x x x x Employer Safe Workplace Program
GA x x x x Georgia Workers Compensation Assigned Risk Insurance Plan—Three Tier Rating Program
Georgia Put-In Debit Program Drug-Free Workplace Premium Credit Program Managed Care Arrangement Premium Credit Data
Reporting Program Work-Based Learning Program Premium Credit
IA x x x
ID x x x Idaho Alcohol- and Drug-Free Workplace Premium Credit
IL x x x x Contracting Classification Premium Adjustment Program
IN x x x
KS x x x x Kansas Assigned Risk Retrospective Rating Plan Kansas Assigned Risk Safety Seminar Premium Credit
Program Kansas Assigned Risk Small Employer Loss-Free Policy
Premium Credit Program
MS x x x Mississippi Small Employer Loss Free Credit Program
NC x x x x 2
NH x x x x 3 x New Hampshire Safety Incentive Program
NM x x x Workers Compensation Premium Adjustment Program for Qualifying Classifications
NV x x x
OR x x x x x Non-Experience Rated Premium Credit Oregon WCIP New Small Employer Credit Oregon Contracting Classification Premium Adjustment
Program
SC x x x x Drug- and Alcohol-Free Workplace Premium Credit Program
SD x x x x x
TN4 x x x x Drug-Free Workplace Premium Credit Program Tennessee Small Employer Plan Tennessee Special Risk Plan
VA x x x Drug-Free Workplace Premium Credit Contracting Classification Premium Adjustment Program
VT x x x x x WV x x x x
1 Connecticut—Approved reduced premium discounts are effective January 1, 2011. 2 North Carolina—Take-out credit must be applied through the NCRB. 3 New Hampshire—Premium discounts are only available for risks with standard premium > $10,000 and experience modification < 1.50. 4 Tennessee—All programs are effective July 1, 2015, except ARAP. ARAP is effective March 1, 2017. Removed premium discount effective March 1, 2017.

Residual Market Management Summary 2016 41
2017 Assigned Carriers
As of January 1, 2017 S = Servicing carrier in state; D = Direct Assignment carrier in state
Carrier Name AK
AL
AR
AZ
CT
DC
DE
GA
IA
ID
IL
KS
MS
NC
NH
NJ
NM
NV
OR
SC
SD
TN
VA
VT
WV
Acadia Insurance Co. S
Ace American Insurance Co. D D D D D D D D D D D
Alaska National Insurance Co. S
American Interstate Insurance Co. D D D D
American Mining Insurance Co. S
American Zurich Insurance Co. D D D D D D D D D D D
AmFed National Insurance Co. S
Amguard Insurance Co. S S S D S S S
Auto Owners Insurance Co. D D D D D D D
Builders Mutual Insurance Co. D D D D D
Cincinnati Insurance Co. D D D D D D D D D D D
Continental Casualty Co. D D D D D D D D D D
Continental Insurance Co. of NJ D
Hartford Underwriters D D D D D D D D D D D D
Liberty Mutual Fire Insurance Co. D
LM Insurance Corporation S S S S S S S S S S S S S S S S S
Mountain States Mutual Casualty Co. S
National Fire Insurance Co. of Hartford D
New Jersey Casualty Insurance Co. D
New Mexico Mutual Casualty Co. S
Riverport Insurance Co. S S S S S S S S S S S S S
SAIF Corporation S
Technology Insurance Co. S S S S S S S S
Travelers Indemnity Co. of CT D
Travelers Property Casualty Co. of America S S S S D S S S S S S S S S S S S S D S S
AK
AL
AR
AZ
CT
DC
DE
GA
IA
ID
IL
KS
MS
NC
NH
NJ
NM
NV
OR
SC
SD
TN
VA
VT
WV

42 Residual Market Management Summary 2016
Glossary of Residual Market Terms
Any-Exposure Theory—Applicable to multistate policies, this theory attributes the policy and related state premium to each state on the policy. For example, a policy providing coverage in SC, GA, and AL with state premiums of $25,000, $52,000, and $11,000, respectively, would be counted as an SC policy with $25,000 in premium, as a GA policy with $52,000 in premium, and as an AL policy with $11,000 in premium.
Assigned Carrier—The insurer assigned to provide coverage to an eligible employer that has applied for workers compensation insurance under NCCI’s Workers Compensation Insurance Plan. An assigned carrier can be either a servicing carrier or a direct assignment carrier.
Assigned Risk Adjustment Program (ARAP)—An assigned risk pricing program that surcharges insureds with a record of losses greater than expected under NCCI’s current Experience Rating Plan.
Assigned Risk Differential—A factor to reflect the difference in aggregate loss experience between the voluntary and assigned risk markets.
Calendar Year—The 12-month period, beginning January 1, in which a transaction either occurred or was included in the financial statements.
Combined Ratio—The sum of the loss ratio and the expense ratio for a given period. The formula for combined ratio is [Losses / Earned Premium] + [(Expenses and Allowances) / Written Premium].
Direct Assignment Carrier—An insurance company authorized by the Insurance Department to write and service assigned risk business directly without reinsurance through the National Workers Compensation Reinsurance Pooling Mechanism or other reinsurance pool.
Dominant State Theory—Applicable to multistate policies, this theory attributes the policy and entire premium to the state on the policy with the highest payroll to eliminate duplicate counting of policies. For example, a policy providing coverage in SC, GA, and AL with state payrolls of $25,000, $52,000, and
$11,000, respectively, would be counted as a GA policy.
Earned But Not Reported (EBNR) Premium Reserve—A projection of additional premium expected to be uncovered after auditing at the end of the policy (also commonly referred to as Earned But Unbilled [EBUB] Premium).
Estimated Annual Premium—Premium charged by an insurance company, at the time the policy is issued, for coverage provided by an insurance contract for a period of time. Estimated premium is reported before endorsements or audits.
Incurred But Not Reported (IBNR)—Pertaining to losses where the events that will result in a loss, and eventually a claim, have occurred, but have not yet been reported to the insurance company. The term may also include “bulk” reserves for estimated future development of case reserves.
Incurred Losses—Calendar year incurred losses equal paid losses plus the change in case and IBNR reserves during the 12-month period in question. Policy year incurred losses reflect paid losses, case reserves, and IBNR reserves for policies written in a particular policy year. They provide a matching of accidents that have occurred on premiums that have already been earned.
Loss Adjustment Expense (LAE)—Expenses of an insurance company, such as the costs of investigating cases, representing an employer before bodies that adjudicate claims, and defending lawsuits that are directly chargeable to settlement of losses. Also, operating expenses that can be allocated specifically to the settlement of losses.
Loss Ratio—The ratio of total incurred losses to total earned premiums in a given period, expressed as a percentage.
Loss Sensitive Rating Plan (LSRP)—A mandatory assigned risk retrospective rating plan for employers that have an assigned risk standard premium of $250,000 and greater.
Merit Rating—An assigned risk pricing program that applies to manual premium for employers that do not generate adequate premium to be eligible for experience rating but that have had coverage during a specified time period.

Residual Market Management Summary 2016 43
National Workers Compensation Reinsurance Pooling Mechanism (NWCRP or National Pool)—A contractual quota share reinsurance pooling mechanism. It affords participating workers compensation insurers an option for complying with state insurance plan requirements by sharing in the operating results of certain policies written under such insurance plans. Insurance companies participate in this reinsurance pooling mechanism as members of the National Workers Compensation Reinsurance Association NFP (NWCRA).
Operating Gain/(Loss)—The financial statement presentation that reflects the excess of earned premium over incurred losses and net operating expenses.
Policy Year—The year of the effective date of the policy. Policy year financial results summarize experience for all policies with effective dates in a given calendar year period.
Premiums Earned—That portion of written premiums applicable to the expired portion of the time the insurance was in effect.
Premiums Written—The premium charged by an insurance company for coverage provided by an insurance contract for a period of time after the application of endorsements, audits, etc.
Projected to Ultimate—Estimates of the total losses, premium collected, and net operating gain or loss for a policy year after all claims have been paid, premiums collected after all audits and other premium adjustments are finalized, and all pool operating and administrative expenses are paid.
Reinsurance Pool—A financial agreement among participating insurers to share in the experience of certain assigned risks. This reduces both administrative costs and annual fluctuations in the liability of participating insurers resulting from the operation of state insurance plans.
Residual Market—State insurance plans that provide eligible employers unable to secure coverage in the voluntary market with a means for insuring their operations through a designated insurance carrier. Also known as the “involuntary market,” “assigned risk market,” or “market of last resort.”
Residual Market Share—The ratio of assigned risk premium (pool plus direct assignment) to the total net direct written premium.
Servicing Carrier—An insurer, other than a direct assignment carrier, authorized to receive Plan assignments and provide coverage to eligible employers on behalf of insurance company members of the NWCRA—or participants in other reinsurance pooling mechanisms—incorporated as a part of the Plan in a state.
Servicing Carrier Allowance—The ceding commission, often expressed as a percentage of premium, retained by a servicing carrier as compensation for the expenses of servicing an employer under a Workers Compensation Insurance Plan or similar program. In states with a servicing carrier selection process, it is a component of the carrier’s proposal that is awarded in the selection process.
Surcharges—Additional charges included when calculating premium for assigned risk policies.
Take-Out Credit Program—A depopulation program that provides financial incentives for carriers when they remove employers from the residual market by writing those policies voluntarily. Credits reduce the amount of premium used in calculating a carrier’s reinsurance pool participation base or direct assignment carrier quota in a given state.
Underwriting Gain/(Loss)—The financial statement presentation of the excess of earned premium over incurred losses.
Voluntary Coverage Assistance Program (VCAP® Service)—A free Internet-based depopulation program that is supplemental to NCCI’s Workers Compensation Insurance Plan and is designed to provide an additional source for producers and employers to secure workers compensation insurance in the voluntary market.
Workers Compensation Insurance Plan (WCIP or Plan)—A program established and maintained by NCCI and approved by state insurance regulatory authorities whereby workers compensation insurance may be secured by eligible employers unable to secure such coverage in the voluntary market.
44 Residual Market Management Summary 2016
Notes:

Residual Market Management Summary 2016 45
Notes:

46 Residual Market Management Summary 2016
Notes:


901 Peninsula Corporate Circle
Boca Raton, FL 33487-1362
800- -123 (800-622-4123)