resilience analysis in karamoja
TRANSCRIPT
AnalysIng Resilience for better targeting and action
RESI
LIEN
CE
IND
EX M
EASU
REM
ENT
AN
D A
NA
LYSI
S II
y R
IMA
II
FA
O r
esil
ien
ce
an
aly
sis
rep
or
tN
o. 1
0
RESILIENCE ANALYSIS
IN KARAMOJA

Cover picture: © WFP \ Riccardo Gangale
Food and Agriculture Organization of the United NationsRome, 2018
FAO Resilience Analysis report
ANALYSING RESILIENCE FOR TARGETING AND ACTION
No. 10
Resilience Analysis in karamoja
Uganda
This publication has been produced with the assistance of the European Union. The contents of this publication are the sole responsibility of FAO and can in no way be taken to reflect the views of the European Union
The designations employed and the presentation of material in this information product do not imply the expression of any opinion whatsoever on the part of the Food and Agriculture Organization of the United Nations (FAO) concerning the legal or development status of any country, territory, city or area or of its authorities, or concerning the delimitation of its frontiers or boundaries. The mention of specific companies or products of manufacturers, whether or not these have been patented, does not imply that these have been endorsed or recommended by FAO in preference to others of a similar nature that are not mentioned.
The views expressed in this information product are those of the authors and do not necessarily reflect the views or policies of FAO.
ISBN 978-92-5-130137-1
© FAO, 2018
FAO encourages the use, reproduction and dissemination of material in this information product. Except where otherwise indicated, material may be copied, downloaded and printed for private study, research and teaching purposes, or for use in non-commercial products or services, provided that appropriate acknowledgement of FAO as the source and copyright holder is given and that FAO’s endorsement of users’ views, products or services is not implied in any way.
All requests for translation and adaptation rights, and for resale and other commercial use rights should be made via www.fao.org/contact-us/licence-request or addressed to [email protected].
FAO information products are available on the FAO website (www.fao.org/publications) and can be purchased through [email protected].
iii
CONTENTS
ACKNOWLEDGEMENTS . . . . . . . . . . . . . . . . . . . . . . . . . . . . . . . . . . . . . . . . . . . . . . . . . . . . . . . . . . v
ACRONYMS . . . . . . . . . . . . . . . . . . . . . . . . . . . . . . . . . . . . . . . . . . . . . . . . . . . . . . . . . . . . . . . . . . . . vi
OBJECTIVE OF THE ANALYSIS . . . . . . . . . . . . . . . . . . . . . . . . . . . . . . . . . . . . . . . . . . . . . . . . . . . . vii
1 KEY MESSAGES . . . . . . . . . . . . . . . . . . . . . . . . . . . . . . . . . . . . . . . . . . . . . . . . . . . . . . . . . . . . . . 1
2 BACKGROUND INFORMATION . . . . . . . . . . . . . . . . . . . . . . . . . . . . . . . . . . . . . . . . . . . . . . . . . . 5
3 MAIN FINDINGS; POLICY AND PROGRAMMING IMPLICATIONS . . . . . . . . . . . . . . . . . . . . . . 9
4 METHODOLOGY AND COVERAGE . . . . . . . . . . . . . . . . . . . . . . . . . . . . . . . . . . . . . . . . . . . . . . . 23
5 NEXT STEPS . . . . . . . . . . . . . . . . . . . . . . . . . . . . . . . . . . . . . . . . . . . . . . . . . . . . . . . . . . . . . . . . 27
REFERENCES . . . . . . . . . . . . . . . . . . . . . . . . . . . . . . . . . . . . . . . . . . . . . . . . . . . . . . . . . . . . . . . . . 29
ANNEX I – RESILIENCE MEASUREMENT . . . . . . . . . . . . . . . . . . . . . . . . . . . . . . . . . . . . . . . . . . . 31
ANNEX II – DESCRIPTIVE STATISTICS . . . . . . . . . . . . . . . . . . . . . . . . . . . . . . . . . . . . . . . . . . . . . 48
FIGURES
1 Uganda and Karamoja (by district) maps . . . . . . . . . . . . . . . . . . . . . . . . . . . . . . . . . . . . . . . . 5
2 Map of Resilience Capacity Index, and wasting, stunting and underweight children in Karamoja districts . . . . . . . . . . . . . . . . . . . . . . . . . . . . . . . . . . . . . . . . . . . . . . . . . . . . . . . 10
3 Percentage of households reporting shocks by district . . . . . . . . . . . . . . . . . . . . . . . . . . . 18
A1 RSM – Correlation RCI-pillars by district . . . . . . . . . . . . . . . . . . . . . . . . . . . . . . . . . . . . . . . 35
A2 RSM: Correlation variables – ABS by district . . . . . . . . . . . . . . . . . . . . . . . . . . . . . . . . . . . 35
A3 RSM: Correlation variables – AST by district . . . . . . . . . . . . . . . . . . . . . . . . . . . . . . . . . . . . 36
A4 RSM: Correlation variables – SSN by district . . . . . . . . . . . . . . . . . . . . . . . . . . . . . . . . . . . . 36
A5 RSM: Correlation variables – AC by district . . . . . . . . . . . . . . . . . . . . . . . . . . . . . . . . . . . . . 37
A6 RSM – Correlation RCI-pillars by gender of household head . . . . . . . . . . . . . . . . . . . . . . . 37
TABLES
1 Comparative Human Development Indicators for Karamoja . . . . . . . . . . . . . . . . . . . . . . . . 6
2 Livelihoods by district . . . . . . . . . . . . . . . . . . . . . . . . . . . . . . . . . . . . . . . . . . . . . . . . . . . . . . . 13
3 Gender of household head by district . . . . . . . . . . . . . . . . . . . . . . . . . . . . . . . . . . . . . . . . . . 16
RESILIENCE ANALYSIS IN KARAMOJA, UGANDAiv
A1 Definition of resilience pillars and food security indicators . . . . . . . . . . . . . . . . . . . . . . . . 32
A2 Variables employed in the RIMA-II model . . . . . . . . . . . . . . . . . . . . . . . . . . . . . . . . . . . . . . . 33
A3 MIMIC results . . . . . . . . . . . . . . . . . . . . . . . . . . . . . . . . . . . . . . . . . . . . . . . . . . . . . . . . . . . . . 34
A4 OLS regression of shocks on food security indicators and RCI . . . . . . . . . . . . . . . . . . . . . . 39
A5 OLS regression of shocks on RCI by district . . . . . . . . . . . . . . . . . . . . . . . . . . . . . . . . . . . . . 40
A6 OLS regression of shocks on food consumption components . . . . . . . . . . . . . . . . . . . . . . 41
A7 OLS regression of shocks on ABS variables . . . . . . . . . . . . . . . . . . . . . . . . . . . . . . . . . . . . . 42
A8 OLS regression of shocks on AST variables . . . . . . . . . . . . . . . . . . . . . . . . . . . . . . . . . . . . . 43
A9 OLS regression of shocks on SSN variables . . . . . . . . . . . . . . . . . . . . . . . . . . . . . . . . . . . . . 44
A10 OLS regression of shocks on AC variables . . . . . . . . . . . . . . . . . . . . . . . . . . . . . . . . . . . . . . 45
A11 OLS regression of the determinants of food security indicators . . . . . . . . . . . . . . . . . . . . 46
A12 Summary statistics of variables employed for the estimation of RCI . . . . . . . . . . . . . . . . . 48
A13 Summary statistics of variables employed for the estimation of RCI . . . . . . . . . . . . . . . . . . . . by district and gender of household head . . . . . . . . . . . . . . . . . . . . . . . . . . . . . . . . . . . . . . . 49
A14 Shock frequency – percentage of households reporting shock in the last 12 months by district . . . . . . . . . . . . . . . . . . . . . . . . . . . . . . . . . . . . . . . . . . . . . . . . . . . . 50
A15 Shock frequency – community questionnaire by district . . . . . . . . . . . . . . . . . . . . . . . . . . . 50
A16 Percentage of households adopting coping strategies to deal with drought by district . . . . . . . . . . . . . . . . . . . . . . . . . . . . . . . . . . . . . . . . . . . . . . . . . . . . . . 51
A17 Households reporting crop failure (percentage) by district . . . . . . . . . . . . . . . . . . . . . . . . 52
A18 Mean RCI by perceived resilience indicators . . . . . . . . . . . . . . . . . . . . . . . . . . . . . . . . . . . . 53
v
ACKNOWLEDGEMENTS
Special thanks go to Rebecca Pietrelli, Francesca Grazioli, Stefania Di Giuseppe, Marco d’Errico and Lavinia Antonaci from the Agricultural Development Economics Division (ESA), and Luca Russo from the Resilience Programme Management Team (SP5) of the Food and Agriculture Organization of the United Nations (FAO), and to Immaculate Atieno from FAO Kenya and Benard Onzima from FAO Uganda, for their contributions of technical information. Vu Hien from FAO Kenya contributed to data entry and cleaning.
The analysis has been conducted within the Resilience Measurement Unit (RMU), composed by representatives from FAO, the United Nations Children’s Fund (UNICEF), the World Food Programme (WFP), the Uganda Bureau of Statistics (UBOS) and the Office of the Prime Minister of Uganda (OPM), with the technical support of the Intergovernmental Authority on Development/Resilience Analysis Unit (IGAD/RAU). UNICEF and WFP have participated in every phase of the analysis especially supporting the data collection and contributing to the development of the report.
Tomaso Lezzi and Giorgia Wizemann worked on the formatting and layout of the publication. Alecia Wood completed the editing.
The team acknowledges Massimo Castiello and Benard Onzima from FAO Uganda for their assistance and liaison with the partners of the joint FAO, WFP and UNICEF initiative, the Enhancing Resilience in Karamoja Programme.
Thanks are also extended to the Uganda Bureau of Statistics (UBOS) and in particular to Mr Paul Opio for their active role and support during the entire data collection process.
Special gratitude is expressed to WFP Photography Unit, and in particular to colleagues Rein Skullerud and Riccardo Gangale, who provided the organization’s copyrighted images for this publication.
RESILIENCE ANALYSIS IN KARAMOJA, UGANDAvi
ACRONYMS
ABS Access to Basic Services AC Adaptive Capacity AST Assets CAPI Computer Assisted Personal Interviewing CSI Coping Strategy IndexERKP Enhancing Resilience in Karamoja ProgrammeESP Expanding Social Protection ProgrammeFHH Female-headed HouseholdFSNA Food Security and Nutrition Assessment for the Karamoja regionGIS Geographic Information SystemHDDS Household Dietary Diversity Score HH Household HeadIDDRSI Intergovernmental Authority on Development Drought Disaster Resilience Sustainability InitiativeIGAD Intergovernmental Authority on DevelopmentIGAD/RAU Intergovernmental Authority on Development/Resilience Analysis Unit JRS Joint Resilience Strategy MAAIF Ministry of Agriculture, Animal Industry and Fisheries of UgandaMHH Male-headed HouseholdMIMIC Multiple Indicators Multiple Causes ODI Overseas Development InitiativeOPM Office of the Prime Minister of UgandaRAP Resilience Analysis and Policies (team) RCI Resilience Capacity Index RIMA Resilience Index Measurement and Analysis RMU Resilience Measurement UnitRM-TWG Resilience Measurement Technical Working Group RSM Resilience Structure Matrix SEM Structural Equation Model SSN Social Safety Nets TLU Tropical Livestock Units UBOS Uganda Bureau of StatisticsUNICEF United Nations Children’s FundWFP Word Food Programme
vii
OBJECTIVE OF THE ANALYSIS
The region of Karamoja, located in the northeast of Uganda, is the poorest and least developed region in the country. It is comprised of seven districts: Kaabong, Abim, Kotido, Moroto, Napak, Nakapiripirit and Amudat.1 Historically, Karamoja has been a pastoral area, suited for livestock husbandry. Crop production, which is less reliable there, has recently emerged as an important source of household food and income in some areas. Although Karamoja bears similarities to other pastoral regions in East Africa, few of its households are self-sufficient in terms of food and most rely on barter trading for much of their staple foods. The region suffers from severe environmental degradation, poor infrastructure, lack of social services, and limited opportunities to sell agricultural products. There is a high degree of sociocultural marginalisation, with a long-standing dependency on external aid. In recent years, the region has been subject to recurrent droughts and sporadic floods. This may be resulting in the erosion of local people’s resilience and coping capacities, and has led to a shift towards the need for better understanding the importance of livelihood strategies and for building the resilience of livelihoods. The region is also recognized as being the least socially and economically developed part of the country, and the majority of the population remains below the poverty line.
In 2015, three United Nations (UN) agencies – the United Nations Children’s Fund (UNICEF), the Food and Agriculture Organization of the United Nations (FAO), and the World Food Programme (WFP) – developed a resilience strategy for Karamoja together. This joint resilience strategy (JRS) represents a commitment and collaborative focus for UNICEF, FAO, and WFP’s efforts to build resilience in the Karamoja region. The overall goal of the JRS is to improve the food security and nutrition status of the region during the period from 2016 to 2020. This JRS identifies the need for the three agencies to develop a common approach to measuring resilience in the context of Karamoja, which have thus adopted FAO’s Resilience Index Measurement and Analysis-II (RIMA-II)2 approach to measure resilience to food insecurity there. This analysis is therefore one of the first steps to systematically measure resilience in the region.
This report will be used for assessing the impact of the JRS by analysing resilience capacity at the household level. The analysis has been conducted by the Resilience Measurement Unit (RMU) of the Office of the Prime Minister of Uganda (OPM), which is made up of representatives from FAO, UNICEF, WFP, the Uganda Bureau of Statistics (UBOS) and OPM, with the technical support of the Intergovernmental Authority on Development/Resilience Analysis Unit (IGAD/RAU).
1 See Figure 1 for a map of Karamoja and its districts.2 Annex I includes an explanation of the RIMA-II methodology, and how the Resilience Capacity Index (RCI) and resilience
pillars are estimated from observed variables.

RESILIENCE ANALYSIS IN KARAMOJA, UGANDAviii
© W
FP \ R
icca
rdo
Gan
gale
The methodology adopted for identifying the key contributing indicators of household resilience capacity is FAO’s RIMA-II approach. Below, the main findings of this resilience analysis of Karamoja are presented in relation to their implications for programme design.
© W
FP \ R
icca
rdo
Gan
gale
© W
FP \ R
icca
rdo
Gan
gale
1
1 KEY MESSAGES This section summarizes the main results of the analysis and related implications for policy and programming
KEY MESSAGE 1:The key drivers of resilience capacity are diversification of crop production, diversification of income sources, the coping strategies adopted in the case of a food shortage, and education; these factors are all part of the Adaptive Capacity (AC) pillar of resilience3 measured within RIMA-II.
The findings of the analysis support the nature of measures outlined in the JRS Building Block 1 aimed at strengthening the productive sectors. Programmes by FAO, the Ministry of Agriculture, Animal Industry and Fisheries of Uganda (MAAIF) and partners should support crop productivity and diversification among farmer and agro-pastoralist communities mainly in the districts of Abim, Moroto, Amudat, Napak and Nakapiripirit, characterized by livelihoods practicing crop production. Income diversification activities related to crop and livestock value chains are also key for building resilience, specifically in the districts of Nakapiripirit, Amudat, and Kaabong. Meanwhile, improving education levels is particularly recommended for the districts of Kotido, Napak and Moroto, where a low level of education is reported for the population.
KEY MESSAGE 2:Non-productive assets and agricultural assets, including land (access to land and natural resource management), also significantly contribute to the resilience capacity of households.
A strong focus should be placed on programmes and policies aimed at building the asset base of households throughout Karamoja. FAO and partners together with the Government of Uganda should support farmer and to some extent agro-pastoralist households, particularly within
3 The pillars of resilience, which form part of the RIMA-II analysis, used in this report are: Access to Basic Services (ABS), Assets (AST), Social Safety Nets (SNN), and Adaptive Capacity (AC). Further information on the variables that comprise each pillar and how they are estimated can be found in Annex I.
© W
FP \ R
icca
rdo
Gan
gale
RESILIENCE ANALYSIS IN KARAMOJA, UGANDA2
the green belt zone,4 to enhance crop productivity through improved access to arable land. For pastoralist and agro-pastoralist households, programmes should aim at investing in livestock assets and related livestock production.
KEY MESSAGE 3:In comparison to Abim, the most resilient district of the region, all the other districts (especially Amudat) report lower closeness to main services (specifically schools and hospitals), low stability of the main water source, and low access to improved sanitation and water.
Access to essential services, such as water and sanitation, is an important determinant of households’ resilience capacity. This is reflected in the JRS Building Block 2, which aims to improve basic social services. The findings from all districts highlight the need to improve access to basic social services, particularly through investments in sanitation and health programmes, as well as through access to water, both for human consumption and agricultural production activities. In addition, improved access to agricultural markets would result in increased income from agricultural production for most households in the Karamoja region.
KEY MESSAGE 4:Households in the Abim district show a high contribution to resilience capacity from formal transfers, such as cash for work programmes. On the other hand, households in Amudat, Moroto and Nakapiripirit show poor access to credit services.
The findings from the analysis show the importance of investing in access to credit and transfer programmes, which is in line with Building Block 3 of the JRS, which aims to establish predictable safety nets to address the most vulnerable people’s basic needs. For instance, among other interventions, supporting saving groups5 would increase households’ access to productive services and encourage higher risk, but more productive, activities. Similarly, the expansion of rural microfinance or credit facilities is also linked to improved productivity and income opportunities for households, while further cash or food for work programmes are especially crucial for the most vulnerable communities.
KEY MESSAGE 5:Female-headed households located in Kaabong, Kotido, Moroto, Nakapiripirit and Napak are less resilient than male-headed households. Female-headed households have a lower amount of assets (both productive and non-productive) compared to male-headed households.
In these districts, lower resilience capacity is related particularly to households’ lower number of household-related assets, such as mobile phones, bicycles, and radios; lower ownership of livestock; and more limited access to land. This shows the need to increase the asset ownership of female-headed households in general, with a focus on female-headed households in the above-mentioned districts. Gender-sensitive approaches are highly relevant in the context of Karamoja, particularly to ensure equitable access to productive assets, such as arable land for cultivation, and to agricultural inputs.
4 The green belt is a zone that is characterised by better rainfall for growing crops compared to other areas in Karamoja, with fertile, loamy soils. It extends across the south and west of the Karamoja region.
5 Savings groups are formed by individuals within the same community who come together for the purpose of collectively saving money for future use.
3
Chapter 1 – Key messages
KEY MESSAGE 6: Almost all households in the region report droughts as the shock they face the most. The coping strategies they employ have major negative implications for their food security and for income-generating activities in the long term.
Other shocks reported are high food prices, as well as pests, parasites and diseases. Programmes should prioritize the sustainable support of early warning mechanisms, including sustainable disease control, for recurring shocks and the provision of timely information to assist households in disaster preparation and mitigation measures.
2 BACKGROUND INFORMATIONThis section introduces background information on the Karamoja region, and explains why the analysis has been carried out in this region of Uganda
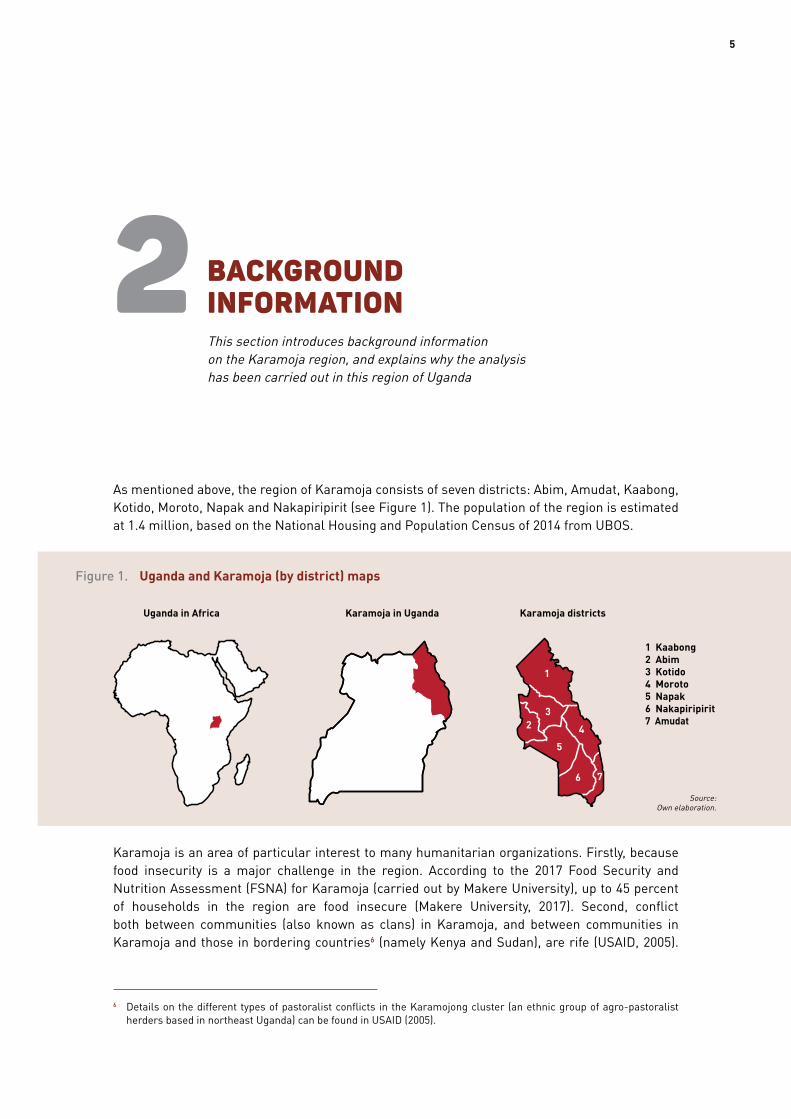
As mentioned above, the region of Karamoja consists of seven districts: Abim, Amudat, Kaabong, Kotido, Moroto, Napak and Nakapiripirit (see Figure 1). The population of the region is estimated at 1.4 million, based on the National Housing and Population Census of 2014 from UBOS.
1
3
4
5
6 7
2
1 Kaabong2 Abim3 Kotido4 Moroto5 Napak6 Nakapiripirit7 Amudat
Karamoja districtsKaramoja in UgandaUganda in Africa
Figure 1. Uganda and Karamoja (by district) maps
Karamoja is an area of particular interest to many humanitarian organizations. Firstly, because food insecurity is a major challenge in the region. According to the 2017 Food Security and Nutrition Assessment (FSNA) for Karamoja (carried out by Makere University), up to 45 percent of households in the region are food insecure (Makere University, 2017). Second, conflict both between communities (also known as clans) in Karamoja, and between communities in Karamoja and those in bordering countries6 (namely Kenya and Sudan), are rife (USAID, 2005).
6 Details on the different types of pastoralist conflicts in the Karamojong cluster (an ethnic group of agro-pastoralist herders based in northeast Uganda) can be found in USAID (2005).
© W
FP \ R
icca
rdo
Gan
gale
5
2 BACKGROUND INFORMATIONThis section introduces background information on the Karamoja region, and explains why the analysis has been carried out in this region of Uganda
As mentioned above, the region of Karamoja consists of seven districts: Abim, Amudat, Kaabong, Kotido, Moroto, Napak and Nakapiripirit (see Figure 1). The population of the region is estimated at 1.4 million, based on the National Housing and Population Census of 2014 from UBOS.
1
3
4
5
6 7
2
1 Kaabong2 Abim3 Kotido4 Moroto5 Napak6 Nakapiripirit7 Amudat
Karamoja districtsKaramoja in UgandaUganda in Africa
Figure 1. Uganda and Karamoja (by district) maps
Karamoja is an area of particular interest to many humanitarian organizations. Firstly, because food insecurity is a major challenge in the region. According to the 2017 Food Security and Nutrition Assessment (FSNA) for Karamoja (carried out by Makere University), up to 45 percent of households in the region are food insecure (Makere University, 2017). Second, conflict both between communities (also known as clans) in Karamoja, and between communities in Karamoja and those in bordering countries6 (namely Kenya and Sudan), are rife (USAID, 2005).
6 Details on the different types of pastoralist conflicts in the Karamojong cluster (an ethnic group of agro-pastoralist herders based in northeast Uganda) can be found in USAID (2005).
Source:Own elaboration.
© W
FP \ R
icca
rdo
Gan
gale
RESILIENCE ANALYSIS IN KARAMOJA, UGANDA6
© W
FP \ R
icca
rdo
Gan
gale
Furthermore, insecurity associated with armed conflict has remained an issue in the region for decades (Saferworld, 2010). Additionally, a high level of climate variability undermines the capacity to utilize the region’s natural resources, as they are affected by droughts, floods and dry spells (USAID, 2017).
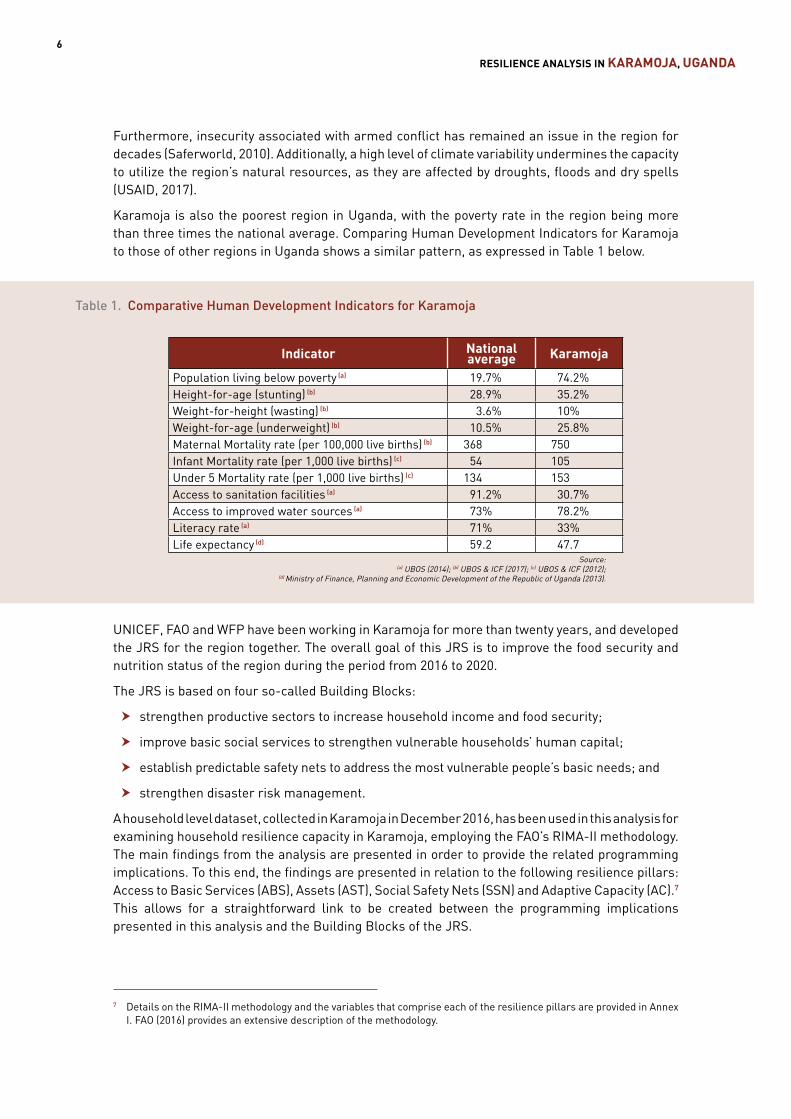
Karamoja is also the poorest region in Uganda, with the poverty rate in the region being more than three times the national average. Comparing Human Development Indicators for Karamoja to those of other regions in Uganda shows a similar pattern, as expressed in Table 1 below.
Table 1. Comparative Human Development Indicators for Karamoja
Indicator National average Karamoja
Population living below poverty (a) 19.7% 74.2%Height-for-age (stunting) (b) 28.9% 35.2%Weight-for-height (wasting) (b) 3.6% 10%Weight-for-age (underweight) (b) 10.5% 25.8%Maternal Mortality rate (per 100,000 live births) (b) 368 750Infant Mortality rate (per 1,000 live births) (c) 54 105Under 5 Mortality rate (per 1,000 live births) (c) 134 153Access to sanitation facilities (a) 91.2% 30.7%Access to improved water sources (a) 73% 78.2%Literacy rate (a) 71% 33%Life expectancy (d) 59.2 47.7
Source:(a) UBOS (2014); (b) UBOS & ICF (2017); (c) UBOS & ICF (2012);
(d) Ministry of Finance, Planning and Economic Development of the Republic of Uganda (2013).
UNICEF, FAO and WFP have been working in Karamoja for more than twenty years, and developed the JRS for the region together. The overall goal of this JRS is to improve the food security and nutrition status of the region during the period from 2016 to 2020.
The JRS is based on four so-called Building Blocks:
h strengthen productive sectors to increase household income and food security;
h improve basic social services to strengthen vulnerable households’ human capital;
h establish predictable safety nets to address the most vulnerable people’s basic needs; and
h strengthen disaster risk management.
A household level dataset, collected in Karamoja in December 2016, has been used in this analysis for examining household resilience capacity in Karamoja, employing the FAO’s RIMA-II methodology. The main findings from the analysis are presented in order to provide the related programming implications. To this end, the findings are presented in relation to the following resilience pillars: Access to Basic Services (ABS), Assets (AST), Social Safety Nets (SSN) and Adaptive Capacity (AC).7 This allows for a straightforward link to be created between the programming implications presented in this analysis and the Building Blocks of the JRS.
7 Details on the RIMA-II methodology and the variables that comprise each of the resilience pillars are provided in Annex I. FAO (2016) provides an extensive description of the methodology.
© W
FP \ R
icca
rdo
Gan
gale
Furthermore, insecurity associated with armed conflict has remained an issue in the region for decades (Saferworld, 2010). Additionally, a high level of climate variability undermines the capacity to utilize the region’s natural resources, as they are affected by droughts, floods and dry spells (USAID, 2017).
Karamoja is also the poorest region in Uganda, with the poverty rate in the region being more than three times the national average. Comparing Human Development Indicators for Karamoja to those of other regions in Uganda shows a similar pattern, as expressed in Table 1 below.
Table 1. Comparative Human Development Indicators for Karamoja
Indicator National average Karamoja
Population living below poverty (a) 19.7% 74.2%Height-for-age (stunting) (b) 28.9% 35.2%Weight-for-height (wasting) (b) 3.6% 10%Weight-for-age (underweight) (b) 10.5% 25.8%Maternal Mortality rate (per 100,000 live births) (b) 368 750Infant Mortality rate (per 1,000 live births) (c) 54 105Under 5 Mortality rate (per 1,000 live births) (c) 134 153Access to sanitation facilities (a) 91.2% 30.7%Access to improved water sources (a) 73% 78.2%Literacy rate (a) 71% 33%Life expectancy (d) 59.2 47.7
Source:(a) UBOS (2014); (b) UBOS & ICF (2017); (c) UBOS & ICF (2012);
(d) Ministry of Finance, Planning and Economic Development of the Republic of Uganda (2013).
UNICEF, FAO and WFP have been working in Karamoja for more than twenty years, and developed the JRS for the region together. The overall goal of this JRS is to improve the food security and nutrition status of the region during the period from 2016 to 2020.
The JRS is based on four so-called Building Blocks:
h strengthen productive sectors to increase household income and food security;
h improve basic social services to strengthen vulnerable households’ human capital;
h establish predictable safety nets to address the most vulnerable people’s basic needs; and
h strengthen disaster risk management.
A household level dataset, collected in Karamoja in December 2016, has been used in this analysis for examining household resilience capacity in Karamoja, employing the FAO’s RIMA-II methodology. The main findings from the analysis are presented in order to provide the related programming implications. To this end, the findings are presented in relation to the following resilience pillars: Access to Basic Services (ABS), Assets (AST), Social Safety Nets (SSN) and Adaptive Capacity (AC).7 This allows for a straightforward link to be created between the programming implications presented in this analysis and the Building Blocks of the JRS.
7 Details on the RIMA-II methodology and the variables that comprise each of the resilience pillars are provided in Annex I. FAO (2016) provides an extensive description of the methodology.
© W
FP \ R
icca
rdo
Gan
gale
9
3 MAIN FINDINGS; POLICY AND PROGRAMMING IMPLICATIONSThis section provides, for each finding, key evidence from the RIMA analysis and outlines programming and policy implications
MAIN FINDING 1
Abim is the most resilient district in Karamoja, where crop diversification, income source diversification and education play a key role in contributing to resilience capacity.
For the second most resilient district, Napak, education and crop diversification have a more marginal role.
Among the medium-high resilient districts, Kotido and Moroto show a lower capacity to cope with food-related shocks (expressed by the Coping Strategy Index (CSI) 8) and lower education; Nakapiripirit has a low number of income sources and cultivated crops.
The less resilient districts are Amudat and Kaabong; in Amudat, income diversification and crop diversification have limited relevance in terms of resilience capacity.
The policy implications as a result of these findings are aligned with the JRS Building Block 1 on promoting resilience, which seeks to “strengthen productive sectors to increase household income and food security”. This refers not only to agricultural livelihoods but also to non-agricultural livelihood options. For example, access to vocational training and programmes that help youth enter the job market can increase income opportunities outside of agriculture, such as in the extractive industries.
8 The CSI is a weighted sum of the days the household adopted different strategies to cope with food shortage in the past week (see Table A2).
© W
FP \ R
icca
rdo
Gan
gale
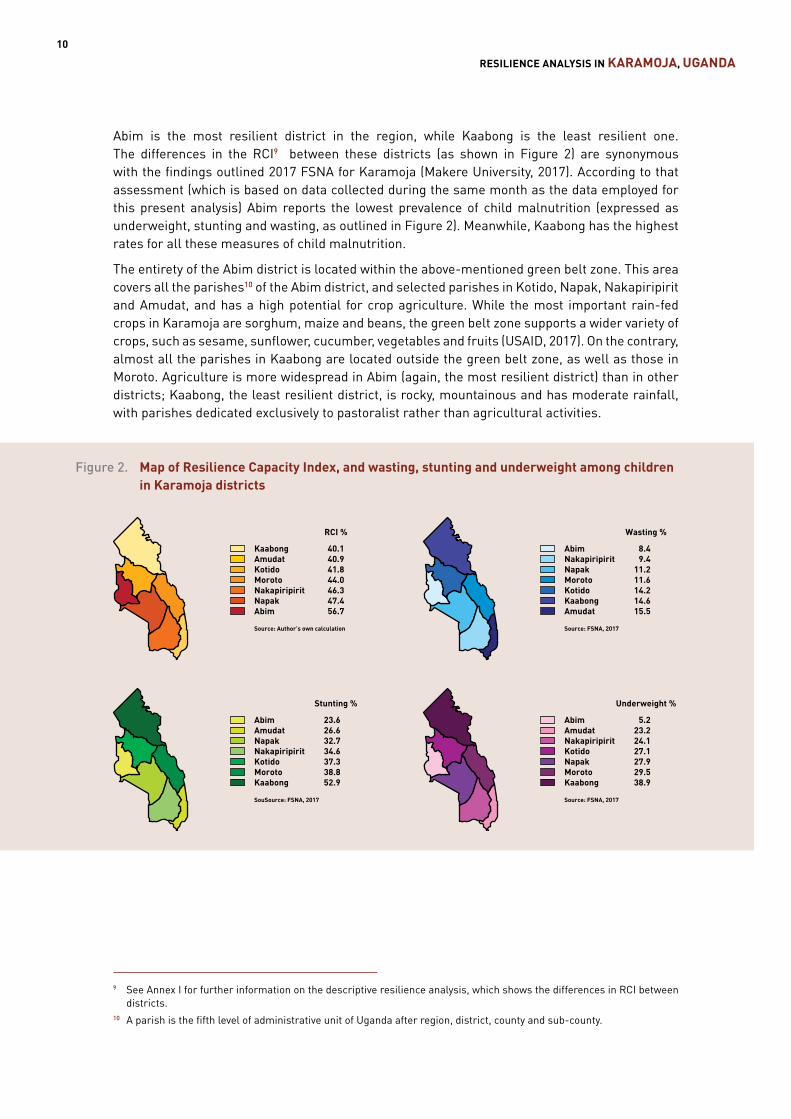
RESILIENCE ANALYSIS IN KARAMOJA, UGANDA10
Abim is the most resilient district in the region, while Kaabong is the least resilient one. The differences in the RCI9 between these districts (as shown in Figure 2) are synonymous with the findings outlined 2017 FSNA for Karamoja (Makere University, 2017). According to that assessment (which is based on data collected during the same month as the data employed for this present analysis) Abim reports the lowest prevalence of child malnutrition (expressed as underweight, stunting and wasting, as outlined in Figure 2). Meanwhile, Kaabong has the highest rates for all these measures of child malnutrition.
The entirety of the Abim district is located within the above-mentioned green belt zone. This area covers all the parishes10 of the Abim district, and selected parishes in Kotido, Napak, Nakapiripirit and Amudat, and has a high potential for crop agriculture. While the most important rain-fed crops in Karamoja are sorghum, maize and beans, the green belt zone supports a wider variety of crops, such as sesame, sunflower, cucumber, vegetables and fruits (USAID, 2017). On the contrary, almost all the parishes in Kaabong are located outside the green belt zone, as well as those in Moroto. Agriculture is more widespread in Abim (again, the most resilient district) than in other districts; Kaabong, the least resilient district, is rocky, mountainous and has moderate rainfall, with parishes dedicated exclusively to pastoralist rather than agricultural activities.
RCI %
Kaabong 40.1Amudat 40.9Kotido 41.8Moroto 44.0Nakapiripirit 46.3Napak 47.4Abim 56.7
Source: Author’s own calculation
Stunting %
Abim 23.6Amudat 26.6Napak 32.7Nakapiripirit 34.6Kotido 37.3Moroto 38.8Kaabong 52.9
SouSource: FSNA, 2017
Wasting %
Abim 8.4Nakapiripirit 9.4Napak 11.2Moroto 11.6Kotido 14.2Kaabong 14.6Amudat 15.5
Source: FSNA, 2017
Underweight %
Abim 5.2Amudat 23.2Nakapiripirit 24.1Kotido 27.1Napak 27.9Moroto 29.5Kaabong 38.9
Source: FSNA, 2017
Figure 2. Map of Resilience Capacity Index, and wasting, stunting and underweight among children in Karamoja districts
9 See Annex I for further information on the descriptive resilience analysis, which shows the differences in RCI between districts.
10 A parish is the fifth level of administrative unit of Uganda after region, district, county and sub-county.
11
Chapter 3 – Main findings; policy and programming implications
The main drivers of the differences in the RCI between the districts are highlighted by the Resilience Structure Matrix11 (RSM), which shows the correlation between the RCI and the four resilience pillars (see Figure A1) and the correlations between the pillars and the observed variables (see Figures A2 through A5).
The AC pillar is the most important pillar of resilience for Abim (see Figure A1), as well as for the Karamoja region in general. As the most resilient district, Abim performs the best in all the observed variables (number of cultivated crops, number of income-generating activities, education, share of active working age household members, and CSI) that constitute the most important pillar, AC. Specifically, crop diversification, income source diversification and education have a high relevance for determining the AC pillar for Abim (see Figure A5). The district reports the highest (mean) observed variables (see Table A12) for AC, especially for the number of cultivated crops. Additionally, looking at the three crops most cultivated in the region – beans, maize and sorghum – the number of households reporting crop failure after planting these in Abim is much lower than in Nakapriripirit and Napak (see Table A17).
Low crop diversity as well as a high rate of monocropping can threaten food access in the event of crop failure. Monocropping also eliminates the efficiency of water use otherwise associated with intercropping; exposes soil to erosion; limits the consumption of dietary plant protein as a result of soil erosion (which depletes crop nutrients); and thwarts soil fertility improvement. Furthermore, as recommended in the FSNA of 2017 (Makere University, 2017), the introduction of drought resistant varieties of staple food crops in the green belt zone could contribute to improving food availability. These implications of low crop diversity and monocropping mean that investments should be made into crop diversification in other districts outside of Abim – Amudat, Moroto, Nakapiripirit, and Napak – where some households rely on farming as part of their livelihood.
For the district with the second highest RCI, Napak, AC has a similar relevance in determining the RCI as it does in the case of Abim (see Figure A1). For Napak, income diversification, the share of household members of an active working age, and the CSI play an important role in enhancing the resilience capacity of households. On the contrary, education and crop diversification have a more marginal role (see Figure A5 and Table A12).
Among the medium-high resilient districts, Kotido and Moroto show a lower capacity to cope with food-related shocks (expressed by the CSI) and lower education; for Moroto, crop diversification also has limited relevance for the RCI, while Nakapiripirit shows poor income source diversification and poor crop diversification. Among the less resilient districts, Amudat and Kaabong, income diversification has low relevance in terms of resilience capacity. Crop diversification has low relevance for Amudat (see Figure A5 and Table A12).
11 The RSM elaborates the contributing factors for the RCI of the different districts. Further details on the RSM as part of the RIMA-II methodology are provided in Annex I.
Abim is the most resilient district in the region, while Kaabong is the least resilient one. The differences in the RCI9 between these districts (as shown in Figure 2) are synonymous with the findings outlined 2017 FSNA for Karamoja (Makere University, 2017). According to that assessment (which is based on data collected during the same month as the data employed for this present analysis) Abim reports the lowest prevalence of child malnutrition (expressed as underweight, stunting and wasting, as outlined in Figure 2). Meanwhile, Kaabong has the highest rates for all these measures of child malnutrition.
The entirety of the Abim district is located within the above-mentioned green belt zone. This area covers all the parishes10 of the Abim district, and selected parishes in Kotido, Napak, Nakapiripirit and Amudat, and has a high potential for crop agriculture. While the most important rain-fed crops in Karamoja are sorghum, maize and beans, the green belt zone supports a wider variety of crops, such as sesame, sunflower, cucumber, vegetables and fruits (USAID, 2017). On the contrary, almost all the parishes in Kaabong are located outside the green belt zone, as well as those in Moroto. Agriculture is more widespread in Abim (again, the most resilient district) than in other districts; Kaabong, the least resilient district, is rocky, mountainous and has moderate rainfall, with parishes dedicated exclusively to pastoralist rather than agricultural activities.
RCI %
Kaabong 40.1Amudat 40.9Kotido 41.8Moroto 44.0Nakapiripirit 46.3Napak 47.4Abim 56.7
Source: Author’s own calculation
Stunting %
Abim 23.6Amudat 26.6Napak 32.7Nakapiripirit 34.6Kotido 37.3Moroto 38.8Kaabong 52.9
SouSource: FSNA, 2017
Wasting %
Abim 8.4Nakapiripirit 9.4Napak 11.2Moroto 11.6Kotido 14.2Kaabong 14.6Amudat 15.5
Source: FSNA, 2017
Underweight %
Abim 5.2Amudat 23.2Nakapiripirit 24.1Kotido 27.1Napak 27.9Moroto 29.5Kaabong 38.9
Source: FSNA, 2017
Figure 2. Map of Resilience Capacity Index, and wasting, stunting and underweight among children in Karamoja districts
9 See Annex I for further information on the descriptive resilience analysis, which shows the differences in RCI between districts.
10 A parish is the fifth level of administrative unit of Uganda after region, district, county and sub-county.
RESILIENCE ANALYSIS IN KARAMOJA, UGANDA12
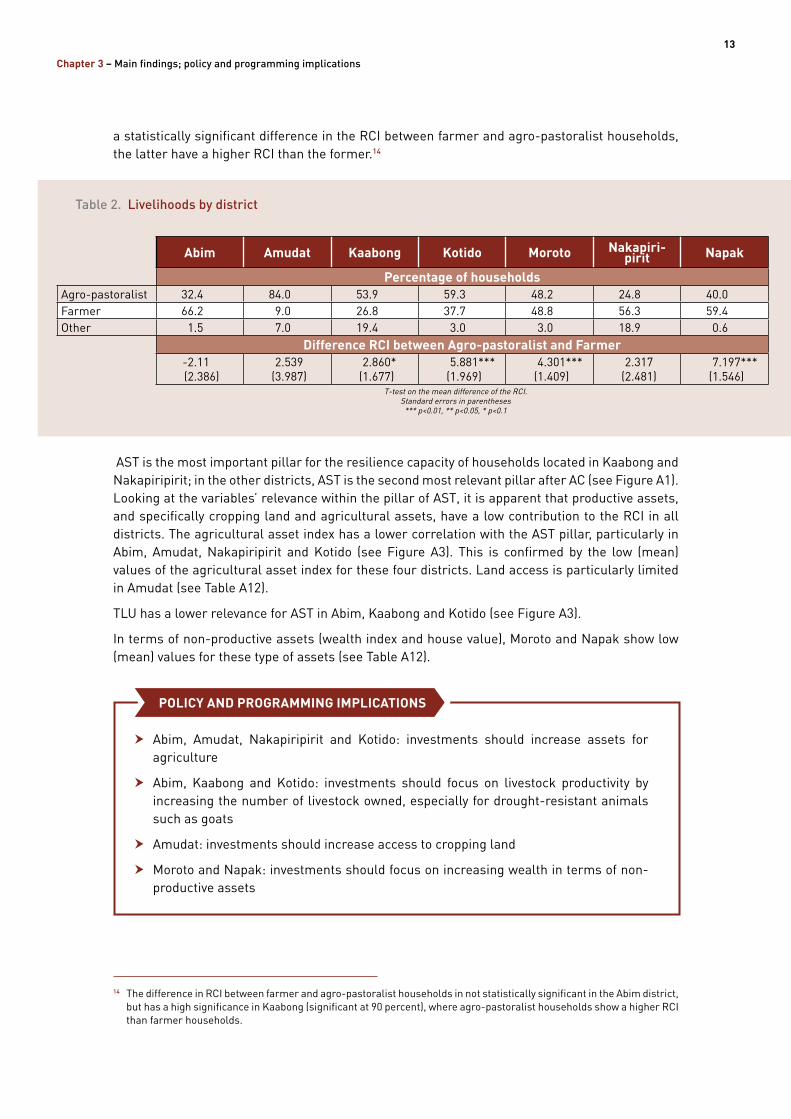
a statistically significant difference in the RCI between farmer and agro-pastoralist households, the latter have a higher RCI than the former.14
Table 2. Livelihoods by district
Abim Amudat Kaabong Kotido Moroto Nakapiri- pirit Napak
Percentage of householdsAgro-pastoralist 32.4 84.0 53.9 59.3 48.2 24.8 40.0Farmer 66.2 9.0 26.8 37.7 48.8 56.3 59.4Other 1.5 7.0 19.4 3.0 3.0 18.9 0.6
Difference RCI between Agro-pastoralist and Farmer-2.11(2.386)
2.539(3.987)
2.860*(1.677)
5.881***(1.969)
4.301***(1.409)
2.317(2.481)
7.197***(1.546)
T-test on the mean difference of the RCI.Standard errors in parentheses
*** p<0.01, ** p<0.05, * p<0.1
AST is the most important pillar for the resilience capacity of households located in Kaabong and Nakapiripirit; in the other districts, AST is the second most relevant pillar after AC (see Figure A1). Looking at the variables’ relevance within the pillar of AST, it is apparent that productive assets, and specifically cropping land and agricultural assets, have a low contribution to the RCI in all districts. The agricultural asset index has a lower correlation with the AST pillar, particularly in Abim, Amudat, Nakapiripirit and Kotido (see Figure A3). This is confirmed by the low (mean) values of the agricultural asset index for these four districts. Land access is particularly limited in Amudat (see Table A12).
TLU has a lower relevance for AST in Abim, Kaabong and Kotido (see Figure A3).
In terms of non-productive assets (wealth index and house value), Moroto and Napak show low (mean) values for these type of assets (see Table A12).
h Abim, Amudat, Nakapiripirit and Kotido: investments should increase assets for agriculture
h Abim, Kaabong and Kotido: investments should focus on livestock productivity by increasing the number of livestock owned, especially for drought-resistant animals such as goats
h Amudat: investments should increase access to cropping land
h Moroto and Napak: investments should focus on increasing wealth in terms of non-productive assets
POLICY AND PROGRAMMING IMPLICATIONS
14 The difference in RCI between farmer and agro-pastoralist households in not statistically significant in the Abim district, but has a high significance in Kaabong (significant at 90 percent), where agro-pastoralist households show a higher RCI than farmer households.
h Nakapiripirit, Amudat and Kaabong: investments should focus on boosting income diversification;
h Moroto, Amudat, Napak and Nakapiripirit: investments should focus on improving crop diversification;
h Napak, Kotido and Moroto: investments should focus on improving education;
h Kotido and Moroto: investments should focus on better management of the effects of shocks to food prices; and
h most districts: the potential of the labour force points to the need for focused investments in employment opportunities in the agricultural and other sectors.
POLICY AND PROGRAMMING IMPLICATIONS
MAIN FINDING 2
In all the districts, productive assets – reflected in the Asset pillar of resilience – make only a limited contribution to resilience capacity. This is particularly the case of agricultural assets in Abim, Amudat, Nakapiripirit and Kotido; access to arable land in Amudat; and Tropical Livestock Units (TLU) in Abim, Kaabong and Kotido.
In terms of non-productive assets (wealth index and house value), this type of asset does not make a relevant contribution to the resilience capacity for households located in Moroto and Napak.
The Karamoja Integrated Development Programme (KID) (2011-2015) and the Karamoja Action Plan for Food Security (KAPFS) (2009-2014) are already targeting investment in productive assets, which is positive in terms of the findings related to the AST pillar. In fact, these programmes support the increase of household income by boosting crop and livestock production and restoring degraded natural resources.
AST is the second most important pillar for Karamoja (see Table A3). Non-productive assets, expressed in the analysis by the wealth index12 as well as house value, can be considered a proxy of the affluence of the household. Additionally, non-productive assets may be of relevance in the case of asset-smoothing strategies; in the case of a shock, households are able to sell these in order to purchase food. TLU is a relevant asset for building resilience capacity, mainly for agro-pastoralist households, while cropping tools are only relevant for farming households.
Based on self-reported information,13 the majority (66 percent) of households located in Abim are classified as farmer households and the remaining 32 percent are agro-pastoralist. On the contrary, in Kaabong, the majority of households (54 percent) are agro-pastoralist, while farmer households make up only 26 percent of the sample (see Table 2). For the districts where there is
12 The wealth index is created through a list of variables that assumes value 1 or 0, depending on whether or not a household has specific non-productive assets, such as a television, radio, lamp, etc.
13 The household classification by livelihood is based on self-reported information. The frequency of the disaggregated answers is the following: Pastoralist – 82; Agro-Pastoralist – 1 050; Farmer – 1 069; Fishing – 1; Urban – 35; Entrepreneur – 46; Mixed – 89; Other – 8. The answers have been aggregated as follows: Agro-pastoralist (Pastoralist, Agro-Pastoralist); Farmer (Farmer); Other (Fishing, Urban, Entrepreneur, Mixed, Other).
13
Chapter 3 – Main findings; policy and programming implications
a statistically significant difference in the RCI between farmer and agro-pastoralist households, the latter have a higher RCI than the former.14
Table 2. Livelihoods by district
Abim Amudat Kaabong Kotido Moroto Nakapiri- pirit Napak
Percentage of householdsAgro-pastoralist 32.4 84.0 53.9 59.3 48.2 24.8 40.0Farmer 66.2 9.0 26.8 37.7 48.8 56.3 59.4Other 1.5 7.0 19.4 3.0 3.0 18.9 0.6
Difference RCI between Agro-pastoralist and Farmer-2.11(2.386)
2.539(3.987)
2.860*(1.677)
5.881***(1.969)
4.301***(1.409)
2.317(2.481)
7.197***(1.546)
T-test on the mean difference of the RCI.Standard errors in parentheses
*** p<0.01, ** p<0.05, * p<0.1
AST is the most important pillar for the resilience capacity of households located in Kaabong and Nakapiripirit; in the other districts, AST is the second most relevant pillar after AC (see Figure A1). Looking at the variables’ relevance within the pillar of AST, it is apparent that productive assets, and specifically cropping land and agricultural assets, have a low contribution to the RCI in all districts. The agricultural asset index has a lower correlation with the AST pillar, particularly in Abim, Amudat, Nakapiripirit and Kotido (see Figure A3). This is confirmed by the low (mean) values of the agricultural asset index for these four districts. Land access is particularly limited in Amudat (see Table A12).
TLU has a lower relevance for AST in Abim, Kaabong and Kotido (see Figure A3).
In terms of non-productive assets (wealth index and house value), Moroto and Napak show low (mean) values for these type of assets (see Table A12).
h Abim, Amudat, Nakapiripirit and Kotido: investments should increase assets for agriculture
h Abim, Kaabong and Kotido: investments should focus on livestock productivity by increasing the number of livestock owned, especially for drought-resistant animals such as goats
h Amudat: investments should increase access to cropping land
h Moroto and Napak: investments should focus on increasing wealth in terms of non-productive assets
POLICY AND PROGRAMMING IMPLICATIONS
14 The difference in RCI between farmer and agro-pastoralist households in not statistically significant in the Abim district, but has a high significance in Kaabong (significant at 90 percent), where agro-pastoralist households show a higher RCI than farmer households.
RESILIENCE ANALYSIS IN KARAMOJA, UGANDA14
MAIN FINDING 3
Access to basic services is the least important pillar in terms of its contribution to resilience capacity in the region.
Households located in Amudat report low closeness to main services (especially schools and hospitals), low stability of the main water source over the year, and low access to improved sanitation and water sources.
Low access to improved sanitation is also reported in Kotido, Moroto, Nakapiripirit and Napak.
In terms of closeness to main services, access to markets plays a marginal role in Abim, Moroto, Kotido, Nakapiripirit and Napak; access to hospitals also plays a limited role (with the exception of Abim, where hospitals are located closer to households).
According to the JRS Building Block 2 – “improve basic social services” – access to essential services such as water and sanitation are important in explaining household resilience capacity; the availability or non-availability of such services play a role in determining the risk level of households’ exposure to shocks and stressors. Despite recent improvements in rural infrastructure (roads, water and sanitation) in Uganda, one issue is the fact that public expenditure on water and sanitation does not adequately address water for agricultural production. Additionally, limited expenditure is dedicated to veterinary/inspection services that are relevant for pest and disease control (FAO, 2014). Among the broader programming context of the Enhancing Resilience in Karamoja Programme (ERKP), which aims to increase the resilience of communities to manage climate and extreme events, some of the activities involve cattle vaccination against epidemic diseases (for 800 000 cattle) and access to improved animal nutrition (for 6 000 pastoralists and agro-pastoralists).
ABS is the least important pillar in terms of its contribution to resilience capacity in the region. This is particularly the case for Kotido, Moroto, Abim, Amudat and Napak (see Figure A1).
Access to basic services is particularly critical in Amudat. Households located in Amudat report low closeness to all basic services (especially schools and hospitals), and low stability of water sources over the year (see Table A12). As confirmed by the 2017 FSNA (Makere University, 2017), Amudat lags behind the other districts in terms of safe water coverage because it has fewer boreholes compared to the other districts.
The majority of the households located in Amudat are involved in livestock activities, while only 9 percent are classified as farmers (see Table 2). This is confirmed by the highest value of TLU reported for households located in this district, out of all the districts (Table A12). In fact, Amudat is the district with the highest percentage (19 percent) of households owning cattle and reporting cattle deaths. The main causes of livestock mortality are pests and diseases, which implies the need to enhance animal health services via the government and local actors supporting livestock productivity. According to the shock frequency by district figures (see Table A14), the highest percentage of households recording pests, parasites and diseases is in Amudat. This is confirmed by USAID (2017), which states that in Amudat (and Nakapiripirit) lack of access to safe water is increasing the risk of infections and diseases.
In addition to Amudat, low access to improved sanitation also plays a role in Kotido, Moroto, Nakapiripirit and Napak (see Figure A2). In fact, in all districts, access to improved sanitation is low; only Abim and Kaabong record more than 30 percent of households with access to improved sanitation (see Table A12).
15
Chapter 3 – Main findings; policy and programming implications
In terms of closeness to main services, access to markets and to hospitals plays a marginal role in Moroto, Kotido, Nakapiripirit and Napak; in Abim, only access to hospitals plays a marginal role.
h Amudat: improving access to basic services is strongly encouraged, as well as improving mechanisms for preventing and coping with pests and diseases
h Kotido, Moroto, Nakapiripirit and Napak: investments in improved access to sanitation are recommended
h Abim, Moroto, Kotido, Nakapiripirit and Napak: investments to improve access to markets are recommended
h Moroto, Kotido, Nakapiripirit and Napak: investments to improve access to hospitals are recommended
POLICY AND PROGRAMMING IMPLICATIONS
MAIN FINDING 4
In all of Karamoja’s districts, monetary transfers received by households play only a marginal role in contributing to their resilience capacity.
For Amudat, this is particularly relevant for informal transfers (such as remittances, gifts, and financial help from family members) while for Abim, Kotido and Kaabong this is the case for formal transfers (such as scholarships, cash for work programmes, and benefits from schemes for elderly people).
For households located in Amudat, Moroto and Napak, credit contracted in the past has a low relevance for their resilience capacity.
For households located in Amudat, Moroto and Nakapiripirit, access to (current) credit is shown to have low relevance.
Building Block 3 of the JRS is “to establish predictable safety nets to address the most vulnerable people’s basic needs”. In addition to the role of transfers, the policy indications from the resilience analysis echo the objective of this JRS block, and underline the crucial role of savings groups. These groups can help to reduce the barriers households face when it comes to accessing productive services, and encourage more productive yet risk-taking activities.
SSN is the least relevant pillar in determining the resilience capacity of households in Karamoja. This is particularly the case in Amudat and Napak (see Figure A1). Looking at the contribution of the different variables within the pillar, received formal and informal transfers play only a marginal role in contributing to resilience capacity, as demonstrated by the low correlations of these two variables with the SSN pillar (see Figure A4). For Amudat, this is particularly relevant for informal transfers, while for Abim, Kotido and Kaabong this is the case for formal transfers. This is shown through the correlation between the observed variables and the SSN pillar according to district. The findings are supported by the differences in the (mean) values of the transfers received by each of the districts (see Table A12).
Additionally, among the different types of social safety nets, the level of actual credit is confirmed as a statistically significant determinant of food security indicators (see Table A11). Looking at
RESILIENCE ANALYSIS IN KARAMOJA, UGANDA16
the differences in the significance of access to credit, it emerges that – while credit contracted in the past has low relevance to the RCI for households located in Amudat, Moroto and Napak (see Figure A4) – households in Amudat, Moroto and Nakapiripirit have lower access to (current) credit compared to households in the rest of Karamoja (see Table A12).
h Amudat, Abim, Kotido and Kaabong: transfers and social safety nets in all districts of the region should be enhanced, but especially in these districts
h Amudat, Moroto, Napak and Nakapiripirit: access to credit should be increased
POLICY AND PROGRAMMING IMPLICATIONS
Regarding access to credit, it must be mentioned that Government of Uganda’s Expanding Social Protection Programme (ESP), which covered the period from 2009 to 2015, piloted a cash transfer system in four districts of Karamoja for senior citizens and vulnerable families. However, additional policy measures for improving access to credit for poor farmers are still necessary in the region (FAO, 2014).
MAIN FINDING 5
Female-headed households located in Kaabong, Kotido, Moroto, Nakapiripirit and Napak are less resilient than male-headed households.
Female-headed households report a lower amount of assets (both productive and non-productive) than male-headed households.
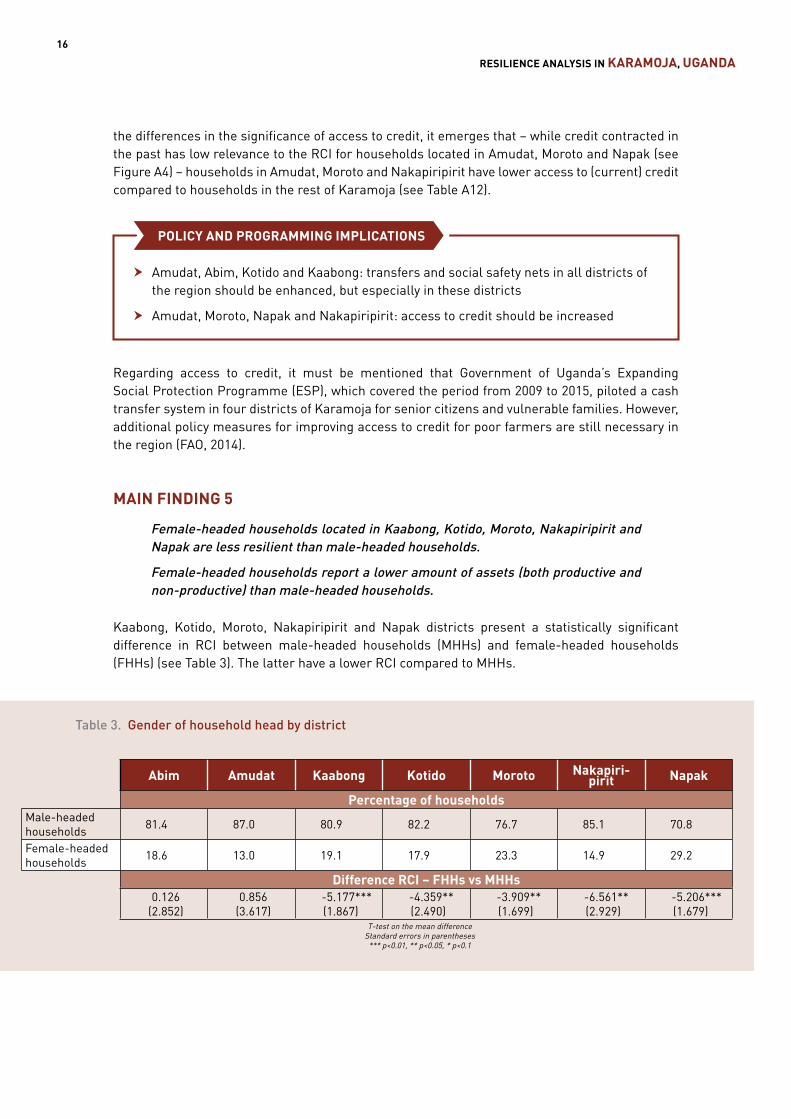
Kaabong, Kotido, Moroto, Nakapiripirit and Napak districts present a statistically significant difference in RCI between male-headed households (MHHs) and female-headed households (FHHs) (see Table 3). The latter have a lower RCI compared to MHHs.
Table 3. Gender of household head by district
Abim Amudat Kaabong Kotido Moroto Nakapiri- pirit Napak
Percentage of householdsMale-headed households 81.4 87.0 80.9 82.2 76.7 85.1 70.8
Female-headed households 18.6 13.0 19.1 17.9 23.3 14.9 29.2
Difference RCI – FHHs vs MHHs0.126
(2.852)0.856
(3.617)-5.177***(1.867)
-4.359**(2.490)
-3.909**(1.699)
-6.561**(2.929)
-5.206***(1.679)
T-test on the mean difference Standard errors in parentheses
*** p<0.01, ** p<0.05, * p<0.1
17
Chapter 3 – Main findings; policy and programming implications
Despite the fact that FHHs and MHHs present similar RSMs (see Figure A6), some differences in the observed variables across the two samples shed light on their differences in terms of RCI.
FHHs have a lower amount of assets (both productive and non-productive) compared to MHHs. In Kaabong, this is the case for wealth index, TLU, land and house value; in Kotido, for the agriculture asset index, TLU, land and house value; in Moroto, for the wealth index, TLU, land and house value; in Nakapiripirit, for the wealth index, agricultural asset index, TLU, land and house value; and in Napak, for the wealth index, agriculture asset index, TLU, land and house value (see Table A13).
h Kaabong, Kotido, Moroto, Nakapiripirit and Napak: FHHs in these districts are in particular need of support, such as with access to productive land to increase their agricultural productivity
h Across Karamoja: asset ownership should be increased for FHHs
POLICY AND PROGRAMMING IMPLICATIONS
Furthermore, there is the need to increase awareness and educate communities in Karamoja on the importance of gender roles. The society in the region is patriarchal, with males controlling household assets that are important for childcare and livelihoods. This might affect child malnutrition, given that the prevalence of child malnutrition is higher for FHHs (Makere University, 2017). This recommendation to focus on gender role education is aligned with the general findings in the 2017 FSNA for Karamoja (Makere University, 2017). The ERKP does involve treatments for pregnant and lactating women in order to reduce the level of child malnutrition in the region, however the results of this resilience analysis highlights the need to further such awareness raising programmes related to gender roles.
MAIN FINDING 6
Almost all households located in Karamoja report being affected by drought. To cope with drought, households adopt strategies with negative implications for food security and for income-generating activities in the long term.
Climatic conditions are relevant factors affecting both household resilience capacity as well as food security in the region.
Other shocks relevant in the region are high food prices, as well as pests, parasites and diseases.
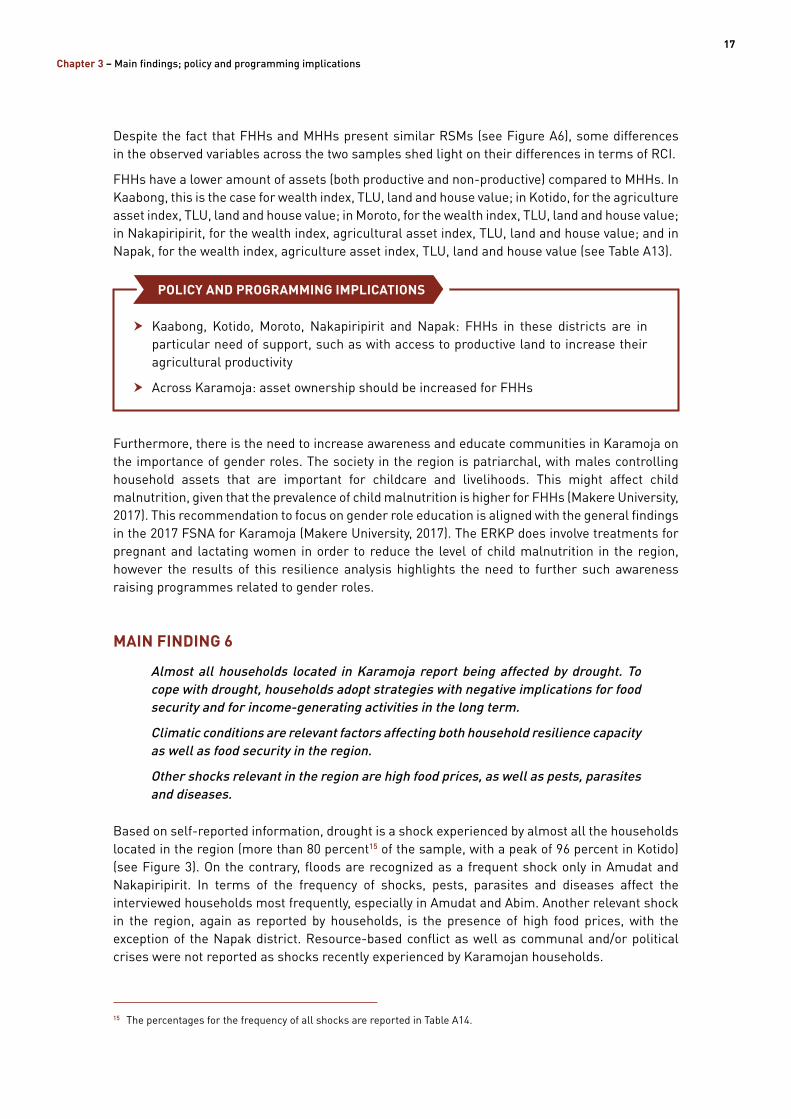
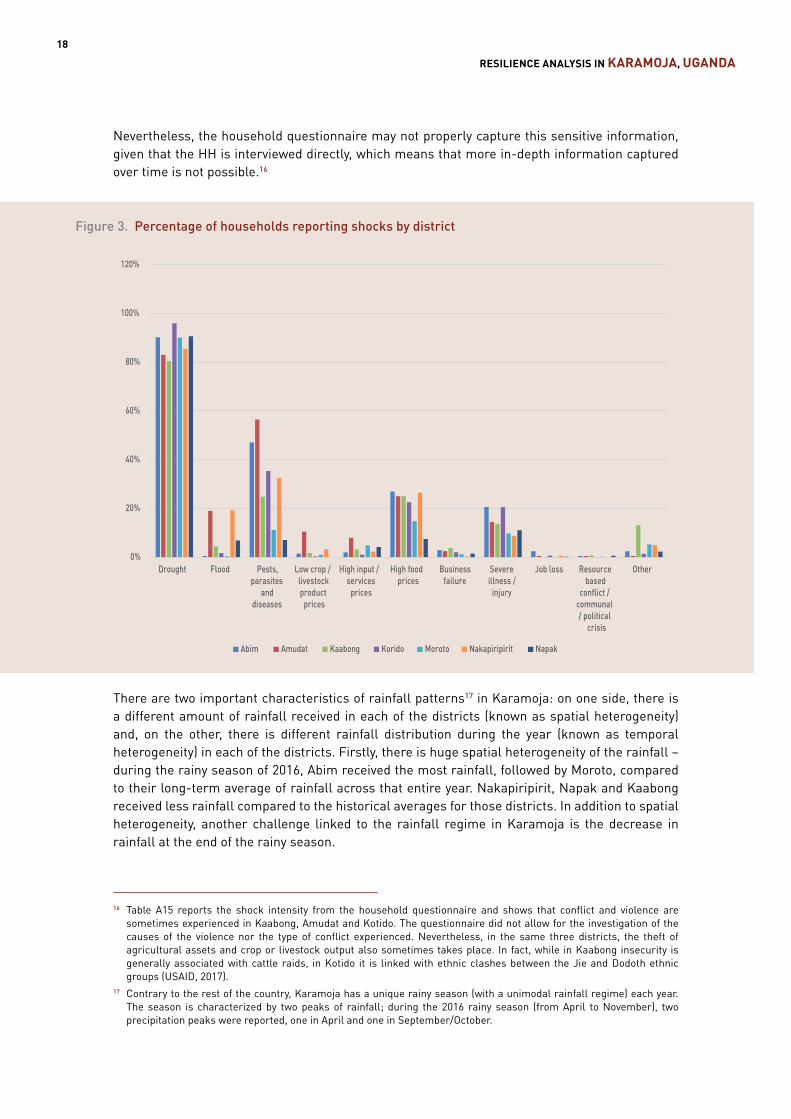
Based on self-reported information, drought is a shock experienced by almost all the households located in the region (more than 80 percent15 of the sample, with a peak of 96 percent in Kotido) (see Figure 3). On the contrary, floods are recognized as a frequent shock only in Amudat and Nakapiripirit. In terms of the frequency of shocks, pests, parasites and diseases affect the interviewed households most frequently, especially in Amudat and Abim. Another relevant shock in the region, again as reported by households, is the presence of high food prices, with the exception of the Napak district. Resource-based conflict as well as communal and/or political crises were not reported as shocks recently experienced by Karamojan households.
15 The percentages for the frequency of all shocks are reported in Table A14.
the differences in the significance of access to credit, it emerges that – while credit contracted in the past has low relevance to the RCI for households located in Amudat, Moroto and Napak (see Figure A4) – households in Amudat, Moroto and Nakapiripirit have lower access to (current) credit compared to households in the rest of Karamoja (see Table A12).
h Amudat, Abim, Kotido and Kaabong: transfers and social safety nets in all districts of the region should be enhanced, but especially in these districts
h Amudat, Moroto, Napak and Nakapiripirit: access to credit should be increased
POLICY AND PROGRAMMING IMPLICATIONS
Regarding access to credit, it must be mentioned that Government of Uganda’s Expanding Social Protection Programme (ESP), which covered the period from 2009 to 2015, piloted a cash transfer system in four districts of Karamoja for senior citizens and vulnerable families. However, additional policy measures for improving access to credit for poor farmers are still necessary in the region (FAO, 2014).
MAIN FINDING 5
Female-headed households located in Kaabong, Kotido, Moroto, Nakapiripirit and Napak are less resilient than male-headed households.
Female-headed households report a lower amount of assets (both productive and non-productive) than male-headed households.
Kaabong, Kotido, Moroto, Nakapiripirit and Napak districts present a statistically significant difference in RCI between male-headed households (MHHs) and female-headed households (FHHs) (see Table 3). The latter have a lower RCI compared to MHHs.
Table 3. Gender of household head by district
Abim Amudat Kaabong Kotido Moroto Nakapiri- pirit Napak
Percentage of householdsMale-headed households 81.4 87.0 80.9 82.2 76.7 85.1 70.8
Female-headed households 18.6 13.0 19.1 17.9 23.3 14.9 29.2
Difference RCI – FHHs vs MHHs0.126
(2.852)0.856
(3.617)-5.177***(1.867)
-4.359**(2.490)
-3.909**(1.699)
-6.561**(2.929)
-5.206***(1.679)
T-test on the mean difference Standard errors in parentheses
*** p<0.01, ** p<0.05, * p<0.1
RESILIENCE ANALYSIS IN KARAMOJA, UGANDA18
Nevertheless, the household questionnaire may not properly capture this sensitive information, given that the HH is interviewed directly, which means that more in-depth information captured over time is not possible.16
0%
20%
40%
60%
80%
100%
120%
Drought Flood Pests,parasites
anddiseases
Low crop /livestockproduct
prices
High input /services
prices
High foodprices
Businessfailure
Severeillness /
injury
Job loss Resourcebased
conflict /communal/ political
crisis
Other
Abim Amudat Kaabong Korido Moroto Nakapiripirit Napak
Figure 3. Percentage of households reporting shocks by district
There are two important characteristics of rainfall patterns17 in Karamoja: on one side, there is a different amount of rainfall received in each of the districts (known as spatial heterogeneity) and, on the other, there is different rainfall distribution during the year (known as temporal heterogeneity) in each of the districts. Firstly, there is huge spatial heterogeneity of the rainfall – during the rainy season of 2016, Abim received the most rainfall, followed by Moroto, compared to their long-term average of rainfall across that entire year. Nakapiripirit, Napak and Kaabong received less rainfall compared to the historical averages for those districts. In addition to spatial heterogeneity, another challenge linked to the rainfall regime in Karamoja is the decrease in rainfall at the end of the rainy season.
16 Table A15 reports the shock intensity from the household questionnaire and shows that conflict and violence are sometimes experienced in Kaabong, Amudat and Kotido. The questionnaire did not allow for the investigation of the causes of the violence nor the type of conflict experienced. Nevertheless, in the same three districts, the theft of agricultural assets and crop or livestock output also sometimes takes place. In fact, while in Kaabong insecurity is generally associated with cattle raids, in Kotido it is linked with ethnic clashes between the Jie and Dodoth ethnic groups (USAID, 2017).
17 Contrary to the rest of the country, Karamoja has a unique rainy season (with a unimodal rainfall regime) each year. The season is characterized by two peaks of rainfall; during the 2016 rainy season (from April to November), two precipitation peaks were reported, one in April and one in September/October.
19
Chapter 3 – Main findings; policy and programming implications
This phenomenon poses challenges to pasture and crop growing because it shortens the length of the potential crop growing period.
Climatic conditions (taking into account rainfall anomalies18 and self-reported drought) are relevant factors affecting both household resilience capacity and food security in the region (see Table A4). The greater amount of rainfall during the rainy season of 2016, compared to the long-run average, is positively associated with resilience capacity and food security indicators (both food consumption and Household Dietary Diversity Score (HDDS)). On the contrary, the shock of drought, which again is self-reported, has a negative effect.
In terms of district heterogeneity, the drought shock had a more significant negative effect on resilience capacity in Nakapiripirit, followed by Napak, Abim and Kaabong. On the contrary, the shock does not affect resilience capacity in Amudat, Kotido and Moroto (see Table A5). Interestingly, 45 percent of households experiencing drought in the last 12 months in Nakapiripirit did not use any coping strategies in response (as reported in Table A16, showing the percentage of households that adopted different coping strategies in response to drought). On the other hand, one common trend across all districts in the Karamoja region is that households reduce meal sizes and quality when coping with drought. Looking at each district, in Amudat households sell more animals than usual to cope with drought. In Kotido, the consumption of wild food and seeking relief assistance are the most frequently adopted strategies. On the other hand, in Moroto, the most frequent coping strategy is engagement in prohibited activities, such as the sale of charcoal or the illegal brewing of alcohol, in order to sell this for more income.
Therefore, drought has a negative effect on the RCI when the household is not adopting any type of coping strategy, or it results in the adoption of strategies with negative implications for household food security and diets (such as reduced meal size and quality, or the consumption of wild food) and for household income-generating activities, especially in the long term (such as the sale of livestock, illegal economic activities, and reliance on assistance). Thus, the strategies adopted to cope with drought in Karamoja can be classified as negative coping mechanisms (Pasteur, 2011). In fact, selling productive assets effectively impoverishes households, with negative consequences for their recovery in the long term; eating less or unpleasant food results in the weakening of the physical health of household members.
Finally, three indicators of subjective resilience with respect to drought are obtained from a module on subjective resilience19 based on the following questions:
1. “If a severe drought occurred tomorrow, my household would be well prepared in advance” – this question explores the household’s absorptive capacity;
2. “If a severe drought occurred tomorrow, my household could recover fully within six months” – this question explores the household’s recovery capacity;
3. “If severe droughts were to become more frequent and intense, my household would still find a way to get by” – this question explores the household’s adaptive capacity
18 Rainfall data used as part of FAO’s Global Information and Early Warning System (GIEWS) is collected from each country, at the district level; this data has been merged with the household level dataset in this analysis. The rainfall anomaly is measured as the difference between the rainfall of the 2016 rainy season (April-November) and the long-term average (1995-2016), by district.
19 The subjective resilience module has been developed by FAO’s Resilience Analysis and Policies (RAP) team in collaboration with the Overseas Development Institute (ODI) and is used to collect data on households’ perception of their own resilience. The possible answers to the questions used in this module are: 1 – strongly agree; 2 – agree; 3 – neither agree nor disagree; 4 – disagree; 5 – strongly disagree.
Nevertheless, the household questionnaire may not properly capture this sensitive information, given that the HH is interviewed directly, which means that more in-depth information captured over time is not possible.16
0%
20%
40%
60%
80%
100%
120%
Drought Flood Pests,parasites
anddiseases
Low crop /livestockproduct
prices
High input /services
prices
High foodprices
Businessfailure
Severeillness /
injury
Job loss Resourcebased
conflict /communal/ political
crisis
Other
Abim Amudat Kaabong Korido Moroto Nakapiripirit Napak
Figure 3. Percentage of households reporting shocks by district
There are two important characteristics of rainfall patterns17 in Karamoja: on one side, there is a different amount of rainfall received in each of the districts (known as spatial heterogeneity) and, on the other, there is different rainfall distribution during the year (known as temporal heterogeneity) in each of the districts. Firstly, there is huge spatial heterogeneity of the rainfall – during the rainy season of 2016, Abim received the most rainfall, followed by Moroto, compared to their long-term average of rainfall across that entire year. Nakapiripirit, Napak and Kaabong received less rainfall compared to the historical averages for those districts. In addition to spatial heterogeneity, another challenge linked to the rainfall regime in Karamoja is the decrease in rainfall at the end of the rainy season.
16 Table A15 reports the shock intensity from the household questionnaire and shows that conflict and violence are sometimes experienced in Kaabong, Amudat and Kotido. The questionnaire did not allow for the investigation of the causes of the violence nor the type of conflict experienced. Nevertheless, in the same three districts, the theft of agricultural assets and crop or livestock output also sometimes takes place. In fact, while in Kaabong insecurity is generally associated with cattle raids, in Kotido it is linked with ethnic clashes between the Jie and Dodoth ethnic groups (USAID, 2017).
17 Contrary to the rest of the country, Karamoja has a unique rainy season (with a unimodal rainfall regime) each year. The season is characterized by two peaks of rainfall; during the 2016 rainy season (from April to November), two precipitation peaks were reported, one in April and one in September/October.
RESILIENCE ANALYSIS IN KARAMOJA, UGANDA20
© W
FP \ R
icca
rdo
Gan
gale
Lower values for the three indicators express that the household perceives that it has a higher level of absorptive, recovery or adaptive capacity, respectively. A descriptive analysis of the indicators shows that lower values of the mean RCI correspond to lower (namely scoring 4 or 5) perceived absorptive, recovery or adaptive capacity using these indicators on subjective resilience (see Table A18). In other words, households with a low RCI also self-report low subjective resilience using these indicators (absorptive, recovery and adaptive capacities) of resilience to drought.
In addition to drought, both high food prices and pests, parasites and diseases are shocks frequently experienced in the region. The presence of high food prices mainly influences household food consumption, and to a limited extent, the RCI (shown in Table A4). The counterintuitive positive association between high food prices and RCI is likely to be driven by a positive effect of high food prices on the purchase component of total food consumption (shown in Table A6) – an increase in food prices is expected to push net-buyer households to increase their expenditure on food items. That is, if a household experiences the shock of high food prices, the RCI of the household increases; the RCI also increases when food consumption increases, which occurs when food expenditure increases.
Pests, parasites and diseases are found to influence the RCI as well as the food security indicators (shown in Table A4). There is a positive association between the occurrence of pests, parasites and diseases as a shock and the RCI, given that this increases the figures for the variables that comprise certain pillars – for ABS, this impacts on access to toilets, water availability and closeness to livestock market (see Table A7); for AST, on TLU and land for cropping (see Table A8); for AC, on income diversification and crop diversification (see Table A10); and for SSN on credit (see Table A9). Due to the fact that the effect of this shock is spread over all the pillars of resilience, it is not easy disentangle the pure effect of the shock from the effect of the household’s adoption of coping strategies to deal with that shock. These features cannot be properly captured by the RIMA-II methodology since it considers stock indicators rather than flow indicators.
h In all districts, community-based natural resource management should be strengthened through awareness-raising and capacity-building initiatives
h Social protection systems should be programmed for households located in the districts most affected by climatic shocks in order to avoid the adoption of negative coping strategies (especially in Amudat, Kotido and Moroto)
h Mechanisms for stabilizing food prices should be enhanced, using a district-specific approach
h Investments in prevention mechanisms to avoid the diffusion of pests, parasites and diseases should be increased, while social protection mechanisms to deal with the occurrence of such shocks should be enhanced
POLICY AND PROGRAMMING IMPLICATIONS
© W
FP \ R
icca
rdo
Gan
gale
© F
AO \ S
ylva
in C
herk
aoui
© W
FP \ R
icca
rdo
Gan
gale
23
4 METHODOLOGY AND COVERAGEThis section introduces the FAO RIMA-II approach employed for estimating household resilience capacity. This section also describes the dataset employed in the resilience analysis, based on an ad hoc data collection carried out in the Karamoja region during 2016, and provides details on secondary data sources employed in the analysis. Some data limitations are also introduced.
The definition of resilience adopted for this report is: “the capacity that ensures stressors and shocks do not have long-lasting development consequences” (RM-TWG, 2014). Building on this definition, resilience capacity is estimated through the FAO RIMA-II approach (FAO, 2016). The RIMA-II methodology employs both latent variable statistical techniques – for estimating the RCI and the four resilience pillars of ABS, AST, SSN and AC at the household level – and regression models. Annex I provides further detail on the RIMA-II methodology.
This resilience analysis covers all the seven districts of the Karamoja region. The data employed for the RIMA-II analysis was obtained from an ad hoc data collection carried out in the Karamoja region by FAO, WFP, UNICEF, OPM and UBOS during November and December 2016. The main dataset employed in the resilience analysis comes from a household survey20 that comprised part of this data collection. A separate community survey, implemented by the same partners, complements the household survey.
The purpose of the household survey is twofold: to understand the resilience capacity of communities in Karamoja, and to determine the baseline values of key resilience indicators in order to conduct an impact evaluation after another round of data collection will take place in future. In fact, a follow-up survey will take place once the JRS has been fully implemented (it is scheduled to take place from 2016 to 2020). The collection of the additional round of data will result in a panel dataset.
20 The definition of ‘household’, as defined by the FAO RAP team, which conducted both the household survey and the resilience analysis, is the following: “a household is formed by all the people living in the same hut or home, related or not by blood lines (family) and sharing food, food expenses, income and other household assets for at least 6 of the 12 months preceding the interview. Therefore, the membership of the household is defined on the basis of the usual place of residence”.
© W
FP \ R
icca
rdo
Gan
gale
RESILIENCE ANALYSIS IN KARAMOJA, UGANDA24
The sample of the household survey is composed in total of 2 380 households. The sampling strategy is stratified according to the following five strata: (1) target households, which are those reached by the JRS in 12 parishes of the Moroto and Napak districts; (2) direct spillover households, which are those located in the remaining parishes of the Moroto and Napak districts and are not involved in the JRS; (3) indirect spillover households, which are those located in the two districts where the JRS is not actually operating (Kotido and Nakapiripirit) but where other UN projects are ongoing; (4) the ‘different ethnicity’ group, which includes those households located in two districts (Abim and Amudat) populated with ethnic groups that are different from the Karamojong;21 (5) and the pure control group, comprised of households located in the Kaabong district, which have the same ethnic group and socioeconomic conditions, mostly pastoralism, as the target group, but which are not involved in the JRS.
The household questionnaire used to carry out the household survey was developed by FAO in collaboration with UBOS, UNICEF and WFP. The questionnaire was piloted in Moroto in November 2016, for which specific training was carried out for the enumerators responsible for interviewing the households. The household questionnaire is comprised of thematic sections. Specifically, it collected detailed information on household characteristics, including food and non-food consumption, shocks, perceived resilience capacity, coping strategies, and so on. Additionally, the data on labour, education and use of time were collected at the individual level. Therefore, an extensive amount of information on household characteristics was collected. The variables used for the pillars of resilience in this analysis derive from the survey data – Table A2 lists all the variables included in the estimation of the RCI.
The data collection was achieved by employing Computer Assisted Personal Interviewing (CAPI) technologies, using digital tablets for conducting the interviews. These technologies present many advantages compared to the traditional paper questionnaire: they reduce the duration of the interview; limit errors during both the interview and data entry phases; and allow for collecting Geographic Information System (GIS) information at the household level.
The main limitation of the household survey is its cross-sectional dimension – that is, that the interviews relate to one moment in time – but this will be addressed by the fact that the second round of data will be collected in future in order to create the above-mentioned panel dataset. A second limitation of the data is that there was a lack of information collected on the quantities of food items consumed in the consumption module of the household survey. This means that the estimation of food security indicators based on caloric intake was not possible in this analysis.
Additionally, child malnutrition indicators, based on anthropometric measures, were unfortunately not collected in the household survey; however, the information is available in the 2017 FSNA for Karamoja (Makere University, 2017). Additional data sources have been employed in the causal part of this analysis, including the above-mentioned FAO-GIEWS dataset for rainfall data at the district level.
In addition to the household survey, a community survey was collected by FAO during November and December 2016 in 24 communities in all the seven districts of Karamoja. The survey includes both qualitative and quantitative components, and used focus group discussions to collect data.
21 The Karamojong is a generic term for the Nilotic people of the Karamoja region. The Karamojong cluster includes Dodoth, Jie and Karimojong people (Gradé, Tabuti and Van Damme, 2009). These three groups speak closely related languages and dialects. On the other hand, the ethnic groups living in Abim and Amudat districts are mainly Labwor and Pokot, which do not belong to the Karamojong cluster (OCHA, 2006). The inclusion of the ‘different ethnicity group’ in this analysis is due to the fact that households with members from different ethnic groups can have different characteristics and may be targeted by different projects and programming. Thus the inclusion of this group creates a dataset that is representative of the region at the district level.
25
Chapter 4 – Methodology and coverage
The main topics covered by the community questionnaire are service and infrastructure availability, shocks and coping strategies, international assistance and the enabling institutional environment. The main scope of the community survey allows for the understanding of (i) how the different livelihoods of the region (pastoralist, agro-pastoralist and farmer) inter-relate to one other across the climatic zones of the region; and (ii) the nature of cross-border dynamics (related to, for example, migration, conflict and service provision), mostly between Uganda and Kenya.
© F
AO \ S
ylva
in C
herk
aoui
© W
FP \ R
icca
rdo
Gan
gale
27
5 NEXT STEPSThis section provides criteria for prioritizing the above-mentioned recommendations (with specific reference to responsible units/agencies, including FAO) resulting from consultation with key stakeholders. This explores the needs and time frame for action plans, further consultation, development of monitoring and evaluation mechanisms, and the next RIMA-II analysis.
The findings of this analysis have provided an overview of the factors affecting household resilience capacity for avoiding food insecurity in Karamoja, with specific details for each of the region’s different districts. It is crucial to note that, based on the findings presented here, the recommended actions are to be taken up by FAO, WFP and UNICEF under the JRS, as well as by any different actors whose mandate is to support interventions related to these recommendations, together with the Government of Uganda.
The main programming recommendations included in this analysis are:
h AC is the pillar that significantly contributes to the resilience of households. Therefore, related programming should be prioritized through:
h Programmes by FAO, the MAAIF and partners providing support for enhancing crop productivity and diversification among farmer and agro-pastoralist communities in Abim, Moroto, Amudat, Napak and Nakapiripirit
h Actors implementing livelihood programmes with income diversification activities linked to the different livelihoods found in the districts of Nakapiripirit, Amudat, and Kaabong; namely, enhancing crop and livestock value chains is key
h Actors supporting the education sector in line with the national education policy for Uganda, with a focus on improving education levels in the Kotido, Napak and Moroto districts
h In terms of building the asset base of households in Karamoja, FAO and partners together with the Government of Uganda should support farmer and to some extent agro-pastoralist livelihoods by focusing on crop productivity through access to arable land for crop production. This is key for households within the green belt zone, especially FHHs. For pastoralist and agro-pastoralist livelihoods, programmes should support the increase of livestock ownership and livestock production assets. Another objective
© W
FP \ R
icca
rdo
Gan
gale
RESILIENCE ANALYSIS IN KARAMOJA, UGANDA28
should be increasing non-productive asset bases, especially for households in Moroto and Napak and for FHHs that could be liquidated quickly when households need to cope with hardships and be able to maintain their food security status.
h The main focus for bettering access to basic social services for households should be through ongoing water, sanitation and health improvement programmes, and access to water for production activities, across the districts by FAO, UNICEF, WFP and partners, in collaboration with the Government of Uganda. Efforts by the government to improve access to markets would also lead to an increase in agricultural productivity in Karamoja.
h Offering continuous support to households with programmes targeting access to transfers and social safety net mechanisms is also relevant. WFP activities related to cash or food for work programmes are still crucial for communities in Karamoja. In addition, activities to support rural microfinance or credit facilities are also linked to increases in livelihood productivity.
h FAO together with government and other actors should prioritize the sustainable support of early warning mechanisms (including sustainable disease control) for recurring exogenous shocks, as well as the provision of timely information for households in Karamoja to assist in disaster preparation and mitigation.
It is also recommended that the monitoring of the prioritized interventions is required as part of measuring the resilience capacity of households over time, in order to track the results of such programmes’ implementation.
In line with the next steps highlighted above, the RMU within the OPM – made up of representatives from the OPM, Intergovernmental Authority on Development (IGAD), UBOS, FAO, WFP and UNICEF – has also proposed some plans to be undertaken for aligning any resilience-building programming with the resilience findings outlined. The RMU’s plans are as follows:
h Engage with Karamoja development actors to highlight the findings and prioritized recommendations from the present analysis.
h The OPM is to call a national workshop with relevant stakeholders and policy makers. This will be to present the Karamoja resilience findings and hold policy and programming discussions, and to examine the prioritized action plan for resilience building activities. This would include outlining action plans for the RMU to follow up on the roll-out of RIMA-II to other areas of Uganda, taking into consideration emerging risks e.g. resilience analysis in the context of refugees from other countries living in Uganda (in other districts rather than Karamoja).
h Engage with the IGAD Drought Disaster Resilience Sustainability Initiative (IDDRSI) technical working group regarding building capacity for analytical work on resilience.
29
REFERENCES
FAO. 2014. Analysis of public expenditure in support of food and agriculture in Uganda, 2006/07–2012/13. Technical notes series, MAFAP, by Shinyekwa, I., Katunze, M. and Ahmed, M. Rome. 42 pp.
FAO. 2016. RIMA-II: Resilience Index Measurement and Analysis II. Rome. 80 pp. Available at www.fao.org/3/a-i5665e.pdf
Makere University. 2017. Food security and nutrition assessment for Karamoja region. School of Public Health of Kampala (unpublished).
Ministry of Finance, Planning and Economic Development – the Republic of Uganda. 2013. Millennium Development Goals Report for Uganda 2013. Uganda. Available at www.ug.undp.org/content/uganda/en/home/library/human_development/UgandaMDGProgressReport2013.html
Pasteur, K. 2011. From Vulnerability to Resilience, a framework for analysis and action to build community resilience. United Kingdom, Practical Action Publishing.
RM-TWG. 2014. Resilience Measurement Principles – Toward an agenda for measurement design. Food Security Information Network Technical Working Series No. 1. Available at www.fsincop.net/fileadmin/user_upload/fsin/docs/resources/FSIN_29jan_WEB_medium%20res.pdf
Saferworld. 2010. Karamoja conflict and security assessment. London. Available at https://www.files.ethz.ch/isn/122923/2010_09_Karamoja%20conflict%20and%20security%20assessment.pdf
Swindale, A. & Bilinsky, P. 2006. Household Dietary Diversity Score (HDDS) for Measurement of Household Food Access: Indicator Guide – Version 2. Washington, D.C., FHI 360/FANTA. Available at https://www.fantaproject.org/sites/default/files/resources/HDDS_v2_Sep06_0.pdf
UBOS. 2014. Uganda National Household Survey 2012/2013. Kampala, Uganda. Available at www.ubos.org/onlinefiles/uploads/ubos/UNHS_12_13/2012_13%20UNHS%20Final%20Report.pdf
UBOS & ICF International Inc. 2012. Uganda Demographic and Health Survey 2011. Kampala, Uganda. Available at www.ubos.org/onlinefiles/uploads/ubos/UDHS/UDHS2011.pdf
UBOS & ICF International Inc. 2017. Uganda Demographic and Health Survey 2016: Key Indicators Report. Kampala, Uganda. Available at https://dhsprogram.com/pubs/pdf/PR80/PR80.pdf

RESILIENCE ANALYSIS IN KARAMOJA, UGANDA30
USAID. 2005. Conflict Baseline Study Report Conducted in the Karamajong Cluster of Kenya and Uganda [online]. Washington, D.C.. Available at www.fao.org/fileadmin/user_upload/drought/docs/Karamoja%20Conflict%20Study%202005.pdf
USAID. 2017. Climate Risks in Food for Peace Geographies: Karamoja Region, Uganda. In: Climate Links . Available at https://www.climatelinks.org/resources/climate-change-risk-profile-climate-risk-screening-food-security-karamoja-region-uganda
All links were checked on 30 November 2017.
31
ANNEX IRESILIENCE MEASUREMENT
DESCRIPTIVE RESILIENCE ANALYSIS Following the RIMA-II approach (FAO, 2016), the estimation of the RCI is based on a two-stage procedure.
1. First, the resilience pillars are estimated from observed variables through Factor Analysis (FA).
2. Second, the RCI is estimated from the pillars, taking into account the indicators of food security using the Multiple Indicators Multiple Causes (MIMIC) model. The food security indicators are considered outcomes of resilience.
The definitions of each pillar of resilience and the related variables are reported below in Table A1 and A2. The choice of the pillars employed in this particular analysis is based on consultations with UBOS and other local experts, literature review and previous analyses (FAO, 2016).
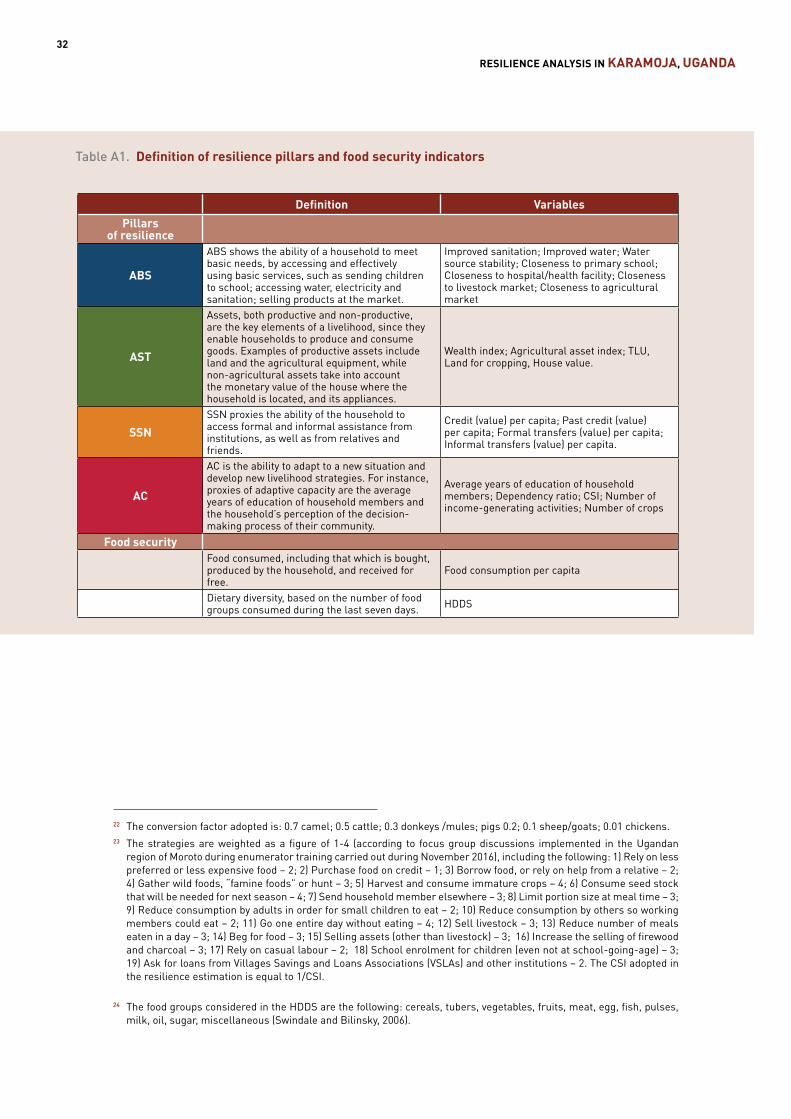
RESILIENCE ANALYSIS IN KARAMOJA, UGANDA32
Table A2. Variables emloyed in the RIMA-II model
Pillar Variable Definition
ABS
Improved sanitation Variable indicating access to improved toilet facility (covered pit latrine private, private ventilated improved pit latrine, and private flush toilet).
Improved waterVariable indicating access to an improved water source (piped dwelling, piped public tap, protected shallow well, borehole, protected spring, roof rain water).
Water source stability Number of months in a year during which water is available from primary source.
Closeness to primary school
Index of closeness to primary school. The index ranges between 0 (no access) and 1 (minimum distance in kilometres).
Closeness to hospital Index of closeness to hospital/health facility. The index ranges between 0 (no access) and 1 (minimum distance in kilometres).
Closeness to livestock market
Index of closeness to livestock market. The index ranges between 0 (no access) and 1 (minimum distance in kilometres).
Closeness to agricultural market
Index of closeness to agricultural market. The index ranges between 0 (no access) and 1 (minimum distance in kilometres).
AST
Wealth index
The wealth index is created through FA. A list of variables assumes a value of 1 or 0 is used, depending on whether or not a household has specific non-productive assets, such as a radio, lamp, mobile, bicycle, table, chairs, bed, hand mill, mattress, solar panel, water tank or jerry cans.
Agricultural asset index
The agricultural asset index is created through FA. A list of variables assumes a value of 1 or 0 is used, depending on whether or not a household has specific productive assets, such as an axe, plough, hoe, sickle, rake, cart, ox plough and other assets.
TLU per capita TLU standardizes different types of livestock into a single unit of measurement.22
Land per capita Total area employed for crop production.House value Monetary value (USD) of the house where the household is located.
SSN
Credit (value) per capita Total amount (USD) of loans received in the last 12 months. Past credit (value) per capita Total amount (USD) of loans contracted before the last 12 months.
Formal transfers (value) per capita
Total amount (USD) of formal transfers received in the last 12 months. They include cash for work programmes, food for work programmes carried out by non-governmental organizations (NGOs), benefits from elderly people schemes, Social Action Grant funds, scholarships, and social action for elderly programmes.
Informal transfers (value) per capita
Total amount (USD) of informal transfers received in the last 12 months. They include help from family members and in-laws, remittances, gifts and borrowing from friends and relatives.
AC
Average years of education Average years of education of household members.
Share of active members The dependency ratio is the share of household members actively employed (>15 and <64 years old) over the household size.
CSI The CSI is a weighted sum of the number of days the household adopted different strategies23 to cope with food shortage in the past week.
Number of income-generating activities
Sum of the different sources of income for the household. A list of variables assumes a value of 1 or 0 is used, depending on whether or not a household has been involved in farming activity; wage employment; sale of livestock, or their products; non-farm enterprise; a household has received transfers; rent, the sale of assets or other income sources.
Number of crops Sum of the different crops cultivated by the household during the last season.
Food Security
Food consumption per capita
Monetary value (USD) of per capita food consumption, including bought, auto-produced, received for free (as gifts or part of a conditional project) and stored food of the last year.
HDDS Number of food groups consumed by the household during the previous seven days.24
Table A1. Definition of resilience pillars and food security indicators
Definition VariablesPillars
of resilience
ABS
ABS shows the ability of a household to meet basic needs, by accessing and effectively using basic services, such as sending children to school; accessing water, electricity and sanitation; selling products at the market.
Improved sanitation; Improved water; Water source stability; Closeness to primary school; Closeness to hospital/health facility; Closeness to livestock market; Closeness to agricultural market
AST
Assets, both productive and non-productive, are the key elements of a livelihood, since they enable households to produce and consume goods. Examples of productive assets include land and the agricultural equipment, while non-agricultural assets take into account the monetary value of the house where the household is located, and its appliances.
Wealth index; Agricultural asset index; TLU, Land for cropping, House value.
SSNSSN proxies the ability of the household to access formal and informal assistance from institutions, as well as from relatives and friends.
Credit (value) per capita; Past credit (value) per capita; Formal transfers (value) per capita; Informal transfers (value) per capita.
AC
AC is the ability to adapt to a new situation and develop new livelihood strategies. For instance, proxies of adaptive capacity are the average years of education of household members and the household’s perception of the decision-making process of their community.
Average years of education of household members; Dependency ratio; CSI; Number of income-generating activities; Number of crops
Food securityFood consumed, including that which is bought, produced by the household, and received for free.
Food consumption per capita
Dietary diversity, based on the number of food groups consumed during the last seven days. HDDS
22 The conversion factor adopted is: 0.7 camel; 0.5 cattle; 0.3 donkeys /mules; pigs 0.2; 0.1 sheep/goats; 0.01 chickens.23 The strategies are weighted as a figure of 1-4 (according to focus group discussions implemented in the Ugandan
region of Moroto during enumerator training carried out during November 2016), including the following: 1) Rely on less preferred or less expensive food – 2; 2) Purchase food on credit – 1; 3) Borrow food, or rely on help from a relative – 2; 4) Gather wild foods, “famine foods” or hunt – 3; 5) Harvest and consume immature crops – 4; 6) Consume seed stock that will be needed for next season – 4; 7) Send household member elsewhere – 3; 8) Limit portion size at meal time – 3; 9) Reduce consumption by adults in order for small children to eat – 2; 10) Reduce consumption by others so working members could eat – 2; 11) Go one entire day without eating – 4; 12) Sell livestock – 3; 13) Reduce number of meals eaten in a day – 3; 14) Beg for food – 3; 15) Selling assets (other than livestock) – 3; 16) Increase the selling of firewood and charcoal – 3; 17) Rely on casual labour – 2; 18) School enrolment for children (even not at school-going-age) – 3; 19) Ask for loans from Villages Savings and Loans Associations (VSLAs) and other institutions – 2. The CSI adopted in the resilience estimation is equal to 1/CSI.
24 The food groups considered in the HDDS are the following: cereals, tubers, vegetables, fruits, meat, egg, fish, pulses, milk, oil, sugar, miscellaneous (Swindale and Bilinsky, 2006).
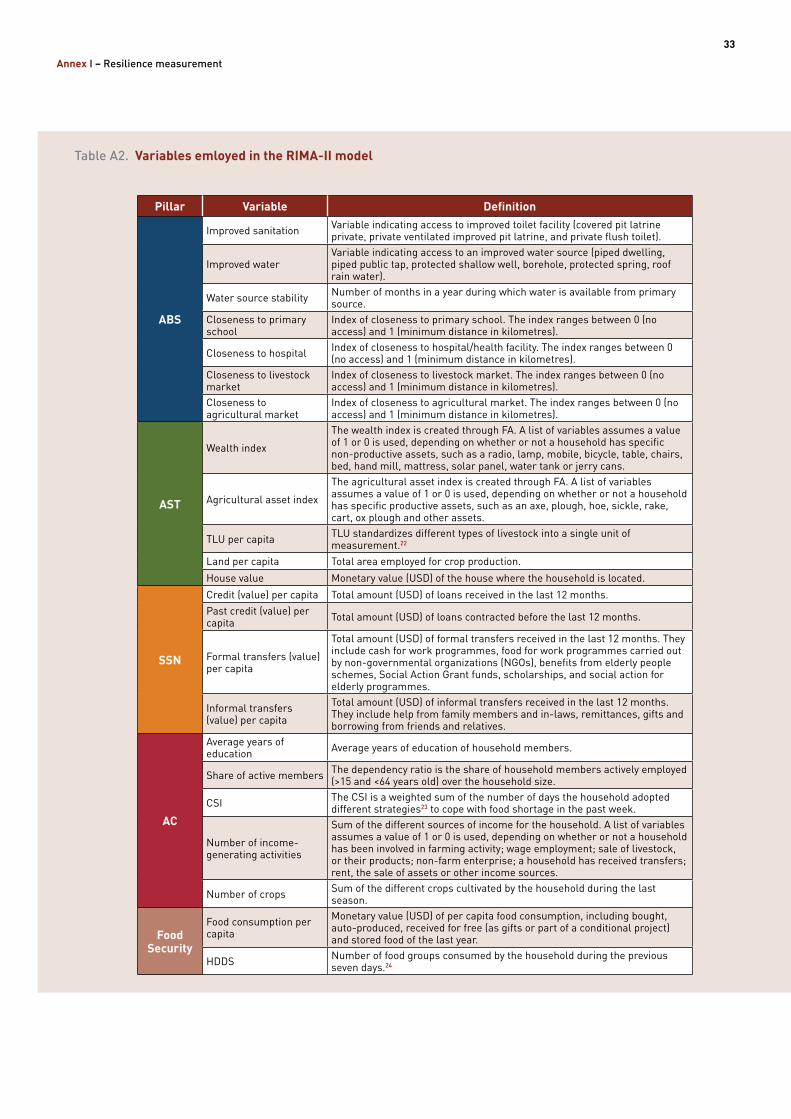
33
Annex I – Resilience measurement
Table A2. Variables emloyed in the RIMA-II model
Pillar Variable Definition
ABS
Improved sanitation Variable indicating access to improved toilet facility (covered pit latrine private, private ventilated improved pit latrine, and private flush toilet).
Improved waterVariable indicating access to an improved water source (piped dwelling, piped public tap, protected shallow well, borehole, protected spring, roof rain water).
Water source stability Number of months in a year during which water is available from primary source.
Closeness to primary school
Index of closeness to primary school. The index ranges between 0 (no access) and 1 (minimum distance in kilometres).
Closeness to hospital Index of closeness to hospital/health facility. The index ranges between 0 (no access) and 1 (minimum distance in kilometres).
Closeness to livestock market
Index of closeness to livestock market. The index ranges between 0 (no access) and 1 (minimum distance in kilometres).
Closeness to agricultural market
Index of closeness to agricultural market. The index ranges between 0 (no access) and 1 (minimum distance in kilometres).
AST
Wealth index
The wealth index is created through FA. A list of variables assumes a value of 1 or 0 is used, depending on whether or not a household has specific non-productive assets, such as a radio, lamp, mobile, bicycle, table, chairs, bed, hand mill, mattress, solar panel, water tank or jerry cans.
Agricultural asset index
The agricultural asset index is created through FA. A list of variables assumes a value of 1 or 0 is used, depending on whether or not a household has specific productive assets, such as an axe, plough, hoe, sickle, rake, cart, ox plough and other assets.
TLU per capita TLU standardizes different types of livestock into a single unit of measurement.22
Land per capita Total area employed for crop production.House value Monetary value (USD) of the house where the household is located.
SSN
Credit (value) per capita Total amount (USD) of loans received in the last 12 months. Past credit (value) per capita Total amount (USD) of loans contracted before the last 12 months.
Formal transfers (value) per capita
Total amount (USD) of formal transfers received in the last 12 months. They include cash for work programmes, food for work programmes carried out by non-governmental organizations (NGOs), benefits from elderly people schemes, Social Action Grant funds, scholarships, and social action for elderly programmes.
Informal transfers (value) per capita
Total amount (USD) of informal transfers received in the last 12 months. They include help from family members and in-laws, remittances, gifts and borrowing from friends and relatives.
AC
Average years of education Average years of education of household members.
Share of active members The dependency ratio is the share of household members actively employed (>15 and <64 years old) over the household size.
CSI The CSI is a weighted sum of the number of days the household adopted different strategies23 to cope with food shortage in the past week.
Number of income-generating activities
Sum of the different sources of income for the household. A list of variables assumes a value of 1 or 0 is used, depending on whether or not a household has been involved in farming activity; wage employment; sale of livestock, or their products; non-farm enterprise; a household has received transfers; rent, the sale of assets or other income sources.
Number of crops Sum of the different crops cultivated by the household during the last season.
Food Security
Food consumption per capita
Monetary value (USD) of per capita food consumption, including bought, auto-produced, received for free (as gifts or part of a conditional project) and stored food of the last year.
HDDS Number of food groups consumed by the household during the previous seven days.24
Table A1. Definition of resilience pillars and food security indicators
Definition VariablesPillars
of resilience
ABS
ABS shows the ability of a household to meet basic needs, by accessing and effectively using basic services, such as sending children to school; accessing water, electricity and sanitation; selling products at the market.
Improved sanitation; Improved water; Water source stability; Closeness to primary school; Closeness to hospital/health facility; Closeness to livestock market; Closeness to agricultural market
AST
Assets, both productive and non-productive, are the key elements of a livelihood, since they enable households to produce and consume goods. Examples of productive assets include land and the agricultural equipment, while non-agricultural assets take into account the monetary value of the house where the household is located, and its appliances.
Wealth index; Agricultural asset index; TLU, Land for cropping, House value.
SSNSSN proxies the ability of the household to access formal and informal assistance from institutions, as well as from relatives and friends.
Credit (value) per capita; Past credit (value) per capita; Formal transfers (value) per capita; Informal transfers (value) per capita.
AC
AC is the ability to adapt to a new situation and develop new livelihood strategies. For instance, proxies of adaptive capacity are the average years of education of household members and the household’s perception of the decision-making process of their community.
Average years of education of household members; Dependency ratio; CSI; Number of income-generating activities; Number of crops
Food securityFood consumed, including that which is bought, produced by the household, and received for free.
Food consumption per capita
Dietary diversity, based on the number of food groups consumed during the last seven days. HDDS
22 The conversion factor adopted is: 0.7 camel; 0.5 cattle; 0.3 donkeys /mules; pigs 0.2; 0.1 sheep/goats; 0.01 chickens.23 The strategies are weighted as a figure of 1-4 (according to focus group discussions implemented in the Ugandan
region of Moroto during enumerator training carried out during November 2016), including the following: 1) Rely on less preferred or less expensive food – 2; 2) Purchase food on credit – 1; 3) Borrow food, or rely on help from a relative – 2; 4) Gather wild foods, “famine foods” or hunt – 3; 5) Harvest and consume immature crops – 4; 6) Consume seed stock that will be needed for next season – 4; 7) Send household member elsewhere – 3; 8) Limit portion size at meal time – 3; 9) Reduce consumption by adults in order for small children to eat – 2; 10) Reduce consumption by others so working members could eat – 2; 11) Go one entire day without eating – 4; 12) Sell livestock – 3; 13) Reduce number of meals eaten in a day – 3; 14) Beg for food – 3; 15) Selling assets (other than livestock) – 3; 16) Increase the selling of firewood and charcoal – 3; 17) Rely on casual labour – 2; 18) School enrolment for children (even not at school-going-age) – 3; 19) Ask for loans from Villages Savings and Loans Associations (VSLAs) and other institutions – 2. The CSI adopted in the resilience estimation is equal to 1/CSI.
24 The food groups considered in the HDDS are the following: cereals, tubers, vegetables, fruits, meat, egg, fish, pulses, milk, oil, sugar, miscellaneous (Swindale and Bilinsky, 2006).
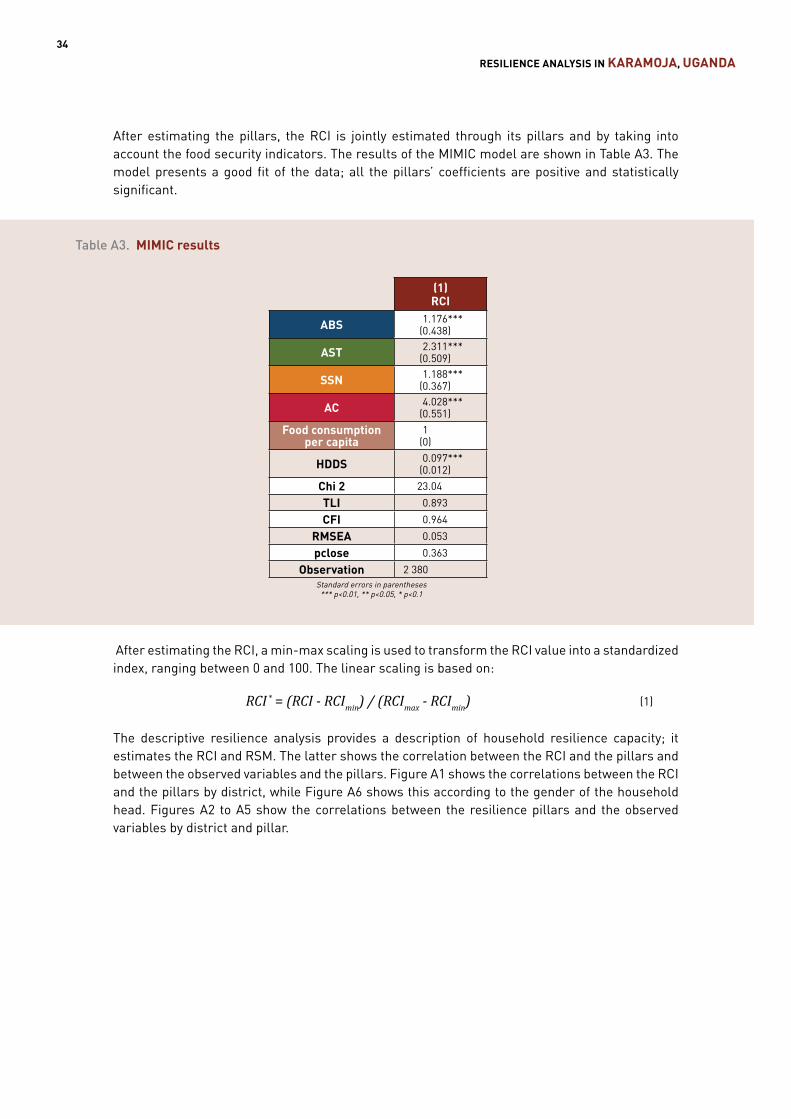
RESILIENCE ANALYSIS IN KARAMOJA, UGANDA34
ABS
AST
SSN
AC
Abim Amudat Kaabong Kotido Moroto Nakapiripirit Napak
Figure A1. RSM – Correlation RCI-pillars by district
Improved sanitation
Improved water
Water stability
Primary schoolHospital
Livestock market
Agricultural market
0.25
0.5
0.75
1
Abim
Amudat
Kaabong
Kotido
Moroto
Nakapiripirit
Napak
Figure A2. RSM: Correlation variables – ABS by district
After estimating the pillars, the RCI is jointly estimated through its pillars and by taking into account the food security indicators. The results of the MIMIC model are shown in Table A3. The model presents a good fit of the data; all the pillars’ coefficients are positive and statistically significant.
Table A3. MIMIC results
(1) RCI
ABS 1.176***(0.438)
AST 2.311***(0.509)
SSN 1.188***(0.367)
AC 4.028***(0.551)
Food consumption per capita
1(0)
HDDS 0.097***(0.012)
Chi 2 23.04
TLI 0.893
CFI 0.964
RMSEA 0.053
pclose 0.363
Observation 2 380Standard errors in parentheses
*** p<0.01, ** p<0.05, * p<0.1
After estimating the RCI, a min-max scaling is used to transform the RCI value into a standardized index, ranging between 0 and 100. The linear scaling is based on:
RCI * = (RCI - RCImin) / (RCImax - RCImin) (1)
The descriptive resilience analysis provides a description of household resilience capacity; it estimates the RCI and RSM. The latter shows the correlation between the RCI and the pillars and between the observed variables and the pillars. Figure A1 shows the correlations between the RCI and the pillars by district, while Figure A6 shows this according to the gender of the household head. Figures A2 to A5 show the correlations between the resilience pillars and the observed variables by district and pillar.
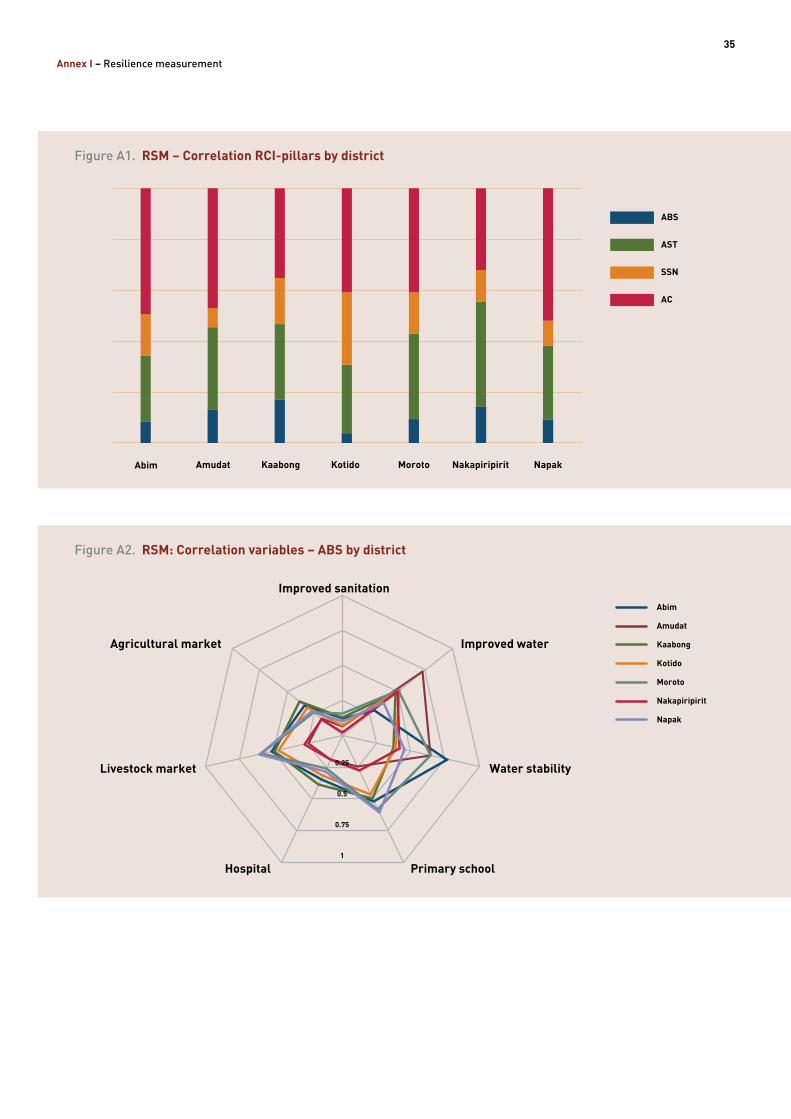
35
Annex I – Resilience measurement
ABS
AST
SSN
AC
Abim Amudat Kaabong Kotido Moroto Nakapiripirit Napak
Figure A1. RSM – Correlation RCI-pillars by district
Improved sanitation
Improved water
Water stability
Primary schoolHospital
Livestock market
Agricultural market
0.25
0.5
0.75
1
Abim
Amudat
Kaabong
Kotido
Moroto
Nakapiripirit
Napak
Figure A2. RSM: Correlation variables – ABS by district
After estimating the pillars, the RCI is jointly estimated through its pillars and by taking into account the food security indicators. The results of the MIMIC model are shown in Table A3. The model presents a good fit of the data; all the pillars’ coefficients are positive and statistically significant.
Table A3. MIMIC results
(1) RCI
ABS 1.176***(0.438)
AST 2.311***(0.509)
SSN 1.188***(0.367)
AC 4.028***(0.551)
Food consumption per capita
1(0)
HDDS 0.097***(0.012)
Chi 2 23.04
TLI 0.893
CFI 0.964
RMSEA 0.053
pclose 0.363
Observation 2 380Standard errors in parentheses
*** p<0.01, ** p<0.05, * p<0.1
After estimating the RCI, a min-max scaling is used to transform the RCI value into a standardized index, ranging between 0 and 100. The linear scaling is based on:
RCI * = (RCI - RCImin) / (RCImax - RCImin) (1)
The descriptive resilience analysis provides a description of household resilience capacity; it estimates the RCI and RSM. The latter shows the correlation between the RCI and the pillars and between the observed variables and the pillars. Figure A1 shows the correlations between the RCI and the pillars by district, while Figure A6 shows this according to the gender of the household head. Figures A2 to A5 show the correlations between the resilience pillars and the observed variables by district and pillar.
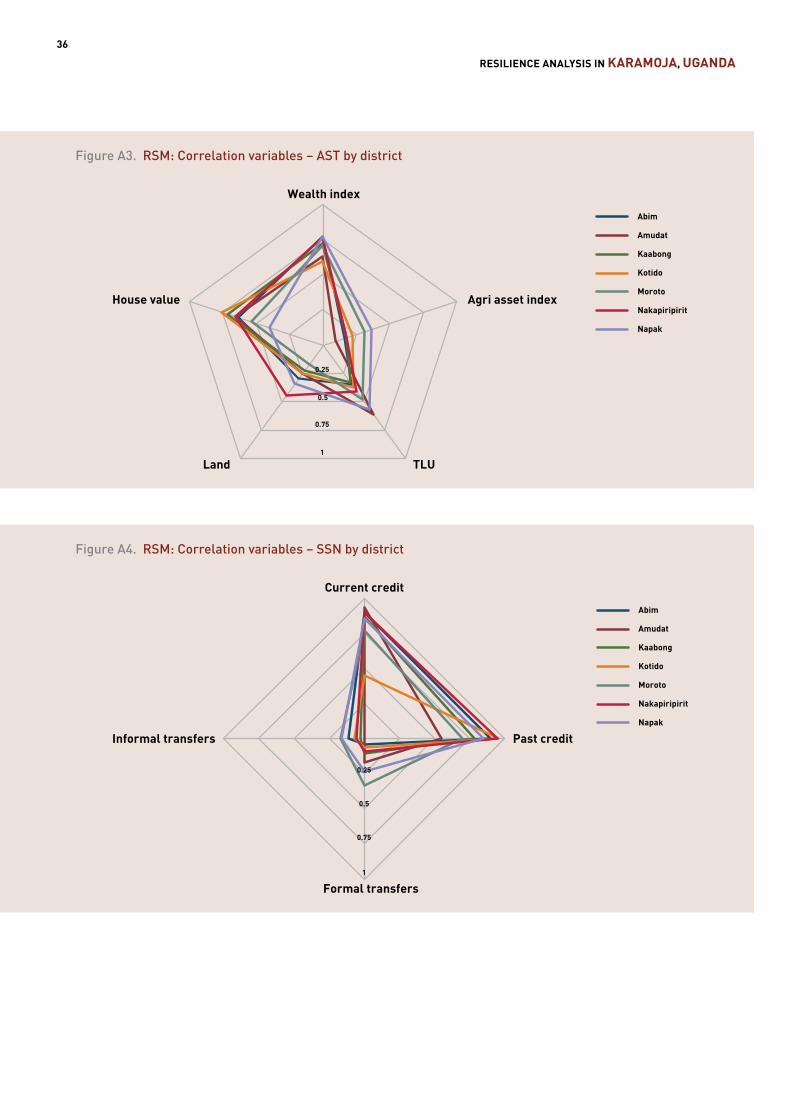
RESILIENCE ANALYSIS IN KARAMOJA, UGANDA36
Education
Active members
CSIIncome−generating activities
Number of crops
0.25
0.5
0.75
1
Abim
Amudat
Kaabong
Kotido
Moroto
Nakapiripirit
Napak
Figure A5. RSM: Correlation variables – AC by district
ABS
AST
SSN
AC
Female Male
Figure A6. RSM – Correlation RCI-pillars by gender of household head
Wealth index
Agri asset index
TLULand
House value
0.25
0.5
0.75
1
Abim
Amudat
Kaabong
Kotido
Moroto
Nakapiripirit
Napak
Figure A3. RSM: Correlation variables – AST by district
Current credit
Past credit
Formal transfers
Informal transfers
0.25
0.5
0.75
1
Abim
Amudat
Kaabong
Kotido
Moroto
Nakapiripirit
Napak
Figure A4. RSM: Correlation variables – SSN by district
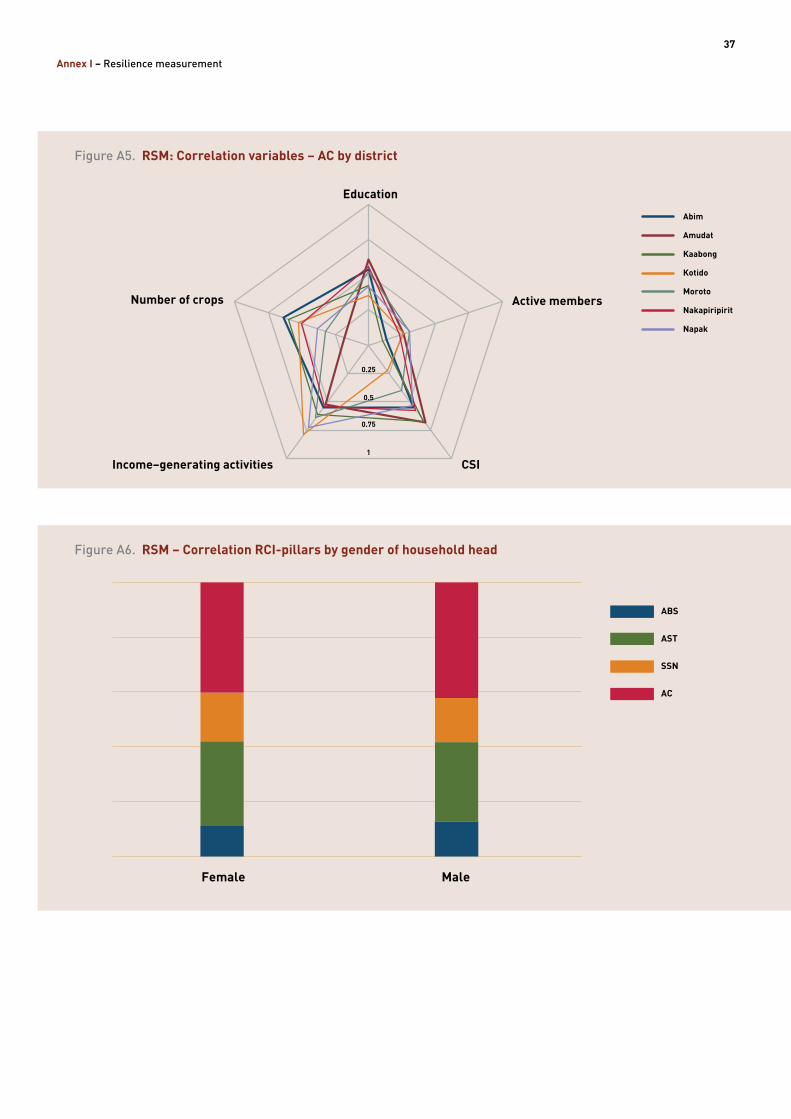
37
Annex I – Resilience measurement
Education
Active members
CSIIncome−generating activities
Number of crops
0.25
0.5
0.75
1
Abim
Amudat
Kaabong
Kotido
Moroto
Nakapiripirit
Napak
Figure A5. RSM: Correlation variables – AC by district
ABS
AST
SSN
AC
Female Male
Figure A6. RSM – Correlation RCI-pillars by gender of household head
Wealth index
Agri asset index
TLULand
House value
0.25
0.5
0.75
1
Abim
Amudat
Kaabong
Kotido
Moroto
Nakapiripirit
Napak
Figure A3. RSM: Correlation variables – AST by district
Current credit
Past credit
Formal transfers
Informal transfers
0.25
0.5
0.75
1
Abim
Amudat
Kaabong
Kotido
Moroto
Nakapiripirit
Napak
Figure A4. RSM: Correlation variables – SSN by district
RESILIENCE ANALYSIS IN KARAMOJA, UGANDA38
Table A4. OLS regression of shocks on food security indicators and RCICAUSAL RESILIENCE ANALYSISTo investigate the association between shocks and the RCI, the following regression model is employed:
RCIh = α + βSh + γRd + δXh + εh (2)
where Sh are dummy variables for self-reported shocks at the household level; Rd is the level of rainfall anomaly (the difference between the rainy season rainfall (in millimetres) of 2016 and the long-term average) at the district level; Xh are control characteristics; εh is the error term and RCIh is the rescaled (0-100) RCI estimated through the RIMA-II model. Additionally, in separated regressions, the food security indicators (total food consumption; the three components of food consumption and HDDS) employed for estimating the RCI and the variables used for estimating the pillars are utilized as an outcome of interest.
Table A4 shows the results of regression model (2) in columns 1 and 2; columns 3 to 6 report the estimates of the same model, adopting alternative outcome variables, namely total food consumption and the HDDS.
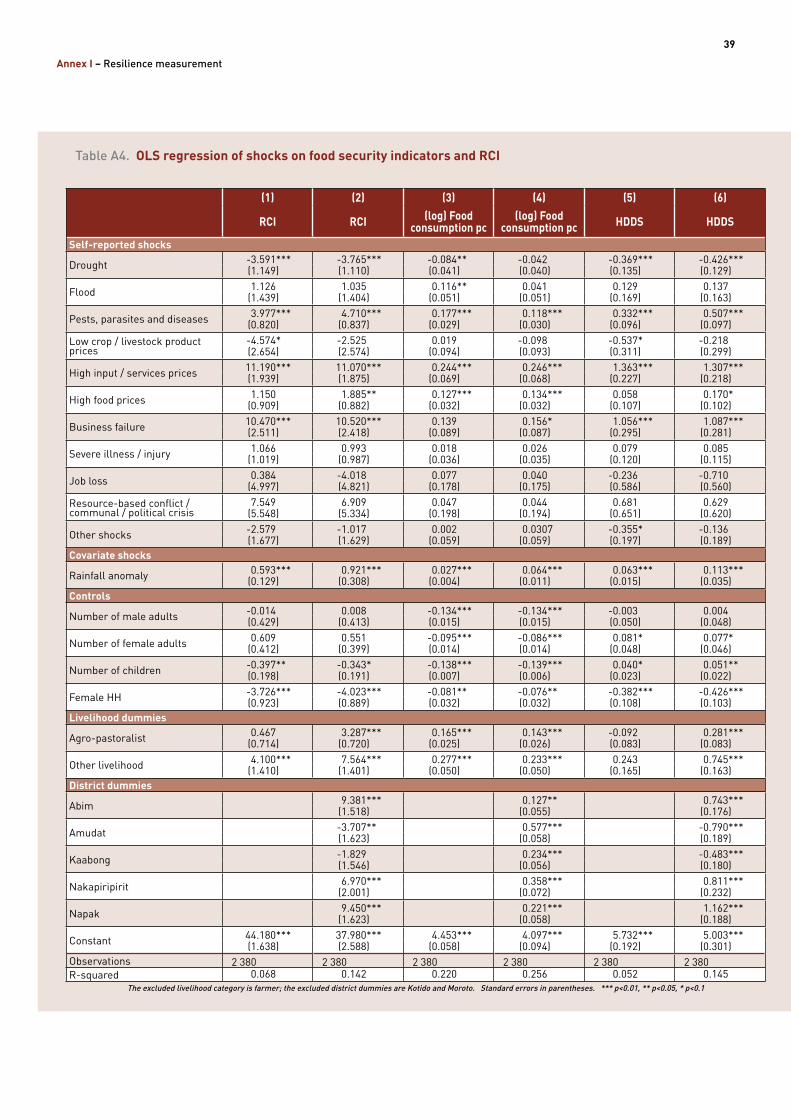
39
Annex I – Resilience measurement
Table A4. OLS regression of shocks on food security indicators and RCI
(1) (2) (3) (4) (5) (6)
RCI RCI (log) Food consumption pc
(log) Food consumption pc HDDS HDDS
Self-reported shocks
Drought -3.591*** -3.765*** -0.084** -0.042 -0.369*** -0.426***(1.149) (1.110) (0.041) (0.040) (0.135) (0.129)
Flood 1.126 1.035 0.116** 0.041 0.129 0.137(1.439) (1.404) (0.051) (0.051) (0.169) (0.163)
Pests, parasites and diseases 3.977*** 4.710*** 0.177*** 0.118*** 0.332*** 0.507***(0.820) (0.837) (0.029) (0.030) (0.096) (0.097)
Low crop / livestock product prices
-4.574* -2.525 0.019 -0.098 -0.537* -0.218(2.654) (2.574) (0.094) (0.093) (0.311) (0.299)
High input / services prices 11.190*** 11.070*** 0.244*** 0.246*** 1.363*** 1.307***(1.939) (1.875) (0.069) (0.068) (0.227) (0.218)
High food prices 1.150 1.885** 0.127*** 0.134*** 0.058 0.170*(0.909) (0.882) (0.032) (0.032) (0.107) (0.102)
Business failure 10.470*** 10.520*** 0.139 0.156* 1.056*** 1.087***(2.511) (2.418) (0.089) (0.087) (0.295) (0.281)
Severe illness / injury 1.066 0.993 0.018 0.026 0.079 0.085(1.019) (0.987) (0.036) (0.035) (0.120) (0.115)
Job loss 0.384 -4.018 0.077 0.040 -0.236 -0.710(4.997) (4.821) (0.178) (0.175) (0.586) (0.560)
Resource-based conflict / communal / political crisis
7.549 6.909 0.047 0.044 0.681 0.629(5.548) (5.334) (0.198) (0.194) (0.651) (0.620)
Other shocks -2.579 -1.017 0.002 0.0307 -0.355* -0.136(1.677) (1.629) (0.059) (0.059) (0.197) (0.189)
Covariate shocks
Rainfall anomaly 0.593*** 0.921*** 0.027*** 0.064*** 0.063*** 0.113***(0.129) (0.308) (0.004) (0.011) (0.015) (0.035)
Controls
Number of male adults -0.014 0.008 -0.134*** -0.134*** -0.003 0.004(0.429) (0.413) (0.015) (0.015) (0.050) (0.048)
Number of female adults 0.609 0.551 -0.095*** -0.086*** 0.081* 0.077*(0.412) (0.399) (0.014) (0.014) (0.048) (0.046)
Number of children -0.397** -0.343* -0.138*** -0.139*** 0.040* 0.051**(0.198) (0.191) (0.007) (0.006) (0.023) (0.022)
Female HH -3.726*** -4.023*** -0.081** -0.076** -0.382*** -0.426***(0.923) (0.889) (0.032) (0.032) (0.108) (0.103)
Livelihood dummies
Agro-pastoralist 0.467 3.287*** 0.165*** 0.143*** -0.092 0.281***(0.714) (0.720) (0.025) (0.026) (0.083) (0.083)
Other livelihood 4.100*** 7.564*** 0.277*** 0.233*** 0.243 0.745***(1.410) (1.401) (0.050) (0.050) (0.165) (0.163)
District dummies
Abim 9.381*** 0.127** 0.743***(1.518) (0.055) (0.176)
Amudat -3.707** 0.577*** -0.790***(1.623) (0.058) (0.189)
Kaabong -1.829 0.234*** -0.483***(1.546) (0.056) (0.180)
Nakapiripirit 6.970*** 0.358*** 0.811***(2.001) (0.072) (0.232)
Napak 9.450*** 0.221*** 1.162***(1.623) (0.058) (0.188)
Constant 44.180*** 37.980*** 4.453*** 4.097*** 5.732*** 5.003***(1.638) (2.588) (0.058) (0.094) (0.192) (0.301)
Observations 2 380 2 380 2 380 2 380 2 380 2 380R-squared 0.068 0.142 0.220 0.256 0.052 0.145
The excluded livelihood category is farmer; the excluded district dummies are Kotido and Moroto. Standard errors in parentheses. *** p<0.01, ** p<0.05, * p<0.1
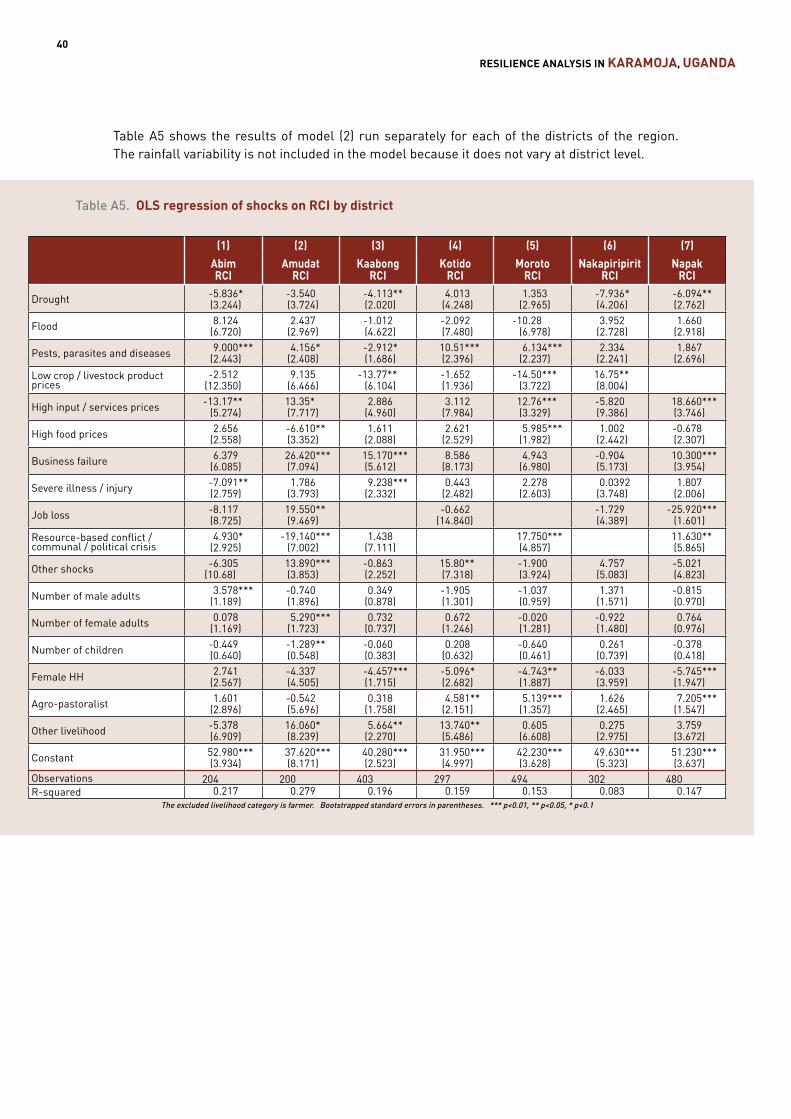
RESILIENCE ANALYSIS IN KARAMOJA, UGANDA40
Table A6 shows the results of model (2) employing, as an outcome, the different component of food consumption: food expenditure in column 1, monetary value of food produced by the household in column 2, and the monetary value of food received for free in column 3.
Table A6. OLS regression of shocks on food consumption components
Table A5 shows the results of model (2) run separately for each of the districts of the region. The rainfall variability is not included in the model because it does not vary at district level.
Table A5. OLS regression of shocks on RCI by district
(1) (2) (3) (4) (5) (6) (7)Abim RCI
Amudat RCI
Kaabong RCI
Kotido RCI
Moroto RCI
Nakapiripirit RCI
Napak RCI
Drought -5.836* -3.540 -4.113** 4.013 1.353 -7.936* -6.094**(3.244) (3.724) (2.020) (4.248) (2.965) (4.206) (2.762)
Flood 8.124 2.437 -1.012 -2.092 -10.28 3.952 1.660(6.720) (2.969) (4.622) (7.480) (6.978) (2.728) (2.918)
Pests, parasites and diseases 9.000*** 4.156* -2.912* 10.51*** 6.134*** 2.334 1.867(2.443) (2.408) (1.686) (2.396) (2.237) (2.241) (2.696)
Low crop / livestock product prices
-2.512 9.135 -13.77** -1.652 -14.50*** 16.75**(12.350) (6.466) (6.104) (1.936) (3.722) (8.004)
High input / services prices -13.17** 13.35* 2.886 3.112 12.76*** -5.820 18.660***(5.274) (7.717) (4.960) (7.984) (3.329) (9.386) (3.746)
High food prices 2.656 -6.610** 1.611 2.621 5.985*** 1.002 -0.678(2.558) (3.352) (2.088) (2.529) (1.982) (2.442) (2.307)
Business failure 6.379 26.420*** 15.170*** 8.586 4.943 -0.904 10.300***(6.085) (7.094) (5.612) (8.173) (6.980) (5.173) (3.954)
Severe illness / injury -7.091** 1.786 9.238*** 0.443 2.278 0.0392 1.807(2.759) (3.793) (2.332) (2.482) (2.603) (3.748) (2.006)
Job loss -8.117 19.550** -0.662 -1.729 -25.920***(8.725) (9.469) (14.840) (4.389) (1.601)
Resource-based conflict / communal / political crisis
4.930* -19.140*** 1.438 17.750*** 11.630**(2.925) (7.002) (7.111) (4.857) (5.865)
Other shocks -6.305 13.890*** -0.863 15.80** -1.900 4.757 -5.021(10.68) (3.853) (2.252) (7.318) (3.924) (5.083) (4.823)
Number of male adults 3.578*** -0.740 0.349 -1.905 -1.037 1.371 -0.815(1.189) (1.896) (0.878) (1.301) (0.959) (1.571) (0.970)
Number of female adults 0.078 5.290*** 0.732 0.672 -0.020 -0.922 0.764(1.169) (1.723) (0.737) (1.246) (1.281) (1.480) (0.976)
Number of children -0.449 -1.289** -0.060 0.208 -0.640 0.261 -0.378(0.640) (0.548) (0.383) (0.632) (0.461) (0.739) (0.418)
Female HH 2.741 -4.337 -4.457*** -5.096* -4.743** -6.033 -5.745***(2.567) (4.505) (1.715) (2.682) (1.887) (3.959) (1.947)
Agro-pastoralist 1.601 -0.542 0.318 4.581** 5.139*** 1.626 7.205***(2.896) (5.696) (1.758) (2.151) (1.357) (2.465) (1.547)
Other livelihood -5.378 16.060* 5.664** 13.740** 0.605 0.275 3.759(6.909) (8.239) (2.270) (5.486) (6.608) (2.975) (3.672)
Constant 52.980*** 37.620*** 40.280*** 31.950*** 42.230*** 49.630*** 51.230***(3.934) (8.171) (2.523) (4.997) (3.628) (5.323) (3.637)
Observations 204 200 403 297 494 302 480R-squared 0.217 0.279 0.196 0.159 0.153 0.083 0.147
The excluded livelihood category is farmer. Bootstrapped standard errors in parentheses. *** p<0.01, ** p<0.05, * p<0.1
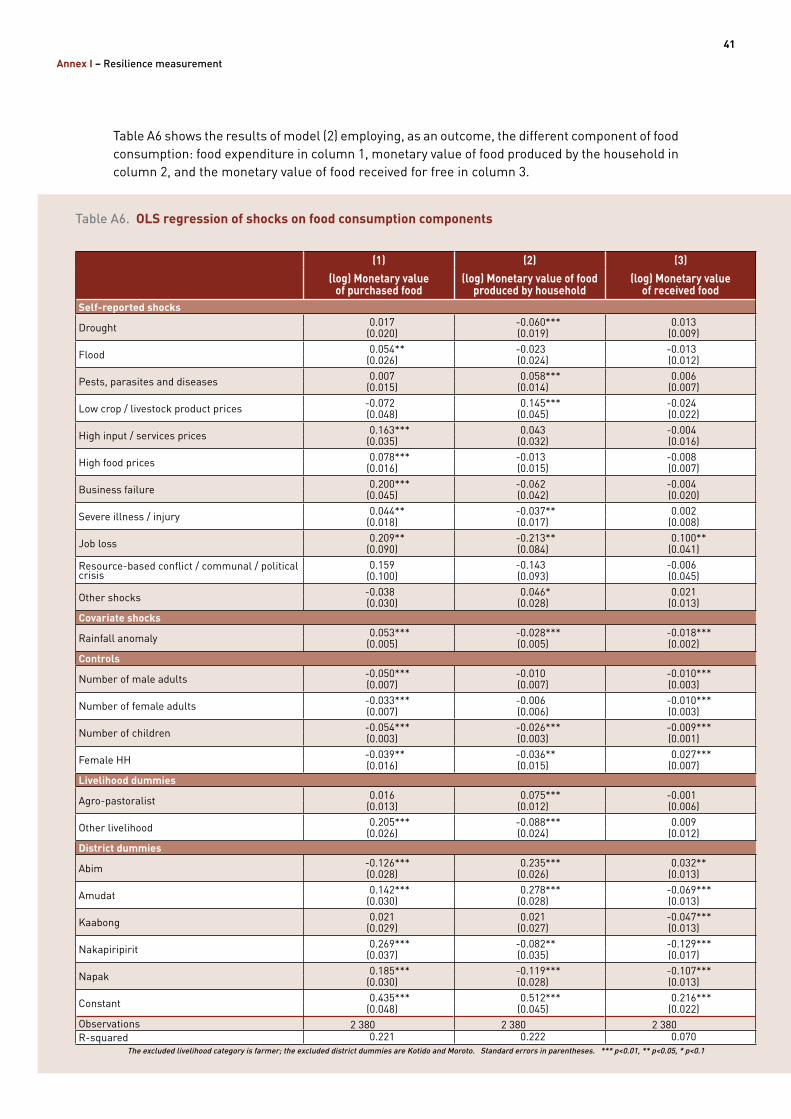
41
Annex I – Resilience measurement
Table A6 shows the results of model (2) employing, as an outcome, the different component of food consumption: food expenditure in column 1, monetary value of food produced by the household in column 2, and the monetary value of food received for free in column 3.
Table A6. OLS regression of shocks on food consumption components
(1) (2) (3)(log) Monetary value
of purchased food(log) Monetary value of food
produced by household(log) Monetary value
of received food Self-reported shocks
Drought 0.017 -0.060*** 0.013(0.020) (0.019) (0.009)
Flood 0.054** -0.023 -0.013(0.026) (0.024) (0.012)
Pests, parasites and diseases 0.007 0.058*** 0.006(0.015) (0.014) (0.007)
Low crop / livestock product prices -0.072 0.145*** -0.024(0.048) (0.045) (0.022)
High input / services prices 0.163*** 0.043 -0.004(0.035) (0.032) (0.016)
High food prices 0.078*** -0.013 -0.008(0.016) (0.015) (0.007)
Business failure 0.200*** -0.062 -0.004(0.045) (0.042) (0.020)
Severe illness / injury 0.044** -0.037** 0.002(0.018) (0.017) (0.008)
Job loss 0.209** -0.213** 0.100**(0.090) (0.084) (0.041)
Resource-based conflict / communal / political crisis
0.159 -0.143 -0.006(0.100) (0.093) (0.045)
Other shocks -0.038 0.046* 0.021(0.030) (0.028) (0.013)
Covariate shocks
Rainfall anomaly 0.053*** -0.028*** -0.018***(0.005) (0.005) (0.002)
Controls
Number of male adults -0.050*** -0.010 -0.010***(0.007) (0.007) (0.003)
Number of female adults -0.033*** -0.006 -0.010***(0.007) (0.006) (0.003)
Number of children -0.054*** -0.026*** -0.009***(0.003) (0.003) (0.001)
Female HH -0.039** -0.036** 0.027***(0.016) (0.015) (0.007)
Livelihood dummies
Agro-pastoralist 0.016 0.075*** -0.001(0.013) (0.012) (0.006)
Other livelihood 0.205*** -0.088*** 0.009(0.026) (0.024) (0.012)
District dummies
Abim -0.126*** 0.235*** 0.032**(0.028) (0.026) (0.013)
Amudat 0.142*** 0.278*** -0.069***(0.030) (0.028) (0.013)
Kaabong 0.021 0.021 -0.047***(0.029) (0.027) (0.013)
Nakapiripirit 0.269*** -0.082** -0.129***(0.037) (0.035) (0.017)
Napak 0.185*** -0.119*** -0.107***(0.030) (0.028) (0.013)
Constant 0.435*** 0.512*** 0.216***(0.048) (0.045) (0.022)
Observations 2 380 2 380 2 380R-squared 0.221 0.222 0.070
The excluded livelihood category is farmer; the excluded district dummies are Kotido and Moroto. Standard errors in parentheses. *** p<0.01, ** p<0.05, * p<0.1
Table A5 shows the results of model (2) run separately for each of the districts of the region. The rainfall variability is not included in the model because it does not vary at district level.
Table A5. OLS regression of shocks on RCI by district
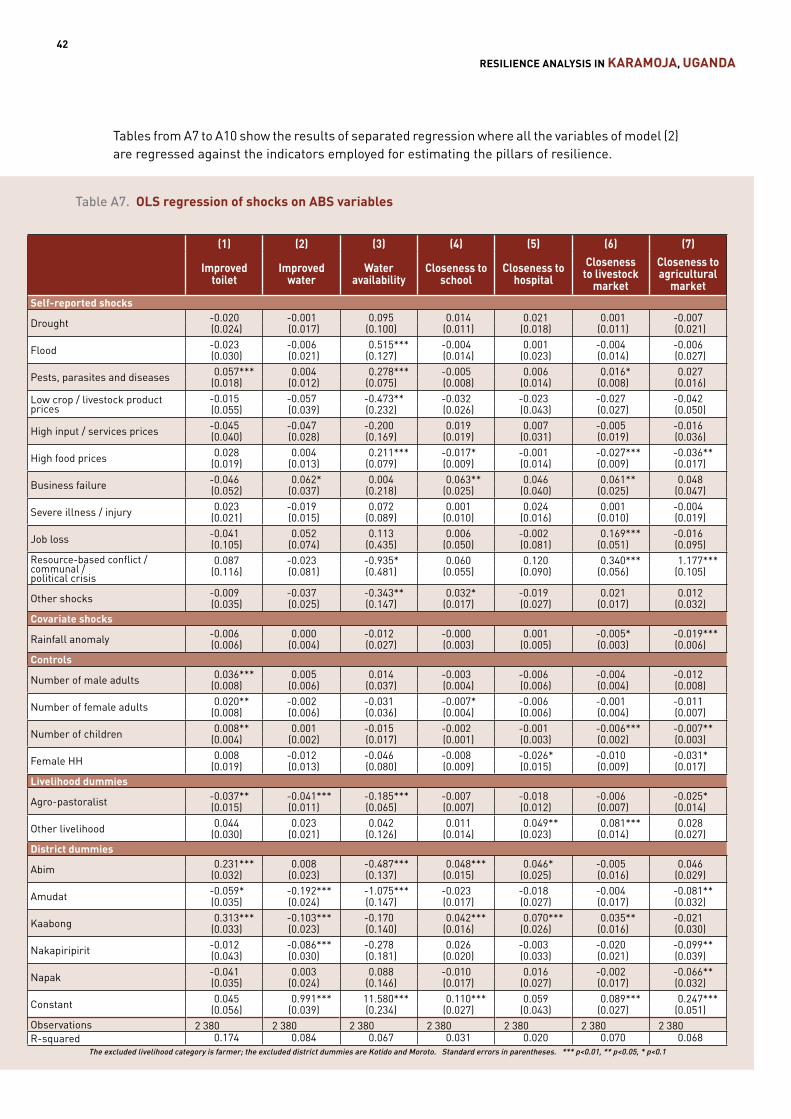
RESILIENCE ANALYSIS IN KARAMOJA, UGANDA42
Table A8. OLS regression of shocks on AST variablesTables from A7 to A10 show the results of separated regression where all the variables of model (2) are regressed against the indicators employed for estimating the pillars of resilience.
Table A7. OLS regression of shocks on ABS variables
(1) (2) (3) (4) (5) (6) (7)
Improved toilet
Improved water
Water availability
Closeness to school
Closeness to hospital
Closeness to livestock
market
Closeness to agricultural
marketSelf-reported shocks
Drought -0.020 -0.001 0.095 0.014 0.021 0.001 -0.007(0.024) (0.017) (0.100) (0.011) (0.018) (0.011) (0.021)
Flood -0.023 -0.006 0.515*** -0.004 0.001 -0.004 -0.006(0.030) (0.021) (0.127) (0.014) (0.023) (0.014) (0.027)
Pests, parasites and diseases 0.057*** 0.004 0.278*** -0.005 0.006 0.016* 0.027(0.018) (0.012) (0.075) (0.008) (0.014) (0.008) (0.016)
Low crop / livestock product prices
-0.015 -0.057 -0.473** -0.032 -0.023 -0.027 -0.042(0.055) (0.039) (0.232) (0.026) (0.043) (0.027) (0.050)
High input / services prices -0.045 -0.047 -0.200 0.019 0.007 -0.005 -0.016(0.040) (0.028) (0.169) (0.019) (0.031) (0.019) (0.036)
High food prices 0.028 0.004 0.211*** -0.017* -0.001 -0.027*** -0.036**(0.019) (0.013) (0.079) (0.009) (0.014) (0.009) (0.017)
Business failure -0.046 0.062* 0.004 0.063** 0.046 0.061** 0.048(0.052) (0.037) (0.218) (0.025) (0.040) (0.025) (0.047)
Severe illness / injury 0.023 -0.019 0.072 0.001 0.024 0.001 -0.004(0.021) (0.015) (0.089) (0.010) (0.016) (0.010) (0.019)
Job loss -0.041 0.052 0.113 0.006 -0.002 0.169*** -0.016(0.105) (0.074) (0.435) (0.050) (0.081) (0.051) (0.095)
Resource-based conflict / communal / political crisis
0.087 -0.023 -0.935* 0.060 0.120 0.340*** 1.177***(0.116) (0.081) (0.481) (0.055) (0.090) (0.056) (0.105)
Other shocks -0.009 -0.037 -0.343** 0.032* -0.019 0.021 0.012(0.035) (0.025) (0.147) (0.017) (0.027) (0.017) (0.032)
Covariate shocks
Rainfall anomaly -0.006 0.000 -0.012 -0.000 0.001 -0.005* -0.019***(0.006) (0.004) (0.027) (0.003) (0.005) (0.003) (0.006)
Controls
Number of male adults 0.036*** 0.005 0.014 -0.003 -0.006 -0.004 -0.012(0.008) (0.006) (0.037) (0.004) (0.006) (0.004) (0.008)
Number of female adults 0.020** -0.002 -0.031 -0.007* -0.006 -0.001 -0.011(0.008) (0.006) (0.036) (0.004) (0.006) (0.004) (0.007)
Number of children 0.008** 0.001 -0.015 -0.002 -0.001 -0.006*** -0.007**(0.004) (0.002) (0.017) (0.001) (0.003) (0.002) (0.003)
Female HH 0.008 -0.012 -0.046 -0.008 -0.026* -0.010 -0.031*(0.019) (0.013) (0.080) (0.009) (0.015) (0.009) (0.017)
Livelihood dummies
Agro-pastoralist -0.037** -0.041*** -0.185*** -0.007 -0.018 -0.006 -0.025*(0.015) (0.011) (0.065) (0.007) (0.012) (0.007) (0.014)
Other livelihood 0.044 0.023 0.042 0.011 0.049** 0.081*** 0.028(0.030) (0.021) (0.126) (0.014) (0.023) (0.014) (0.027)
District dummies
Abim 0.231*** 0.008 -0.487*** 0.048*** 0.046* -0.005 0.046(0.032) (0.023) (0.137) (0.015) (0.025) (0.016) (0.029)
Amudat -0.059* -0.192*** -1.075*** -0.023 -0.018 -0.004 -0.081**(0.035) (0.024) (0.147) (0.017) (0.027) (0.017) (0.032)
Kaabong 0.313*** -0.103*** -0.170 0.042*** 0.070*** 0.035** -0.021(0.033) (0.023) (0.140) (0.016) (0.026) (0.016) (0.030)
Nakapiripirit -0.012 -0.086*** -0.278 0.026 -0.003 -0.020 -0.099**(0.043) (0.030) (0.181) (0.020) (0.033) (0.021) (0.039)
Napak -0.041 0.003 0.088 -0.010 0.016 -0.002 -0.066**(0.035) (0.024) (0.146) (0.017) (0.027) (0.017) (0.032)
Constant 0.045 0.991*** 11.580*** 0.110*** 0.059 0.089*** 0.247***(0.056) (0.039) (0.234) (0.027) (0.043) (0.027) (0.051)
Observations 2 380 2 380 2 380 2 380 2 380 2 380 2 380R-squared 0.174 0.084 0.067 0.031 0.020 0.070 0.068
The excluded livelihood category is farmer; the excluded district dummies are Kotido and Moroto. Standard errors in parentheses. *** p<0.01, ** p<0.05, * p<0.1
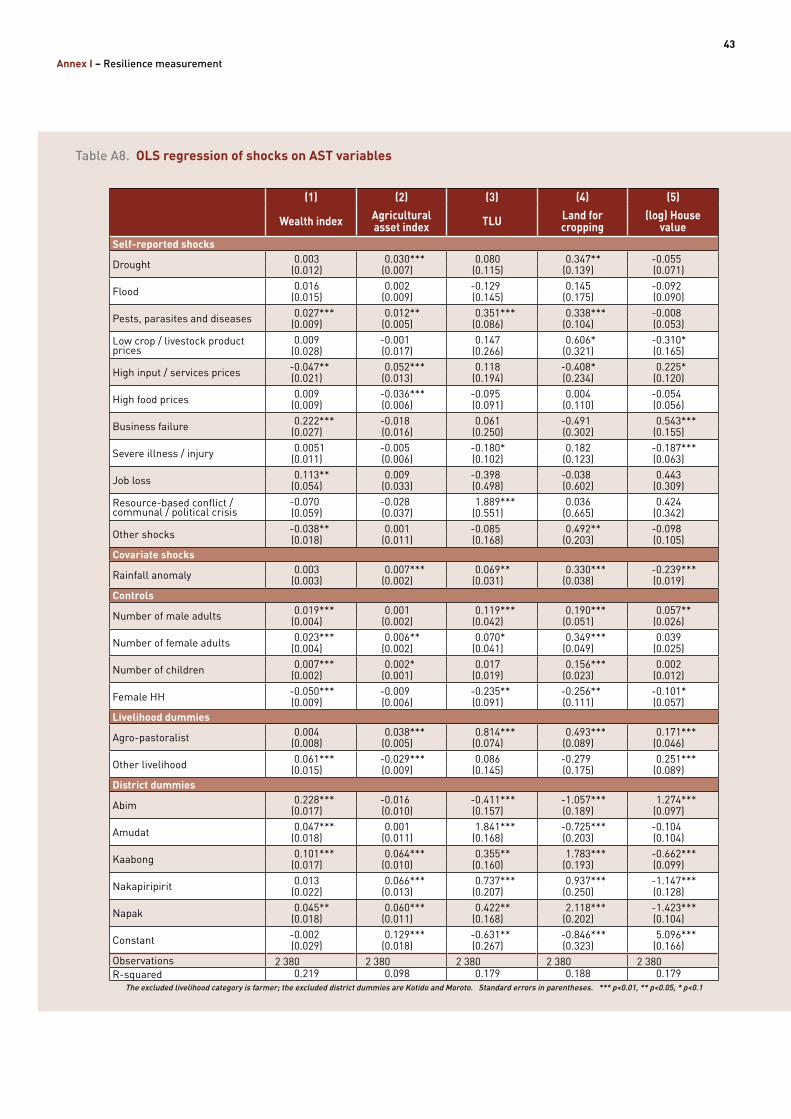
43
Annex I – Resilience measurement
Table A8. OLS regression of shocks on AST variables
(1) (2) (3) (4) (5)
Wealth index Agricultural asset index TLU Land for
cropping(log) House
valueSelf-reported shocks
Drought 0.003 0.030*** 0.080 0.347** -0.055(0.012) (0.007) (0.115) (0.139) (0.071)
Flood 0.016 0.002 -0.129 0.145 -0.092(0.015) (0.009) (0.145) (0.175) (0.090)
Pests, parasites and diseases 0.027*** 0.012** 0.351*** 0.338*** -0.008(0.009) (0.005) (0.086) (0.104) (0.053)
Low crop / livestock product prices
0.009 -0.001 0.147 0.606* -0.310*(0.028) (0.017) (0.266) (0.321) (0.165)
High input / services prices -0.047** 0.052*** 0.118 -0.408* 0.225*(0.021) (0.013) (0.194) (0.234) (0.120)
High food prices 0.009 -0.036*** -0.095 0.004 -0.054(0.009) (0.006) (0.091) (0.110) (0.056)
Business failure 0.222*** -0.018 0.061 -0.491 0.543***(0.027) (0.016) (0.250) (0.302) (0.155)
Severe illness / injury 0.0051 -0.005 -0.180* 0.182 -0.187***(0.011) (0.006) (0.102) (0.123) (0.063)
Job loss 0.113** 0.009 -0.398 -0.038 0.443(0.054) (0.033) (0.498) (0.602) (0.309)
Resource-based conflict / communal / political crisis
-0.070 -0.028 1.889*** 0.036 0.424(0.059) (0.037) (0.551) (0.665) (0.342)
Other shocks -0.038** 0.001 -0.085 0.492** -0.098(0.018) (0.011) (0.168) (0.203) (0.105)
Covariate shocks
Rainfall anomaly 0.003 0.007*** 0.069** 0.330*** -0.239***(0.003) (0.002) (0.031) (0.038) (0.019)
Controls
Number of male adults 0.019*** 0.001 0.119*** 0.190*** 0.057**(0.004) (0.002) (0.042) (0.051) (0.026)
Number of female adults 0.023*** 0.006** 0.070* 0.349*** 0.039(0.004) (0.002) (0.041) (0.049) (0.025)
Number of children 0.007*** 0.002* 0.017 0.156*** 0.002(0.002) (0.001) (0.019) (0.023) (0.012)
Female HH -0.050*** -0.009 -0.235** -0.256** -0.101*(0.009) (0.006) (0.091) (0.111) (0.057)
Livelihood dummies
Agro-pastoralist 0.004 0.038*** 0.814*** 0.493*** 0.171***(0.008) (0.005) (0.074) (0.089) (0.046)
Other livelihood 0.061*** -0.029*** 0.086 -0.279 0.251***(0.015) (0.009) (0.145) (0.175) (0.089)
District dummies
Abim 0.228*** -0.016 -0.411*** -1.057*** 1.274***(0.017) (0.010) (0.157) (0.189) (0.097)
Amudat 0.047*** 0.001 1.841*** -0.725*** -0.104(0.018) (0.011) (0.168) (0.203) (0.104)
Kaabong 0.101*** 0.064*** 0.355** 1.783*** -0.662***(0.017) (0.010) (0.160) (0.193) (0.099)
Nakapiripirit 0.013 0.066*** 0.737*** 0.937*** -1.147***(0.022) (0.013) (0.207) (0.250) (0.128)
Napak 0.045** 0.060*** 0.422** 2.118*** -1.423***(0.018) (0.011) (0.168) (0.202) (0.104)
Constant -0.002 0.129*** -0.631** -0.846*** 5.096***(0.029) (0.018) (0.267) (0.323) (0.166)
Observations 2 380 2 380 2 380 2 380 2 380R-squared 0.219 0.098 0.179 0.188 0.179
The excluded livelihood category is farmer; the excluded district dummies are Kotido and Moroto. Standard errors in parentheses. *** p<0.01, ** p<0.05, * p<0.1
Tables from A7 to A10 show the results of separated regression where all the variables of model (2) are regressed against the indicators employed for estimating the pillars of resilience.
Table A7. OLS regression of shocks on ABS variables
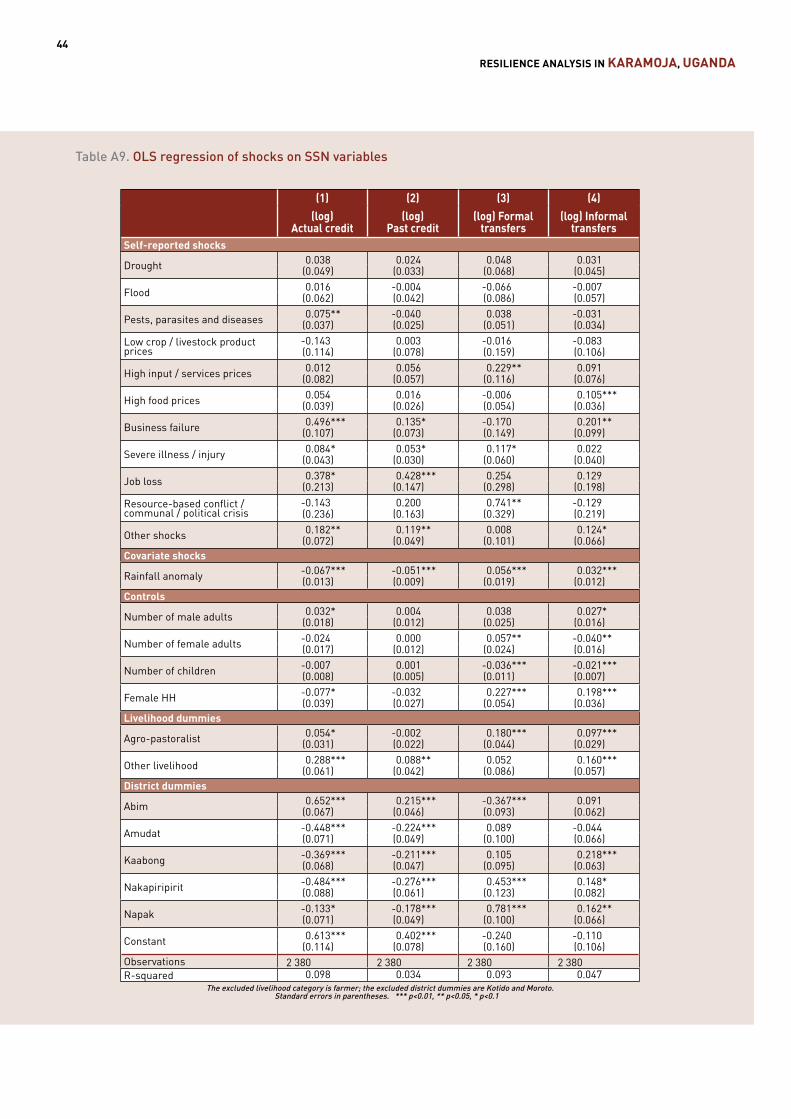
RESILIENCE ANALYSIS IN KARAMOJA, UGANDA44
Table A10. OLS regression of shocks on AC variablesTable A9. OLS regression of shocks on SSN variables
(1) (2) (3) (4)(log)
Actual credit(log)
Past credit(log) Formal
transfers(log) Informal
transfersSelf-reported shocks
Drought 0.038 0.024 0.048 0.031(0.049) (0.033) (0.068) (0.045)
Flood 0.016 -0.004 -0.066 -0.007(0.062) (0.042) (0.086) (0.057)
Pests, parasites and diseases 0.075** -0.040 0.038 -0.031(0.037) (0.025) (0.051) (0.034)
Low crop / livestock product prices
-0.143 0.003 -0.016 -0.083(0.114) (0.078) (0.159) (0.106)
High input / services prices 0.012 0.056 0.229** 0.091(0.082) (0.057) (0.116) (0.076)
High food prices 0.054 0.016 -0.006 0.105***(0.039) (0.026) (0.054) (0.036)
Business failure 0.496*** 0.135* -0.170 0.201**(0.107) (0.073) (0.149) (0.099)
Severe illness / injury 0.084* 0.053* 0.117* 0.022(0.043) (0.030) (0.060) (0.040)
Job loss 0.378* 0.428*** 0.254 0.129(0.213) (0.147) (0.298) (0.198)
Resource-based conflict / communal / political crisis
-0.143 0.200 0.741** -0.129(0.236) (0.163) (0.329) (0.219)
Other shocks 0.182** 0.119** 0.008 0.124*(0.072) (0.049) (0.101) (0.066)
Covariate shocks
Rainfall anomaly -0.067*** -0.051*** 0.056*** 0.032***(0.013) (0.009) (0.019) (0.012)
Controls
Number of male adults 0.032* 0.004 0.038 0.027*(0.018) (0.012) (0.025) (0.016)
Number of female adults -0.024 0.000 0.057** -0.040**(0.017) (0.012) (0.024) (0.016)
Number of children -0.007 0.001 -0.036*** -0.021***(0.008) (0.005) (0.011) (0.007)
Female HH -0.077* -0.032 0.227*** 0.198***(0.039) (0.027) (0.054) (0.036)
Livelihood dummies
Agro-pastoralist 0.054* -0.002 0.180*** 0.097***(0.031) (0.022) (0.044) (0.029)
Other livelihood 0.288*** 0.088** 0.052 0.160***(0.061) (0.042) (0.086) (0.057)
District dummies
Abim 0.652*** 0.215*** -0.367*** 0.091(0.067) (0.046) (0.093) (0.062)
Amudat -0.448*** -0.224*** 0.089 -0.044(0.071) (0.049) (0.100) (0.066)
Kaabong -0.369*** -0.211*** 0.105 0.218***(0.068) (0.047) (0.095) (0.063)
Nakapiripirit -0.484*** -0.276*** 0.453*** 0.148*(0.088) (0.061) (0.123) (0.082)
Napak -0.133* -0.178*** 0.781*** 0.162**(0.071) (0.049) (0.100) (0.066)
Constant 0.613*** 0.402*** -0.240 -0.110(0.114) (0.078) (0.160) (0.106)
Observations 2 380 2 380 2 380 2 380R-squared 0.098 0.034 0.093 0.047
The excluded livelihood category is farmer; the excluded district dummies are Kotido and Moroto. Standard errors in parentheses. *** p<0.01, ** p<0.05, * p<0.1
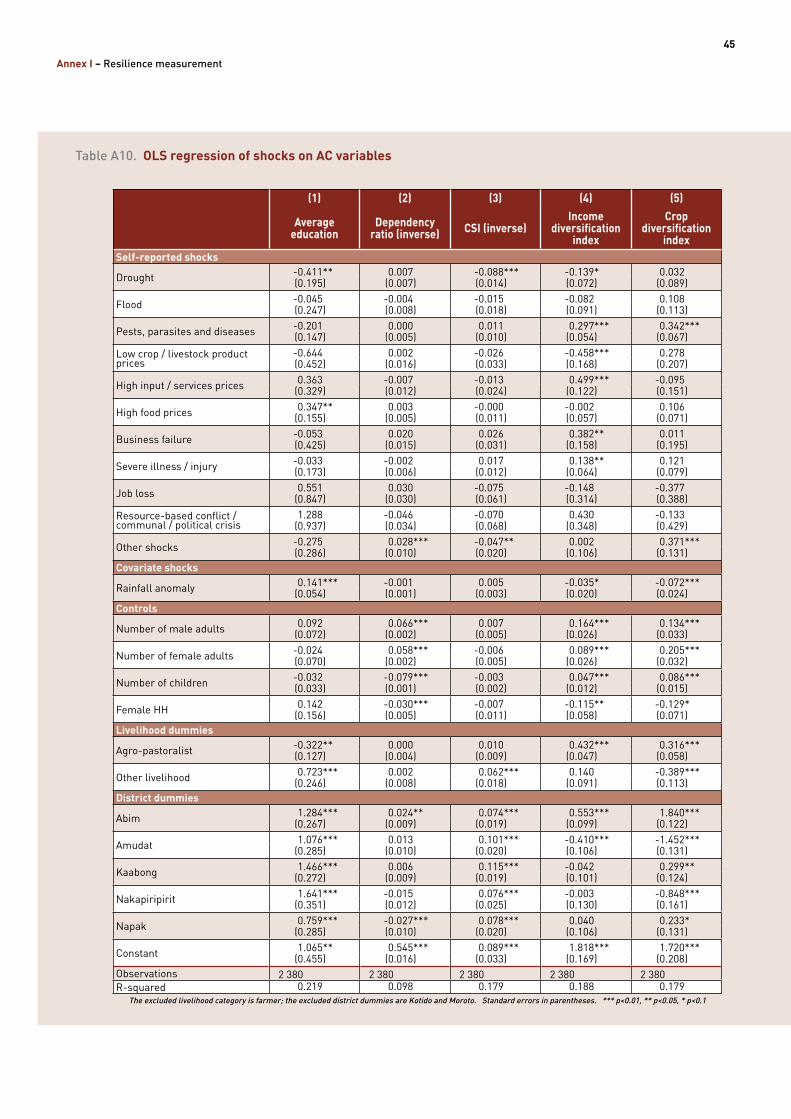
45
Annex I – Resilience measurement
Table A10. OLS regression of shocks on AC variables
(1) (2) (3) (4) (5)
Average education
Dependency ratio (inverse) CSI (inverse)
Income diversification
index
Crop diversification
indexSelf-reported shocks
Drought -0.411** 0.007 -0.088*** -0.139* 0.032(0.195) (0.007) (0.014) (0.072) (0.089)
Flood -0.045 -0.004 -0.015 -0.082 0.108(0.247) (0.008) (0.018) (0.091) (0.113)
Pests, parasites and diseases -0.201 0.000 0.011 0.297*** 0.342***(0.147) (0.005) (0.010) (0.054) (0.067)
Low crop / livestock product prices
-0.644 0.002 -0.026 -0.458*** 0.278(0.452) (0.016) (0.033) (0.168) (0.207)
High input / services prices 0.363 -0.007 -0.013 0.499*** -0.095(0.329) (0.012) (0.024) (0.122) (0.151)
High food prices 0.347** 0.003 -0.000 -0.002 0.106(0.155) (0.005) (0.011) (0.057) (0.071)
Business failure -0.053 0.020 0.026 0.382** 0.011(0.425) (0.015) (0.031) (0.158) (0.195)
Severe illness / injury -0.033 -0.002 0.017 0.138** 0.121(0.173) (0.006) (0.012) (0.064) (0.079)
Job loss 0.551 0.030 -0.075 -0.148 -0.377(0.847) (0.030) (0.061) (0.314) (0.388)
Resource-based conflict / communal / political crisis
1.288 -0.046 -0.070 0.430 -0.133(0.937) (0.034) (0.068) (0.348) (0.429)
Other shocks -0.275 0.028*** -0.047** 0.002 0.371***(0.286) (0.010) (0.020) (0.106) (0.131)
Covariate shocks
Rainfall anomaly 0.141*** -0.001 0.005 -0.035* -0.072***(0.054) (0.001) (0.003) (0.020) (0.024)
Controls
Number of male adults 0.092 0.066*** 0.007 0.164*** 0.134***(0.072) (0.002) (0.005) (0.026) (0.033)
Number of female adults -0.024 0.058*** -0.006 0.089*** 0.205***(0.070) (0.002) (0.005) (0.026) (0.032)
Number of children -0.032 -0.079*** -0.003 0.047*** 0.086***(0.033) (0.001) (0.002) (0.012) (0.015)
Female HH 0.142 -0.030*** -0.007 -0.115** -0.129*(0.156) (0.005) (0.011) (0.058) (0.071)
Livelihood dummies
Agro-pastoralist -0.322** 0.000 0.010 0.432*** 0.316***(0.127) (0.004) (0.009) (0.047) (0.058)
Other livelihood 0.723*** 0.002 0.062*** 0.140 -0.389***(0.246) (0.008) (0.018) (0.091) (0.113)
District dummies
Abim 1.284*** 0.024** 0.074*** 0.553*** 1.840***(0.267) (0.009) (0.019) (0.099) (0.122)
Amudat 1.076*** 0.013 0.101*** -0.410*** -1.452***(0.285) (0.010) (0.020) (0.106) (0.131)
Kaabong 1.466*** 0.006 0.115*** -0.042 0.299**(0.272) (0.009) (0.019) (0.101) (0.124)
Nakapiripirit 1.641*** -0.015 0.076*** -0.003 -0.848***(0.351) (0.012) (0.025) (0.130) (0.161)
Napak 0.759*** -0.027*** 0.078*** 0.040 0.233*(0.285) (0.010) (0.020) (0.106) (0.131)
Constant 1.065** 0.545*** 0.089*** 1.818*** 1.720***(0.455) (0.016) (0.033) (0.169) (0.208)
Observations 2 380 2 380 2 380 2 380 2 380R-squared 0.219 0.098 0.179 0.188 0.179
The excluded livelihood category is farmer; the excluded district dummies are Kotido and Moroto. Standard errors in parentheses. *** p<0.01, ** p<0.05, * p<0.1
Table A9. OLS regression of shocks on SSN variables
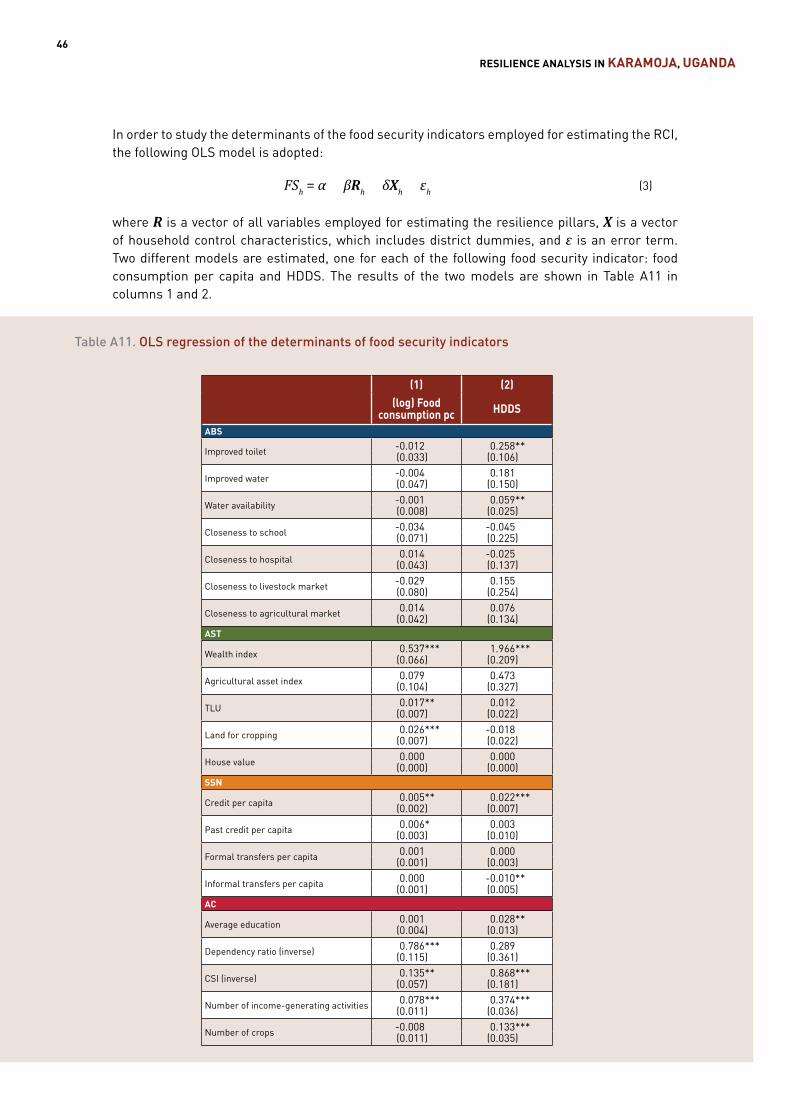
RESILIENCE ANALYSIS IN KARAMOJA, UGANDA46
Table A11. OLS regression of the determinants of food security indicators (cont.)
In order to study the determinants of the food security indicators employed for estimating the RCI, the following OLS model is adopted:
FSh = α + βRh + δXh + εh (3)
where R is a vector of all variables employed for estimating the resilience pillars, X is a vector of household control characteristics, which includes district dummies, and ε is an error term. Two different models are estimated, one for each of the following food security indicator: food consumption per capita and HDDS. The results of the two models are shown in Table A11 in columns 1 and 2.
Table A11. OLS regression of the determinants of food security indicators
(1) (2)(log) Food
consumption pc HDDS
ABS
Improved toilet -0.012 0.258**(0.033) (0.106)
Improved water -0.004 0.181(0.047) (0.150)
Water availability -0.001 0.059**(0.008) (0.025)
Closeness to school -0.034 -0.045(0.071) (0.225)
Closeness to hospital 0.014 -0.025(0.043) (0.137)
Closeness to livestock market -0.029 0.155(0.080) (0.254)
Closeness to agricultural market 0.014 0.076(0.042) (0.134)
AST
Wealth index 0.537*** 1.966***(0.066) (0.209)
Agricultural asset index 0.079 0.473(0.104) (0.327)
TLU 0.017** 0.012(0.007) (0.022)
Land for cropping 0.026*** -0.018(0.007) (0.022)
House value 0.000 0.000(0.000) (0.000)
SSN
Credit per capita 0.005** 0.022***(0.002) (0.007)
Past credit per capita 0.006* 0.003(0.003) (0.010)
Formal transfers per capita 0.001 0.000(0.001) (0.003)
Informal transfers per capita 0.000 -0.010**(0.001) (0.005)
AC
Average education 0.001 0.028**(0.004) (0.013)
Dependency ratio (inverse) 0.786*** 0.289(0.115) (0.361)
CSI (inverse) 0.135** 0.868***(0.057) (0.181)
Number of income-generating activities 0.078*** 0.374***(0.011) (0.036)
Number of crops -0.008 0.133***(0.011) (0.035)
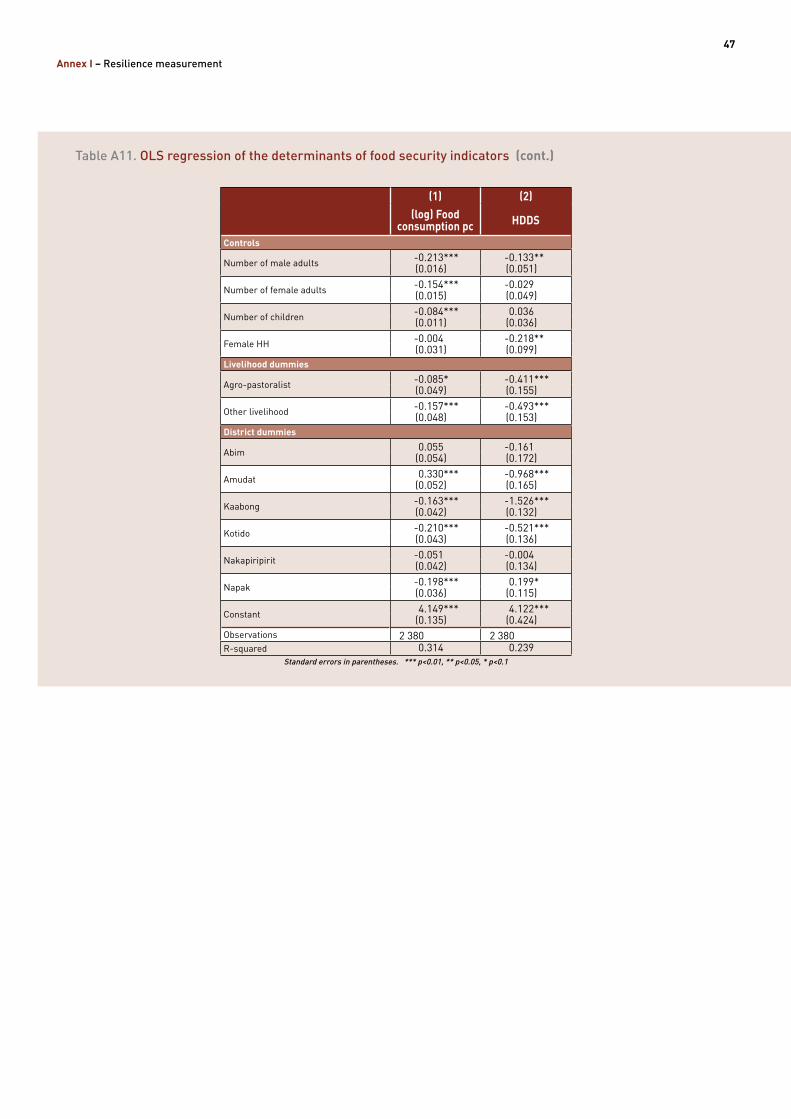
47
Annex I – Resilience measurement
Table A11. OLS regression of the determinants of food security indicators (cont.)
(1) (2)(log) Food
consumption pc HDDS
Controls
Number of male adults -0.213*** -0.133**(0.016) (0.051)
Number of female adults -0.154*** -0.029(0.015) (0.049)
Number of children -0.084*** 0.036(0.011) (0.036)
Female HH -0.004 -0.218**(0.031) (0.099)
Livelihood dummies
Agro-pastoralist -0.085* -0.411***(0.049) (0.155)
Other livelihood -0.157*** -0.493***(0.048) (0.153)
District dummies
Abim 0.055 -0.161(0.054) (0.172)
Amudat 0.330*** -0.968***(0.052) (0.165)
Kaabong -0.163*** -1.526***(0.042) (0.132)
Kotido -0.210*** -0.521***(0.043) (0.136)
Nakapiripirit -0.051 -0.004(0.042) (0.134)
Napak -0.198*** 0.199*(0.036) (0.115)
Constant 4.149*** 4.122***(0.135) (0.424)
Observations 2 380 2 380R-squared 0.314 0.239
Standard errors in parentheses. *** p<0.01, ** p<0.05, * p<0.1
In order to study the determinants of the food security indicators employed for estimating the RCI, the following OLS model is adopted:
FSh = α + βRh + δXh + εh (3)
where R is a vector of all variables employed for estimating the resilience pillars, X is a vector of household control characteristics, which includes district dummies, and ε is an error term. Two different models are estimated, one for each of the following food security indicator: food consumption per capita and HDDS. The results of the two models are shown in Table A11 in columns 1 and 2.
Table A11. OLS regression of the determinants of food security indicators
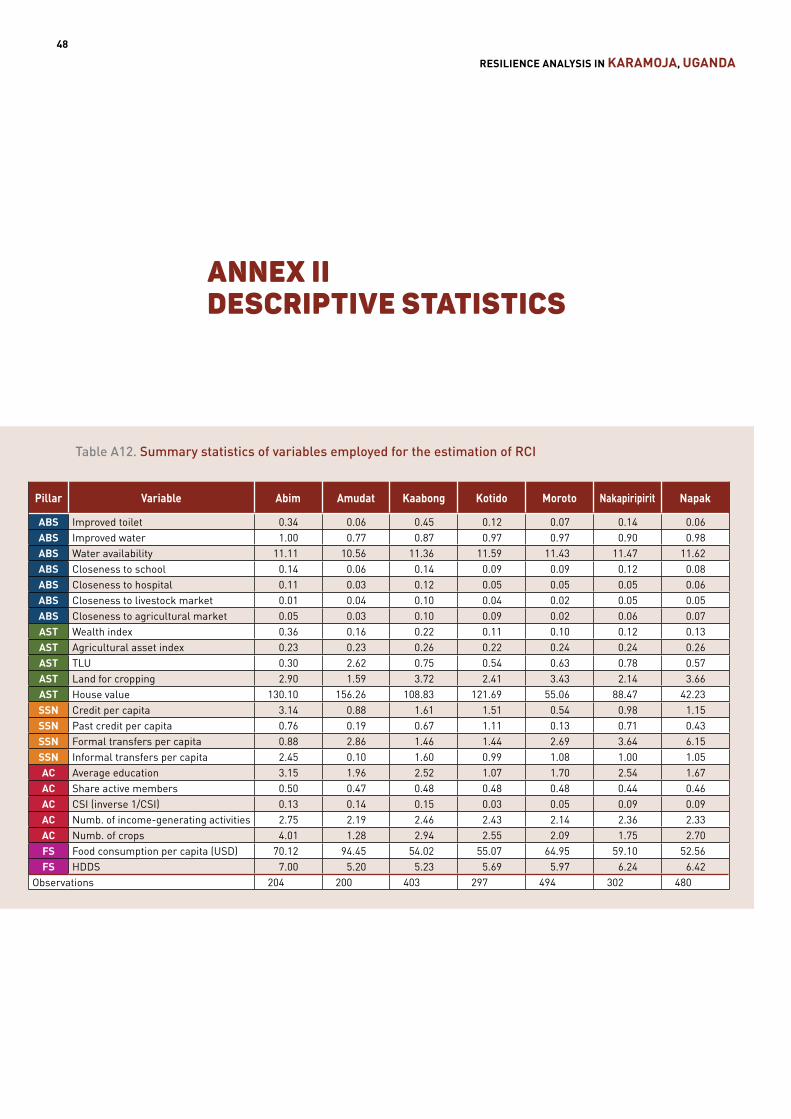
RESILIENCE ANALYSIS IN KARAMOJA, UGANDA48
ANNEX IIDESCRIPTIVE STATISTICS
Table A12. Summary statistics of variables employed for the estimation of RCI
Pillar Variable Abim Amudat Kaabong Kotido Moroto Nakapiripirit Napak
ABS Improved toilet 0.34 0.06 0.45 0.12 0.07 0.14 0.06ABS Improved water 1.00 0.77 0.87 0.97 0.97 0.90 0.98ABS Water availability 11.11 10.56 11.36 11.59 11.43 11.47 11.62ABS Closeness to school 0.14 0.06 0.14 0.09 0.09 0.12 0.08ABS Closeness to hospital 0.11 0.03 0.12 0.05 0.05 0.05 0.06ABS Closeness to livestock market 0.01 0.04 0.10 0.04 0.02 0.05 0.05ABS Closeness to agricultural market 0.05 0.03 0.10 0.09 0.02 0.06 0.07AST Wealth index 0.36 0.16 0.22 0.11 0.10 0.12 0.13AST Agricultural asset index 0.23 0.23 0.26 0.22 0.24 0.24 0.26AST TLU 0.30 2.62 0.75 0.54 0.63 0.78 0.57AST Land for cropping 2.90 1.59 3.72 2.41 3.43 2.14 3.66AST House value 130.10 156.26 108.83 121.69 55.06 88.47 42.23SSN Credit per capita 3.14 0.88 1.61 1.51 0.54 0.98 1.15SSN Past credit per capita 0.76 0.19 0.67 1.11 0.13 0.71 0.43SSN Formal transfers per capita 0.88 2.86 1.46 1.44 2.69 3.64 6.15SSN Informal transfers per capita 2.45 0.10 1.60 0.99 1.08 1.00 1.05AC Average education 3.15 1.96 2.52 1.07 1.70 2.54 1.67AC Share active members 0.50 0.47 0.48 0.48 0.48 0.44 0.46AC CSI (inverse 1/CSI) 0.13 0.14 0.15 0.03 0.05 0.09 0.09AC Numb. of income-generating activities 2.75 2.19 2.46 2.43 2.14 2.36 2.33AC Numb. of crops 4.01 1.28 2.94 2.55 2.09 1.75 2.70FS Food consumption per capita (USD) 70.12 94.45 54.02 55.07 64.95 59.10 52.56FS HDDS 7.00 5.20 5.23 5.69 5.97 6.24 6.42
Observations 204 200 403 297 494 302 480
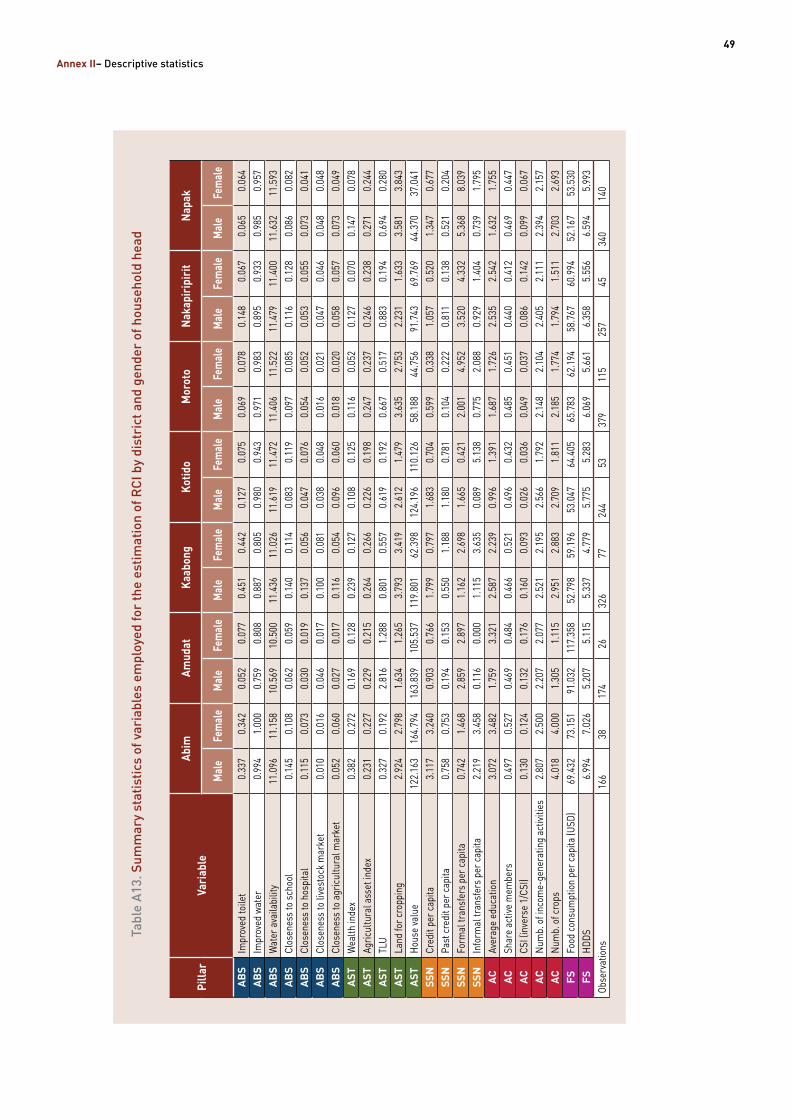
49
Annex II– Descriptive statistics
Tabl
e A1
3. S
umm
ary
stat
istic
s of
var
iabl
es e
mpl
oyed
for
the
estim
atio
n of
RCI
by
dist
rict
and
gen
der
of h
ouse
hold
hea
d
Pilla
rVa
riab
leAb
imAm
udat
Kaab
ong
Kotid
oM
orot
oN
akap
irip
irit
Nap
ak
Mal
eFe
mal
eM
ale
Fem
ale
Mal
eFe
mal
eM
ale
Fem
ale
Mal
eFe
mal
eM
ale
Fem
ale
Mal
eFe
mal
e
ABS
Impr
oved
toile
t0.
337
0.34
20.
052
0.07
70.
451
0.44
20.
127
0.07
50.
069
0.07
80.
148
0.06
70.
065
0.06
4AB
SIm
prov
ed w
ater
0.99
41.
000
0.75
90.
808
0.88
70.
805
0.98
00.
943
0.97
10.
983
0.89
50.
933
0.98
50.
957
ABS
Wat
er a
vaila
bilit
y11
.096
11.1
5810
.569
10.5
0011
.436
11.0
2611
.619
11.4
7211
.406
11.5
2211
.479
11.4
0011
.632
11.5
93AB
SCl
osen
ess t
o sc
hool
0.
145
0.10
80.
062
0.05
90.
140
0.11
40.
083
0.11
90.
097
0.08
50.
116
0.12
80.
086
0.08
2AB
SCl
osen
ess t
o ho
spita
l0.
115
0.07
30.
030
0.01
90.
137
0.05
60.
047
0.07
60.
054
0.05
20.
053
0.05
50.
073
0.04
1AB
SCl
osen
ess t
o liv
esto
ck m
arke
t0.
010
0.01
60.
046
0.01
70.
100
0.08
10.
038
0.04
80.
016
0.02
10.
047
0.04
60.
048
0.04
8AB
SCl
osen
ess t
o ag
ricul
tura
l mar
ket
0.05
20.
060
0.02
70.
017
0.11
60.
054
0.09
60.
060
0.01
80.
020
0.05
80.
057
0.07
30.
049
AST
Wea
lth in
dex
0.38
20.
272
0.16
90.
128
0.23
90.
127
0.10
80.
125
0.11
60.
052
0.12
70.
070
0.14
70.
078
AST
Agric
ultu
ral a
sset
inde
x0.
231
0.22
70.
229
0.21
50.
264
0.26
60.
226
0.19
80.
247
0.23
70.
246
0.23
80.
271
0.24
4AS
TTL
U0.
327
0.19
22.
816
1.28
80.
801
0.55
70.
619
0.19
20.
667
0.51
70.
883
0.19
40.
694
0.28
0AS
TLa
nd fo
r cro
ppin
g 2.
924
2.79
81.
634
1.26
53.
793
3.41
92.
612
1.47
93.
635
2.75
32.
231
1.63
33.
581
3.84
3AS
THo
use
valu
e12
2.16
316
4.79
416
3.83
910
5.53
711
9.80
162
.398
124.
196
110.
126
58.1
8844
.756
91.7
4369
.769
44.3
7037
.041
SSN
Cred
it pe
r cap
ita3.
117
3.24
00.
903
0.76
61.
799
0.79
71.
683
0.70
40.
599
0.33
81.
057
0.52
01.
347
0.67
7SS
NPa
st cr
edit
per c
apita
0.75
80.
753
0.19
40.
153
0.55
01.
188
1.18
00.
781
0.10
40.
222
0.81
10.
138
0.52
10.
204
SSN
Form
al tr
ansf
ers p
er ca
pita
0.74
21.
468
2.85
92.
897
1.16
22.
698
1.66
50.
421
2.00
14.
952
3.52
04.
332
5.36
88.
039
SSN
Info
rmal
tran
sfer
s per
capi
ta2.
219
3.45
80.
116
0.00
01.
115
3.63
50.
089
5.13
80.
775
2.08
80.
929
1.40
40.
739
1.79
5AC
Aver
age
educ
atio
n3.
072
3.48
21.
759
3.32
12.
587
2.23
90.
996
1.39
11.
687
1.72
62.
535
2.54
21.
632
1.75
5AC
Shar
e ac
tive
mem
bers
0.
497
0.52
70.
469
0.48
40.
466
0.52
10.
496
0.43
20.
485
0.45
10.
440
0.41
20.
469
0.44
7AC
CSI (
inve
rse
1/CS
I)0.
130
0.12
40.
132
0.17
60.
160
0.09
30.
026
0.03
60.
049
0.03
70.
086
0.14
20.
099
0.06
7AC
Num
b. o
f inc
ome-
gene
ratin
g ac
tiviti
es2.
807
2.50
02.
207
2.07
72.
521
2.19
52.
566
1.79
22.
148
2.10
42.
405
2.11
12.
394
2.15
7AC
Num
b. o
f cro
ps4.
018
4.00
01.
305
1.11
52.
951
2.88
32.
709
1.81
12.
185
1.77
41.
794
1.51
12.
703
2.69
3FS
Food
cons
umpt
ion
per c
apita
(USD
)69
.432
73.1
5191
.032
117.
358
52.7
9859
.196
53.0
4764
.405
65.7
8362
.194
58.7
6760
.994
52.1
6753
.530
FSHD
DS
6.99
47.
026
5.20
75.
115
5.33
74.
779
5.77
55.
283
6.06
95.
661
6.35
85.
556
6.59
45.
993
Obse
rvat
ions
166
3817
426
326
7724
453
379
115
257
4534
014
0
ANNEX IIDESCRIPTIVE STATISTICS
Table A12. Summary statistics of variables employed for the estimation of RCI
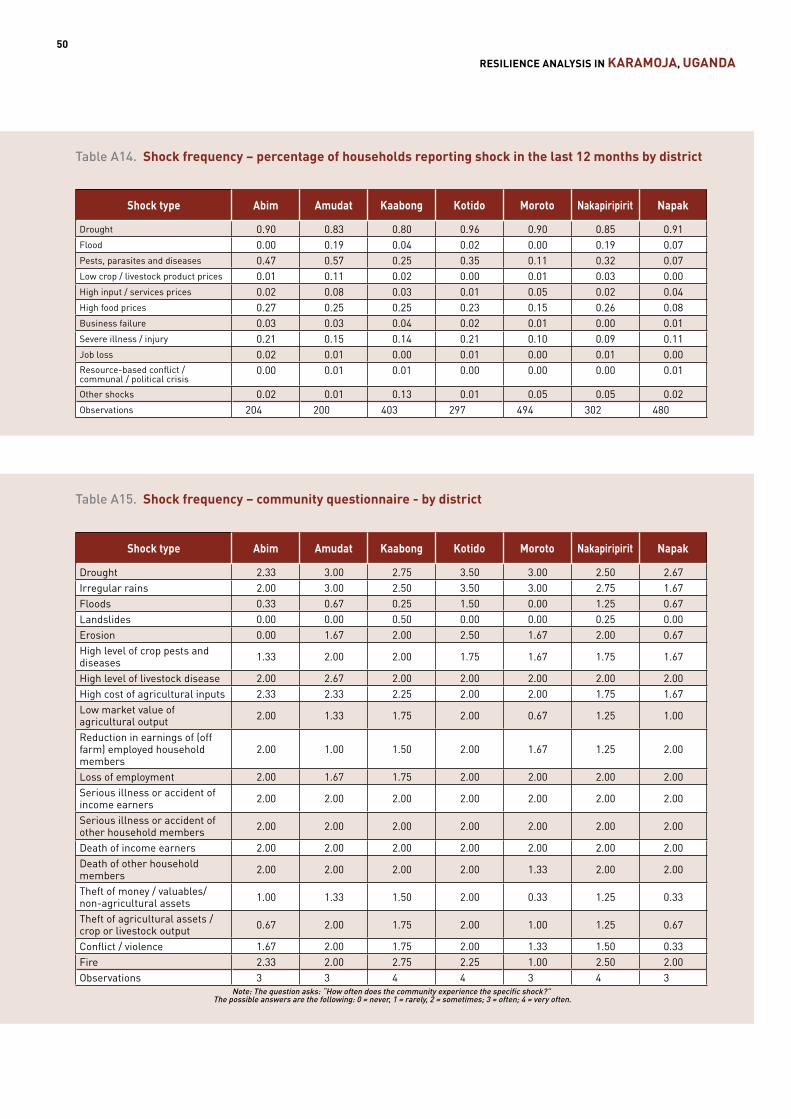
RESILIENCE ANALYSIS IN KARAMOJA, UGANDA50
Table A16. Percentage of household adopting the coping stategies to deal with drought by districtTable A14. Shock frequency – percentage of households reporting shock in the last 12 months by district
Table A15. Shock frequency – community questionnaire - by district
Shock type Abim Amudat Kaabong Kotido Moroto Nakapiripirit Napak
Drought 0.90 0.83 0.80 0.96 0.90 0.85 0.91Flood 0.00 0.19 0.04 0.02 0.00 0.19 0.07Pests, parasites and diseases 0.47 0.57 0.25 0.35 0.11 0.32 0.07Low crop / livestock product prices 0.01 0.11 0.02 0.00 0.01 0.03 0.00High input / services prices 0.02 0.08 0.03 0.01 0.05 0.02 0.04High food prices 0.27 0.25 0.25 0.23 0.15 0.26 0.08Business failure 0.03 0.03 0.04 0.02 0.01 0.00 0.01Severe illness / injury 0.21 0.15 0.14 0.21 0.10 0.09 0.11Job loss 0.02 0.01 0.00 0.01 0.00 0.01 0.00Resource-based conflict / communal / political crisis
0.00 0.01 0.01 0.00 0.00 0.00 0.01
Other shocks 0.02 0.01 0.13 0.01 0.05 0.05 0.02Observations 204 200 403 297 494 302 480
Shock type Abim Amudat Kaabong Kotido Moroto Nakapiripirit Napak
Drought 2.33 3.00 2.75 3.50 3.00 2.50 2.67Irregular rains 2.00 3.00 2.50 3.50 3.00 2.75 1.67Floods 0.33 0.67 0.25 1.50 0.00 1.25 0.67Landslides 0.00 0.00 0.50 0.00 0.00 0.25 0.00Erosion 0.00 1.67 2.00 2.50 1.67 2.00 0.67High level of crop pests and diseases 1.33 2.00 2.00 1.75 1.67 1.75 1.67
High level of livestock disease 2.00 2.67 2.00 2.00 2.00 2.00 2.00High cost of agricultural inputs 2.33 2.33 2.25 2.00 2.00 1.75 1.67Low market value of agricultural output 2.00 1.33 1.75 2.00 0.67 1.25 1.00
Reduction in earnings of (off farm) employed household members
2.00 1.00 1.50 2.00 1.67 1.25 2.00
Loss of employment 2.00 1.67 1.75 2.00 2.00 2.00 2.00Serious illness or accident of income earners 2.00 2.00 2.00 2.00 2.00 2.00 2.00
Serious illness or accident of other household members 2.00 2.00 2.00 2.00 2.00 2.00 2.00
Death of income earners 2.00 2.00 2.00 2.00 2.00 2.00 2.00Death of other household members 2.00 2.00 2.00 2.00 1.33 2.00 2.00
Theft of money / valuables/ non-agricultural assets 1.00 1.33 1.50 2.00 0.33 1.25 0.33
Theft of agricultural assets / crop or livestock output 0.67 2.00 1.75 2.00 1.00 1.25 0.67
Conflict / violence 1.67 2.00 1.75 2.00 1.33 1.50 0.33Fire 2.33 2.00 2.75 2.25 1.00 2.50 2.00Observations 3 3 4 4 3 4 3
Note: The question asks: “How often does the community experience the specific shock?” The possible answers are the following: 0 = never, 1 = rarely, 2 = sometimes; 3 = often; 4 = very often.
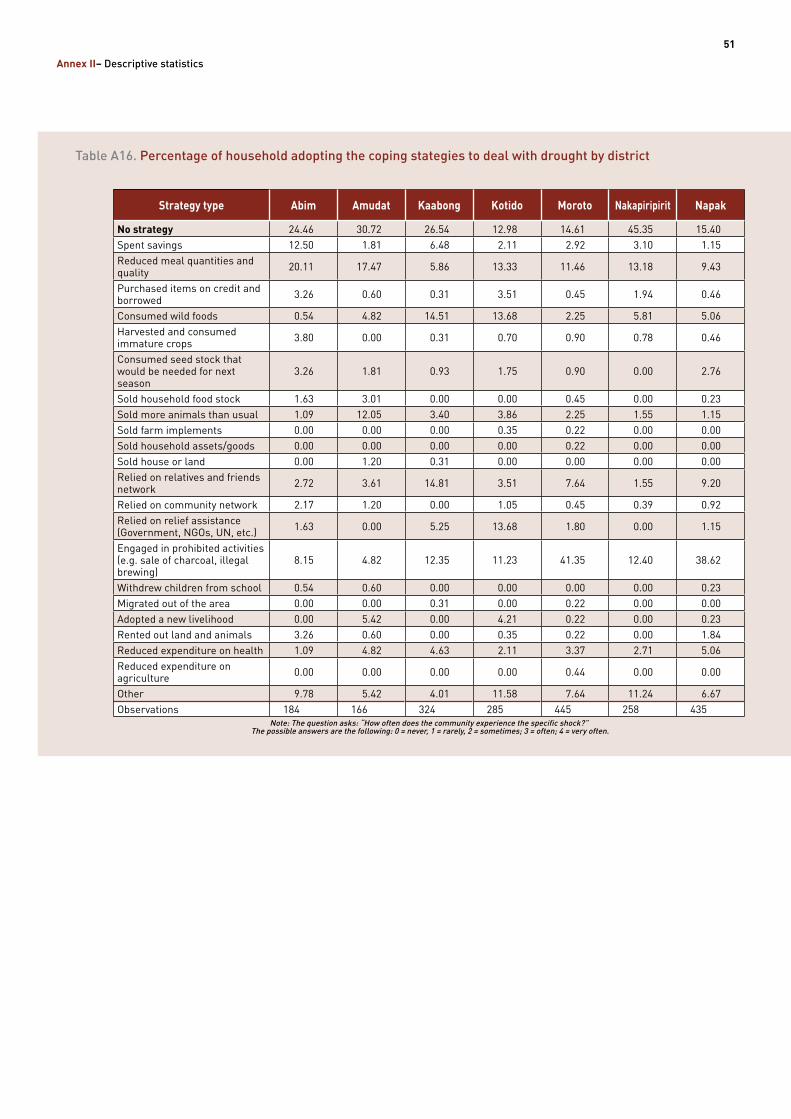
51
Annex II– Descriptive statistics
Table A16. Percentage of household adopting the coping stategies to deal with drought by district
Strategy type Abim Amudat Kaabong Kotido Moroto Nakapiripirit Napak
No strategy 24.46 30.72 26.54 12.98 14.61 45.35 15.40Spent savings 12.50 1.81 6.48 2.11 2.92 3.10 1.15Reduced meal quantities and quality 20.11 17.47 5.86 13.33 11.46 13.18 9.43
Purchased items on credit and borrowed 3.26 0.60 0.31 3.51 0.45 1.94 0.46
Consumed wild foods 0.54 4.82 14.51 13.68 2.25 5.81 5.06Harvested and consumed immature crops 3.80 0.00 0.31 0.70 0.90 0.78 0.46
Consumed seed stock that would be needed for next season
3.26 1.81 0.93 1.75 0.90 0.00 2.76
Sold household food stock 1.63 3.01 0.00 0.00 0.45 0.00 0.23Sold more animals than usual 1.09 12.05 3.40 3.86 2.25 1.55 1.15Sold farm implements 0.00 0.00 0.00 0.35 0.22 0.00 0.00Sold household assets/goods 0.00 0.00 0.00 0.00 0.22 0.00 0.00Sold house or land 0.00 1.20 0.31 0.00 0.00 0.00 0.00Relied on relatives and friends network 2.72 3.61 14.81 3.51 7.64 1.55 9.20
Relied on community network 2.17 1.20 0.00 1.05 0.45 0.39 0.92Relied on relief assistance (Government, NGOs, UN, etc.) 1.63 0.00 5.25 13.68 1.80 0.00 1.15
Engaged in prohibited activities (e.g. sale of charcoal, illegal brewing)
8.15 4.82 12.35 11.23 41.35 12.40 38.62
Withdrew children from school 0.54 0.60 0.00 0.00 0.00 0.00 0.23Migrated out of the area 0.00 0.00 0.31 0.00 0.22 0.00 0.00Adopted a new livelihood 0.00 5.42 0.00 4.21 0.22 0.00 0.23Rented out land and animals 3.26 0.60 0.00 0.35 0.22 0.00 1.84Reduced expenditure on health 1.09 4.82 4.63 2.11 3.37 2.71 5.06Reduced expenditure on agriculture 0.00 0.00 0.00 0.00 0.44 0.00 0.00
Other 9.78 5.42 4.01 11.58 7.64 11.24 6.67Observations 184 166 324 285 445 258 435
Note: The question asks: “How often does the community experience the specific shock?” The possible answers are the following: 0 = never, 1 = rarely, 2 = sometimes; 3 = often; 4 = very often.
Table A14. Shock frequency – percentage of households reporting shock in the last 12 months by district
Table A15. Shock frequency – community questionnaire - by district
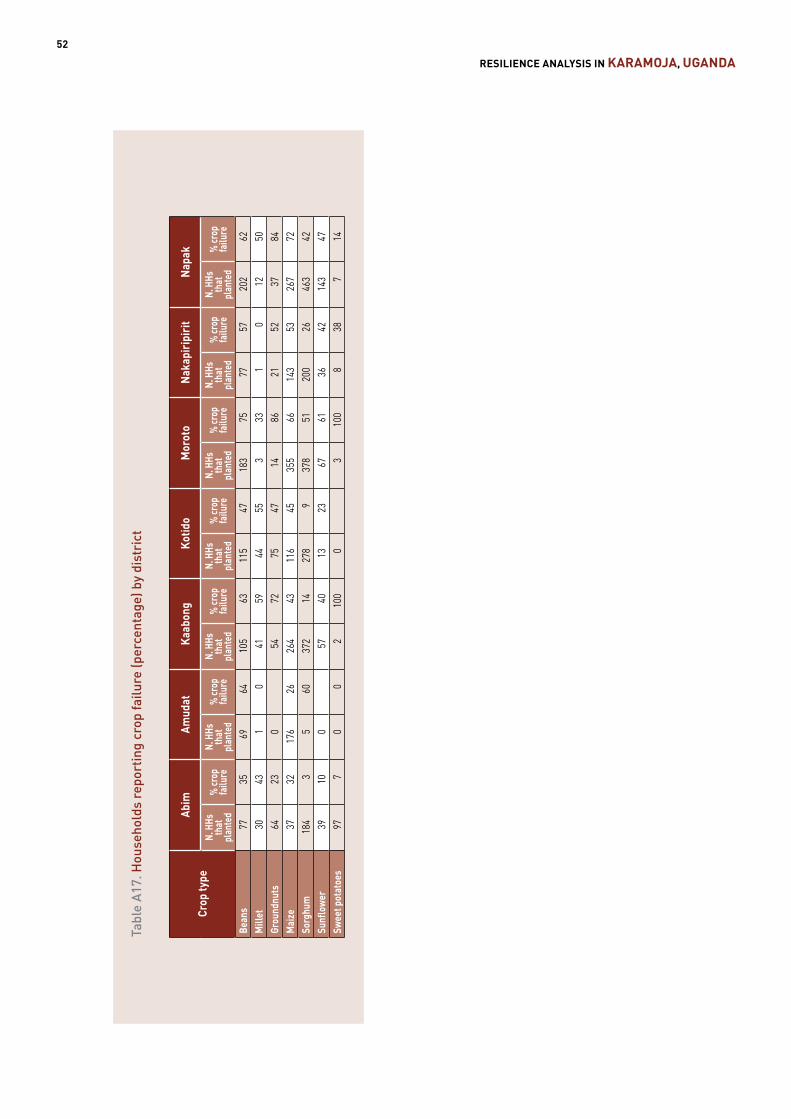
RESILIENCE ANALYSIS IN KARAMOJA, UGANDA52
Table A18. Mean RCI by perceived resilience indicators Ta
ble
A17.
Hou
seho
lds
repo
rtin
g cr
op fa
ilure
(per
cent
age)
by
dist
rict
Crop
type
Abim
Amud
atKa
abon
gKo
tido
Mor
oto
Nak
apir
ipir
itN
apak
N. H
Hs
that
pl
ante
d%
crop
fa
ilure
N. H
Hs
that
pl
ante
d%
crop
fa
ilure
N. H
Hs
that
pl
ante
d%
crop
fa
ilure
N. H
Hs
that
pl
ante
d%
crop
fa
ilure
N. H
Hs
that
pl
ante
d%
crop
fa
ilure
N. H
Hs
that
pl
ante
d%
crop
fa
ilure
N. H
Hs
that
pl
ante
d%
crop
fa
ilure
Bean
s77
3569
6410
563
115
4718
375
7757
202
62M
illet
3043
10
4159
4455
333
10
1250
Grou
ndnu
ts64
230
5472
7547
1486
2152
3784
Mai
ze37
3217
626
264
4311
645
355
6614
353
267
72So
rghu
m18
43
560
372
1427
89
378
5120
026
463
42Su
nflow
er39
100
5740
1323
6761
3642
143
47Sw
eet p
otat
oes
977
00
210
00
310
08
387
14
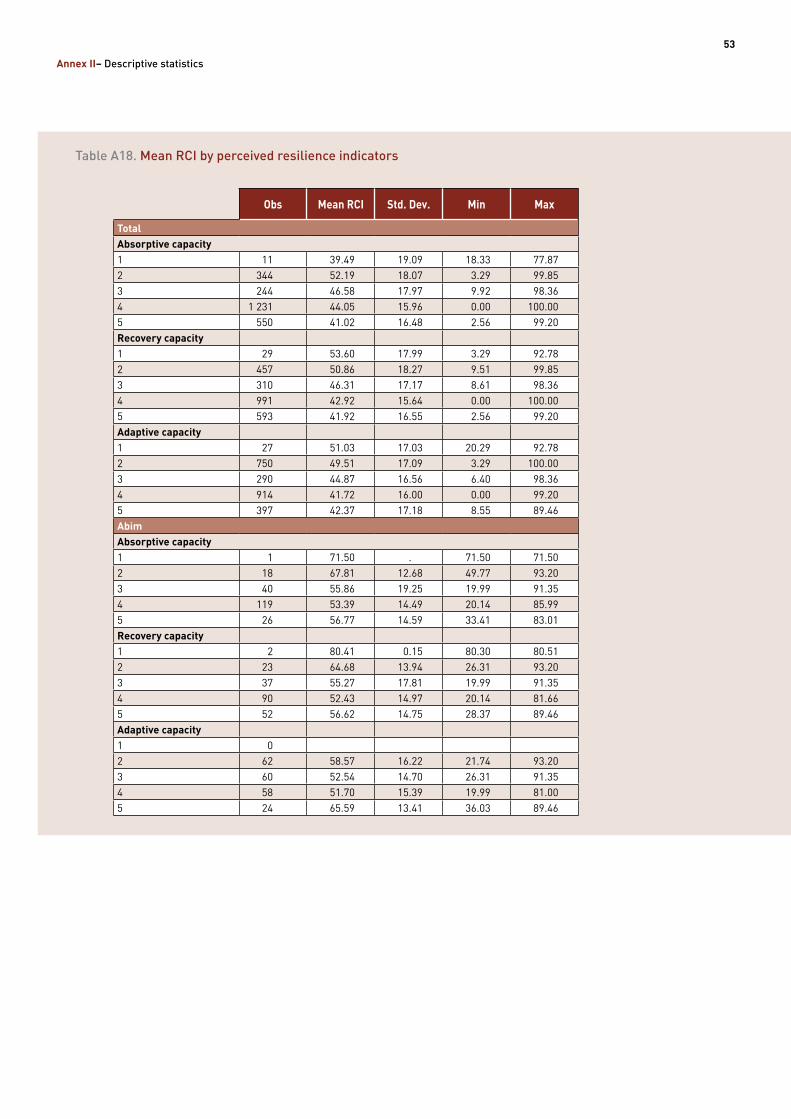
53
Annex II– Descriptive statistics
Table A18. Mean RCI by perceived resilience indicators
Obs Mean RCI Std. Dev. Min Max
TotalAbsorptive capacity1 11 39.49 19.09 18.33 77.872 344 52.19 18.07 3.29 99.853 244 46.58 17.97 9.92 98.364 1 231 44.05 15.96 0.00 100.005 550 41.02 16.48 2.56 99.20Recovery capacity1 29 53.60 17.99 3.29 92.782 457 50.86 18.27 9.51 99.853 310 46.31 17.17 8.61 98.364 991 42.92 15.64 0.00 100.005 593 41.92 16.55 2.56 99.20Adaptive capacity1 27 51.03 17.03 20.29 92.782 750 49.51 17.09 3.29 100.003 290 44.87 16.56 6.40 98.364 914 41.72 16.00 0.00 99.205 397 42.37 17.18 8.55 89.46AbimAbsorptive capacity1 1 71.50 . 71.50 71.502 18 67.81 12.68 49.77 93.203 40 55.86 19.25 19.99 91.354 119 53.39 14.49 20.14 85.995 26 56.77 14.59 33.41 83.01Recovery capacity1 2 80.41 0.15 80.30 80.512 23 64.68 13.94 26.31 93.203 37 55.27 17.81 19.99 91.354 90 52.43 14.97 20.14 81.665 52 56.62 14.75 28.37 89.46Adaptive capacity1 02 62 58.57 16.22 21.74 93.203 60 52.54 14.70 26.31 91.354 58 51.70 15.39 19.99 81.005 24 65.59 13.41 36.03 89.46
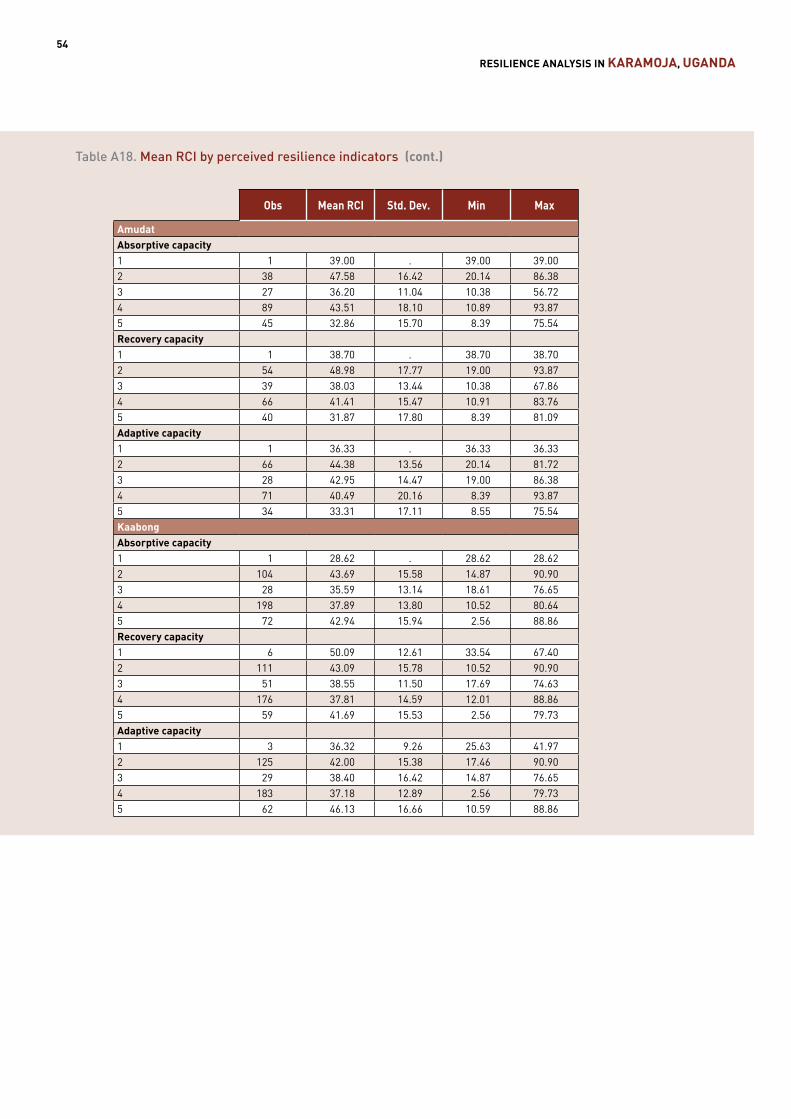
RESILIENCE ANALYSIS IN KARAMOJA, UGANDA54
Table A18. Mean RCI by perceived resilience indicators (cont.)Table A18. Mean RCI by perceived resilience indicators (cont.)
Obs Mean RCI Std. Dev. Min Max
AmudatAbsorptive capacity1 1 39.00 . 39.00 39.002 38 47.58 16.42 20.14 86.383 27 36.20 11.04 10.38 56.724 89 43.51 18.10 10.89 93.875 45 32.86 15.70 8.39 75.54Recovery capacity1 1 38.70 . 38.70 38.702 54 48.98 17.77 19.00 93.873 39 38.03 13.44 10.38 67.864 66 41.41 15.47 10.91 83.765 40 31.87 17.80 8.39 81.09Adaptive capacity1 1 36.33 . 36.33 36.332 66 44.38 13.56 20.14 81.723 28 42.95 14.47 19.00 86.384 71 40.49 20.16 8.39 93.875 34 33.31 17.11 8.55 75.54KaabongAbsorptive capacity1 1 28.62 . 28.62 28.622 104 43.69 15.58 14.87 90.903 28 35.59 13.14 18.61 76.654 198 37.89 13.80 10.52 80.645 72 42.94 15.94 2.56 88.86Recovery capacity1 6 50.09 12.61 33.54 67.402 111 43.09 15.78 10.52 90.903 51 38.55 11.50 17.69 74.634 176 37.81 14.59 12.01 88.865 59 41.69 15.53 2.56 79.73Adaptive capacity1 3 36.32 9.26 25.63 41.972 125 42.00 15.38 17.46 90.903 29 38.40 16.42 14.87 76.654 183 37.18 12.89 2.56 79.735 62 46.13 16.66 10.59 88.86
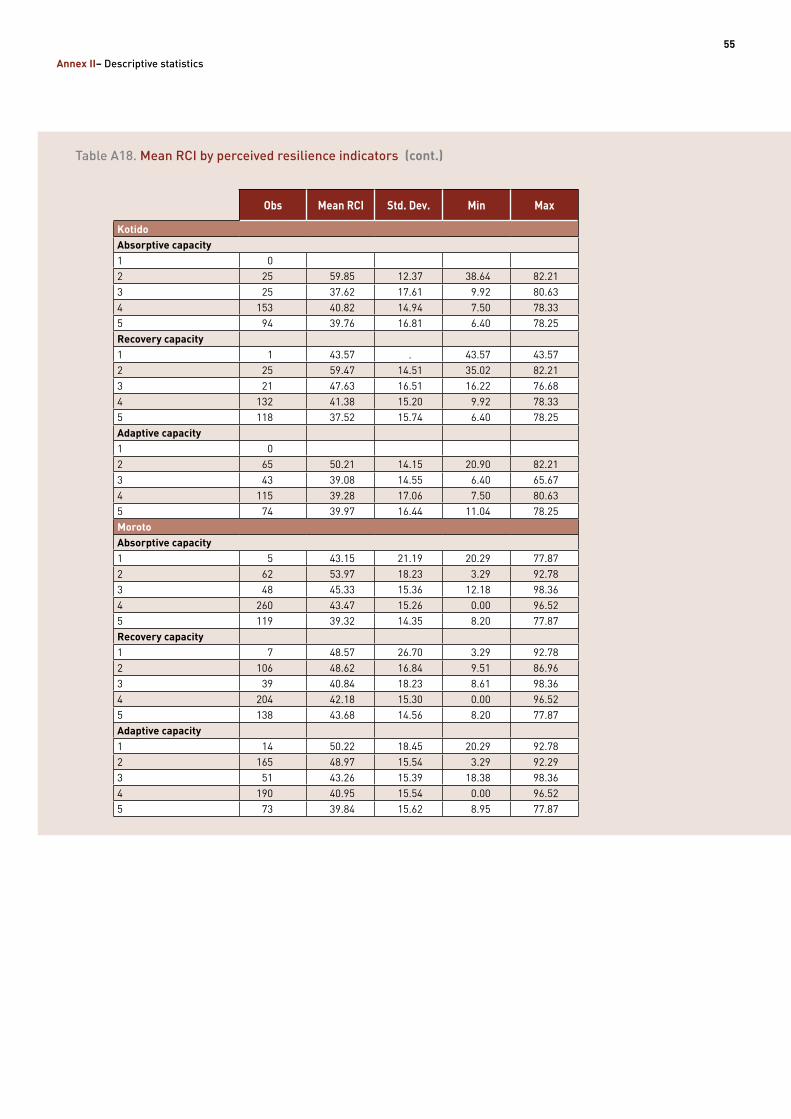
55
Annex II– Descriptive statistics
Table A18. Mean RCI by perceived resilience indicators (cont.)
Obs Mean RCI Std. Dev. Min Max
KotidoAbsorptive capacity1 02 25 59.85 12.37 38.64 82.213 25 37.62 17.61 9.92 80.634 153 40.82 14.94 7.50 78.335 94 39.76 16.81 6.40 78.25Recovery capacity1 1 43.57 . 43.57 43.572 25 59.47 14.51 35.02 82.213 21 47.63 16.51 16.22 76.684 132 41.38 15.20 9.92 78.335 118 37.52 15.74 6.40 78.25Adaptive capacity1 02 65 50.21 14.15 20.90 82.213 43 39.08 14.55 6.40 65.674 115 39.28 17.06 7.50 80.635 74 39.97 16.44 11.04 78.25MorotoAbsorptive capacity1 5 43.15 21.19 20.29 77.872 62 53.97 18.23 3.29 92.783 48 45.33 15.36 12.18 98.364 260 43.47 15.26 0.00 96.525 119 39.32 14.35 8.20 77.87Recovery capacity1 7 48.57 26.70 3.29 92.782 106 48.62 16.84 9.51 86.963 39 40.84 18.23 8.61 98.364 204 42.18 15.30 0.00 96.525 138 43.68 14.56 8.20 77.87Adaptive capacity1 14 50.22 18.45 20.29 92.782 165 48.97 15.54 3.29 92.293 51 43.26 15.39 18.38 98.364 190 40.95 15.54 0.00 96.525 73 39.84 15.62 8.95 77.87
Table A18. Mean RCI by perceived resilience indicators (cont.)
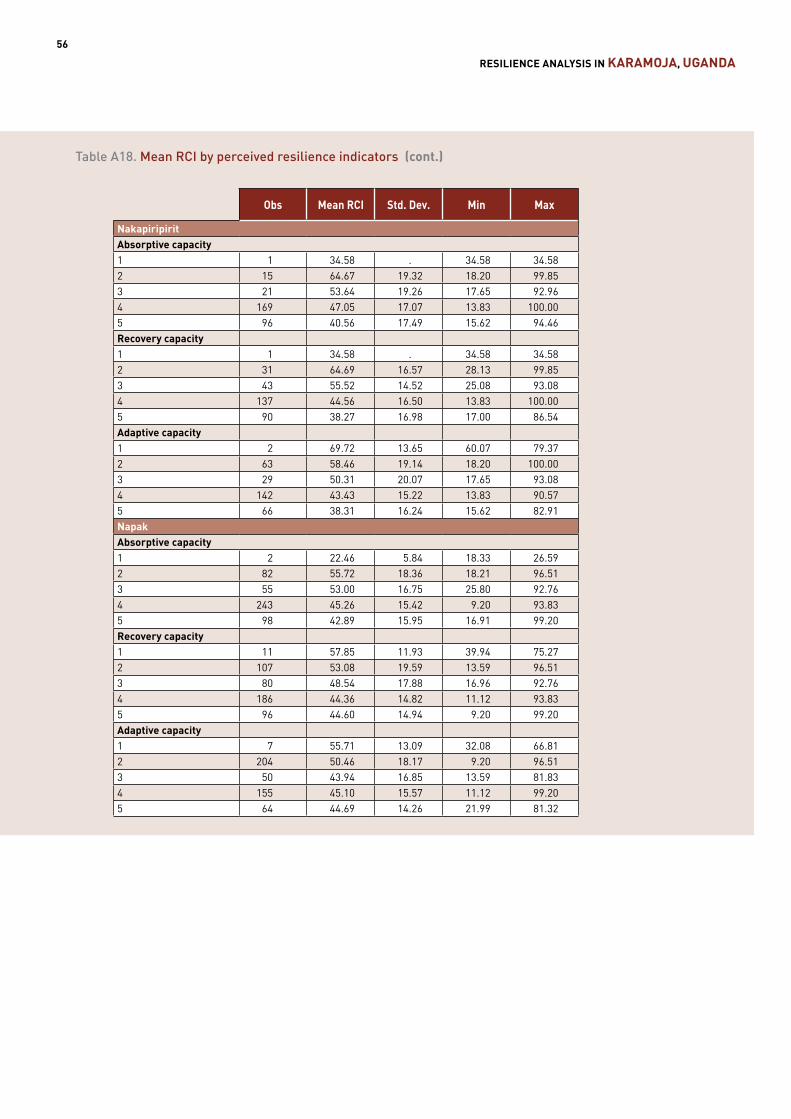
RESILIENCE ANALYSIS IN KARAMOJA, UGANDA56
Table A18. Mean RCI by perceived resilience indicators (cont.)
Obs Mean RCI Std. Dev. Min Max
NakapiripiritAbsorptive capacity1 1 34.58 . 34.58 34.582 15 64.67 19.32 18.20 99.853 21 53.64 19.26 17.65 92.964 169 47.05 17.07 13.83 100.005 96 40.56 17.49 15.62 94.46Recovery capacity1 1 34.58 . 34.58 34.582 31 64.69 16.57 28.13 99.853 43 55.52 14.52 25.08 93.084 137 44.56 16.50 13.83 100.005 90 38.27 16.98 17.00 86.54Adaptive capacity1 2 69.72 13.65 60.07 79.372 63 58.46 19.14 18.20 100.003 29 50.31 20.07 17.65 93.084 142 43.43 15.22 13.83 90.575 66 38.31 16.24 15.62 82.91NapakAbsorptive capacity1 2 22.46 5.84 18.33 26.592 82 55.72 18.36 18.21 96.513 55 53.00 16.75 25.80 92.764 243 45.26 15.42 9.20 93.835 98 42.89 15.95 16.91 99.20Recovery capacity1 11 57.85 11.93 39.94 75.272 107 53.08 19.59 13.59 96.513 80 48.54 17.88 16.96 92.764 186 44.36 14.82 11.12 93.835 96 44.60 14.94 9.20 99.20Adaptive capacity1 7 55.71 13.09 32.08 66.812 204 50.46 18.17 9.20 96.513 50 43.94 16.85 13.59 81.834 155 45.10 15.57 11.12 99.205 64 44.69 14.26 21.99 81.32

Table A18. Mean RCI by perceived resilience indicators (cont.)


Graphic designer: Tomaso Lezzi
This report is part of the impact evaluation of the joint resilience strategy of FAO, UNICEF and WFP in Karamoja, Uganda. It has been prepared under the Resilience Measurement Unit (RMU) through the common effort of the Office of Prime Minister, the Uganda Bureau of Statistics, WFP, UNICEF and FAO.
This analysis aims at providing guidance to policy makers, practitioners, UN agencies, NGO and other stakeholders on resilience, food security, shocks, and vulnerability.
The analysis is largely based on the use of the FAO Resilience Index Measurement and Analysis (RIMA) tool.
Contacts: Luca Russo, FAO Senior Economist - [email protected] Marco d’Errico, FAO Economist - [email protected]
The Food and Agriculture Organization of the United Nations (FAO)would like to thank the European Union for the financial supportwhich made possible the development of this publication.