résistance de p. falciparum au nigeria
TRANSCRIPT

P. falciparum resistance in Nigeria
Christian T. Happi
Malaria in Nigeria: Facts and Figures
• Population:160 millions
• 350,000 Nigerian children under the age of 5 die
of malaria every year [2002 Annual report of the
Federal Ministry of Health (FMOH), Nigeria]
• Drug resistance is a growing problem

Current situation of drug resistant malaria in Nigeria
CLINICAL PROFILES OF CURRENTLY USED ANTIMALARIAL DRUGS IN NIGERIA
• CHLOROQUINE:
– DATE CURE RATE
– 1990 100%
– 1992 85%
– 2003 48%
– 2004 43%
• SULPHADOXINE/PYRIMETHAMINE
– DATE CURE RATE
– 1990 100%
– 1993 93%
– 1997 80%
– 2003 77%
– 2005 73%
• HALOFANTHRINE
– DATE CURE RATES
– 1990 100%
– 1997 87%
• Innate resistance to mefloquine

STUDY SITE/DESIGN AND METHODOLOGY
Study site:
-Malaria Clinic, University
College Hospital
Clinical studies:•Study received ethical approval from the joint UI/UCH and the Harvard Schoo
of Public Health ethical review committee.

Study Design
Patients enrollment
AS-AQ Artemether-Lumefantrine
Samples collectionSamples collection
Nested PCRIn vitro
susceptibility testing
Nested PCR
Msp-2 typing
Pfcrt, Pfmdr1,
Transporters
Msp2 typing
RFLP
Pfmdr1, Pfatpase6, transporter
genes
RFLP
Patient treatment
outcomes
Patient treatment
outcomes
Cloning and
sequencing of
PCR Products
PKPK
In vitro susceptibility
testing

Determination of P. falciparum population structure
and discrimination between recrudescences and re-
infections
• Nested PCR using block 3 of msp-2 gene.
• Resolve secondary products on 1.5% agarose gels stained with ethidium bromide.
• View and photographed on a UV transilluminator.
L D0 D21 D0 D3 D14 D0 D14 D0 D28 D0 D7
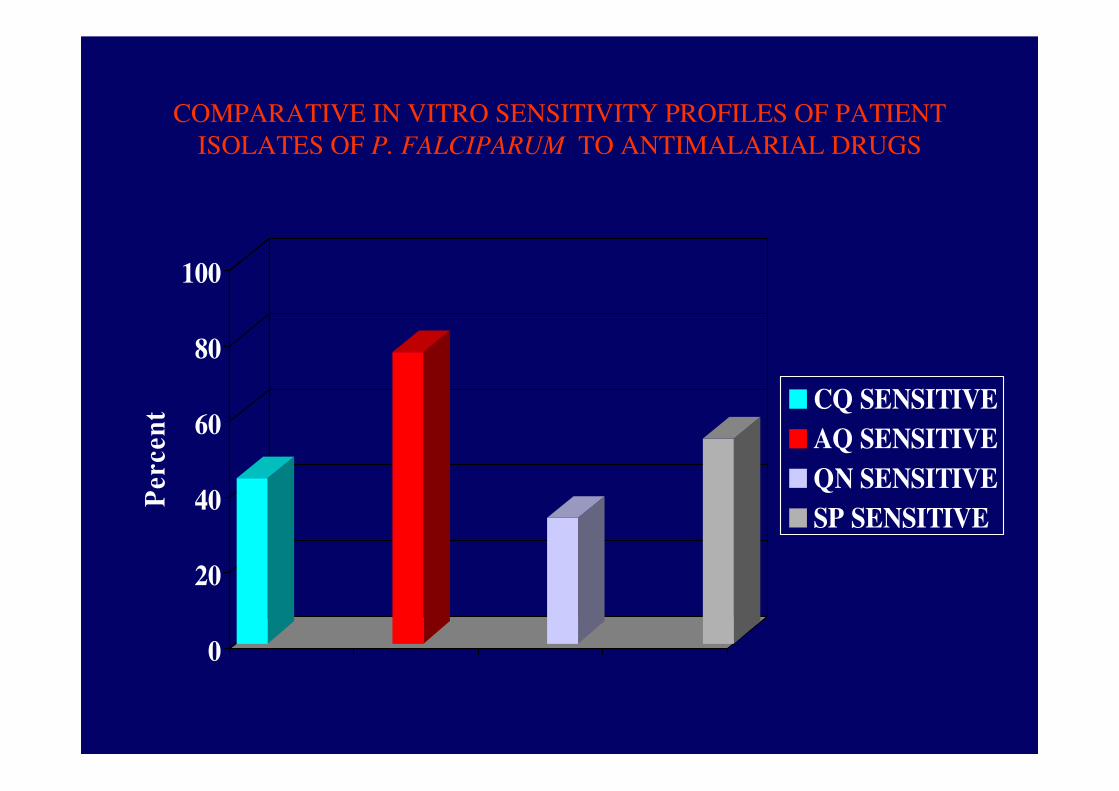
COMPARATIVE IN VITRO SENSITIVITY PROFILES OF PATIENT
ISOLATES OF P. FALCIPARUM TO ANTIMALARIAL DRUGS
0
20
40
60
80
100
Percen
t CQ SENSITIVE
AQ SENSITIVE
QN SENSITIVE
SP SENSITIVE

Association between pfcrt and pfmdr1 alleles and in vivo
CQ resistance
477Number
failed
80%62%49%87%0.00042
2928Number
cured
pfmdr1Y86pfmdr1N86
49 6 Number
failed
73%55%28%89%0.0196
40 16 Number
cured
NPVPPVSpecificitySensitivityP value
pfcrtT76pfcrtK76Treatment
outcome

Genotypes of
pre-treatment
isolates
pfcrt T76 (%) Pfcrt K76 (%) Total
Pfmdr1Y86 26 (47%) 5 (9%) 31
Pfmdr1N86 14 (26%) 10 (18%) 24
Total 40 15 55
Distribution of mutant pfcrt and pfmdr1 alleles among the 55 pre-
treatment isolates harboring a single allele on both loci
χ2= 4.45; p=0.0349.

D’ (95% CI) r2 p
Paired alleles pfcrt T76 pfcrtK76
pfmdr1Y86 26 14
0.64
(0.537-0.753)0.28 0.000
Pfmdr1N86 5 10
Association and linkage disequilibrium between paired single alleles
of pfcrt on Chromosome 7 and pfmdr1 on Chromosome 5.

Selection of mutant pfmdr1Y86 alleles in Nigerian
children by CQ treatment
5322724Total
10343Mixed
Allele
7511Wild-type
N86
3614220Mutant Y86
Recrudescence
Mixed
Allele
Wild-type
N86
Mutant
Y86
Pfmdr1
Codon 86
TotalEnrollment
p=0.006 (Wilcoxon Signed Ranks Test); Z=-2.727 (based on positive Ranks)

Selection of mutant pfcrtT76 alleles in Nigerian
children by CQ treatment
5314633Total
8413Mixed
Allele
2020Wild-type
K76
4310330Mutant T76
Recrudescence
Mixed
Allele
Wild-type
K76
Mutant
T76
pfcrt Codon
76
TotalEnrollment
p=0.040 (Wilcoxon Signed Ranks Test); Z=-2.051 (based on positive Ranks)

COMPARISON OF CLINICAL OUTCOME WITH BLOOD LEVELS OF
CHLOROQUINE AND AREA UNDER CONCENTRATION TIME CURVE (AUC)
AND CLEARANCE
25.2±22.2449.0±379.42.7±1.70.932±0.481.56±0.880.80±0.52LTF(30.2%)
P=0.20
1.8±0.7
3.8±3.0
Mean
Cmax
(ug/ml)
P=0.79P=0.36P=0.28P=0.09P = 0.72
26.21±26.9320.9±195.60.92±0.991.20±0.770.58±0.60ETF(26.8%)
20.03±11.1445.2±213.21.57±1.482.10±1.190.70±0.65ACR (43%)
D7D3D0
Mean
Clearance
(mlday-1kg-1)
x1000
Mean AUC
(ugdayml-1)
Mean Concentration of CQ (ug/ml) Clinical
outcome
(%patients)

Concentration-time curve for patients treated with CQ
0 4 8 120.0
0.5
1.0
1.5
2.0
2.5ACR
ETF
LTF
Day
Concentr
ation (ug/m
l)

0 3 7 14 21 280
250
500
750Blood CQ conc
CQR Gametocytes
0
30
60
90
CQS gametocytes
92% pfcrtT7678% pfmdr1Y86
MEC
Time (days)
[CQ
]b
loo
d
Ga
me
toc
yte
s d
en
sity
/ul b
loo
d
The median in vivo MEC of CQ was 780nM (250ng/ml)[range: 20.7-1400ng/ml] in
blood from patients. Blood CQ concentration on day 7 post-treatment (during peak
gametocytaemia) was above therapeutic concentration (115 -263 ng/ml) in all patients.
Gametocytes Generation, Blood levels of CQ and Molecular Markers
of Chloroquine Resistance

0 3 7 14 21 280
2
4
6 CQR MSP2
CQ blood conc
CQS MSP-2
0
100
200
300
400
500
600
M E C
92% pfcrt T76
78%pfmdr1Y86
Time (days)
Me
an
no
. c
lon
es
pe
r in
fec
tio
n
[CQ
]blo
od (n
g/m
l)
Gametocytes Generation, Blood levels of CQ and Molecular Markers
of Chloroquine Resistance

Association between molecular markers of
SP resistance and patients treatment
outcome.

0
20
40
60
80
100
Pe
rce
nt
Asn-108
Ile-5
1Arg
-59
Gly
-437
Glu
-540
Asn-108
/Ile5
1/Arg
59
Gly
-437
/Glu
540
quintu
ple d
hfr/dhps
muta
nt
Prevalence of dhfr and dhps mutations at enrollment in isolates of Pf
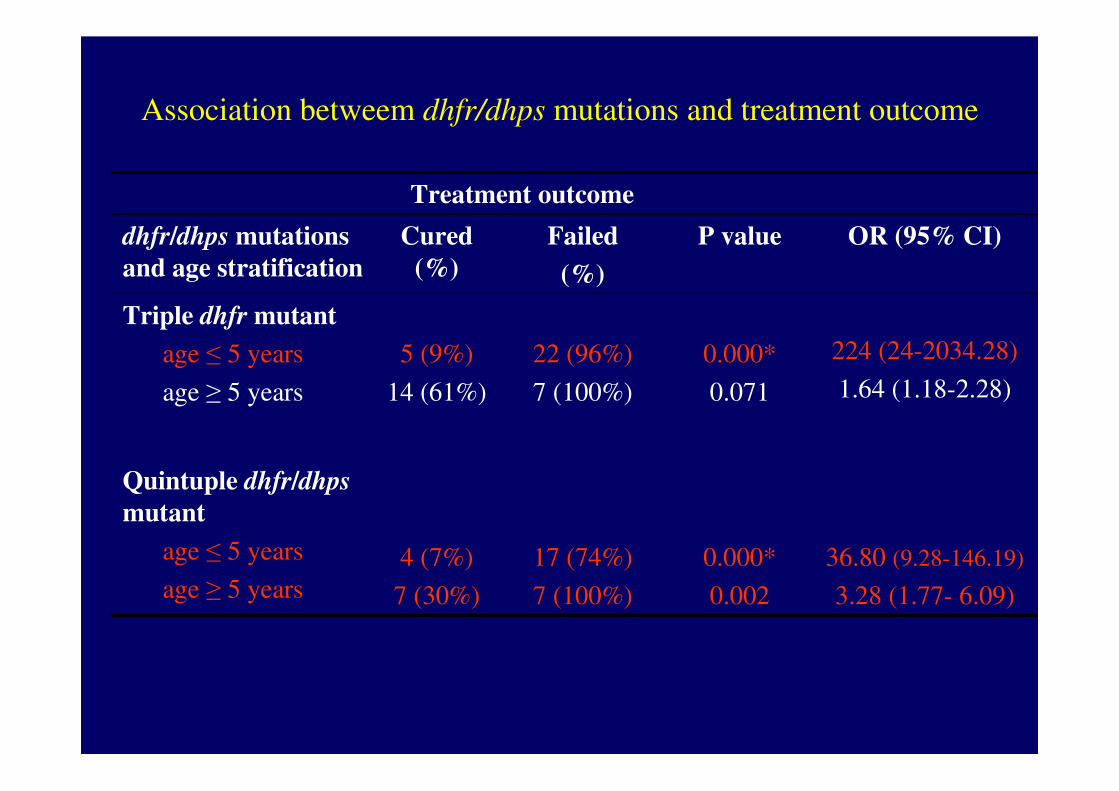
36.80 (9.28-146.19)
3.28 (1.77- 6.09)
0.000*
0.002
17 (74%)
7 (100%)
4 (7%)
7 (30%)
Quintuple dhfr/dhps
mutant
age ≤ 5 years
age ≥ 5 years
224 (24-2034.28)
1.64 (1.18-2.28)
0.000*
0.071
22 (96%)
7 (100%)
5 (9%)
14 (61%)
Triple dhfr mutant
age ≤ 5 years
age ≥ 5 years
OR (95% CI)P valueFailed
(%)
Cured
(%)
dhfr/dhps mutations
and age stratification
Treatment outcome
Association betweem dhfr/dhps mutations and treatment outcome

Genotype failure Index
Based on quintuple mutant
• GFI= 1.07 (29%/27%)

Molecular markers of amodiaquine resistance
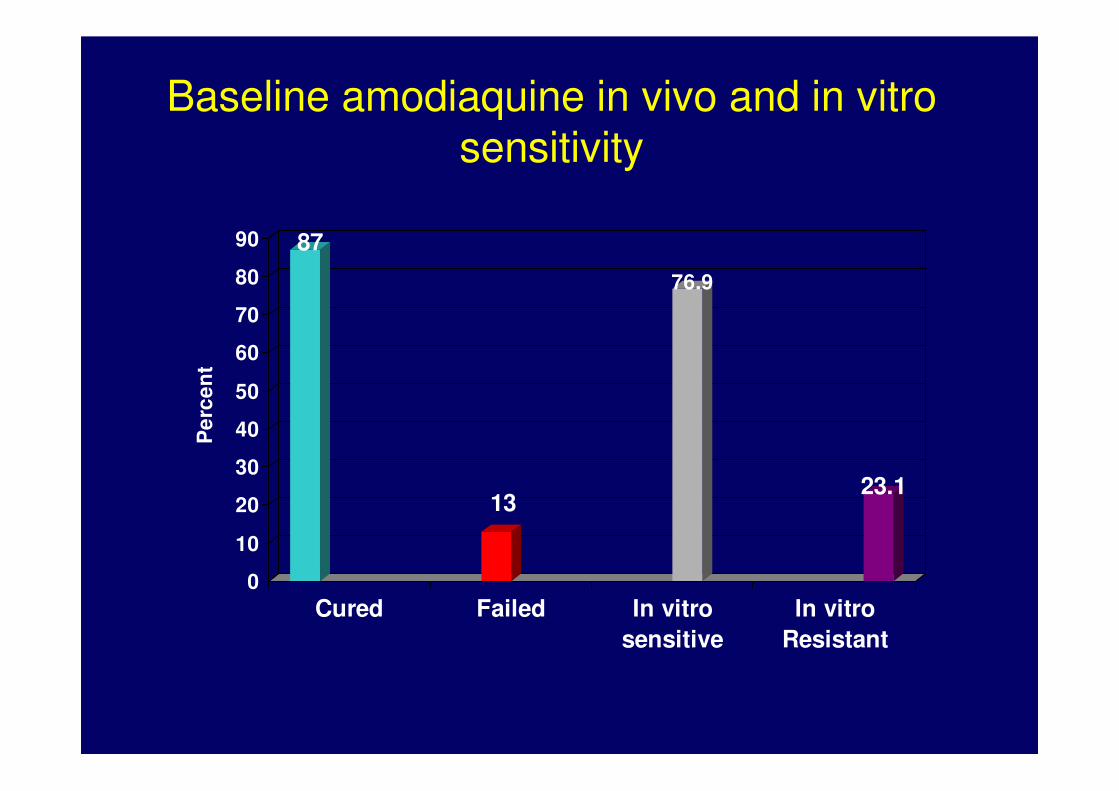
Baseline amodiaquine in vivo and in vitro sensitivity
87
13
76.9
23.1
0
10
20
30
40
50
60
70
80
90
Pe
rce
nt
Cured Failed In vitro
sensitive
In vitro
Resistant

Baseline frequency of pfcrt and pfmdr1 in P.
falciparum from amodiaquine treated patients
49.5
18.28.1 15.2
34.3
22.2
0
25
50
75
T76 K76 K76+T76 Y86 N86 N86+Y86

Treatment outcome (%)
pfcrt/pfmdr1alleles Failed Cured OR (95% CI) p-value
pfcrt
T76a 13/13
(100%)
67/88 (76%)1.31 (1.16-1.47) 0.065
K76b 0/13 (0%) 21/88 (24%)
pfmdr1
Y86c 11/13 (85%) 46/88 (52%)5.022 (1.051-
23.98)0.036‡
N86d 2/13 (15%) 42/88 (48%)
pfmdr1 & pfcrt
pfmdr1Y86+ pfcrtT76 11/13 (85%) 37/88 (42%)7.58 (1.58-36.25) 0.006‡
pfmdr1N86+ pfcrtT76 2/13 (15%) 51/88 (58%)
Association between pfcrt/pfmdr1 mutations in P. falciparum
isolates collected at enrolment and AQ treatment failure.

Prevalence of point mutations in patients
samples (n)
Pfmdr1/pfcrt alleles Baseline Recrudescence χ2 (Chi-square) p-value
Pfmdr1 Codon 86
Wild-type N86 43% (44/101) 8% (1/13) 5.91 0.013*
Mutant Y86 29% (29/101) 84% (11/13) 13.44 0.000246*
Mixed N86+ Y86 28% (28/101) 8% (1/13) 1.49 0.221
pfcrt Codon 76
Wild-type K76 22% (22/101) 0% (0/13) 2.25 0.133
mutant T76 62% (63/101) 92% (12/13) 3.31 0.0671
Mixed K76+T76 16% (16/101) 8% (1/13) 0.13 0.716
Pfmdr1 Codon 86+ pfcrt Codon 76
N86+K76 12% (12/101) 0/% (0/13) 0.70 0.404
Y86+T76 46% (47/101) 92% (12/13) 10.08 0.0015*
Mixed (N86+T76/Y86+K76) 42% (42/101) 8% (1/13) 4.28 0.038*
Selection of mutant pfcrtT76 and pfmdr1Y86 alleles in Nigerian children by amodiaquine treatment

Patients clearing
double mutant
parasites
(n)
Patients not
clearing
double mutant
parasites
(n)
p
value
Mean age in years 6.42±2.57 (37) 3.90±2.57 (11)
0.0017*
Fever 89.2% (33) 45.4% (5)
0.0066*
Mean log of parasites
density
10.25±0.93 9.96±1.180.4
Association between patients’ characteristics and clearance of amodiaquine resistant P. falciparum§ in children from Nigeria

Confirmation of emergence of mutations associated with
Atovaquone/proguanil resistance in unexposed Plasmodium
falciparum isolates from Nigeria.
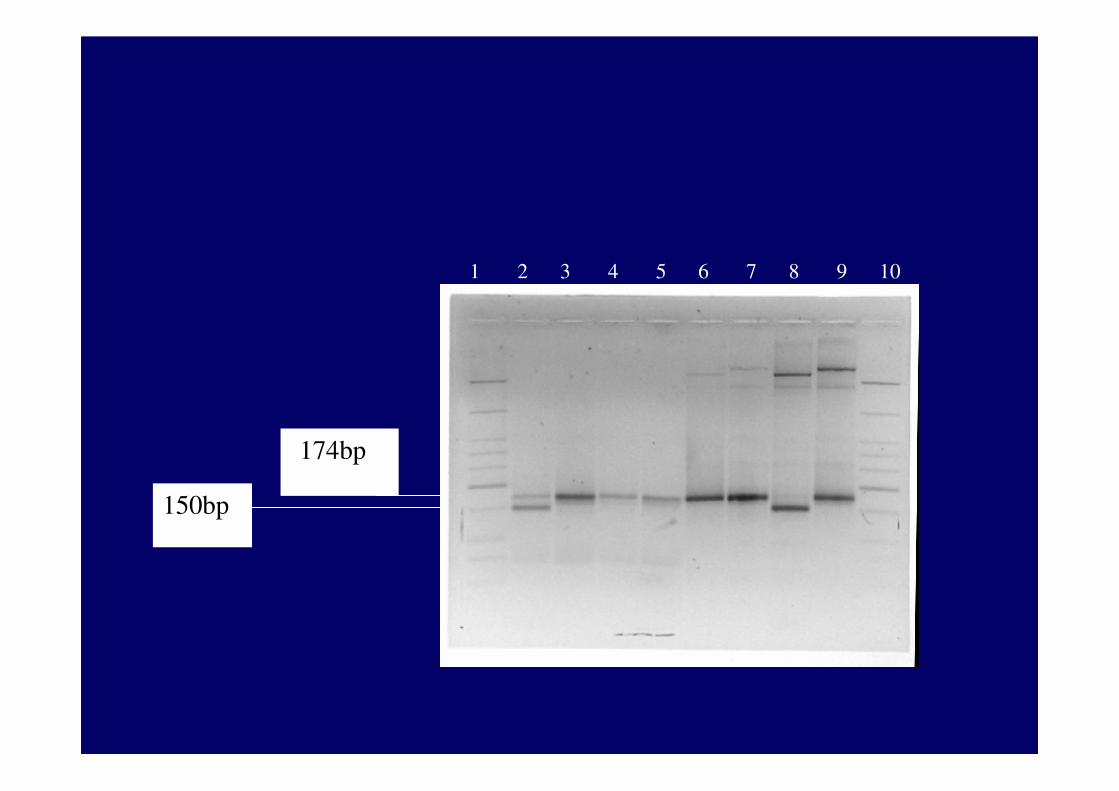
150bp
174bp
1 2 3 4 5 6 7 8 9 10

Cytb011 GYTVSDPTIKRFFVLHFILPFIGLCIVFIHIFFLHLHGSTNPLGYDTALKMPFYPNLL 205Cytb012 GYTVSDXTIKRFFVLHFILPFIGLCIVFIHIFFLHLHGSTNPLGYDTALKIPFYPNLL 205Cytb014 GYTVSDPTIKRFFVLHFILPFIGLCIVFIHIFFLHLHGSTNPLGYDTALKIPFYPNLL 205Cytb023 GYTVSDPTIKRFFVLHFILPFIGLCIVFIHIFFLHLHGSTNPLGYDTALKIPFYPNLL 205Cytb024 GYTVSDPTIKRFFVLHFILPFIGLCIVFIHIFFLHLHGSTNPLGYDTALKIPFYPNLL 205Cytb027 GYTVSDPTIKRFFVLHFILPFIGLCIVFIHIFFLHLHGSTNPLGYDTALKIPFYPNLL 205Cytb028 GYTVSDPTIKRFFVLHFILPFIGLCIVFIHIFFLHLHGSTNPLGYDTALKIPFYPNLL 205Cytb029 GYTVSDPTIKRFFVLHFILPFIGLCIVFIHIFFLHLHGSTNPLGYDTALKIPFYPNLL 205Cytb038 GYTVSDPTIKRFFVLHFILPFIGLCIVFIHIFFLHLHGSTNPLGYDTALKIPFYPNLL 205Cytb041 GYTVSDPTIKRFFVLHFILPFIGLCIVFIHIFFLHLHGSTNPLGYDTALKIPFYPNLL 205Cytb043 GYTVSDPTLKRFFVLHFILPFIGLCIVFIHIFFLHLHGSTNPLGYDTALKIPFYPNLL 205Cytb053 GYTVSDPTLKRFFVLHFILPFIGLCIVFIHIFFLHLHGSTNPLGYDTALKIPFYPNLL 205Cytb053d10 GYTVSDPTIKRFFVLHFILPFIGLCIVFIHIFFLHLHGSTNPLGYDTALKIPFYPNLL 205Cytb057 GYTVSDPTIKRFFVLHFILPFIGLCIVFIHIFFLHLHGSTNPLGYDTALKIPFYPNLL 205Cytb059 GYTVSDPTIKRFFVLHFILPFIGLCIVFIHIFFLHLHGSTNPLGYDTALKIPFYPNLL 205K1F GYTVSDPTIKRFFVLHFILPFIGLCIVFIHIFFLHLHGSTNPLGYDTALKIPFYPNLL 205NGTV01 GYTVSDPTIKRFFVLHFILPFIGLCIVFIHIFFLHLHGSTNPLGYDTALKIPFYPNLL 2053D7 GYTVSDPTIKRFFVLHFILPFIGLCIVFIHIFFLHLHGSTNPLGYDTALKIPFYPNLL 205Cytb011 SLDVKGFNNVIILFLIQSLFGIIPLSHPDNAIVVNTYVTPSQIVPEWYFLPFNNNNAMLKTVPSKPA 280Cytb012 SLDVKGFNNVIILFLIQSLFGIIPLSHPDNAIVVNTYVTPSQIVPEWYFLTFYAMLKTVPSKPA 280Cytb14F SLDVKGFNNVIILFLIQSLFGIIPLSHPDNAIVVNTYVTPSQIVPEWYFLPFYAMLKTVPSKPA 280Cytb023 SLDVKGFNNVIILFLIQSLFGIIPLSHPDNAIVVNTYVTPSQIVPEWYFLPFYAMLKTVPSKPA 280Cytb024 SLDVKGFNNVIILFLTQSLFGIIPLSHPDNAIVVNTYVTPSQIVPEWHFLPFNNNNAMLKTVPSKPA 280Cytb027 SLDVKGFNNVIILFLIQSLFGIIPLSHPDNAIVVNTYVTPSQIVPEWYFLPFNNNNAMLKTVPSKPA 280Cytb028 SLDVKGFNNVIILFLIQSLFGIIPLSHPDNAIVVNTYVTPSQIVPEWYFLPFYAMLKTVPSKPA 280Cytb028 SLDVKGFNNVIILFLIQSLFGIIPLSHPDNAIVVNTYVTPSQIVPEWYFLPFYAMLKTVPSKPA 280Cytb038 SLDVKGFNNVIILFLIQSLFGIIPLSHPDNAIVVNTYVTPSQIVPEWYFLPFNNNNAMLKTVPSKPA 280Cytb041 SLDVKGFNNVIILFLIQSLFGIIPLSHPDNAIVVNTYVTPSQIVPEWYFLPFYAMLKTVPSKPA 280Cytb043 SLDVKGFNNVIILFLIQSLFGIIPLSHPDNAIVVNTYVTPSQIVPEWYFLPFYAMLKTVPSKPA 280Cytb053 SLDVKGFNNVIILFLIQSLFGIIPLSHPDNAIVVNTYVTPSQIVPEWYFLPFYAMLKTVPSKPA 280Cytb053d10 SLDVKGFNNVIILFLIQSLFGIIPLSHPDNAIVVNTYVTPSQIVPEWYFLPFNNNNAMLKTVPSKPA 280Cytb057 SLDVKGFNNVIILFLIQSLFGIIPLSHPDNAIVVNTYVTPSQIVPEWYFLPFYAMLKTVPSKPA 280Cytb059 SLDVKGFNNVIILFLIQSLFGIIPLSHPDNAIVVNTYVTPSQIVPEWYFLPFYAMLKTVPSKPA 280K1F SLDVKGFNNVIILFLIQSLFGIIPLSHPDNAIVVNTYVTPSQIVPEWYFLPFYAMLKTVPSKPA 280NGTV01 SLDVKGFNNVIILFLIQSLFGIIPLSHPDNAIVVNTYVTPSQIVPEWYFLPFNNNNAMLKTVPSKPA 2803D7 SLDVKGFNNVIILFLIQSLFGIIPLSHPDNAIVVNTYVTPSQIVPEWYFLPFYAMLKTVPSKPA 280

Summary (1)•Resistance level of Plasmodium falciparum to Chloroquine or SP is on the increase.
•In vitro results shows concurrent reduced susceptibility to currently available antimalarial drugs including amodiaquine which is the drug to be combined with artesunate in the recently reviewed malaria control policy of Nigeria.
•A significant number of patients had chloroquine in blood samples prior to treatment however this did not appear to influence the response to treatment.
•Preliminary pharmacokinetic data generated appears to show no significant difference in the area under the concentration time curve (AUC) (which is a measure of exposure to drug) and blood levels on day 7 from patients who were cured or who failed chloroquine treatment.
•Mutations in pfcrt and pfmdr1 genes are linkage disequilibrium and this linkage is maintained epistatically through selection by chloroquine

Summary (2)
•Early detection of gametocytes in patients isolates may be a good indicator of parasites resistance to CQ.
•Gametocytes harboring the mutant pfcrt T76 and pfmdr1Y86 alleles may have a relative survival advantage in presence of high plasma concentrations of CQ.
•The dhfr/dhps quintuple mutants is the best predictive marker of S-P resistance
•pfcrtT76 and pfmdr1Y86 appear to be good molecular markers of amodiaquine resistance.
•The detection of atovaquone resistance associated mutations in unexposed populations of P. falciparum in Nigeria is a matter of serious concern
•Data from the project were used to promote evidence-based antimalarial drug policy in Nigeria.
The Way Forward
• Identification of new molecular markers of resistance to
artemisinin derivatives
• Identification of immune determinants of clearance of
Drug resistant parasites

Identification of new molecular markers of resistance to artemisinin
derivatives

Transporters
• G2-PF-A0590w (3),
• G7-PF13-0271 (1),
• G25-PF14-0321 (2)
• G70-PFL0620c ( 1)
• G30-PF14-0292 (1)
• G47-PFE0775c (3),
• G49-PF08-0078 (8),
• G54-PF14-0260 (2)
• G55-PF14-0133 (1)
pfcrt
Pfmdr1 (86, 1042, 1246
• PfATP6

Blood Sample
Total RNAPlasma DNACulture
•Drug Blood Levels
(specific aim 1)
In vitro Susceptibility Test
(specific aim 1)
•P. falciparum population diversity
[MSP2,microsatellites]
•SNPs Transporters genes
(specific aim 2)
•Transporters gene expression
Using both Quantitative RT PCR
and customized microarrays
(specific aim 3)
•Parasite Cloning
(specific aim 3)
•Transporter gene expression
Fresh field isolates vs Lab clones
(specific aim 4)

Preliminary data
• In vitro development of a stable artemisinin
Plasmodium falciparum Resistant Clone (W2-
ART).
- survives a 200ng/ml [artelinic acid] in vitro
-phenotype is stable
-being characterized for SNPs and for whole
genome scan (Real-time QT PCR) and
microarrays

Selection of N86 allele of pfmdr1 by Artemether-
lumefantrine
28.6
71.4
50
21.4 21.4
7.2
0
10
20
30
40
50
60
70
80
N DY Y
D0
Drec/reinf
P=0.01; z=-2.53 Wilcoxon-signed rank test

Selection of F184 allele of pfmdr1 by
Artemether-lumefantrine
78.6
14.3 14.3 14.3
7.1
71.4
0
10
20
30
40
50
60
70
80
Y YF F
D0
Drec/reinf
P=0.003; z=-2.97; Wilcoxon-signed rank test

Selection of D1246 allele of pfmdr1 by Artemether-lumefantrine
71.4
85.7
21.4
0
7.114.3
0
10
20
30
40
50
60
70
80
90
D DY Y
D0
Drec/reinf
P=0.7; Wilcoxon singed ranked