resonance hairpin probe for electronegative plasma...
TRANSCRIPT
Resonance hairpin probe for
electronegative plasma diagnostics
Nishant Sirse
PhD
2013

Resonance hairpin probe for electronegative
plasma diagnostics
A thesis for the degree of
DOCTOR OF PHILOSOPHY
Presented to
The school of physical sciences
Dublin City University
By
Nishant Sirse
Research Supervisors:
Dr. Shantanu Karkari
and
Prof. Miles Turner
External Examiner: Prof. Nicholas St. J. Braithwaite
Internal Examiner: Prof. John Costello
2013

Declaration
I hereby certify that this material which I now submit for assessment on the programme
of study leading to the award of PhD is entirely my own work, that I have exercised
reasonable care to ensure that the work is original, and does not to the best of my
knowledge breach any law of copyright, and has not been taken from the work of others
save and to the extent that such work has been cited and acknowledged within the text
of this work.
Signed:
ID No.: 58103791
Date: 16/01/2013

This thesis is dedicated to my mother for her unconditional love, support and
encouragement.

Abstract
The practical applications of resonance hairpin probe for characterizing electronegative
plasma is investigated. In particular the hairpin probe was operated in a time-resolved
mode for measuring the electron density evolution during pulsed laser photodetachment
of negative ions in an oxygen inductively coupled plasma (ICP) discharge. From the
temporal evolution of the electron density, the negative ion temperature is determined
from the characteristic diffusion time of negative ions in the photodetached channel.
This is compared with an independent method based on the temporal evolution of the
plasma potential during photodetachment measured by a floating emissive probe.
Temporal evolution of negative oxygen ions in a pulsed dc magnetron discharge is also
obtained using pulsed photodetachment and a time-resolved hairpin probe. The results
are found to be in reasonably good agreement with those measured from Langmuir
probe assisted photodetachment.
Two important applications addressed in this thesis are the use of steady state
and pulse biased hairpin probes. For overcoming the limitations arising because of the
finite sheath width around the resonator pins, the hairpin was systematically biased at
strong negative dc potentials (eφ >> kTe) with respect to the plasma. A plot of
resonance frequency verses probe bias is shown to provide a unique value for the
electron density. Comparison of the sheath corrected electron density based on the step
front sheath model and that obtained with a planar Child-Langmuir sheath
approximation, were found to be in good agreement at higher densities (above 1x10¹⁶
m-3
), however small deviations were observed at lower densities (below 3x10¹⁵
m-3
) due
to deviation from a planar sheath assumption. Finally, qualitative measurement of
negative ion parameters is performed by pulse biasing the hairpin probe. Comparison of
the temporal evolution of the electron density before and post application of a negative
pulse bias allows one to obtain both the negative ion density, negative ion temperature,
as well as the positive ion density. The relative measurements of the negative ion
parameters using this technique are found to be in reasonably good agreement with the
hairpin probe assisted laser photodetachment however the absolute measurements are
underestimated by a factor of 10. The discrepancy in the measured absolute negative ion
parameters and the limitations behind this technique are discussed.

Acknowledgements
I would like to express my gratitude to all those who contributed to completion
of this thesis. First of all I would like to acknowledge my supervisors Dr. Shantanu
Karkari and Professor Miles Turner for giving me opportunity to be a research
postgraduate student at the National Centre for Plasma Science and Technology
(NCPST), Dublin City University, Ireland. I especially want to thanks Dr. Shantanu
Karkari for his availability, time to time discussions, planning of work activities and
writing papers, constructive comments and ideas which kept me motivated over the
years of my postgraduate study. I would also like to appreciate for his extra efforts
during the second half of my PhD in which he already started his new job in India, but
agreed to remain my supervisor. I also want to thanks Prof. Miles Turner for his
valuable comments on plasma sheaths.
The research performed in this thesis would not have been possible without the
people who helped me during the experimental work. Therefore I would like to give my
gratitude to Dr. Jim Conway who worked with me during laser photodetachment
experiment, Dr. Cezar Gaman and Mr. Everaldo Gaspar to provide and make me learn
about LabVIEW programmes. I would like to thanks to Mr. James Lalor, Mr. Pat
Wogan, Mr. Des Lavelle, Mr. Conor Murphy and Mr. Ray Murphy for providing
technical support. I am also grateful to the administrative team in the NCPST and
school of physical science, namely Samantha, Sarah, Sheila, Trish, Claire and Lisa and
my colleagues Sean, Nina, Huw, Samir, Zhenning, David and Muhammad. I would also
like to thank Trevor for helping in proofreading the thesis.
I wish to thank Dr. Jean Paul Booth and Dr. Sophie Bouchoule for inviting me to
LPP, Ecole Polytechnique, France and LPN, CNRS, France and for providing financial
assistance during my visit. Also to Prof. James Bradley for his financial support to
invite me to the University of Liverpool, UK and giving me opportunity to work in
magnetron sputtering plasma source and providing Langmuir probe data.
I would like to thank my friends and colleagues Mubarak, Gurusharan and
Sarveshwar for their continuous support during my PhD. Their family members Deepa,
Sanju and Arundhati (wife of shantanu) for inviting me on different occasions and being
like family during my stay in Ireland. I wish to give my love to their kids Bhavya,
Richa, Riya and Rhony for making me smile. I would also like to thanks Yasmina for
her support and helping in starting a new life in France, the phase when I was writing
my thesis along with a new position.
I would like to thanks my family, my parents, Baby and Narayan, my wife,
Rupal and my sisters, Varsha and Ritu for their unconditional love, sacrifice and care. I
love them so much, and I would not have made it this far without them. And last, but by
no means least, my newborn daughter, Vrishti to come in our family with blessings.
The financial support of the Association EURATOM fusion DCU is gratefully
acknowledged.
Nishant Sirse

I
Contents
List of figures V
1 Introduction 1
1.1 General overview of plasmas 4
1.1.1 Fundamental properties of plasmas 6
1.1.2 Plasma discharges 8
1.2 Conventional methods of measuring the electron density 9
1.3 Conventional methods of measuring negative ions 14
1.4 Hairpin probe 16
1.5 Objective and motivation of the thesis 17
1.6 Outline of the thesis 19
2 The Resonance Hairpin Probe 21
2.1 Resonance frequency of the hairpin probe 21
2.1.1 Transmission line model 21
2.1.2 LCR circuit equivalent of a transmission line 23
2.1.3 Effect of hairpin dimension on vacuum frequency 24
2.2 Cold plasma permittivity 25
2.2.1 Plasma response to high frequency electric field 25
2.2.2 Dielectric property of the plasma
(1) Collision-less and (2) Collisional 26
2.3 Electron density measurement from plasma permittivity 28
2.4 Designs of hairpin probe 29
2.4.1 Transmission and Reflection type 30
2.4.2 Floating hairpin probe 30
2.4.3 Electrically biased hairpin probe 32
2.5 Detection of resonance frequency in steady state plasma 33
2.5.1 Schematic of the setup 33
2.5.2 Resonance frequency and its characteristics in vacuum 34
2.6 Dynamical plasma systems and measurement of time-resolved
electron density 35
2.6.1 Dynamical plasma systems 35
2.6.2 Detection of resonance peak in time-resolved mode 35

II
2.6.3 Time-resolved electron density spectrum in a pulsed dc
magnetron discharge 37
3 Sheath effects on electron density measurement by hairpin probe 39
3.1 Motivation 39
3.2 Effective permittivity of the plasma and sheath 40
3.3 Sheath corrections and limitations of present model 45
3.4 Sheath correction by a negative dc biased hairpin probe 47
3.4.1 Basic principle 48
3.4.2 Resonance frequency dependence on the sheath width 49
3.4.3 Experimental setup 50
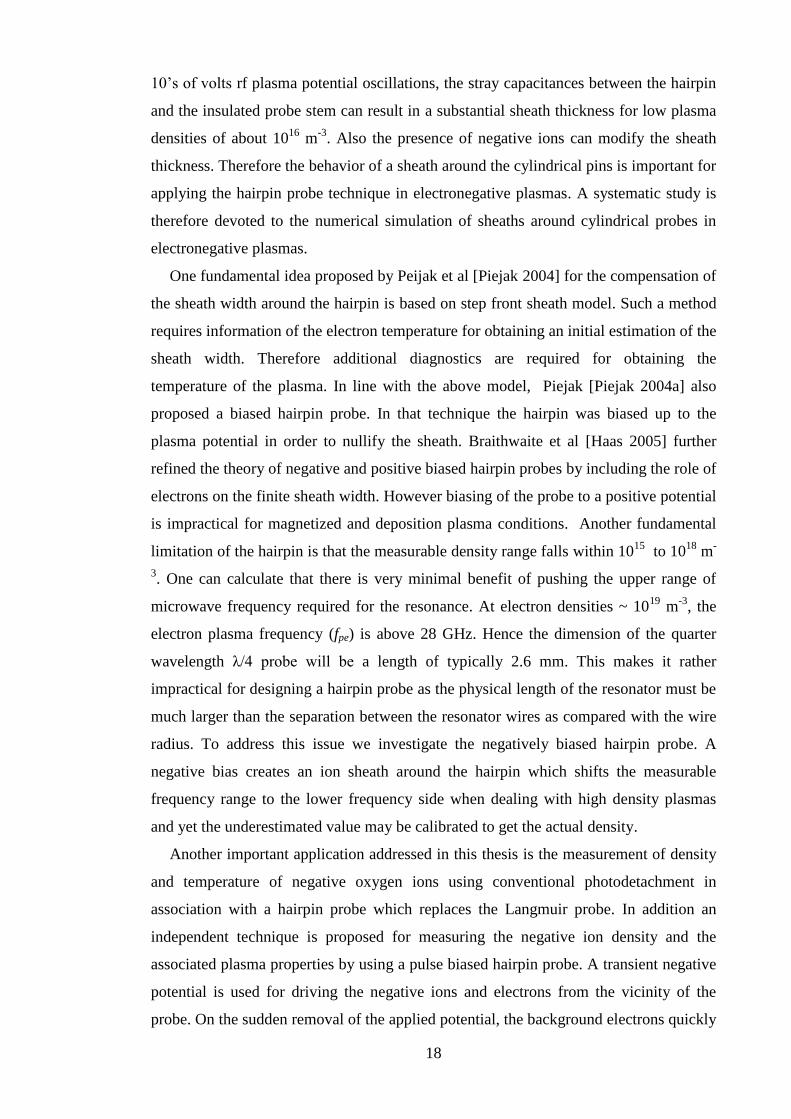
3.5 Results 52
3.6 Discussions 55
3.7 Summary and conclusions 57
4 Theoretical investigation of the sheath around a cylindrical probe in
electronegative plasmas 59
4.1 Motivation and background 59
4.2 Bohm speed in electropositive plasma 61
4.3 Equilibrium properties of sheaths in the presence of negative ions 63
4.3.1 Bohm criterion in the presence of negative ions 63
4.3.2 Basic formulation of the model 65
4.3.3 Boundary Conditions 68
4.3.4 Methods of finding the sheath boundary 68
4.4 Numerical simulation results 69
4.4.1 Sheath potential 70
4.4.2 Sheath width as a function of probe potential 72
4.5 Summary and Conclusions 74
5 Hairpin probe in conjunction with laser photodetachment for
electronegative plasma diagnostic 76
5.1 Introduction 76
5.2 Principle of probe assisted laser photodetachment 77
5.3 Hairpin probe with laser photodetachment 79
5.3.1 Probe alignment and laser 79

III
5.3.2 Photodetachment signal along the illuminated region 80
5.3.3 Off-line of sight response 82
5.3.4 Tuning of the laser intensity and calibration technique 83
5.4 Negative ion density in oxygen ICP discharge 86
5.4.1 Experimental setup 86
5.4.2 Electronegativity as a function of applied power and pressure 87
5.4.3 Summary and Conclusions 91
5.5 Time resolved negative ion density: Comparison between the Hairpin
probe and Langmuir probe assisted photodetachment 92
5.5.1 Description of the experimental setup 92
5.5.2 Experimental results 94
5.5.3 Summary and conclusions 97
5.6 Measurement of negative ion temperature 97
5.6.1 Underlying concept 98
5.6.2 Measurement of plasma potential by an emissive probe 99
5.6.3 Experimental setup for the emissive probe 100
5.6.4 Experimental results: Space potential variation data 101
5.6.5 Discussion of various features and time scales 102
5.6.6 Estimation of the negative ion temperature from the space
potential evolution 104
5.6.7 Negative ion temperature:
Space potential verses density evolution 104
5.7 Summary and conclusions 107
6 Stimulated hairpin probe for electronegative plasma diagnostic 109
6.1 Basic principle 109
6.2 Experimental setup 111
6.3 Results and discussions 112
6.4 Summary and conclusions 117
7 Summary, conclusions and future prospects 119
7.1 Summary and conclusions 119
7.2 Future prospects 121
Bibliography 123

IV
Publications 128

V
List of figures
1.1 Application of plasma processing in several industries. 1
1.2 A typical Langmuir probe characteristic curve. 10
1.3 Resonance signal of a hairpin probe in vacuum and in plasma. 13
1.4 Schematic of the microwave resonator probe by Stenzel. 16
2.1 Transmission line equivalent of hairpin and the front view of electric and
magnetic field-lines in a transmission line. 22
2.2 Equivalent electric circuit of the hairpin with distributed electrical elements. 23
2.3 Experimental and theoretical plot of resonance frequency in vacuum, fo,
as a function of the length, L, of the resonator pins. 24
2.4 Frequency dependence of plasma permittivity. 27
2.5 Schematic diagram of a transmission type hairpin probe. 30
2.6 Schematic diagram of a reflection type hairpin probe. 30
2.7 Schematic diagram of a floating hairpin probe. 31
2.8 Schematic diagram of an electrically biased hairpin probe. 32
2.9 Electrically biased hairpin probe in Sentech SI 500 triple planar
spiral antenna ICP etch system. 33
2.10 Schematic of floating hairpin resonance probe and the circuit
for detecting the resonance peak. 34
2.11 Amplitude of reflected signal in vacuum and in plasma for a sweep of frequency.
34
2.12 Amplitude of reflected signals at different frequencies and
time varying electron density vs time. 36
2.13 a) Spatio-temporal evolution b) temporal evolution of electron density in a
pulsed dc magnetron discharge. 38
3.1 Schematic of the side view and the front view of the hairpin limbs with wire
radius a, width 2h and sheath radius b. 41
3.2 Correction factor due to the sheath as a function of the electron density
estimated by the Piejak formulation [Piejak 2004] and the modified formulation.
The electron temperature is 3eV, wire radius is 0.125mm and the hairpin probe
length and width are 30mm and 3mm respectively. 43
3.3 Correction factor due to sheath as a function of electron density estimated by
modified formulation for different widths of the hairpin probe. The electron
temperature is 3eV, wire radius is 0.125mm and the hairpin probe length is
30mm. 44

VI
3.4 Correction factor due to the sheath as a function of electron density estimated by
the modified formulation for different values of electron temperature. Wire
radius is 0.125mm and hairpin probe length and width are 30mm and 3mm
respectively. 45
3.5 Plot of ratio of sheath radii to probe radii as a function of probe radii to Debye
length from the step front sheath model. 46
3.6 Plot of the resonance frequency of a hairpin as a function of the sheath width for
various electron densities. 49
3.7 Amplitude of reflected signal vs frequency with and without bias. 50
3.8 Top view of the ICP reactor with the hairpin probe and its measurement circuit
and Langmuir probe connected. 51
3.9 Measured Current as a function of the probe bias for various rf powers. The
pressure is kept constant at 10 mTorr. 51
3.10 Measured resonance frequency as a function of probe bias for various rf powers
at 10 mTorr operating pressure. 53
3.11 Sheath width estimated by the Child-Langmuir sheath model as a function of
probe bias for various rf power at 10 mTorr operating pressure. 53
3.12 Plot of resonance frequency as a function of sheath width from theory (line) and
experiments (Dots: square-50W, circle-40W). 54
3.13 Plot of sheath corrected and sheath uncorrected electron density as a function of
probe bias corresponding to 40W ICP power and 10 mTorr gas pressure. 55
3.14 Uncorrected and corrected electron density by the step front sheath correction
and negative dc bias hairpin probe (w~4mm) in an argon plasma as a function of
rf power at 10 mTorr operating pressure. 55
4.1 Spatial profile of the electric potential and charged particles densities in the
plasma, presheath and sheath region. 61
4.2 Plot of the sheath edge potential as a function of the electronegativity (0)
[Braithwaite 1988]. 64
4.3 Normalized potential and its curvature as a function of the normalized distance
from the probe surface (for a=10, q=0 and β=0). 69
4.4 Effect of the integration length ξ on the probe potential (a) Parameters: γ=10,
q=0, β=0 and a=10 (b) α=0.5, γ=10, β=0 and q=0. 70
4.5 Plot of the spatial profile of the normalized sheath potential for different For
these calculations we have chosen q=0, a=5 and =0. 71

VII
4.6 Plot of the spatial profile of the normalized sheath potential for different values
of the normalized positive ion current a
4.7 Plot of the spatial profile of the normalized sheath potential for different values
of
4.8 Plots showing the comparison of the normalized sheath width obtained for two
different values of using the curvature criterion. 73
4.9 Theoretical IV characteristic curves for different values of ξp ,α and γ parameters
for β=0, γ=10, ξp =5. 74
5.1 Typical photodetachment signal recorded by a cylindrical Langmuir probe at the
axis of the laser beam [Devynck 1989]. 78
5.2 A schematic diagram of the hairpin probe and laser. 79
5.3 The hairpin probe signals on the axis of the laser beam following
photodetachment of oxygen negative ions at t = 0 shown by the trigger pulse
applied for firing the laser. The laser flux is kept constant at a value of 2000
J/m2. 81
5.4 Hairpin signals recorded outside the laser beam (~4mm from the axis of the laser
beam) as the probe is tuned to the plasma electron density following
photodetachment of oxygen negative ions. The laser flux is kept constant at a
value of 2000 J/m2. 82
5.5 Plot of photodetachment fraction as a function of laser energy density with the
probe placed inside the laser beam. The operating conditions of the plasma are
30 mTorr and 200 W rf power. 83
5.6 Hairpin probe data recorded at various positions moving from the beam centre
outwards. The operating conditions of the plasma are 30 mTorr and 200 W rf
power. 84
5.7 Plot of photodetachment fraction as a function of laser energy density with the
probe placed outside the laser beam. The operating conditions of the plasma are
30 mTorr and 200 W rf power 85
5.8 Schematic diagram of the experimental setup (top view) to detect the negative
ion density using laser photodetachment with a floating hairpin probe. M1 and
M2 - steering mirrors, G.P - glass plate. 86
5.9 Variation in electron density verses rf power (on beam) in an oxygen plasma
operating at 30 mTorr and 200 sccm. 89
5.10 Variation in negative ion density verses rf power (on beam) in an oxygen plasma
operating at 30 mTorr and 200 sccm. 89

VIII
5.11 Plot of ratio of the negative ion density to electron density verses rf power (on-
beam) in an oxygen plasma operating at 30 mTorr and 200 sccm. 89
5.12 Plot of (a) absolute total negative ion density (right abscissa) and, electron
density (left abscissa) and (b) = (n-/ne) verses total pressure. The inductive
radio frequency power was set at 200 W. 90
5.13 Magnetron sputtering and photodetachment systems for resonance hairpin probe
(RHP) assisted photodetachment. For the Langmuir probe (LP) measurements,
the microwave source and acquisition unit are replaced with the detection and
acquisition circuitry described in reference [You, 2010]. 92
5.14 Magnetic field configuration relative to the cathode target position (0 mm). The
laser-beam line-of-sight and position of the RHP tips at 100 mm from the target
are shown. 93
5.15 Negative ion (n-) and native electron (ne) densities for times during the pulse (10
KHz frequency) measured by both the RHP and LP at 100 mm from the target.
95
5.16 Negative ion-to-native electron density ratio =n-/ne measured by both the RHP
and LP techniques at 100 mm from the target. 96
5.17 Temporal evolution of electron density at the centre of the laser beam measured
using the hairpin during laser photodetachment. 98
5.18 Schematic of the construction of the emissive probe and its electronic circuit.
101
5.19 Temporal evolution of the change in plasma potential during pulsed laser photo
detachment at different operating pressures. Laser energy density is set to 2000
J/m2 at 532 nm. The rf power for this experiment is set to be 200 W. 102
5.20 Comparison of the temporal evolution of the change in plasma potential and
electron density during pulsed laser photo detachment of negative ions. The
laser energy density is set to 200 J/m2 at 532 nm. The rf power for this
experiment is set to 200 W at 25 mTorr operating pressure. The laser is injected
at time t = 0 s. 103
5.21 Plot of the thermal speed of negative ions obtained by the electron density and
the plasma potential evolution verses operating pressure. The laser energy
density is set to 2000 J/m2 at 532 nm. The rf power for this experiment is set to
be 200 W. 105

IX
5.22 Plot of (a) the negative ion temperature (O-) (b) the electron temperature verses
operating pressure. Laser energy density is set to 2000 J/m2 at 532 nm. The rf
power for this experiment is set to 200 W. 106
5.23 Plot of the maximum change in the plasma potential and electronegativity verses
operating pressure. Laser energy density is set to 2000 J/m2 at 532 nm. The rf
power for this experiment is set to 200 W. 107
6.1 Pulsed voltage signal and the expected change in the electron density during
each phase of the pulse applied to the hairpin probe. 110
6.2 Time resolved resonance frequency of the hairpin probe during an applied
negative pulse voltage in oxygen plasmas. Pulsed voltage applied to the hairpin
probe is -80 volts with a frequency of 1 KHz. 113
6.3 Time resolved electron density in argon and oxygen plasmas. Pulsed voltage
applied to the hairpin probe is -80 Volts having a frequency of 1 KHz. Operating
conditions for O2 plasma and Ar plasma are 35mT/400W and 35mT/200W
respectively. 114
6.4 Time resolved electron density in argon and oxygen plasmas. Pulsed voltage
applied to hairpin probe is -80 Volts having a frequency of 1 KHz. Operating
conditions for the O2 plasma and Ar plasma are 30mT/300W and 30mT/100W
respectively. 114
6.5 Negative ion density measured by pulse biased hairpin probe and hairpin probe
assisted laser photodetachment as a function of ICP power in O2 plasma
operating at 30mT. Pulsed voltage applied to the hairpin probe is -80 Volts with
a frequency of 1 KHz. 115

1
Chapter1
Introduction
Plasma assisted technologies have established themselves in all areas of
industry, with new applications constantly evolving. Foremost among these industries is
the electronic industry where plasma processing is indispensible for manufacturing very
large-scale integrated microelectronic circuits. Besides plasma processing is an
important technology used in wide range of applications such as the aerospace,
automotive, steel, biomedical and toxic waste management industries (figure 1.1).
Figure 1.1: Application of plasma processing in several industries.
Electronic industries are fuelled by the semiconductor industry in which billions of
transistors are accumulated in very small areas (~few mm2) using plasma processing to
make a microelectronic integrated circuit or a chip. It is roughly estimated that about
30% of the equipment used in semiconductor chip manufacturing is plasma based.
Etching and deposition are two main processes to make integrated circuit. Etching
involves removal of material from the surface whereas deposition means the formation
of thin layers on a substrate. To make an integrated circuit, first submicron electronic

2
devices such as transistors, capacitors, etc are etched onto a silicon wafer which is
followed by the deposition of thin layers of dielectric materials such as silicon dioxide
or silicon nitride for insulation. The crucial parameter in the etching process is
anisotropy, which means that the etch rate should be directional. To achieve this,
positive ions from the plasma are accelerated in the direction perpendicular to the
substrate by sheath potential. This process is known as Ion-Enhanced etching. However
a common problem that exists in Ion-Enhanced etching is charge build up which leads
to non directional etching when high aspect ratios are desired. A solution to this
problem is neutral beam etching in which mainly neutral active species (radicals) are
directed towards substrate [Samukawa 2006]. Electronegative plasmas are one of the
most efficient sources for producing neutral beam.
The etching process described above is chemical etching, not physical etching.
This means: a chemical reaction takes place between the solid atoms (from the substrate
to be etched) and reactive species from the plasma. Molecular gases containing fluorine
or chlorine are found to be the most effective in producing reactive species in the
plasma. In fact in most of the plasma processing applications, electronegative gases
such as Cl2, SF6, CF4, C4F8, Ar+O2 etc are used. For example Cl2 based discharges are
found to be a good source of etchant for platinum and aluminium [Flamm 1990]. The
active chlorine atoms are produced in the plasma by electron impact dissociation of
chlorine molecule according to the reaction e + Cl2 e + 2Cl. Along with the
formation of reactive species the electronegative gases also produces negative ions
mainly through dissociative attachment. The role of negative ions in plasmas is
important as their presence in the discharge can modify the Bohm speed that in turn
affects the positive ion flux at the substrate. With an abundance of negative ions the
electron population may reduce significantly in the plasma. On the other hand, the
effective temperature of the plasma may increase as low energy electrons are lost via
attachments with neutrals to form negative ions. The discharge impedance also
increases with the increase of negative ions.
For neutral beam heating in fusion devices the hydrogen plasmas are the primary
requirement for the production of MeV range neutral beams for plasma heating in ITER
like machines [Boilson 2005]. The neutral beams are formed via charge exchange
collisions between the negative hydrogen ions extracted from the source and
background neutrals. The neutralization efficiency of negative ions is nearly 60% even
at MeV beam energy, which makes negative ions the inevitable choice as the primary
ion species for future neutral beam systems.

3
More recently the concept of plasma propulsion using electronegative gases was
proposed [Chabert 2007]. In this concept negative ion plasma is produced by using
molecular gases containing fluorine, chlorine etc from which electrons are filtered by
magnetic filtering and thus resulting in an ion-ion plasma. Both positive and negative
ions from the ion-ion plasma are accelerated by an alternating accelerating field to
provide thrust. Acceleration of both positive and negative ions also reduces the space
charge formation on the thruster body as the mutual recombination is faster. This is one
of the basic disadvantages of present thrusters.
Diagnostics of electronegative plasmas are thus required for fulfilling diverse
applications. However this is often challenging. Generally the negative ion density (n-)
is inferred indirectly from the measurement of the absolute values of the electron
density (ne) and positive ion density (ni), based on the assumption that the plasma is
quasineutral i.e. ni ≈ ne + n-. The electron and positive ion densities are generally
obtained using Langmuir probes. However, measuring the positive ion density is not
straight forward in electronegative gases due to the presence of a wide range of ionic
species. Hence the probe assisted pulsed Laser photodetachment and cavity ring down
spectroscopy are the most commonly used techniques. Probe assisted photodetachment
is based on measuring the electron current using a Langmuir probe placed inside the
laser beam path. A transient increase in electron current is observed when the incoming
laser annihilates all negative ions along its way by creating an electron-positive ion
plasma ne ≈ n+. This non-equilibrium electron-positive ion plasma lasts for a few
microseconds before the perturbed plasma column equilibrates with the surrounding.
The fractional negative ion density can be obtained from the ratio of the electron
saturation current to the background prior to detachment.
The above method can provide only the relative fraction of negative ions. For
the absolute measurement of negative ions, it is important that the accurate electron
number density be obtained from a Langmuir probe. There are some major applications
where the electron density is not straightforward to measure. One such example is high
power radio frequency discharges involving multiple frequencies. The electron
saturation current may be difficult to obtain in the case of depositing plasmas due to
contamination on probes surfaces. Application of Langmuir probes in strongly
magnetized plasmas is another such example where electron saturation current is
difficult to obtain owing to complicated electron motion around the probe. Moreover
positively biased Langmuir probe for collecting electron saturation current can disturb
the local equilibrium of the plasma surrounding the probe. In order to address these

4
issues we researched into the practical application of the resonance hairpin probe for
measuring electron density. The main advantage is that the (1) probe is electrically
floating – this minimizes the perturbation to the plasma (2) Measurement of the time-
varying electron density is possible. The subject of this investigation is the hairpin
probe, which is employed as a diagnostic for electronegative plasma. Principally the
hairpin measures electron density in collision-less plasmas. In this thesis we investigate
the hairpin probe as a diagnostic for negative oxygen ion and other parameters in the
discharge in conjunction with laser photodetachment. An independent technique is also
investigated in which the hairpin probe is systematically biased to negative values either
in dc or in pulsed dc mode for obtaining additional information including the negative
ion density.
This chapter is organized as follows: Section 1.1 presents a general overview of the
plasma, its fundamental properties through highlighting the role of the electron density
in sustaining plasma discharges. Section 1.2 and 1.3 presents a summary of useful
diagnostics for measuring electron and negative ion densities. A brief review of hairpin
probes is presented in section 1.4. Section 1.5 gives the objective of the work followed
by an outline of the thesis in section 1.6.
1.1 General overview of plasmas
The term plasma describes an ionized gas in which electrons are freed from neutral
atoms resulting in the existence of positively charged ions and free electrons in a state
of quasineutral equilibrium. In some plasmas, where abundance of negative ions are
found, then the plasma can be classified into two categories namely: electropositive and
electronegative plasma depending on their relative concentrations. Electropositive
plasmas are the plasmas made up of electropositive gases like argon, nitrogen etc having
electrons and positive ions only as charged particles. Electronegative plasmas are those
which are made up of electronegative gases like chlorine, oxygen, hydrogen etc. In
these plasmas the total positive ion density (n+) is equals to sum of the electron (ne) and
total negative ion densities (n-) i.e. ni ≈ ne+n-.
The species in the plasma can have the same or different temperature. Therefore
plasmas can be categorized on the basis of particle temperatures. Plasmas having locally
identical temperatures for all species are termed as equilibrium plasmas. An example of
this type of plasma are fusion plasmas where the particles temperature are >106 Kelvin.
On the other hand in the plasmas having large differences in the species temperature,

5
are defined as non-equilibrium plasmas also known as low temperature plasmas where
electrons have high temperatures compared to the ions (Te>>Ti, Tn with Ti ≈ Tn where
Ti, Te and Tn are the positive ion temperature, electron temperature and neutral gas
temperature respectively). In low temperature plasmas, ions and neutrals are generally
at room temperature (300-1500 Kelvin) whereas the electron temperature can be found
in the range of 10,000-100,000 Kelvin (0.5-10 eV). The temperature is typically related
to the operating pressure of the discharge. At high pressure collisions will be dominant
and the particle will exchange energy which will lead to a local thermal equilibrium
condition. The collision frequencies are small in low pressure discharges which results
in a higher temperature difference between the electrons and ions. Such plasmas are
regarded as non-equilibrium plasmas. However not only the pressure but the discharge
length (basically product of discharge length and pressure) is responsible for
characterizing equilibrium and non-equilibrium plasmas. This research work will focus
on low pressure non-equilibrium plasmas.
Plasmas are characterized by mainly two parameters; namely particle densities
(electron, neutrals, positive and negative ions) and its temperature. However the
electron density (ne; due to the lighter mass of the electrons), is one of the basic plasma
parameters which can provide useful information about the state of the plasma.
Electrons are mainly responsible for electron impact ionization that helps in sustaining
the plasma. Positive ions are considered to be at near equilibrium with the background
gas. In multi-component plasmas the electron density measurement can indirectly
provide information about the negative ions and positive ion species. The state of a
reactive discharge is affected sensitively by the parameters of the applied plasma
processes, e.g. thin film growth or etching rates. Thus monitoring the electron density is
an essential feature for ensuring defect free plasma processing. It is also required for
understanding various plasma properties, power coupling into the plasmas, and the
plasma chemistry. Furthermore there are many basic plasma parameters which depend
on the electron density and characterize a gas to be plasma. In this section we present a
brief overview of those basic properties of a plasma that depend on the electron density.
6
1.1.1 Fundamental properties of plasmas
Plasma frequency
The plasma frequency is the most fundamental collective effect exhibited by plasmas. It
was first observed in 1929, in relation to the large fluctuations in the velocities of
electrons in a low pressure mercury arc [Tonks 1929]. In equilibrium, the electric
fields of the electrons and ions cancel each other out. However, due to the thermal
motion of the particles, this field free equilibrium cannot be maintained. In order to
explain the concept of the plasma frequency, it is useful to consider the motion of the
center of masses of the electrons and of the ions (rather than the motion of all of the
individual particles). If the center of mass of the electrons is now displaced from that of
the ions, an electric field is set up (as the charges no longer cancel) which acts to attract
the electrons and ions back together. This acts as a restoring force and sets up a simple
harmonic motion of the electrons about the center of mass of the ions. This amounts to a
continual conversion of electrostatic energy to kinetic energy and back again. This
process takes place at the electron plasma frequency (ωpe) given as follows (see section
2.2 for details)
Where m is the mass of the electrons, e is electron charge and is vacuum permittivity.
On substituting all the constant parameters it gives:
fpe=9 (inHz) (1.2)
Here the electron density (ne) is in m-3
. Thus the electron density is directly linked to the
electron plasma frequency, which lies in the microwave (GHz) region for laboratory
plasmas.
Debye sheath
The Debye sheath is a fundamental property of plasmas which depends on both
the electron density and temperature. It is a layer in plasmas which has a greater density
of positive ions, and hence an overall excess positive charge, that balances an opposite
negative charge on the surface of a material with which it is in contact. A Debye sheath
arises in a plasma because the electrons usually have a temperature an order of
magnitude or greater than that of the ions and are much lighter. Consequently, they are

7
faster than the ions by at least a factor of where M is the ion mass and m is the
electron mass. At the interface to a material surface, therefore, the electrons will fly out
of the plasma, charging the surface negatively relative to the bulk plasma. This negative
potential is constantly maintained by the influx of energetic electrons that actively
replenish the negative charge every time they are lost due to neutralization by positive
ions at the surface. Hence the net current eventually reaches zero at a specific negative
potential which is defined as the floating potential. The floating potential is typically of
the order of few kTe below the plasma potential and depends on the mass of positive
ions and the electron temperature.
The potential distribution in the sheath can be obtained from the solution of Poisson’s
equation,
Assuming Boltzmann distribution for the electrons ( ) and for a
small change in the sheath potential ( ), such that the positive ion density is
fixed (ni = n0) the equation (1.3) after Taylor’s expansion of exponent term and
neglecting all the higher order terms of gives,
Where n0 is the plasma density far away from the charged conductor at potential and
is the potential at a distance x from the conductor. The solution to this equation can be
written as,
Where the Debye length is defined as
Thus quasineutrality, which is the basic criterion for an ionized gas to be plasma, will
exist if the dimensions of the system are large compare to the Debye length. Also for
Debye shielding to be statistically valid there must be a large number of particles ND in
a Debye sphere.
8
Plasma permittivity
Another fundamental and important property depending on the electron density is the
dielectric constant or permittivity of the plasma. Plasma permittivity defines the phase
velocity of electromagnetic waves propagating through it and thus forms a basis of
microwave diagnostics. If the plasma is located in a high frequency electromagnetic
field of angular frequency ω, then the plasma permittivity ( ) as a function of ω, and
plasma frequency ωpe, is given by the relation (see section 2.2 for details)
Where is defined by equation (1.1).
The effect of electron-neutral collisions on the plasma permittivity is neglected in the
above expression (the effect of electron-neutral collisions on the plasma permittivity is
discussed in the next chapter). Also for weakly or non magnetized plasmas the electron
cyclotron frequency (ωce) can also be neglected compare to ω (i.e. ωce<<ω).
As appear from the equation (1.7) for frequencies above the plasma frequency
i.e. ωpe<<ω, the dielectric constant of plasma is positive. Hence, the refractive
index ( ) will be real. This would seem to imply that high frequency
electromagnetic waves can propagate through plasma. On the other hand, for
frequencies below the plasma frequency, the dielectric constant is negative, which
would seem to imply that the refractive index is imaginary. Hence low
frequency electromagnetic waves are reflected from the plasma boundary.
1.1.2 Plasma discharges
This section is mainly concerned a brief overview of plasma discharges namely:
DC, radio frequency, wave heated discharges, helicon discharges etc. In most of the
discharges it is commonly known that the electrons are responsible for creating and
sustaining the plasma. The most commonly used method of generating and sustaining a
low-temperature plasma for technological and technical application is by applying an
electric field to a neutral gas. Any volume of a neutral gas always contains a few
electrons and ions that are formed by the interaction of cosmic rays or radioactive
radiation with the gas. These free charge carriers are accelerated by the electric field and
new charged particles may be created when these charge carriers collide with atoms and
molecules in the gas or with the surfaces of the electrodes. This leads to an avalanche of

9
charged particles that is eventually balanced by charge carrier losses, so that a steady-
state plasma develops. The most important collision processes for the production and
sustaining of a plasma are electronic excitation by means of collisions with energetic
plasma electrons (i.e. electron impact excitation) and ionization by means of collisions
with either energetic electrons (i.e. electron impact ionization) or metastable species of
the support gas (i.e. penning ionization). Sometime the discharge is operated with
pulsed voltages to enhance the higher instantaneous ionization and excitation and hence
obtain better efficiencies at low power.
Along with the electron collisions in the plasma as a source of ionization, the
electrons are also responsible for gaining energy from the oscillating radio frequency
(rf) field applied onto the electrode as in case of capacitive coupled plasmas (CCP).
Since the applied frequencies are in the MHz range (which is small compared to the
electron plasma frequency), the electrons can easily follow rf field while heavy ions can
only follow time-averaged electric fields. Another design of plasma source in which the
rf powered electrode is isolated from the plasma is an inductively coupled plasma (ICP)
discharge. In an ICP discharge the electrons are accelerated by an azimuthal electric
field produced by a time varying magnetic field because of a time-varying electric
current in the coil. The coil is isolated from the plasma and thus provides a low pressure
high density plasma operation compared to a CCP. Another way of power coupling is
based on the resonance between electrons in a magnetic field and microwave field and
is called electron cyclotron resonance (ECR) discharge. In ECR discharges the gyrating
electrons gain energy from the electric field of a right hand circularly polarized wave,
which accelerate the electrons on a circular path, which increases the collisions and
sustains the plasma. Electrons are also responsible for absorbing the energy from an rf
wave that propagates along the plasma. In this type of source the microwave source is
replaced by a radio frequency powered antenna responsible for creating resonating
waves. This type of heating mechanism is mainly the principle of helicon discharges.
Thus most of the heating mechanisms discussed above in different discharges are
mostly governed by the electrons.
1.2 Conventional methods of measuring the electron density
The electron density can be measured by means of well known plasma
diagnostic techniques such as electrostatic probes, emission and absorption
spectroscopy, microwave techniques such as microwave transmission and cut-off,

10
hairpin probe and self-excited electron resonance spectroscopy (SEERS). The
diagnostics are typically classified in terms of invasive or non-invasiveness to the
plasma and the density range for the operation of the diagnostic. This section presents a
brief overview on the principles behind electrical and microwave techniques.
Electrostatic probes
The electrostatic probe for plasma diagnostics was invented by Irving Langmuir in 1926
and it is commonly known as the Langmuir probe. It is an invasive technique in which a
piece of conductor (planar, spherical or cylindrical) is inserted inside the plasma and a
voltage-ampere characteristic is drawn by biasing the conductor with respect to other
conductors in contact with the plasma such as the vacuum vessel or any reference
electrode.
Figure 1.2: A typical Langmuir Probe Characteristic Curve.
When the bias voltage of the probe is set to a value much more negative than the
floating potential one obtains a saturation current that corresponds to positive ions if the
secondary electron emission is small. Similarly, when a positive potential is applied to
the probe, typically a few volts above the plasma potential an electron saturation region

11
is obtained purely comprised of electrons. The typical characteristic so obtained is
schematically shown in figure 1.2.
Following the simplest assumptions, [Langmuir 1924] the transition region from
the electron saturation to the ion saturation is characterized by a slope which
corresponds to the plasma electrons obeying the Maxwell-Boltzmann distribution
. Thus the electron component of probe current is given by
Here n0 is bulk plasma density, VB is probe bias, Vp is plasma potential, Te is electron
temperature, A is the area of the probe and is the mean electron speed given
by .
The electron saturation current is therefore given by
The positive ions exiting the plasma have a directed speed at the sheath edge which is
given by the Bohm velocity
. The typical ion saturation current is
therefore given by,
Where ns is the density at the sheath edge related to bulk density by ns ≈ 0.61n0 at low
pressure [Chabert and Braithwaite, 2011].
If the contribution of the ion current is eliminated from the net current drawn by
the probe, then the electron temperature can be easily obtained from the slope of the
characteristic curve plotted between as the log of electron current verses the probe bias.
This is a straight line as shown below:
Hence the electron density can be obtained from the electron saturation current by
substituting the mean electron speed (which is a function of Te) and the probe area as
given below:
One of the drawbacks of this technique are due to its invasive nature thus it can
significantly perturb the plasma, particularly in a strong magnetic field. Inaccurate
measurement of electron saturation current is possible if insulating films get deposited

12
on the probe surface. Furthermore in rf plasmas additional care must be taken in
restoring the dc shape of the Langmuir probe characteristic. Active and passive
compensation is used so that the probe can easily follow the rf plasma potential
[Chabert and Braithwaite 2011]. However the Langmuir probe is the most popular
diagnostic method as it uses simple equipment and a number of plasma parameters
including, plasma potential, floating potential, electron and ion density, electron
temperature can be readily obtained by analyzing the voltage-ampere characteristic.
Microwave diagnostics
The microwave diagnostic technique uses the frequency dependent permittivity of the
plasma (equation 1.7) which changes the characteristic wavelength of the wave. The
relative phase shift between the incident and the transmitted wave through the plasma
medium is related to the electron density from the measurement of refractive index for
that characteristic frequency [Heald 1978]. This is the principle of microwave
interferometry.
The typical formula for obtaining the electron density using this technique for a wave of
frequency ω which is chosen above the plasma frequency is given below,
Here is the change in phase shift. Thus the line integral of the electron density can
be obtained by measuring the change in phase shift. Microwave interferometry is a
simple and non-invasive method to determine the line-integrated electron density;
however a local measurement of density is not possible.
Another type of microwave diagnostic technique is known as microwave
reflectometry. In this technique a wave with a frequency below the cutoff frequency is
launched into the plasma. As a consequence the wave will be reflected from the so-
called critical density layer. One can deduce the position of that layer by measuring the
phase shift of the probing wave with respect to a reference wave or by measuring the
time-of- flight of a short microwave pulse to the reflecting layer and back. Multiple-
fixed or swept frequency systems are employed for measuring the electron density
profile. It is generally not for diagnosing the central part of the density profile since the
density gradient is too small here. The above techniques are commonly used in high
density plasmas such as tokamaks and in laboratory plasmas as well.

13
The Hairpin probe is also a microwave technique. However its methodology for
extracting the density is very different than the above discussed techniques. Using the
hairpin probe, we launch a local electric field by means of a U-shaped quarter wave
resonator wire which has a characteristic frequency that depends on the permittivity of
the medium around the wire. On changing the permittivity, as happens in the plasma,
the characteristic frequency gets shifted. The shifts in the characteristic resonance
frequency in the two media are related to the electron density as (a detailed description
can be found in chapter 2).
Here the frequencies fr and f0 are in GHz and the electron density ne is in 1016
m-3
.
Figure 1.3 shows two resonance peaks: one corresponds to the vacuum resonance (f0)
and the second corresponds to the resonance in the presence of plasma (fr).
Figure 1.3: Resonance signal of a hairpin probe in vacuum and in plasma.
Thus the relative shift in the resonance frequency with and without the plasma allows
one to obtain the electron density. This technique allows us to obtain a local
measurement of the electron density in the plasma and therefore is highly promising.

14
1.3 Conventional methods of measuring negative ions
The measurement of negative ion density and temperature is commonly done by
indirect techniques i.e. usually electrons and positive ions are monitored which gives
information about negative ions. These indirect techniques mainly include electrical
probes and laser based diagnostics. In this section we present a brief overview on these
diagnostic techniques that are used for measuring negative ion density and temperature.
Langmuir probes are the one of the oldest ways for diagnosing of plasmas (a
more detailed discussion can be found in section 1.2). Several theories have been
developed based on Langmuir probe characteristics for estimating the negative ion
parameters. Most of the theories were based on the ratio of the saturation current at the
plasma potential to the positive ion saturation current. In 1988, Braithwaite and Allen
[Braithwaite 1988] proposed an analytical expression which relates the negative ion
density ratio to the ratio of negative saturation current to positive ion saturation current
for a spherical Langmuir probe. It was the first time that the multi-valuation of the
Bohm criterion in electronegative plasmas was discussed. This theory was well
accepted and used by various authors [Amemiya 1990, Nikitin 1996]. More recently
Shindo et al [Shindo 2001] used the same technique by comparing the ratio of the
saturation current of positive ions and electrons in a noble gas plasma with that in an
electronegative plasma to estimate the negative ion density. However the input
parameter to these techniques like mass of positive ions, mass of negative ions and
temperature ratio, make it difficult to use in complex industrial gas mixtures.
Another diagnostic technique based on electrostatic probes is the two-probe
technique which was proposed by Chabert et al [Chabert 1999]. As the name suggests,
this technique uses two electrostatic probes at the same time. One probe is used to
measure the modified Bohm flux and another probe is used to measure the electron
thermal current. The negative ion density is estimated by comparing the ratio of electron
thermal current and modified Bohm flux to the ratio obtained by a fluid model
developed by Sheridan et al [Sheridan 1999]. Initially the technique was employed for
collision-less plasmas which were further developed by Curley et al [Curley 2008] to
make use in modestly collisional plasmas. However the use of two probes is impractical
in some plasma tools. Also the accuracy will again depend on the accuracy of the
measured electron density.
Optical methods have also been developed for measuring absolute negative ion
densities in which the cavity ring down spectroscopy (CRDS) [Booth 2006] is the most

15
promising one. In CRDS a pulsed laser is passed up and down through the plasma
chamber via the use of highly reflecting mirrors located at each end of the chamber to
create an optical cavity and so significantly increase the optical path length of the laser
pulse through the plasma and the decay of the laser light escaping through one end of
the cavity after each pass of the laser pulse through the plasma chamber is recorded. The
time constant associated with the exponential decay in the laser energy escaping the
cavity is determined. By comparing the CRDS signals with plasma on and plasma off,
the absolute negative ion density can be measured. One of the main issues related to this
technique is that this method only allows a line averaged density measurement whereas
the negative ion density varies spatially within the plasma and local density variations
are not considered in the results obtained with this method. Another issues related to
this technique is the deposition or etching at the surface of glass windows, which affects
the laser light.
Another well known diagnostic technique for electronegative plasmas is based
on the detachment of electrons from the negative ions with a laser pulse followed by the
detection of the electron density [Bacal 2000]. In this technique a pulsed laser beam of
photon energy higher than the electron affinity of the negative ions is passed through
the plasma. When operating in the saturation regime of laser flux it creates an
electropositive channel. The negative ion density is determined by the difference in the
background electron density and the peak electron density after photodetachment.
Diagnostic of multiple negative ions is also possible using this technique. This is done
by tuning the laser frequency (photon energy) just higher than the electron affinity of
the specific negative ion to be diagnosed.
Measurement of the time varying electron density during the pulsed laser also
gives the information of the negative ion temperature. To estimate the negative ion
temperature it is assumed that the decay in the peak electron density in the laser channel
is due to the diffusion of negative ions from the surrounding plasma [Bacal 2000]. The
negative ion temperature is thus estimated from the recovery time and the radius of the
laser beam. Furthermore two laser beam technique is also used to measure the negative
ion temperature in which the first laser is used for photodetachment and the second laser
is fired with some delay to measure the recovery of negative ions [Stern 1990]. In this
thesis we have extensively studied this technique and proposed the use of hairpin probes
with laser photodetachment to obtain negative ion parameters.

16
1.4 Hairpin probe
In this section we briefly present the background of the hairpin probe. The
history of the hairpin probe is not too old, till 1970’s the common plasma diagnostics
for characterizing electron density were based on radio frequency techniques like
microwave interferometers, faraday rotation and resonance cavity shift. These
techniques were suitable for spatially averaged densities, and therefore they are ideal for
homogeneous plasmas. Around 1971, Stenzel and Gould [Stenzel 1971] invented the
microwave resonance probe for electron density measurements in collision-less weakly
magnetized plasmas. The resonance probe had the advantage that the probe is
electrically floating. This means the probe draws no net current from the plasma.
Therefore a major advantage is that no reference electrode is necessary as required for
Langmuir probes. This significantly reduces the perturbation introduced in the plasma.
Stenzel and Gould used this technique extensively for studying the upper hybrid
resonance in an afterglow decaying plasma [Stenzel 1971]. A detailed description of the
probe was later published by Stenzel in 1976 [Stenzel 1976]. Figure 1.4 represents the
design of the hairpin probe proposed by Stenzel. The probe had two loop antennas, 1.5
mm in diameter and separated by 4 mm. The hairpin was mounted in-between the two
loops and was completely isolated from the two loops. The hairpin was made with a
silver wire having diameter 0.1 mm and the length and width of the hairpin was 8 mm
and 2 mm respectively.
Figure 1.4: Schematic of the microwave resonator probe by Stenzel.
One of the disadvantages with Stenzel’s probe was due to its bulky design. This was the
reason for its rare application by few researchers ([Kim 1995], [Werner 1996],
[Grabowski 1998]). In order to reduce the probe dimension Hebner et al [Hebner 2001]
Loop 1
2mm
8 mm
/4 OUTPUT
INPUT
Loop 2
Hairpin

17
demonstrated a hybrid system in which a coaxial cable loop antenna was used for
exciting the hairpin and a remote horn antenna was used as a sensor.
In 2004 Peijak et al [Piejak 2004] introduced an innovative design of the
microwave probe after which it became popular as a hairpin probe due to its
characteristic shape. One basic advantage was that a single loop antenna is required for
both excitation and detection of the resonance condition. Following this pioneering
paper some renewed interest was created on the application of hairpin probes for direct
application in commercial plasma tools [Karkari 2006, Curley 2010] and also in
laboratory plasma studies [Karkari 2005, 2007]. Important papers include those by
Braithwaite et al [Haas 2005] who addressed the effects of space charge sheath around
the hairpin probe. Around the same time, Piejak and Braithwaite from Open University,
UK [Piejak 2005] and Karkari et al [Karkari 2005] from Dublin City University, Ireland
came up with novel designs of floating hairpin probes for rf plasmas. Curley et al
[Curley 2008] measured the negative ions by comparing the electron density using a
hairpin probe with the positive ion density using an additional ion flux probe. Ganguly
et al [Sands 2007] demonstrated the use of a hairpin in sub-atmospheric pressure
plasmas. Recently Sugai et al presented a detailed theoretical work on the application of
hairpin probes in high pressure plasma [Xu 2009]. Sirse and Karkari et al [Sirse 2010,
Conway 2010] have demonstrated the use of hairpin in conjunction with pulsed laser
photodetachment for electronegative plasma diagnostics while Gogna and Karkari
[Gogna 2010] addressed the issues related to the application of hairpin in magnetized
plasmas.
1.5 Objective and motivation of the thesis
One basic limitation with hairpin probes is due to the sheaths around the
resonator pins which affect the accuracy of the measured values at lower densities
(below 1016
m-3
). The sheath is a boundary layer around the surface of the probe which
is deficient of electrons. Therefore the effective permittivity seen by the hairpin is
because of both the vacuum permittivity ( o) of the sheath and the true plasma
permittivity ( p). The influence due to the sheath is significant at plasma densities
below 1016
m-3
, as the effective sheath width becomes comparable to the separation
between the pins. Hence the electron density measured by the hairpin is underestimated.
This problem can be severe in the case of radio frequency discharges due to a high level
of oscillation in the plasma potential resulting from sheath rectification. Even for a few
18
10’s of volts rf plasma potential oscillations, the stray capacitances between the hairpin
and the insulated probe stem can result in a substantial sheath thickness for low plasma
densities of about 1016
m-3
. Also the presence of negative ions can modify the sheath
thickness. Therefore the behavior of a sheath around the cylindrical pins is important for
applying the hairpin probe technique in electronegative plasmas. A systematic study is
therefore devoted to the numerical simulation of sheaths around cylindrical probes in
electronegative plasmas.
One fundamental idea proposed by Peijak et al [Piejak 2004] for the compensation of
the sheath width around the hairpin is based on step front sheath model. Such a method
requires information of the electron temperature for obtaining an initial estimation of the
sheath width. Therefore additional diagnostics are required for obtaining the
temperature of the plasma. In line with the above model, Piejak [Piejak 2004a] also
proposed a biased hairpin probe. In that technique the hairpin was biased up to the
plasma potential in order to nullify the sheath. Braithwaite et al [Haas 2005] further
refined the theory of negative and positive biased hairpin probes by including the role of
electrons on the finite sheath width. However biasing of the probe to a positive potential
is impractical for magnetized and deposition plasma conditions. Another fundamental
limitation of the hairpin is that the measurable density range falls within 1015
to 1018
m-
3. One can calculate that there is very minimal benefit of pushing the upper range of
microwave frequency required for the resonance. At electron densities ~ 1019
m-3
, the
electron plasma frequency (fpe) is above 28 GHz. Hence the dimension of the quarter
wavelength λ/4 probe will be a length of typically 2.6 mm. This makes it rather
impractical for designing a hairpin probe as the physical length of the resonator must be
much larger than the separation between the resonator wires as compared with the wire
radius. To address this issue we investigate the negatively biased hairpin probe. A
negative bias creates an ion sheath around the hairpin which shifts the measurable
frequency range to the lower frequency side when dealing with high density plasmas
and yet the underestimated value may be calibrated to get the actual density.
Another important application addressed in this thesis is the measurement of density
and temperature of negative oxygen ions using conventional photodetachment in
association with a hairpin probe which replaces the Langmuir probe. In addition an
independent technique is proposed for measuring the negative ion density and the
associated plasma properties by using a pulse biased hairpin probe. A transient negative
potential is used for driving the negative ions and electrons from the vicinity of the
probe. On the sudden removal of the applied potential, the background electrons quickly

19
rush in to shield the ion space charge. This results in the observance of a transient
electron density that corresponds to the background positive ions as similar to
photodetached electron density in the case of pulsed laser photodetachment technique.
1.6 Outline of the thesis
The outline of this thesis is as follows: chapter 2 presents the detailed principle
of the resonance hairpin probe. This chapter also describes different designs of the
hairpin probe. A detailed description of the underlying techniques used for finding the
steady state and time resolved electron density is presented together with experimental
data.
In chapter 3 a detailed discussion is presented for different methods/models of
sheath correction. A technique for measuring accurate electron densities in low density
plasmas with the application of negative dc bias on the hairpin is presented. The results
are compared with the correction based on step front sheath model. Finally, high density
plasma diagnostics with negatively dc biased hairpin probe is proposed. Chapter 4 is
devoted to the systematic theoretical investigation of sheaths particularly in the context
of sheaths around cylindrical objects in electronegative plasmas.
The application of floating hairpin probes with laser photodetachment for
electronegative plasma diagnostics is presented in chapter 5. The photodetachment
signals are investigated both inside and outside the beam to avoid the laser ablation
from the probe surface. The steady state negative ion density is experimentally
measured using this technique in an oxygen based ICP discharge and also the time
resolved negative ion density in argon/oxygen based pulsed dc magnetron discharge.
The response of the plasma following photodetachment is discussed by comparing the
plasma potential and electron density evolution. Finally an independent technique to
measure the negative ion temperature is systematically investigated using the temporal
evolution of the plasma potential during photodetachment and compared with those
obtained by the evolution of the electron density.
In chapter 6 we presented a novel application of the hairpin probe to measure
electronegative plasma parameters without using laser photodetachment. The temporal
evolution of the electron density during the application of a sharp negative pulse to the
hairpin is used for this purpose. This technique is experimentally investigated in both
electropositive as well as in electronegative plasmas. The dependency of the diagnostic

20
on the applied pulsed parameters is also discussed. The limitation of this technique is
presented at the end of the chapter.
Finally the summary, conclusions and future scope of the work are given in
chapter 7.

21
Chapter 2
The resonance hairpin probe
In this chapter we discuss the fundamental principle behind the resonance
hairpin probe for measuring the electron density in collision-less non-equilibrium
plasmas with different designs of the hairpin probe. The experimental set-up for
obtaining the probe resonance frequency is presented and its application for measuring
the electron density in two important cases is demonstrated; (1) steady state plasmas, in
which the electron density remains constant over the period of scanning of the
frequency applied to the hairpin and, (2) the technique behind time-resolved
measurement of the electron density with experimental results in a pulsed dc magnetron
discharge.
2.1 Resonance frequency of the hairpin probe
The hairpin probe is based on measuring the frequency dependent permittivity of
plasma by means of a U-shaped wire. Since the resonator design resembles the hairpin,
it is therefore commonly called as a hairpin probe. The hairpin has its own characteristic
resonance frequency which depends on its physical dimensions and the permittivity of
the medium surrounding it. This section presents the resonance frequency formulation
of the hairpin probe with the assumption of a transmission line and its equivalent LCR
circuit. The effect of the hairpin resonator width on resonance frequency is also
experimentally investigated in vacuum.
2.1.1 Transmission line model
In the simplest case, the hairpin probe can be modelled as a parallel wire
transmission line having length L, wire radius a separated by distance w~2h (L>>w)
which is shorted at one end and open at the other. Figure 2.1 shows the transmission
line equivalent of the hairpin and the front view of the transmission line showing the
electric and magnetic field lines at resonance.
When a current or voltage waveform is launched in a transmission line then it
gets reflected from the open end because of the impedance mismatch. The transmitted
and the reflected waves interfere either constructively or destructively depending on the

22
length of the transmission line. If the length of the transmission line is equal to the
integral multiple of the quarter wavelength of the wave launched, the incident and
reflected waves interfere constructively and thus support a standing wave. In the case of
the hairpin probe a current waveform is fed via a loop sitting near to the short circuit
end of the hairpin. At resonance, the hairpin supports a standing wave and the short
circuit end of the hairpin will be a current anti-node (voltage node) and the open end
will be a current node (voltage anti-node). Thus the probe will be sensitive at the open
end where the electric field is a maximum.
Figure 2.1: Transmission line equivalent of the hairpin and the front view of electric and
magnetic field-lines in a transmission line.
In the resonance condition the length of the transmission line or hairpin is given
by the odd multiple of the wavelength of the waveform launched, i.e.
Here k is an integer and is the wavelength. The frequency and wavelength are related
by the equation
Equations (2.1) and (2.2) above give the resonance frequency of the hairpin
When the medium surrounding the hairpin is not vacuum but it is a dielectric medium
having dielectric permittivity then equation (2.3) can be written in the form
Hairpin
2a
Source
waveform Reflected waveform
Impedance mismatch
2h
L
Incident waveform
Transmission line

23
Thus the resonance frequency of the hairpin given by equation (2.4) is inversely
proportional to its length and to the square root of the permittivity of the medium
surrounding it.
2.1.2 LCR circuit equivalent of a transmission line
The electrical circuit of a transmission line is composed of distributed electrical
elements, namely: the resistance of the line Rl given by the dc conductivity l with the
skin depth l at frequency , conductance Gl given by the conductivity (p) of the
surrounding medium, distributed inductance Ll and the distributed capacitance Cl as
shown in figure 2.2. The capacitance and inductance (which depends on the permittivity
of medium and absolute permeability respectively), resistance and conductance is given
by the relations [Xu 2009]
Figure 2.2: Equivalent electric circuit of the hairpin with distributed electrical elements.
The propagation constant of an electromagnetic wave exciting transmission line is given
by . Where l is the attenuation constant and l is the phase constant. For a
low-loss transmission line l and l is given by the distributed parameters as [Xu 2009]
Resonance occurs when the wavenumber satisfies lL=(2k+1)/2 for the integer k. Thus
on substituting l in equation (2.7), the fundamental resonance for k=0 gives
Source
waveform
Hairpin
2a 2h
L
Equivalent electrical circuit
Ll
Cl
Rl

24
. Substituting the values of the inductance and capacitance from equations
(2.5) and (2.6) gives
Here c= 1/(00)1/2
.
Thus the expression for the hairpin resonance frequency obtained by the
transmission line model and its LCR circuit equivalent suggest that the measurement of
the resonance frequency of a U-shape wire gives a measurement of permittivity of the
medium surrounding the probe.
2.1.3 Effect of hairpin dimension on vacuum frequency
Figure 2.3: Experimental and theoretical plot of resonance frequency in vacuum, fo, as a
function of the length, L, of the resonator pins.
The dependence of resonance frequency on the physical dimension of the hairpin was
outlined in the previous section. To validate the dependence a simple experiment was
performed in vacuum. The experimental and theoretical vacuum resonance frequency
(f0) as a function of the length of the hairpin is shown in figure (2.3) with w (
) [Sands, 2007] and without w ( ). The width (w=2h) of the
resonator is kept constant. The resonance formula, fo, without w is based on the
assumption of an infinite parallel wire transmission line which neglects the finite width,

25
w, of the resonator. However in the real experiments the effective length of the
resonator includes the finite w i.e. the total length of the resonator is given by (L+w/2).
In figure 2.3 we observe that the experimentally measured vacuum resonance frequency
( mof ) agrees well with equation (2.3) while for the shorter probe lengths m
of deviates
from fo. Thus the most general formula for the resonance frequency of the hairpin
including the width of hairpin is given by the relation . Hence the
width of the hairpin is taken into account when calculating the vacuum resonance
frequency. However the electron density measurement by the hairpin probe is related
with to the relative shift in the resonance frequency as discussed in the sections below.
2.2 Cold plasma permittivity
The response of a plasma particle to an externally applied electric field depends
on its frequency. For steady state or low frequency fields this response is generally
termed as the conductivity on the other hand the plasma response to a high frequency
field is termed as permittivity [Chabert and Braithwaite 2011]. Thus before proceeding
to the dependence of electron density on hairpin resonance frequency it is important to
discuss the concept of plasma permittivity. In this section we discuss the plasma
response to small amplitude oscillating electric fields and obtain the cold plasma
permittivity in two cases, namely: collision-less and collisional.
2.2.1 Plasma response to high frequency electric field
Consider a plasma excited by an externally imposed high frequency electric
field. The electric field will be induced by imposing an oscillating potential V(t) =
V0sint at time t = 0 across boundaries on opposite sides of a plasma having length l
(implicitly >> D) in the x direction. For simplicity the plasma will be assumed to be
infinite in extent (or at least >> l) in the other two directions so that their effects can be
neglected. Since the plasma is assumed to be electrically neutral, each species must
have the same equilibrium number density, ne. Now, given that the electrons are much
less massive than the ions (i.e., m M) thus the lighter electrons will give the primary
inertial response to an applied electric field in plasma. Also they have the same charge
(modulo a sign), hence it follows that the electric field induced oscillations of the
electrons are of much higher amplitude than those of the ions. In fact, to a first
approximation, the electrons oscillate whilst the ions remain stationary. Also for

26
simplicity the thermal motions of the particles can be neglected and a zero initial drift is
assumed.
In the simplest case a slab consisting entirely of one charge species is displaced
from its quasineutral position by an infinitesimal distance x. The resulting charge
density which develops on the leading face of the slab is σ = enex. An equal and
opposite charge density develops on the opposite face. The x-directed electric field
generated inside the slab is of magnitude Ex = -σ/ε0 = -enex/ε0. The electric field together
with the equation of motion gives an oscillatory solution with a frequency given by
electron plasma frequency (a detailed discussion can be found in the next section). Thus
there will be a cut-off in frequency defined by the electron plasma frequency. Plasma
electrons will be unresponsive for any applied frequency above this frequency whereas
the electrons will oscillate with the applied frequency lower than this.
2.2.2 Dielectric property of the plasma
(1) Collision-less
In the collision-less plasma the mean free path of electrons is large compared to the
length of the plasma (l as considered in section 2.2.1). In this situation apart from
electric force there will not be any additional force will exerted onto the electrons (again
the magnetic force is not considered). Also a cold plasma is assumed, where one or
more species is assumed to have no thermal energy. The motion of electrons in the
applied electric field will be governed by Newton’s second law of motion
(2.9)
Where E is the applied electric field given by E= E0sint.
The solution of the differential equation (2.9) is given by
Assuming that the electrons and ions are evenly distributed throughout the plasma, the
electric field induced displacement of an individual electron generates an effective
electric dipole moment in the x direction. The electric dipole moment in the x direction
will be given by the equation
(2.10)
Where p0 is given by the relation
(2.11)

27
Above equation gives the magnitude of the dipole moment of an individual electron
induced by the applied electric field. If ne is the electron density per unit volume of the
plasma then the dipole moment per unit volume will be given by multiplying equation
(2.11) by ne. The effect of magnetic field and collisions are not included in the above
formulation, further ions and neutrals are assumed to be stationary.
Figure 2.4: Frequency dependence of plasma permittivity.
The dipole moment per unit volume induced in the medium by the electric field is given
by the relation
(2.12)
Simplifying equation (2.12) with (2.11) (multiplied by ne for the dipole moment per unit
volume) gives the plasma permittivity
(2.13)
Thus the plasma permittivity is a function of applied frequency. This frequency
dependent permittivity is plotted in the figure 2.4.
The value of 1 for >> pe. In this case the driven component of the
electric field approaches the externally applied electric field in this “vacuum" limit.
Since the plasma permittivity is negative for pe, the externally applied electric
field is shielded out of the plasma or cut-off in this frequency range. The vanishing of
for pe indicates that this is a “normal mode" of oscillation of the plasma.

28
(2) Collisional
In the collisional plasma, typically at high discharge pressure, the mean free path
is short compared to the discharge length. In this case the electrons will collide with the
background ions and neutrals. The collision will create another force to the electrons
moving in the applied electric field. The interaction of the electrons with the ions and
neutral particles in a plasma can be represented by a friction term in the electron
equation of motion.
(2.14)
Where is the effective collision frequency. The collision term represents the rate of
change of momentum and therefore the force exerted on the electrons by the ions and
neutrals of the plasma. Doing the same exercise as in the previous section the equation
of motion yield a complex dielectric function of
(2.15)
Under the condition of pe (typically in the GHz range) and pressure up to 500
mTorr (which is typically the case fulfilled in all the discharges used in this thesis), the
collision frequency is very small compared to the wave frequency i.e. . Thus the
permittivity given by the equation (2.15) takes the form of equation (2.13).
2.3 Electron density measurement from plasma permittivity
This section presents a simple analytical expression which relates the vacuum
resonance frequency and plasma resonance frequency of the resonance hairpin probe to
the electron density. Since the plasma studied in this thesis is collision-less, the formula
for electron density is derived from the collision-less dielectric permittivity described in
section 2.3.2.
The resonance frequency of a hairpin depends on the permittivity of the medium
surrounding it and its physical dimension as shown in equation (2.4). Also in collision-
less, non-magnetized and non-equilibrium plasmas the permittivity is a function of the
electron density and the frequency of the penetrating electric field. Thus using a hairpin
probe in the plasma can quantify the electron density. Again if the plasma is located in a
high frequency electromagnetic field of angular frequency ω, then the cold plasma
permittivity as a function of ω, and plasma frequency ωpe, is given by the relation

29
(2.13). If the probe is in vacuum, where ε = 1, then the resonant frequency is
determined by the physical dimension of the probe. From equation (2.14):
If the probe is immersed inside plasma, the resonance frequency will change
accordingly with respect to its resonance frequency in vacuum due to the change in the
permittivity around the resonator pins. Thus from equation (2.4), (2.13) and (2.18) we
can derive the relation for the shifted resonance frequency in the plasma,
Where ( is plasma permittivity defined by equation (1.7)) is the
resonance frequency of the hairpin in the presence of the plasma. Using the plasma
frequency (fp from equation (1.1)) we can write an expression for the electron density as
a function of the resonance frequency in the plasma:
Where the frequencies fr and f0 are in GHz and the electron density ne is in 1016
m-3
.
Thus with the relative shift in the resonance frequency with and without plasma the
electron density can be obtained using equation (2.20).
2.4 Designs of hairpin probes
The typical design of the hairpin depends on the particular method used for
determining the resonance frequency. When the hairpin is in resonance, a significant
amount of power is coupled to the hairpin from the external driving loop. Intense
electric fields generated around the hairpin can provide a signature of the resonance
condition. In another type of design, the reflected power is measured in the 50 Ω
transmission line supplying the microwave signal to the loop antenna. At the resonance
frequency the reflected power detected using a directional coupler is found to reduce
drastically owing to efficient power transfer to the hairpin followed with ohmic losses
by the finite resistance of the wire. Based on these principles mainly two types of
hairpin resonators are found in the literature, namely: transmission and reflection types
as discussed below. The design of the probe differs slightly when the coupling loop is
electrically isolated from the hairpin.

30
2.4.1 Transmission and Reflection type
The transmission type probe is comprised of two loop antennas constructed at
the end of two 50 Ω lines. One of the loops functions as the transmitter of the
microwave signal to the hairpin while the other, called the pick-up loop, acts as the
receiver when the probe is driven at resonance for a characteristic frequency as shown
in figure 2.5.
Figure 2.5: Schematic diagram of a transmission type hairpin probe.
For improving the signal to noise ratio the coupling between the driving loop
and the pick-up loop is minimized by bending the plane of the pick-up loop in the
perpendicular direction of the plane of the driving loop and the hairpin [Piejak, 2004].
Because of bulky construction of the probe comprised of two individual coaxial
lines, this original design, as proposed by Stenzel [Stenzel, 1976], is less popular. In
2004, Peijak et al [Piejak, 2004] proposed measuring the resonance signal from the
reflected power from the same coaxial line used for driving the hairpin. This eliminated
the requirement for the second 50 Ω line which greatly simplified the construction of
the probe. This is shown in figure 2.6 below.
Figure 2.6: Schematic diagram of a reflection type hairpin probe.
2.4.2 Floating hairpin probe
One of the limitations of the design proposed by Peijak et al [Piejak, 2004] for
the reflection type probe is that the hairpin is directly attached to the loop antenna which
is close to ground potential. Therefore its application to discharges having significantly
large potential fluctuations, such as in the case of single and dual frequency confined
narrow gap capacitive discharges, can result in severe arcing of the probe. The
sinusoidal variation of the plasma potential can also result in sheath rectification and

31
drastic reduction of electron density around the hairpin pins. Therefore it is essential to
design the hairpin to be electrically isolated from the coupling loop. In order to achieve
this objective, a number of designs of floating hairpin probes were published around the
same time by different groups. Important ones are by Piejak and Braithwaite et al
[Piejak, 2005], Curley and Booth [Curley, 2008] and Ganguly [Sands, 2007]. The
floating hairpin probe designed at Dublin City University, Ireland by Karkari and
Ellingboe [Karkari, 2005] has a mechanism by means of which the short circuited end
of the hairpin is mechanically attached by sandwiching between two cylindrical tubes.
In this way the pins can be replaceable. One of the important aspects of designing a
floating hairpin is that extensive care needs to be taken for minimizing stray capacitance
between the loop antenna and the hairpin. This is generally achieved by providing a
sufficient air-gap between the two components.
Figure 2.7: Schematic diagram of a floating hairpin probe.
A schematic of a floating hairpin probe is shown in figure 2.7. The probe design
contains a 50 coaxial line, a single turn driving loop of diameter nearly 3 mm and a
hairpin resonator of length nearly 30 mm and width 2-4 mm which is completely
isolated from the driving loop. Since the hairpin is inductively coupled to the driving
loop, the position of the hairpin with respect to the driving loop will affect the quality of
the signal. However one can identify a better quality resonance peak in the reflected
signal by varying the position of the hairpin with respect to the driving loop. But there is
a trade-off between the quality of the resonance peak and floating the hairpin
(capacitance between the driving loop and the hairpin should be much smaller compared
to the capacitance between the hairpin and the plasma).
50co-axial line Loop antenna
Hairpin probe tip

32
The signal quality of the resonance signal also depends on the material of wire
chosen for the hairpin [Sands, 2007]. To improve the quality of the resonance signal the
losses in the hairpin should be a minimum which can be reduced by choosing a wire
material of higher conductivity (effect of other factors like length to width ratio, wire
diameter, surface nicks etc on the quality of resonance signal are not discussed here).
Wire materials used for hairpins in this thesis are molybdenum and gold coated
tungsten.
2.4.3 Electrically biased hairpin probe
For our study, we need to externally bias the hairpin with respect to the plasma
potential for varying the dimension of the sheath around the hairpin. When negatively
biased, expulsion of electrons from the vicinity of the probe results in a shift of the
resonance peak in the plasma towards the vacuum frequency. On the other hand, a
positive bias up to the plasma potential will negate the sheath; hence the resonance
frequency shifts to the true resonance value that corresponds to the actual plasma
permittivity.
Figure 2.8: Schematic diagram of an electrically biased hairpin probe.
A schematic diagram of an electrically biased hairpin probe is shown in figure
2.8 and 2.9. The design and the method of obtaining the resonance frequency is the
same as discussed in section 2.4.2. The hairpin remains electrically isolated from the
driving loop while a hypodermic tube carries the electrical connection to the short
circuited end of the hairpin. The use of a hypodermic tube also provides flexibility to
change hairpin tip without interrupting the line of electrical connection. The
hypodermic tube is electrically isolated from the plasma using an additional ceramic
sleeve. A special vacuum compatible electric feed through is designed which have
separate electrical connection for biasing the probe and SMA connection hermetically
sealed for the microwave signal to the loop antenna.

33
Figure 2.9: Electrically biased hairpin probe in Sentech SI 500 triple planar
spiral antenna ICP etch system.
2.5 Detection of resonance frequency in steady state plasma
The technique used for the measurement of the resonance signal involves
varying the input microwave signal and measuring the reflected microwave power at
each frequency. The typical process takes 10 – 20 ms depending on the tuning
frequency of the source. Additional delay can occur due to automation used for the
detection of the resonance signal. In order to be able to determine the resonance
frequency accurately, one should consider the plasma to remain in steady state during
the diagnostics. The method for detecting the resonance peak in a steady state plasma is
presented in the following section.
2.5.1 Schematic of the setup
The experimental set-up shown in figure 2.10 comprises a tunable microwave source
(frequency range 1 – 8 GHz, power level 10 dbm). The microwave signal is fed into the
loop antenna via a directional coupler placed between the microwave source and the 50
Ω coaxial line whose far end is attached to the loop-antenna as shown in the figure 2.10.
The r.m.s amplitude of the reflected signal is obtained using a negative output schottky
diode and displayed on an oscilloscope against the time axis, the time axis is linearly
related to the frequency. As the applied frequency is tuned to the resonant frequency,
significant microwave power is inductively coupled in to the resonator.
Correspondingly, the reflected power output across the diode is reduced. In this way one
can identify the resonance frequency corresponding to the drop in the reflected signal.

34
Figure 2.10: Schematic of floating hairpin resonance probe and the circuit for detecting
the resonance peak.
2.5.2 Resonance frequency and its characteristics in vacuum
Figure 2.11: Amplitude of reflected signal in vacuum and in plasma for a sweep of
frequency.
Reflected signal
amplitude (Y)
Microwave
Source
Digital oscilloscope
Directional
Coupler
Hairpin
50 Ω
coax
ial
Loop
antenna
Ceramic
Encasing Diode Frequency
(X)
Injected signal

35
In figure 2.11, reflected signals are plotted, one under vacuum (black) and the
other in plasma (red). The reflected signal is characterized by a negative amplitude
signal which sharply drops to zero at the resonance frequency. The resonance
frequency of the same probe shifts to higher value in plasma since the plasma
permittivity εp <1 while the resonance frequency of hairpin is inversely proportional to
the square root of εp. The formula that relates the measured resonances in vacuum and
in plasma to the electron density is given by equation (2.20). Hence we can estimate the
steady state electron density in the plasma using equation (2.20).
2.6 Dynamical plasma systems and measurement of time-resolved electron
density
2.6.1 Dynamical plasma systems
Plasma systems in which the variation in electron density is faster than the
period of the sweeping frequency (10-20 ms) are considered as dynamical plasma
systems. An example of a dynamical plasma system investigated in this thesis is a
pulsed dc magnetron discharge operated at 10 KHz with a 50% duty cycle. The
temporal evolution of the electron density in this case occurs at microsecond scales,
which is faster than the sweeping period. Another example of a dynamical system
discussed in this research is the temporal evolution of the electron density during pulse
laser photodetachment of negative ions. During pulsed laser photodetachment, the
electron density overshoots instantaneously (typically of the order of nanoseconds) and
then drops back to equilibrium on a time given by the response time of the negative ions
(typically few microseconds). The method of obtaining the time resolved electron
density is discussed in the following section.
2.6.2 Detection of resonance peak in time-resolved mode
There are two methods of obtaining time-resolved electron density namely: step
increment of frequency technique and the box-car technique. In the first technique the
reflected signal from the hairpin is observed as a function of trigger pulse at a single
frequency, however the box-car technique averages many signals at a discrete moment
of the discharge. The details of the above techniques are as follows:

36
Fig 2.12: Amplitude of reflected signals at different frequencies and time varying
electron density vs time.
The experimental setup to obtain the electron density in time-resolved mode by
step increment of frequency is the same as in the case of a steady state plasma. The only
difference is the oscilloscope is now synchronized with the trigger pulse. Figure 2.12
shows a schematic of the principle idea. The electron density is shown to be increasing
as a function of time following the trigger pulse. If the microwave source is operated in
the continuous wave (CW) mode it gives a single frequency output. If the probe is in
resonance at any point of time during the trigger the reflected power shows a minimum
at that point of time. If the electron density dynamic is repeating at each trigger pulse, it
is possible to tune the CW to a next higher frequency, which will allow the probe to
resonate at a later time for increasing density. The process can be repeated to obtain a
spectrum of probe resonance frequencies as a function of time, and then it is
straightforward to obtain the electron density using equation (2.20). In this way, by
changing the frequency of the microwave we can get the time varying electron density.

37
The time resolution of the acquisition depends on both the acquisition limit of the
oscilloscope and the quality factor of the resonance signal. The former condition can be
improved by choosing a fast oscilloscope while the latter one is improved by improving
the quality factor. A choice of a longer hairpin will improve the quality factor and hence
the time resolution, but again there will be a compromise with the spatial resolution.
In the box-car technique, instead of sending a constant frequency to the
resonator the signal is acquired at a discrete point of time. The delay is used to give the
desired time width with a suitable delay from the reference time. The box-car integrator
averages the data points over many cycles before moving to the next time step. In this
way it produces the whole time resolved electron density profile. In this thesis we have
used the step increment of frequency technique to measure the time resolved electron
density.
2.6.3 Time-resolved electron density spectrum in a pulsed dc magnetron
discharge
The step increment of frequency technique explained above is applied to
measure the time evolution of the electron density in a pulsed dc magnetron discharge
described in section 5.6.1. Figure 2.13 shows the spatio-temporal of electron density
along the centre line (measured at a distance of 65, 75, 85, 95 mm respectively from the
target). Corresponding time-resolved electron density for a one particular position (Z =
95 mm) is shown in the figure 2.14. The magnetron is operated with a 10 KHz pulsed dc
at a moderate 100 W power with 30% O2 and 70% argon and 10 mTorr discharge
pressure. The applied pulse voltage waveform from a 100x voltage probe is displayed
with a white line on the figure 2.13 with its magnitude on the right y axis. The distance
of the probe from the target is shown on the left y axis in figure 2.13 whereas the
electron density is represented by the colors.
The measurement of the time resolved electron density involves the increment of
frequencies from the lowest to the highest electron density. At each frequencies the
reflected signal from the probe are recorded. To improve the signal to noise ratio the
background signal in vacuum is subtracted from each of the reflected signals at all
frequencies.

38
Figure 2.13: a) Spatio-temporal evolution b) temporal evolution of electron density in a
pulsed dc magnetron discharge.
(a)
(b)

39
Chapter3
Sheath effects on electron density measurement by
hairpin probe
3.1 Motivation
The hairpin probe theory assumes that the inter-spacing between the pins of the
hairpin are uniformly filled with a homogeneous plasma. However such an assumption
is rarely achieved due to the presence of sheaths around the resonator pins in plasma.
The sheath is devoid of bulk electrons and is treated as a vacuum dielectric layer. This
vacuum dielectric layer modifies the effective permittivity surrounding the hairpin.
Hence an incorrect density is measured as obtained from the shift in the resonance
frequency. In general, one avoids the problem by choosing the spacing between the
pins to be much larger than typical sheath sizes. However, in low plasma densities that
are below 1016
m-3
and in radio frequency discharges (due to fluctuation in rf potential)
the sheath width is relatively large.
The effect of sheath width on the probe’s resonance frequency is a fundamental
problem. Although Stenzel [Stenzel 1976] considered this effect to be negligible
provided the separation between the pins is far greater than the typical sheath
dimensions. Until 2003 Hebner [Hebner 2001], Kim [Kim 1995] all used the hairpin
probes without considering the influence of the finite sheath width. Peijak in 2004
[Piejak 2004] first recognized the problem. He systematically compared the measured
electron densities with a Langmuir probe and an interferometry technique and found
that the electron densities, particularly of the lower order of 1016
m-3
range, were found
to be underestimated by over 40 % than those measured using interferometry. Finally he
proposed a model for the correction of the density measured in the case of floating
sheath.
The model for the floating sheath considers capacitance associated with
infinitely long coaxial cylinders wires. From that Piejak et al [Piejak 2004] obtained the
effective permittivity by providing the geometric sheath width based on a step front
sheath model. Following this principle, several authors [Curley 2008, Piejak 2005]
adopted this method for the correction of the electron density. Ganguly et al [Sands

40
2007] further modified the formula by taking into account the finite width of the
resonator. A brief review of this model is presented in section 3.2.
However one major limitation associated with the above method were the
dependencies on electron temperature and the initial guess of the electron density. This
is required for estimation of the sheath thickness. Peijak [Piejak 2004] used a Langmuir
probe for obtaining the electron temperature (Te). Thus in terms of practical benefit, the
use of hairpin posed no significant benefit as compared with a Langmuir probe.
Since then some useful suggestions were made such as the one unpublished
paper by Peijak [Piejak 2004a] in which he suggested biasing the hairpin up to the
plasma potential, thus helping to nullifying the sheath. Later Braithwaite et al [Haas
2005] applied this principle and proposed a model that includes the electrons in the
sheath by biasing the hairpin probe. However again the major problem remains due to
practical application of the hairpin when applied to magnetized plasmas and in plasmas
where the plasma potential is fluctuating at large rf potentials, therefore biasing of the
probe can introduce local perturbation, arcing etc. Furthermore it may be impractical to
bias the hairpin in depositing plasmas as the surface conductivity is compromised due to
any insulating depositions on the surface of the pins.
Therefore the question addressed in this chapter concerns whether one can
obtain accurate electron densities independently without relying on another diagnostic
for the additional information of electron temperature. Based on the above foreseen
limitations we present an alternative approach that considers applying a negative dc bias
to the probe for estimating the sheath width. This method is based on the well known
Child-Langmuir sheath model. In this technique the sheath width is estimated by
measuring the ion current corresponding to a finite negative potential applied to the
hairpin.
3.2 Effective permittivity of the plasma and sheath
Figure 3.1 shows a side view and a front view of the sheaths surrounding the
hairpin limbs. These sheaths are treated as a coaxial cylinder of radius b separated from
each other by distance 2(h-b) where 2h is the width of the hairpin probe. Assume the
capacitance of the sheath is Cs whereas the capacitance of the plasma between the
midplane up to the surface of sheath is given by Cp. Following Piejak [Piejak 2004] we
apply the method of images for obtaining the effective capacitance between the pins.

41
This reduces the problem to solving for the capacitance between the cylindrical wire
and mid-plane (as shown in figure 3.1).
Figure 3.1: Schematic of the side view and the front view of the hairpin limbs with wire
radius a, width 2h and sheath radius b.
The capacitance per unit length between any cylindrical wires situated at a
height h above a plane as given by Piejak [Piejak 2004] is
Here is the relative effective permittivity due to the plasma and the sheath.
However one can also treat the effective capacitance by expressing effective
capacitance in terms of series combination of capacitance of a cylinder of radius
equivalent to the sheath around the hairpin having permittivity o and a capacitance
from the outer surface of the cylinder to the mid-plane filled with plasma having
permittivity p where p= o p This is expressed as follows:
Equating these two expressions (3.1) and (3.2), we can obtain eff in terms of the
sheath dimension as follows:
In the above formulation Piejak [Piejak 2004] neglected the wire and the sheath radius
compared with the width of the hairpin probe. However at lower plasma densities,
typically of the order of 1015
m-3
, and an electron temperature of 3eV, the Debye sheath
is nearly 0.4 mm which is significant and thus cannot be neglected with respect to width
Cp
a b
Mid-plane
Cs
a

42
of the hairpin probe. The refined sheath capacitance formula by eliminating the
assumption of small sheath width is shown below.
Again the capacitance between a mid plane and a wire of radius a considering the wire
radius in the formula is given by
a
ah
a
h
a
h
Ceffeff
eff2
ln1ln
2
)4.3(
Using the same equation the capacitance between the mid plane and the sheath of radius
b is given by
b
bh
b
h
b
h
Cpp
p2
ln1ln
2
)5.3(
Here b is the radius of the sheath boundary.
The effective capacitance is equated to the series equivalent of the plasma capacitance
given by (3.5) and the sheath capacitance. In order to obtain Cs a hypothetical vacuum
cylinder of radius b is assumed and vacuum in the remaining space (h-b). Thus first by
equating Ceff with series equivalent of Cwp and Cs we can find the sheath capacitance Cs.
Here Cwp is the capacitance between the mid plane and the hypothetical cylinder of
radius b without plasma in equation (3.5) by replacingp with
0 and Ceff is given by
(3.4). Thus we can write
wps
wps
effCC
CCC
)6.3(
On substituting the value of Ceff and Cwp we can get the value of the sheath capacitance
which is given by
b
bh
a
ahCs
2ln
2ln
0 )7.3(
The series combination of (3.5) and (3.7) results in Ceff, which is equivalent to (3.4), by
doing this we can obtain a relationship between the effective permittivity εeff as a
function of p, a and b,
b
bh
b
bh
a
ah
a
ah
p
p
eff2
ln2
ln2
ln
2ln
)8.3(

43
From equation (3.8), when b = a as in the case of negligible sheath width, we observe
that the effective permittivity is equal to the plasma permittivity i.e. εeff = p. Again
when the sheath radius is comparable with the half width (mid-plane of the pins) we can
substitute b=h which gives the effective permittivity reducing to the vacuum
permittivity i.e. εeff =εo. The equation is similar to one obtained by Ganguly et al [Sands
2007]. Therefore equation (3.8) is better suited for a negative biased hairpin as
discussed further in section 3.4.
Figure 3.2: Correction factor due to the sheath as a function of the electron density
estimated by the Piejak formulation [Piejak 2004] and the modified formulation. The
electron temperature is 3eV, wire radius is 0.125mm and the hairpin probe length and
width are 30mm and 3mm respectively.
When the sheath width and wire radius is neglected with respect to the width of
hairpin probe, it gives a similar expression to that derived by Piejak [Piejak 2004].
Therefore by assuming b, a << h equation (3.8) can be rewritten as follows,
)/ln(]/2ln[)(
]/2ln[22
2
abfahf
bhf
or
op
(3.9)
Here we have substituted
which can be experimentally measured. On
substituting p from (2.13) in (3.9) we get

44
Λf
f
fff
r
o
orpe
2
2
222
1
, with
)/2ln(
)/ln(
ah
abΛ )10.3(
Thus ne(corrected) = ne(uncorrected)*correction factor where the correction factor is
given by
. For the Piejak formulation, is defined in equation (3.10),
whereas for the modified formulation (when the sheath width and wire radius are not
neglected in comparison with the width of the hairpin probe) it is given by
.
Figure 3.2 shows the comparison of correction factor obtained by the Piejak
formulation and the modified formulation. For estimating the sheath width, the step
front sheath model is used as described in Section 3.3. The Electron temperature is
taken to be 3 eV. As observed in the figure, the correction factor obtained by both
formulations agrees fairly well when the plasma density is higher than 2*1016
m-3
.
However the correction factor by Piejak’s model is found to be insufficient for lower
densities because the sheath sizes are larger compared with the pin separation.
Figure 3.3: Correction factor due to sheath as a function of electron density estimated by
modified formulation for different widths of the hairpin probe. The electron temperature
is 3eV, wire radius is 0.125mm and the hairpin probe length is 30mm.
Shown in figure 3.3 the correction factor is significantly reduced by increasing
the width of the hairpin probe from 2mm to 5mm for a constant plasma density and
electron temperature. However the compromise for going to larger width hairpins would

45
be on spatial resolution. As expected the correction factor also decreases with a decrease
in electron temperature, as observed in figure 3.4. In all cases (figure 3.3-3.4) it is
observed that the sheath correction is less significant when the plasma density is of the
order of 1016
m-3
or higher. However the sheath correction is recommended for plasma
densities of the order of 1015
m-3
and electron temperatures in the range of 1-5 eV or
higher.
Figure 3.4: Correction factor due to the sheath as a function of electron density
estimated by the modified formulation for different values of electron temperature. Wire
radius is 0.125mm and hairpin probe length and width are 30mm and 3mm respectively.
3.3 Sheath corrections and limitations of present model
The simplistic approach to correct for the presence of sheath is to provide the
sheath width in equation (3.10) [Piejak 2004]. The sheath width can be calculated by
using the well known Child-Langmuir sheath model or by using the step front sheath
model. The Child-Langmuir sheath model is based on the assumption that the sheath
potential should be much larger compared to the electron temperature (when measured
in electron Volts) [Chabert and Braithwaite 2011]. However this may not be truly
applicable for the hairpin probe because it is a floating probe, and is found to
overestimate the sheath width if applied [Piejak 2004]. Thus the step front sheath model
is the possible solution for evaluating the sheath width as suggested by Piejak et al
[Piejak 2004]. In the step front sheath model an electron free collision-less sheath is

46
assumed with cold positive ions. The equations governing the sheath are the ion flux
continuity equation; ion momentum equation and the Poisson’s equation
Here r, v, n, and are the radius, ion velocity, ion density and electrical potential,
respectively.
Figure 3.5: Plot of ratio of sheath radii to probe radii as a function of probe radii to
Debye length from the step front sheath model.
The solution of the above equations with the boundary conditions , and
provides the ratio of sheath radius to wire radius
(b/a) as a function of (a/λD). Here and are the electric potential normalized by the
electron temperature. is the mass ratio defined by . and are the
radius normalized by the Debye length. Subscripts a and b represent the probe surface
and the position of the sheath edge respectively.
Figure 3.5 shows the plot of b/a as a function of a/D obtained by numerically solving
equations (3.11) to (3.13) for argon. From figure 3.5 it is possible to deduce the sheath
width for a specific value of a/D to estimate the corrected electron density using

47
equation (3.10). Piejak et al [Piejak 2004] compared the value of b/a by the step front
sheath model with that obtained by the Child-Langmuir sheath model and found that the
ratio b/a is overestimated at lower values of a/D when using the Child-Langmuir
sheath model. However for a/D>0.3 both models gives nearly the same values of b/a
(see figure 4 in reference Piejak 2004). In practical situations, for example plasma
having a density 1x10¹⁵
m-3
to 1x10¹⁶
m-3
, 3 eV electron temperature and a wire radius
0.125mm for the hairpin probe, typical values of a/D are between 0.3 to 1. Thus it
appears that any one of the models can be used to estimate the sheath width for the
electron density correction.
The major drawback of this approach is that it invokes the use of a theoretical
sheath model which requires additional plasma parameters. For example in the step
front sheath model (SFSM) information of both the electron temperature and electron
density are required initially for obtaining λD. Thus a separate diagnostic such as a
Langmuir probe is needed for measuring the electron temperature, otherwise one needs
to provide a guess value as applied by [Piejak 2004]. However ne still remains an
unknown parameter. Therefore an approximate λD is first obtained using the uncorrected
ne which gives an initial value of b/a. This allows one to obtain Λ by substituting b/a in
equation (3.10). On obtaining the first round correction, the new ne is again used for
refining λD and the process is iterated until the ne value saturates to the actual density.
As evident, the above procedure has two major limitations. (1) The requirement
of an independent diagnostic for determining Te and initial guess for ne that is necessary
for calculating the sheath width. (2) The SFSM is only true for the floating sheath and
may not be valid for rf sheaths. This problem is common in industrial plasma tools that
apply capacitive radio frequency discharge. The amplitude of rf oscillation in plasma
potential can vary from a few 10’s to 100’s of Volts such as in the case of narrow gap
capacitive coupled plasmas used for nano-device fabrication plants. In such a scenario
the floating potential is driven more negative as compared to a floating sheath where the
rf oscillation is almost zero.
3.4 Sheath correction by a negative dc biased hairpin probe
The above limitations motivate for formulating an alternative method for the
sheath correction. In this section a negative dc biased hairpin is proposed. The principle
of sheath correction using this technique is discussed. The experimental set-up is
presented in section 3.4.3 followed by the experimental results and discussion in

48
sections 3.4 and 3.5 respectively. Finally, a high density plasma diagnostic is proposed
using this technique.
3.4.1 Basic principle
If the hairpin is biased to a negative dc potential without affecting the plasma
parameters, it will lead to the drawing of a net positive ion current. The negative
potential also leads to an increase in the sheath width and hence a decrease in the
resonance frequency. On estimating the sheath width from the measured voltage and
current along with the corresponding measured resonance frequency, it is possible to
deduce the corrected electron density using equation (3.10). Alternatively the resonance
frequency can be plotted using equation (3.10) as a function of sheath width (b) for a
fixed plasma density and compared with the measured value of the resonance frequency
as a function of sheath width for different bias voltages.
However the estimation of the sheath width from the measured current and
voltage for a cylindrical sheath relies on solving Poisson’s equation (as in the case of
step front sheath model) with defined boundary conditions and depends on the electron
temperature and electron density. Thus in the simplest case the sheath width can be
estimated by a Child-Langmuir sheath model given by
Here ji is the positive ion current density, b is sheath width, M is the mass of the
positive ion and V is the voltage on the probe with respect to the plasma potential. Using
the above equation one can obtain the sheath width by providing the ion current density
at the respective applied voltage to the probe. However, the Child-Langmuir sheath
model neglects electron space charge in the sheath and thus it can be applicable only for
a large negative bias that exceeds the electron temperature i.e. eV<<-kTe.
One advantage of applying this planar Child-Langmuir sheath model is to
eliminate the complexity arising in the case of the cylindrical sheath solution which
requires prior knowledge of the electron temperature and electron density. However, use
of the planar Child-Langmuir sheath assumption for cylindrical sheaths can only be
applicable for a thin sheath i.e. for low bias voltage (lower sheath width), it leads to an
overestimate of the value of sheath width for low density plasmas where the sheath
sizes are bigger. In the following section we found that the assumption of a planar
Child-Langmuir sheath model is valid and in agreement with the SFSM correction for

49
higher plasma densities, and overestimates the correction at low plasma density.
However the overestimation at low plasma density is still in the acceptable range for all
practical purposes.
3.4.2 Resonance frequency dependence on the sheath width
The theoretical curve of probe resonance frequency (fr) as a function of sheath
width (b) is plotted in figure 3.6. The relationship between the resonance frequency and
the sheath width is obtained from equations (3.8) and (1.7). In these equations we
substituted the values εeff and p which resulted in a bi-quadratic equation in fr given by:
Figure 3.6: Plot of the resonance frequency of a hairpin as a function of the sheath width
for various electron densities.
Where
and B=
.
One of the possible solutions of the above equation is plotted in figure 3.6 for a range of
plasma densities, particularly in the range where the sheath correction is expected to be
significant. In the above solutions the value of the sheath width b is arbitrarily varied
from the probe surface up to the mid-plane of the hairpin. As shown in figure 3.6 the
corresponding resonance frequency at which the sheath vanishes (i.e. b=0.125 mm) is

50
the ideal resonance frequency for that electron density. The larger the sheath width the
lower is the resonance frequency, approaching to the vacuum frequency as the sheath
width engulfs the space between the pins completely.
Figure 3.7: Amplitude of reflected signal vs frequency with and without bias.
The experimental realization of the probe resonance frequency shifting towards
the vacuum frequency with the application of a negative bias is shown in figure 3.7 in
an argon plasma. The resonance spectrum is measured in an ICP discharge (a detailed
description of the setup can be found in section 3.4.3) with an L-shaped hairpin probe
(L~25 mm, W~3mm and f0 =2.809 GHz) purposely built that allowed aligning the pins
in the uniform plasma region. As shown in figure 3.7 applying a negative bias increases
the space charge sheath around the resonator prongs and hence decreases the resonance
frequency. For a sufficiently large negative bias, the probe measures the resonance
frequency that approaches that obtained in vacuum.
3.4.3 Experimental setup
The experiment is performed in an Inductive Coupled Plasma (ICP) system. The
schematic of the setup is shown in figure 3.8 with a detailed description in section 5.4.1.
An argon discharge is generated between the helicon antenna of diameter 30 mm and
the cylindrical chamber of internal diameter of 200 mm. The helicon antenna is

51
mounted at the centre of the cylindrical chamber and powered by a 13.56 MHz ENI
ACG10B signal generator.
Figure 3.8: Top view of the ICP reactor with the hairpin probe and its measurement
circuit and Langmuir probe connected.
The hairpin tip (dimensions of the hairpin probe tip are mentioned in figure 3.6)
is set at right angles to the axis of the probe feed-through and hence resembles the L-
shape of the english alphabet. This design of the hairpin allows the probe to be in a
uniform plasma having a negligible density gradient along the length of the hairpin. The
hairpin probe is installed through one of the side ports such that it is approximately 40
mm distant from the helicon antenna. The hairpin probe tip is connected to a dc power
supply for biasing it with a negative potential. The current during the applied bias is
measured across a 50 Ώ resistor with respect to ground. The microwave generator, dc
power supply and oscilloscope are controlled by LabVIEW. Briefly, a voltage ramp is
generated and the corresponding resonance frequency and current at each bias voltage is
collected. A Langmuir probe is also installed from the opposite port to measure the
electron temperature that is required to compare the results obtained for sheath
correction using the step front sheath model.
Pyrex
Window
Chamber
Coupler
Diode
Microwave
Source
Oscilloscope A
Matching
Unit
RF
Generator
Langmuir
probe
Side ports
Antenna R
F
G
M
U
Top ports
PC
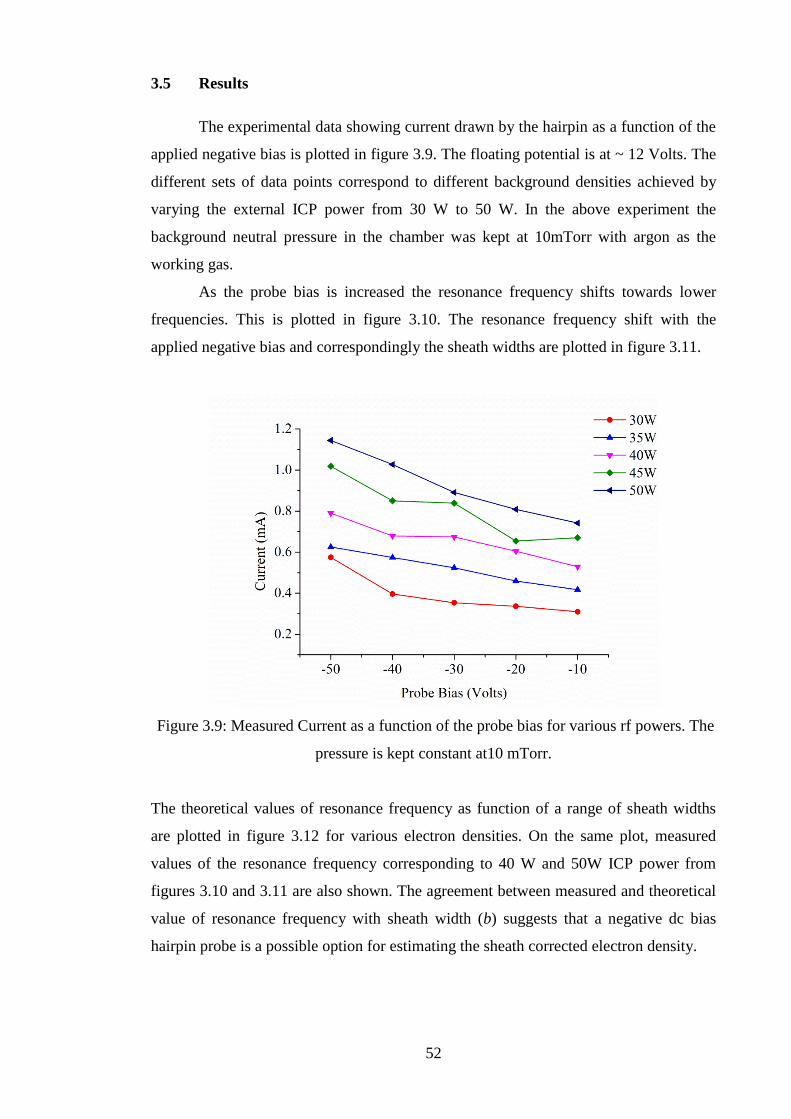
52
3.5 Results
The experimental data showing current drawn by the hairpin as a function of the
applied negative bias is plotted in figure 3.9. The floating potential is at ~ 12 Volts. The
different sets of data points correspond to different background densities achieved by
varying the external ICP power from 30 W to 50 W. In the above experiment the
background neutral pressure in the chamber was kept at 10mTorr with argon as the
working gas.
As the probe bias is increased the resonance frequency shifts towards lower
frequencies. This is plotted in figure 3.10. The resonance frequency shift with the
applied negative bias and correspondingly the sheath widths are plotted in figure 3.11.
Figure 3.9: Measured Current as a function of the probe bias for various rf powers. The
pressure is kept constant at10 mTorr.
The theoretical values of resonance frequency as function of a range of sheath widths
are plotted in figure 3.12 for various electron densities. On the same plot, measured
values of the resonance frequency corresponding to 40 W and 50W ICP power from
figures 3.10 and 3.11 are also shown. The agreement between measured and theoretical
value of resonance frequency with sheath width (b) suggests that a negative dc bias
hairpin probe is a possible option for estimating the sheath corrected electron density.

53
Figure 3.10: Measured resonance frequency as a function of probe bias for various rf
powers at 10 mTorr operating pressure.
Figure 3.11: Sheath width estimated by the Child-Langmuir sheath model as a function
of probe bias for various rf powers at 10 mTorr operating pressure.
Corresponding sheath corrected and sheath uncorrected electron densities at 40W ICP
power and 10mT gas pressure are plotted in figure 3.13 as a function of probe bias. The
sheath corrected electron density is obtained by using equation (3.10) with the modified
expression for and providing the sheath width from figure 3.11 It is clear from figure
3.13 that the probe bias up to -50V has no change in the corrected electron density

54
which is consistent with the fact that biasing the probe should not modify the plasma
parameters surrounding it.
Figure 3.12: Plot of resonance frequency as a function of sheath width from theory
(line) and experiments (Dots: square-50W, circle-40W).
In figure 3.14 we considered the plasma density in the range less than 5x10¹⁶
m-3
as the sheath corrections are significant. By applying the same principle we compared
the corrected electron density obtained by a negative dc biased hairpin probe at different
ICP powers with the SFSM as shown in figure 3.14. As shown in figure 3.14, the
difference between the corrected and the raw density (uncorrected) is found to be 41%
when the ICP power was operated at 25W as compared to 10% when the ICP power
was raised to 100W. Also observed is a small discrepancy between the planar Child-
Langmuir sheath model and the step front sheath model by approximately 12 %.
However as the density increases by increasing the rf power, the difference is reduced to
within 5 %. For obtaining the corrected electron density using the SFSM, the electron
temperature was measured using a Langmuir probe and it was found to be ~3eV
independent of the rf power. Finally the sheath width is calculated using the SFSM and
equation (3.10) for estimating the corrected electron density. The overestimation in the
sheath width at lower densities is attributed to simplifying the problem to a planar
Child-Langmuir sheath model.

55
Figure 3.13: Plot of sheath corrected and sheath uncorrected electron density as a
function of probe bias corresponding to 40W ICP power and 10 mTorr gas pressure.
Figure 3.14: Uncorrected and corrected electron density by the step front sheath
correction and dc bias hairpin probe (w~4mm) in an argon plasma as a function of rf
power at 10 mTorr operating pressure.
3.6 Discussion
The modified formula obtained for the sheath correction shows significantly
higher correction compared to Piejaks correction. At low plasma density (1x10¹⁵
m-3
)

56
the correction is about 25% higher than the Piejak correction for an electron temperature
of about 3 eV. Thus at low plasma densities, neglecting sheath width with respect to the
width of the hairpin to obtain the sheath correction is not a good approximation. Using
the modified sheath correction formula the effect of the hairpin probe width on sheath
correction is investigated. At 1x10¹⁵
m-3
electron density and 3eV electron temperature
the sheath correction is reduced from 85% to 50 % by changing the hairpin width from
2mm to 5mm which is still significant. Also, the hairpin of width above 5mm is
impractical to use because it affects the quality of the signal. Thus changing the hairpin
width is not a feasible solution to reduce the sheath effects at the expense of spatial
resolution.
The results presented in section 3.4 highlight the effective use of a negatively
biased hairpin for compensating underestimated densities due to the finite sheath around
the hairpin. An advantage clearly seen is that the sheath width can be found
independently without relying on the electron temperature as required in the case of the
SFSM. The negatively biased hairpin is based on the space charge limited current
collection by the probe. In the simplest case the sheath width can be estimated by the
planar Child-Langmuir sheath model i.e. using equation 3.14. Using this planar Child-
Langmuir sheath model eliminates the complexity of the sheath estimation as in the case
of the cylindrical probe which requires prior knowledge of the electron temperature,
electron density and numerical solution of Poisson’s equation for cylindrical geometry.
However the assumption of a planar sheath can overestimate the sheath width compared
to the cylindrical sheath because for a fixed probe area and given bias the current
collected by planar probes is small compared to cylindrical probes. The overestimation
can be higher in low density plasmas where the sheath sizes are bigger, however in high
density plasmas the assumption of a planar sheath can be applicable for cylindrical
sheaths [Chabert 2011]. This fact is apparent from figure 3.13. The discrepancy is found
to be higher at low density but as the density increases the planar Child-Langmuir
sheath model and the step front sheath model both give a reasonably good match to the
corrected density. Another uncertainty posed with the dc biased hairpin is that the
applied negative bias should be measured with respect to the plasma potential. In order
to overcome this limitation, we assumed the floating potential that can be conveniently
measured. The plasma potential can be approximated with the basic assumption of a
finite electron temperature and the gas used. Since the applied negative bias is
significantly larger compared to the plasma potential, therefore the error associated with

57
this assumption (neglecting plasma potential with respect to the applied bias potential)
is minimal.
One should also be careful about the magnitude of the bias voltage because the
planar Child-Langmuir sheath model used in the calculation cannot be applicable when
the sheath sizes are much greater than the probe dimension. In this study we found that
the theoretical and measured value of resonance frequency as a function of sheath width
matches very well for a probe bias of less than -50 volt but the results can deviate for
higher bias voltages. The corresponding electron density also remains constant with
probe bias after sheath correction as shown in figure 3.13 (red dots). Finally the electron
density is corrected using the negative dc hairpin probe and compared with the step
front sheath correction (the only available and widely accepted technique to correct for
the sheath). Good agreement between these two techniques validate the assumption of
the planar Child-Langmuir sheath model for estimating the sheath width from the
measured current and voltage and hence the corrected electron density.
The above method can also be useful for measuring higher plasma densities
which is currently limited (below 1018
m-3
) due to the practical range of the microwave
source, choice of vacuum resonance of the resonator and the dispersion of the resonance
signal due to electron thermal motion. To address this issue a finite sheath around the
hairpin is created by applying a negative dc bias thus bringing the resonance signal in
the measurable range and finally the underestimation in the electron density due to the
sheath is corrected by the technique described above. Unfortunately no results are
presented in this thesis for high density plasma diagnostics using this technique.
Hopefully the work will continue in the future.
3.7 Summary and conclusions
In this chapter we studied the effect of the sheath on the electron density
measurement by the hairpin probe. A modified formula for sheath correction is derived
which excludes the assumptions of previous formulations and is thus applicable for a
wider range of electron densities. Based on the modified formula the effect of the probe
width and electron temperature on the sheath correction is presented. It is concluded that
even by increasing the hairpin probe width the correction cannot be reduced
significantly. The negative dc biased hairpin probe is also studied to estimate the
corrected electron density due to the sheath. The agreement between the corrected
electron density obtained by the negative dc biased hairpin probe and modified sheath
58
correction formula (providing sheath width by SFSM) confirm the validity of negative
dc biased hairpin probe to use for the sheath correction. Finally a high density plasma
diagnostic is proposed using a negatively dc biased hairpin probe.
In particular this method is better with respect to a positive biased hairpin
because a negative potential can be applied even to an insulating surface while the
perturbation to the plasma is significantly reduced. In addition one major advantage is
that additional information regarding the electron temperature is not required for the
estimation of the sheath width. Another advantage addressed is the usefulness of the
biasing technique for shifting the resonance frequency to a lower frequency range. This
is necessary if the measurable densities are greater than 1018
m-3
which demands an
impractical size of the hairpin. For example a 1 – 8 GHz source can measure electron
densities up to 8×10¹⁷
m-3
, provided the vacuum resonance is 1 GHz. This would imply
that the required length of the hairpin is 75 mm. Also at very high plasma densities,
electron thermal motion results in the dispersion of the resonance signal.

59
Chapter 4
Theoretical investigation of the sheath around a
cylindrical probe in electronegative plasmas
4.1 Motivation and background
The hairpin probe measurement is greatly affected by the presence of a sheath as
discussed in the previous chapter. These effects are dominant in low density plasmas
where the sheath sizes are bigger. Since electrons are lighter in mass, the sheath
properties are mostly described by electronic parameters such as the electron density
and electron temperature. However along with the electrons, the sheaths are also
influenced by the presence of other charged species in the plasma. Electronegative
plasmas are one of the examples in which the majority of the electron population is
replaced by negative ions, and hence the sheath and discharge properties are mainly
governed by these particles. Negative ions are heavier in mass compared to electrons,
and thus having lower temperature they affect the positive ion fluxes collected by the
surface and can change the sheath dimensions. Thus before applying hairpin probes to
electronegative plasmas it is important to understand the sheath properties in the
presence of negative ions. Since hairpin probes consist of two cylindrical pins, in the
simplest case it is adequate to investigate a single cylindrical pin interaction with an
electronegative plasma, thereafter assuming the effect will be the same on the other pin.
Thus the problem is reduced to investigating a cylindrical probe (similar to a cylindrical
Langmuir probe) interaction with an electronegative plasma.
The presence of negative ions and their influence on Langmuir probe was first
addressed in 1935 [Spencer-Smith, 1935]. Since then significant research on the theory
of plasma probe interaction in electro-negative plasma have been published [Braithwaite
1988, Amemiya 1999, Franklin 2000, Kono 2001, Sheridan 1999]. Most theories
addressed the modification in the positive ion flux collected by the probe caused by the
presence of negative ions.
An important observation found from numerical studies of the sheath at a
spherical probe by Braithwaite and Allen [Braithwaite, 1988] found a parameter range
where the positive ion flux becomes multi-valued. They proposed that the sheath forms
at the first location where charge neutrality is violated. However this leads to a
discontinuity in the ion flux at some values of the negative ion concentration [Sheridan

60
1999]. Leading to the discontinuity in the ion flux this theory predicts very well the
beginning of sheath i.e. the point at which charge neutrality is violated first. However as
proposed by J E Allen [Allen 2004] this theory can’t be used to estimate the positive ion
flux leaving the discharge.
Relaxing the plasma approximations, Sheridan et al in 1999 [Sheridan 1999] put
forward a fluid model to compute the flux of positive ions from a low-pressure planar
electronegative discharge. The flux continuity equation, momentum conservation
equation and Poisson’s equation governing the transition from quasineutral plasmas to
the sheath were solved as an initial value problem using the boundary conditions u0, η0,
ε0=0, for q=0 and for q>0 at the centre of the
discharge. Here u0, η0, ε0, and q are normalized parameters described in reference
[Sheridan 1999]. For addressing the multi-valued ion flux, Sheridan et al proposed the
correct solution is the one which gives the larger value of flux. The physical
interpretation of this multi-valuation in the positive ion flux was briefly discussed by
Kono et al [Kono 2003]. According to Kono, when the positive ion attains the modified
Bohm speed in the presence of negative ions, quasineutrality breaks down and the space
charge begins to develop until all the negative ions are repelled by the potential. Once
all the negative ions are repelled, the space charge starts decreasing because the
modified Bohm speed is smaller than the Bohm speed without negative ions i.e.
. Positive ions start decelerating which again creates a positive space charge
and the process continues to form oscillatory solutions until the actual Bohm speed is
gained by the positive ions. Finally, using a fluid model Franklin [Franklin 2000]
analyzed the influence of the positive ion thermal motion on the oscillatory solutions.
He found that the oscillatory solution is mainly due to the unphysical assumption of a
significant difference between the temperatures of the ions. By considering the finite
temperature of positive ions Franklin found that the oscillations in the electric field are
suppressed.
In this study we followed a similar approach to that proposed by Sheridan et al
[Sheridan 1999]. Thus, without assuming quasineutrality the equations governing the
sheath around cylindrical probes are solved from the bulk plasma to the edge of the
probe. The profile of the electric potential is obtained with respect to different plasma
parameters. Finally, the sheath width is obtained by using curvature criterion [Crespo
2006] for different sets of parameters range. Before dealing with the electronegative
plasma sheath, we first discuss the Bohm criterion in electropositive plasmas.

61
4.2 Bohm speed in electropositive plasma
The transition from a quasineutral plasma to the plasma sheath is not abrupt. There is a
transitional layer that exists between the plasma and the sheath (as shown in figure 4.1)
to maintain the continuity of ion flux. This layer is known as the presheath region which
has a length several times that of the Debye length. In this region ions get accelerated
and acquire a finite velocity known as the Bohm velocity. Thus there must be a finite
electric field in this region.
Figure 4.1: Spatial profile of the electric potential and charged particles densities in the
plasma, presheath and sheath region.

62
We assume a simple system in which we consider:
i) Maxwellian distribution of electrons with temperature Te
ii) Cold positive ions i.e. Ti=0
iii) nes=nis at the edge of the sheath and presheath
The positive ion flux and acceleration of positive ion is given by the continuity equation
and the momentum equation, which are given by equation 4.1 (neglecting ionization
and momentum transfer collisions).
Where and are the positive ion density and positive ion fluid speed at the sheath
edge, ni(x) and ui(x) are the ion density and velocity respectively at any position from
the surface inside the sheath, is electric potential and M is the mass of positive ions.
On substituting the ion fluid speed from the momentum equation into the continuity
equation, we obtain the ion density in the sheath as a function of the electric potential as
The electron density distribution is given by the Boltzmann relation as
The electric potential ( ) in the sheath can be obtained by using the Poisson equation,
Here ε0 is the permittivity of free space. By substituting ne and ni from (4.2) and (4.3) in
to (4.4), we obtain a non-linear equation governing the sheath potential, electron density
and ion density as
The above equation is a second order non-linear differential equation whose first
integral can be obtained analytically by multiplying and integrating with respect
to x, along with the boundary conditions ( , at x=0).

63
Above equation can be integrated numerically to obtain the value of . However it is
straightforward to see that the term on the right hand side of equation (4.6) should be
positive for a solution to exist. Using the Taylor’s expansion for small and imposing
this positive condition, the right hand side gives
Where is called the Bohm velocity. The equation (4.7) is known as the Bohm sheath
criterion, which implies that the ion flow speed at the sheath boundary must be at least
as great as the ion acoustic speed. To acquire this velocity there must be a finite electric
field in the bulk plasma over some distance. This region is known as the presheath
region, and is typically much wider than the sheath. The potential drop in the presheath
region to accelerate ions to the Bohm speed can be estimated by
Where is the potential at the sheath edge with respect to the plasma potential. On
substituting the value of the Bohm speed in equation (4.8) we get .
Thus to accelerate ions to Bohm velocity, the potential drop in the presheath region is of
the order of the electron temperature.
4.3 Equilibrium properties of sheaths in the presence of negative ions
4.3.1 Bohm criterion in the presence of negative ions
As discussed in the case of electropositive plasmas, the Bohm criterion
signifies the breakdown of quasineutrality resulting in the beginning of a space charge
region. It is an inequality that states that the ion flow speed at the plasma sheath
boundary must be at least as great as the ion acoustic speed. The Bohm criterion gets
modified due to the presence of negative ions in the plasma, because of their higher
mass compared to electrons. Using sonic flow at the sheath edge, Wickens and Allen in
1978 [Wickens 1978] obtained the modified Bohm speed in plasmas having two
electron temperatures. The expression is then generalized to negative ion containing
plasmas given as (a detailed derivation can be found in the next section)

64
Where is the Bohm speed in electropositive plasmas, is the ratio of the
electron temperature to the negative ion temperature, and is the ratio of the negative
ion density to the electron density at the sheath edge. Because of the low temperature of
the negative ions compared to electrons, they can be repelled by the sheath edge
potential, thus must be different from (ratio of the negative ion to the electron
density in the bulk plasma). If is the potential at the sheath-presheath edge with
respect to the plasma, then by assuming a Maxwellian distribution for electrons and
negative ions, can be related to as
From the equation (4.9) we found that the speed of positive ions, at the sheath edge is
dependent on and . For large values of and modest values of the positive ion
speed at the sheath edge is reduced significantly. Ignoring collisions can be
expressed as
Figure 4.2: Plot of the sheath edge potential as a function of the electronegativity (0)
[Braithwaite 1988].
Equations (4.10) and (4.11) can be solved to obtain as a function of (ratio of
negative ion density to electron density in the bulk plasma). The curve of as a
function of for different values of γ is shown in figure 4.2. It is clear from the figure

65
that as the electronegativity increases the potential at the sheath-presheath edge
decreases For a specific range of the Bohm criterion in electronegative plasmas can
also be satisfied at more than two positions (blue curve in figure 4.2 from A to B) i.e.
three values of for given value of and . This multi-valuation of the Bohm
criterion in electronegative plasmas was first discussed by Braithwaite and Allen
[Braithwaite 1988]. According to Braithwaite and Allen the multiple solution exists for
.
4.3.2 Basic formulation of the model
In this section we present the basic formulation of the sheath surrounding
cylindrical probes. The steady state fluid equations of continuity and momentum for the
positive ions are written in a cylindrical coordinate system [Chung 2006]. For simplicity
we restrict our analysis to weakly collisional plasmas with negative ions, positive ions
and electrons. This is an appropriate assumption since the study in this thesis is limited
only to collision-less plasmas. Thus the parameter range is chosen such that the mean
free path λmfp for electron-neutral and ion-neutral collisions can be neglected inside the
sheath. However we consider weak collisionality within the pre-sheath region defined
by a collision frequency υiz. The collisions in the pre-sheath govern the positive ion flux
to the probe. The probe is a cylindrical wire with its lengths lprobe >> rp; where rp is the
wire radius and rp ≤ λD the Debye length of the plasma.
When the wall losses of negative ions dominate over volume recombination (for
low pressure plasmas) then the negative ions will exist in thermal equilibrium with each
other, obeying the Boltzmann distribution function. In other words the negative ion
density should be determined mainly by transport. To satisfy this, the following relation
must hold in a region with length LBoltz [Kono 2001]:
Here D, ne, ng, ka
and n- are the diffusion coefficient, electron density, neutral gas density, electron
attachment rate co-efficient and negative ion density respectively. Thus the
characteristic time of loss of negative ions via diffusion should be much smaller than
the recovery time of negative ions via electron attachment. Thus we can write
Also for the electrons we can write,

66
Assuming, φ < 0 is the probe potential with respect to the plasma, ne0 and n-0 represent
respective densities in the bulk plasma, e = electronic charge, k = Boltzmann constant.
Because φ < 0, a non-neutral layer of positive ions is formed around the probe
and extends up to a certain radius from the probes surface. Beyond this region is a
diffused quasineutral boundary layer called the “pre-sheath” region having a very weak
electric field, while the plasma quasineutrality condition n+s ≈ nes + n-s is considered to
be valid in the pre-sheath region. Assuming the positive ions fall radially towards the
probe surface, thus neglecting the orbital motion of ions, the positive ion flux J+= n+v+
is given by the continuity equation as,
Here n+ and v+ are the ion density and velocity respectively at any radial position from
the probe and is ionization frequency. Acceleration of ions towards the probe is
governed by the momentum conservation equation:
Here M is the mass of positive ions.
For obtaining we use the Poisson equation;
Here ε0 is the free space permittivity. By substituting ne and n- from (4.12) and (4.13) in
(4.16) and using the following normalizing parameters;
We obtain the following dimensionless equation;
Following the analysis of the quasi-neutral condition in the pre-sheath, we can consider
that for weak electric fields, d2ψ/dξ
2 ≈ 0 and dψ/dξ ≈ 0. Therefore equation (4.20) is
reduced to;

67
By solving the set of equations (4.18), (4.19) and (4.20) we obtain,
A condition for the normalized ion flux, at the sheath boundary ξs is obtained
by imposing the condition at the sheath boundary where the space charge begins to
develop resulting in sharp rise in electric field i.e.
. This condition is satisfied
by equating the denominator of (4.22) to zero. This gives the normalized positive ion
flux at the sheath boundary.
(4.23)
By general inspection of (4.21) and (4.23), the square-root term in (4.23) corresponds to
the normalized Bohm speed us for the positive ions, modified in the presence of
negative ions:
It can be verified that for electropositive plasmas (α0 = 0 i.e. αs = 0 from equation
(4.10)), equation (4.24) reduces to the absolute Bohm speed
which is similar to the one for electro-positive plasma for cold
positive ion (i.e. T+ ≈ 0). Equation (4.24) is similar to the one obtained by Sheridan et al
[Sheridan 1999] for planar discharge with = 0. Equation (4.24) gives multiple
solutions for specific values of sandas discussed in section 4.2.1
To obtain the complete potential profile and the position of the sheath edge the
quasineutral assumption is relaxed as proposed by Sheridan et al and the set of
equations (4.18) to (4.20) is solved numerically from the plasma to the probe using an
adaptive step size Runge-Kutta scheme. The four unknowns in these equations are , u,
ψ and dψ /dξ, hence four initial values are necessary to be defined for these parameters
in order to solve the coupled equations, which is described in the following section.

68
4.3.3 Boundary Conditions
The equations are solved from ξ∞ to any arbitrarily small value of ξ. Far away from
the probe i.e. in the plasma (ξ >> r), we assume the quasineutral condition such that the
normalized density = 1, where ψ and dψ /dξ ≈ 0. To obtain the initial value of u at the
defined position in the plasma ξ >> r from where the equations (4.18) to (4.20) are
integrated; we consider the following: First we drop the ionization collision term on the
right hand side of (4.18) and integrate with respect to ξ to obtain,
From (4.25), (4.19) and (4.20) one can obtain u for specific values of ξ >> r. Here a is
the normalized current density defined as:
here,
is the Debye
current density and I+ =2πern+v+ is the positive ion current per unit length of the probe.
Therefore one can solve (4.18) to (4.20) for obtaining the normalized electric potential,
electric field, density and the velocity profile from the plasma to the probe surface.
4.3.4 Methods of finding the sheath boundary
The sheath thickness is mainly defined by the position of the sheath edge from the
probe surface which is rather difficult to determine due to the smooth behavior of
parameters describing the sheath. However this point can be located by high positive
ion current density. Based on this there are different ways of interpreting the sheath
boundary. One of the techniques, commonly known as the curvature criteria [Crespo
2006], interprets the sheath pre-sheath boundary as the point where the curvature of the
electric potential becomes maximum i.e.
. Where represent the curvature of
the normalized electric potential. Since there is no arbitrary parameter involved, the
curvature criterion is a suitable solution to find the position of the sheath edge. Figure
4.3 shows the spatial profile of the electric potential and its curvature. The electric
potential profile is obtained by numerically solving the sheath equations (4.18) to (4.20)
from the plasma to the probe. Figure 4.3 clearly shows a maximum in the curvature of
the electric potential profile. The value of ξ corresponding to this maximum is defined
as the position of the sheath edge.

69
Figure 4.3: Normalized potential and its curvature as a function of the normalized
distance from the probe surface (for a=10, q=0 and β=0).
4.4 Numerical simulation results
The main focus of this study is to obtain the thickness of the sheath around
cylindrical probes and the effect of the electronegative plasma parameters (and) on
it. For this purpose the model equations (4.18) to (4.20) are solved numerically using an
adaptive size Runge-Kutta method from the plasma to the edge of the probe with the
boundary conditions discussed in the previous section. However a choice of finite ξ is
required to solve the model equation because the probe sees an infinite plasma.
Therefore it is important to inspect the probe potential when this parameter is varied.
Figure 4.4(a) and 4.4(b) shows the variation of normalized probe potential as a function
of ξ. Figure 4.4(a) is plotted for different values of keeping q, a and constant,
however figure 4.4(b) is plotted for different values of the normalized current density,
keeping other parameters constant as described in the figure. As shown in figures 4.4(a)
and 4.4(b), the potential at the probe first increases monotonically and then saturates as
ξ is varied over a distance 10 λD to 100 λD. Thus a choice of ξ between 50 λD to 100 λD is
reasonable for the parameter range used in this study. Therefore for our analysis we
have chosen ξ = 100 λD as an upper limit of the integration to obtain the numerical
solutions to the model equations. However in some of the figures the spatial variation is
shown from the value below 100 λD. This is because the spatial behavior is almost the
same from the upper limit shown to the point ξ = 100 λD.

70
Figure 4.4: Effect of the integration length ξ on the probe potential (a) Parameters:
γ=10, q=0, β=0 and a=10 (b) α=0.5, γ=10, β=0 and q=0.
4.4.1 Sheath potential
The normalized sheath potential profile is first obtained for different values of α by
solving the complete set of non-linear equations numerically. In this calculation, the
ionizing collisions in the pre-sheath are completely ignored by assuming q = 0. Ion
thermal motion is considered to be infinitely small, i.e. β ≈ 0. From figure 4.5 we
observe that at a fixed value of the normalized positive ion current, the normalized
sheath potential increases monotonically with Hence the sheath width also increases
with the electronegativity for a constant value of normalized positive ion current. This
result is a consequence of keeping the ion flux constant at the probe surface. As
observed in equation (4.11); an increase in the electronegativity results in a drop in the
pre-sheath potential as well as the positive ion speed at the sheath–presheath boundary.
Consequently the positive ion flux at the sheath boundary should reduce. However we
have chosen our boundary condition by defining a constant positive current density a
using equation (4.25). To conserve this current, the sheath boundary expands radially
such that the integrated surface charge density of positive ions is constant in the sheath
region. This observation is found to be consistent with that obtained by Amemiya
[Amemiya 1999].

71
Figure 4.5: Plot of the spatial profile of the normalized sheath potential for different
For these calculations we have chosen q=0, a=5 and =0.
Figure 4.6: Plot of the spatial profile of the normalized sheath potential for different
values of the normalized positive ion current a

72
Figure 4.7: Plot of the spatial profile of the normalized sheath potential for different
values of
The effect of the normalized current density a and the temperature ratio is shown in
figure 4.6 and figure 4.7. As shown in figure 4.6: with the increase in the normalized
current density, the electric potential also increases and moves to the higher values of
Thus for increase in the current density for a constant value of and the sheath
width also increases. As shown in figure 4.7 the effect of on the electric potential
profile is not so significant. Hence changes in the temperature ratio won’t change the
sheath width significantly for constant values of a and .
4.4.2 Sheath width as a function of probe potential
The motivation behind the sheath modeling surrounding cylindrical probes in
electronegative plasmas is to obtain the sheath width. In this section we obtain the
normalized sheath width as a function of the normalized probe potential using the
curvature criterion described in previous section. The parameters chosen in this study
are outside the parameter range where multiple solutions exists [Braithwaite 1988].
Again, in the calculations the ionizing collisions in the pre-sheath are completely
ignored and ion thermal motion is neglected. This is an appropriate condition to
approximately estimate the sheath dimensions. The normalized sheath width is obtained
for two different values of by choosing a constant value of i.e. .

73
Figure 4.8: Plots showing the comparison of the normalized sheath width obtained for
two different values of using the curvature criterion.
The sheath thickness in figure 4.8 is found to be an increasing function of the probe
potential. If a constant positive ion current is considered, then the potential of the object
increases while ξ extends to larger values, implying a greater sheath width. This is
shown in figure 4.5. However in figure 4.8 we observe a decrease in the sheath width
for a given potential with increases in the electronegativity . This is in favour of
accurate hairpin probe measurement i.e. the smaller in the sheath width the smaller will
be the underestimation in the measured electron density by the hairpin probe.
The above observation is consistent as increasing the electronegativity decreases
the positive ion flux. Figure 4.9 shows how the positive ion current collected by the
probe affected with an increase in the electronegativity. The positive ion current
collected by the probe decreases with increase in .

74
Figure 4.9: Theoretical IV characteristic curves for different values of ξp ,α and γ
parameters for β=0, γ=10, ξp =5.
4.5 Summary and Conclusions
As discussed: the sheath around the cylindrical pins is an important parameter
for the hairpin probe. Their effect can be substantial when b/h ~1 (where b and h are
sheath width and probe half width respectively) because of its contribution to the
effective permittivity. In this chapter we further studied the effect of negative ions on
the sheath width. The model equations are solved in a cylindrical coordinate system
without assuming quasineutrality in the presheath region. The sheath and presheath
boundary is thus estimated on the basis of a curvature criterion i.e. the point at which
the curvature of the electric potential is maximum.
Important results thus obtained show the enhancement of the sheath potential
and the sheath width with electronegativity for similar positive ion fluxes to the
cylindrical probe. The sheath sizes are typically of the order of 1-25 times the Debye
length at a normalized probe potential of 2-20. This information is necessary for
designing hairpin probes in the subsequent chapter for electronegative plasma

75
diagnostics. Furthermore the model equation also includes the positive ion temperature
and collision frequency. Since the negative ions have nearly the same mass as that of the
positive ions thus the cold positive ion assumption cannot be valid. Therefore the
positive ion temperature should be included to better estimate the sheath width. The
effect of collision frequency is also studied, however it is not presented in this chapter
since it is not relevant to the scope of this thesis. Briefly, with increases in the collision
frequency, the sheath width is found to be decreased for a fixed ion current density.

76
Chapter 5
Hairpin probe in conjunction with laser
photodetachment for electronegative plasma diagnostic
5.1 Introduction
Most of the gases used in technological plasma applications used for the etching
of semiconductors in the microelectronic and photonic industries are electronegative in
nature. As a consequence it results in the formation of a significant fraction of negative
ions in the plasma. The presence of negative ions has a dramatic effect on plasma
processing. Powder formation in chemically active plasmas has been attributed to
negative ions which accentuate the mechanism [Howling 1994]. The negative ions also
affect the discharge structure and the sheaths as reviewed and discussed in Chapter 4.
This has inspired a number of theoretical works since the 1990’s and recent debates on
the theories of electronegative discharges by Franklin, Lampe [Lampe 2003, Franklin
2005, Lampe 2006].
Some of the most important and interesting problems related to the existence of
various kinds of instabilities and double layers are associated with electronegative
plasmas [Chabert 2006]. Therefore diagnosis of negative ion discharges is important for
the experimental verification of the above theories as well as for the quantification of
basic discharge parameters for a wide range of applications. Probe assisted laser
photodetachment is a commonly used technique for electronegative plasma diagnostics
in which the temporal evolution of current to a positively biased Langmuir probe is
measured. In this chapter we present the application of hairpin probes for measuring
negative ion parameters; namely the negative ion density and temperature during laser
photodetachment. Hairpins have several advantages compared with the conventional
Langmuir probe, particularly in magnetized plasmas where Langmuir probes tend to
deplete electrons. Additional limitations apply in the case of probe surfaces being
exposed to oxide deposition, as in the case of pulsed magnetron sputtering [Dodd 2010].
The insulating films developed can severely hamper the accuracy of the measured
electron saturation current. In some plasma reactors, typically those used in plasma
manufacturing industries, there are large amplitude rf oscillations in the plasma
potential. The presence of a Langmuir probe in such cases can severely disturb the
plasma. Due to the above limitations, the hairpin is considered as a possible candidate

77
for the diagnosis of electronegative plasmas. This study is also important to benchmark
the technique of pulse biased hairpin probes, which is presented in chapter 6.
The chapter is presented as follow: in section 5.2 principle behind pulsed laser
photodetachment is discussed. Experimental results are presented in section 5.3 and 5.4
on oxygen negative ion density characterization in an inductive ion source at Dublin
City University. In section 5.5 we present time-resolved negative ion density
measurements for the first time using a hairpin probe in pulsed dc magnetron discharges
and a comparison with Langmuir probe assisted photodetachment. This experiment was
carried out at the Electrical Engineering Department of University of Liverpool
following an invitation from Prof. James Bradley. In section 5.6 we discuss the
measurement of the negative ion temperature. The discrepancy in measuring negative
ion temperature on ignoring the ambipolar electric field created along the axis of the
beam with the adjacent plasma is also discussed. This caused an overestimation in the
measured negative ion temperature. In order to address this issue, we further used an
emissive probe for measuring the plasma potential behaviour. As shown in this section,
the negative ion temperature obtained from the plasma potential evolution is found to be
lower compared with the negative ion temperature obtained from the electron density
refilling time. Finally the summary and conclusion of the chapter is given in section 5.7.
5.2 Principle of probe assisted laser photodetachment
If the laser photon energy is tuned to a threshold value just enough for the
photodetachment of weakly bound electrons to the negative ions, one can detach
electrons from negative ions. This gives rise to a quasineutral equilibrium between
electrons and the background positive ions. As time evolves, an equilibrium is reached
between the electropositive plasma with the negative ion rich background plasma. This
is caused by negative ions diffusing from the surrounding plasma into the
electropositive region determined by their characteristic thermal speed. Thus by
measuring the temporal evolution of the electron density before and after detachment,
one can estimate the negative ion density. This is often done by using a Langmuir probe
operating in the electron saturation regime, which is proportional to the electron density.
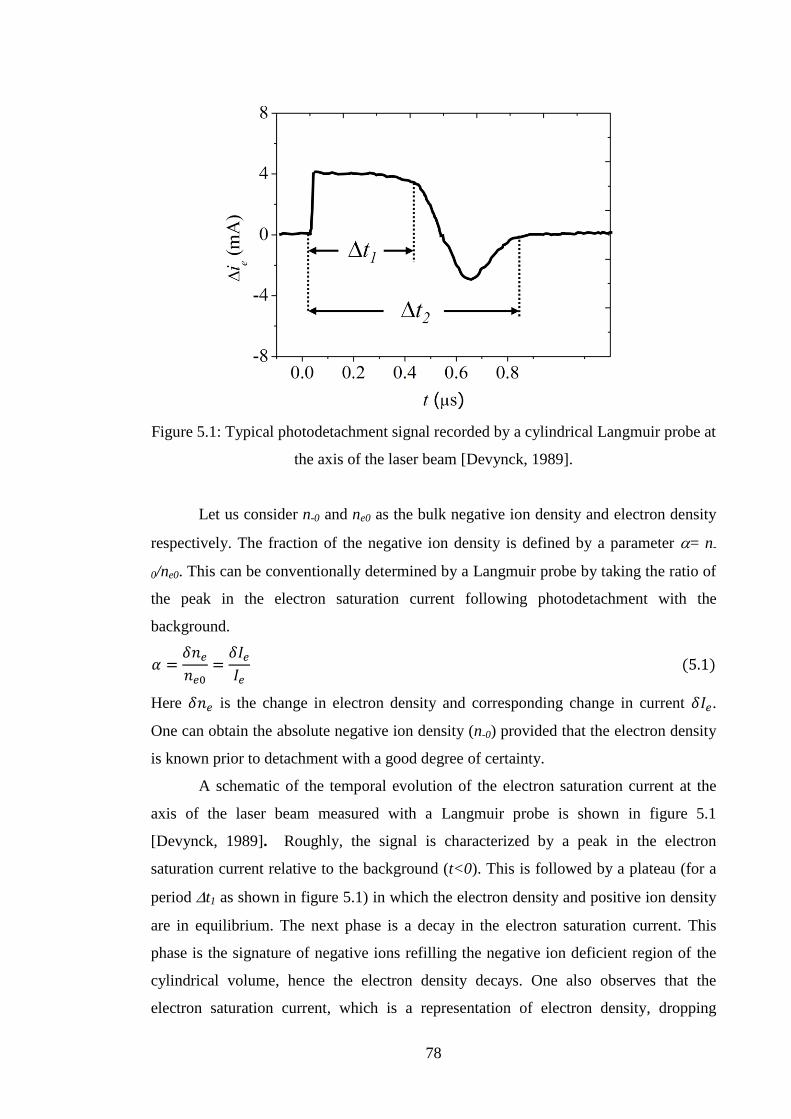
78
Figure 5.1: Typical photodetachment signal recorded by a cylindrical Langmuir probe at
the axis of the laser beam [Devynck, 1989].
Let us consider n-0 and ne0 as the bulk negative ion density and electron density
respectively. The fraction of the negative ion density is defined by a parameter = n-
0/ne0. This can be conventionally determined by a Langmuir probe by taking the ratio of
the peak in the electron saturation current following photodetachment with the
background.
Here is the change in electron density and corresponding change in current .
One can obtain the absolute negative ion density (n-0) provided that the electron density
is known prior to detachment with a good degree of certainty.
A schematic of the temporal evolution of the electron saturation current at the
axis of the laser beam measured with a Langmuir probe is shown in figure 5.1
[Devynck, 1989]. Roughly, the signal is characterized by a peak in the electron
saturation current relative to the background (t<0). This is followed by a plateau (for a
period t1 as shown in figure 5.1) in which the electron density and positive ion density
are in equilibrium. The next phase is a decay in the electron saturation current. This
phase is the signature of negative ions refilling the negative ion deficient region of the
cylindrical volume, hence the electron density decays. One also observes that the
electron saturation current, which is a representation of electron density, dropping

79
below the equilibrium level. This overshoot in the electron saturation current before
reaching the equilibrium value (after a period t2), reflects that some positive ions are
expelled from the laser illuminated region because of the creation of an ambipolar
electric field. We have addressed this problem in section 5.6 by applying an emissive
probe which finds that the plasma potential sharply rises following photodetachment.
5.3 Hairpin probe with laser photodetachment
5.3.1 Probe alignment and laser
The alignment of the hairpin probe for the laser photodetachment experiment is
quite tricky since the hairpin probe has two parallel cylindrical limbs. One also needs to
be careful about avoiding the interaction of the high power laser with the end of the
ceramic tube which encloses the coaxial cable and the loop. Keeping this in mind we
designed a hairpin probe in such a way that its pin’s are directed at an angle with respect
to the probe feedthrough. In this way the laser is coincident with more than 90% of the
hairpin probe while reflection from the ceramic holder encasing the loop was avoided
because the ceramic was situated outside the laser beam volume. Figure 5.2 shows a
schematic of the hairpin probe and laser beam.
To measure the absolute value of the negative ion density, the diameter of the
laser beam should be sufficient enough to detach electrons from negative ions which
influence the hairpin. In this experiment we have chosen a laser beam of diameter 6mm,
thereby assuming that it is adequate for this purpose (the hairpin probe width is ~3mm).
Figure 5.2: A schematic diagram of the hairpin probe and laser.
The experiment is carried out in the inductive oxygen discharge. Oxygen is well
known for its electronegativity and because of its low value of detachment energy. The
second harmonic corresponding to the 532 nm (2.33 eV) wavelength (green light) of the
Ceramic
Shield
D Laser
Beam
Probe Tip

80
laser is therefore suitable for photodetachment. This photon energy is however
insufficient for causing photodissociation (5.12 eV) or ionization of the O2 (Eiz = 12.07
eV) and O (Eiz = 13.6 eV) species [Shibata, 1997]. Whereas it is above the
photodetachment energy for the two main oxygen negative ions O2- (Ed = 0.44 eV) and
O- (Ed = 1.46 eV). Therefore the laser beam is only responsible for removing the extra
electron from negative ions. The photodetached electrons increase the net electron
density, which is measured by the time-resolved technique discussed in section 2.6.2.
The laser setup used in the experiment comprises the following parts:
(1) Innolas Spitlight 600 Nd : YAG laser which has a bandwidth of <0.003 mm-1
operated at a frequency of 10 Hz. The second harmonic of the laser is generated
using a temperature controlled type II KTP crystal. The resulting mixture of
infrared and green light is then fed into a harmonic separation assembly
composed of two dichroic mirrors that transmit infrared but reflect green light.
(2) A series of mirrors for reflecting the green light at 532 nm and steer the beam to
the laser exit aperture.
(3) A small sheet of glass for reflecting part of the laser beam onto a Thorlabs
Det210 fast photodiode that is used to trigger the oscilloscope.
The exit beam has a 6.0 mm diameter, which is steered using mirrors into the plasma
chamber (describe in section 5.4.1) through a quartz window, and passes at a specific
radial distance from the helical RF antenna enclosed inside the quartz exit port located
at the far end of the chamber.
5.3.2 Photodetachment signal along the illuminated region
If the laser flux is sufficient, then it is possible to detach electrons from all
negative ions in the path of laser beam (effect of laser flux on photodetachment fraction
is further studied in section 5.3.4). In this experiment we fixed the laser flux at ~2000
J/m2. Following the laser pulse, the electron density is expected to rise instantly and
then fall to the equilibrium value after some time. When the hairpin probe is employed
for detecting the rise and fall in the electron density, we adopt the step increment of
frequency technique for obtaining temporal values of the probe resonance in the case of
a time varying plasma density, as discussed in section 2.6.2. The procedure begins by
tuning the input frequency to the hairpin slightly above that at the resonance frequency
observed for the background plasma (before injecting the laser). The signal
corresponding to 2.12 GHz as shown in figure 5.3 is the resonance frequency of the
background plasma (t < 0 s) having a plasma density of about 3x10¹⁵
m-3
(data is taken

81
in an oxygen ICP discharge discussed in the section 5.4). In figure 5.3 the signals shown
are normalized by subtracting the individual background dc level corresponding to the
amplitude of the reflected signal when the probe is not in resonance. At t = 0 shown by
the trigger pulse applied for firing the laser, all signals have been scaled to reduce the dc
amplitude to zero prior to the laser pulse.
.
Figure 5.3: The hairpin probe signals on the axis of the laser beam following
photodetachment of oxygen negative ions at t = 0 shown by the trigger pulse applied for
firing the laser. The laser flux is kept constant a value of 2000 J/m2.
The dip in the hairpin probe signal at 2.12 GHz shows that the probe is off
resonance due to the generation of extra electrons from photodetachment of negative
ions. The probe remains off resonance over a substantial period of time (approximately
1-2 s) as the photoelectrons diffuse through the probe region. As the hairpin frequency
is gradually increased to bring the probe back to a resonance with the increased electron
density we observe that two distinct peaks begin to emerge. The first peak corresponds
to the increasing electron density, and second corresponds to a decreasing plasma
density following photodetachment. As the microwave frequency further increases the
two peaks move closer together as the probe is gradually brought to resonance with the
surrounding plasma, and when the hairpin driving frequency reaches resonance with the
photodetached plasma electron density, the two peaks merge into a single peak. This is
observed at 2.16 GHz as shown in figure 5.3, which corresponds to an electron density
of about 5.4x10¹⁵
m-3
. The absolute negative ion density is obtained by the subtraction

82
of the background electron density from the electron density corresponding to the
frequency of a single peak which is 2.4x10¹⁵
m-3
in the present case.
In the figure 5.3, although the electron density is the same during the rising and
falling phase, however we observe some asymmetry in the resonance peaks in time.
This is attributed to a sharp rise in density in the photodetachment phase followed by
the slow decay in density in the diffusion phase as the surrounding negative ions refill
the electropositive region.
5.3.3 Off-line of sight response
Figure 5.4: Hairpin signals recorded outside the laser beam (~4mm from the axis of the
laser beam) as the probe is tuned to the plasma electron density following
photodetachment of oxygen negative ions. The laser flux is kept constant a value of
2000 J/m2.
When the hairpin is placed at some radial distance outside the path of the beam, the
electron density dynamics are governed by negative ions diffusing in the electropositive
plasma region. This response is rather slow compared with the observed dynamics at the
centre of the beam. Therefore the rate of increase and the rate of decrease of the electron
density outside the beam are correspondingly slow. This allows the probe to respond in
accordance with the time-varying density, hence both the resonance peaks during the
rising and decaying phase are pronounced and symmetric as shown in figure 5.4 (data is
taken in an oxygen ICP discharge discussed in the section 5.4). Again at a background
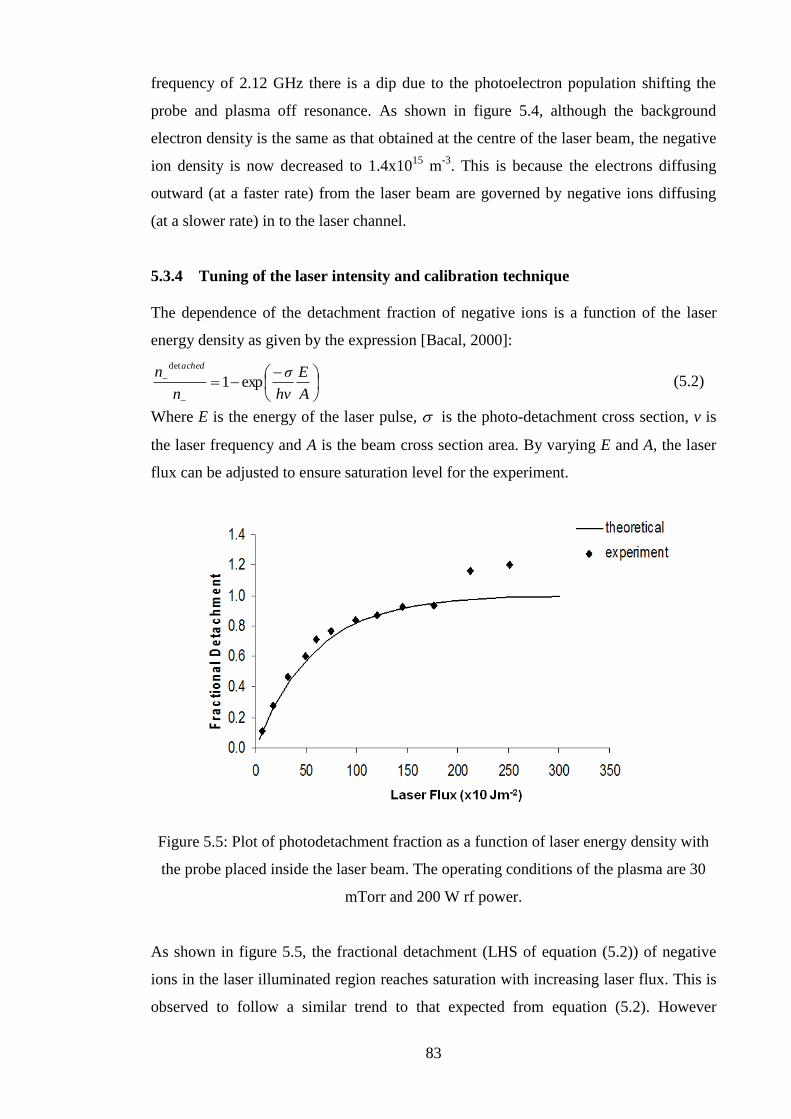
83
frequency of 2.12 GHz there is a dip due to the photoelectron population shifting the
probe and plasma off resonance. As shown in figure 5.4, although the background
electron density is the same as that obtained at the centre of the laser beam, the negative
ion density is now decreased to 1.4x10¹⁵
m-3
. This is because the electrons diffusing
outward (at a faster rate) from the laser beam are governed by negative ions diffusing
(at a slower rate) in to the laser channel.
5.3.4 Tuning of the laser intensity and calibration technique
The dependence of the detachment fraction of negative ions is a function of the laser
energy density as given by the expression [Bacal, 2000]:
A
E
hv
σ
n
nached
exp1
det
(5.2)
Where E is the energy of the laser pulse, is the photo-detachment cross section, v is
the laser frequency and A is the beam cross section area. By varying E and A, the laser
flux can be adjusted to ensure saturation level for the experiment.
Figure 5.5: Plot of photodetachment fraction as a function of laser energy density with
the probe placed inside the laser beam. The operating conditions of the plasma are 30
mTorr and 200 W rf power.
As shown in figure 5.5, the fractional detachment (LHS of equation (5.2)) of negative
ions in the laser illuminated region reaches saturation with increasing laser flux. This is
observed to follow a similar trend to that expected from equation (5.2). However

84
deviation from the theoretical plot is observed above 2000 J/m2. This deviation is
thought to be due to ablation from the probe. Ablation phenomena have been reported in
the case of Langmuir probes [Kajita, 2004] due to thermionic electron emission from
the probe surface which leads to spurious electron current signal. Since we reached a
photodetachment fraction of nearly 90% for 2000 J/m2, we have restricted the laser flux
to this value.
Figure 5.6: Hairpin probe data recorded at various positions moving from the beam
centre outwards. The operating conditions of the plasma are 30 mTorr and 200 W rf
power.
The interaction between the laser and the probe can be completely avoided by placing
the pins outside the path of the beam. This was also applied earlier for Langmuir probes
[Nishiura, 1999]. Because the probe pins are at a certain distance from the
electropositive channel, the electron density dynamics cannot be seen unless negative
ions begin to move into the detachment region. As the local negative ions move
inwards, the electrons from the electropositive region occupy the position of the
negative ions. This will happen on the time scale when the negative ions move at the
characteristic thermal speed. Therefore the probe situated outside the electropositive
signal will under-estimate the value of the negative ion density compared with the probe
directly placed in the electropositive region. This is because we are only observing the
secondary effect associated with the fractional amount of negative ions diffusing
inwards. Therefore the negative ions estimated by locating the probe at different radial

85
distances from the centre fall off with distance. However the trend is found to be
independent of the laser flux, as shown in figure 5.6. These measurements were
performed at reduced laser powers to avoid ablation effects. The data is normalized to
100 for each laser power.
At a distance of 3.0 mm from the centre the density drops by approximately 65
% of the peak density at the centre. After this distance, the density signal remains fairly
constant as the probe is moved to 6.0 mm. The profile of the spatial variation of the
electron density remains the same irrespective of the laser power used for
photodetachment. This suggests that one can estimate n-0 without having the probe
placed in the line of sight of the beam. Once a calibration curve is obtained, the negative
ion density can be measured by positioning the probe outside the path of the laser beam.
The laser can be operated at much higher powers without any interference of the probe.
This is evident from figure 5.7, which shows that no probe assisted interference was
caused compared with figure 5.5 when the probe was placed 4 mm from the center of
the beam as the laser power was pushed up to 3000 J/m2.
Figure 5.7: Plot of photodetachment fraction as a function of laser energy density with
the probe placed outside the laser beam. The operating conditions of the plasma are 30
mTorr and 200 W rf power

86
5.4 Negative ion density in oxygen ICP discharge
In this section we investigate the negative ion density using the above technique
in an oxygen ICP discharge. The absolute negative ion density is obtained for a range of
powers and pressures and the results are discussed.
5.4.1 Experimental setup
Figure 5.8: Schematic diagram of the experimental setup (top view) to detect the
negative ion density using laser photodetachment with a floating hairpin probe. M1 and
M2 - steering mirrors, G.P. - glass plate.
The experiment was carried out in the experimental setup called BARIS (BAsic
Radiofrequency Ion Source) at DCU. The setup shown in figure 5.8 is a stainless steel
cylindrical chamber 800 mm long with an internal radius of 100 mm. Gas is introduced
into the chamber using a STEC SEC-4000 series mass flow controller and the chamber
is pumped using a pfeiffer balzars turbomolecular pump which is backed by an edwards
rotary pump. An 11 turn helicon antenna of diameter 30 mm made from 1/8 inch
diameter gold plated copper tubing is mounted into the chamber region through one of
the chamber end walls along the chamber axis. The antenna is isolated from the vacuum
chamber by a Quartz tube (i.e. re-entrant configuration). The antenna is driven by a
13.56 MHz ENI ACG10B signal generator via a standard ‘L’ RFPP AM20 impedance
Pyrex
Window
M1 Laser
Chamber Matching
Unit
RF
Generator
Side ports
Antenna R
F
G
M
U
Coupler
Diode
Microwave
Source
Oscilloscope
M2
Photodiode
G. P.
Beam dump

87
matching unit. Water cooling of the antenna and discharge chamber allows the
discharge to be operated at power levels as high as 1 kW.
To allow access to the chamber for detachment experiments, a number of
viewports are present in the chamber. A 20 mm thick by 60 mm wide Pyrex viewport is
fitted into the antenna endwall of the chamber. This viewport extends radially from the
edge of the antenna out towards the flange edge. This window is mounted at the
Brewster angle to minimise laser light reflections back into the chamber. The opposite
end of the chamber is sealed with a 15mm thick Pyrex viewport allowing the laser beam
to enter the chamber at any position. The laser enters the chamber through the front
viewport and exits the chamber via the Brewster window beside the antenna. A hairpin
probe is inserted through one of the radial ports in the path of the laser beam as shown
in figure 5.8, such that the position of the probe is at a distance of 40 mm from the
quartz tube covering the coil. The oscilloscope is triggered by a photodiode signal
obtained via reflection from the glass plate placed in the path of the laser beam just
before entering the reactor. The microwave source is operated in the CW mode to
produce a single frequency output which is feed to the hairpin probe via a 50 Ohm
coaxial cable and a loop. The technique of measuring the absolute negative ion density
is based on finding the frequency that corresponds to the maximum amplitude of the
reflected signal following photodetachment (as discussed in section 5.3.2).
5.4.2 Electronegativity as a function of applied power and pressure
Effect of RF power
Figures 5.9 and 5.10, present a characterization of the electron density and the negative
oxygen ion density over a wide range of RF powers varied between 50 W and 500 W by
keeping a constant pressure of 30 mTorr with a flow rate of 100 sccm.
The electron density is found to increase almost linearly with increasing RF power
above 100 W. The linear relationship between the applied power and density suggests
the electron density no is below the critical limit at which absorbed power scales as, Pabs
∝ noIrf2 or
TeffB
abso
EAeu
Pn [Lieberman and Lichtenberg, 2005]. The negative ions are
primarily generated by dissociative attachment: e + O2 (O2)* O
- + O. This is
consistent with the experimental results plotted in figure 5.10 that shows that the
negative ion density rises linearly with electron density, hence we can confirm that

88
dissociative attachment is the dominant process for the production of negative oxygen
ions in the reactor. At low operating powers below 75W, the negative ion density is
found to be higher than the electron density, with a negative ion fraction α = n-0/ne0 =
1.5 as seen in figure 5.11. Whereas α drops significantly to about 0.3 with increasing rf
power. This is consistent with the fact that the electron density increases at a higher rate
than the negative ion density with increasing rf power. This suggests that negative ion
destruction mechanisms become increasingly prominent as the rf power increases up to
150W. The main destruction channels for negative ions are electron detachment and
ion-ion neutralization via the reactions e + O- O+2e and O
- +
O + O2. From
figure 5.9 the electron density in the plasma increases with rf power which would result
in an increased rate of destruction of negative ions, consistent with our finding. Above
150W α remains essentially constant indicating that equilibrium is reached between the
production and destruction rate of the negative ions as the electron density further
increases with rf power, provided the electron temperature remains constant. As the
measurements were performed at constant pressure, the electron temperature remains
essentially constant over the rf power range, and has been measured for the system to be
~4eV using a Langmuir probe.
Figure 5.9: Variation in electron density verses rf power (on beam) in an oxygen plasma
operating at 30 mTorr and 200 sccm.

89
Figure 5.10: Variation in negative ion density verses rf power (on beam) in an oxygen
plasma operating at 30 mTorr and 200 sccm.
Figure 5.11: Plot of the ratio of negative ion density to electron density verses rf power
(on-beam) in an oxygen plasma operating at 30 mTorr and 200 sccm.
Effect of pressure
The effect of background pressure on the electronegativity is presented in figure
5.12(a). The pressure was varied between 10.0 mTorr and 70.0 mTorr for a constant

90
Figure 5.12: Plot of (a) absolute total negative ion density (right abscissa) and, electron
density (left abscissa) and (b) = (n-/ne) verses total pressure. The radio frequency
power was set at 200 W.
flow rate of 100.0 sccm while keeping the RF power constant at 200 W. The graph
shows the electron density increases almost linearly and tends to saturate at higher
pressures. However the absolute value of the negative ion density decreases to within 20
% of the maximum density as the pressure is increased [c.f. 10 mTorr and 50 mTorr

91
data]. The plots of electronegativity α in figure 5.12(b) shows a consistent trend; that α
reaches a saturation with increasing background neutral density (pressure).
The observed decay of the negative ion density can be understood by
considering the following mechanism. The negative ions are formed by two competing
processes, one is the electron attachment (O2 + e O- + O; rate constant = 3.5 x 10
-17
m3s
-1 ), competing with constant losses by destruction of negative ions mainly via ion-
ion recombination (O- + O2
+ Neutrals; rate constant = 1.0 x 10
-13 m
3s
-1 ), and
associative detachment via reactions; Rate O- + O O2 + e; rate constant = 1.4 x 10
-16
m3s
-1 [Stoffels, 1995]. At sufficiently low pressures the dominant mechanism is the
dissociative attachment and ion-ion recombination. However as the pressure increases,
associative detachment also starts dominating and the discharge mainly becomes
detachment dominated. Therefore the negative ion density tends to decrease as the
pressure is increased. Similar behaviour has also been reported by previous authors in rf
capacitively coupled oxygen discharges [Stoffels, 1995]. The maximum value of for
these operating parameters is found to be ~ 0.7, at a background pressure of 10 mTorr.
5.4.3 Summary and conclusions
In this section we presented the application of the floating hairpin probe, in
conjunction with laser photodetachment, to the characterization of the absolute negative
ion density in an oxygen ICP discharge. The absolute value of the negative ion density
is obtained directly. Ablation effects are found to be negligible unlike the case where
Langmuir probes are used, as the probe is fully floating and does not draw a net current
from the plasma. However the effects can be enhanced in the case of depositing plasmas
where the ejected neutrals could become ionized. In this condition the probe can be
placed outside the beam and the negative ion density is still obtained provided that the
underestimation should be evaluated first at low laser power.
Using this technique the negative ion density is recorded as a function of rf
power and found to increase in a manner determined by the increase in electron density.
The electronegativity of the plasma is found to drop significantly with increasing power
as the rate of increase of n- is smaller than the rate of increase of ne. However we
observed no significant difference in the absolute negative ion density with operating
pressure at constant RF power. The difference is less than 20% for the pressure range of
10-50 mTorr. The electronegativity drops significantly with operating pressure,
revealing that the discharge is detachment dominated at high pressures.

92
5.5 Time resolved negative ion density: Comparison between the Hairpin probe
and Langmuir probe assisted photodetachment
This section is devoted to the measurement of the time resolved electron and negative
ion densities in an argon-oxygen pulsed discharge. The motivation behind this
experiment is to compare the electron and negative ion densities obtained by hairpin
probe assisted laser photodetachment with those obtained by Langmuir probe assisted
photodetachment. The detailed description of the experimental setup and the
comparison of results are presented in the following sections.
5.5.1 Description of the experimental setup
Figure 5.13: Magnetron sputtering and photodetachment systems for resonance hairpin
probe (RHP) assisted photodetachment. For the Langmuir probe (LP) measurements,
the microwave source and acquisition unit are replaced with the detection and
acquisition circuitry described in reference [You, 2010].
A schematic diagram of the magnetron discharge, together with the hairpin probe setup,
is shown in figure 5.13. A VTech 150 series unbalanced magnetron (Gencoa Ltd, UK)
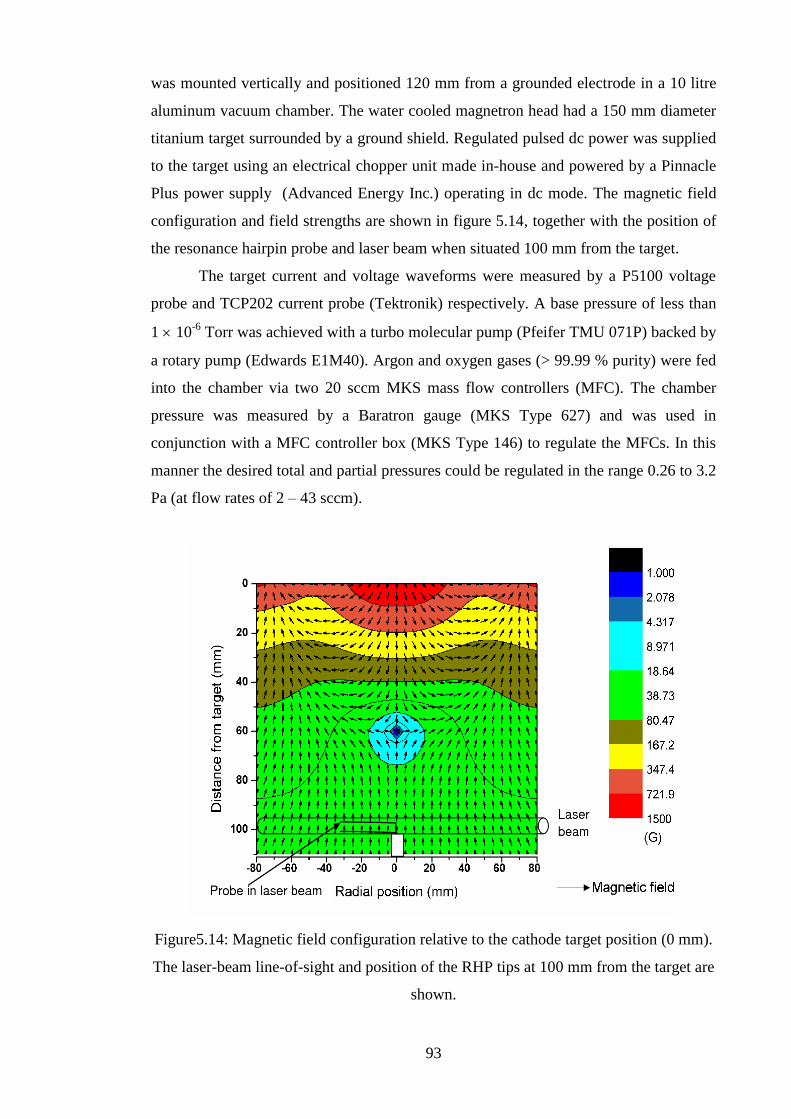
93
was mounted vertically and positioned 120 mm from a grounded electrode in a 10 litre
aluminum vacuum chamber. The water cooled magnetron head had a 150 mm diameter
titanium target surrounded by a ground shield. Regulated pulsed dc power was supplied
to the target using an electrical chopper unit made in-house and powered by a Pinnacle
Plus power supply (Advanced Energy Inc.) operating in dc mode. The magnetic field
configuration and field strengths are shown in figure 5.14, together with the position of
the resonance hairpin probe and laser beam when situated 100 mm from the target.
The target current and voltage waveforms were measured by a P5100 voltage
probe and TCP202 current probe (Tektronik) respectively. A base pressure of less than
1 10-6
Torr was achieved with a turbo molecular pump (Pfeifer TMU 071P) backed by
a rotary pump (Edwards E1M40). Argon and oxygen gases (> 99.99 % purity) were fed
into the chamber via two 20 sccm MKS mass flow controllers (MFC). The chamber
pressure was measured by a Baratron gauge (MKS Type 627) and was used in
conjunction with a MFC controller box (MKS Type 146) to regulate the MFCs. In this
manner the desired total and partial pressures could be regulated in the range 0.26 to 3.2
Pa (at flow rates of 2 – 43 sccm).
Figure5.14: Magnetic field configuration relative to the cathode target position (0 mm).
The laser-beam line-of-sight and position of the RHP tips at 100 mm from the target are
shown.

94
The resonance hairpin probe (RHP) was placed on the centerline in the
downstream plasma at a position of 100 mm from the target, and the alignment with the
laser is the same as discussed in section 5.3.1. This is the position close to the open field
lines. The RHP, due to its length, occupied a radial distance of 32 mm from the
discharge axis. The Langmuir probe was placed only at one position, a distance of 100
mm from the target (on the discharge centre line) occupying 3.5 mm of radial distance.
The laser used in this experiment is a frequency-doubled pulsed Q-switched Nd:
YAG laser (Quantel Brilliant B) with wavelength 532 nm. The laser repetition rate was
10 Hz with a 5 - 6 ns pulse width and a beam divergence of 0.5 mrads. By using
variable aperture (VA in figure 5.13) the beam diameter could be varied. A power meter
(PM) monitored a known fraction of the average laser beam power via a beam splitter
(BS). Optical access to the chamber was provided by two windows (W1 and W2) made
of synthetic fused silica 10 mm thick. To minimize film deposition on the windows,
which may cause reflections or reduce the optical transmission, they were positioned 10
cm from the chamber axis. The beam entered the chamber through the window W1 after
being directed by the turning mirrors (M1 and M2) and a periscope arrangement. The
laser beam exited the chamber through window W2 and its diameter and intensity
profile were measured by a laser beam analyser (LBA – US Beam Pro Photon Inc.
CMOS profiler). This was also used to ensure that the laser beam was co-axial with the
probe and blocking wire in case of eclipsed photodetachment. In these experiments the
laser beam diameter was set at 4 mm with a pulse energy of 30 mJ, giving an energy
density of 2400 J/m2.
5.5.2 Experimental results
In this study the pressure was fixed at ~10mTorr and the discharge was operated
at a power of 50W in 70% argon and 30% oxygen gas mixtures. Figure 5.15 shows a
plot of the measured temporal profile of the electron density ne and negative ion density
n- during the pulse cycle by both the RHP and LP techniques, 100 mm from the cathode
target. The two techniques were not done simultaneously, but carried out during
different experimental runs. In the on-phase of the pulse, the Langmuir probe values of
ne are larger than those determined by the RHP (up to about 50 %), however in the off–
time the values are in very close agreement. A similar discrepancy is obtained in the
temporal profile of the negative ion density. Compared to the hairpin probe, the
Langmuir probe measures a higher negative ion density in the on-phase, but gives

95
excellent agreement in the off-phase of the pulse. The highest value of n- determined at
this position was 1.5 x 10¹⁵
m-3
measured at the end of the off-time using the Langmuir
probe. It seems unlikely that the Langmuir probe can produce an overestimate of the
negative ion density, since we cannot detect more photoelectrons than exist in the beam,
and the results indicate that the RHP in this particular configuration is marginally less
sensitive in detecting the rise in electron density than the LP.
The discrepancy in electron density and negative ion density in the driven phase
of the discharge may be a result of the plasma being spatially inhomogeneous, with the
probes sampling different volumes of plasma due to the different extensions. The RHP
is 32 mm in length and radially samples 32 mm of plasma, cutting across the magnetic
flux lines. This is compared to only a 3.5 mm radial extension of the Langmuir probe
(with a length of typically 7 mm) from the axis, situated in a relatively field-free region.
In the off-time as the plasma decays and the electric fields collapses, the plasma may
become more evenly distributed, with smaller spatial gradients, and therefore the probes
will give more consistent results. Also, the LP measured electron currents may not give
a true measure of the local electron density, due to perturbation of the plasma, since for
the measurement of photoelectrons, the probe is always biased 20 V more positive than
the space potential. It is not straightforward to predict if the drawn electron current
would increase or decrease in such a case without a detailed study.
Figure 5.15: Negative ion (n-) and native electron (ne) densities for times during the
pulse (10 KHz frequency) measured by both the RHP and LP at 100 mm from the
target.

96
The discharge behaviour for both the RHP and LP techniques show higher values of n-
in the off-time compared to the on-time, and that n- clearly rises during the off-time.
This would indicate that oxygen plasma chemistry is taking place in the afterglow,
giving rise to the production of new O- ions. In the afterglow when Te falls rapidly, the
conditions are more favourable for the formation of negative ions (O-) through
dissociative electron attachment of highly-excited oxygen matastables, which
themselves are created in the pulse on-time [Dodd, 2010]. The cross-section for this
reaction increases with decreasing electron temperature and this is consistent with
conditions in the afterglow where the electrons cool to temperatures of about 0.5 eV
[You, 2010], For greatly extended off-times, the negative ion density can grow further
followed eventually by a decay which happens at a rate determined by the ambipolar
diffusion of the charged species to the wall [Dodd, 2010].
Figure 5.16: Negative ion-to-native electron density ratio =n-/ne measured by both the
RHP and LP techniques at 100 mm from the target.
Figure 5.16 shows a comparison of measured values of determined by both
techniques at a distance of 10 cm from the target. The trends in time during the pulse
cycle are in generally good agreement. Both techniques clearly show larger and
increasing values in the off time and lower and decreasing values in the on-time. The
worst agreement between the different probes occurs at t = 40 µs, with a discrepancy in
excess of 500%. As alluded to above, the difference in n-, and therefore , may stem

97
from the fact that the RHP has a larger radial extension than the LP, and therefore
detects photoelectrons originating from a larger plasma volume than the LP. In this
particular magnetic geometry, the O- densities may be largest on the axis, and therefore
the RHP, which is sampling a radial plasma, would show inherently lower n- values
than the Langmuir probe.
5.5.3 Summary and conclusions
A hairpin probe with laser photodetachment is successfully applied to the time
resolved measurement of the negative ion density in a pulsed dc magnetron discharge.
A comparison of the resonance hairpin probe technique with the more conventional
Langmuir probe assisted laser photodetachment generally shows very good agreement
in both n- and , particularly in the afterglow phase of the pulse cycle. In the on-time
however, the Langmuir probe typically gives higher values for both parameters by
factors in excess of 2 as the discharge current builds-up. The discrepancy in the on-
phase of the pulse is thought to be because of the spatial inhomogenity of the plasma.
Using this technique, the absolute O- densities and negative ion-to-electron density
ratios have been obtained during the pulse on and off-times. The results show the
highest O- densities occur in the afterglow with n- reaching 1.5 x 10
15 m
-3 at the end of
the off-time at a position 100 mm from the target, with degree of electronegativity of up
to 0.6.
5.6 Measurement of negative ion temperature
The hairpin probe can also be used for measuring negative ion temperatures
based on the temporal evolution of the electron density following photodetachment
[Conway 2010]. The underlying principle is based on identifying the recovery time of
the transient electron density signal. A similar technique was used earlier by [Bacal,
2000], where the electron saturation current was monitored with a Langmuir probe.
However we find that the negative ion temperature obtained from the density evolution
is overestimated compared with the negative ion temperatures obtained if we consider
the plasma potential evolution. It will be shown that the latter technique is more
accurate compared with the temperature obtained from the recovery time of the electron
density.
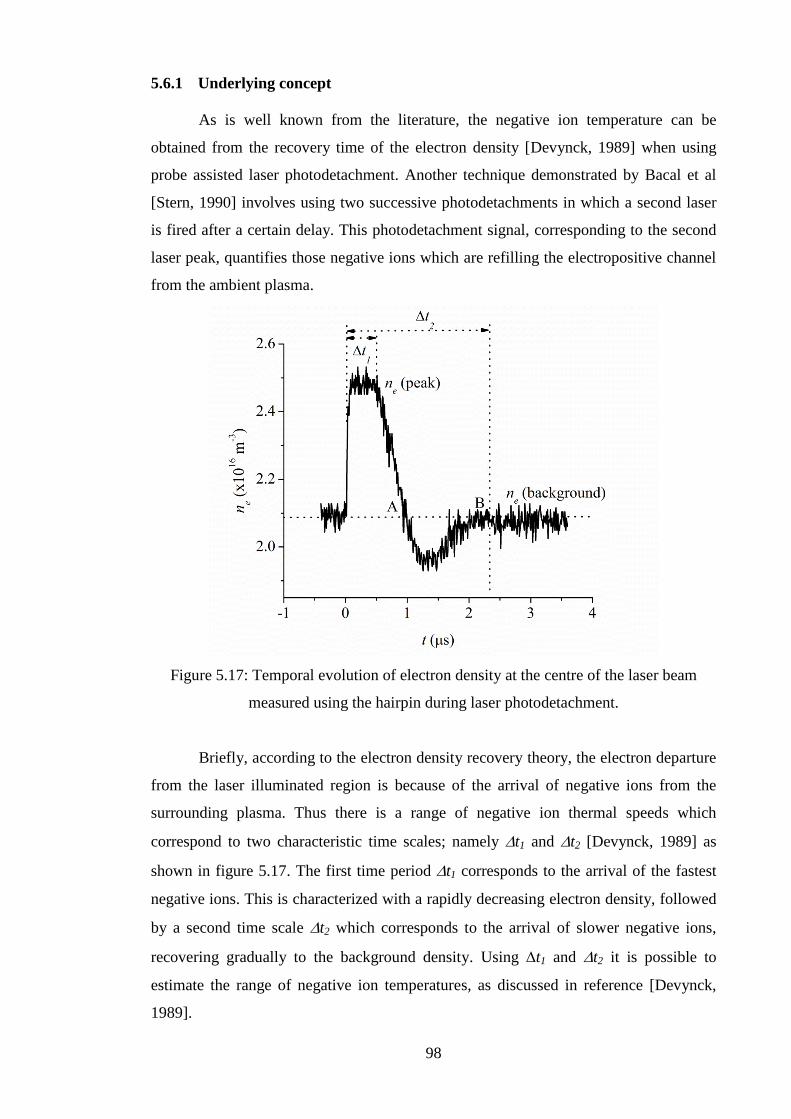
98
5.6.1 Underlying concept
As is well known from the literature, the negative ion temperature can be
obtained from the recovery time of the electron density [Devynck, 1989] when using
probe assisted laser photodetachment. Another technique demonstrated by Bacal et al
[Stern, 1990] involves using two successive photodetachments in which a second laser
is fired after a certain delay. This photodetachment signal, corresponding to the second
laser peak, quantifies those negative ions which are refilling the electropositive channel
from the ambient plasma.
Figure 5.17: Temporal evolution of electron density at the centre of the laser beam
measured using the hairpin during laser photodetachment.
Briefly, according to the electron density recovery theory, the electron departure
from the laser illuminated region is because of the arrival of negative ions from the
surrounding plasma. Thus there is a range of negative ion thermal speeds which
correspond to two characteristic time scales; namely t1 and t2 [Devynck, 1989] as
shown in figure 5.17. The first time period t1 corresponds to the arrival of the fastest
negative ions. This is characterized with a rapidly decreasing electron density, followed
by a second time scale t2 which corresponds to the arrival of slower negative ions,
recovering gradually to the background density. Using t1 and t2 it is possible to
estimate the range of negative ion temperatures, as discussed in reference [Devynck,
1989].
99
In the two laser photodetachment measurement, the curves of the negative ion
density recovery are obtained by the use of two lasers, one of which destroys all
negative ions and the other is delayed in time and is used for searching for the
recovering negative ions. In order to deduce the negative ion temperature, the
experimental curves of the negative ion density recovery are usually fitted with a
theoretical curve, i.e. the following equation is derived from the ballistic kinetic theory
(BKT) for negative ions [Stern, 1990]:
2
0 exp,0 tvRntrn th
(5.3)
Here n-(t) is the negative ion density at a time t after firing the laser shot, n-0 is the initial
negative ion density, R is the laser beam radius, and vth- is the thermal velocity of
negative ions.
The equation is derived using a kinetic approach by considering the set of
coupled Boltzmann and Poisson equations [Stern, 1990] for times small compare to the
collisional time. However there is one limitation associated with both techniques; the
ambipolar electric field in the laser illuminated region is neglected. The creation of an
ambipolar electric field between the electropositive plasma channel and the surrounding
negative ion plasma is because the thermal energy of the electrons exceeds the positive
as well as the negative ion temperature by several orders of magnitude. The typical
thermalization time of photodetached electrons is of the order of few 100 ns. The hot
electrons tend to escape from the electropositive channel leaving behind a slight excess
of positive charges which creates a reverse electric field stopping the freely escaping
electrons from the electropositive channel. This ambipolar electric field, if sustained for
some time, it will tend to accelerate the negative ions because of the potential difference
created by the energetic electrons. Thus if we neglect the ambipolar field, it can lead to
an overestimation of the negative ion temperature. The formation of an ambipolar
electric field is well known theoretically but has never experimentally quantified. In the
following sections we apply a floating emissive probe for the first time to measuring the
relative variation in the plasma potential following photodetachment of electrons from
negative ions. Finally the negative ion temperature deduced by the electron density
evolution is compared with that obtained by the plasma potential evolution.
5.6.2: Measurement of the plasma potential by an emissive probe
The emissive probe is a well known technique for measuring the plasma potential
[Kemp, 1966]. In this technique if the amount of electron flux received from the plasma

100
is compensated for by an equal number of electrons released from the surface of the
probe then net potential difference between the probe and the plasma is zero. Therefore
the probe potential ideally reaches the plasma potential.
The probe can be made to thermionically emit electrons by heating a small filament
with an AC or DC current, until the filament is visually white hot. In some experiments
a small probe tip was irradiated with a laser beam [Schrittwieser, 2008] in order to
avoid interference caused to the plasma due to the probe heating power supply. In the
literature we find three basic methods of using emissive probes for measuring the
plasma potential [Sheehan and Hershkowitz, 2011],
The saturated floating probe method is the one in which the voltage at zero
probe current is identified as the plasma potential.
In the divergence point method, the point of divergence between the hot and
cold probe characteristics is taken as the space potential.
The space potential is identified with the inflection point in the hot probe
current-voltage characteristic.
In our case we are interested in measuring the dynamic variation in the plasma potential.
Therefore it is simpler to use the floating point method. The probe in our case is a small
loop of tungsten wire which is heated by passing 2.0 – 3.0A DC current, which lifts the
potential of the probe close to the plasma potential as the probe becomes visually white
hot. The tip of the filament stays in the path of the laser beam. This method is simpler
but comes with a small compromise because the floating potential saturates on the order
of Te/e due to space charge around the probe [Sheehan and Hershkowitz, 2011]. If the
temperature is small and constant, this effect will merely give the plasma potential
measurements a small and constant offset [Sheehan and Hershkowitz, 2011]. For our
present application we are interested in the relative change in plasma potential before
and after the laser pulse rather than its absolute value. Therefore the constant off-set can
be eliminated by subtracting from the background potential (i.e with and without
photodetachment).
5.6.3: Experimental setup for the emissive probe
A schematic diagram of the emissive probe is shown in figure 5.18. The probe
comes with a thin 0.03 mm ‘tungsten filament in the shape of inverted ‘V’. The filament
is tightly inserted into a double-bore ceramic tube which contains beaded copper wires.
The filament makes very good surface contact with the copper and is compressed
against the inner bore of the ceramic tubing. The end of the copper tube is soldered to a
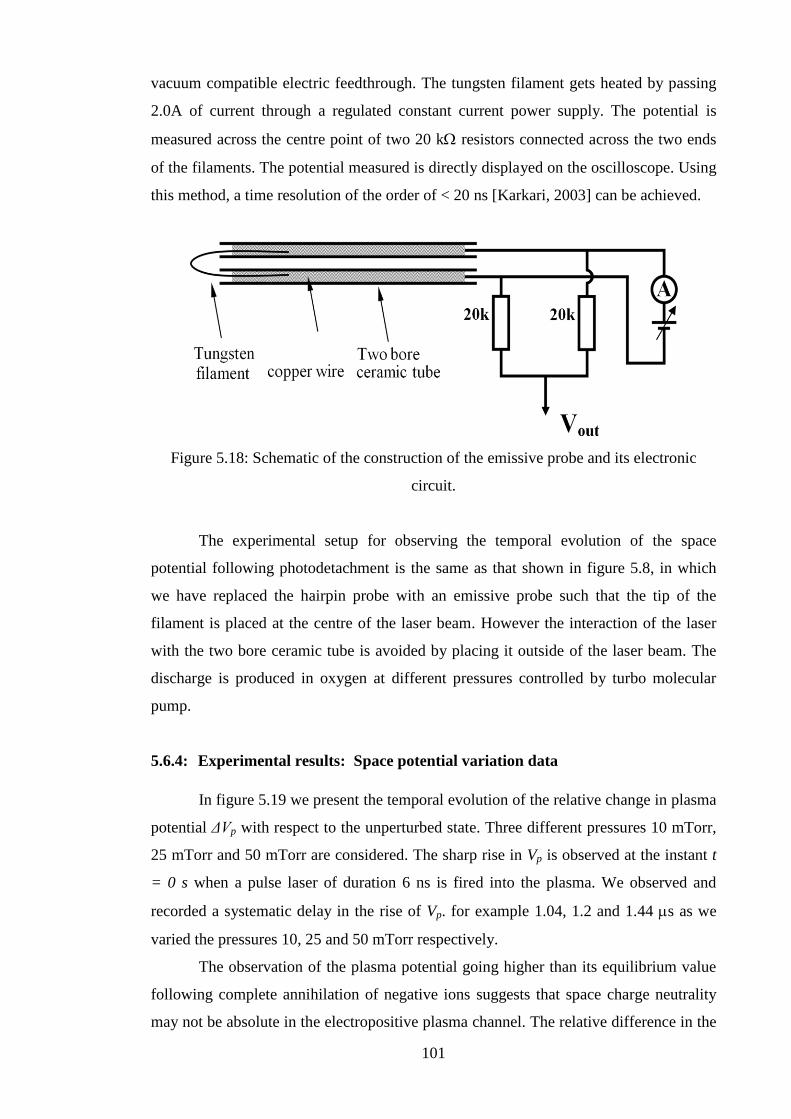
101
vacuum compatible electric feedthrough. The tungsten filament gets heated by passing
2.0A of current through a regulated constant current power supply. The potential is
measured across the centre point of two 20 k resistors connected across the two ends
of the filaments. The potential measured is directly displayed on the oscilloscope. Using
this method, a time resolution of the order of < 20 ns [Karkari, 2003] can be achieved.
Figure 5.18: Schematic of the construction of the emissive probe and its electronic
circuit.
The experimental setup for observing the temporal evolution of the space
potential following photodetachment is the same as that shown in figure 5.8, in which
we have replaced the hairpin probe with an emissive probe such that the tip of the
filament is placed at the centre of the laser beam. However the interaction of the laser
with the two bore ceramic tube is avoided by placing it outside of the laser beam. The
discharge is produced in oxygen at different pressures controlled by turbo molecular
pump.
5.6.4: Experimental results: Space potential variation data
In figure 5.19 we present the temporal evolution of the relative change in plasma
potential ΔVp with respect to the unperturbed state. Three different pressures 10 mTorr,
25 mTorr and 50 mTorr are considered. The sharp rise in Vp is observed at the instant t
= 0 s when a pulse laser of duration 6 ns is fired into the plasma. We observed and
recorded a systematic delay in the rise of Vp. for example 1.04, 1.2 and 1.44 s as we
varied the pressures 10, 25 and 50 mTorr respectively.
The observation of the plasma potential going higher than its equilibrium value
following complete annihilation of negative ions suggests that space charge neutrality
may not be absolute in the electropositive plasma channel. The relative difference in the

102
mobility of electrons compared with negative and positive ions is the factor which can
lead to a transient departure from quasineutrality. As the electrons tend to diffuse faster
from the photodetached zone, negative ions from the surrounding plasma cannot
compete with the escaping electrons from the photodetached region due to differences
in the thermal velocities. Therefore a local electric field is created between the
electropositive channel and the surrounding plasma which will enhance the inward flux
of negative particles into the laser illuminated region. The mobility of electrons and
negative ions is affected by the operating pressure and thus it is reflected in the delay of
rise in the plasma potential. In the following sections we find that the ratio of electron
temperature to negative ion temperature for this pressure range is increased by 80%.
Figure 5.19: Temporal evolution of the change in plasma potential during pulsed laser
photo detachment at different operating pressures. The laser energy density is set to
2000 J/m2 at 532 nm. The rf power for this experiment is set at 200 W.
5.6.5: Discussion of various features and time scales
To gain more insight, the plasma potential evolution is compared with the
electron density evolution measured by the hairpin probe. Figure 5.20 present a
comparison between the electron density and space potential evolution during
photodetachment of electrons from the negative ions. The measurements were
independently done at the same location by inserting the emissive and the hairpin
probes one after the other using a manually operated differentially pumped gate valve.

103
The gate valve placed in the path of the probes feedthrough allowed the probes to be
taken out without disrupting the vacuum in the main plasma chamber. The experimental
conditions such as power, pressure (via gas flow rate) and the pumping speed was
maintained constant throughout the experiment.
Figure 5.20: Comparison of the temporal evolution of the change in plasma potential
and electron density during pulsed laser photo detachment of negative ions. The laser
energy density is set to 2000 J/m2 at 532 nm. The rf power for this experiment is set to
200 W at 25 mTorr operating pressure. The laser is injected at time t = 0 s.
Looking at figure 5.20 we observe a clear delay between the rise and fall times
of the electron density and the plasma potential. For discussing different phases, we
label the specific electron density profile by A, B and C. The points A & B on the
density plot correspond to the unperturbed electron density during t < 0 s. Between
points A and B we observe the electron density to drop below the equilibrium value and
exhibit a minimum at C. The minimum electron density value at C coincides with the
peak in ΔVp.
Coincidence between the density minimum and peak plasma potential observed
in figure 5.20 confirms the idea that the potential maximum is created because of an
excess loss of electrons from the electropositive plasma channel. The local electric field
created between the electropositive channel and the surrounding plasma tends to
enhance the inward flux of negative ions into the laser illuminated region. Therefore the

104
peak in ΔVp may be considered as the demarcation point between the thermal diffusion
of negative ions and the fast negative ions due to the creation of the ambipolar electric
field.
5.6.6 Estimation of the negative ion temperature from the space potential
evolution
Before proceeding to the comparison between the negative ion thermal speed
obtained by two techniques (namely electron density evolution and plasma potential
evolution), it is necessary to model how the plasma potential evolution is related to the
negative ion thermal speed. The rise in plasma potential buildup in the initial phase
results in accelerating negative ions towards the centre of the electropositive plasma.
After starting from their thermal speed, these negative ions eventually reach some
equilibrium speed because of ΔVp.
In the simplest case, when assuming no collisions, we can express the kinetic
energy gained by the negative ions at the expense of eΔVp. Hence,
pth Vevmvm
22
2
1
2
1 (5.4)
Where v is the velocity of the negative ions due to the potential difference Vp created
between the illuminated region and the background after detachment, whereas thv is the
actual thermal velocity of negative ions of mass m- . Thus rearranging equation (5.4),
2
1
2
21
Mv
Ve
v
v pth (5.5)
From the above equation, one can estimate the actual value of the negative ion thermal
speed thv by substituting ΔVp obtained using the emissive probe. On the other hand, v-
can be estimated from the time taken for the plasma potential to decay from its peak to
its equilibrium value by ions situated at a distance 3.0 mm just outside the beam radius.
5.6.7 Negative ion temperature: Space potential verses density evolution
A comparison of the negative ion thermal speed obtained independently via the
electron density evolution and the plasma potential evolution (equation (5.5)) is shown
in figure 5.21. The thermal speed of negative ions obtained using the electron density
evolution in figure 5.17 is calculated by considering t2 which corresponds to the
minimum speed of the negative ions. Figure 5.21 shows that the thermal speed is

105
consistently lower when evaluated using the time scale determined from the plasma
potential variation as based on discussions in previous sections.
Figure 5.21: Plot of the thermal speed of negative ions obtained by the electron density
and the plasma potential evolution verses operating pressure. The laser energy density is
set to 2000 J/m2 at 532 nm. The rf power for this experiment is set to be 200 W
Assuming O- as the dominant negative ion in the plasma, which is valid for RF oxygen
discharges [Stoffels 1995], the negative ion temperature and electron temperature are
plotted in figure 5.22 (a) and (b) respectively. The electron temperature is obtained from
the emissive probe prior to detachment. The main highlights of figure 5.22 are that both
negative ion and electron temperature decrease with pressure [Lieberman and
Lichtenberg, 2005] giving a ratio = Te/T- of nearly 20 and 100 at 10mTorr and
50mTorr respectively.

106
Figure 5.22: Plot of (a) the negative ion temperature (O-) (b) the electron temperature
verses operating pressure. Laser energy density is set to 2000 J/m2 at 532 nm. The rf
power for this experiment is set to 200 W.
Finally, figure 5.23 shows a comparison between the electronegativity and the
maximum change in the plasma potential. It is clear from the graph that the maximum
change in the plasma potential in the illuminated region increases with increases in the
electronegativity . This is true because a higher electronegativity produces a high
number of photodetached electrons in the laser illuminated region, and hence a higher
plasma potential is needed to confine them. Therefore for high electronegativities if one

107
neglects the ambipolar potential, a significant error in estimating the negative ion
thermal speed can occur. Using particle-in-cell simulation with a one-dimensional slab
model [Mizuno, 2007] it has been shown that for > 0.1 ambipolar electric fields
cannot be neglected when estimating the negative ion thermal speed using the electron
density recovery or by two laser photodetachment. Thus we propose the use of the
emissive probe to measure the negative ion thermal speed.
Figure 5.23: Plot of the maximum change in the plasma potential and electronegativity
verses operating pressure. Laser energy density is set to 2000 J/m2 at 532 nm. The rf
power for this experiment is set to 200 W.
5.7 Summary and Conclusions
In this chapter we systematically investigated the hairpin probe to measuring the
negative ion density and its temperature with laser photodetachment. Although the
photodetachment technique is a well known technique routinely applied in conjunction
with a biased Langmuir probe, it has certain limitations when applied to magnetized
plasmas. It is shown for the first time that the hairpin probe can be used in conjunction
with pulsed photodetachment for obtaining the electronegativity in steady state as well
as time-resolved as in the case of a pulsed dc magnetron plasma.
However, we also discussed certain issues related to the application of the
hairpin when applied in conjunction with laser photodetachment. The primary problem

108
is related to the physical size of the probe as the alignment is tricky. In this study we
addressed this problem by aligning the pins off-line of sight to the beam. This has the
advantage that ablation from the probe surface can be avoided. We presented a
systematic study of the electron density dynamics at different radial distances from the
region of detachment. It is understood that the electrons created by photodetachment
along the beam will diffuse outwards at a characteristic time-scale determined by the
temperature of the negative ions. In principle one can determine the negative ion
temperature. This technique was primarily applied by Bacal [Bacal 2000] with the help
of a Langmuir probe. However the ambipolar electric field created at the axis of the
laser beam during photodetachment has been completely neglected until now, which can
cause an overestimation in the measured negative ion temperature by this technique.
In order to highlight the above limitations we performed a plasma potential
measurement using an emissive probe. The plasma potential is clearly seen to be rising
with the photodetachment of electrons from negative ions. This is an indication that the
electrons are quickly thermalized, which then tends to escape from the electropositive
plasma channel. The estimated thermal speed of negative ions from the plasma potential
evolution is found to be lower than those obtained from the electron density evolution.
The potential evolution clearly show the presence of an ambipolar electric field which
was ignored earlier. Thus we propose to use the temporal evolution of the plasma
potential to measure the negative ion thermal speed when the electronegativity is high.
However, for low electronegativities ( < 0.1) the ambipolar electric field can be
neglected and the hairpin probe can be used to measure the negative ion temperatures as
well with laser photodetachment.
Based on the above technique we presented systematic study of negative ion
parameters in the case of a steady state oxygen plasma in an ICP reactor. The temporal
evolution of the electronegativity is also presented in the case of a pulsed dc magnetron
discharge. The results are found to be in good agreement with the expected behavior of
electronegativity, and were found to be consistent with the power and pressure
variations present within the literature.

109
Chapter 6
Stimulated hairpin probe for electronegative plasma
diagnostic
Pulsed induced laser photodetachment discussed in the previous chapter
involved sophisticated optical alignment for focussing the laser beam into the plasma.
Direct exposure of the intense laser onto the probe placed in the path of the laser beam
can ablate material from the probe’s surface and thereby unwanted impurities may be
introduced into the plasma. Deposition on optical windows can also affect the
performance of photodetachment due to scattering of the beam.
In this chapter we present a novel method of using the hairpin probe
independently for measuring the negative ion parameters. The technique is based on
stimulating the hairpin by repetitive pulsed bias of the hairpin to large negative
potentials. The negative ion parameters are obtained from the dynamic measurement of
the temporal electron density profiles. The details are presented in the following
sections.
6.1 Basic principle
Plasma always tends to remain quasineutral. Any disturbance created via an
electrically biased object leads to the break in the quasineutrality locally around the
object. The perturbation can be several Debye lengths depending on the applied
negative potential. In the negative ion plasmas, the positive charge density is balanced
by the negative ion density and the electron density. Because of the vast disparity
between mobility of the electrons and negative ions, the response of charged particles to
shield the opposing charge lags with significant time delays.
Based on the above argument a large negative potential is applied to the hairpin
that displaces the negative ions and electrons from the vicinity of the probe. This is in
contrast to the laser photodetachment technique where the pulsed laser annihilates
negative ions. The region around the probe is mainly dominated by the positive ion
sheath with negligible negative charge particles if a sufficient bias has been applied.
This is in contrast to the electron-positive ion plasma region created by the application
of pulsed laser photodetachment. When the pulsed potential is removed swiftly at a time

110
scale (ωpe)-1
< τperiod, the electrons are the only species which will immediately respond
to shield the negative potential. This will result in the observation of a peak in electron
density compared with the steady-state as the electrons will immediately respond to
shield the positive space charge around the probe. Hence the peak electron density is a
measure of the positive ion density based on the assumption that the plasma is
quasineutral. Once the background positive ion density is obtained, subtracting the
equilibrium electron density from it gives the measure of the negative ion density.
Figure 6.1: Pulsed voltage signal and the expected change in the electron density during
each phase of the pulse applied to the hairpin probe.
In figure 6.1 a sequence of negative voltage pulses is applied while the instantaneous
electron density feature is shown schematically. The different phases of the voltage
waveform are marked as Phase I, II, III and IV.
The phase I of the pulse is the positive potential phase when the sheath around
the hairpin is almost zero. Therefore the electron density corresponding to this phase is
the background electron density in the plasma in equilibrium with the positive ions and
negative ions. i.e.

111
In phase II, the potential falls sharply to certain negative values. All the negative
charged species including the negative ions and the electrons are removed leading to the
observed drop in the electron density.
The overshoot in the electron density, as discussed earlier, corresponds to the
phase III conjunction with the removal of the negative potential. The peak electron
density is the measure of the positive ion density as the electrons are mainly responsible
for shielding the positive ions i.e.
In the off-phase, the negative ions move towards the probe after τoff >> (ωn)-1
while the
peak in the electron density gradually reaches the equilibrium background electron
density.
Hence the negative ion density is obtained by subtracting the background
electron density from the peak electron density
The decay in the electron density also contains information about the negative
ion thermal velocity as in the case of photodetachment. As discussed before, the decay
of peak electron is mainly due to the diffusion of the negative ions from the surrounding
volume. Hence by taking diffusion time the thermal velocity of the negative ions can be
estimated as,
(6.1)
Where h is the half width of the hairpin probe and tdiff is the time of diffusion of peak
electron density to background electron density. Collisions between the particles are
completely neglected in the above calculation.
6.2 Experimental setup
For validating the above concept, the pulsed negative potential is applied to the
hairpin immersed in an inductive discharge setup described in section 3.3.3. One time
the hairpin was subjected to a pure electropositive argon discharge while the same
experiment was repeated for an electronegative O2 plasma.
The hairpin probe was comprised of a mechanism for electrically biasing the
probe tip in the plasma. An Agilent 33250A arbitrary waveform generator was used for
producing a pulsed waveform of a few KHz frequencies and variable duty cycle. The
output is connected to the high voltage amplifier (WMA-280) which gives a
112
corresponding amplified voltage output to 100 Volts. An L-shape hairpin probe of
length 26 mm and width 3 mm is inserted through one of the radial ports of the
chamber. For time resolved electron density measurements we have used the automated
technique. This technique incorporates a LabVIEW program for incrementing the
output frequency of a commercial microwave oscillator (HP8350B). The software helps
to increment the applied microwave frequency in steps of prescribed value, Δf = (fe -
fi)/n, where fi < f0 < fr < fe and where n is the number of steps; and register the reflected
signal amplitude which is converted into a dc signal corresponding to each frequency.
For increasing signal to noise ratio the dc level at each frequency is subtracted from the
signal.
6.3 Results and discussions
Before performing experiments it is important to understand and fix the applied
pulse parameters. A pulsed voltage waveform is mainly described by its basic
parameters namely the rise time, duty cycle, pulse period and its amplitude. A square
waveform is used in this experiment because of its symmetrical behaviour and easily
determined phase and antiphase boundary. The rise time of the pulse is another
important parameter which is chosen in such a way that it can resolve the thermal
motion of the electrons and negative ions when the negative pulse voltage is removed
from the hairpin probe. The response time of the electrons is typically of the order of a
nanosecond for laboratory plasmas whereas the negative ions respond on microsecond
time scales (as experimentally found in previous chapters). Thus pulse rise time is fixed
for a few nanoseconds to distinguish between the thermal motion of electrons and
negative ions.
The choice of the pulse width defines the depletion of the negative charged
species from the vicinity of the hairpin probe. The duration of the pulse must be greater
than the time scale at which the sheath is fully established. Typically the pulse width
chosen was 0.5ms; many orders greater than the typical collision rate. The choice of
0.5ms will give sufficient time for the negative ions to be displaced from the region
around the probe. Last, and the most important pulse parameter, is its magnitude. The
magnitude of the pulse voltage defines the sheath dimension around the hairpin prongs.
As discussed in chapter 4 the sheath width is large for larger biases and decreases with
increases in the electronegativity of the plasma.

113
Figure 6.2 shows the measurement of the time-resolved resonance frequency
of the hairpin probe during an applied negative pulse voltage on the hairpin probe in an
oxygen discharge. Operating conditions for the oxygen discharge were 35mTorr
operating pressure at 400Watt ICP power. The amplitude of the pulsed voltage is set to
be -80 volts while the rest of the parameters are the same as discussed above. The
corresponding electron density plot for oxygen and argon is shown in figure 6.3. The
argon discharge is produced at 35 mTorr operating pressure and 200Watt ICP power.
As expected no overshoot in electron density was observed on removal of the applied
negative pulse for the electropositive argon plasma while a distinct peak is observed in
the case of the electronegative oxygen plasma confirming the principle behind the
technique. From the electron density overshoot, the negative ion density was calculated
and found to be approximately 2.68*1015
m-3
. Whereas the positive ions are measured to
be 5.498*1016
m-3
and the corresponding electron density is 5.230*1016
m-3
. However
these densities are not absolute because the basic principle behind this technique says
that the electron density should go to zero (figure 6.1) which is not the case in this
experiment (figure 6.3). One of the possible reasons is partially formed sheath around
the resonator prongs and discussed later in this chapter.
Figure 6.2: Time resolved resonance frequency of the hairpin probe during an applied
negative pulse voltage in oxygen plasmas. Pulsed voltage applied to the hairpin probe is
-80 volts with a frequency of 1 KHz.

114
Figure 6.3: Time resolved electron density in argon and oxygen plasmas. Pulsed voltage
applied to the hairpin probe is -80 Volts having a frequency of 1 KHz. Operating
conditions for O2 plasma and Ar plasma are 35mT/400W and 35mT/200W respectively.
Figure 6.4: Time resolved electron density in argon and oxygen plasmas. Pulsed voltage
applied to hairpin probe is -80 Volts having a frequency of 1 KHz. Operating conditions
for the O2 plasma and Ar plasma are 30mT/300W and 30mT/100W respectively.

115
To confirm further the validity of the technique, the same experiment is repeated
with a slight change in the operating conditions of the discharge. The measurement was
mainly focused during the starting phase of the pulse. Figure 6.4 shows the comparison
of the time resolved electron density measurement by the hairpin probe in oxygen and
argon discharges produced at 300W/30mT and 100W/30mT respectively. The
experimental result at this operating condition consistently shows an electron density
overshoot at the instant of removal of the negative potential from the hairpin probe. The
characteristic overshoot in electron density resembles in some form with the
photodetached electron density obtained in the laser photodetachment experiment in
chapter 6. By hypothesis the positive ion density corresponds to the electron density
peak obtained to be 2.8637*1016
m-3
while the steady state electron density in the long
off phase is 2.7243*1016
m-3
. The difference gives the negative ion density of the order
of 1.394*1015
m-3
.
Figure 6.5: Negative ion density measured by pulse biased hairpin probe and hairpin
probe assisted laser photodetachment as a function of ICP power in O2 plasma operating
at 30mT. Pulsed voltage applied to the hairpin probe is -80 Volts with a frequency of 1
KHz.
Using the above method, systematic experiments with the pulsed hairpin probe
was carried out for various ICP powers and the results compared with those obtained

116
using pulsed laser photodetachment in conjunction with the hairpin probe. The negative
ion density can be varied by changing the ICP power at fixed pressure (figure 5.10)
whereas at fixed ICP power changing the pressure from 5-90mTorr the negative ion
density change is very small (figure 5.12a). Thus the operating pressure was kept
constant at 30mTorr corresponding to maximum negative ion production.
Figure 6.5 shows the comparison of the absolute negative ion density measured
by the two independent techniques involving the pulse biased hairpin probe and laser
photodetachment under identical operating condition. As observed in figure 6.5, both
techniques show an increase in the negative ion density with ICP power. Increases in
the electron density with ICP power increases the dissociative attachment therefore
increasing the negative ion density. However the negative ion density obtained with the
pulse bias technique underestimates the density by a factor of 10 less than those
obtained by the photodetachment method. Despite this, both laser photodetachment and
pulse bias hairpin probe shows a ~80% change in the negative ion density with rf power
varied from 150 W to 300W.
The reason for the observed underestimated negative ion density can be explained on
the basis of a partial or fully formed sheath around the hairpin. For the experiment
described the maximum applied voltage was - 80Volts. The sheath thickness (figure
4.8) obtained from the theoretical model for cylindrical probes in chapter 4 require
values of and These values can be taken from the photodetachment experiment. For
example at 200 watt ICP power and 30 mTorr operating pressure the values of and
are 0.34 and 30 respectively (see figure 5.11, 5.22a and 5.22b). Using these values the
model equation governing the sheath surrounding the cylindrical probes can be solved
[c.f. chapter 4]. It gives the sheath thickness of near about 0.7mm. Thus at 200W ICP
power and 30mTorr operating pressure the sheath thickness on each limb of the hairpin
probe is 0.7mm. This is nearly half the width of the hairpin probe (~1.5mm) used in this
experiment. However the basic principle assumes that the sheaths around the hairpin
must be completely overlapping. Therefore one should reduce the separation between
the pins to a reasonable distance for the technique to work precisely, or increase the
magnitude of the bias voltage.
The thermal speed of negative ions is obtained from the time scale of the decay
in electron density peak. At 30mTorr the decay time for the electron density to reach the
background electron density is 0.s and found to be constant with ICP power.
Considering the half width of the hairpin probe (~1.5mm), the thermal speed of negative
ions is estimated to be ~2.5x10³ m/s. The magnitude of the thermal speed of negative

117
ions obtained by the above technique at this operating pressure is somewhat higher than
the one measured by the plasma potential evolution (~1.2x10³ m/s) as shown in figure
5.21. However considering negative ions responding to the probe surface from the
distance equivalent to the typical sheath width of approximately 0.7mm we obtained
reasonably good agreement as the thermal speed of negative ions increased to ~1.6x10³
m/s comparable to those obtained from the plasma potential evolution (figure 5.21)
discussed in chapter-5. Thus in equation 6.1 the half width should be replaced by the
sheath thickness obtained in our conditions i.e. 0.7 mm.
6.4 Summary and Conclusions
In conclusion we presented a novel use of pulsed bias hairpin for the diagnostic
of negative ions in an electronegative discharge. Preliminary results comparing the time
resolved electron density in the electronegative plasma with that of the electropositive
plasma confirmed that the overshoot is due to the presence of negative ions in the
plasma. With this method the electron density, negative ion density, positive ion density
and negative ion temperature can be obtained in electronegative plasmas. This is an
independent diagnostic technique as it does not require expensive and cumbersome laser
photodetachment equipment. The negative potential is easy to apply also in the case of
dielectric shielded probes by means of capacitive coupling with a 1 MHz signal in short
transient bursts as typically also applied for ion-flux probes [Braithwaite 1996]. The
perturbation to the plasma is also small as compared with positive biased probes. The
technique is simple as the density is calculated using quasineutral approximations.
Despite many advantages, this technique has some drawbacks. One of the limitations of
this technique is that it is not species selective when multiple negative ions are present.
As in the case of photodetachment experiments, it is possible by tuning the laser
frequency corresponding to the detachment energy of selected negative ions.
The negative ion density measured in an O2 discharge shows an increase in the
negative ion density with ICP power. However the values were underestimated when
compared with the hairpin probe assisted laser photodetachment. By evaluating the
sheath dimension it is validated that the underestimation in the measured negative ion
density is mainly due to low bias potential. Although the results were limited to low
bias potential it suggests that the pulse bias hairpin probe can be used for relative
measurements of negative ion density in electronegative plasmas. Thus it can be used to
characterize the electronegative plasma discharges with using a laser. However for

118
absolute measurements, one should be careful about the magnitude of the sheath
potential. The negative ion thermal velocity is also estimated and found to be higher
than the one calculated by the plasma potential evolution. However when the correct
sheath dimension is used it gives reasonably good agreement with that obtained using
the photodetachment method.

119
Chapter7
Summary, conclusions and future prospects
7.1 Summary and conclusions
In this thesis we presented practical applications of resonance hairpin probes for
characterizing electronegative discharges. The key parameters, namely the negative ion
density and its characteristic temperature, are obtained in a steady state inductively
coupled oxygen discharge. Time resolved negative ion parameters were obtained in a
pulsed dc magnetron source at the University of Liverpool. The principal technique
investigated is the use of resonance hairpin probes in conjunction with pulsed laser
photodetachment. The hairpin probe provided the principle role for measuring spatial
and temporal electron density evolution in the photodetached channel. As compared to
the use of conventional Langmuir probes, the hairpin has the following advantages.
Firstly, one can directly obtain the temporal value of the absolute electron density.
Another advantage is that one can apply it in depositing plasmas and also in plasma
systems where the reference electrode is unavailable or poorly conducting. For avoiding
ablation from the probes surface we have systematically investigated the electron
density measured outside the photodetached region and related it to the density
measured in the illuminated column. It is found that if one can perform a certain
calibration, it is possible to relate the negative ion density from the electron density
response at some distance outside the photodetached region. These results are discussed
in chapter 5.
The use of laser photodetachment and Langmuir probes has been extensively
used for the measurement of the negative ion temperature. Here for the first time we
have applied a hairpin to the measurement of the negative ion temperature in an oxygen
discharge. One of the important facts revealed from the systematic experiment is that
the negative ions are being accelerated because of a potential difference created between
the electropositive plasma channel and background electronegative plasma measured by
a floating emissive probe. The experimental results show the peak plasma potential
coinciding with the dip in the electron density. A positive potential is required for
stopping the loss of fast electrons from the electropositive plasma channel. We have
also discussed the use of emissive probes for obtaining the negative ion temperature and
compared these results with those obtained from the temporal evolution of the electron
density using the hairpin probe. The negative ion temperature obtained from the decay

120
in the electron density peak was found to be higher (~40%) than those obtained from the
temporal evolution of the plasma potential. These results are presented in chapter 5.
The final chapter of the thesis describes the basic principle and application of a pulsed
bias hairpin probe for characterizing negative ion parameters. In this technique we have
applied a sequence of strong negative dc biases to the hairpin, strong enough to remove
negative ions from the vicinity of the hairpins. On removal of the external bias, one
expects the quasineutrality condition to be quickly established, first primarily by
electrons and then followed by negative ions. With the help of time-resolved
measurement of the electron density, we can identify the presence of negative ions by
subtracting the background electron density from the electron density obtained on
removal of the external bias. The same technique also allows the determination of the
negative ion temperature from the state at which the electron density returns to
equilibrium. We have validated the underlying principle based on preliminary
experiments performed in an oxygen ICP discharge. Because of limitations of the power
rating of the pulsing negative biasing supply, the applied negative bias was limited to -
80 V. Therefore absolute measurements were not possible but the relative measurements
are found to be in reasonably better agreement as compared with those obtained from
laser photodetachment.
The thesis also addressed some key issues concerning accuracy of the electron
density measurement over a wide range. As found at low density (below 1016
m-3
), the
sheath sizes can be comparable with the separation between the pins. This limitation
was addressed by Peijak et al [Piejak 2004] who proposed an analytical expression for
sheath correction. This analytical expression is based on finding the sheath width using
a theoretical sheath model (step front sheath model as proposed by Piejak) and thus
requires information of the electron density and electron temperature. A technique based
on a negative dc biased hairpin probe is investigated to overcome this limitation. In this
technique the sheath width is estimated by the well know Child-Langmuir sheath model
from the measured current and voltage. The sheath correction in the raw densities
obtained by the negative dc biased hairpin probe is compared with those obtained by the
step front sheath model and gives reasonably good agreement. On the other hand the
sheaths can be purposely created around the resonator pins by a negative dc bias in
order to stretch the higher orders of the measured density with the available limited
range of the frequency from the hairpin microwave generator. Thus the technique of
measuring a high plasma density (>1018
m-3
) is proposed.
121
7.2 Future prospects
In this thesis we have addressed some important applications of the resonance
hairpin probe for electronegative plasmas. Amongst different techniques discussed in
the thesis are the use of dc and pulsed dc biasing techniques where the hairpin was
externally biased with respect to the reference electrode. However for broader
applicability one needs to address the technique in depositing plasmas when the
electrode surface is poorly conducting. Similarly under the influence of large rf
oscillation in plasma potential as in the case of symmetric capacitively coupled radio
frequency discharges one has to appropriately treat the sheaths around the hairpin. One
of the important applications of the pulsed bias hairpin is in the filter field region of
negative ion source. The effect of strong magnetic field on electron density dynamics
towards the hairpin on removal of high voltage pulse needs further investigation.
Furthermore, the role of external magnetic field on the sheath structure, anisotropy in
plasma permittivity because of the presence of magnetic field needs systematic
investigation and requires 3d simulation of the electric field structure around the
hairpin.
The pulsed dc biasing technique shows good agreement with laser
photodetachment. However variation in absolute densities by a factor of 10 lower than
those obtained (shown in figure (6.5)) by pulsed photodetachment. This is attributed due
to partially formed sheath around the hairpin resonator. This is confirmed by estimating
the sheath width using the theoretical sheath model (discussed in chapter 4). This
limitation can be overcome by increasing the magnitude of the pulsed voltage or by
decreasing the width of the resonator. The extent to which this can be done considering
practical applications is the subject of future research. The effect of pulse parameters
like pulse width, width of the hairpin probe on sheath structure needs further
investigation for explaining the diffusion of charged particles in case of multi-
component negative ion species . However an important question needs to be addressed
is whether it is possible to achieve zero electron density with negative dc bias or not?
The technique described for the sheath correction (in chapter 3) is based on the
simultaneous measurement of resonance frequency and positive ion current with
different probe bias. The positive ion current and resonance frequency is a function of
the electron density, electron temperature and plasma potential. Once the corrected
electron density is obtained it is also possible to estimate the average electron
122
temperature and plasma potential from the measured value of the ion current and
resonance frequency. Thus the future work shall aim in modelling positive ion current
and resonance frequency as a function of these parameters.

123
Bibliography
Allen J E, A note on the Bohm criterion for electronegative gases, Plasma sources sci.
Technol. Vol. 13: 48, 2004.
Amemiya H, Annartone B M and Allen J E, The collection of positive ions by
spherical and cylindrical probes in electronegative plasma, Plasma sources sci.
Technol. Vol. 8: 179, 1999.
Amemiya H, Plasmas with negative ions-probe measurements and charge equilibrium,
J. Phys. D: Appl. Phys. Vol. 23: 999, 1990.
Bacal M, Photo-detachment diagnostic techniques for measuring negative ion densities
and temperatures in plasmas, Rev. Sci. Instrum. Vol. 71: 3981, 2000.
Boilson D et al., Fusion Engineering and Design Vol. 74: 295, 2005.
Booth J P, Corr C S, Curley G A, Jolly J, Guillon J and Földes T, Fluorine negative
ion density measurement in a dual-frequency capacitive plasma etch reactor by cavity
ring-down spectroscopy, Appl. Phys. Lett. Vol. 88: 151502, 2006.
Braithwaite N St J and Allen J E, Boundaries and probes in electronegative plasmas,
J. Phys. D: Appl. Phys. Vol. 21: 1733, 1988.
Braithwaite N St J, Booth J P and Cunge G, A novel electrostatic probe method for
ion flux measurements, Plasma Sources Sci. Technol. Vol. 5: 677, 1996.
Chabert P, Electronegative plasma motor, US2008/0271430 A1, 2007.
Chabert P and Braithwaite N St J, Physics of radio-frequency plasmas, Cambridge
university press, 2011.
Chabert P, Plihon N, Corr C S, Raimbault J-L, and Lichtenberg A J, Equilibrium
model for two low-pressure electronegative plasmas connected by a double layer,
Physics of Plasmas Vol. 13: 093504, 2006.
Chabert P, Sheridan T E, Boswell R W and Perrin J, Electrostatic probe
measurement of the negative ion fraction in an SF6 helicon discharge, Plasma Sources
Sci. Technol. Vol. 8: 561, 1999.
Chung T H, Sheath structure for cylindrical probe in low-pressure electronegative
discharges, Phys. Plasmas Vol. 13: 024501, 2006.
Conway J, Sirse N, Karkari S K and Turner M M, Using the resonance hairpin
probe and pulsed photo-detachment technique as a diagnostic for negative ions in
oxygen plasma, Plasma Sources Sci. Technol. Vol. 19: 065002, 2010.
124
Crespo R M, Palop J I F, Hernandez M A, Pino S B D, Diaz-Cabrera J M and
Ballesteros J, Floating potential and sheath thickness for cylindrical and spherical
probes in electronegative plasmas, J. Appl. Phys. Vol. 99: 053303, 2006.
Curley G A, The dynamics of charged particles in a dual frequency capacitively
coupled dielectric etch reactor, PhD thesis, Ecole Polytechnique France, 2008.
Curley G A, Gatilova L, Guilet S, Bouchoule S, Booth J P, Gogna G S, Sirse N and
Karkari S K, Surface loss rates of H and Cl atoms in an inductively coupled plasma
etcher using time-resolved electron density and optical emission measurements, J. Vac.
Sci. Tech. A Vol. 28: 360, 2010.
Devynck P, Auvray J, Bacal M, Berlemont P, Brunetueau J, Leroy R and Stern R
A, Photodetachment technique for measuring H−
velocities in a hydrogen plasma, Rev.
Sci. Instrum. Vol. 60: 2873, 1989.
Dodd R, You S D and Bradley J W, O- density measurements in the pulsed-dc
reactive magnetron sputtering of titanium, Thin solid films Vol. 519:1705, 2010.
Franklin R N, The equations for electronegative plasmas are not singular at the
plasma centre at low pressures, J. Phys. D: Appl. Phys. Vol. 38: 2790, 2005.
Franklin R N, The plasma-wall boundary region in negative-ion-dominated plasmas at
low pressures, Plasma sources sci. Technol. Vol. 9: 191, 2000.
Franklin R N and Snell J, Are the oscillations found in electronegative plasmas at low
pressure an artefact? , J. Phys. D: Appl. Phys. Vol. 33: 1990, 2000.
Flamm D L, Mechanisms of silicon etching in fluorine- and chlorine-containing
plasmas, Report UCB/ERL M90/41, College of Engineering, University of California,
Berkeley, 1990.
Gogna G S and Karkari S K, Microwave resonances of a hairpin probe in a
magnetized plasma, Appl. Phys. Lett. Vol. 96: 151503, 2010.
Grabowski C, Gahl J M and Schamiloglu E, Initial Plasma-Filled Backward-Wave
Oscillator Experiments Using a Cathode-Mounted Plasma Prefill Source, IEEE Trans.
Plasma Sci. Vol. 26: 653–68, 1998.
Haas F A, AL-Kuzee J and Braithwaite N St J, Electron and ion sheath effects on a
microwave “hairpin” probe, Appl. Phys. Lett. Vol. 87: 201503, 2005.
Heald M A and Wharton C B, Plasma Diagnostics with Microwaves; New York:
Krieger Publishing, 1978.
Hebner G A and Abraham I C, Characterization of electron and negative ion
densities in fluorocarbon containing inductively driven plasmas, J. Appl. Phys., Vol. 90:
4929, 2001.

125
Howling A A, Sansonnens L, Dorier J L, and Hollenstein Ch., Time‐resolved
measurements of highly polymerized negative ions in radio frequency silane plasma
deposition experiments, J. Appl. Phys., Vol. 75: 1340, 1994.
Kajita S, Kado S, Shikama T, Xiao B and Tanaka S, Effect of probe surface ablation
on laser photodetachment signals, Contrib. Plasma Phys. Vol. 44: 607, 2004.
Karkari S K and Ellingboe A R, Effect of radio-frequency power levels on electron
density in a confined two-frequency capacitively-coupled plasma processing tool, Appl.
Phys. Lett. Vol. 88: 101501, 2006.
Karkari S K, Ellingboe A R, Gaman C, Swindells I and Bradley J W, A floating
hairpin resonance probe technique for measuring time-resolved electron density in
pulse discharge, Meas. Sci. and Technol. Vol. 18: 2649, 2007.
Karkari S K, Law V J and Ellingboe A R, Design and performance of a floating
hairpin resonance probe for measuring plasma density in radio-frequency discharges,
27th ICPIG (Eindhoven, The Netherlands) Abstract No 08-168, 2005.
Karkari S K, Vetushka A and Bradley J W, Measurement of the plasma potential
adjacent to the substrate in a midfrequency bipolar pulsed magnetron, J. Vac. Sci.
Technol. A Vol. 21: L28, 2003.
Kemp R F and Sellen J M, Plasma Potential Measurements by Electron Emissive
Probes, Rev. Sci. Instrum. Vol. 37: 455, 1966.
Kim J, Schamiloglu E, Martinez-Tovar B and Jungling K C, Temporal
measurement of plasma density variations above a semiconductor bridge (SCB), IEEE
Trans. Instrum. Meas. vol. 44: 843, 1995.
Kono A, Intrinsic sheath edge conditions for sheath instability in low-pressure
electronegative plasmas, J. Phys. D: Appl. Phys. Vol. 36: 465, 2003.
Kono A, Complex sheath formation around a spherical electrode in electronegative
plasmas: a comparison between a fluid model and a particle simulation, J. Phys. D:
Appl. Phys. Vol. 34: 1083, 2001.
Lampe M, Manheimer W M, Fernsler R F, Slinker S P and Joyce G, The physical
and
mathematical basis of stratification in electronegative plasmas, Plasma Sources Sci.
Technol. Vol. 13: 15, 2004.
Lampe M, Manheimer W M, Fernsler R F, Slinker S P and Joyce G, Comment on
'The equations for electronegative plasmas are not singular at the plasma centre at low
pressures' by R N Franklin, J. Phys. D: Appl. Phys. Vol. 39: 3919, 2006.
Langmuir I and Blodgett K B, Currents between coaxial cylinders, Phys. Rev. Vol.
22: 347,
1923.
Langmuir I and Mott-Smith H M, Studies of Electric Discharges in Gases at Low
pressures, Gen. Elec. Rev. Vol. 27: 449, 1924.

126
Lieberman M A and Lichtenberg A J, Principles of Plasma Discharges and
Materials Processing, New York: Wiley, 2005.
Mizuno T, Hatayama A and Bacal M, One-dimensional analysis of the effect of the
ambipolar potential on the H- ion density recovery after a laser photodetachment in the
high density regime, J. Phys. D: Appl. Phys. Vol. 40: 168, 2007.
Mujawar M A, Karkari S K and Turner M M, Properties of a differentially pumped
constricted hollow anode plasma source, Plasma Sources Sci. Technol. Vol.
20: 015024, 2011.
Nishiura M, Sasao M, Wada M and Bacal M, Plasma perturbation induced by laser
photodetachment, EPS conference on Contr. Fusion and Plasma Physics (Maastricht),
ECA Vol. 23J: 1369, 1999.
Piejak R B, A dc biased hairpin resonator probes, Gaseous Electronics Conf.
(Shannon) ES2.011, 2004 a.
Piejak R B, Al-Kuzee J and Braithwaite N St J, Hairpin resonator probe
measurements in RF plasmas, Plasma Sources Sci. Technol. Vol. 14: 734, 2005.
Piejak R B, Godyak V A, Garner R, Alexandrovich B M and Sternberg N, The
hairpin resonator: A plasma density measuring technique revisited, J. Appl. Phys. Vol.
95: 3785, 2004.
Samukawa S, Ultimate top-down etching processes for future nanoscale devices:
Advanced neutral-beam etching, Japanese Journal of Applied Physics Part-1 Regular
Papers and Brief Communications and Review Paper Vol. 45 (4A): 2395, 2006.
Sands B L, Siefert N S and Ganguly B N, Design and measurement considerations of
hairpin resonator probes for determining electron number density in collisional
plasmas, Plasma Sources Sci. Technol. Vol. 16: 716, 2007.
Sheehan J P and Hershkowitz N, Emissive probes, Plasma Sources Sci. Technol. Vol.
20: 063001, 2011.
Sheridan T E, Chabert P and Boswell R W, Positive ion flux from a low-pressure
electronegative discharge, Plasma sources sci. Technol. Vol. 8: 457, 1999.
Shibata M, Nakano N and Makabe T, The effect of laser-induced photodetachment in
O2 rf discharges, J. Phys. D: Appl. Phys. Vol. 30: 1219, 1997.
Shindo M, Uchino S, Ichiki R, Yoshimura S and Kawai Y, Measurements of the
negative ion density in SF6/Ar plasma using a plane electrostatic probe, Rev. Sci.
Instrum. Vol. 72: 2288, 2001.
Sirse N, Conway J, Karkari S K and Turner M M, Hairpin probe in conjunction with
laser photo-detachment technique for negative ion density measurement, Proceedings

127
37th
EPS conference on plasma physics (Dublin) Vol. 34A: ISBN 2-914771-62-2, June-
2010.
Spencer-Smith J L, Negative ions of iodine- Part I Probe measurements, Philosophical
magazine Vol. 19: 806, 1935.
Spencer-Smith J L, Negative ions of iodine- Part II Ion beams, Philosophical
magazine Vol.
19: 1016, 1935.
Stenzel R L and Gould R W, Upper-hybrid resonance absorption, emission, and
heating of an afterglow plasma column, J. Appl. Phys. vol. 42: 4225, 1971.
Stenzel R L, Microwave resonator probe for localized density measurements in weakly
magnetized plasmas, Rev. Sci. Instrum., vol. 47: 603, 1976.
Stern R A, Devynck P, Bacal M, Berlemont P and Hillion F, Nonresonant optical
tagging and "monopolar" transport in negative-ion plasmas, Phys. Rev. A Vol. 41:
3307, 1990.
Stoffels E, Stoffels W W, Vender D, Kando M, Kroesen G M W and de Hoog F J,
Negative ions in a radio-frequency oxygen plasma, Phys. Rev. E Vol. 51: 2425, 1995.
Schrittwieser R, Ionita C, Balan P, Gstrein R, Grulke O, Windisch T, Brandt
C, Klinger T, Madani R, Amarandei G and Sarma A K, Laser-heated emissive
plasma probe, Rev. Sci. Instrum., vol. 79: 083508, 2008.
Tonks L and Langmuir I, Phys. Rev. Vol. 33: 195, 1929.
Werner P W and Schamiloglu E, Two-photon ionization of trimethylamine using KrF
laser radiation, J. Appl. Phys. Vol. 79: 2728, 1996.
Wickens L M and Allen J E, Jour. Plasma Physics Vol. 22: 167, 1978.
Xu J, Nakamura K, Zhang Q and Sugai H, Simulation of resistive microwave
resonator probe for high-pressure plasma diagnostics, Plasma Sources Sci. Technol.
Vol. 18: 045009, 2009.
You S D, Dodd R, Edwards A and Bradley J W, A study of the plasma
electronegativity in an argon-oxygen pulsed-DC sputter magnetron, J. Phys. D: Appl.
Phys. Vol. 43: 505205, 2010.

128
Publications (As of 1
st November 2011)
Peer reviewed journals:
1. N. Sirse, S. K. Karkari, M. A. Mujawar, J. Conway and M. M. Turner, “The temporal
evolution in plasma potential during laser photo-detachment”, Plasma Sources Sci. and
Technol. (2011) 20 055003.
2. J. W. Bradley, R. Dodd, S - D. You, N. Sirse and S. K. Karkari, “Resonance hairpin
and Langmuir probe assisted laser photo-detachment measurements of the negative ion
density in a pulsed dc magnetron discharge”, J. Vac. Sci. Tech. A 29 (2011) 031305.
3. J. Conway, N. Sirse, S. K. Karkari and M. M. Turner, “Using the resonance hairpin
probe and pulsed photo-detachment technique as a diagnostic for negative ions in
oxygen plasma”, Plasma Sources Sci. and Technol. (2010) 19 065002.
4. G. A. Curley, L. Gatilova, S. Guilet, S. Bouchoule, G. S. Gogna, N. Sirse, S.K. Karkari
and J. P. Booth, “Surface loss rates of H and Cl atoms in an inductively coupled plasma
etcher using time-resolved electron density and optical emission measurements”, J. Vac.
Sci. Tech. A 28 (2010) 360.
Conference proceedings
5. N. Sirse, J. P. Booth, Y. Azamoum and P. Chabert, “Electron density comparison
between experiments and simulations in chlorine based ICP discharge”, Proceedings
XXX International Conference on Phenomena in Ionized Gases (ICPIG 2011), UK,
D13-292.
6. J. P. Booth, N. Sirse, Y. Azamoum and P. Chabert, “Absolute atomic chlorine densities
in a Cl2 ICP determined by TALIF with a new calibration method”, Proceedings XXX
International Conference on Phenomena in Ionized Gases (ICPIG 2011), UK, B6-376.
7. J. P. Booth, N. Sirse, P. Chabert, Y. Azamoum and M. Zaka-Ul-Islam “Recombination
coefficient of Cl atom on Al2O3 walls determined by Two-Photon Laser-Induced
Fluorescence”, Proceedings XXX International Conference on Phenomena in Ionized
Gases (ICPIG 2011), UK, B6-158.
8. N. Sirse, M. A. Mujawar, J. Conway, S. K. Karkari and M. M. Turner, “Negative ion
temperature from the temporal evolution of plasma potential during laser photo-
detachment”, Proceedings XXX International Conference on Phenomena in Ionized
Gases (ICPIG 2011), UK, B6-230.
9. N. Sirse, J. Conway, S. K. Karkari and M. M. Turner, “Hairpin probe in conjunction
with laser photo-detachment technique for negative ion density measurement”, 37th EPS
Conference on Plasma Physics, June 21-25. 2010, Dublin, Ireland.

129
Oral/Posters
10. N. Sirse, S. K. Karkari and M. M. Turner, “Sheath boundary of a cylindrical probe
immersed in electronegative plasma”, 2nd Workshop on RF Discharges, May 17-20,
2009, La Badine, France.
11. N. Sirse, S. K. Karkari and M. M. Turner, “Sheath Boundary of Cylindrical Probe in
Weakly Collisional Electronegative Plasma”, 3rd ITER International Summer School
on “Plasma Surface Interaction in Controlled Fusion Devices”, June 22-26, 2009, Aix
en Provence, France.
12. N. Sirse and S. K. Karkari, “Practical applications of hairpin resonator probe for
electron density measurement in low temperature plasmas”, 37th EPS Conference on
Plasma Physics, June 21-25, 2010, Dublin, Ireland.
13. N. Sirse, G. S. Gogna, S. Karkari, G. A. Curley, L. Gatilova, S. Guilet, S. Bouchoule
and J. P. Booth, “Diagnostics of Cl2-based inductively coupled plasmas used for the
etching of III-V materials”, BOC Gases Poster Competition, Dublin City University,
Dublin, 24th September 2010.
14. N. Sirse, M. A. Mujawar, J. Conway, M. M. Turner and S. K. Karkari, “Spatial and
temporal evolution of electron density and plasma potential by resonance hairpin probe
and emissive probe during pulsed laser photo-detachment of negative ions”, 63rd
Annual Gaseous Electronics Conference, October 4-8, 2010, Paris, France.
15. N. Sirse, S. K. Karkari, R. Dodd, S-D. You and J. W. Bradley, “Resonance hair pin
probe and laser photo-detachment technique for measuring time resolve negative ion
density in pulsed dc magnetron discharge”, 63rd Annual Gaseous Electronics
Conference, October 4-8, 2010, Paris, France.
16. N. Sirse and S. K. Karkari, “Resonance hairpin probe for low temperature plasma
diagnostics”, European Summer School, Bad Honnef, Germany, 9-16th October 2010.